Abstract
In agreement with Article 6(2) of the Regulation (EU) 2016/2031 on protective measures against pests of plants, the European Commission has been tasked by the Council and European Parliament to establish a list of Union quarantine pests which qualify as priority pests. The prioritisation is based on the severity of the economic, social and environmental impact that these pests can cause in the Union territory. The Commission's Joint Research Centre (JRC) is in charge of developing a methodology based on a multi‐criteria decision analysis and composite indicators. In this context, EFSA has provided technical and scientific data related to these pests, in particular: (i) the potential host range and distribution of each of these pests in the Union territory at the level of NUTS2 regions; (ii) parameters quantifying the potential consequences of these pests, e.g. crop losses in terms of yield and quality, rate of spread and time to detection. Expert knowledge elicitation methodology has been applied by EFSA in order to provide those parameters in a consistent and transparent manner.
Keywords: control, detection, host plants, potential distribution, quality loss, spread, yield loss
1. Introduction
1.1. Background and Terms of Reference as provided by the requestor
Pursuant to Article 31 of Regulation (EC) No 178/20021, the Directorate‐General of Health and Food Safety (DG SANTE) of the European Commission requested EFSA for technical assistance in the field of plant health as regards a list of regulated harmful organisms qualifying as priority pests under Regulation (EU) 2016/20312.
More particularly, the Commission has been empowered by the Council and European Parliament to adopt a delegated act, establishing a list of Union quarantine pests which qualify as priority pests, as by Article 6(2) of the Regulation (EU) 2016/2031 on protective measures against pests of plants (hereinafter ‘the new Plant Health Law’). Pests will be listed as priority according to Article 6(1) of the new Plant Health Law, taking into account the severity of the economic, social and environmental impact that they can cause in the Union territory. That list shall be adopted by the Commission by the end of 2019 at the latest.
As regards the initial analysis of the criteria included in Section 2 of Annex I of Regulation (EU) 2016/2031, covering multiple dimensions (i.e. economic, social and environmental) each of the described by multiple impacts (i.e. crop losses in terms of yield and quality, costs of control measures, significant effects on biodiversity, employment, food security and safety and cultural heritage), the methodology should be built on the multi‐criteria decision analysis (MCDA) and composite indicators.
Given the expertise in this domain, DG SANTE is in the process of contracting out to the Commission's Joint Research Centre (JRC), a 2 year project with the aim to develop the methodology which would support DG SANTE in the preparation of such a list of priority pests. That methodology will be applied by the JRC on a sample of indicative list of Union quarantine pests qualifying as potential priority pests. The indicative, non‐binding, list is available in Appendix A and could still be further refined.
EFSA is therefore requested to support the JRC with the extrapolation of technical and scientific data related to those pests, based on current scientific knowledge, and related to the criteria listed in Section 2 of Annex I of Regulation (EU) 2016/2031.
More specifically, EFSA is requested to provide an indication of the potential capacity of establishment of each of those pests in the Union territory at the level of NUTS2 regions. Available data on the potential consequences of those pests should also be provided, taking into account their economic and environmental impact (e.g. crop losses in terms of yield and quality, needs for additional control measures, in particular, when data are available, the need for any significant and long‐term increases of the use of plant protection products).
Such information should be made available at appropriate times during the course of the 2 year project which will start in June 2017. More specifically, the JRC project will consist of three tasks and EFSA inputs will be requested for Task 1 on Methodology development, identification of indicators, and alternative weights for each of the criteria, Task 2 on Application of the methodology to two pilot pests, which will be defined at the onset of the project based on data promptly available, while covering different types of pests, and for Task 3 Extension of the application of the methodology to the remaining potential candidate priority pests.
As some of the potential candidate priority pests may be already included in the mandate on pest categorisation (Ares(2017)1111340), it is also requested that the categorisation of these plant pests are prioritised so that their results can also be applied to this project.
1.2. Interpretation of the Terms of Reference
The current mandate asked EFSA to contribute to the three following tasks
Task 1: Methodology development and identification of indicators
Task 2: Application of the methodology to two pilot pests
Task 3: Extension of the application of the methodology to the remaining potential candidate priority pests.
Task 1 was performed by developing the specific methodology proposed in the current EFSA Scientific Report (from now on ‘Methodology Report’). The methodology has been developed ad hoc taking into account the tiered approach proposed in the EFSA guidance on quantitative pest risk assessment (EFSA PLH Panel, 2018a). The setting of the methodology went through a series of steps and adjustments as a consequence of: (i) the lesson learnt from its testing on the pilot pests; (ii) the feedbacks provided by JRC as final user of the EFSA outputs; (iii) the feedbacks provided by Member States during the regular meetings of the Expert Group on Plant Health Legislation, Discussion of the Delegated Act on Priority Pests of the European Commission, and by written procedure; and (iv) the experience gained by the EFSA Working Group (WG) testing the methodology on the full list of pests provided with the mandate (Appendix A).
Task 2 was conducted applying the methodology on the two pilot pests Agrilus anxius and Tilletia indica with the ‘permanent group of experts’ only. Agrilus anxius was then repeated at a later stage with a different expert group composition, as indicated in Appendix B: this allowed a test of the reliability of the approach (in terms of the stability of the results) and to update the assessment with the most recent findings presented at the international conference ‘Preparing Europe for invasion by the beetles emerald ash borer and bronze birch borer, two major tree‐killing pests’ (1–4 October 2018, BFW Austrian Research Centre for Forests, Vienna, Austria). Tilletia indica was also updated and its completeness improved with the support provided by the hearing expert Pierluigi Meriggi. A third pest, Xanthomonas citri, could also be considered as a pilot study, as it was the first pest on which the methodology was tested with ‘external’ experts; that is experts who did not participate to the development of the methodology, but then applied it on the pest.
Task 3 was completed during the second year of activity, involving for each of the remaining pests’ different groups of experts (Appendix B). All the 28 pests of the list (Appendix A) were assessed. The list of the candidate pests was reviewed and updated during the second year. A large part of the 28 pest species was at the same period subject of at least another type of EFSA evaluation: pest categorisation (e.g. Popillia japonica, EFSA PLH Panel, 2018b), pest risk assessment (e.g. Spodoptera frugiperda, EFSA PLH Panel, 2018c), survey card (e.g. Synchytrium endobioticum, EFSA, 2019). In order to connect the different outputs and harmonise their content, the different EFSA WGs planned to synchronise their outputs, whenever possible. In case of Xylella fastidiosa, the assessment was performed as part of the activity of the WG dedicated to the ‘Update of the Scientific Opinion on the risks to plant health posed by X. fastidiosa in the EU territory’ (EFSA PLH Panel, 2019a).
In Task 3 common templates for the Pest Reports and Pest Datasheets were developed; their regular update was mainly dedicated to improving clarity, and therefore usability, of the final outputs by JRC and any other external user.
1.2.1. Final outputs
The Methodology Report is the reference document for the methodology applied to all the other outputs produced under the mandate: for each of the 28 pests, in fact, EFSA produced a specific report (from now on ‘Pest Report’) and a datasheet (from now on ‘Pest Datasheet’) provided to JRC. Pest Reports and Pest Datasheets are not published on the EFSA Journal but are uploaded on Zenodo3 from which they are freely accessible. The use of this platform should simplify the process of publication of the Pest Reports and Pest Datasheets in case more pests will be submitted for assessment as candidate priority pests or existing reports require to be updated in line with the most recent findings. In case of multiple versions of the same document, Zenodo provides a DOI that represents all versions, and will always resolve to the latest one (Appendix C).
For each of the 28 pests, an interactive version of the map of area of potential distribution at NUTS24 spatial resolution is available on ArcGIS Online.
1.2.2. Working Group composition
The WG is composed by:
Ten members from the EFSA staff, with different tasks and coming from different units and teams
Two members who are external experts regularly involved in all the activities of the WG (‘permanent member’ in the Table of Appendix B)
Forty experts, across Members and Hearing Experts, involved ad hoc to the pest specific assessment according to their knowledge (ad hoc expert groups, Section 1.2.2.1). Some of the Members were also invited to review Pest Reports produced by other groups (Appendix B).
Two Peer‐Reviewers who reviewed the Methodology Report.
1.2.2.1. Ad hoc expert groups
For each pest specific assessment, an ad hoc group of experts was created. The group was designed to include:
at least one of the WG members who defined the methodology in order to ensure consistency in the approach and application of the methods;
at least one internationally recognised expert on the pest;
one expert on agricultural/forestry practices relevant to the specific hosts under consideration.
A good combination of experts and resource availability meant that the ad hoc groups were generally composed of 4–5 people, very rarely by less than 3 or more than 6.
PLH Panel members were selected if their expertise covered points (ii) and/or (iii).
2. Data and methodologies
For each pest, EFSA has provided the JRC with data sets including the following components:
-
•
The area of potential distribution at least at the NUTS2 level for each Member State (MS)
-
•
Host lists: (i) a preliminary list of main hosts obtained from a variety of sources; (ii) a full host list obtained by combining the host lists from the CABI Crop Protection Compendium datasheet and the EPPO Global database; and (iii) a final list of hosts for which the expert knowledge elicitation (EKE) on yield and quality losses was performed
-
•
Expected change in the use of plant protection products
-
•
Additional potential effects other than direct yield and quality losses (mycotoxin production and vector of a plant pathogen)
-
•
Data on parameters related to the potential consequences of pest establishment:
Yield and quality losses
Spread rate
Time between establishment and first detection of the pest.
In order to produce the data set, EFSA estimated uncertainty distributions for each of the parameters using the literature and data sets available and, where sufficient evidence was lacking, EKEs with groups composed of risk assessors and pest experts.
The full process undergone for the preparation of the Pest Reports and Pest Datasheets is summarised in Appendix D and described in detail in the following sections.
2.1. Selection of information and data
The Pest Reports summarise the key information on which the assessment is conducted based on the most complete, up‐to‐date, pest categorisation(s) and/or pest risk assessment(s) by EFSA, EPPO, other European or non‐European institutions.
Additional information and data were obtained via literature search and complemented by expert contributions to ensure that data relevant to the estimation of the parameters and the most recent research findings were taken into account.
When a reference had been collected and screened for relevance, a.pdf of the full article was stored in the EFSA internal document management system (DMS).
2.2. Structure and content of the Pest Report
Each Pest Report has five sections:
-
1
Introduction for the user on the structure of the document
-
2
Background information relevant to support the EKE process and its results, in particular
-
o
biology and taxonomy
-
o
host plants
-
o
area of potential distribution
-
o
expected change in the use of plant protection products
-
o
additional potential effects
-
o
-
3
Report of the EKE
-
o
yield and quality losses: structured expert judgement and elicited values
-
o
spread rate: structured expert judgement and elicited values
-
o
time to detection: structured expert judgement and elicited values
-
o
-
4
Conclusions
-
5
References.
In addition, Appendices on the host list and summary tables on the evidence provided to the EKE complete the document.
2.2.1. Summary of the biology and taxonomy
This introductory section provides the reader with general information on the pest, any taxonomic or nomenclature issues and the type of damages caused. This section is short and only includes information directly relevant to the assessment.
2.2.2. Host plants
A full list of host plants was compiled merging the information from the most recent pest risk assessments, the CABI Crop Protection Compendium (CABI, online) and the EPPO Global Database (EPPO, online). Hosts from the CABI list classified as ‘Unknown’ as well as hosts from the EPPO list classified as ‘Alternate’, ‘Artificial’ or ‘Incidental’ were excluded from the list. The full list of host plants is reported in Appendix A of the Pest Report.
From the full list, host plants of economic or environmental importance to the EU (agricultural crops, ornamental, forest species, etc.) were identified to assist with the process of selecting the plant species, for which yield and quality losses should be elicited. These are based on published reports of the pest causing economic impacts and a review of the hosts listed as ‘major’ in the EPPO Global Database and ‘main’ in the CABI Crop Protection Compendium.
One or more of the following criteria were used to decide which hosts to include in the estimation of yield and quality losses:
The availability of data on the distribution of the host(s) in the EU and production statistics.
The type of damage caused by the pest on the specific host or category of hosts.
The economic and environmental importance of the plant species in the EU (e.g. whether it is a major crop in the area of potential distribution).
Host plant preferences of the pest under assessment.
The impact caused by the pest on the host.
Once the species to be included for the estimation of yield and quality losses had been identified, experts were asked to decide on:
The grouping of host plants for each EKE, especially for polyphagous pests.
The level of aggregation (genus/species/subspecies) of the hosts.
In the case of polyphagous pests, the host plants were grouped by taking into account similarities in one or more of the following criteria:
The level of susceptibility of the hosts or the host preferences of the pest within the same taxonomic group (e.g. family, genus, species) or crop category (e.g. EUROSTAT categories).
The production systems (e.g. row crops, greenhouse crops, orchards, forest plants).
The final use of the product (e.g. forage crop, grain crop, fresh consumption).
2.2.2.1. Natura 2000 sites
For assessing the environmental impact, the number of Natura 20005 sites and their area where potential hosts of the pest are mentioned as ‘protected’ or ‘important’ species were considered. The impact was assessed as follows:
Number of Natura 2000 sites with at least one potential host were counted.
Number of Natura 2000 sites impacted by the pest (i.e. with at least one host within the area of potential distribution) were counted.
Total area (ha) of Natura 2000 sites with at least one potential host was calculated.
Total area (ha) of Natura 2000 sites impacted by the pest (i.e. with at least one host within the area of potential distribution) was calculated.
Percentage of the area of Natura 2000 sites impacted by the pest was calculated as the ratio between number 3 and 4.
For those Natura 2000 sites whose area is only partially included in the area of potential establishment, the full size of the site was used.
2.2.3. Area of potential distribution
The area of potential distribution includes both the area of potential establishment and the area where the pest may only have transient populations. Combining transient populations with established populations to form the area of potential distribution is in agreement with the International Standard for Phytosanitary Measures (ISPM) No 8. (Determination of Pest Status in an Area) since it is stated here that ‘seasonally present’, i.e. transience, is included in the term ‘distribution’.
In order to identify the area of potential distribution for a given pest in the EU, information on host availability and climate suitability were used. The results of any relevant models describing the area of potential establishment were evaluated. The area of potential distribution in the EU was then reported in a map.
The areas where the pest has been present with transient populations can be included in the assessment if needed (for details on the criteria for assessment of transient populations, see Section 2.2.3.3).
Since it is assumed that glasshouses are favourable habitats for the establishment of the pest, they were considered as part of the area of potential establishment, even if they are far from the areas where the pest can establish outdoors.
2.2.3.1. Area of current distribution
This is generally represented by a map of the pest's global distribution usually extracted from the EPPO Global Database.
2.2.3.2. Area of potential establishment
In order to define the area of potential establishment, the availability of suitable hosts and the suitability of the environment, particularly the climate, has been assessed. Where appropriate, published maps have been reproduced or new maps have been generated to support the assessments.
In order to identify the area of host distribution the following databases were consulted:
EUROSTAT: for crop distributions, although in many cases the information is available at national level only or for groups of crops and not at the species level – http://ec.europa.eu/eurostat/data/database
JRC – Natura 2000 database – https://www.eea.europa.eu/data-and-maps/data/natura-9
European atlas of forest tree species – http://forest.jrc.ec.europa.eu/european-atlas-of-forest-tree-species/atlas-download-page/
JRC Yearly Modelled crop area at grid level – http://agri4cast.jrc.ec.europa.eu/DataPortal/RequestDataResource.aspx?idResource=32&o=d
Previous EFSA opinions: where specific data sets are available (e.g. citrus distribution from CBS opinions: data collected from MSs)
Corine Land Cover 2012: https://land.copernicus.eu/pan-european/corine-land-cover/clc-2012
Priority was given to the data set which provided the highest level of spatial resolution. The minimum level is the information on presence/absence at NUTS2 level (in the data set 0 = absent and 1 = present).
When the pest is polyphagous and data were available, maps provide the distribution of the hosts (see Section 2.2.2).
Whenever available, priority was given to models for the estimation of potential pest distributions published in previous EFSA opinions or other scientific publications. When models were not available or considered to be flawed, maps of pest potential distribution were generated taking into account the most relevant biological parameters for the pest to establish in a given area. For meteorological and climatic data, the following data sets were used:
JRC Gridded Agro‐Meteorological data http://agri4cast.jrc.ec.europa.eu/DataPortal/RequestDataResource.aspx?idResource=7&o=d
Köppen‐Geiger climate classification: http://koeppen-geiger.vu-wien.ac.at/
Maps are provided with the highest level of spatial resolution based on meteorological and climatic data available. The minimum level of resolution is the information on the climate suitable/not suitable for establishment at NUTS2 level (in the data set 0 = not suitable and 1 = suitable).
For harmonisation purposes, the climatic suitability may be aggregated up to NUTS0 level. In such cases, the data sets include the weighted average of the NUTS2 regions based on production volumes or production areas. If host specific data were not available, the land area of the NUTS2 regions was used to weight the average.
The area of potential establishment could be smaller than the area where the main hosts occur, due to due to climate or other ecological factors preventing the establishment.
Within the area of potential establishment, the mean abundance of the pest, the main driver of the pest impact, was considered as: (i) the same throughout the assessment area or (ii) not equally distributed across the assessment area, in which case patterns of population abundance or of any of the proxies that could be considered (e.g. number of generations, thermal sums) are described. In case (ii), zones or gradients were described and the impact on yield and quality loss assessed in each zone or along the gradient.
2.2.3.3. Transient populations
In areas outside the area of potential establishment, yield/quality losses could still occur due to the presence of transient populations. The impacts of these transient populations on the yield/quality losses estimated in the area of potential establishment can be scaled by factors (i.e. coefficients) specific to the areas where transience can occur. These scaling factors account for: (i) the heterogeneity both in time and space in the occurrence of the transient populations and (ii) differences in the abundance of these transient populations compared to the population abundance in the area of potential establishment.
It was assumed that transient populations only occur when the species has a specific adaptation facilitating long‐distance dispersal involving both active (e.g. the species is a strong flyer) and/or passive (e.g. the species can be transported by wind) methods of spread. We set a threshold for identifying the cases where transient populations are taken into account. This only occurs if the species has a maximum spread rate (99% percentile of the spread rate) greater than 100 km. For the species that satisfied this criterion, the yield/quality loss outside the area of potential establishment was calculated as follows:
The area of potential distribution was defined by extending the border of the area of potential establishment based on the additional distance covered by the pest (a distance equal to 99% percentile of the spread rate).
A variable was defined that provides a proxy for the abundance to be used for assessing the amount of impact caused by the transient population (e.g. the number of generations, thermal sums).
The scaling factor for the impact was calculated as the ratio between the value of the variable defined in point 2) in each point and the maximum value of that variable in the area of potential establishment.
The yield/quality loss caused by transient populations at a location outside the area of potential establishment was calculated by multiplying the estimated maximum yield/quality loss in the area of potential establishment by the scaling factor computed at that location.
2.2.4. Expected change in the use of plant protection products
The WG found that it was not possible to identify one parameter that correctly reflects whether pest presence will result in the ‘need for any significant and long‐term increases of the use of plant protection products’ as mentioned in the DG SANTE mandate letter. Since the JRC protocol considers this aspect in terms of ‘undesired effects of control measures’, EFSA has proposed a three‐level score (Table 1) to reflect the extent to which there is likely to be an increase in the use of Plant Protection Products (PPPs) without quantifying the likely number of additional treatments. This is based on four cases (A–D) as outlined in Table 1.
Table 1.
Expected changes in the use of Plant Protection Products (PPPs) following pest establishment in the EU in relation to four cases (A–D) and three‐level score (0–2) for the expected change in the use of PPPs
| Expected change in the use of PPPs | Case | PPPs indicator |
|---|---|---|
| PPPs effective against the pest are not available/feasible in the EU | A | 0 |
| PPPs applied against other pests in the risk assessment area are also effective against the pest, without increasing the amount/number of treatments | B | 0 |
| PPPs applied against other pests in the risk assessment area are also effective against the pest but only if the amount/number of treatments is increased | C | 1 |
| A significant increase in the use of PPPs is not sufficient to control the pest: only new integrated strategies combining different tactics are likely to be effective | D | 2 |
In this section, therefore, the WG provides a general description of the currently available treatments (in particular plant protection products) in order to select the most suitable ‘Existing PPPs indicator’ according to the Table below.
The presence of treatments and control options already available in the risk assessment area (case A) and their effect on the pest under consideration were also taken into account when assessing yield and quality losses. For example, if the use of resistant varieties is a common practice in the EU, and this would be expected to reduce the impact of the pest if it became established, the EKE would take this into account and include a justification in the report.
2.2.5. Additional potential effects
Under this section are included the:
Known competence of the pest to transmit plant pathogens
Responsibility of the pest for the presence of toxins in crops for animal and/or human consumption based on evidence in the literature. The toxins could occur either as a direct consequence of the pest on the plant or as an indirect result of infections by secondary pests whose presence was favoured by the pest attacks.
2.3. Finalisation of section 2 of the Pest Report
Once the Section 2 of the Pest Report had been prepared, it was reviewed by at least one of the experts involved in the assessment of the parameters, especially before an upcoming EKE. All the experts participating in the exercise read the factsheet before the meeting. During the meeting, after discussion, further amendments were made and each section agreed before the start of an elicitation process (e.g. the selection of relevant host plants, see Section 2.2.3).
2.4. Experts knowledge elicitation
After reviewing the evidence, the WG decided on the need to perform an EKE for the parameters to be assessed.
The parameter was estimated using statistical methods only if there was a solid basis of quantitative information, e.g. from official European surveys. The uncertainty distribution for the parameter was derived from the uncertainty in the empirical data, e.g. based on differences in the time period the data were collected, statistical errors or similar. If the evidence for a specific pest–host combination (e.g. citrus species) was lacking or data were incomplete, several pest–host combinations (e.g. all citrus fruits) may have been estimated together. The uncertainty distribution in this case also took into account the differences between the pest‐host combinations and may have needed expert judgements.
In all other cases, an assessment was performed for each parameter and pest–host combination following a structured approach using EKE (EFSA, 2014). Any additional data and evidence provided by external experts was added to the Pest Reports. Their expertise includes specific knowledge on the biology and behaviour of the pest, the pest–host interaction in the area of current distribution, the current European cropping practices and control options.
The EKE has five steps.
In the first step, the general scenario is reviewed for each parameter. Specific clarifications are added, if needed
In the second step, the evidence provided in summary tables are further discussed by the experts with respect to:
Relevance for the parameter of interest
Assumptions, reliability or limiting conditions, such as restriction to specific species, varieties, geographic/climatic conditions, temporal and local scale, specific experimental or survey design.
Interpretation and/or recalculation of the results reported in the evidence
This step concludes with a list of elements of evidence and their uncertainties/limitations.
In the third step, the overall uncertainties are discussed and summarised. Specific focus is given to the availability and completeness of the necessary evidence to estimate the parameter.
This step concludes with a qualitative listing of the overall uncertainties.
In the fourth step, the parameter is elicited by a structured expert judgement, using the informal EKE method as described in the EFSA Guidance on Uncertainty (EFSA Scientific Committee, 2018).
To describe quantitatively the existing evidence and remaining uncertainties, the WG performed an expert elicitation to judge on the parameter following the Quartile Method of the Sheffield protocol (EFSA, 2014):
-
Each member of the group of experts individually judges the quartiles of the uncertainty distribution in the following order:
The lower and upper limit of the credibility range (98% uncertainty range: 1st and 99th percentile). This range describes the parameter values, which would occur under conditions defining a reasonable high/low‐value scenario.
The median value (2nd quartile) as central estimate, which equally likely over‐ or underestimates the unknown parameter. This parameter value is an unbiased estimate of the unknown truth and should reflect an average situation (central value).
The lower and upper limit of the inter‐quartile range (50% uncertainty range: 1st and 3rd quartile), which describes the precision of the central value. The range covers 50% of the uncertainty meaning that is equally likely to have the unknown truth inside as well as outside the range.
-
The judgements on the credibility range are discussed and agreed in consensus by the group before the other values are discussed. The reasoning is always summarised by describing the conditions of the reasonable high‐ or low‐value scenarios:
-
o
Reasoning for a scenario which would lead to high values (99th percentile/upper limit).
-
o
Reasoning for a scenario, which would lead to low values (1st percentile/lower limit).
-
o
The judgements on the median and interquartile range are discussed and agreed as a consensus by the group. The reasoning is again summarised with specific emphasis on the location of the central value and the precision of the judgement.
-
For the location of the median, the skewness of the distribution is discussed. This means, if higher or lower values are more likely. The identification of key sources of evidences may help substantiate the judgement. The precision may be reasoned by the uncertainty of key studies or the consistency of the total evidence.
-
o
Reasoning for a central scenario, equally likely to over‐ or underestimate the unknown truth (50th percentile/median).
-
o
Reasoning for the precision of the judgement describing the remaining uncertainties (1st and 3rd quartile/interquartile range).
-
o
Finally a smooth distribution curve is fitted to the five values agreed by the group, and additional percentiles are calculated. This final distribution is reviewed and agreed by the group of experts.
The fourth step concludes with a table on the elicited values, a list of percentiles of the fitted distribution, a graphical description on the distribution fit, the distribution of uncertainties as formula, and graphically as probability density function (pdf) and descending cumulative distribution function (cdf).
Finally, the fifth section concludes on the quantitative results in summary. This section answers the question of interest and includes the central estimate and the 95% uncertainty range in non‐technical wording.
2.4.1. Yield and quality losses
2.4.1.1. Scenario assumptions
The following set of scenario assumptions was introduced to guarantee that the assessment was performed in comparable conditions for all the pests so that the general scenario was pest‐independent. This procedure is considered a prerequisite for a ranking exercise.
The yield and quality losses estimated by the experts were based on the following scenarios:
Impacts were assessed by assuming that the entry, establishment and spread of the pest had already occurred. This corresponds to a scenario where the pest is already present throughout the area of potential distribution in the EU (i.e. it has spread to its maximum extent) and there are no ongoing eradication or containment programmes.
It was assumed that the pest is not only present throughout the area of potential distribution but also that the limits to this area do not change. Within the area of potential distribution, pest presence depends on the heterogeneity of the patches where the host occurs. It is therefore not necessarily the case that the pest is present in all suitable patches. For some pests, e.g. those that are strong fliers and have no special adaptation, such as diapause for surviving the winter within the area of potential distribution, impacts may occur not only where it is established throughout the year but also in areas where it is transient with pest presence dependent on annual reinvasion.
In each location where the pest occurs, its abundance is in equilibrium with the available resources (e.g. host plants) and environmental conditions (including climate, ecosystem resistance and resilience) and current crop production practices, e.g. pest control, such as the efficacy of the pesticides targeted at other pests and current quarantine measures. The abundance varies from one place to another according to the biotic and abiotic factors influencing the equilibrium. A specific pattern of spatial variation in potential abundance may occur (e.g. a latitudinal gradient due to a temperature gradient). In case of plant pathogens vectored by insects or other arthropods, the vector distribution and population dynamics are taken into account and their role is discussed case by case.
The maximum potential abundance was considered to be the driving factor for the estimation of yield/quality loss and was evaluated in a time frame long enough to take into account the possible effects of the temporal variation in pest population dynamics (e.g. population fluctuations), impacts and cropping practices (e.g. the crop replacement time). Yield/quality losses due to quarantine measures were also included (e.g. rejection of full lots, downgrading of seed potato to ware potato).
Cropping practices and management options were taken as those currently in place in the area of potential distribution, taking into account the fact that these may differ from those in places where the pest is currently present and thus from where the data on impacts have been published.
The effect of currently applied control against other pests is taken into account.
Future changes in agricultural practice have not been taken into account.
The effect of the pest is evaluated in absence of other pests (there are no competition effects limiting the impact).
In areas or habitats (e.g. some glasshouses) outside the area of potential establishment yield/quality losses could occur due to the presence of transient populations. The impacts of these transient populations have been based on the yield/quality losses estimated in the area of potential establishment scaled by factors (i.e. coefficients) specific to the areas or the habitats where transience can occur. These scaling factors account for: (i) the heterogeneity both in time and space in the occurrence of the transient populations, and (ii) an assessment of the abundance of these transient populations compared to the population abundance in the area of potential establishment.
Specific assumptions can be added on a case by case basis and are included in the Pest Report.
2.4.1.2. Yield loss
The experts are requested to reply to the following question
What is the percentage yield loss [for the hosts] under the scenario assumptions in the area of the EU under assessment [for the pest], as defined in the Pest Report?
The definition of yield loss changes among different types of production systems:
Yield losses relate to the reduction in harvested and marketable material.
For annual crops: The yield loss is defined as the reduction (in percentage) in the amount (in weight) of harvest due to decline of plants, reduced size of plants, reduced amount of harvested and marketable material.
For orchards without replanting of individual plants: The yield loss is defined as the reduction (in percentage) in the amount (in weight) of harvest of the production system, e.g. a citrus orchard during the normal duration of production of the whole system. This is especially important in relation to tree decline without replanting (a typical orchard practice) that may lead to reductions for several harvesting periods, e.g. years.
For orchards with replanting of individual plants: The yield loss is defined as reduction (in percentage) in the amount (in weight) of harvest of an individual plant, e.g. tree within a typical production duration. Tree decline would lead to a reduction for some harvest periods, and a complete loss during the period after tree has been replanted and before it produces a first crop.
For urban trees: The yield of urban trees is defined as the ecosystem service of the tree in an urban environment (e.g. recreation, aesthetic and educational values, disease regulation, cleaning air). It is assumed that these services are continuously provided without a lag phase for newly planted trees. The loss in ecosystem services is defined as the reduction (in percentage) due to reduced size of the tree caused by the pest (assuming that the ecosystem service provision is proportional to the size of the tree).
For forest trees: The yield loss is defined as the reduction (in percentage) in the amount (in weight) of harvested wood of sufficient quality. The mortality of trees before its normal harvest date is a good proxy for the yield loss due to the pest, if the tree usually does not achieve its marketable size. Reduction in size at harvest date (if still marketable) or reduction in the marketable trunk length (if only part is harvested) were used if the pest does not necessarily kill the tree before harvest.
The same parameter (i.e. yield loss) has to be estimated for each group of host plants defined according to the criteria in Section 2.2.3. In addition, the parameter can be estimated only once for the whole assessment area (the area of potential distribution) or for each partitioning of that area. For example, the area of potential distribution can be subdivided in two or more strata according to differences in climate suitability or other factors influencing the biological cycle of the pest and its potential abundance and therefore the impact that the pest can have on the host plants selected for the assessment.
2.4.1.3. Quality loss
The experts are requested to reply to the following question:
What is the percentage of the harvested [crop] damaged by [the pest] that would lead to downgrading the final product because of quality issues under the scenario assumptions in the area of the EU under assessment as defined in the Pest Report?
The definition of quality loss changes among different hosts and products therefore its meaning was specified case by case, considering international quality standards, when available.
The same parameter (i.e. quality loss) has to be estimated for each group of host plants defined according the criteria in Section 2.2.3. In addition, the parameter can be estimated only once for the whole assessment area (the area of potential distribution) or for each partitioning of that area. For example, the area of potential distribution can be subdivided in two or more strata according to differences in climate suitability or other factors influencing the biological cycle of the pest and its potential abundance and therefore the impact that the pest can have on the crops selected for the assessment.
2.4.1.4. Handling of nurseries
The assessment focusses on the yield and quality losses in the final product. Intermediate products, especially propagation material, were not considered, even if additional economic impacts may have occurred. This is because:
Trade in propagation material frequently uses specific certification schemes to ensure pest freedom. This does not allow the assumption of a common agricultural practice, as the effect will strongly depend on the surveillance effort. The assumption of the widespread presence of the pest up to an equilibrium level is not applicable.
Specialised providers in propagation material to professional growers must be distinguished from nurseries directly supplying consumers, as the loss in production will differ due to different quality criteria. These types of nurseries are usually not distinguished in European statistics.
In the case of an infestation of a nursery, the loss of production is usually not limited to the host plant under concern. For certification schemes, the whole nurseries may be affected and subject to other forms of plant health restrictions. This will bring additional loss and an unproductive phase to the nursery.
Instead of assessing loss at the nursery level, it is assumed that propagation material is free from the pest when arriving at the production system. This assumption is particularly important at the beginning of a production cycle or at the time when individual plants are being replanted.
2.4.1.5. Translate impacts from NUTS2 to NUTS0 level
The yield and quality loss impact parameters were estimated for each NUTS2 region that has host plants and suitable climatic conditions. If host distribution and climatic data were available at higher resolution, e.g. by climatic modelling, only the part of the production area in the NUTS2 region that has suitable climatic conditions was included. Otherwise, it was assumed that all the production was located in the area climatically suitable for the pest. If the host distribution or crop production data were only available at the NUTS1 (e.g. for some MS) or the country level (NUTS0), the production data for each NUTS2 region was assumed to be proportional to for the area of its land surface.
For the analysis by JRC, the NUTS2 region data have been summarised at the NUTS0 region level by calculating the weighted average of the estimates at the NUTS2 level using production data as weights. If production data were not available, the host area or the land surface area was used.
2.4.2. Spread rate and time to detection
These two parameters were assessed using a common scenario in order to provide, when combined, an estimation of the difficulty of eradication of a given pest (the more it is able to spread and remain undetected during surveys, the harder it is expected to be eradicated in outbreak situations).
2.4.2.1. Scenario assumptions
In order to estimate the spread rate and time to detection, the experts involved in the assessment considered the following scenario:
The pest is present in an isolated focus in the area of potential establishment (e.g. a small number of individuals, or a single infected plant).
In the isolated focus, a small population has established on suitable host(s). The time to detection is evaluated from this moment in time.
After establishment, the size of the pest population increases. It is assumed that due to the favourable demographic (e.g. initial population abundance, population structure, no Allee effect) and environmental conditions there is no lag phase in the population growth.
When the population has reached a relatively high abundance in the isolated focus, it starts spreading from the original area of presence. The spread rate is assessed starting from this moment in time, when the area where the pest is present starts to consistently increase in most/all the directions due to the dispersal of the pest individuals.
Spread rate is measured as the linear increase of the area (i.e. the radius of a hypothetical circle) where the pest is present. Spread occurs only when it results in the successful infection/infestation of the host on arrival. Extreme phenomena of long‐distance spread (e.g. human‐assisted ‘jumps’, including hitchhiking) are not included in the scenario.
-
Assumptions for the assessment of spread:
-
o
Host availability is not a limiting factor for pest establishment after a dispersal event.
-
o
Spread rate was assessed without considering the contribution of the different susceptibilities of host plants (e.g. species, varieties, rootstocks), virulence of different subspecies/strains/pathovars of the pest or the biological characteristics of vector species or subspecies (e.g. dispersal rate, feeding activity).
-
o
The current climatic conditions were assumed for population growth/epidemics and spread of the pest.
-
o
-
Means of spread
-
o
The spread rate is the outcome of the contribution of natural dispersal together with local human assisted spread.
-
o
Spread due to post‐harvest movement, such as the trade in commodities, was not included in the estimation.
-
o
Human‐assisted spread includes operations related to production (e.g. common agricultural practices such as the use of pruning equipment, usage of farm saved seed potatoes) and operations related to commerce of the harvested product (which includes trade in commodities). The second category was not part of the estimation.
-
o
For forest management, the common practice of gathering the cut logs inside the forest and transporting them along a forest road was included in short‐distance dispersal and in the spread rate. In the case of urban infections or infestations, the material resulting from pruning is either shredded on the spot or gathered in a collection place which could be far from the infestation spot; and therefore, this component was not considered in the assessment of the spread rate.
-
o
-
Monitoring activity
-
o
It was assumed that the monitoring activity for the pest was conducted according to current practices in the EU
-
o
Specific assumptions can be added on a case by case basis and are included in the Pest Report.
2.4.2.2. Spread rate
The experts are requested to reply to the following question:
What is the spread rate in 1 year for an isolated focus within this scenario based on average European conditions? (units: m/year)
The unit of distance can change depending on the type of pest.
2.4.2.3. Time for detection after entry
The experts are requested to reply to the following question:
What is the time between the event of pest transfer to a suitable host and its first detection within this scenario based on average European conditions? (unit: years)
This parameter corresponds to that defined as ‘duration until detection’ in the JRC report.
2.4.3. Compilation of the pest datasheet
The following information is included in the pest datasheet provided to JRC:
-
−
Impacts: estimated impacts are provided for the 2.5th, 25th, 50th, 75th and 97.5th percentiles and fitted to the NUTS2 regions representing the area of potential distribution in the EU. Yield and quality losses of a single host or category of hosts are provided in the same sheet. The impacts are also provided at NUTS0 level.
-
−
Spread rate and time to detection are provided as single distributions (at 2.5th, 25th, 50th, 75th and 97.5th percentiles) for the whole EU
-
−
Expected change in the use of plant protection products is given as indicators (A/B/C/D and 0/1/2)
-
−
Host plants: (i) a preliminary list of main hosts obtained from a variety of sources; (ii) a full host list obtained by combining the host lists from the CABI Crop Protection Compendium datasheet and the EPPO Global database; (iii) a final list of hosts on which the EKE on yield and quality losses was performed
-
−
Distribution: a list of countries where the pest is present is taken from the EPPO Global Database
-
−
Quarantine countries: a list of individual countries where the pest is specifically regulated as a quarantine species is extracted from the EPPO Global Database. However, since not all countries publish a complete list of quarantine plant pests, the list of countries where the pest is present is also extracted from EPPO Global Database and provided to JRC.
-
−
Natura 2000:
-
o
the total area of Natural 2000 with at least 1 host
-
o
the total area of Natural 2000 impacted by the pest
-
o
the % of area impacted by the pest
-
o
the number of sites of Natural 2000 with at least 1 host
-
o
the number of sites of Natural 2000 impacted by the pest.
-
o
-
−
Additional effects: any information about whether the pest is known to be related to problems caused by mycotoxins or the capacity to vector any plant pathogens.
-
−
Notes: any additional information that could guide JRC or any other user to help use the datasheet is added.
3. Summary of results
The 28 pests provided with the mandate (Table A.1, Appendix A) are mainly insects (17) but also bacteria (6), fungi (4) and nematodes (1) (Figure 1). The methodology was not tested on viruses.
Table A.1.
List of priority pests provided together with the mandate letter (Ares(2017)3281434)
| Category | Potential priority pests | |
|---|---|---|
| Insects | 1. | Agrilus anxius a |
| 2. | Agrilus planipennis | |
| 3. | Anastrepha ludens | |
| 4. | Anoplophora chinensis | |
| 5. | Anoplophora glabripennis | |
| 6. | Anthonomus eugenii | |
| 7. | Aromia bungii | |
| 8. | Bactericera cockerelli | |
| 9. | Bactrocera dorsalis (including Bactrocera invadens) | |
| 10. | Bactrocera zonata | |
| 11. | Conotrachelus nenuphar | |
| 12. | Dendrolimus sibiricus | |
| 13. | Popillia japonica | |
| 14. | Rhagoletis pomonella (Tephritidae (non‐European)) | |
| 15. | Spodoptera frugiperda | |
| 16. | Thaumatotibia leucotreta | |
| 17. | Thrips palmi | |
| Bacteria | 18. | Candidatus Liberibacter spp. (citrus greening) |
| 19. | Clavibacter michiganensis subsp. sepedonicus | |
| 20. | Ralstonia solanacearum | |
| 21. | Xylella fastidiosa | |
| 22. | Xanthomonas citri a | |
| 23. | Grapevine flavescence dorée | |
| Nematodes | 24. | Bursaphelenchus xylophilus |
| Fungi | 25. | Ceratocystis fagacearum |
| 26. | Phyllosticta citricarpa | |
| 27. | Synchytrium endobioticum | |
| 28. | Tilletia indica a |
Pilot study.
Figure 1.

a) Types of hosts affected by the 28 candidate priority pests (one pest could affect more than one type of host) (Table E.1, Appendix E). b) Taxonomic classification of the 28 candidate priority pests
The candidate group of 28 species includes a variety of pests differing in:
type of host infected: twenty are mainly crop pests and six are mainly forestry pests; two species (Aromia bungii and Anoplophora chinensis) affect both agricultural crops and forest trees. For three species (Aromia bungii, Anoplophora chinensis and Anoplophora glabripennis), yield losses in urban areas were also assessed.
the level of host specialisation: from monophagous (e.g. Anthonomus eugenii) to oligophagous (e.g. Aromia bungii) to extremely polyphagous (e.g. Popillia japonica).
the spread capacity: from pests with limited spread capacity (e.g. Xanthomonas citri) to pests with the potential to actively disperse for hundreds of kilometres per year (e.g. Spodoptera frugiperda).
the area of distribution: from pests never reported in the EU (e.g. Agrilus anxius) to pests largely distributed in the area of potential distribution (e.g. grapevine flavescence dorée).
the type of damage: from pests with the capacity of rapidly killing their hosts (e.g. Xylella fastidiosa) to pests mainly known for the cosmetic damage caused to the crop (e.g. Bactericera cockerelli).
The methodology developed for this mandate is in line with the EFSA guidance on quantitative pest risk assessment (EFSA PLH Panel, 2018a):
-
−
the first‐tier approach was applied in most of the cases, directly estimating the uncertainty distribution for the parameters (i.e. yield and quality losses, spread rate, time to detection).
-
−
the second‐tier approach was applied in some cases, developing models for the estimation of the area of potential distribution and yield loss.
The number of EKEs that were carried out on yield and quality losses and the possible grouping of the hosts varied between pests, depending mainly on the host specialisation of the pest and also the type of damage to the host. On average, about three EKEs were performed for yield and quality losses for each pest (Figure 2) with one EKE on monophagous pests and up to seven EKEs for polyphagous pests.
Figure 2.
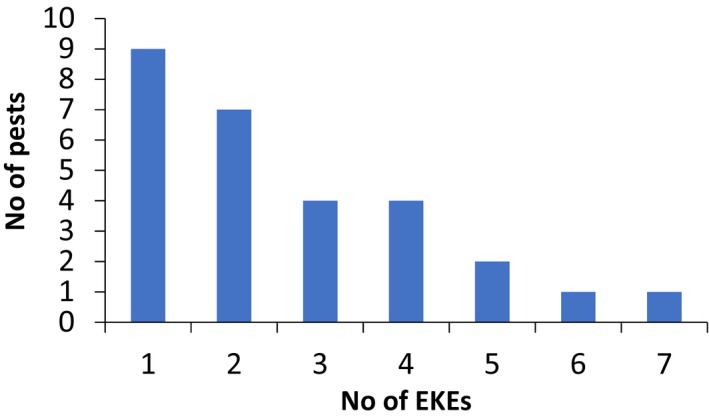
No of EKEs of yield and quality losses carried out for the pests
The estimated values of the assessed parameters (yield and quality losses, spread rate and time to detection) are reported in the Tables and Figures of following section.
3.1. Comparison of pests
In the following section, a comparison of the estimates on yield and quality loss, spread rate and time to detection is given. Each estimation includes the description of the uncertainty as cumulative distribution function. For different confidence levels, upper limits of the estimates are described in tabular or graphical format. The resulting order of the pests may depend on the selected confidence level.
3.1.1. Comparison of yield loss for different host categories
For the yield loss the comparison is stratified by the affected hosts:
Other fruits (e.g. exotic, small) (Section 3.1.1.8, Table 9 and Figure 10)
Ornamentals or urban plants (other hosts) (Section 3.1.1.10, Table 11 and Figure 12)
Table 2.
Percentiles of the uncertainty distributions of the proportion of yield loss [%] caused by species with effect on yield of cereals
| Species with effect on yield of cereals | Percentiles of the proportion of yield loss [%] | ||||||||||||||
|---|---|---|---|---|---|---|---|---|---|---|---|---|---|---|---|
| Class | Species | EPPO code/host | 1% | 5% | 10% | 17% | 25% | 33% | 50% | 67% | 75% | 83% | 90% | 95% | 99% |
| INSECTS | Spodoptera frugiperda | LAPHFR/sweet corn | 0.8% | 2.5% | 4.2% | 6.3% | 8.8% | 11.4% | 16.9% | 23.6% | 27.9% | 33.3% | 39.5% | 46.8% | 60.3% |
| INSECTS | Thaumatotibia leucotreta | ARGPLE/sweet corn | 2.2% | 4.4% | 6.2% | 8.1% | 10.1% | 12.1% | 16.0% | 20.5% | 23.4% | 27.0% | 31.1% | 36.0% | 45.6% |
| INSECTS | Spodoptera frugiperda | LAPHFR/grain maize | 0.3% | 1.0% | 1.7% | 2.7% | 3.8% | 5.1% | 7.8% | 11.4% | 13.7% | 16.9% | 20.6% | 25.4% | 35.1% |
| INSECTS | Spodoptera frugiperda | LAPHFR/rice | 0.4% | 1.3% | 2.1% | 3.0% | 4.0% | 5.1% | 7.2% | 9.8% | 11.4% | 13.5% | 15.9% | 18.9% | 25.1% |
| INSECTS | Thaumatotibia leucotreta | ARGPLE/grain for feed | 0.5% | 0.5% | 0.7% | 0.9% | 1.4% | 2.1% | 4.0% | 6.8% | 8.4% | 10.4% | 12.3% | 13.9% | 15.4% |
| INSECTS | Spodoptera frugiperda | LAPHFR/forage maize | 0.3% | 0.7% | 1.1% | 1.6% | 2.2% | 2.7% | 3.8% | 5.1% | 6.0% | 7.0% | 8.2% | 9.7% | 12.8% |
| INSECTS | Popillia japonica | POPIJA/soya, maize | 0.1% | 0.4% | 0.7% | 1.1% | 1.5% | 2.0% | 3.0% | 4.2% | 4.9% | 6.0% | 7.2% | 8.7% | 12.0% |
| FUNGI | Tilletia indica | NEOVIN/wheat | 0.00% | 0.01% | 0.01% | 0.02% | 0.03% | 0.03% | 0.05% | 0.08% | 0.10% | 0.13% | 0.19% | 0.27% | 0.54% |
Figure 3.
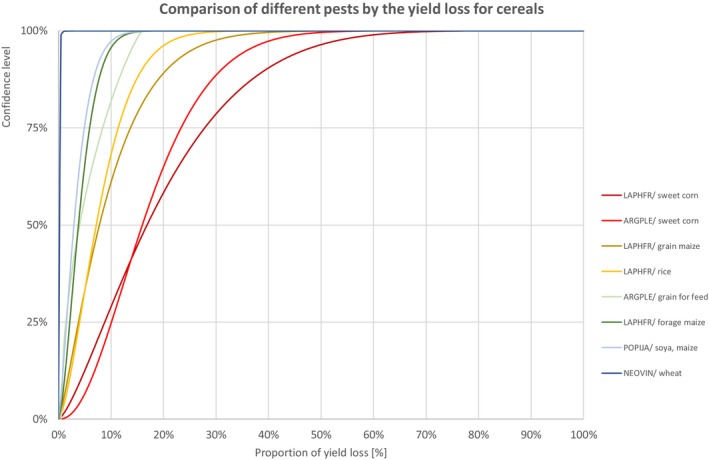
Comparison of different pests by the yield loss of cereals
Figure 4.
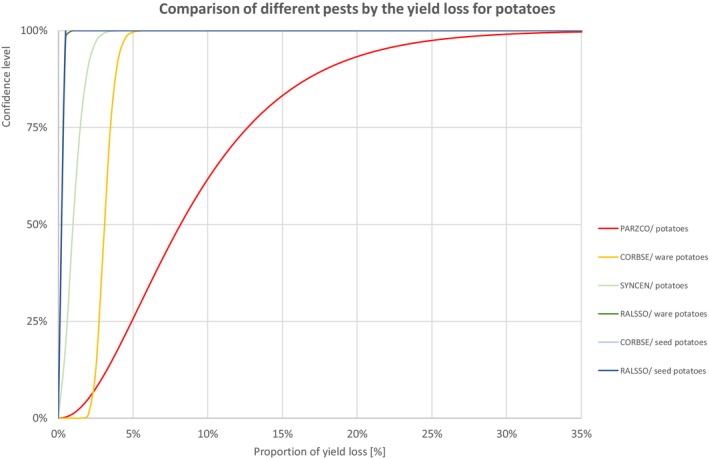
Comparison of different pests by the yield loss of potatoes
Figure 5.
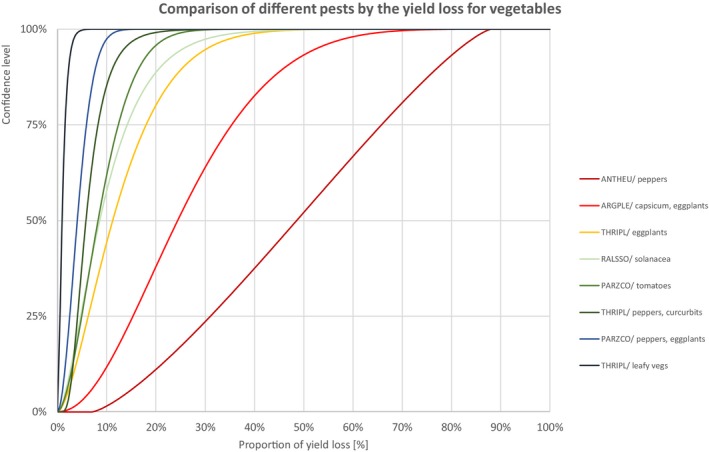
Comparison of different pests by the yield loss of vegetables
Figure 6.
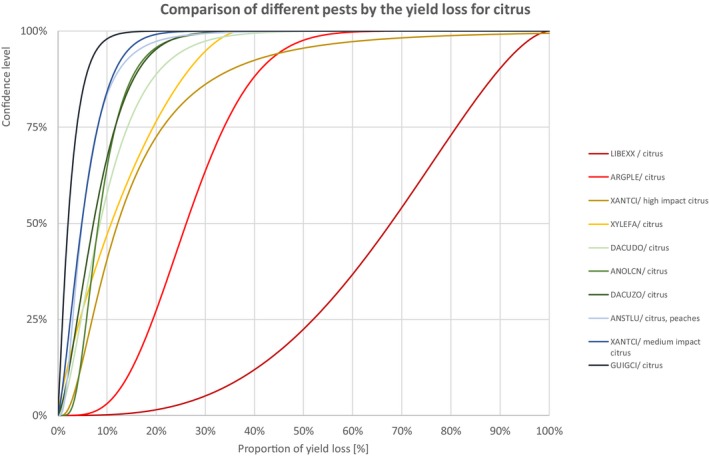
Comparison of different pests by the yield loss of citrus fruits
Figure 7.
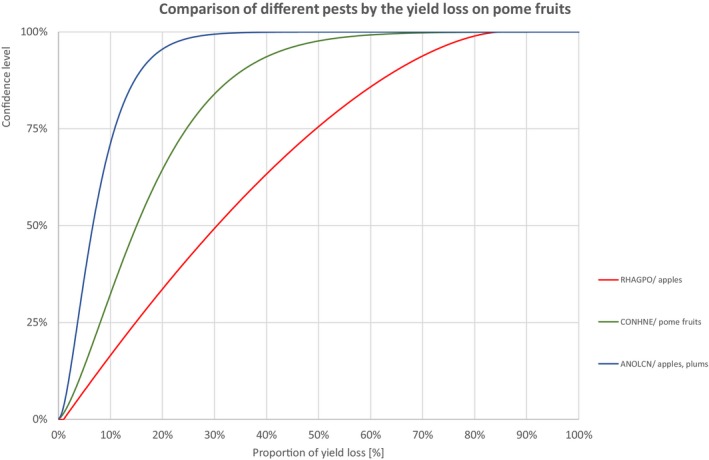
Comparison of different pests by the yield loss of pome fruits
Figure 8.
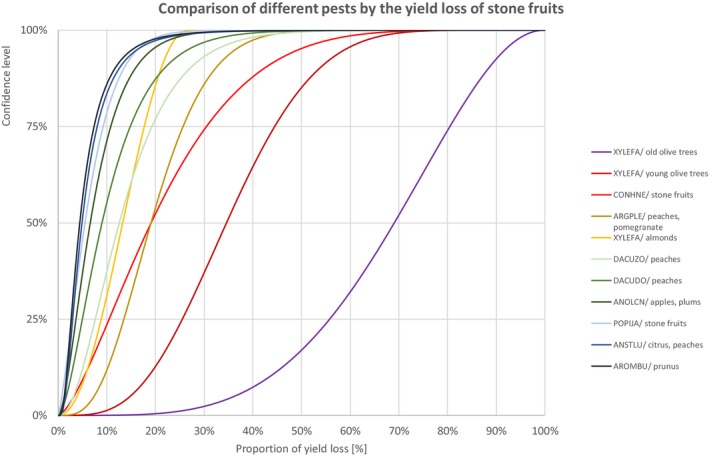
Comparison of different pests by the yield loss of stone fruits
Figure 9.
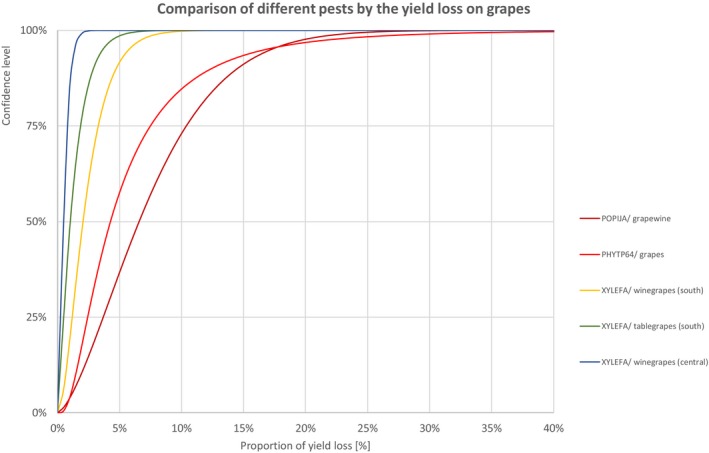
Comparison of different pests by the yield loss of grapes
Figure 10.
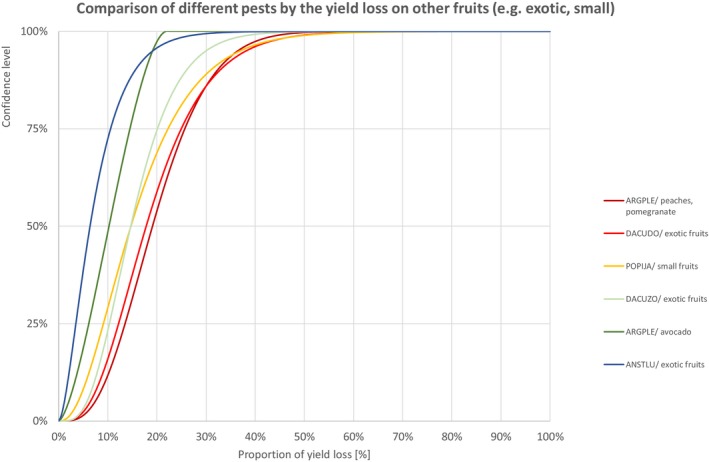
Comparison of different pests by the yield loss of other fruits (e.g. exotic, small)
Table 10.
Percentiles of the uncertainty distributions of the proportion of yield loss [%] caused by species with effect on forest trees
| Species with effect on yield in forest | Percentiles of the proportion of yield loss [%] | ||||||||||||||
|---|---|---|---|---|---|---|---|---|---|---|---|---|---|---|---|
| Class | Species | EPPO code/host | 1% | 5% | 10% | 17% | 25% | 33% | 50% | 67% | 75% | 83% | 90% | 95% | 99% |
| INSECTS | Agrilus anxius | AGRLAX/birch trees | 49.5% | 54.8% | 58.8% | 62.8% | 67.0% | 70.6% | 77.1% | 83.3% | 86.4% | 89.8% | 92.7% | 95.4% | 98.3% |
| INSECTS | Agrilus planipennis | AGRLPL/ash trees | 48.6% | 53.4% | 57.1% | 60.9% | 65.0% | 68.6% | 75.2% | 81.5% | 84.9% | 88.4% | 91.7% | 94.6% | 98.0% |
| NEMATODES | Bursaphelenchus xylophilus | BURSXI/pine trees (south) | 4.3% | 8.2% | 11.0% | 13.8% | 16.9% | 19.7% | 25.2% | 31.3% | 34.9% | 39.5% | 44.4% | 50.2% | 60.9% |
| INSECTS | Aromia bungii | AROMBU/prunus trees | 0.3% | 0.9% | 1.6% | 2.4% | 3.4% | 4.4% | 6.7% | 9.8% | 11.9% | 14.8% | 18.3% | 23.0% | 33.5% |
| INSECTS | Anoplophora glabripennis | ANOLGL/forest trees | 0.2% | 0.8% | 1.3% | 1.9% | 2.7% | 3.6% | 5.4% | 7.9% | 9.6% | 11.9% | 14.7% | 18.5% | 27.0% |
| INSECTS | Anoplophora chinensis | ANOLCN/forest trees | 0.3% | 0.6% | 0.8% | 1.1% | 1.5% | 1.8% | 2.5% | 3.4% | 4.0% | 4.7% | 5.7% | 6.9% | 9.5% |
| FUNGI | Ceratocystis fagacearum | CERAFA/oak trees | 0.3% | 0.5% | 0.7% | 0.9% | 1.1% | 1.4% | 2.1% | 3.1% | 3.8% | 5.0% | 6.6% | 9.2% | 16.9% |
| NEMATODES | Bursaphelenchus xylophilus | BURSXI/pine trees (north) | 0.1% | 0.3% | 0.5% | 0.7% | 1.0% | 1.2% | 1.7% | 2.2% | 2.5% | 2.9% | 3.4% | 4.0% | 5.2% |
| INSECTS | Dendrolimus sibiricus | DENDSI/coniferous trees | 0.0% | 0.1% | 0.1% | 0.2% | 0.2% | 0.3% | 0.5% | 0.8% | 1.0% | 1.4% | 2.0% | 3.2% | 9.1% |
Figure 11.
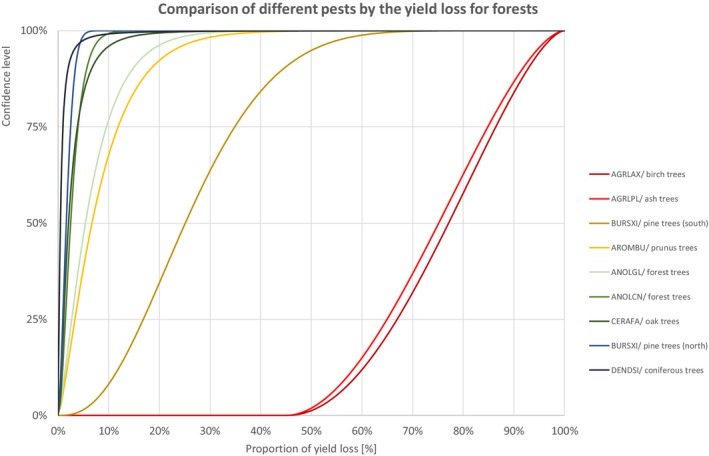
Comparison of different pests by the yield loss of forest trees
Table 11.
Percentiles of the uncertainty distributions of the proportion of yield loss [%] caused by species with effect on ornamentals or urban plants
| Species with effect on ornamentals or similar | Percentiles of the proportion of yield loss [%] | ||||||||||||||
|---|---|---|---|---|---|---|---|---|---|---|---|---|---|---|---|
| Class | Species | EPPO code/host | 1% | 5% | 10% | 17% | 25% | 33% | 50% | 67% | 75% | 83% | 90% | 95% | 99% |
| INSECTS | Anoplophora chinensis | ANOLCN/urban trees | 5.0% | 6.8% | 8.6% | 10.6% | 12.9% | 15.2% | 20.2% | 26.1% | 29.9% | 34.7% | 40.1% | 46.6% | 58.7% |
| INSECTS | Anoplophora glabripennis | ANOLGL/urban trees | 4.4% | 5.5% | 6.6% | 8.0% | 9.8% | 11.6% | 15.7% | 20.8% | 24.1% | 28.5% | 33.6% | 39.8% | 51.9% |
| INSECTS | Aromia bungii | AROMBU/ornamentals | 1.4% | 3.2% | 4.7% | 6.2% | 7.8% | 9.3% | 12.3% | 15.6% | 17.6% | 20.1% | 22.9% | 26.2% | 32.7% |
| INSECTS | Popillia japonica | POPIJA/turf | 0.5% | 1.4% | 2.2% | 3.1% | 4.1% | 5.1% | 7.0% | 9.4% | 10.8% | 12.7% | 14.8% | 17.4% | 22.7% |
| INSECTS | Thrips palmi | THRIPL/ornamentals | 0.0% | 0.1% | 0.2% | 0.3% | 0.5% | 0.6% | 1.0% | 1.6% | 1.9% | 2.4% | 3.1% | 3.9% | 5.9% |
Figure 12.
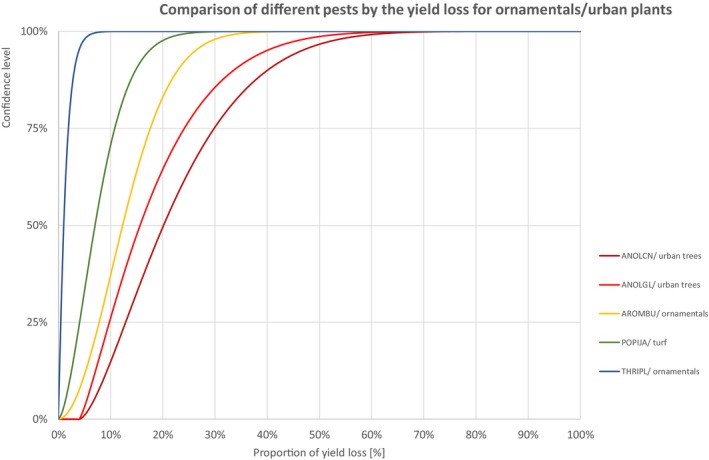
Comparison of different pests by the yield loss of ornamentals or urban plants
3.1.1.1. Cereals
3.1.1.2. Potatoes
Table 3.
Percentiles of the uncertainty distributions of the proportion of yield loss [%] caused by species with effect on yield of potatoes
| Species with effect on yield of potatoes | Percentiles of the proportion of yield loss [%] | ||||||||||||||
|---|---|---|---|---|---|---|---|---|---|---|---|---|---|---|---|
| Class | Species | EPPO code/host | 1% | 5% | 10% | 17% | 25% | 33% | 50% | 67% | 75% | 83% | 90% | 95% | 99% |
| INSECTS | Bactericera cockerelli | PARZCO/potatoes | 0.9% | 2.0% | 2.9% | 3.8% | 4.9% | 6.0% | 8.2% | 10.9% | 12.7% | 15.0% | 17.9% | 21.5% | 29.6% |
| BACTERIA | Clavibacter michiganensis subsp. sepedonicus | CORBSE/ware potatoes | 2.0% | 2.3% | 2.5% | 2.6% | 2.7% | 2.9% | 3.1% | 3.3% | 3.5% | 3.7% | 3.9% | 4.2% | 4.7% |
| FUNGI | Synchytrium endobioticum | SYNCEN/potatoes | 0.09% | 0.22% | 0.34% | 0.46% | 0.60% | 0.73% | 0.99% | 1.29% | 1.47% | 1.70% | 1.96% | 2.28% | 2.92% |
| BACTERIA | Ralstonia solanacearum | RALSSO/ware potatoes | 0.05% | 0.07% | 0.09% | 0.10% | 0.12% | 0.14% | 0.17% | 0.21% | 0.24% | 0.28% | 0.33% | 0.39% | 0.56% |
| BACTERIA | Clavibacter michiganensis subsp. sepedonicus | CORBSE/seed potatoes | 0.002% | 0.007% | 0.011% | 0.015% | 0.020% | 0.025% | 0.035% | 0.047% | 0.055% | 0.065% | 0.076% | 0.090% | 0.118% |
| BACTERIA | Ralstonia solanacearum | RALSSO/seed potatoes | 0.000% | 0.000% | 0.000% | 0.000% | 0.001% | 0.001% | 0.003% | 0.007% | 0.010% | 0.014% | 0.020% | 0.028% | 0.050% |
3.1.1.3. Vegetables
Table 4.
Percentiles of the uncertainty distributions of the proportion of yield loss [%] caused by species with effect on yield of vegetables
| Species with effect on yield of potatoes | Percentiles of the proportion of yield loss [%] | ||||||||||||||
|---|---|---|---|---|---|---|---|---|---|---|---|---|---|---|---|
| Class | Species | EPPO code/host | 1% | 5% | 10% | 17% | 25% | 33% | 50% | 67% | 75% | 83% | 90% | 95% | 99% |
| INSECTS | Bactericera cockerelli | PARZCO/potatoes | 0.9% | 2.0% | 2.9% | 3.8% | 4.9% | 6.0% | 8.2% | 10.9% | 12.7% | 15.0% | 17.9% | 21.5% | 29.6% |
| BACTERIA | Clavibacter michiganensis subsp. sepedonicus | CORBSE/ware potatoes | 2.0% | 2.3% | 2.5% | 2.6% | 2.7% | 2.9% | 3.1% | 3.3% | 3.5% | 3.7% | 3.9% | 4.2% | 4.7% |
| FUNGI | Synchytrium endobioticum | SYNCEN/potatoes | 0.09% | 0.22% | 0.34% | 0.46% | 0.60% | 0.73% | 0.99% | 1.29% | 1.47% | 1.70% | 1.96% | 2.28% | 2.92% |
| BACTERIA | Ralstonia solanacearum | RALSSO/ware potatoes | 0.05% | 0.07% | 0.09% | 0.10% | 0.12% | 0.14% | 0.17% | 0.21% | 0.24% | 0.28% | 0.33% | 0.39% | 0.56% |
| BACTERIA | Clavibacter michiganensis subsp. sepedonicus | CORBSE/seed potatoes | 0.002% | 0.007% | 0.011% | 0.015% | 0.020% | 0.025% | 0.035% | 0.047% | 0.055% | 0.065% | 0.076% | 0.090% | 0.118% |
| BACTERIA | Ralstonia solanacearum | RALSSO/seed potatoes | 0.000% | 0.000% | 0.000% | 0.000% | 0.001% | 0.001% | 0.003% | 0.007% | 0.010% | 0.014% | 0.020% | 0.028% | 0.050% |
3.1.1.4. Citrus
Table 5.
Percentiles of the uncertainty distributions of the proportion of yield loss [%] caused by species with effect on yield of citrus fruits
| Species with effect on yield of citrus fruits | Percentiles of the proportion of yield loss [%] | ||||||||||||||
|---|---|---|---|---|---|---|---|---|---|---|---|---|---|---|---|
| Class | Species | EPPO code/host | 1% | 5% | 10% | 17% | 25% | 33% | 50% | 67% | 75% | 83% | 90% | 95% | 99% |
| BACTERIA | Candidatus Liberibacter spp. (citrus greening) | LIBEXX/citrus | 17.7% | 29.8% | 37.7% | 45.0% | 52.0% | 57.8% | 67.8% | 76.7% | 81.1% | 85.7% | 89.8% | 93.5% | 97.6% |
| INSECTS | Thaumatotibia leucotreta | ARGPLE/citrus | 7.4% | 11.5% | 14.1% | 16.7% | 19.3% | 21.7% | 26.2% | 31.0% | 33.8% | 37.4% | 41.2% | 45.8% | 54.3% |
| BACTERIA | Xanthomonas citri | XANTCI/high impact citrus | 1.8% | 3.1% | 4.2% | 5.5% | 7.0% | 8.5% | 12.2% | 17.4% | 21.3% | 27.2% | 35.2% | 47.6% | 83.6% |
| BACTERIA | Xylella fastidiosa | XYLEFA/citrus | 0.1% | 0.7% | 1.5% | 2.8% | 4.5% | 6.4% | 10.9% | 16.2% | 19.4% | 23.1% | 26.7% | 30.2% | 34.4% |
| INSECTS | Bactrocera dorsalis | DACUDO/citrus | 0.6% | 1.6% | 2.5% | 3.5% | 4.7% | 5.9% | 8.6% | 11.9% | 14.2% | 17.2% | 20.9% | 25.7% | 36.4% |
| INSECTS | Anoplophora chinensis | ANOLCN/citrus | 2.5% | 3.5% | 4.3% | 5.0% | 5.8% | 6.6% | 8.3% | 10.3% | 11.7% | 13.6% | 16.0% | 19.3% | 27.4% |
| INSECTS | Bactrocera zonata | DACUZO/citrus | 0.4% | 1.2% | 2.0% | 2.9% | 4.0% | 5.0% | 7.3% | 9.9% | 11.7% | 13.9% | 16.5% | 19.8% | 26.5% |
| FUNGI | Anastrepha ludens | ANSTLU/citrus, peaches | 0.9% | 1.5% | 1.9% | 2.4% | 3.0% | 3.6% | 4.9% | 6.8% | 8.1% | 10.0% | 12.5% | 16.3% | 26.7% |
| BACTERIA | Xanthomonas citri | XANTCI/medium impact citrus | 0.2% | 0.7% | 1.2% | 1.8% | 2.6% | 3.3% | 4.9% | 6.8% | 8.1% | 9.8% | 11.8% | 14.3% | 19.5% |
| FUNGI | Phyllosticta citricarpa | GUIGCI/citrus | 0.1% | 0.2% | 0.4% | 0.7% | 1.0% | 1.3% | 2.1% | 3.1% | 3.9% | 4.9% | 6.2% | 7.8% | 11.7% |
3.1.1.5. Pome fruits
Table 6.
Percentiles of the uncertainty distributions of the proportion of yield loss [%] caused by species with effect on yield of pome fruits
| Species with effect on yield of pome fruits | Percentiles of the proportion of yield loss [%] | ||||||||||||||
|---|---|---|---|---|---|---|---|---|---|---|---|---|---|---|---|
| Class | Species | EPPO code/host | 1% | 5% | 10% | 17% | 25% | 33% | 50% | 67% | 75% | 83% | 90% | 95% | 99% |
| INSECTS | Rhagoletis pomonella | RHAGPO/apples | 1.5% | 3.7% | 6.4% | 10.1% | 14.9% | 19.8% | 30.5% | 42.6% | 49.5% | 57.4% | 64.9% | 71.9% | 80.1% |
| INSECTS | Conotrachelus nenuphar | CONHNE/pome fruits | 0.7% | 2.4% | 4.0% | 5.8% | 8.1% | 10.3% | 15.1% | 20.9% | 24.6% | 29.6% | 35.3% | 42.6% | 57.7% |
| INSECTS | Anoplophora chinensis | ANOLCN/apples, plums | 0.5% | 1.3% | 2.0% | 2.8% | 3.7% | 4.6% | 6.6% | 9.2% | 10.8% | 13.1% | 15.8% | 19.4% | 27.4% |
3.1.1.6. Stone fruits
Table 7.
Percentiles of the uncertainty distributions of the proportion of yield loss [%] caused by species with effect on yield of stone fruits
| Species with effect on yield of stone fruits | Percentiles of the proportion of yield loss [%] | ||||||||||||||
|---|---|---|---|---|---|---|---|---|---|---|---|---|---|---|---|
| Class | Species | EPPO code/host | 1% | 5% | 10% | 17% | 25% | 33% | 50% | 67% | 75% | 83% | 90% | 95% | 99% |
| BACTERIA | Xylella fastidiosa | XYLEFA/old olive trees | 24.4% | 36.3% | 43.4% | 49.8% | 55.8% | 60.7% | 69.1% | 76.7% | 80.5% | 84.6% | 88.4% | 91.9% | 96.3% |
| BACTERIA | Xylella fastidiosa | XYLEFA/young olive trees | 9.4% | 14.9% | 18.5% | 22.0% | 25.6% | 28.7% | 34.6% | 40.9% | 44.5% | 48.9% | 53.6% | 59.0% | 68.5% |
| INSECTS | Conotrachelus nenuphar | CONHNE/stone fruits | 1.1% | 3.3% | 5.3% | 7.7% | 10.5% | 13.3% | 19.1% | 26.1% | 30.5% | 36.1% | 42.2% | 49.5% | 62.7% |
| INSECTS | Thaumatotibia leucotreta | ARGPLE/peaches, pomegranate | 4.5% | 7.5% | 9.5% | 11.5% | 13.5% | 15.4% | 19.1% | 23.2% | 25.7% | 28.8% | 32.3% | 36.5% | 44.6% |
| BACTERIA | Xylella fastidiosa | XYLEFA/almonds | 1.8% | 3.9% | 5.5% | 7.2% | 8.9% | 10.4% | 13.3% | 16.2% | 17.7% | 19.5% | 21.2% | 22.8% | 25.0% |
| INSECTS | Bactrocera zonata | DACUZO/peaches | 1.5% | 3.2% | 4.6% | 6.0% | 7.7% | 9.3% | 12.6% | 16.7% | 19.3% | 22.8% | 27.0% | 32.5% | 44.4% |
| INSECTS | Bactrocera dorsalis | DACUDO/peaches | 0.7% | 1.7% | 2.7% | 3.8% | 5.0% | 6.3% | 9.1% | 12.5% | 14.9% | 18.0% | 21.8% | 26.8% | 37.8% |
| INSECTS | Anoplophora chinensis | ANOLCN/apples, plums | 0.5% | 1.3% | 2.0% | 2.8% | 3.7% | 4.6% | 6.6% | 9.2% | 10.8% | 13.1% | 15.8% | 19.4% | 27.4% |
| INSECTS | Popillia japonica | POPIJA/stone fruits | 0.2% | 0.8% | 1.4% | 2.1% | 2.9% | 3.7% | 5.6% | 7.8% | 9.3% | 11.2% | 13.5% | 16.4% | 22.5% |
| FUNGI | Anastrepha ludens | ANSTLU/citrus, peaches | 0.9% | 1.5% | 1.9% | 2.4% | 3.0% | 3.6% | 4.9% | 6.8% | 8.1% | 10.0% | 12.5% | 16.3% | 26.7% |
| INSECTS | Aromia bungii | AROMBU/prunus | 0.8% | 1.3% | 1.7% | 2.2% | 2.7% | 3.3% | 4.5% | 6.2% | 7.4% | 9.2% | 11.7% | 15.3% | 25.4% |
3.1.1.7. Grapes
Table 8.
Percentiles of the uncertainty distributions of the proportion of yield loss [%] caused by species with effect on yield of grapes
| Species with effect on yield of grapes | Percentiles of the proportion of yield loss [%] | ||||||||||||||
|---|---|---|---|---|---|---|---|---|---|---|---|---|---|---|---|
| Class | Species | EPPO code/host | 1% | 5% | 10% | 17% | 25% | 33% | 50% | 67% | 75% | 83% | 90% | 95% | 99% |
| INSECTS | Popillia japonica | POPIJA/grapewine | 0.4% | 1.2% | 1.9% | 2.7% | 3.7% | 4.6% | 6.6% | 8.9% | 10.4% | 12.3% | 14.5% | 17.2% | 22.9% |
| BACTERIA | Grapevine flavescence dorée | PHYTP64/grapes | 0.6% | 1.1% | 1.5% | 1.9% | 2.4% | 3.0% | 4.3% | 6.1% | 7.5% | 9.6% | 12.4% | 16.8% | 29.6% |
| BACTERIA | Xylella fastidiosa | XYLEFA/winegrapes (south) | 0.2% | 0.4% | 0.7% | 0.9% | 1.2% | 1.5% | 2.1% | 2.8% | 3.3% | 4.0% | 4.7% | 5.8% | 8.0% |
| BACTERIA | Xylella fastidiosa | XYLEFA/tablegrapes (south) | 0.0% | 0.1% | 0.2% | 0.4% | 0.5% | 0.7% | 1.0% | 1.5% | 1.9% | 2.3% | 2.9% | 3.7% | 5.4% |
| BACTERIA | Xylella fastidiosa | XYLEFA/winegrapes (central) | 0.1% | 0.1% | 0.2% | 0.2% | 0.3% | 0.4% | 0.5% | 0.7% | 0.8% | 0.9% | 1.1% | 1.4% | 1.9% |
3.1.1.8. Other fruits (e.g. exotic, small)
Table 9.
Percentiles of the uncertainty distributions of the proportion of yield loss [%] caused by species with effect on yield of other fruits (e.g. exotic, small)
| Species with effect on yield of other fruits (e.g. exotic, small, etc.) | Percentiles of the proportion of yield loss [%] | ||||||||||||||
|---|---|---|---|---|---|---|---|---|---|---|---|---|---|---|---|
| Class | Species | EPPO code/host | 1% | 5% | 10% | 17% | 25% | 33% | 50% | 67% | 75% | 83% | 90% | 95% | 99% |
| INSECTS | Thaumatotibia leucotreta | ARGPLE/peaches, pomegranate | 4.5% | 7.5% | 9.5% | 11.5% | 13.5% | 15.4% | 19.1% | 23.2% | 25.7% | 28.8% | 32.3% | 36.5% | 44.6% |
| INSECTS | Bactrocera dorsalis | DACUDO/exotic fruits | 3.9% | 6.5% | 8.3% | 10.2% | 12.2% | 14.1% | 17.8% | 22.2% | 25.0% | 28.6% | 32.8% | 38.2% | 49.6% |
| INSECTS | Popillia japonica | POPIJA/small fruits | 2.0% | 4.0% | 5.6% | 7.3% | 9.1% | 11.0% | 14.7% | 19.3% | 22.3% | 26.2% | 30.9% | 37.0% | 50.2% |
| INSECTS | Bactrocera zonata | DACUZO/exotic fruits | 3.6% | 5.8% | 7.3% | 8.8% | 10.4% | 11.8% | 14.7% | 18.0% | 20.1% | 22.9% | 26.0% | 30.0% | 38.5% |
| INSECTS | Thaumatotibia leucotreta | ARGPLE/avocado | 0.7% | 2.1% | 3.3% | 4.7% | 6.2% | 7.6% | 10.3% | 13.0% | 14.5% | 16.2% | 17.7% | 19.2% | 20.9% |
| INSECTS | Anastrepha ludens | ANSTLU/exotic fruits | 0.5% | 1.2% | 1.9% | 2.6% | 3.5% | 4.4% | 6.4% | 8.9% | 10.6% | 12.8% | 15.6% | 19.2% | 27.2% |
3.1.1.9. Forest trees
3.1.1.10. Ornamentals and urban plants
3.1.2. Comparison of quality loss for different hosts
The comparison of quality loss (Table 12 and Figure 13) is not stratified. Please note that the estimates are referring to different hosts.
Table 12.
Percentiles of the uncertainty distributions of the proportion of quality loss [%] caused by species with effect on the quality
| Species with effect on quality | Percentiles of the proportion of quality loss within the yield [%] | ||||||||||||||
|---|---|---|---|---|---|---|---|---|---|---|---|---|---|---|---|
| Class | Species | EPPO code/host | 1% | 5% | 10% | 17% | 25% | 33% | 50% | 67% | 75% | 83% | 90% | 95% | 99% |
| FUNGI | Phyllosticta citricarpa | GUIGCI/citrus | 0.2% | 1.3% | 2.8% | 5.0% | 8.0% | 11.3% | 19.0% | 29.0% | 35.3% | 43.4% | 52.2% | 62.0% | 77.7% |
| BACTERIA | Xanthomonas citri | XANTCI/high‐impact citrus | 7.9% | 11.3% | 13.7% | 16.1% | 18.8% | 21.4% | 26.8% | 33.6% | 38.2% | 44.5% | 52.5% | 63.5% | 90.7% |
| BACTERIA | Xanthomonas citri | XANTCI/medium‐impact citrus | 3.3% | 5.2% | 6.6% | 8.2% | 9.9% | 11.6% | 15.4% | 20.4% | 23.9% | 29.0% | 35.6% | 45.2% | 70.6% |
| BACTERIA | Ralstonia solanacearum | RALSSO/potatoes | 4.5% | 5.0% | 6.0% | 8.0% | 11.3% | 15.2% | 24.5% | 34.6% | 39.6% | 44.2% | 47.4% | 49.3% | 50.4% |
| FUNGI | Tilletia indica | NEOVIN/wheat | 0.1% | 0.2% | 0.4% | 0.7% | 1.0% | 1.3% | 2.1% | 3.1% | 3.9% | 4.9% | 6.2% | 7.9% | 11.7% |
| INSECTS | Thrips palmi | THRIPL/eggplants | 49.5% | 54.8% | 58.8% | 62.8% | 67.0% | 70.6% | 77.1% | 83.3% | 86.4% | 89.8% | 92.7% | 95.4% | 98.3% |
| INSECTS | Thrips palmi | THRIPL/peppers, curcurbits | 0.1% | 0.6% | 1.0% | 1.7% | 2.4% | 3.3% | 5.2% | 7.7% | 9.5% | 11.8% | 14.6% | 18.3% | 26.5% |
Figure 13.
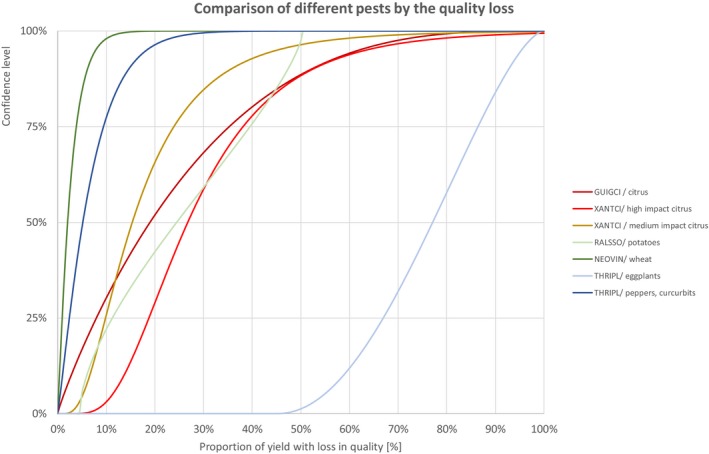
Comparison of different pests by the quality loss
3.1.3. Comparison of spread rates
The comparison is stratified by high, (Table 13 and Figure 14) medium (Table 14 and Figure 15) or low (Table 15 and Figure 16) spread rates defined roughly by the upper, middle or low third of the median spread rate.
Table 13.
Percentiles of the uncertainty distributions of the spread rate for species with high spread rate
| High spread species | Percentiles of the spread rate [km/y] | ||||||||||||||
|---|---|---|---|---|---|---|---|---|---|---|---|---|---|---|---|
| Class | Species | EPPO code | 1% | 5% | 10% | 17% | 25% | 33% | 50% | 67% | 75% | 83% | 90% | 95% | 99% |
| INSECTS | Spodoptera frugiperda | LAPHFR | 254.45 | 379.05 | 474.62 | 572.65 | 674.77 | 765.67 | 931.66 | 1093.67 | 1178.63 | 1271.45 | 1356.94 | 1436.66 | 1533.07 |
| BACTERIA | Candidatus Liberibacter spp. (citrus greening) | LIBEXX | 0.90 | 3.21 | 5.55 | 8.34 | 11.58 | 14.66 | 20.61 | 26.55 | 29.61 | 32.82 | 35.58 | 37.88 | 40.12 |
| INSECTS | Anastrepha ludens | ANSTLU | 1.71 | 3.08 | 4.08 | 5.11 | 6.23 | 7.29 | 9.45 | 12.00 | 13.62 | 15.76 | 18.28 | 21.49 | 28.42 |
| INSECTS | Bactrocera zonata | DACUZO | 1.26 | 2.44 | 3.28 | 4.14 | 5.08 | 5.97 | 7.86 | 10.36 | 12.17 | 14.91 | 18.83 | 25.34 | 48.71 |
| INSECTS | Bactrocera dorsalis | DACUDO | 1.05 | 1.83 | 2.46 | 3.17 | 4.02 | 4.91 | 6.95 | 9.87 | 12.02 | 15.25 | 19.67 | 26.41 | 45.84 |
| BACTERIA | Xylella fastidiosa | XYLEFA | 0.42 | 1.10 | 1.69 | 2.34 | 3.07 | 3.77 | 5.18 | 6.81 | 7.82 | 9.10 | 10.57 | 12.35 | 15.94 |
| NEMATODES | Bursaphelenchus xylophilus | BURSXI | 0.16 | 0.59 | 1.03 | 1.57 | 2.24 | 2.92 | 4.43 | 6.34 | 7.59 | 9.27 | 11.25 | 13.80 | 19.26 |
Figure 14.
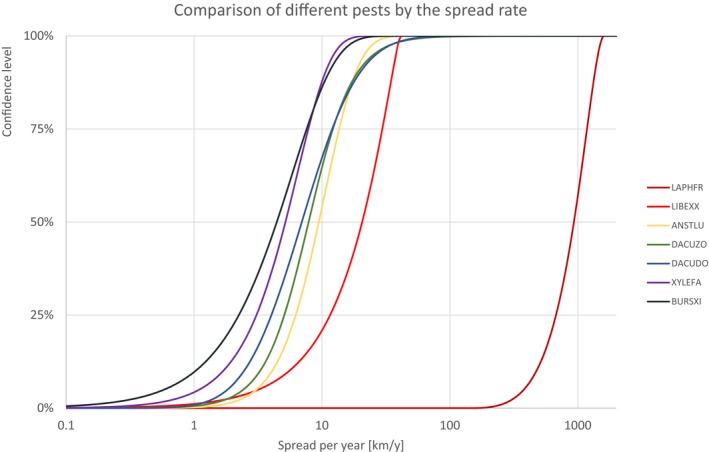
Comparison of different pests by the spread rate for species with high spread rate
Table 14.
Percentiles of the uncertainty distributions of the spread rate for species with medium spread rate
| Medium spread species | Percentiles of the spread rate [km/y] | ||||||||||||||
|---|---|---|---|---|---|---|---|---|---|---|---|---|---|---|---|
| Class | Species | EPPO code | 1% | 5% | 10% | 17% | 25% | 33% | 50% | 67% | 75% | 83% | 90% | 95% | 99% |
| INSECTS | Anthonomus eugenii | ANTHEU | 0.095 | 0.173 | 0.313 | 0.545 | 0.890 | 1.285 | 2.201 | 3.276 | 3.876 | 4.524 | 5.088 | 5.550 | 5.967 |
| INSECTS | Agrilus planipennis | AGRLPL | 0.236 | 0.416 | 0.562 | 0.729 | 0.930 | 1.138 | 1.627 | 2.325 | 2.845 | 3.629 | 4.707 | 6.362 | 11.188 |
| INSECTS | Popillia japonica | POPIJA | 0.240 | 0.458 | 0.621 | 0.794 | 0.983 | 1.163 | 1.534 | 1.978 | 2.263 | 2.640 | 3.087 | 3.659 | 4.902 |
| INSECTS | Thaumatotibia leucotreta | ARGPLE | 0.233 | 0.395 | 0.523 | 0.667 | 0.836 | 1.010 | 1.409 | 1.966 | 2.374 | 2.978 | 3.798 | 5.028 | 8.511 |
| INSECTS | Agrilus anxius | AGRLAX | 0.016 | 0.089 | 0.189 | 0.336 | 0.541 | 0.774 | 1.348 | 2.168 | 2.754 | 3.585 | 4.633 | 6.059 | 9.393 |
| FUNGI | Tilletia indica | NEOVIN | 0.010 | 0.066 | 0.150 | 0.280 | 0.467 | 0.685 | 1.238 | 2.046 | 2.631 | 3.466 | 4.530 | 5.986 | 9.411 |
| BACTERIA | Clavibacter michiganensis subsp. sepedonicus | CORBSE | 0.128 | 0.296 | 0.430 | 0.569 | 0.716 | 0.848 | 1.093 | 1.334 | 1.462 | 1.602 | 1.731 | 1.852 | 1.999 |
| INSECTS | Thrips palmi | THRIPL | 0.124 | 0.218 | 0.293 | 0.379 | 0.481 | 0.588 | 0.836 | 1.189 | 1.452 | 1.845 | 2.385 | 3.209 | 5.601 |
| FUNGI | Phyllosticta citricarpa | GUIGCI | 0.027 | 0.097 | 0.173 | 0.269 | 0.391 | 0.520 | 0.816 | 1.212 | 1.484 | 1.861 | 2.326 | 2.947 | 4.360 |
| FUNGI | Synchytrium endobioticum | SYNCEN | 0.048 | 0.064 | 0.090 | 0.130 | 0.189 | 0.259 | 0.436 | 0.698 | 0.888 | 1.161 | 1.508 | 1.984 | 3.103 |
| BACTERIA | Ralstonia solanacearum | RALSSO | 0.015 | 0.053 | 0.094 | 0.145 | 0.205 | 0.266 | 0.390 | 0.529 | 0.608 | 0.701 | 0.792 | 0.882 | 1.001 |
Figure 15.
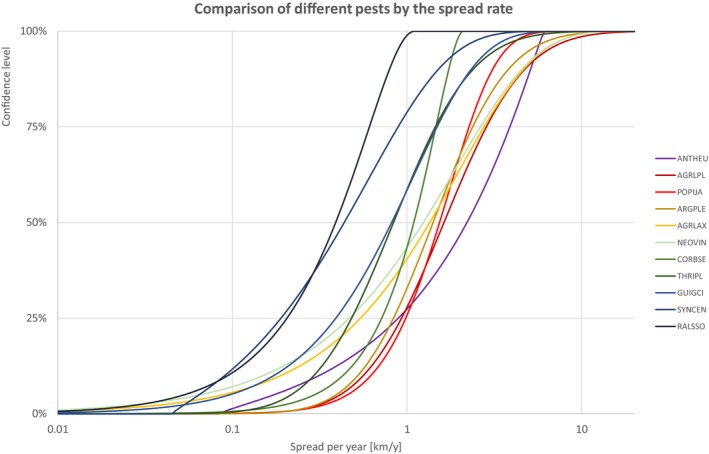
Comparison of different pests by the spread rate for species with medium spread rate
Table 15.
Percentiles of the uncertainty distributions of the spread rate for species with low spread rate
| Low spread rate species | Percentiles of the spread rate [km/y] | ||||||||||||||
|---|---|---|---|---|---|---|---|---|---|---|---|---|---|---|---|
| Class | Species | EPPO code | 1% | 5% | 10% | 17% | 25% | 33% | 50% | 67% | 75% | 83% | 90% | 95% | 99% |
| INSECTS | Bactericera cockerelli | PARZCO | 0.028 | 0.071 | 0.108 | 0.149 | 0.193 | 0.236 | 0.321 | 0.419 | 0.479 | 0.556 | 0.643 | 0.748 | 0.958 |
| INSECTS | Aromia bungii | AROMBU | 0.055 | 0.092 | 0.121 | 0.153 | 0.191 | 0.229 | 0.317 | 0.438 | 0.526 | 0.656 | 0.831 | 1.091 | 1.822 |
| INSECTS | Conotrachelus nenuphar | CONHNE | 0.017 | 0.052 | 0.085 | 0.124 | 0.169 | 0.213 | 0.306 | 0.419 | 0.490 | 0.583 | 0.692 | 0.827 | 1.107 |
| INSECTS | Rhagoletis pomonella | RHAGPO | 0.016 | 0.035 | 0.053 | 0.076 | 0.107 | 0.142 | 0.234 | 0.385 | 0.511 | 0.717 | 1.031 | 1.569 | 3.445 |
| INSECTS | Anoplophora chinensis | ANOLCN | 0.028 | 0.057 | 0.077 | 0.099 | 0.123 | 0.145 | 0.194 | 0.260 | 0.308 | 0.382 | 0.489 | 0.668 | 1.332 |
| BACTERIA | Xanthomonas citri | XANTCI | 0.027 | 0.045 | 0.058 | 0.073 | 0.091 | 0.109 | 0.150 | 0.205 | 0.246 | 0.305 | 0.384 | 0.501 | 0.826 |
| FUNGI | Ceratocystis fagacearum | CERAFA | 0.006 | 0.014 | 0.023 | 0.035 | 0.051 | 0.071 | 0.127 | 0.227 | 0.315 | 0.467 | 0.712 | 1.159 | 2.884 |
| BACTERIA | Grapevine flavescence dorée | PHYTP64 | 0.001 | 0.003 | 0.005 | 0.008 | 0.014 | 0.021 | 0.044 | 0.093 | 0.143 | 0.237 | 0.410 | 0.771 | 2.524 |
| INSECTS | Anoplophora glabripennis | ANOLGL | 0.003 | 0.005 | 0.006 | 0.007 | 0.008 | 0.009 | 0.010 | 0.011 | 0.012 | 0.013 | 0.014 | 0.015 | 0.017 |
| INSECTS | Dendrolimus sibiricus | DENDSI | 0.001 | 0.002 | 0.003 | 0.004 | 0.005 | 0.007 | 0.009 | 0.013 | 0.016 | 0.019 | 0.023 | 0.028 | 0.040 |
Figure 16.
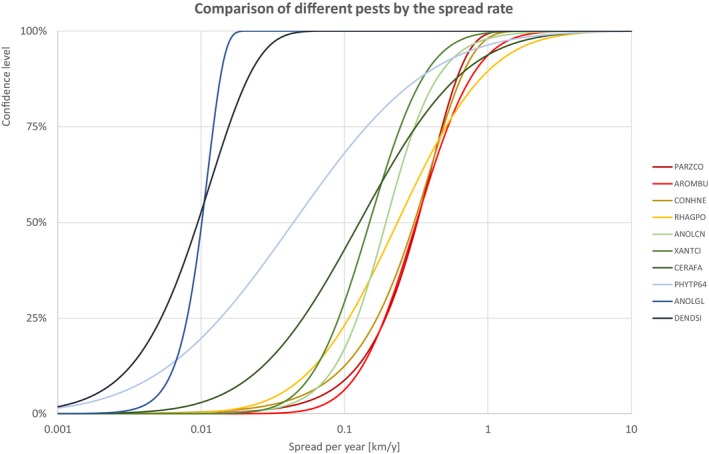
Comparison of different pests by the spread rate for species with low spread rate
3.1.3.1. High spread rate species
3.1.3.2. Medium spread rate species
3.1.3.3. Low spread rate species
3.1.4. Comparison of time to detection
The comparison is stratified by high (Table 16 and Figure 17), medium (Table 17 and Figure 18) or low (Table 18 and Figure 19) time to detection defined roughly by the upper, middle or low third of the median time to detection.
Table 16.
Percentiles of the uncertainty distributions of the time to detection for species with slow detection
| Long time to detection species | Percentiles of the time to detection [y] | ||||||||||||||
|---|---|---|---|---|---|---|---|---|---|---|---|---|---|---|---|
| Class | Species | EPPO code/host | 1% | 5% | 10% | 17% | 25% | 33% | 50% | 67% | 75% | 83% | 90% | 95% | 99% |
| INSECTS | Dendrolimus sibiricus | DENDSI | 1.40 | 3.62 | 5.51 | 7.58 | 9.89 | 12.08 | 16.52 | 21.60 | 24.74 | 28.73 | 33.24 | 38.76 | 49.79 |
| FUNGI | Tilletia indica | NEOVIN | 2.84 | 4.98 | 6.38 | 7.70 | 9.00 | 10.13 | 12.17 | 14.26 | 15.44 | 16.86 | 18.38 | 20.12 | 23.30 |
| INSECTS | Agrilus planipennis | AGRLPL | 1.59 | 2.79 | 3.91 | 5.18 | 6.62 | 7.97 | 10.57 | 13.22 | 14.62 | 16.16 | 17.55 | 18.80 | 20.22 |
| INSECTS | Agrilus anxius | AGRLAX | 3.33 | 4.13 | 4.95 | 5.92 | 7.04 | 8.13 | 10.27 | 12.48 | 13.67 | 14.97 | 16.15 | 17.21 | 18.39 |
| NEMATODES | Bursaphelenchus xylophilus | BURSXI | 1.61 | 3.28 | 4.49 | 5.70 | 6.95 | 8.07 | 10.18 | 12.44 | 13.77 | 15.39 | 17.16 | 19.24 | 23.18 |
| INSECTS | Anoplophora glabripennis | ANOLGL/Forest trees | 3.25 | 5.03 | 6.10 | 7.07 | 7.99 | 8.76 | 10.12 | 11.45 | 12.18 | 13.05 | 13.96 | 14.98 | 16.81 |
| INSECTS | Anoplophora chinensis | ANOLCN/Forest trees | 2.73 | 4.18 | 5.07 | 5.87 | 6.64 | 7.27 | 8.36 | 9.35 | 9.86 | 10.40 | 10.91 | 11.38 | 11.99 |
| INSECTS | Popillia japonica | POPIJA | 2.19 | 2.99 | 3.66 | 4.38 | 5.16 | 5.88 | 7.24 | 8.62 | 9.36 | 10.19 | 10.97 | 11.72 | 12.64 |
| INSECTS | Anoplophora glabripennis | ANOLGL/Urban trees | 2.80 | 3.60 | 4.11 | 4.62 | 5.14 | 5.63 | 6.60 | 7.74 | 8.46 | 9.43 | 10.59 | 12.11 | 15.56 |
| FUNGI | Synchytrium endobioticum | SYNCEN | 1.05 | 1.58 | 2.12 | 2.76 | 3.50 | 4.20 | 5.57 | 6.94 | 7.66 | 8.42 | 9.09 | 9.66 | 10.25 |
Figure 17.
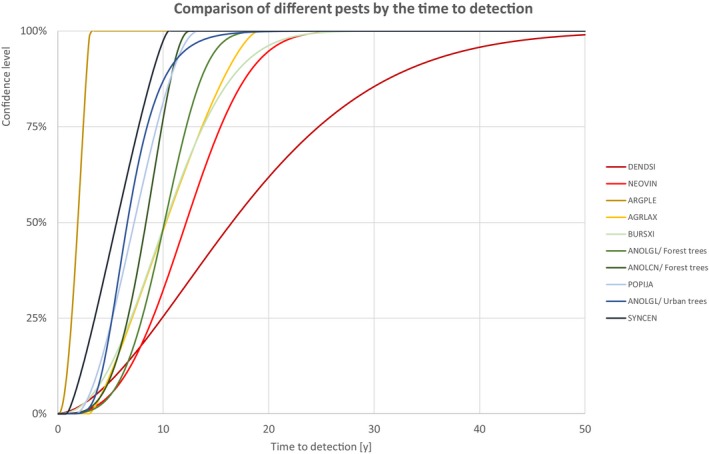
Comparison of different pests by the time for detection for species with slow detection
Table 17.
Percentiles of the uncertainty distributions of the time to detection for species with medium detection
| Medium time to detection species | Percentiles of the time to detection [y] | ||||||||||||||
|---|---|---|---|---|---|---|---|---|---|---|---|---|---|---|---|
| Class | Species | EPPO code/host | 1% | 5% | 10% | 17% | 25% | 33% | 50% | 67% | 75% | 83% | 90% | 95% | 99% |
| INSECTS | Anoplophora chinensis | ANOLCN/Urban trees | 2.11 | 2.86 | 3.29 | 3.67 | 4.03 | 4.35 | 4.95 | 5.62 | 6.06 | 6.67 | 7.43 | 8.54 | 11.60 |
| INSECTS | Rhagoletis pomonella | RHAGPO | 0.76 | 1.53 | 2.08 | 2.64 | 3.21 | 3.71 | 4.67 | 5.69 | 6.29 | 7.02 | 7.81 | 8.75 | 10.51 |
| BACTERIA | Grapevine flavescence dorée | PHYTP64 | 1.78 | 2.29 | 2.62 | 2.95 | 3.29 | 3.60 | 4.23 | 4.97 | 5.44 | 6.07 | 6.82 | 7.81 | 10.05 |
| INSECTS | Aromia bungii | AROMBU | 0.40 | 0.97 | 1.44 | 1.94 | 2.50 | 3.01 | 4.04 | 5.20 | 5.90 | 6.79 | 7.79 | 8.99 | 11.37 |
| FUNGI | Ceratocystis fagacearum | CERAFA | 0.78 | 1.36 | 1.77 | 2.19 | 2.65 | 3.07 | 3.93 | 4.93 | 5.57 | 6.41 | 7.39 | 8.63 | 11.30 |
| BACTERIA | Ralstonia solanacearum | RALSSO | 1.27 | 1.39 | 1.57 | 1.84 | 2.21 | 2.63 | 3.61 | 4.83 | 5.59 | 6.52 | 7.47 | 8.45 | 9.81 |
| BACTERIA | Clavibacter michiganensis subsp. sepedonicus | CORBSE | 1.27 | 1.40 | 1.58 | 1.85 | 2.22 | 2.63 | 3.59 | 4.82 | 5.58 | 6.54 | 7.55 | 8.63 | 10.24 |
| BACTERIA | Xylella fastidiosa | XYLEFA | 0.82 | 1.09 | 1.33 | 1.61 | 1.92 | 2.23 | 2.87 | 3.61 | 4.07 | 4.63 | 5.25 | 5.96 | 7.19 |
| FUNGI | Phyllosticta citricarpa | GUIGCI | 0.44 | 0.92 | 1.28 | 1.63 | 1.98 | 2.27 | 2.79 | 3.24 | 3.45 | 3.67 | 3.84 | 3.99 | 4.12 |
| INSECTS | Bactericera cockerelli | PARZCO | 0.66 | 1.10 | 1.38 | 1.63 | 1.88 | 2.09 | 2.47 | 2.85 | 3.06 | 3.32 | 3.59 | 3.89 | 4.45 |
Figure 18.
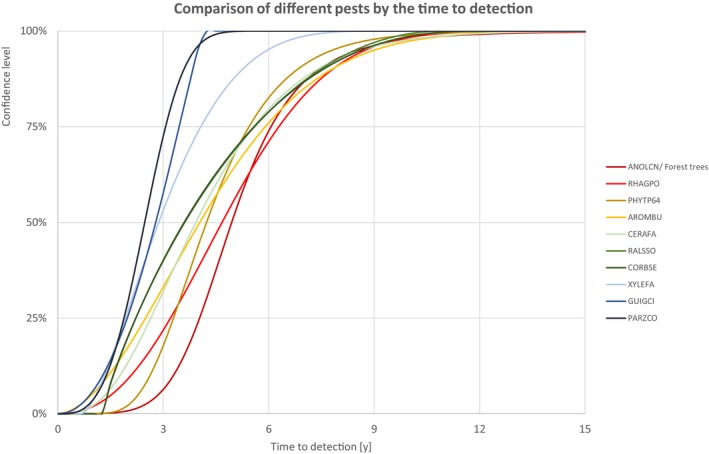
Comparison of different pests by the time for detection for species with medium detection
Table 18.
Percentiles of the uncertainty distributions of the time to detection for species with fast detection
| Short time to detection species | Percentiles of the time to detection [y] | ||||||||||||||
|---|---|---|---|---|---|---|---|---|---|---|---|---|---|---|---|
| Class | Species | EPPO code/host | 1% | 5% | 10% | 17% | 25% | 33% | 50% | 67% | 75% | 83% | 90% | 95% | 99% |
| BACTERIA | Candidatus Liberibacter spp. (citrus greening) | LIBEXX | 0.64 | 0.90 | 1.08 | 1.27 | 1.47 | 1.66 | 2.07 | 2.57 | 2.91 | 3.38 | 3.96 | 4.76 | 6.72 |
| INSECTS | Thrips palmi | THRIPL | 0.50 | 0.62 | 0.77 | 0.97 | 1.23 | 1.49 | 2.04 | 2.64 | 2.96 | 3.29 | 3.59 | 3.84 | 4.08 |
| INSECTS | Anastrepha ludens | ANSTLU | 0.69 | 0.87 | 1.02 | 1.19 | 1.38 | 1.55 | 1.91 | 2.33 | 2.59 | 2.91 | 3.28 | 3.73 | 4.64 |
| INSECTS | Thaumatotibia leucotreta | ARGPLE | 0.32 | 0.61 | 0.84 | 1.07 | 1.31 | 1.52 | 1.89 | 2.24 | 2.41 | 2.59 | 2.75 | 2.88 | 3.02 |
| INSECTS | Bactrocera dorsalis | DACUDO | 0.42 | 0.65 | 0.82 | 1.00 | 1.21 | 1.42 | 1.87 | 2.47 | 2.89 | 3.50 | 4.28 | 5.41 | 8.41 |
| INSECTS | Bactrocera zonata | DACUZO | 0.42 | 0.65 | 0.82 | 1.00 | 1.21 | 1.42 | 1.87 | 2.47 | 2.89 | 3.50 | 4.28 | 5.42 | 8.40 |
| INSECTS | Conotrachelus nenuphar | CONHNE | 0.53 | 0.64 | 0.76 | 0.92 | 1.13 | 1.33 | 1.75 | 2.20 | 2.44 | 2.70 | 2.93 | 3.13 | 3.33 |
| INSECTS | Anthonomus eugenii | ANTHEU | 0.49 | 0.59 | 0.70 | 0.84 | 1.01 | 1.17 | 1.50 | 1.82 | 1.99 | 2.17 | 2.31 | 2.43 | 2.55 |
| BACTERIA | Xanthomonas citri | XANTCI | 0.18 | 0.29 | 0.40 | 0.53 | 0.68 | 0.82 | 1.10 | 1.38 | 1.52 | 1.66 | 1.79 | 1.89 | 1.99 |
| INSECTS | Spodoptera frugiperda | LAPHFR | 0.02 | 0.06 | 0.09 | 0.12 | 0.16 | 0.19 | 0.26 | 0.35 | 0.40 | 0.46 | 0.53 | 0.62 | 0.80 |
Figure 19.
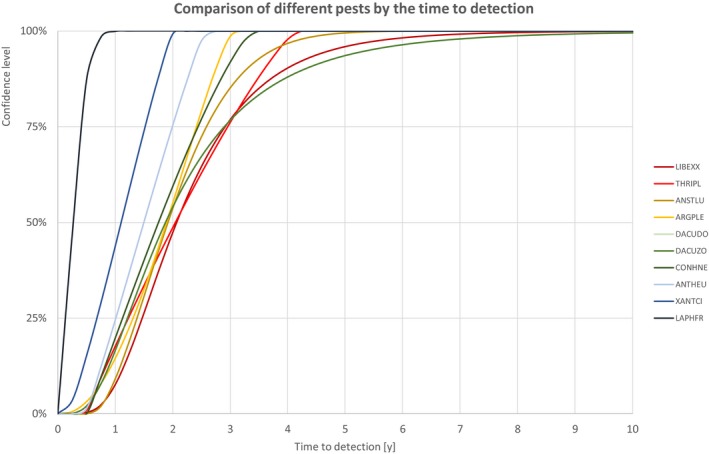
Comparison of different pests by the time for detection for species with fast detection
3.1.4.1. Long time to detection species
3.1.4.2. Medium time to detection species
3.1.4.3. Short time to detection species
Abbreviations
- CABI
Centre for Agriculture and Bioscience International
- cdf
cumulative distribution function
- DG SANTE
Directorate‐General of Health and Food Safety
- DMS
document management system
- EKE
Expert Knowledge Elicitation
- EPPO
European and Mediterranean Plant Protection Organization
- MCDA
multi‐criteria decision analysis
- MS
Member State
- NUTS
Nomenclature of Territorial Units for Statistics
- ISPM
International Standard for Phytosanitary Measures
- JRC
Joint Research Centre
probability density function
- PLH
Plant Health
- PPP
plant protection product
- WG
Working Group
Appendix A – List of candidate priority pests by categories
1.
Together with the mandate, DG SANTE provided to EFSA a list of Union quarantine pests qualifying as candidate priority pests (Table A.1).
Appendix B – Working Group composition
1.
| Name | Role | Performed tasks | |
|---|---|---|---|
| 1. | AKOTSEN‐MENSAH Clement | Hearing Expert | EKE on Conotrachelus nenuphar |
| 2. | BAKER Richard | Permanent Member |
EKE on Anthonomus eugenii, Bactericera cockerelli, Bursaphelenchus xylophilus, Candidatus Liberibacter spp., Ceratocystis fagacearum, Conotrachelus nenuphar, Dendrolimus sibiricus, Phyllosticta citricarpa, Popillia japonica, Spodoptera frugiperda, Thaumatotibia leucotreta, Thrips palmi, Tilletia indica, Xanthomonas citri Review on Agrilus anxius, Agrilus planipennis, Xylella fastidiosa |
| 3. | BALI Elma | Hearing Expert | EKE on Anastrepha ludens, Bactrocera dorsalis, Bactrocera zonata, Rhagoletis pomonella |
| 4. | BEHRING Carsten | Member from EFSA | Supporting information to the quantitative analysis (data and maps management) |
| 5. | BIONDI Antonio | Hearing Expert | EKE on Anthonomus eugenii |
| 6. | BOSCIA Donato | Member |
EKE on Xylella fastidiosa Review on Candidatus Liberibacter |
| 7. | BOSIO Giovanni | Hearing Expert | EKE on Popillia japonica |
| 8. | CANDIANI Denise | Member from EFSA | Elicitor for the EKE on Candidatus Liberibacter (rapporteur), Phyllosticta citricarpa (rapporteur), Ralstonia solanacearum (impact on Solanaceae other than potato), Synchytrium endobioticum (preliminary assessment), Tilletia indica (rapporteur), Xanthomonas citri (rapporteur) |
| 9. | CIAMPITTI Mariangela | Hearing Expert | EKE on Aromia bungii, Popillia japonica |
| 10. | CUBERO Jaime | Member |
EKE on Candidatus Liberibacter spp., Xanthomonas citri Review on Phyllosticta citricarpa |
| 11. | DALMAU Vicente | Hearing Expert | EKE on Conotrachelus nenuphar, Xylella fastidiosa |
| 12. | DEHNEN‐SCHMUTZ Katharina | Peer Reviewer | Peer‐Review of the report on the methodology |
| 13. | EVANS Hugh | Member |
EKE on Agrilus anxius, Agrilus planipennis, Bursaphelenchus xylophilus Review on Anoplophora chinensis, Anoplophora glabripennis |
| 14. | FACCOLI Massimo | Hearing Expert | EKE on Anoplophora chinensis, Anoplophora glabripennis |
| 15. | FOISSAC Xavier | Member | EKE on grapevine flavescence dorée |
| 16. | GILIOLI Gianni | Permanent Member |
EKE on Anoplophora chinensis, Anoplophora glabripennis, Aromia bungii, Candidatus Liberibacter spp., Clavibacter michiganensis subsp. Sepedonicus, grapevine flavescence dorée, Phyllosticta citricarpa, Ralstonia solanacearum, Spodoptera frugiperda, Synchytrium endobioticum, Thaumatotibia leucotreta, Tilletia indica, Xanthomonas citri, Xylella fastidiosa Elicitor for the EKE on Bactericera cockerelli, Bursaphelenchus xylophilus, Ceratocystis fagacearum, Conotrachelus nenuphar, Popillia japonica |
| 17. | GOGIN Andrey | Member from EFSA | Supporting information to the quantitative analysis (data and maps management) |
| 18. | GREGOIRE Jean Claude | Member |
EKE on Anoplophora chinensis, Anoplophora glabripennis, Dendrolimus sibiricus Review on grapevine flavescence dorée |
| 19. | HOPPE Bjoern | Hearing Expert | EKE on Aromia bungii |
| 20. | HRUSKA Allan | Member | EKE on Spodoptera frugiperda |
| 21. | JACQUES Marie Agnes | Member |
EKE on Ralstonia solanacearum, Xylella fastidiosa Review on Xanthomonas citri |
| 22. | JAQUES MIRET Josep Anton | Member |
EKE on Anastrepha ludens, Bactrocera dorsalis, Bactrocera zonata, Rhagoletis pomonella Review on Anthonomus eugenii, Conotrachelus nenuphar |
| 23. | JEGER Michael John | Peer Reviewer | Peer‐review of the report on the methodology |
| 24. | KALUSKI Tomasz | Member from EFSA | Support to experts and JRC, rapporteur during EKEs |
| 25. | KINKAR Mart | Member from EFSA | Support to experts and JRC, rapporteur during EKEs |
| 26. | LOOMANS Antoon | Hearing Expert | EKE on Anthonomus eugenii, Thrips palmi |
| 27. | MACLEOD Alan | Member |
EKE on Thrips palmi Review on Spodoptera frugiperda |
| 28. | MACQUARRIE Christian | Member |
EKE on Agrilus anxius, Agrilus planipennis Review on Popillia japonica, Aromia bungii |
| 29. | MAGNUSSON Sven Christer | Member |
EKE on Bursaphelenchus xylophilus Review on Ceratocystis fagacearum |
| 30. | MALUMPHY Chris | Hearing Expert | EKE on Bactericera cockerelli |
| 31. | MARZACHI Cristina | Member | EKE on grapevine flavescence dorée |
| 32. | MCCULLOUGH Deborah | Member | EKE on Agrilus anxius, Agrilus planipennis |
| 33. | MERIGGI Pierluigi | Hearing Expert | Information on cereals production |
| 34. | MILONAS Panagiotis | Member |
EKE on Bactericera cockerelli Review on Bactrocera dorsalis, Bactrocera zonata |
| 35. | MOSBACH‐SCHULZ Olaf | Member from EFSA | Elicitor during most of the EKEs |
| 36. | NERI Franco Maria | Member from EFSA | Support to experts and JRC, rapporteur during EKEs |
| 37. | PAPADOPOULOS Nikolaos | Member |
EKE on Anastrepha lundens, Bactrocera dorsalis, Bactrocera zonata, Rhagoletis pomonella Review on Thrips palmi |
| 38. | PAPANASTASSIOU Stella | Hearing Expert | EKE on Anastrepha lundens, Bactrocera dorsalis, Bactrocera zonata, Rhagoletis pomonella |
| 39. | RAFOSS Trond | Hearing Expert | EKE on Candidatus Liberibacter spp., Clavibacter michiganensis subsp. sepedonicus, Dendrolimus sibiricus, Phyllosticta citricarpa, Ralstonia solanacearum, Synchytrium endobioticum, Tilletia indica, Xanthomonas citri |
| 40. | RAVN Hans Peter | Member | EKE on Agrilus anxius, Agrilus planipennis |
| 41. | RUTLEDGE Claire | Member |
EKE on Agrilus anxius, Agrilus planipennis Review on Dendrolimus sibiricus |
| 42. | SILIGATO Riccardo | Member from EFSA | Support to experts and JRC, rapporteur during EKEs |
| 43. | STANCANELLI Giuseppe | Member from EFSA | Chair of the Working Group in the preliminary phase |
| 44. | TRAMONTINI Sara | Member from EFSA | Chair of the Working Group, support to experts and JRC, rapporteur during EKEs |
| 45. | UREK Gregor | Member |
EKE on Clavibacter michiganensis subsp. Sepedonicus, Ralstonia solanacearum, Synchytrium endobioticum Review on Bursaphelenchus xylophilus |
| 46. | VAN DER GAAG Dirk Jan | Member |
EKE on Clavibacter michiganensis subsp. Sepedonicus, Popillia japonica, Ralstonia solanacearum, Synchytrium endobioticum Review on Anastrepha ludens, Rhagoletis pomonella |
| 47. | VAN DER STRATEN Marja | Member | EKE on Spodoptera frugiperda, Thaumatotibia leucotreta |
| 48. | VERNIERE Christian | Member |
EKE on Candidatus Liberibacter spp., Phyllosticta citricarpa, Xanthomonas citri Review on Ralstonia solanacearum |
| 49. | VETTRAINO Anna Maria | Member |
EKE on Ceratocystis fagacearum Review on Tilletia indica |
| 50. | VICENT Antonio | Member | EKE on Candidatus Liberibacter spp., Phyllosticta citricarpa, Xanthomonas citri, Xylella fastidiosa |
| 51. | VILA Lluis | Hearing Expert | EKE on Conotrachelus nenuphar |
| 52. | YEMSHANOV Denys | Member | EKE on Agrilus anxius, Agrilus planipennis |
| 53. | YUEN Jonathan | Member |
EKE on Ralstonia solanacearum Review on Clavibacter michiganensis subsp. sepedonicus, Synchytrium endobioticum |
| 54. | ZAPPALA’ Lucia | Member |
EKE on Thrips palmi Review on Bactericera cockerelli, Thaumatotibia leucotreta |
Appendix C – Published Pest Reports and Pest Datasheets
1.
The table below is provided in order to help the user retrieving the 56 pest specific outputs published under this mandate. All the files are available on Zenodo and the provided Concept DOI will remain unchanged even in case of update of a file keeping accessible all the versions.
Appendix D – Flow chart of the quantitative assessment of pest‐related criteria required to rank candidate priority pests
1.
In order to fulfil the tasks indicated in the mandate, the WG conducted its assessment following a series of steps summarised in the flowchart below.
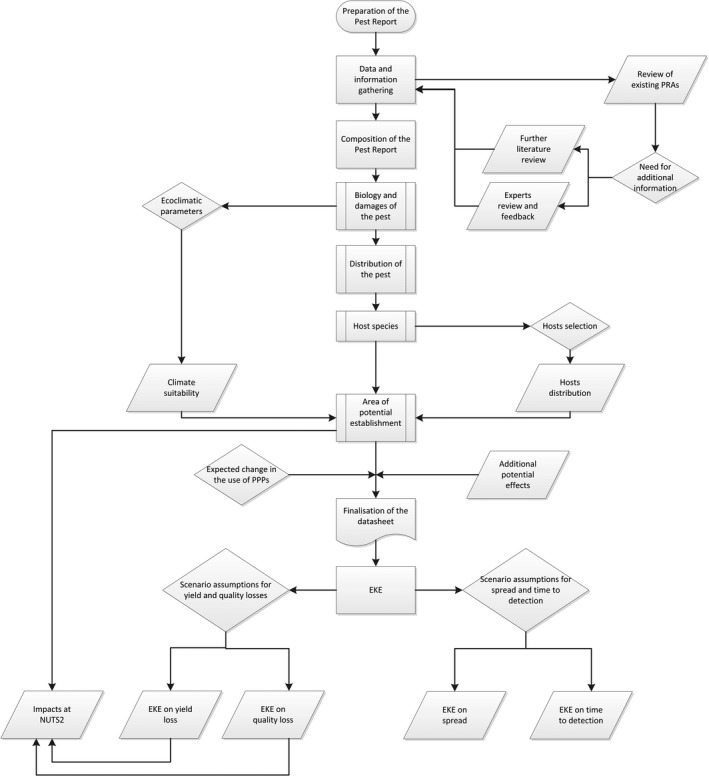
Appendix E – Summary table on the 28 assessed candidate priority pests
1.
Table E.1.
Summary of the types of hosts affected by the 28 candidate pests that were considered during the assessment of yield and quality losses. (Y: yield loss was assessed; Q: quality loss was assessed; U: (forest pests) yield loss was assessed also for urban areas)
| Fruits | Vegetables, legumes | Cereals | Other | Forest | ||||||||||||||||||||||||||||||||
|---|---|---|---|---|---|---|---|---|---|---|---|---|---|---|---|---|---|---|---|---|---|---|---|---|---|---|---|---|---|---|---|---|---|---|---|---|
| Pears | Apples | Peach and nectarine | Apricot | Plum | Cherry | Almond | Olive | Grape | Citrus | Avocado | Other exotic fruit | Berries (small fruit) | Potato | Tomato | Pepper | Eggplant | Cucurbits | Lettuce | Soybean | Durum wheat | Rice | Sorghum | Sweet corn | Grain maize | Forage maize/Biofuel | Turf | Ornamentals(cut flowers)/potted plants) | Birch | Ash | Oak | Fir | Pine | Other conifers | Other broadleaves | ||
| BACTERIA | Candidatus Liberibacter spp. (citrus greening) | Y | ||||||||||||||||||||||||||||||||||
| Xanthomonas citri | YQ | |||||||||||||||||||||||||||||||||||
| Grapevine flavescence dorée | Y | |||||||||||||||||||||||||||||||||||
| Xylella fastidiosa | Y | Y | Y | Y | ||||||||||||||||||||||||||||||||
| Clavibacter michiganensis subsp. sepedonicus | Y | |||||||||||||||||||||||||||||||||||
| Ralstonia solanacearum | YQ | Y | Y | Y | ||||||||||||||||||||||||||||||||
| FUNGI | Synchytrium endobioticum | Y | ||||||||||||||||||||||||||||||||||
| Ceratocystis fagacearum | Y | |||||||||||||||||||||||||||||||||||
| Phyllosticta citricarpa | YQ | |||||||||||||||||||||||||||||||||||
| Tilletia indica | YQ | |||||||||||||||||||||||||||||||||||
| INSECTS | Anastrepha ludens | Y | Y | Y | ||||||||||||||||||||||||||||||||
| Bactrocera zonata | Y | Y | Y | |||||||||||||||||||||||||||||||||
| Bactrocera dorsalis | Y | Y | Y | |||||||||||||||||||||||||||||||||
| Rhagoletis pomonella | Y | |||||||||||||||||||||||||||||||||||
| Anthonomus eugenii | Y | |||||||||||||||||||||||||||||||||||
| Conotrachelus nenuphar | Y | Y | Y | Y | Y | Y | ||||||||||||||||||||||||||||||
| Spodoptera frugiperda | Y | Y | Y | Y | Y | |||||||||||||||||||||||||||||||
| Thaumatotibia leucotreta | Y | Y | Y | Y | Y | Y | Y | Y | ||||||||||||||||||||||||||||
| Popillia japonica | Y | Y | Y | Y | Y | Y | Y | Y | Y | Y | Y | |||||||||||||||||||||||||
| Thrips palmi | YQ | YQ | YQ | Y | Y | |||||||||||||||||||||||||||||||
| Bactericera cockerelli | Y | Y | Y | Y | ||||||||||||||||||||||||||||||||
| Aromia bungii | Y | Y | Y | Y | Y | YU | ||||||||||||||||||||||||||||||
| Anoplophora chinensis | Y | Y | Y | Y | Y | Y | Y | Y | YU | |||||||||||||||||||||||||||
| Anoplophora glabripennis | YU | |||||||||||||||||||||||||||||||||||
| Agrilus anxius | Y | |||||||||||||||||||||||||||||||||||
| Agrilus planipennis | Y | |||||||||||||||||||||||||||||||||||
| Dendrolimus sibiricus | Y | Y | Y | |||||||||||||||||||||||||||||||||
| NEM | Bursaphelenchus xylophilus | Y | ||||||||||||||||||||||||||||||||||
Suggested citation: EFSA (European Food Safety Authority) , Baker R, Gilioli G, Behring C, Candiani D, Gogin A, Kaluski T, Kinkar M, Mosbach‐Schulz O, Neri FM, Siligato R, Stancanelli G and Tramontini S, 2019. Scientific report on the methodology applied by EFSA to provide a quantitative assessment of pest‐related criteria required to rank candidate priority pests as defined by Regulation (EU) 2016/2031. EFSA Journal 2019;17(6):5731, 61 pp. 10.2903/j.efsa.2019.5731
Requestor: European Commission
Question number: EFSA‐Q‐2017‐00558
Acknowledgments: EFSA wishes to acknowledge the contribution of the experts who participated to the EKE for the different pests and the peer‐reviewers of this document: Katharina Dehnen‐Schmutz and Mike Jeger.
Adopted: 17 May 2019
Notes: Links to 56 pest specific outputs can be found in Appendix C.This article was originally published on the EFSA website www.efsa.europa.eu on 3 June 2019 as part of EFSA's urgent publication procedures.
Notes
Regulation (EC) No 178/2002 of the European Parliament and of the Council of 28 January 2002 laying down the general principles and requirements of food law, establishing the European Food Safety Authority and laying down procedures in matters of food safety, OJ L 31, 1.2.2002, p. 1–24, as last amended.
Regulation (EU) 2016/2031 of the European Parliament of the Council of 26 October 2016 on protective measures against pests of plants, amending Regulations (EU) No 228/2013, (EU) No 652/2014 and (EU) No 1143/2014 of the European Parliament and of the Council and repealing Council Directives 69/464/EEC, 74/647/EEC, 93/85/EEC, 98/57/EC, 2000/29/EC, 2006/91/EC and 2007/33/EC, OJ L 317, 23.11.2016, p. 4–104.
Open‐access repository developed under the European OpenAIRE program and operated by CERN, https://about.zenodo.org/
The NUTS (Nomenclature of Territorial Units for Statistics) is a geocode standard developed and regulated by the European Union. The current NUTS classification lists 98 regions at NUTS 1, 276 regions at NUTS 2 and 1,342 regions at NUTS 3 level.
Data accessible from https://www.eea.europa.eu/data-and-maps/data/natura-10 (Last accessed: 2 May 2019)
References
- CABI (Centre for Agriculture and Bioscience International), online. Crop Protection Compendium. Available online: https://www.cabi.org/cpc/ [Accessed: 16 May 2019]
- EFSA (European Food Safety Authority), 2014. Guidance on Expert Knowledge Elicitation in Food and Feed Safety Risk Assessment. EFSA Journal 2014;12(6):3734, 278 pp. 10.2903/j.efsa.2014.3734 [DOI] [Google Scholar]
- EFSA (European Food Safety Authority), Schenk M, Camilleri M, Diakaki M, Schrader G and Vos S, 2019. Pest survey card on Synchytrium endobioticum . EFSA supporting publication 2019:EN‐1591, 20 pp. 10.2903/sp.efsa.2019.en-1591 [DOI]
- EFSA PLH Panel (EFSA Panel on Plant Health), Jeger M, Bragard C, Caffier D, Candresse T, Chatzivassiliou E, Dehnen‐Schmutz K, Gregoire J‐C, Jaques Miret JA, MacLeod A, Navajas Navarro M, Niere B, Parnell S, Potting R, Rafoss T, Rossi V, Urek G, Van Bruggen A, Van Der Werf W, West J, Winter S, Hart A, Schans J, Schrader G, Suffert M, Kertesz V, Kozelska S, Mannino MR, Mosbach‐Schulz O, Pautasso M, Stancanelli G, Tramontini S, Vos S and Gilioli G, 2018a. Guidance on quantitative pest risk assessment. EFSA Journal 2018;16(8):5350, 86 pp. 10.2903/j.efsa.2018.5350 [DOI] [PMC free article] [PubMed] [Google Scholar]
- EFSA PLH Panel (EFSA Plant Health Panel), Bragard C, Dehnen‐Schmutz K, Di Serio F, Gonthier P, Jacques M‐A, Jaques Miret JA, Justesen AF, Magnusson CS, Milonas P, Navas‐Cortes JA, Parnell S, Potting R, Reignault PL, Thulke H‐H, Van der Werf W, Vicent Civera A, Yuen J, Zappalà L, Czwienczek E and MacLeod A, 2018b. Scientific Opinion on the pest categorisation of Popillia japonica . EFSA Journal 2018;16(11):5438, 30 pp. 10.2903/j.efsa.2018.5438 [DOI] [Google Scholar]
- EFSA PLH Panel (EFSA Panel on Plant Health), Bragard C, Dehnen‐Schmutz K, Di Serio F, Gonthier P, Jacques M‐A, Jaques Miret JA, Justesen AF, MacLeod A, Magnusson CS, Milonas P, Navas‐Cortés JA, Potting R, Reignault PL, Thulke H‐H, van der Werf W, Vicent Civera A, Yuen J, Zappalà L, Boscia D, Chapman D, Gilioli G, Krugner R, Mastin A, Simonetto A, Spotti Lopes JR, White S, Abrahantes JC, Delbianco A, Maiorano A, Mosbach‐Schulz O, Stancanelli G, Guzzo M and Parnell S, 2019a. Update of the Scientific Opinion on the risks to plant health posed by Xylella fastidiosa in the EU territory. EFSA Journal 2019;17(5):5665, 200 pp. 10.2903/j.efsa.2019.5665 [DOI] [PMC free article] [PubMed] [Google Scholar]
- EFSA PLH Panel (EFSA Panel on Plant Health), Jeger M, Bragard C, Caffier D, Candresse T, Chatzivassiliou E, Dehnen‐Schmutz K, Gilioli G, Gregoire J‐C, Jaques Miret JA, Navarro MN, Niere B, Parnell S, Potting R, Rafoss T, Rossi V, Urek G, Van Bruggen A, Van der Werf W, West J, Winter S, Day R, Early R, Hruska A, Nagoshi R, Gardi C, Mosbach‐Schultz O and MacLeod A, 2018c. Scientific Opinion on the pest risk assessment of Spodoptera frugiperda for the European Union. EFSA Journal 2018;16(8):5351, 120 pp. 10.2903/j.efsa.2018.5351 [DOI] [Google Scholar]
- EFSA Scientific Committee, Benford D, Halldorsson T, Jeger MJ, Knutsen HK, More S, Naegeli H, Noteborn H, Ockleford C, Ricci A, Rychen G, Schlatter JR, Silano V, Solecki R, Turck D, Younes M, Craig P, Hart A, Von Goetz N, Koutsoumanis K, Mortensen A, Ossendorp B, Martino L, Merten C, Mosbach‐Schulz O and Hardy A, 2018. Guidance on Uncertainty Analysis in Scientific Assessments. EFSA Journal 2018;16(1):5123, 39 pp. 10.2903/j.efsa.2018.5123 [DOI] [PMC free article] [PubMed] [Google Scholar]
- EPPO (European and Mediterranean Plant Protection Organization), online. EPPO Global Database. Available online: https://gd.eppo.int/ [Accessed: 16 May 2019]


