

Abstract
Since 2007, the EFSA PRIMo (Pesticide Residue Intake Model), an Excel‐based calculation spreadsheet, is the standard tool used at EU level to perform the dietary risk assessment for pesticide residues in the framework of setting and reviewing of maximum residue levels for pesticides under Regulation (EC) No 396/2005 and in the peer review of pesticides under Regulation (EU) No 1107/2009. The model was now updated with regard to food consumption data derived from some recent dietary food surveys. In addition, new functionalities were included in the calculation spread sheet to make the tool more user‐friendly and to allow automatic integration of the EFSA PRIMo in the workflows where dietary risk assessments are performed.
Keywords: dietary risk assessment model, pesticide residues
Short abstract
This publication is linked to the following EFSA Supporting Publications article: http://onlinelibrary.wiley.com/doi/10.2903/sp.efsa.2019.EN-1605/full
Summary
Similar to the previous version of the European Food Safety Authority Pesticide Residue Intake Model (EFSA PRIMo), revision 3 of the model is intended
to support risk assessors in performing the risk assessments in a transparent way reflecting the currently agreed risk assessment approach at European Union (EU) level;
to provide risk managers with the relevant details needed to take risk management decisions on setting or amending legal limits and risk management decisions to be taken in the framework of maximum residue level (MRL) enforcement;
to be easy to handle, based on standard Information Technology (IT) tools (Excel) which do not require specific IT expertise of the user;
to perform risk assessments in a standardised way required for regulatory questions at EU level and also allow the flexibility to calculate not standard risk assessment scenarios.
The new version of the EFSA PRIMo was updated for the following elements:
Incorporation of new food consumption data available for calculating dietary exposure assessments to pesticide residues1;
Alignment of the food classification with the latest version of Annex I of Regulation (EC) No 396/2005;
Enhancement of the interoperability of the model with other tools used in pesticide risk assessment;
The model provides the option to run short‐term dietary exposure assessments with the IESTI methodology proposed in the Scientific Workshop in Geneva, organised by EFSA, cosponsored by FAO/WHO. It is stressed that this module is intended purely for information purposes and does not anticipate a decision to change the methodology;
The results of the calculation of the Theoretical Maximum Daily Intake (TMDI) are reported as supplementary information.
The model provides the option to calculate the long‐term dietary exposure according to the UK approach (Rees–Day methodology). Also, this module is intended to provide risk managers supplementary information.
The main characteristics of the risk assessment model are summarised in the table below.
Characteristics of EFSA PRIMo revision 3
| Model purpose | Estimation of the short‐ and long‐term dietary exposure to pesticide residues via food. |
| Model type |
The EFSA PRIMo revision 3 is a deterministic model that is primarily intended for being used as a predictive screening tool in the framework of setting MRLs (see below). It can also be used to provide risk managers quantitative results on enforcement questions (e.g. to decide if for food consignments subject to official controls Rapid Alert Notifications (RASFF) or any other risk management actions need to be taken). The model can be used in the framework of post‐marketing dietary risk assessment to estimate the actual long‐term and short‐term exposure resulting from residues measured in pesticide monitoring programmes (see below limitations of the model). |
| Regulatory framework | The model was designed to be used in the context Regulation (EC) No 396/2005 (MRL setting, MRL review under Article 12, assessment of exposure related to results of pesticide monitoring) and in the framework of the approval of pesticides under Regulation (EC) No 1107/2009. |
| Target model users |
Risk assessors and risk managers, working in the framework of Regulation (EC) No 396/2005 and Regulation (EC) No 1107/2009. For reasons of transparency, the model should be made available for being used by other parties having an interest in food safety allowing to reproduce the risk assessments performed by competent regulatory authorities in the framework of the beforementioned legislation. It can be used by applicants requesting or considering requesting a modification of an existing EU MRL set in the framework of Regulation (EC) No 396/2005 to predict the outcome of a risk assessment. Although the intention was to create a risk assessment model that is easy to handle, the user should have a certain level of expert knowledge in dietary risk assessment to be able to interpret the results correctly. |
| Limitations of the model |
Since EFSA PRIMo revision 3 is a deterministic model, it does not allow predicting the level of protection, i.e. the percentage of the population that exceeds a certain exposure level defined by risk managers. For this type of question, probabilistic models would be required. PRIMo revision 3 does not assess the uncertainty related to the dietary exposure calculations. With the PRIMo model, the exposure is calculated separately for each pesticide. Using the standard setting of PRIMo revision 3, the calculation of cumulative exposure resulting from more than one pesticide is not foreseen. Due to limited availability of consumption data for processed commodities, the possibility to perform refined exposure assessments, taking into account individual processing factors, is limited. Food consumption data used in the EFSA PRIMo are not fully comparable; the design of the surveys may differ significantly; the statistical analysis of the consumption data (e.g. calculation of mean or high percentile consumption) is not standardised. Consumption data are not available for all food products listed in the EU food classification used for pesticides (Part A of Annex I of Regulation (EC) No 396/2005). No detailed consumption data are available for minor food products listed in Part B of the EU food classification used for setting MRLs for pesticides. |
1. Introduction
In 2006, European Food Safety Authority (EFSA) developed an Excel‐based risk assessment tool (EFSA PRIMo – Pesticide Residue Intake Model) for screening of approximately 90.000 temporary maximum residue levels (MRLs) under Article 24 of Regulation (EC) No 396/20052 for possible dietary health concerns relevant for the European population. The purpose of the model was to estimate simultaneously the short‐term and the long‐term exposure of consumers to pesticide residues and to compare the estimated exposure with the toxicological reference values to identify potential consumer health risks. In 2007, the model was revised (EFSA PRIMo revision 2) (EFSA, 2007), including additional features which allowed refined calculations according to the internationally agreed risk assessment methodology of Joint Meeting on Pesticide Residues (JMPR) (FAO 2002).3
Since 2007, the EFSA PRIMo revision 2 is the standard tool used at European Union (EU) level to perform the dietary pesticide risk assessment in the framework of the setting and reviewing of MRLs for pesticides under Regulation (EC) No 396/2005 and the peer review of pesticides under Regulation (EC) No 1107/2009. The EFSA PRIMo was also used to estimate the exposure of European consumers to pesticide residues measured in the EU pesticide‐monitoring programmes (EFSA, 2009, 2010, 2011b, 2013, 2016, 2017); an adapted version of the PRIMo tool was used to perform indicative cumulative risk assessments based on deterministic methodologies (EFSA, 2014). According to the EU guidelines for evaluation of the risk for pesticide residues triggering notifications in the framework of the Rapid Alert System for Food and Feed (RASFF) (RASFF WI 2.2, Guidelines for the calculation of consumer intake and evaluation of the risk for pesticide residues, version 2016/01/054), the EFSA PRIMo should be used to decide which actions have to be taken.
The calculation spreadsheet for the EFSA PRIMo model was made publicly available on the EFSA website and via Zenodo5 to provide risk assessors in the EU Member States, applicants and interested stakeholders the opportunity to reproduce the consumer risk assessment for pesticide residues performed by EFSA or to perform indicative calculations to decide whether an application for amending the existing EU MRL would be acceptable from a consumer safety point of view.
The exposure calculations in EFSA PRIMo revision 2 are based on food consumption data for food crops/commodities listed in Annex I of Regulation (EC) No 396/2005. These consumption data were provided by 14 Member States specifically for being used for the pesticide risk assessment; in addition, also the Global Environment Monitoring System (GEMS)/Food cluster diets (WHO, 2006) relevant for the European population were included in the model. The spreadsheet for inserting the input values (i.e. residue concentrations to be assessed) was structured in a way to make it compatible with the food classification established in Annex I of Regulation (EC) No 396/2005 that was in place in 2007 (Regulation (EC) No 178/20066).
After several years of use, the EFSA PRIMo rev. 2 should be updated to reflect the most recent information on food consumption and the changed legal framework.
At international level, discussions are ongoing if and how the currently used acute risk assessment methodology should be modified (EFSA and RIVM, 2015). The new revision of the model should allow performing comparative calculations, quantifying the impact of the proposed modifications, without anticipating the outcome of the ongoing discussions.
2. Terms of Reference
An updated version of the EFSA PRIMo shall be developed (EFSA PRIMo revision 3) addressing the following aspects:
Incorporation of additional or revised food consumption data that were made available to EFSA by Member States (Netherlands, Germany, Ireland, France, Czech Republic, Denmark, Finland and Belgium);
Incorporation of additional/revised data on the unit weight of commodities used in the acute exposure calculation methodology (IESTI).
-
Establish the possibility to calculate two acute risk assessment scenarios:
-
–
Scenario 1 should reflect the currently used EU risk assessment methodology using variability factors agreed by EU risk managers7 and the highest residue (HR) or the Supervised Trials Median Residue (STMR) according to case 1, 2a/2b and case 3 as defined in the FAO Manual (FAO, 2016);
-
–
in scenario 2, the acute exposure should be calculated in line with the recommendations of the international workshop on revisiting the IESTI equations (EFSA and RIVM, 2015)
-
–
Provide risk managers with supplementary information related to the chronic exposure calculations (i.e. results of Theoretical Maximum Daily Intake (TMDI) calculation and results of calculation according to Rees Day approach8).
The new revision of the EFSA PRIMo should reflect the food classification used for setting of legal limits for pesticide residue (Commission Regulation (EU) No 752/20149).
The data management should be streamlined to allow an integration of the model in the different EFSA risk assessment workflows (peer review, MRL applications, MRL reviews under Article 12 or Regulation (EC) No 396/2005, risk assessment on the basis of monitoring data).
In order to streamline the data management, the format of the input values used for the exposure calculation (residue concentrations) should be compatible with database formats used by EFSA in the framework of risk assessments of pesticides.
The tool should provide sufficient flexibility to perform calculations with modified parameters (e.g. calculations with alternative variability factors).
A guidance document should explain the functionalities of EFSA PRIMo revision 3, provide details on the data used for the exposure calculations and the methodology implemented for long‐term and short‐term risk assessment.
3. Methodology for assessing dietary risks related to pesticide residues
In general, two main purposes for dietary risk assessment of pesticide residues can be distinguished:
Premarketing/preauthorisation dietary risk assessment: the purpose is to assess risks resulting from pesticide residues expected on food related to intended uses of an new active substance or of intended new uses of an active substance that is already used on other crops;
Post‐marketing risk assessment: performed to assess the actual exposure of the population resulting from pesticide residues in food consumed.
In both cases, the risk assessment may focus on two different time frames of the exposure:
Long‐term (chronic) exposure or
Short‐term (acute) exposure (usually the exposure related to a single meal or over a day).
In the long‐term (chronic) risk assessment, the estimated chronic dietary exposure is compared with the acceptable daily intake (ADI) value which gives the concentration of a chemical that can be consumed over a long period without unacceptable negative health effects. For the short‐term (acute) risk assessment, the Acute Reference Dose (ARfD) is used to identify possible consumer health risks. The ARfD gives the concentration of a chemical that can be ingested over a short period of time (one meal, one day) without appreciable risks.
The general equations for calculating the chronic and acute dietary exposure, assessments implemented in the EFSA PRIMo revision 3 are summarised in Table 1. These equations present the algorithms for the premarketing dietary risk assessment, based on residue data either derived from supervised field trials or based on the MRL.
Table 1.
Algorithm for calculation of dietary exposure implemented in EFSA PRIMo
| Type of exposure assessmenta | Equationsb | Reference | |
|---|---|---|---|
| Chronic exposure assessment | |||
| TMDI | Original equation for TMDI: Equation implemented in PRIMo rev. 3c: i, j, k,….n: individual raw agricultural products | FAO, 2016 | |
| IEDI |
|
||
| NEDI: Rees–Day model (I) |
|
NEDI Chronic intake guidance documentd | |
| NEDI: Rees–Day model (II) |
k, l, m, …n: remaining raw agricultural commodities consumed |
||
| Acute exposure assessment | |||
| IESTI Case 1 |
|
FAO, 2016 | |
| IESTI Case 2a |
|
||
| IESTI Case 2b |
|
||
| IESTI Case 3 |
|
||
| IESTI new Case 1 and 3 |
|
EFSA and RIVM, 2015 | |
| IESTI new Case 2a and 2b |
|
||
Different types of exposure assessments:
TMDI: Theoretical Maximum Dietary Intake;
IEDI: International Estimated Dietary Intake;
NEDI: National Estimated Dietary Intake; NEDI calculations are only performed for UK and Finish diets;
IESTI: International Estimated Short‐Term Intake.
Case 1: refers to commodities with unit weight of the raw agricultural commodity (URAC) ≤ 25 g (e.g. walnuts, strawberries and peas. It is also used for meat, liver, kidney, edible offal, eggs and for post‐harvest uses in cereal grains, oilseeds and pulses).
Case 2a: for food product with a URAC > 25 g, where the meal‐sized portion > Uep (unit weight edible portion).
Case 2b: for food products with a URAC > 25 g, where the meal sized portion is < Uep.
Case 3: for food products that are usually bulked or blended before they are consumed (e.g. cereals, pulses, oilseeds and milk).
IESTI new: risk assessment methodology proposed in the international workshop organised by EFSA, cosponsored by FAO/WHO (EFSA and RIVM, 2015).
Parameters used in the equations:
MRL/MRL i : Maximum residue level for the RAC concerned (in mg/kg);
STMR/STMR i : Supervised Trials Maximum Residue for raw agricultural commodity (RAC) concerned (in mg/kg);
CF, CF i : Conversion factor residue definition enforcement to residue definition risk assessment (calculated as the ratio of residues according to the residue definition for risk assessment divided by the residue concentration according to the residue definition for enforcement);
MC i : mean consumption for a given raw agricultural product (RAC) calculated for the whole survey/subgroup of the survey, including processed products (recalculated to the unprocessed RAC) (in kg/day);
P97.5 consumption i for a given raw agricultural product (RAC), calculated from the individual consumption reported by the participants of the whole survey/subgroup of the survey, including processed products (recalculated to the unprocessed RAC) (in kg/day);
BW: mean body weight for the subgroup of the population related to the LP or mean consumption (in kg). It is noted that for IESTInew, it was recommended to express the LP on individual body weight. This recommendation could not yet be fully implemented since the LP data were used as provided by the Member States. The LP would have to be recalculated on the basis of the individual consumption and individual body weight of the respondent of the survey.
LP: Large portion reported (in kg/day) (97.5th percentile of eaters (or alternative percentile, depending on the number of reported eating occasions, see also footnote 13));
HR: Highest residue according to residue definition for enforcement in composite sample (in mg/kg);
U ep : Unit weight of edible portion (in kg), provided by the country from which the LP was reported (or mean unit weight calculated from all available unit weight data, if no unit weight is available from the country matching the highest LP).
PF: Processing factor or peeling factor (calculated as the ratio of residues in processed/peeled product, divided by residue concentration in unprocessed/unpeeled product);
VF: variability factor, depending on the unit weight of the whole product (URAC), different default VFs are used in the calculations.
URAC < 25 g, the calculations are performed according to case 1 (VF = 1).
URAC between 25 and 250 g: VF = 7.
URAC greater than 250: VF = 5.
In IESTInew, a default VF of 3 is used.
In case, empirically derived variability factors are available, the default VF is to be replaced.
In contrast to the TMDI equation developed by JMPR, a conversion factor (CFi) is included in the calculation which takes into account the residues included only in the residue definition for risk assessment, but not in the MRL which refers to the residue definition for enforcement.
EFSA PRIMo revision 3 was developed primarily to perform dietary risk assessments in the preregulatory/preauthorisation context. For calculations of the exposure in the framework for the post‐marketing scenarios, the MRL/HR/STMR values need to be replaced by the measured residue derived in control or monitoring samples (see Table 2).
Table 2.
Source of residue concentration used in post‐marketing risk assessment
| Type of risk assessment | Chronic risk assessment | Acute risk assessment |
|---|---|---|
| Actual exposure assessment | MRLi or STMRi are replaced by mean residue concentration calculated from the individual results measured in pesticide monitoring programmes | HR, STMR or MRL are replaced by highest or individual residue concentration(s) measured in pesticide monitoring programmes |
| MRL enforcement | MRLi or STMRi are replaced by residue concentration measured in the consignment(s) under assessment (performed only in exceptional cases) | HR, STMR or MRL are replaced by residue concentration measured residue in the consignment under assessment |
4. Food consumption data used for chronic and acute exposure assessments
Food consumption data (i.e. mean consumption (MC), 97.5th percentile consumption (P97.5 consumption) and large portion (LP)) were provided by Member States who have derived this information from national food surveys. Since the calculations in PRIMo are performed on the basis of the food products defined in Annex I of Regulation (EC) No 396/2005, the consumption reported for processed and composite food was recalculated by the data provider to the unprocessed raw agricultural commodity (RAC). In addition, consumption data for a number of processed products were provided for being used for acute exposure assessments. Table 3 summarises the relevant surveys used parameterise the EFSA PRIMo revision 3. It has to be pointed out that the surveys have been performed according to different methodologies. Although the surveys are not fully comparable, the data are considered appropriate to address risk management questions, in particular to identify intake concerns for the EU population related to pesticide residues in food. The food consumption data in the EFSA PRIMo revision 3 reflect the currently used national risk assessment models used by Member States for this purpose.
Table 3.
Food surveys used to derive food consumption data used in EFSA PRIMo revision 3
| Member State (acute/chronic exposure assessment) | Reference |
|---|---|
| Belgium (acute) |
I. Huybrechts I., Bellemans M., De Maeyer M., Matthys C., De Backer G, De Henauw S., 2003. Onderzoek naar het voedingspatroon van Vlaamse kleuters. Nutrinews, 4:3–8; Huybrechts, I., Matthys, C., Vereecken, C., Maes, L., Temme, E. H. M., Van Oyen, H., De Backer, G., De Henauw, S. (2008). Food intakes by preschool Children in Flanders Compared with Dietary Guidelines. International Journal of Environmental Research and Public Health, 5, 243–257. Huybrechts I., 2008. Dietary habits in preschool children: as a basis for the development of a methodological framework for future dietary surveillance. Monografieën van de Vakgroep Maatschappelijke Gezondheidskunde, Universiteit Gent (ISBN 9789078344087) |
|
Czech Republic (acute) |
Ruprich J, Dofkova M, Rehurkova I, Slamenikova E, Resova D. 2006. Individual food consumption – the national study SISP04. CHFCH NIPH in Prague. Available from: http://www.chpr.szu.cz/spotrebapotravin.htm |
| Germany (acute and chronic) |
Banasiak, U., Heseker, H., Sieke, C., Sommerfeld, C. und Vohmann, C. (2005) Abschätzung der Aufnahme von Pflanzenschutzmittel‐Rückständen in der Nahrung mit neuen Verzehrsmengen für Kinder. Bundesgesundheitsbl– Gesundheitsforsch – Gesundheitsschutz 48:84–98. Brombach C. et al., Die Nationale Verzehrsstudie II ‐ Ziel: Aktuelle und belastbare Primärdaten für die Ernährungsberichterstattung des Bundes generieren, Ernährungs‐Umschau 53 (2006) Heft 1, Karlsruhe Krems C. et al., Methoden der Nationalen Verzehrsstudie II, Ernährungs‐Umschau 53 (2006) Heft 2, Karlsruhe Anonymus, Nationale Verzehrsstudie II ‐ Ergebnisbericht Teil 1, Max Rubner‐Institut, Bundesforschungsinstitut für Ernährung und Lebensmittel, 2008, Karlsruhe, http://www.was-esseich-de/uploads/media/NVS_II_Abschlussbericht_Teil_1_mit_Ergaenzungsbericht.pdf Anonymus, Nationale Verzehrsstudie II ‐ Ergebnisbericht Teil 2, Max Rubner‐Institut, Bundesforschungsinstitut für Ernährung und Lebensmittel, 2008, Karlsruhe, http://www.was-esseich-de/uploads/media/NVSII_Abschlussbericht_Teil_2.pdf (link: http://www.bfr.bund.de/cm/349/bfr-model-for-pesticide-residue-intake-calculations-nvs2.zip) |
| Denmark(acute and chronic) |
Acute: Jensen A, Hartkopp H, Hinsh H‐J, Matthiessen J, Moeller A, Saxholt E et al. 2005. The Danes dietary habits 2000‐2002. Main results. [in Danish, summary in English]. Søborg (Denmark): Danish Institute for Food and Veterinary Research. Chronic: Pedersen, A.N., Fagt, S., Groth, M.V., Christensen, T., Biltoft‐Jensen, A.P., Matthiessen, J., Andersen, N.L., Kørup, K., Hartkopp, H.B., Ygil, K.H., Hinsch, H–J., Saxholt, E., Trolle, E, 2010, Danskernes kostvaner 2003–2008, Hovedresultater (Dietary habits in Denmark 2003–2008, Main results), National Food Institute, Technical University of Denmark. Data for animal products from a survey conducted in 1995 |
| Finland (acute and chronic) |
FINDIET 2007 Survey. (In Finnish, summary, figures and tables in English) Publications of the National Public Health Institute, B23/2008. Helsinki: National Public Health Institute. Available from http://www.ktl.fi/attachments/suomi/julkaisut/julkaisusarja_b/2008/2008b23.pdf Reinivuo H, Hirvonen T, Ovaskainen M‐L, Korhonen T and Valsta LM, 2010. Dietary survey methodology of FINDIET 2007 with a risk assessment perspective. FINRISK 2007 project (https://www.maelstrom-research.org/mica/study/finrisk-2007) and https://www.julkari.fi/handle/10024/78088 (permanent address: http://urn.fi/URN:NBN:fi-fe201204193298)) DIPP projects Simell et al. http://dipp.utu.fi/index.php?mid=2&language=en |
| France (acute and chronic) | Volatier, J.‐L., 2000. Enquête INCA individuelle et nationale sur les consommations alimentaires. Agence Francaise de Sécurité Sanitaire des Aliments (AFSSA). Tech & Doc, Parisa |
| Ireland (acute and chronic) | IUNA (Irish Universities Nutrition Alliance) 2004. North/South Ireland Food Consumption Survey: Food And Nutrient Intakes, Anthropometry, Attitudinal Data & Physical Activity Patterns. Irish Universities Nutrition Alliance, Dublin, Ireland. |
| Italy (acute and chronic) | Leclercq C, Arcella D, Piccinelli R, Sette S, Le Donne C and Turrini A, 2009. The Italian national food consumption survey INRAN‐SCAI 2005–06: main results in terms of food consumption. Publ Health Nutr. 12(12): 2504–2532. |
| Lithuania(acute and chronic) | Barzda A, Abaravicius A, Bartkeviciute R, Stukas R, Olechnovic M, 2004. Food Consumption Patterns in Adult Lithuanian Population 2001–2002. Laboratorin≐ medicina, 4 (24), 23 |
| Netherlands (chronic) |
Ocké MC, Van Rossum CTM, Fransen HP, Buurma EJM, de Boer EJ, Brants HAM, Niekerk EM, Van der Laan JD, Drijvers JJMM and Ghameshlou Z, 2008. Dutch National Food Consumption Survey – Young children 2005/2006 (350070001). Bilthoven: National Institute for Public Health and the Environment (RIVM). Available from : http://www.rivm.nl/dsresource?objectid=05986352-f7e9-4f63-840d-742428e7c4f4&type=org&disposition=inline VIO for toddlers (8–20 months) performed in 2002; owned by TNO Nutrition and Numico and managed by RIVM. Food consumption survey (VCP‐3) for the general population of 1–97 years, performed in 1997–1998; owned by the Dutch minitry of Health, Welfare and Sports and managed by the RIVM. |
| Poland (acute and chronic) | Szponar L, Sekula W, Rychlik E, Oltarzewski M, Figurska K, 2003. Household Food Consumption and Anthropometric Survey. National Food and Nutrition Institute, Project Report TCP/POL/8921(A). Warsawa. Poland. |
| Portugal (chronic) | Food balance sheet 1997 |
| Romania (chronic) | Food balance sheet (year not reported) |
| Spain (acute and chronic) |
Ministerio de sanidad y consumo 2006. Modelo de dieta española para la determinación de la exposición del consumidor a sustancias químicas. Agencia Española de seguridad alimentaría, Spain. Document available at: http://www.aecosan.msssi.gob.es/AECOSAN/docs/documentos/para_consumidor/modelo_dieta_espanola.pdf |
| Sweden (chronic) |
Andersen L 1996. Typiske vægte for madvare, Scandinavian Journal of Nutrition/Naringsforskning 4/96, 3: 129–152. Becker W and Pearson M, 2003. Kostvanor och naringsintagg i Sverige. Avdelingen for Informeation och Nutrition, Livmedelsverket, Sverige. |
| United Kingdom(acute and chronic) |
PSD (UK Pesticides Safety Directorate) 2006. Chronic Consumer Risk Assessment. Document available at: |
More recent French food surveys are available; however, due to limited resources, the food consumption data could not be provided in a format compatible with the EFSA PRIMo rev. 3.
It is noted that the food consumption data compiled in the EFSA Comprehensive European Food Consumption Database (EFSA, 2011a) have not yet been taken into account in the new revision of the EFSA PRIMo because the conversion of the processed products to the corresponding RACs has not yet been completed. As soon as this conversion is completed, the relevant statistical descriptors (i.e. mean consumption for specific subgroups of the population and high percentile of the eaters population) will be derived. Upon availability of these new data, the EFSA PRIMo will be updated again.
The food consumption data in EFSA PRIMo revision 3 are structured in accordance with the current version of the food classification used to set MRLs under Regulation (EC) No 396/2005, i.e. Annex I to this regulation.9 , 10 The naming of the food commodities has been aligned with Annex I, Part A of Regulation (EU) No 752/2014. It is noted that food products listed in Part B of the food classification are not reported separately but are represented by the corresponding product of listed in Part A. For example, the overall consumption figure for sweet peppers (code 0231020) comprises also consumption reported specifically for chilli peppers, a crop listed in Part B of the food classification under to the main commodity sweet peppers. This implies that refined exposure calculations cannot be performed at that detailed level.
4.1. Chronic exposure assessments
Overall, 30 Member State diets for chronic exposure assessments were taken into account in the PRIMo model. In addition, the relevant GEMS/Food Cluster diets relevant for the EU Member States (i.e. Cluster diet G06, G07, G08, G10, G11 and G15) were incorporated.11 Table 4 gives the overview on some key characteristics of the diets used in EFSA PRIMo revision 3 for chronic exposure assessments.
Table 4.
Diets for chronic exposure assessment
| Diet for chronic exposure | Subgroup of population/age group | Mean body weight (kg) | Comment |
|---|---|---|---|
| DE child | Children between 2 and 5 years | 16.2 | The German consumption data used in PRIMo were the consumption calculated on the basis of the individual body weight of the survey participants. The consumption of processed or composite food was referred back to RAC (edible portion) |
| DE general | General population | 76.4 | |
|
DE women 14–50 years |
Women of child‐bearing age | 67.5 | |
| DK adult | 15–74 years | 75.1 | Data on 1599 individuals for plant products and 1837 individuals for animal products. Diary record for food consumed over 7 days |
| DK child | 4–6 years | 21.8 | Data from 106 children for plant products and 137 children for animal products (male and female) |
| ES adult | Adults ≥ 17 years | 68.5 | 1,060 individuals |
| ES child | 7–12 years | 34.5 | 903 individuals |
| FI adult | Adults | 77.1 | Survey covered 958 male consumers (mean body weight 84.7 kg, SD 14.7 kg) and 1,080 female consumers (mean body weight 71.2 kg, SD 14.4 kg) |
| FI child 3 years | Children up to 3 years | 15.2 | Survey covered 505 children |
| FI child 6 years | Children up to 6 years | 22.4 | Survey covered 448 children |
| FR infant | 7–18 months | 9.1 | 261 individuals |
| FR toddler 2–3 years | 25–36 months | 13.6 | 127 individuals |
| FR child 3 to < 15 years | Children from 3 to less than 15 years | 18.9 |
341 children of 3–6 years (mean body weight 18.9 kg) 344 children of 7–10 years (mean body weight 30.0 kg) 333 children of 11–14 years (mean body weight 46.3 kg) |
| FR adult | Adults ≥ 15 years | 66.4 | 1,474 individuals (mean body weight 66.4 kg) |
| IE adult | Adults 18–64 years | 75.2 | 958 individuals |
| IE child | 5–12 years | 20.0 | 4,158 individuals |
| IT adult | 18–64 years | 66.5 | 1,513 individuals |
| IT toddler | 1–17 years | 41.6 | 288 individuals |
| LT adult | 19–64 years | 70.0 | 1,931 individuals |
| NL child | 2–6 years | 18.4 | 625 girls and 654 boys, calculated on the basis of body weight of 18.4 kg |
| NL general | General population, 1–97 years | 65.8 | Survey covered 2,558 consumers |
| NL toddler | 8 to 20 months | 10.2 | 914 children, calculated based on body weight of 10 kg |
| PL general | General population, 1–96 years | 62.8 | 4,134 individuals |
| PT general | General population | 60.0a | Food balance sheet |
| RO general | General population | 60.0a | Food balance sheet |
| SE general | General population, 1–74 years | 60.0a | 90th percentile consumption, in total 3,158 individuals |
| UK infant | 6 months–1 year | 8.7 | 448 individuals (male and female) |
| UK toddler | 18 months–4 years | 14.6 | 1,675 individuals |
| UK adult | 19–64 years | 76.0 | 1,724 adults, male and female |
| UK vegetarian | No information | 66.7 | Self‐declared vegetarians |
| GEMS/Food G06 | General population | 60.0a | Cluster diet 06 covers Greece |
| GEMS/Food G07 | General population | 60.0a | Cluster diet 07 covers Finland, France, Luxembourg and the United Kingdom |
| GEMS/Food G08 | General population | 60.0a | Cluster diet 08 covers Austria, Germany, Poland and Spain |
| GEMS/Food G10 | General population | 60.0a | Cluster diet 10 covers Bulgaria, Croatia, Cyprus, Estonia, Italy, Latvia and Malta |
| GEMS/Food G11 | General population | 60.0a | Cluster diet 11 covers Belgium and the Netherlands |
| GEMS/Food G15 | General population | 60.0a | Cluster diet 15 covers the Czech Republic, Denmark, Hungary, Ireland, Lithuania, Portugal, Romania, Slovakia, Slovenia and Sweden |
Default body weight.
4.2. Acute exposure assessments
According to JMPR (FAO, 2016), the short‐term (acute) exposure should be based on the ‘Large portion’ (LP) which is the 97.5th percentile of the reported consumption distribution. The LP is derived by considering the so‐called ‘eaters‐only’ or ‘consumers‐only’, that refers to those consumers among all the respondents of the survey who actually, during the surveyed period, have reported the consumption of the concerned commodity. The use of the 97.5th percentile of consumption should represent an intake situation in which a consumer is eating a large portion of the commodity within a short period of time (one day or meal).12 In cases where the number of respondents reporting consumption of a certain commodity was low, alternative percentiles need to be selected.13 The surveys used for deriving input values for the acute exposure assessment are summarised in Table 3.
In addition to the LP consumption data, information on the unit weight of food products (Uep, URAC) was provided by a number of Member States. For commodities, where no unit weight information was reported, EFSA filled the gap with estimates based on information published on the public domain.
By comparing the results of the exposure calculation of the different diets, EFSA identified the most critical diet for each food commodity. To perform these comparative intake calculations, the LP were combined with the unit weight of the matching country (e.g. Dutch LP was combined with Dutch unit weight information). If no corresponding unit weight information was available, the calculated mean or estimated unit weight was used.
The exposure assessments for unprocessed products in PRIMo revision 3 are calculated only for the most critical diet, which should cover all other diets that lead to a lower exposure.
In addition to data for unprocessed raw agricultural products, consumption data for processed commodities were provided to EFSA which were included in the PRIMo model as well. Similar to unprocessed products, the LP used in the EFSA PRIMo reflects the most critical diet among the diets provided.
5. Instructions for using EFSA PRIMo revision 3 in preregulatory risk assessments
In this section, a detailed description of the handling of the EFSA PRIMo revision 3 is provided.
The EFSA PRIMo revision 3 is an Excel workbook (Macro‐Enabled Workbook, Excel 2010) which contains several spreadsheets for data entry, data calculation and reporting the results. In total, nine different spreadsheets, which are described in detail in the following sections, are visible to the user:
Background information (see Section 5.1)
input_values (see Section 5.2)
Results (see Section 5.4.1)
Summary_input_values (see Section 5.5)
Supplementing_results_chronic (see Section 5.4.2)
chronic_intake_assessment (see Section 5.3.2)
acute_overview children (see Section 5.3.1)
acute overview adults (see Section 5.3.1)
chronic_consumption (see Section 5.6)
In order to facilitate the use of the EFSA PRIMo revision 3, colour codes were used to visualise the function of certain cells.
| Table headers | Description of the content of the column. In the table ‘input_values’, further explanations are provided in small text boxes that become visible if the curser is moved to the table headers. These text boxes explain what type of input values should be inserted or any other relevant information. |
| Cells for data entry | Only green cells are intended for entering data. In the standard setting of the model, all cells that are not intended for data entry (cells that are not shaded in green) are locked for avoiding that the cell content is changed unintentionally.a |
| No data entry | Grey cells refer to cells that are not be used for calculations. No data entry is foreseen in these cells. |
| Drop‐down list | The bright green cells contain a drop‐down list for selecting different options. By clicking on the arrow in the right bottom corner, the available entries become selectable. |
| Cells deserving specific attention | Particular attention should be paid to these cells in the spreadsheet ‘input_values’. Specific instructions are given in the cell which become visible when the curser is placed in this cell. |
| Linked cell | Yellow cells are connected with green cells. Thus, the cell is updated automatically if the connected green cell is modified. Yellow cells are not intended for data entry and are therefore locked. |
| Exposure exceeds toxicological reference value | In the ‘Results’, spreadsheet cells are highlighted in pink if the calculated exposure exceeds the ADI/ARfD. |
The protection of the cells can be easily removed, in case the user would like to make modifications by clicking on ‘Unprotect Sheet’ in the register ‘Review’. However, it is not recommended to remove the protection because unintended changes may have a serious impact on the calculations and the results.
Please note that the colour code for certain cells changes, depending on the context (e.g. depending on the type of calculation mode selected, or fat solubility of the residue).
The crop hierarchy established in Annex I of Regulation (EC) No 396/2005 is indicated in different shades of turquoise. The colour coding of the different hierarchy levels is given in the example below:
| Hierarchy level 1 | VEGETABLES |
| Hierarchy level 2 | Root and tuber vegetables |
| Hierarchy level 3 | Potatoes |
| Hierarchy level 4 | Carrots |
The spreadsheets of the EFSA PRIMo tool are protected in order to avoid that erroneously formula used for the risk assessment calculations or data not intended for modification are deleted by a user. Thus, as a general rule, only the green cells are open for data entry.
Despite of the spreadsheet protections, the user can adapt the view of the Excel sheets to his/her preferences. For facilitating the navigation within the individual work sheets and between the worksheets, several tools can be used:
Filters: In line 11 and 411 of the different spreadsheets in the EFSA PRIMo (all spreadsheets except ‘Results’, filters can be used to select certain entries. Please note that in the new version of Excel filtering for colours is possible).
Navigation buttons/function buttons:
In the input_values spreadsheet, a set of navigation buttons/function buttons are available which start a short macro or function after having clicked on it.

In the upper part of the spreadsheet, the ‘Reset’ button can be used to clear all data entries from the spreadsheet ‘input_values’ and the text inserted in comment fields in other spreadsheets. Before data are deleted, a message box asks for confirmation of the deletion. The reset macro will turn on the default setting for drop‐down lists (see below details Data entry in ‘input_values spreadsheet’ on cell L7, A10 and spreadsheet ‘Results’, cell B62). If the reset macro is not executed correctly, the security settings on the computer should be checked to allow the execution of macros.
In the top section of the different spreadsheets, additional navigation buttons are available which can be used to move between the different spreadsheets. An example of the navigation buttons on the spreadsheet ‘input_values’ is displayed below:


Alternatively, the user can also use the tabs in the bottom of the sheet.
Collapse/expand groups: In some of the spreadsheets, outline symbols can be found on the left side or above the tables. By clicking on the boxes with the minus or plus sign, a hierarchy group or other hidden information can be collapsed or expanded, respectively.
In the following section, detailed information on the different spreadsheets of the new PRIMo file is outlined.
5.1. Spreadsheet ‘Background information’
The spreadsheet is for information purpose. It contains
A short user manual;
Reference to the full EFSA guidance document;
Information on the revision of the model;
Contact details for reporting problems or for asking for support on the use of the tool.
5.2. Data entry in ‘input_values’ spreadsheet
All data on pesticide residues relevant for calculating the dietary risk assessment have to be entered in the spreadsheet called ‘input_values’. Colour codes as described above are used for certain cells to guide the user.
Detailed explanations for the different fields in the sheet ‘input_values’ are summarised in Table 6. The calculations in the different spreadsheets are updated automatically after entering the data in the ‘input_values’ spreadsheet. If this is not the case, please check in the settings in Excel if the function ‘workbook calculation’ is ‘automatic’ is ticked. (Click on the symbol in the left upper corner of Excel, select ‘Excel Options’, got to ‘Formulas’ and tick ‘Automatic ‘in the ‘Calculation options’.)
Table 6.
Description of the fields in the spreadsheet ‘input values’
| Field reference | Name of the field | Field content | Mandatory field | Field type, valid entries | ||||||
|---|---|---|---|---|---|---|---|---|---|---|
| Section 1: General information (line 1–10) | ||||||||||
| D3 | Active substance name | Enter the name of the active substance, for which the risk assessment should be performed | N | Alphanumerical field | ||||||
| D4, F4, G4 | ADI value, source, year | In D4, the ADI value in mg/kg body weight per day has to be entered | Y | D4: Numerical values | ||||||
| In F4 and G4, the source of the assessment and the year of the assessment should be entered (not mandatory fields) | N | F4, G4: free text | ||||||||
| D5, F5, G5 | ARfD value, source, year of assessment |
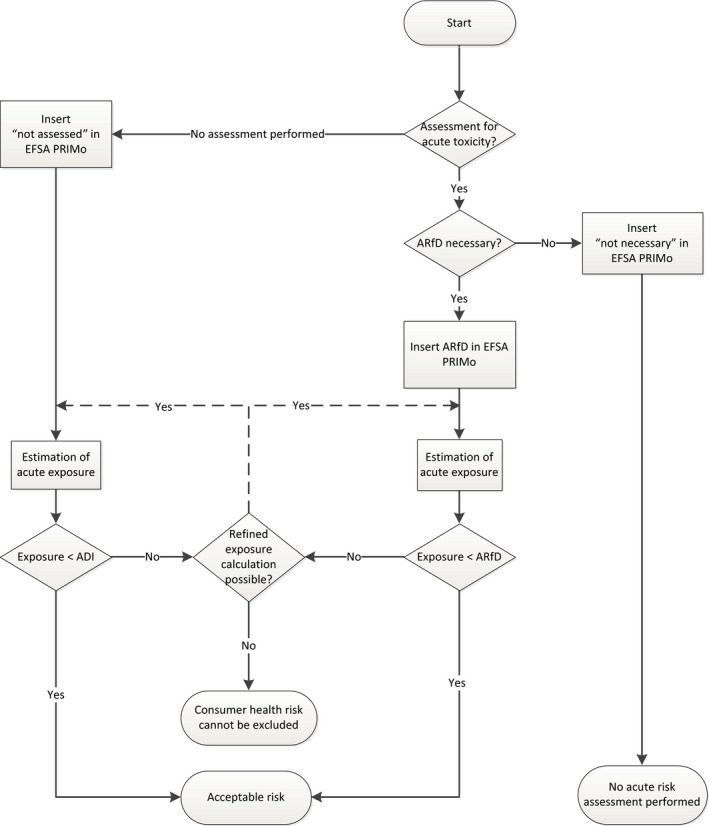
In D5, the ARfD value in mg/kg body weight has to be entered. Other valid entries: not necessary not assessed blank Please note that in the revision 2 of the EFSA PRIMo, ‘n.n.’ was used to indicate that no ARfD was considered necessary. This entry is no longer valid. Figure 1 outlines the schema how acute risk assessment is performed with EFSA PRIMo revision 3, depending on the information entered in the field D5. If the field is empty or the user enters ‘not assessed’, the calculation is performed with the ADI. No acute risk assessment is performed if the field is completed with the entry ‘not necessary’ or if no valid entry is inserted in this field |
N |
D5: Numerical values, ‘not necessary’ or ‘not assessed’ |
||||||
| In F5 and G5, the source of the assessment and the year of the assessment should be entered (not mandatory fields) | N | F5, G5: free text | ||||||||
| D6, D7, D8, D9 | Residue definitions for unprocessed products | The different residue definitions for unprocessed should be entered in these fields. The entries are not used for further calculations or data validations, but it is good practice to describe the calculated scenario in detail, including the residue definitions to which the assessment refers. | N | Free text | ||||||
| I6, I7, I8, I9 | Residue definitions for processed products |
In this part of the spreadsheet, the residue definitions for processed products should be inserted, if they differ from the residue definition for unprocessed products. Again, these entries are not used for calculations, but it is recommended to describe in a transparent manner the calculated scenario. |
N | Free text | ||||||
| L7 | Fat soluble residue definition for animal commodities | If a residue definition is defined as fat soluble, the entry ‘fat soluble’ should be selected from the drop‐down list. This selection will have an impact on the calculation of the exposure for meat/muscle of different species (see also field ‘MRL/proposed MRL’, column E in Section 2). |
Y; default setting: ‘not fat soluble’ |
Select from drop‐down list one of the valid entries (i.e. ‘not fat soluble’ or ‘fat soluble’) | ||||||
| A10 | Calculation mode |
The risk assessment calculations can be performed in two different modes: –Normal mode and –Refined calculation mode 1) In the ‘Normal mode’, all commodities are included in the exposure calculations (chronic and acute risk assessment) 2) In the ‘Refined calculation mode’, only those commodities are considered which are labelled with ‘Y’ in column L, ‘GAP under assessment’. The default setting is ‘Normal mode’ More details on the calculation mode can be found in Table 5. It is possible, to switch between ‘Normal mode’ and ‘Refined calculation mode’ without losing any information inserted in the spreadsheet.Typically, the refined calculation mode should be used for MRL reviews (Art. 12 of Regulation (EC) No 396/2005) which focusses on crops, for which a GAP has been reported and for the assessment of representative uses in the framework of the peer review under Regulation (EC) No 1107/2009.In the framework of MRL applications for active substances for which the MRL review has not yet been performed and where no information is available on the actual authorised uses, the calculations should be performed selecting the ‘Normal mode’ option, assuming that all crops for which an MRL was entered in column E contain residues at the level of the MRL or – if available – STMR‐RAC or HR‐RAC. |
Y, default setting ‘Normal mode’ |
Select from drop‐down list one of the valid entries | ||||||
| Cell LMN10 | GAPs under assessment |
This green cell contains a hyperlink to the drop‐down list in the spreadsheet ‘Results’ (line 73). The default setting is ‘Show results of IESTI calculation for all crops’. The alternative option is ‘Show results of IESTI calculation only for crops with GAPs under assessment’. Basically, switching between the two options has an effect on the acute risk assessment: the user can decide whether the results of the IESTI calculations should be presented for all crops, for which data have been inserted in the spreadsheet ‘input_values’ or only for a subset of crops, that are labelled in Column L as ‘GAP under assessment’. It is highlighted that this option is only of relevance if the calculations are performed in the ‘Normal mode’; in the ‘Refined calculation mode’ the chronic and the acute risk assessment are restricted anyway to the crops labelled with ‘Y’ in column L (see below). More detailed descriptions on this data element can be found in Section 5.4.1 and in the description of column L below. |
Default setting ‘Show all results’ | Select from drop‐down list | ||||||
| D10 | Comments | It is recommended to describe the scenario that is calculated, including the source of data or other relevant information. | N | Free text | ||||||
| Section 2: Entry section for unprocessed commodities (line 12–390) | ||||||||||
| Column A to C | Level, Code no., Commodity or group of commodities to which the MRLs apply | These cells contain the food classification and the food codes of Annex I of Regulation (EC) No 396/2005. The cells are protected to avoid unintended modifications of the content. | Cells locked | No modification allowed | ||||||
| Column D | Source/type of MRL | This field is intended for reporting the source or type of the MRL inserted in column E (e.g. Codex MRL, proposed MRL, existing EU MRL, import tolerance (IT), etc.). The information is not mandatory but will increase the transparency of the risk assessment scenario. | N | Free text | ||||||
| Column E | MRL/proposed MRL |
In this column, the values of the MRLs/proposed MRLs should be entered. The MRLs derived from the database of the European Commission can be copied manually in this column after they have been converted to numerical values. All additional text or footnote signs have to be removed (e.g. (ft) or *). Please make sure that the MRLs inserted are formatted as number.a NBA separate Excel‐based tool has been developed which should facilitate the conversion of MRLs retrieved from the database of the European Commissionb to the format compatible with the EFSA PRIMo rev. 3. The exposure calculation is performed with the MRL values entered in these cells, if no STMR or HR values are entered in column I and J, respectively.c Please note that in contrast to the previous version of the EFSA PRIMo, the MRLs entered for a food group (e.g. citrus fruit) are not taken over for the commodities belonging to the food group. Hence, in the new version of PRIMo, the MRLs have to be inserted for each individual commodity (green cells), e.g. for grapefruit, oranges, lemons, limes, mandarins and other citrus fruit. In cell D326, D333, D340, D347, D354, D361 and D368 (Swine Muscle/meat, Bovine Muscle/meat, etc.), the MRL established for muscle should be inserted. For the exposure calculation for fat soluble substances (see field L7), the MRL established for muscle is recalculated automatically in the model to ‘meat’ to match with the consumption data reported as ‘meat’, if the exposure calculation is based on the MRL. Meat is considered containing 80% muscle and 20% fat; for poultry meat, the assumption is that it contains 90% muscle and 10% fat. (See also comments on column I and J). |
Y | Numerical | ||||||
| Column F | LOQ |
These cells should be used to indicate if a MRL is set at the ‘LOQ’ (or limit of determination). Valid entries: blank cell or *. Please note that for the LOQ field, the hierarchy principle is not applicable (e.g. the LOQ entered in the line for fruit and nuts is not applied automatically for grapefruit). See also column G and H. |
N; if blank the MRL is considered to be a value >LOQ. | ‘*’ or blank cells are accepted | ||||||
| Column G | CFrisk for residue definition |
If the residue definition for enforcement and for risk assessment differs, usually conversion factors are established for individual commodities or commodity groups which account for the concentration of metabolites included only in the residue definition for risk assessment. The conversion factor is used to recalculate the HR‐RAC and STMR‐RAC (column I and J) derived for the residue definition for enforcement to the HR or STMR for the residue definition for risk assessment. If the residue definitions for enforcement and risk assessment are identical or if the conversion factor is equal to one, no entry is required. If the residue concentration entered in column I and J (STMR‐RAC and HR‐RAC) refer to the residue definition for risk assessment, no conversion factor should be entered. The conversion factor is also used for the exposure calculations based on the MRL values (in case no HR or STMR is available). However, under the following situation, the conversion factor is ignored: The MRL is set at the LOQ (labelled with * in column F) and column L (GAP under assessment) is blank or contains ‘N’ (see further explanations on column L); thus, under these circumstances, it is assumed that the LOQ reflects a no‐use‐situation, and therefore, the use of the CF is not appropriate. Please note that no extrapolation of conversion factors from a higher commodity hierarchy to a commodity in a lower hierarchy is implemented; this means that the relevant conversion factor has to be entered in each line separately. |
N, if the field is blank, a default value of 1 is used for the exposure calculation. | Numerical field | ||||||
| Column H | PeF (peeling factor) |
For crops consumed only after peeling (green cells), a peeling factor can be entered to refine the exposure assessments. For crops that can be consumed with or without peel (e.g. apples), the exposure calculation is performed under the assumption that the commodity is consumed without peeling (conservative approach). The peeling factors are derived from residue trials/processing studies, where the PeF for the individual trial is calculated according to the following equation:
Peeling factors are crop specific; thus, peeling factors have to be entered for each commodity individually. Peeling factors are also used for exposure calculations based on MRL values (in case no HR‐RAC or STMR‐RAC is available), except for MRLs which are labelled as a LOQ and for which column L is blank or contains ‘N’ (the crop/commodity is not under assessment) which is interpreted by the tool as a no‐use‐situation. |
N, if blank, a default value of one is used. | Numerical field | ||||||
| Column I | STMR‐RAC (median residue) |
In these cells, the median residue values derived from residue trials according to the enforcement residue definition have to be entered (STMR‐RAC). If the residue definition for risk assessment is different from the enforcement residue definition, a CF for residue definition needs to be entered in column G for the respective commodity. If relevant, a peeling factor should be inserted in column H. If an STMRrisk (median residue for the edible portion, reflecting the residue definition for risk assessment) is available, this STMR can be entered in this cell. In this case, no CF and peeling factor (PF) should be entered. It is recommended to make notes in the comment field to make clear which data were used for the exposure calculation. Please note that in the cells for muscle/meat of swine, bovine, sheep, goat, equine, poultry and other farmed animals (H326, H333; H340; H347, H354, H361, H368), the STMR‐RAC (or STMR) calculated for meat should be entered (meat is considered to be a mixture of muscle and fat 80/20 (w/w), except for poultry where the ratio of muscle and fat is 90/10 (w/w)). |
N, if blank, the chronic exposure calculation is performed with the MRL; if blank, the acute exposure calculation (IESTI case 3) is performed with the MRL. |
Numerical field | ||||||
| Column J | HR‐RAC (highest residue) |
In these cells, the highest residue values derived from residue trials according to the enforcement residue definition have to be entered (HR‐RAC). In case the residue definition for risk assessment is different from the enforcement residue definition, a CF for residue definition needs to be entered in column F for the respective commodity. If only a HRrisk (highest residue in edible portion, reflecting the residue definition for risk assessment) is available, this HR can be entered directly in this cell. However, in this case, no CF and peeling factor (PF) should be entered. It is recommended to make notes in the comment field to make clear which data were used for the exposure calculation. Please note that in the cells for muscle/meat of swine, bovine, sheep, goat, equine, poultry and other farmed animals (H326, H333; H340; H347, H354, H361, H368), the HR‐RAC (or HR) calculated for meat should be entered (meat is considered to be a mixture of muscle and fat 80/20 w/w), except for poultry where the ratio of muscle and fat is 90/10 (w/w)). |
N; if blank, depending on the context, the exposure assessment is based on the MRL (See also column G and H) | Numerical field | ||||||
| Column K | VF (alternative variability factor) |
For the acute exposure assessments, the default variability factors 7 or 5 are used in IESTI calculations, case 2a and 2b (see also sheet ‘acute_overview_children’ and ‘acute_overview_adutls’, column Y and AB), as agreed with risk managers.d If available, an empirical variability factor can be inserted in this column. The empirical variability factors will replace the default variability factor for the calculation of IESTI case 2a/2b. For IESTI new the empirical variability factor is used only, if it is lower than the default variability factor of 3. For specific cases, a higher VF of 10 may be appropriate (e.g. granular uses). It is recommended to justify the deviation from the default variability factor in the comment field (column T). |
N; if blank, the default variability factors derived on the basis of the unit weight RAC are used for acute exposure calculations | Numerical field | ||||||
| Column L | GAP under assessment |
This column is intended to label the crops that shall be included in the risk assessment. Choice of valid entries and impact on risk assessment:
Please note that for the acute risk assessment an additional qualifier is available in EFSA PRIMo which is intended to focus on the crops under assessment (see spreadsheet ‘Results’, cell B62), presented below as option a) and b).
|
N |
Valid entries: Y N blank |
||||||
| Valid entries in column L | Normal mode | Refined calculation mode | ||||||||
| Acute RA | Chronic RA | Acute RA | Chronic RA | |||||||
| Y | a)✓ | ✓ | a)✓ | ✓ | ||||||
| b)✓ | b)✓ | |||||||||
| N | a)✓ | ✓ | a)✗ | ✗ | ||||||
| b)✗ | b)✗ | |||||||||
| No entry | a)✓ | ✓ | a)✗ | ✗ | ||||||
| b)✗ | b)✗ | |||||||||
|
✓ crop included in risk assessment ✗ crop not included in risk assessment | ||||||||||
| Column M | Post‐harvest treatment | The information on post‐harvest treatment is relevant to identify the correct approach for the acute exposure assessment for pulses, cereals and oilseeds (IESTI calculations according to case 1 or 3). The acute exposure is calculated with the HR‐RAC instead of the STMR‐RAC, if the pesticide is applied on a crop as post‐harvest treatment. For other crops, the entry in this column is not used for further calculations and is therefore considered for information purpose only. | N; if blank the acute risk assessment for cereals, pulses and oilseeds will be based on the STMR. |
Valid entries: Y Blank |
||||||
| Section 3: Calculated input values (line 12–390) | ||||||||||
| Column N | Chronic RA label | This column contains the description of the input value derived for chronic risk assessment for the selected calculation mode. Depending on the input values inserted in column E–J, the input values may be derived as a combination of MRL, LOQ or STMR‐RAC and CFriks and/or peeling factor. The field is empty, if no MRL/STMR‐RAC is reported or if column L is blank or ‘N’ in the refined calculation mode. See also Table 7. | Cells locked (yellow cells, generated automatically from the information inserted in the green cells) | |||||||
| Column O | Chronic RA input value |
This column contains the automatically calculated input value for the selected calculation mode. The different options for derivation the input values for the different cases, depending on the settings of the programme, are presented in Table 7. |
||||||||
| Column P | Acute RA label |
This column contains the description of the input value derived for acute risk assessment for the selected calculation mode. Depending on the input values inserted in column E–J and M, the input values may be derived as a combination of MRL, LOQ, HR‐RAC or STMR‐RAC and CFriks and/or peeling factor. The field is empty,
|
||||||||
| Column Q | Acute RA input value |
This column contains the automatically calculated input value for the selected calculation mode. The different options for derivation the input values for the different cases, depending on the settings of the programme, are presented in Table 8. |
||||||||
| Column R | Acute RA IESTI new label | Label describing the input value for acute risk assessment for proposed new IESTI equation (see Section 2) | Cells locked | |||||||
| Column S | Acute RA IESTI new input value |
Input value for acute risk assessment according to the proposed new IESTI equation (see Section 2). The different options for derivation the input values for the different cases, depending on the settings of the programme, are presented in Table 8. |
||||||||
| Column T | Comment | Any additional information relevant for a commodity (justification for selection of input values, describe whether the STMR‐RAC or STMR edible portion was inserted, etc.) should be reported. | N | Free text | ||||||
| Columns U–BD | Fields used for calculation | Hidden columns used for calculations that should not be modified. | Cells locked | No modification allowed | ||||||
| Section 4: Entry section for processed commodities (line 409–540) | ||||||||||
| Column C | Processed food commodities | These cells contain the description of the food commodities, for which specific consumption data for the processed commodities are available | Cells locked (yellow cell, generated automatically from the information inserted in the green cells in Section 2) | |||||||
| Columns D, E, F, G, J, K, L, M and N | Source of MRL, MRL, LOQ, CFrisk for residue definition (unprocessed), STMR‐RAC, HR‐RAC, VF, GAP under assessment, post‐harvest treatment |
The information entered for the related unprocessed commodity is taken over for the processed commodity. This CFrisk is used for the calculations, unless a conversion factor is entered in column H ‘CFrisk for residue definition for processed products’ (see below). |
||||||||
| Column H | CFrisk for residue definition for processed products |
If the residue definitions for enforcement and for risk assessment applicable to processed products differ, usually a conversion factor is established which accounts for the concentration of metabolites/degradation products included only in the residue definition for risk assessment (processed products). This conversion factor is used to recalculate the HR‐RAC and STMR‐RAC for the unprocessed product (column J and K) derived for the residue definition for enforcement to the HR or STMR for the residue risk assessment (for processed commodities). If the residue definitions for enforcement and risk assessment for processed products are identical or if the conversion factor is equal to one, and no entry is required. If the residue concentration in column J and K refers to the residue definition for risk assessment, no conversion factor should be entered. In case a conversion factor has been derived for unprocessed products CFrisk for residue definition (unprocessed) (column G), but no conversion factor was inserted for processed products; the calculations will be performed with the conversion factor for unprocessed products. The conversion factor is also used for the exposure calculations based on the MRL values (in case no HR or STMR is available). However, under the following situation, the conversion factor is ignored: The MRL is set at the LOQ (labelled with * in column F) and column M (GAP under assessment) contains ‘N’; thus, these input values are considered to reflect a no‐use‐situation. Please note that no extrapolation of conversion factors from a higher commodity hierarchy to a commodity in a lower hierarchy is implemented; this means that the relevant conversion factor has to be entered in each line separately. |
N | Numerical field | ||||||
| Column I | PF (processing factors RD enforcement) |
If available, processing factors for the corresponding processed food commodities should be entered. The processing factors are derived from residue trials/processing studies, where the PF for the individual trial is calculated according to the following equation:
Processing factors less than one indicate that the processed commodity contains lower residues compared to the residues in the unprocessed product, while a processing factor is greater than one for processed commodities where residues accumulate in the processed product. Please note that for some commodities (dark green cells), default processing factors are used, if no information is inserted in column I. Table grapes/raisins: 4.7 (OECD, 2008) Potatoes/dried (flakes): 4.6 (OECD, 2008) Peas/canned: 0.4 (Dutch NESTI Model) Sunflower seeds/oil: 2 (OECD, 2008) Rapeseeds/processed (not specified): 2 (OECD, 2008) Soybeans/boiled: 0.4 (Dutch NESTI Model) Olives for oil production/oil: 2 (OECD, 2008) Barley/beer: 0.2 (Personal communicatione) Maize/oil: 25 (Dutch NESTI Model) Millet/boiled: 0.4 (Dutch NESTI Model) Tea (dried leaves of Camellia sinensis)/infusion: 0.01 (Dilution factor calculated by EFSA)Hibiscus flowers/infusion: 0.01 (Dilution factor calculated by EFSA) Rooibos leaves/infusion: 0.01 (Dilution factor calculated by EFSA) Valerian root/infusion: 0.01 (Dilution factor calculated by EFSA) Cocoa/fermented: 0.03 (Dutch NESTI Model) Hops/beer: 0.004 (Personal communication(e)) Sugar beets (root)/sugar: 12 (OECD, 2008) The value and the source of the default processing factor become visible when you click in the cells that are highlighted in dark green. |
N; if no entry, the default processing factor (see commodities described) or no processing factor is used for exposure calculations. |
Numerical field | ||||||
| Column O | IESTI case |
This column contains the information which IESTI calculation case is used for the exposure calculation. Case 1 was assigned to processed products derived from crops with unit weight (URAC) < 25 g and where the processing at household level may be expected. Also for wine, it is suggested to calculate the exposure according to case 1, since wine is frequently produced without mixing of lots from different producers/treatment regimes. Case 2a/2b: applicable for processed products derived from crops with a unit weight between 25 and 250 g produced at household level. This case was also assigned to processed products produced at industrial scale if the final product is not homogeneous (e.g. canned pineapples). Case 3 is applied to products that are derived by industrial processing with bulking and blending (e.g. juices produced at industrial scale). |
Y (Cells locked) | Default entry | ||||||
| Column P | Acute RA label |
This column contains the description of the input value derived for acute risk assessment for the selected calculation mode. Depending on the input values inserted in the input fields, the calculations are performed with the MRL, LOQ, HR or STMR‐RAC and CFrisk and/or PF (processing factor). The field is empty, if no MRL/HR‐RAC/STMR‐RAC is reported or, if column L is blank or ‘N’ in the refined calculation mode. (See also Table 8). |
Cells locked | Derived automatically | ||||||
| Column Q | Acute RA input value |
This column contains the automatically calculated input value for the respective commodity, depending on the selected calculation mode. The different options for derivation the input values for the different cases, depending on the settings of the programme, are presented in Table 8. |
Cells locked | Derived automatically | ||||||
| Column R | Acute RA IESTI new label | Label describing the input value for acute risk assessment for proposed new IESTI equation(see Table 8) | Cells locked | Derived automatically | ||||||
| Column S | Acute RA IESTI new input value | Input value for acute risk assessment according to the proposed new IESTI equation (see Table 8). | ||||||||
| Column T | Comment | Any additional information relevant for a commodity (justification for selection of input values, etc.) should be reported. | N | Free text | ||||||
If a number is formatted as text, click on the exclamation mark that appears next to the green triangle on the left corner when you enter the cell of the cell, and select the option ‘Convert to Number’.
EU Pesticide database, current MRLs: available under: http://ec.europa.eu/food/plant/pesticides/eu-pesticides-database/public/?event=pesticide.residue.selection&language=EN
Thus, in this case, the results of the chronic risk assessment would reflect the TMDI calculation.
For the calculation ‘IESTI new’ (Columns F–I and N–Q on the ‘Report’ spreadsheet, the default variability factor of 3 is used.
Personal communication of the contractor responsible for preparing the Compendium of representative processing techniques (EFSA‐Q‐2017‐00658).
All cells that are not intended for data entry are blocked to avoid that formulas or other information used in the calculations are modified by mistake, leading to errors or results that are not reflecting the standard model setting. However, since the model should provide sufficient flexibility to the risk assessor, allowing calculations for non‐standard settings, the protected cells can be unprotected and modified (to unprotect the sheet, select the respective option under the ‘Review’ tab in Excel). However, it is essential that in all cases where the risk assessments are performed with data not complying with the standard setting in the EFSA PRIMo, the modifications have to be clearly reported in the comment field and risk managers need to be informed on the assumptions used for the risk assessment.
The ‘input_values’ spreadsheet is considered to be used as a repository for all residue‐related information of an active substance needed to perform dietary exposure assessments. Thus, a dietary risk assessment calculated with revision 3 of PRIMo can be reused in the framework of new MRL applications. The ‘input values’ spreadsheet should be updated with information on new uses whenever a new assessment is performed for the pertinent pesticide. Information from previous assessments should not be deleted as long as the information is still valid.
In PRIMo revision 3, exposure calculations can be performed according to two different calculation modes, i.e. ‘Normal mode’ and ‘Refined mode’; the calculation mode has to be selected from the drop‐down list in cell AB10 of the spreadsheet input values.
The general concept of these two calculation modes is outlined in Table 5.
Table 5.
Calculation modes of EFSA PRIMo revision 3
| Normal mode | Refined calculation mode | |
|---|---|---|
| Chronic risk assessment |
All commodities are included in the TMDI/IEDI/NEDI calculations. If available, the long‐term exposure is calculated with the STMR values; however, if no STMR values are available, the calculations are performed with the MRL or the LOQ. A mix of STMR values for some crops and MRLs/LOQs for other crops is possible. A commodity is not included in the overall exposure assessment, if neither a MRL/LOQ nor a STMR value is inserted in the spreadsheet ‘input values’. If available, the STMR/MRL/LOQ values are combined with conversion factors, peeling factors (see below Table 6). |
Only those commodities are included in the TMDI/IEDI/NEDI which are labelled with ‘Y’ in column L (‘GAP under assessment’) of the spreadsheet ‘input_values’. The calculations are performed either with the STMR values, if available, or the MRL/LOQ value, in combination with a conversion factor or peeling factor, if appropriate (see below Table 6). All other crops/commodities, for which column L is blank or contains the entry ‘N’ are not taken into account, even if an MRL or STMR has been inserted in the respective column of the input values spreadsheet. |
| Acute risk assessment |
The acute exposure is calculated for all commodities according to the IESTI case 1, 2a/2b or 3, as appropriate. The calculations are performed with the HR (case 1 or 2a/2b) or STMR (case 3) in combination with a conversion factor, peeling factor and variability factor if available. If no HR value (case 1 or 2a/2b) or STMR (case 3) is inserted in the input values spreadsheet, the calculation is performed with the MRL/LOQ inserted. If neither an HR (for case 1 and 2a/2b) nor an STMR nor an MRL/LOQ is inserted, no acute exposure calculation is performed for the respective food commodity. The risk assessor can decide to present results of the IESTI calculations only for certain crops that are under assessment (see below description of column L, GAP under assessment). |
The acute exposure is calculated only for those commodities labelled with ‘Y’ in column L, ‘GAP under assessment’. The calculations are performed with the HR (case 1 or 2a/2b) or STMR (case 3) in combination with a conversion factor, peeling factor and variability factor, if available. If no HR value (case 1 or 2a/2b) or STMR (case 3) is inserted in the input values spreadsheet, the calculation is performed with the MRL/LOQ inserted. If neither an HR (for case 1 and 2a/2b) nor an STMR nor an MRL/LOQ is inserted, no acute exposure calculation is performed for the respective food commodity. |
The individual data elements of the input spreadsheet are described in Table 6.
Figure 1.
Acute risk assessment schema
Table 7.
Derivation of input values for chronic risk assessment
| Calculation case | Value entered in input field ✗ no entry, field is blank ✓ any valid entry ‘Y’, ‘N’, ‘*’: specific valid entry allowed for the cell | Input value for exposure calculation | Explanation | |||||
|---|---|---|---|---|---|---|---|---|
| MRL/proposed MRL/CXL | LOQ | CFrisk for / residue definition | Peeling factor | Median residue (STMR‐RAC) | GAP under assessment (Column L) | |||
| Normal mode | ||||||||
| 1 | ✗ | ✓ or ✗ | ✓ or ✗ | ✓ or ✗ | ✗ | ✓ or ✗ | – | If no MRL and STMR value is inserted for a commodity, this commodity is not considered for the exposure assessment. |
| 2 | ✓ | ✗ | ✗ | ✗ | ✗ | ✓ or ✗ | MRL |
If no other input values are inserted, the exposure calculation is performed with the MRL. This general rule applies to all commodities, except for muscle/meat for residue definitions that are fat soluble (cell L7). In this case, the input values are calculated as a mixture of muscle and meat MRLs: Poultry meat: MRLmuscle × 0.9 + MRLfat × 0.1 Meat of other animal species: MRLmuscle × 0.8 + MRLfat × 0.2 |
| 3 | ✓ | ✗ | ✓ | ✗ | ✗ | ✓ or ✗ | MRL×CF | Calculations are performed with the MRL in combination with the CF and/or PF. |
| 4 | ✓ | ✗ | ✗ | ✓ | ✗ | ✓ or ✗ | MRL×PF | |
| 5 | ✓ | ✗ | ✓ | ✓ | ✗ | ✓ or ✗ | MRL×CF×PF | |
| 6 | ✓ | ‘*’ | ✓ or ✗ | ✓ or ✗ | ✗ | ‘N’ or ✗ | LOQ |
If an MRL is labelled as LOQ and no STMR is inserted, the exposure calculation is performed with the LOQ value. Peeling factors and conversion factors in combination with LOQ values are only taken into account if the crop is labelled as being a ‘GAP under assessment’. Special case for meat (line 326, 333, 340, 347, 354, 361 and 368): If the residue definition is fat soluble (cell L7), the input values for meat are calculated as a mixture of muscle and fat. Poultry meat: LOQmuscle × 0.9 + LOQfat × 0.1 Meat of other animal species: LOQmuscle × 0.8 + LOQfat × 0.2 |
| 7 | ✓ | ‘*’ | ✓ | ✗ | ✗ | ‘Y’ | LOQ×CF | |
| 8 | ✓ | ‘*’ | ✗ | ✓ | ✗ | ‘Y’ | LOQ×PF | |
| 9 | ✓ | ‘*’ | ✓ | ✓ | ✗ | ‘Y’ | LOQ×CF×PF | |
| 10 | ✓ or ✗ | ✓ or ✗ | ✗ | ✗ | ✓ | ✓ or ✗ | STMR |
Calculations are performed with the STMR in combination with CF and/or PF. If the residue definition is fat soluble, the STMR entered in the line for muscle/meat has to refer to the meat (mixture of muscle and fat). |
| 11 | ✓ or ✗ | ✓ or ✗ | ✓ | ✗ | ✓ | ✓ or ✗ | STMR×CF | |
| 12 | ✓ or ✗ | ✓ or ✗ | ✗ | ✓ | ✓ | ✓ or ✗ | STMR×PF | |
| 13 | ✓ or ✗ | ✓ or ✗ | ✓ | ✓ | ✓ | ✓ or ✗ | STMR×CF×PF | |
| Refined calculation mode | ||||||||
| 14 | ✗ | ✓ or ✗ | ✓ or ✗ | ✓ or ✗ | ✗ | ✓ or ✗ | – | If no MRL or STMR value is inserted for a commodity, this commodity is not considered for the exposure assessment. |
| 15 | ✓ | ✓ or ✗ | ✓ or ✗ | ✓ or ✗ | ✓ or ✗ | ‘N’ or ✗ | – | If the commodity is not specifically labelled in the column L as a GAP under assessment with ‘Y’, the commodity is not considered in the chronic risk assessment. |
| 16 | ✓ | ✗ | ✗ | ✗ | ✗ | ‘Y’ | MRL | The same rules as for the ‘Normal mode’ calculations apply. |
| 17 | ✓ | ✗ | ✓ | ✗ | ✗ | ‘Y’ | MRL×CF | |
| 18 | ✓ | ✗ | ✗ | ✓ | ✗ | ‘Y’ | MRL×PF | |
| 19 | ✓ | ✗ | ✓ | ✓ | ✗ | ‘Y’ | MRL×CF×PF | |
| 20 | ✓ | ‘*’ | ✓ or ✗ | ✓ or ✗ | ✗ | ‘Y’ | LOQ | |
| 21 | ✓ | ‘*’ | ✓ | ✗ | ✗ | ‘Y’ | LOQ×CF | |
| 22 | ✓ | ‘*’ | ✗ | ✓ | ✗ | ‘Y’ | LOQ×PF | |
| 23 | ✓ | ‘*’ | ✓ | ✓ | ✗ | ‘Y’ | LOQ×CF×PF | |
| 24 | ✓ or ✗ | ✓ or ✗ | ✗ | ✗ | ✓ | ‘Y’ | STMR | |
| 25 | ✓ or ✗ | ✓ or ✗ | ✓ | ✗ | ✓ | ‘Y’ | STMR×CF | |
| 26 | ✓ or ✗ | ✓ or ✗ | ✗ | ✓ | ✓ | ‘Y’ | STMR×PF | |
| 27 | ✓ or ✗ | ✓ or ✗ | ✓ | ✓ | ✓ | ‘Y’ | STMR×CF×PF | |
Table 8.
Derivation of input values for acute risk assessment (IESTI and IESTI new)
| Calculation case | Value entered in input field ✗ no entry, field is blank ✓ any valid entry ‘Y’, ‘N’, ‘*’: specific valid entry allowed for the cell | Explanation | ||||||||||
|---|---|---|---|---|---|---|---|---|---|---|---|---|
| MRL/proposed MRL/CXL | LOQ | CFrisk for residue definition | Peeling factor | IESTI case | Median residue (STMR‐RAC) | Highest residue (HR‐RAC) | Post‐harvest treatment}(b) | GAP under assessment | Input value for exposure calculation (IESTI) | Input value for exposure calculation (IESTI new) | ||
| Normal mode/Show results for all crops | ||||||||||||
| 1 | ✗ | ✓ or ✗ | ✓ or ✗ | ✓ or ✗ | 1,2a/2b | ✓ or ✗ | ✗ | ✓ or ✗ | ✓ or ✗ | – | – | If no MRL and HR (case 1 and 2a/2b) or MRL and STMR (for case 3) are inserted for a commodity, this commodity is not considered for the exposure assessment. |
| 2 | 3 | ✗ | ✓ or ✗ | |||||||||
| 3 | ✓ | ✗ | ✗ | ✗ | 1a,2a/2b | ✓ or ✗ | ✗ | ✓ or ✗ | ✓ or ✗ | MRL | MRL |
The calculations are performed with the MRL, if no HR (case 1 and 2a/2b) is inserted. For IESTI case 3, the calculation is performed with the MRL, if no STMR is entered (no post‐harvest use). a) Special case for IESTI case 1 for muscle/meat: the input values are calculated as a mixture of muscle and fat for fat soluble residue definitions. See calculation case 2 and 6–9 for chronic risk assessment b) Table 7. |
| 4 | 3 | ✗ | ✓ or ✗ | ✓ or ✗ | ||||||||
| 5 | ✓ | ✗ | ✓ | ✗ | 1,2a/2b | ✓ or ✗ | ✗ | ✓ or ✗ | ✓ or ✗ | MRL×CF | MRL×CF | Calculations are performed with the MRL in combination with the CF and/or PF. |
| 6 | 3 | ✗ | ✓ or ✗ | ✓ or ✗ | ||||||||
| 7 | ✓ | ✗ | ✗ | ✓ | 1a,2a/2b | ✓ or✗ | ✗ | ✓ or ✗ | ✓ or ✗ | MRL×PF | MRL×PF | |
| 8 | 3 | ✗ | ✓ or ✗ | ✓ or ✗ | ||||||||
| 9 | ✓ | ✗ | ✓ | ✓ | 1a,2a/2b | ✓ or ✗ | ✗ | ✓ or ✗ | ✓ or ✗ | MRL×CF×PF | MRL×CF×PF | |
| 10 | 3 | ✗ | ✓ or ✗ | ✓ or ✗ | ||||||||
| 11 | ✓ | ‘*’ | ✗ | ✗ | 1a,2a/2b | ✓ or ✗ | ✗ | ✓ or ✗ | ✓ or ✗ | LOQ | LOQ |
The calculations are performed with the LOQ, if no HR (case 1 and 2a/2b) was inserted. For case 3, the calculation is performed with the LOQ, if no STMR is entered. |
| 12 | 3 | ✗ | ✓ or ✗ | ✓ or ✗ | ||||||||
| 13 | ✓ | ‘*’ | ✓ | ✗ | 1a,2a/2b | ✓ or ✗ | ✗ | ✓ or✗ | ‘N’ or ✗ | LOQ | LOQ | For commodities with MRLs at the LOQ, the calculations are performed with the LOQ without considering the CF and/or PF, if the cell ‘GAP under assessment is labelled with ‘N’ or is blank. |
| 14 | 3 | ✗ | ✓ or ✗ | ✓ or ✗ | ||||||||
| 15 | ✓ | ‘*’ | ✓ | ✗ | 1a,2a/2b | ✓ or ✗ | ✓ or ✗ | ✓ or ✗ | ‘Y’ | LOQ×CF | LOQ×CF | Calculations are performed with the LOQ in combination with the CF and/or PF, if the cell ‘GAP under assessment’ is labelled with ‘Y’. |
| 16 | 3 | ✗ | ✓ or ✗ | ✓ or ✗ | ||||||||
| 17 | ✓ | ‘*’ | ✗ | ✓ | 1,2a/2b | ✓ or ✗ | ✓ or ✗ | ✓ or ✗ | LOQ×PF | LOQ×PF | ||
| 18 | 3 | ✗ | ✓ or ✗ | ✓ or ✗ | ||||||||
| 19 | ✓ | ‘*’ | ✓ | ✓ | 1a,2a/2b | ✓ or ✗ | ✓ or ✗ | ✓ or ✗ | LOQ×CF×PF | LOQ×CF×PF | ||
| 20 | 3 | ✗ | ✓ or ✗ | ✓ or ✗ | ||||||||
| 21 | ✓ or ✗ | ✓ or ✗ | ✗ | ✗ | 1a,2a/2b | ✓ or ✗ | ✓ | ✓ or ✗ | ✓ or ✗ | HR | MRL/LOQ |
Calculations for IESTI case 1, 2a and 2b are performed with the HR in combination with the CF and/or PF, if available. The IESTI new calculations are performed with the MRL in combination with the CF and/or PF, if available or LOQ in combination with CF and/or PF (if MRL is labelled as LOQ). |
| 22 | ✓ | ✗ | 1a,2a/2b | ✓ or ✗ | ✓ | ✓ or ✗ | HR×CF | MRL×CF/LOQ×CF | ||||
| 23 | ✗ | ✓ | 1a,2a/2b | ✓ or ✗ | ✓ | ✓ or ✗ | HR×PF | MRL×PF/LOQ×PF | ||||
| 24 | ✓ | ✓ | 1a,2a/2b | ✓ or ✗ | ✓ | ✓ or ✗ | HR×CF×PF | MRL×CF×PF/LOQ×CF×PF | ||||
| 25 | ✓ or ✗ | ✓ or ✗ | ✗ | ✗ | 3 | ✓ | ✓ or ✗ | ✓ or ✗ | ✓ or ✗ | STMR | MRL/LOQ | Calculations for IESTI case 3 are performed with the HR in combination with the CF and/or PF if available. |
| 26 | ✓ | 3 | ✓ | ✓ or ✗ | STMR×CF |
MRL×CF/ LOQ×CF |
||||||
| 27 | ✓ | 3 | ✓ | ✓ or ✗ | STMR×PF |
MRL×PF/ LOQ×PF |
||||||
| 28 | ✓ | ✓ | 3 | ✓ | ✓ or ✗ | STMR×CF×PF |
MRL×CF×PF/ LOQ×CF×PF |
|||||
| Refined calculation mode or Show results of acute risk assessment only for crops with GAPs under assessment | ||||||||||||
| 29 | ✓ or ✗ | ✓ or ✗ | ✓ or ✗ | ✓ or ✗ | 1,2a/2b, 3 | ✓ or ✗ | ✓ or ✗ | ✓ or ✗ | ‘N’ or ✗ | – | – | If a commodity is not labelled with ‘Y’ in the field ‘GAP under assessment’, it is not considered for the risk assessment calculation. |
| 30 | ✓ or ✗ | ✓ or ✗ | ✓ or ✗ | ✓ or ✗ | 1,2a/2b, 3 | ✓ or ✗ | ✓ or ✗ | ✓ or ✗ | ‘Y’ | See cases 1–28 | For all combinations of input values that are explicitly labelled with ‘Y’ in the field ‘GAP under assessment’, the calculations are performed with the input values described in the section ‘Normal mode/Show results for all crops’. | |
Special case for muscle/meat, similar provision are applied as described for case 3–5.
If a commodity belonging to the group of pulses, oilseeds, cereals is labelled in column post‐harvest treatment with ‘Y’, the IESTI case switches from case 3 to case 1.
5.3. Calculation spreadsheets
5.3.1. Acute exposure calculation for children and adults
The detailed short‐term exposure calculations and the result of the risk assessment can be found in the two spreadsheets ‘acute_overview_children’ and ‘acute_overview_adults’. The calculations are performed in accordance with the algorithm described in Table 1.
In Table 9 below, the information presented in the spreadsheet ‘acute_overview_children’ and ‘acute_overview_adults’ are explained in detail.
Table 9.
Description of the fields in the spreadsheet ‘acute_overview_children’ and ‘acute_overview_adults’
| Field reference | Name of the field | Field content | |
|---|---|---|---|
| Section 1: General information (lines 1–6) | |||
|
In this part of the table, the general information on the active substance name, the ARfD and the calculation mode are displayed.Please note that no acute risk assessment is performed, if the user inserts ‘not necessary’ or if no valid entry is inserted for the ARfD in cell D5 of the input_values spreadsheet (see also Figure 1). Cells C6 and C7 contain hyperlinks to the drop‐down elements where the calculation setting can be changed. | |||
| Section 2: Unprocessed commodities (line 12–390) | |||
| Column E, F,G |
MRL, Input value for IESTI, IESTI is calculated with |
The MRL is taken over from the sheet ‘input_values’. Depending on the available data inserted in the ‘input_values’, the appropriate input values for the acute exposure calculation are derived (e.g. LOQ, MRL, HR‐RAC, STMR‐RAC combined with CF and/or PF, see Table 8). In column G, the label explaining the input value is reported (see Table 8). |
|
| Column H and I |
Input value for IESTI new, IESTI new is calculated with |
The input value is taken over from the spreadsheet ‘input_values’. It is noted that the approach for IESTI new is not reflecting an internationally agreed methodology for calculating the acute exposure. The results are therefore purely indicative; it is intended to provide risk managers with additional information on the safety of MRL levels. In column I, the label for the IESTI new calculation is reported (LOQ, MRL, combined with the CF and/or PF, if relevant). |
|
| Column J | Comment | Any additional information can be reported in this field. | |
| Column K, L, M and N | GAPs under assessment, Post‐harvest treatment, Peeling/processing factor, Alternative variability factor | Information is taken over from the spreadsheet ‘input_values’. No modifications are foreseen in these columns. | |
| Column O | Large portion (expressed as g/kg bw) |
This column contains the large portion (LP), normalised by the mean body weight. ‘ND’ indicates commodities for which no consumption data were available in any of the diets. |
|
| Column P, Q, R and S |
Percentile, MS critical diet, Body weight, Large portion (edible portion) |
Column P and Q specify the percentile (‘eaters only’) and the diet with the critical food intake reported in column O. In column R, the mean body weight for the respective subgroup of the population is reported. Column S contains the large portion for the edible portion, expressed as g/person. |
|
| Column T, U, V and W |
Unit weight edible portion, Source unit weight edible portion, unit weight RAC, Source unit weight RAC |
These columns contain the unit weights used in the IESTI equations (see Table 1). Where available, the unit weight reported by the country matching the LP was identified (column O). If no unit weight was available from the country with the critical food intake, the mean value of all available unit weights was calculated (EU mean). In cases where no unit weight data were available, EFSA used estimates for the calculation (labelled as ‘EFSA estimate’ in column U and W). | |
| Column X | Case | In this column, the appropriate IESTI case was determined according to the principle established by JMPR (FAO, 2016). For oilseeds, cereals and pulses, the calculations are performed according to case 3 unless a post‐harvest use has to be assessed (see input_values, column M); in this case the exposure is calculated according to case 1). | |
| Column Y | Variability factor for IESTI | Depending on the unit weight RAC, the variability factor is derived according to the rule defined below: | |
| Unit weight RAC (in g) | VF (IESTI) | ||
| < 25 | 1 (=IESTI case 1) | ||
| ≥ 25 and ≤ 250 | 7 or VF entered in column K, input_values) | ||
| > 250 | 5 or alternative VF entered in column K, input_values | ||
| If an alternative VF was used for the calculation, the cell is highlighted in blue. | |||
| Column Z, AA | IESTIIESTI in % of the ARfD (alternatively %ADI) |
In column Z, the calculated short‐term exposure, expressed as mg/kg bw per day, is reported. In column AA, the exposure is expressed in % of the ARfD. If no ARfD is available (not assessed or field for ARfD is empty), the ADI is used as surrogate. If the result exceeds 100%, the cell is shaded in pink. If no ARfD was found necessary, ‘no acute risk assessment’ is displayed in this field. |
|
| Column AG | Variability factor for IESTI new | For the indicative calculation, ‘IESTI new’ a variability factor of 3 is used as default value for case 2a and 2b unless a lower alternative variability factor was entered in the respective cell of the sheet ‘input_values’ (column K). | |
| Unit weight RAC (in g) | VF (IESTI new) | ||
| < 25 | 1 | ||
| ≥ 25 and ≤ 250 | 3 or VF entered in column K input_values if this value is < 3 | ||
| > 250 | 3 or VF entered in column K input_values if this value is < 3 | ||
| If an alternative VF was used for the calculation, the cell is highlighted in blue. | |||
| Column AC and AD |
IESTI new, IESTI new in % of the ARfD (alternatively % ADI) |
The calculated short‐term exposure based on the MRL (in combination with CFrisk and/or peeling factor, where appropriate) is reported. If the result exceeds 100%, the cell is shaded in pink. It is stressed again, that these calculations do not reflect the internationally agreed methodology. |
|
| Column AE, AF | Threshold residue IESTI; Threshold residue IESTI new | In cases, where the acute exposure exceeds 100% of the ARfD, a threshold residue is calculated. This value is a residue concentration that would result in 100% of the toxicological reference dose. | |
| Column AG, AH | Threshold residue IESTI; Threshold residue IESTI new | These cells are normally not displayed, but can be made visible, if the expand sign is pressed (column AF). | |
| Section 3: Processed commodities (line 412–390) | |||
| Column E to AH | The structure of the input values for processed commodities is comparable with the structure for unprocessed commodities, described above. Some minor differences are self‐explanatory and do not require specific considerations. | ||
Please note that the calculations are performed automatically, based on the input data inserted in the spreadsheet ‘input_values’. If input values have to be changed, the revised values have to be inserted in the spreadsheet ‘input_values’.
The only cells that are not locked are the comment fields (column J). For navigation between the spreadsheets, the buttons ‘Results ‐ Overview’ and ‘Input values’ can be used.
5.3.2. Chronic exposure calculation for children and adults
In the spreadsheet ‘chronic_intake_assessment’, the chronic risk assessment calculations are performed. The calculations combine the mean consumption data reported in spreadsheet ‘chronic_consumption’ with the residue data entered in the spreadsheet ‘input_values’. The calculations are performed for in total 37 diets in parallel using the algorithm described in Table 1.
Table 10 describes in detail the information reported in this spreadsheet.
Table 10.
Description of the fields in the spreadsheet chronic_intake_assessment’
| Field reference | Name of the field | Field content |
|---|---|---|
| Section 1: General information (lines 1–6) | ||
| In this part of the table, the general information on the active substance name, the ADI and the calculation mode are displayed.Cell C4 contains a hyperlink to the drop‐down elements where the calculation mode can be changed. | ||
| Section 2: Chronic risk assessment (JMPR methodology) (line 11–390) | ||
| Column D,E, F,G | MRL, LOQ, Input value for exposure calculation, exposure is calculated with |
The MRL and the information on the LOQ are taken over from the sheet ‘input_values’. Depending on the available data inserted in the ‘input_values’, the appropriate input values for the chronic exposure calculation are derived (e.g. LOQ, MRL, STMR‐RAC combined with CF or PF if data were entered in the input_values sheet) for the calculation of the acute exposure. In column G, the label explaining the input value is reported (see Table 7). |
| Column H | GAP under assessment |
The information is taken over from the sheet ‘input_values’. In the calculation mode, ‘Refined calculation’ only those commodities are included which contain the entry ‘Y’ in this column. |
| Column I | Comment | Any additional information can be reported in this field. |
| Column J to AT | Results of the chronic risk assessment for each diet |
In these columns, the results of the chronic risk assessment (expressed in % of the ADI) are reported individually for each commodity/diet combination. The calculations of the chronic exposure is based on the consumption data reported for the individual commodities (lowest hierarchy level) (e.g. oranges, grapefruit etc.) and not for commodity groups (e.g. ‘citrus fruit’ or ‘fruit and nuts’) except for herbal infusions and spices (see below). These rows not considered for the exposure calculation are shaded in grey. The consumption data in row 326, 333, 340, 347, 354; 367 and 368 refer to meat (consisting of a mixture of muscle and meat). See also comment on column D, H and I in ‘input_values’. In the ‘refined calculation mode’, the rows which are not under assessment (‘N’ or blank cell in column L of the sheet ‘input_values’ are empty. |
| Column BA | Min | The lowest exposure among all diets is reported (in most cases, this cell will be blank). |
| Column BB and BV | Max | The highest exposure (expressed as % of the ADI) among all diets is identified. The diet in which the respective commodity was leading to the highest ADI exhaustion is labelled in column BC. |
| Sections 3 and 4: Chronic risk assessment (Rees–Day methodology) (line 411–790 and line 811–1190) | ||
| This section of the spreadsheet is used to perform the calculations according to the Rees–Day methodology (see Table 1). It contains only data for the Finish and the UK diets. Further explanations see ‘Supplementing_results_chronic’. | ||
| Section 5: TMDI calculation (line 1211–1590) | ||
| This section of the spreadsheet is used to perform the calculations according to the TMDI methodology (see Table 1). Further explanations see ‘Supplementing_results_chronic’. | ||
The only cells that are not locked are the comment field (column I). For navigation between the spreadsheets, the buttons ‘Results‐Overview’ and ‘Input values’ can be used.
5.4. Presentation of the results
5.4.1. Results of chronic and acute risk assessment
A comprehensive overview of the overall results of the chronic and acute risk assessment is presented in the spreadsheet ‘Results’. No data entry is foreseen on this spreadsheet except in line 9 (Comments).
In line 11–53, the results of the chronic risk assessment (IEDI/TMDI calculations) are displayed (Figure 2). This part is formatted to be printed on one page (landscape format); it can be pasted into a Word document, using the function ‘Paste special’, selecting the option ‘Picture (Enhanced Metafile)’.
Figure 2.
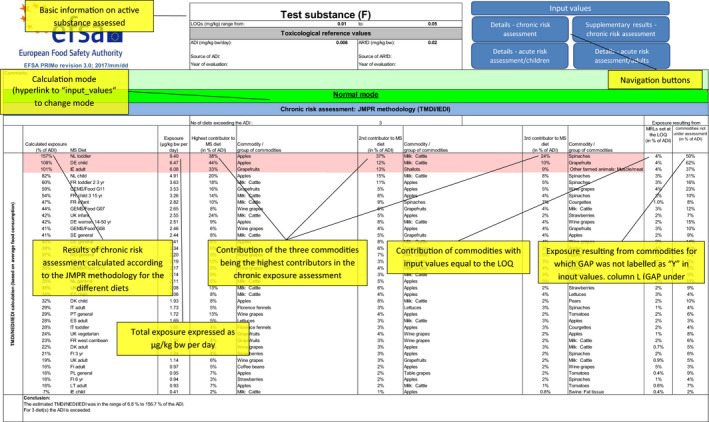
Presentation of results for chronic risk assessment
The results of the IESTI calculations for unprocessed food commodities are summarised in line 57–226; the results of the acute risk assessment are formatted to be printed on one page (portrait format).14 According to the default setting, the 15 commodities which result in the highest acute exposure are displayed. If results for all commodities should be displayed, the plus sign at the left side of row 225 should be pressed (expand button).
The user has also the possibility to display only results for commodities that are under assessment (labelled with ‘Y’ in column L of the input values spreadsheet). If this option is preferred, the option ‘Show results of IESTI calculation only for crops with GAPs under assessment’ from the drop down menu in cell B62 should be selected. (The default setting is ‘Show results of IESTI calculation for all crops’).
Below, a screen shot of an acute risk assessment result is presented (Figure 3).
Figure 3.
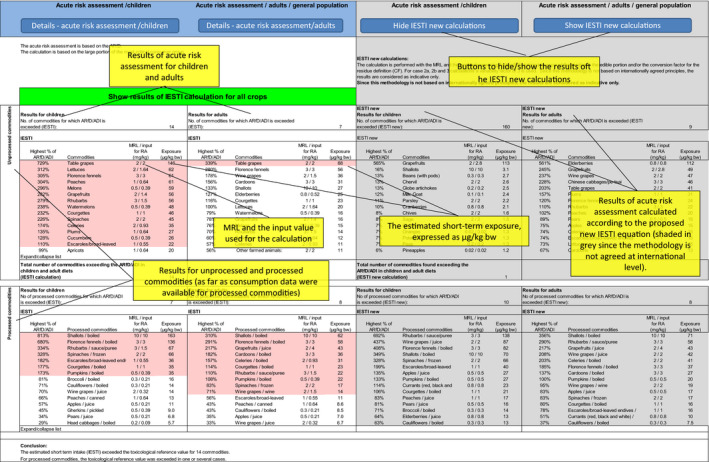
Presentation of results for acute risk assessment
In case, the calculated exposure exceeds the toxicological reference value, the results are automatically highlighted in pink.
5.4.2. Supplementary results of chronic risk assessment
In addition to the main results presented in the spreadsheet ‘Results’, the following information is presented in this spreadsheet:
Results of the NEDI calculations (Rees–Day model I or II), calculated according to equations shown in Table 1 (line 13–23);
Results of the TMDI calculation (line 28–71) and
TMDI calculation per crop/commodity (line 77–352).
No data entry is foreseen in this spreadsheet, except in line nine (comments).
The TMDI calculation per crop/commodity can be sorted or filtered according to the interest of the risk assessor.
5.5. Summary of input values
A summary table comprising the risk assessment values used for the calculations can be retrieved automatically in the spreadsheet ‘Summary_input_values’. To ensure that all modifications introduced in the spreadsheet ‘input_values’ are reflected correctly, the button ‘Update input table’ should be pressed.
The table is formatted in a way that it can be copied in an evaluation report or a reasoned opinion (Word documents). If considered necessary, further editorial changes should be made in the Word document only.
5.6. Consumption data used for chronic exposure assessment
In the spreadsheet ‘chronic consumption’, the consumption data used for calculating the chronic dietary exposure are summarised. The data for the individual products reported in line 11–390 are listed in column E–AO for the 37 diets; the mean consumption data are expressed as g/kg body weight per day. In line five, the mean body weight of the individual diets are displayed (expressed as kg).
In line 411–790, the 97.5th percentile consumption data are reported for the UK and the Finish diets. This information is used to calculate the exposure according to the Rees–Day model (see Table 1).
No data entry is foreseen in this spreadsheet.
6. Conclusions and recommendations
The new version of the PRIMo tool has been prepared to be used for dietary risk assessments in the framework of Regulation (EC) No 396/2005 and Regulation (EC) No 1107/2009 (premarketing/preauthorisation risk assessment). Similar to the previous version of the tool, the exposure calculations are performed on the basis of summary statistics of food consumption data provided by Member States, using the agreed risk assessment methodologies.
New features were introduced in the PRIMo tool that should facilitate the work of the risk assessors and increase the transparency of the risk assessment.
PRIMo revision 3 can be used not only for preauthorisation risk assessments but also to answer risk management questions in the context of MRL enforcement and for estimating the actual exposure of consumers using a simple deterministic methodology.
Risk managers in collaboration with risk assessors should decide on the implementation of the new version of the tool in regulatory processes and the applicability date to use PRIMo revision 3 in the different regulatory workflows, including MRL applications, MRL reviews, approval of active substances used in plant protection products and post‐marketing risk assessments such as RASFF.
It should be highlighted that revision 3 of the EFSA PRIMo is an intermediate version of the tool that should be further developed, integrating the food consumption data compiled in the EFSA comprehensive food consumption database (EFSA, 2011b), once the data have been processed for being used for pesticide risk assessments (i.e. disaggregation of composite food consumed into primary food ingredients (raw agricultural products), aggregation of primary raw agricultural products and derivation of summary statistics on food consumption for the different food products).
Thus, preparatory work for the development of PRIMo revision 4 should be initiated, taking into account the experience gained with the new version of PRIMo (revision 3). It is recommended that EFSA, in collaboration with risk assessors and risk managers of Member States and the European Commission, should develop a roadmap defining the technical specifications of revision 4 of the PRIMo tool.
A Member State consultation on the draft guidance document and the EFSA PRIMo revision 3 was organised and the comments submitted were taken into account in the final version.
Abbreviations
- ADI
Acceptable daily intake
- ARfD
Acute reference dose
- BW
Body weight
- CF
Conversion factor
- CFrisk
Conversion factor for risk assessment residue definition
- FAO/WHO
Food and Agriculture Organization of the United Nations/World Health Organization
- GAP
Good Agricultural Practice
- GEMS/Food
Global Environment Monitoring System – Food Contamination Monitoring and Assessment Programme
- HR
Highest residue
- IEDI
International estimated daily intake
- IESTI
International estimated short term intake
- IT
Information technology
- JMPR
Joint Meeting on Pesticide Residues
- LOQ
Limit of quantification
- LP
Large portion
- MC
Mean consumption
- MRL
Maximum residue level
- NEDI
National estimated daily intake
- PeF
Peeling factor
- PF
Processing factor
- PRIMo
Pesticide Residue Intake Model
- RA
Risk assessment
- RAC
Raw agricultural commodity
- RASFF
Rapid Alert System for Food and Feed
- STMR
Supervised trials median residue
- TMDI
Theoretical Maximum Daily Intake
- Uep
Unit weight edible portion
- URAC
Unit weight of the raw agricultural product
- VF
Variability factor
Supporting information
EFSA PRIMo revision 3 calculator
Suggested citation: EFSA (European Food Safety Authority) , Brancato A, Brocca D, Ferreira L, Greco L, Jarrah S, Leuschner R, Medina P, Miron I, Nougadere A, Pedersen R, Reich H, Santos M, Stanek A, Tarazona J, Theobald A and Villamar‐Bouza L, 2018. Guidance on use of EFSA Pesticide Residue Intake Model (EFSA PRIMo revision 3). EFSA Journal 2018;16(1):5147, 43 pp. 10.2903/j.efsa.2018.5147
Requestor: EFSA
Question number: EFSA‐Q‐2011‐00266
Acknowledgements: EFSA wishes to acknowledge all European competent authorities that provided data and comments for this scientific output.
Adopted: 19 December 2017
This publication is linked to the following EFSA Supporting Publications article: http://onlinelibrary.wiley.com/doi/10.2903/sp.efsa.2019.EN-1605/full
Notes
As soon as the food consumption data of the EFSA comprehensive database are converted as required for pesticide risk assessment, the EFSA PRIMo will be updated again.
Regulation (EC) No 396/2005 of the Parliament and of the Council of 23 February 2005 on maximum residue levels of pesticides in or on food and feed of plant and animal origin and amending Council Directive 91/414/EEC. OJ L 70, 16.3.2005, p. 1–16.
As regards the acute risk assessment (IESTI methodology), the calculations were performed with different variability factor compared to the variability factor recommended by JMPR in 2002. For crops with a unit weight for the raw agricultural product between 25 g and 250 g, a variability factor of 7 was used; for crops with a unit weight greater than 250 g a variability factor of 5 was applied. The variability factor of 10, recommended to be used for leafy vegetables with unit weight between 25 g and 250 g and for residues derived from granular soil treatment in crops with unit weight between 25 g and 250 g was not included in the standard setting of PRIMo revision 2. The deviation reflected the EU practice and was agreed with risk managers in Member States and European Commission.
Available under: https://ec.europa.eu/food/sites/food/files/safety/docs/rasff_reg-guid_sops_wi-2-2.pdf
Available under: https://zenodo.org/record/56287#.WgGWv9VSyDI
Commission Regulation (EC) No 178/2006 of 1 February 2006 amending Regulation (EC) No 396/2005 of the European Parliament and of the council to establish Annex I listing the food and feed products to which maximum levels for pesticide residues apply.
See footnote 3.
Description of Rees–Day model: http://www.hse.gov.uk/pesticides/resources/N/NEDI_Chronic_intake_guidance.pdf
Commission Regulation (EU) No 752/2014 of 24 June 2014 replacing Annex I to Regulation (EC) No 396/2005 of the European Parliament and of the Council. OJ L 208, 15.7.2014, p. 1–71.
In revision 2 of EFSA PRIMo, a minor inconsistency in the food group 0610000 (Tea (Camellia sinensis) occurred which required specific attention when transferring the MRLs extracted from the MRL database managed by the European Commission. In the new revision of EFSA PRIMo, this inconsistency was corrected.
Available under: http://www.who.int/nutrition/landscape_analysis/nlis_gem_food/en/
For some of the diets, the LP was calculated on the basis of the individual body weight of the survey participants (e.g. German surveys), while in other surveys, the LP was derived from the distribution of the consumption expressed per person, divided by the mean body weight.
For commodities with less than 41 person‐days, Germany and Belgium reported that the following alternative percentiles were selected: 40 days to > 20 days: P95, 20 days to > 10 days: P90; 10 days or less: maximum value.
Only the results of the IESTI calculation (column A–I) should be presented a Word document. The columns J–Q reflect the calculations using IESTI new. These results are considered as supplementary only and can be hidden, using the respective button in row 57.
References
- EFSA (European Food Safety Authority), 2007. Reasoned opinion on the potential chronic and acute risk to consumers’ health arising from proposed temporary EU MRLs. EFSA Journal 2007;5(3):32r, 1141 pp. 10.2903/j.efsa.2007.32r [DOI] [Google Scholar]
- EFSA (European Food Safety Authority), 2009. 2007 Annual Report on Pesticide Residues according to Article 32 of Regulation (EC) No 396/2005. EFSA Scientific Report 2009;7(7):305r, 106 pp. 10.2903/j.efsa.2009.305r [DOI] [Google Scholar]
- EFSA (European Food Safety Authority), 2010. 2008 Annual Report on Pesticide Residues according to article 32 of Regulation (EC) No 396/2005. EFSA Journal 2010;8(7):1646, 442 pp. 10.2903/j.efsa.2010.1646 [DOI] [Google Scholar]
- EFSA (European Food Safety Authority), 2011a. Use of the EFSA Comprehensive European Food Consumption Database in Exposure Assessment. EFSA Journal 2011;9(3):2097, 134 pp. 10.2903/j.efsa.2011.2097 [DOI] [Google Scholar]
- EFSA (European Food Safety Authority), 2011b. The 2009 European Union report on pesticide residues in food. EFSA Journal 2011;9(11):2430, 225 pp. 10.2903/j.efsa.2011.2490 [DOI] [Google Scholar]
- EFSA (European Food Safety Authority), 2013. The 2010 European Union report on pesticide residues in food. EFSA Journal 2013;11(3):3130, 808 pp. 10.2903/j.efsa.2013.3130 [DOI] [PMC free article] [PubMed] [Google Scholar]
- EFSA (European Food Safety Authority), 2014. The 2011 European Union report on pesticide residues in food. EFSA Journal 2014;12(5):3694, 34 pp. 10.2903/j.efsa.2014.3694 [DOI] [Google Scholar]
- EFSA (European Food Safety Authority), 2016. The 2014 European Union report on pesticide residues in food. EFSA Journal 2017;14(10):4611, 139 pp. 10.2903/j.efsa.2017.4611 [DOI] [PMC free article] [PubMed] [Google Scholar]
- EFSA (European Food Safety Authority), 2017. The 2015 European Union report on pesticide residues in food. EFSA Journal 2017;15(4):4791, 134 pp. 10.2903/j.efsa.2017.4791 [DOI] [PMC free article] [PubMed] [Google Scholar]
- EFSA and RIVM (European Food Safety Authority and Dutch National Institute for Public Health and the Environment). 2015. EFSA Scientific Workshop, co‐sponsored by FAO and WHO: Revisiting the International Estimate of Short‐Term Intake (IESTI equations) used to estimate the acute exposure to pesticide residues via food. EFSA supporting publication 2015_EN‐907, 81 pp.
- FAO (Food Agriculture Organization) 2002. FAO manual: Submission and evaluation of pesticide residues data for the estimation of maximum residue levels in food and feed. FAO Plant Production and Protection Paper 170, Food Agricultural Organization, Rome, Italy.
- FAO (Food and Agriculture Organization of the United Nations), 2016. Submission and evaluation of pesticide residues data for the estimation of Maximum Residue Levels in food and feed. Pesticide Residues. 3rd Ed. FAO Plant Production and Protection Paper 225, 286 pp.
- OECD (Organisation for Economic Co‐operation and Development) 2008. Guidance document on the magnitude of pesticide residues in processed commodities. In: Series of Testing and Assessment No 6. ENV/JM/MONO(2008)23, 29 July 2008.
- WHO (World Health Organization), 2006. GEMS/Food Consumption Cluster Diets, Global Environmental Monitoring System – Food Contamination monitoring and Assessment Programme (GEMS/Food). WHO, Geneva, Switzerland. [Google Scholar]
Associated Data
This section collects any data citations, data availability statements, or supplementary materials included in this article.
Supplementary Materials
EFSA PRIMo revision 3 calculator