

Abstract
The European Commission asked EFSA for a scientific evaluation on the risks to human health related to the presence of perfluorooctane sulfonic acid (PFOS) and perfluorooctanoic acid (PFOA) in food. Regarding PFOS and PFOA occurrence, the final data set available for dietary exposure assessment contained a total of 20,019 analytical results (PFOS n = 10,191 and PFOA n = 9,828). There were large differences between upper and lower bound exposure due to analytical methods with insufficient sensitivity. The CONTAM Panel considered the lower bound estimates to be closer to true exposure levels. Important contributors to the lower bound mean chronic exposure were ‘Fish and other seafood’, ‘Meat and meat products’ and ‘Eggs and egg products’, for PFOS, and ‘Milk and dairy products’, ‘Drinking water’ and ‘Fish and other seafood’ for PFOA. PFOS and PFOA are readily absorbed in the gastrointestinal tract, excreted in urine and faeces, and do not undergo metabolism. Estimated human half‐lives for PFOS and PFOA are about 5 years and 2–4 years, respectively. The derivation of a health‐based guidance value was based on human epidemiological studies. For PFOS, the increase in serum total cholesterol in adults, and the decrease in antibody response at vaccination in children were identified as the critical effects. For PFOA, the increase in serum total cholesterol was the critical effect. Also reduced birth weight (for both compounds) and increased prevalence of high serum levels of the liver enzyme alanine aminotransferase (ALT) (for PFOA) were considered. After benchmark modelling of serum levels of PFOS and PFOA, and estimating the corresponding daily intakes, the CONTAM Panel established a tolerable weekly intake (TWI) of 13 ng/kg body weight (bw) per week for PFOS and 6 ng/kg bw per week for PFOA. For both compounds, exposure of a considerable proportion of the population exceeds the proposed TWIs.
Keywords: PFOS, PFOA, food, exposure, BMD, PBPK, risk assessment
Summary
In a request from the European Commission, the EFSA Panel on Contaminants in the Food Chain (CONTAM Panel) was asked to assess the risk to human health related to the presence of perfluorooctane sulfonic acid (PFOS) and perfluorooctanoic acid (PFOA) in food, considering existing hazard assessments and available occurrence data.
PFOS and PFOA belong to the group of per‐ and polyfluoroalkyl substances (PFASs). This group of substances consists of a hydrophobic alkyl chain of varying length (typically C4–C16) and a hydrophilic end‐group. PFOS belongs to the perfluoroalkyl sulfonic acids (PFSAs), whereas PFOA belongs to the perfluoroalkyl carboxylic acids (PFCAs). Linear, branched or linear/branched mixtures of PFOS and PFOA are produced and are found in human and environmental samples. Liquid chromatography coupled to quadrupole tandem mass spectrometry (LC–MS/MS) is commonly used to determine PFOS and PFOA in both food and biological samples. Two major processes exist for production of PFOS and PFOA, Simons electrochemical fluorination and telomerisation. The telomerisation process generates almost exclusively linear PFOS and PFOA, whereas the electrochemical process produces a mixture of branched and linear isomers. Since the 1940s, PFASs have been produced and used in numerous commercial and industrial applications, including textile, carpet and leather treatment (water and dirt proofing), surfactants, firefighting foams, metal plating and paper grease‐proofing treatments. The widespread use of PFOS, PFOA and their precursors, together with their persistency, has resulted in widespread environmental contamination. Contamination of food with PFOS and PFOA is thought to occur mainly through two different processes (i) from bioaccumulation in aquatic and terrestrial food chains and (ii) as a result of transfer of PFOS, PFOA and their precursors from contact materials used in food processing and packaging. Contamination can also arise when food‐producing animals are exposed to sources of pollution such as wild boars feeding at dumpsites.
An initial number of 21,411 results for food samples analysed for PFOS (n = 10,889) and PFOA (n = 10,522) from 16 European countries were available for the assessment. The data set was characterised by a high proportion of left‐censored data (results below limit of detection (LOD)/limit of quantification (LOQ)) with 74% of left‐censored data for PFOS and 91% of left‐censored data for PFOA. A total of 20,019 analytical results for PFOS (n = 10,191) and PFOA (n = 9,828) fulfilled the quality criteria applied and have been considered in the assessment. The highest mean concentrations of PFOS and PFOA were recorded in the food category ‘Meat and meat products’. This was affected by high mean concentrations in the liver from game mammals (lower bound/upper bound (LB/UB) mean = 215/215 μg/kg for PFOS and LB/UB mean = 5.46/8.11 μg/kg for PFOA). Excluding offal, the mean concentration in the category ‘meat and meat products’ was LB/UB = 0.55/0.75 μg/kg for PFOS and LB/UB = 0.10/0.34 μg/kg for PFOA. In edible offal from farmed animals, the concentration was for PFOS (LB/UB mean) 0.66/2.12 μg/kg and for PFOA (LB/UB mean) 0.05/1.39 μg/kg. High levels were also observed in ‘Fish and other seafood’ (LB/UB mean = 2.08/2.59 μg/kg for PFOS and LB/UB mean = 0.18/0.90 μg/kg for PFOA.
For PFOS, the LB mean dietary exposure ranges from 1.26 (adolescents) to 20.86 (other children) ng/kg body weight (bw) per week, across age groups and surveys. The high (95th percentile) LB exposure ranges from 3.5 (adolescents) to 165.9 (other children) ng/kg bw per week. For PFOA, the mean LB dietary exposure estimates range from 1.47 ng/kg bw per week (elderly and very elderly) up to 18.27 ng/kg bw per week (toddlers). The high LB (95th percentile) exposures range from 3.43 (very elderly) to 37.59 (toddlers) ng/kg bw per week. The most important contributors to the LB mean chronic exposure to PFOS, were ‘Fish and other seafood’ (contributing up to 86% in adults), especially ‘Fish meat’, followed by ‘Meat and meat products’ and ‘Eggs and egg products’. Regarding PFOA, ‘Milk and dairy products’ (contributing up to 86% in toddlers, but based on only a few samples with detectable levels for cow milk and gouda cheese), ‘Drinking water’ and ‘Fish and other seafood’ made the largest contribution to the LB mean chronic exposure.
PFOS and PFOA are readily absorbed in the gastrointestinal tract in mammals, including humans, and distribute predominantly to the plasma and liver. They are not metabolised and are excreted in both urine and faeces. Differences in biological half‐lives between species for both PFOS and PFOA are mainly due to differences in renal clearance. Significant gender differences in the elimination of PFOA are observed in some, but not all species; gender differences in renal clearance have not been reported in humans. The half‐lives of the branched chain PFOS and PFOA isomers are generally shorter than those for the linear molecules, with the exception of 1 m‐PFOS. For both PFOS and PFOA, maternal transfer occurs prenatally to the fetus through the placenta transfer and postnatally through breastfeeding. The estimated half‐life for PFOS in humans is approximately 5 years, whereas for PFOA, several studies estimated a half‐life between 2 and 4 years.
With regard to information on human biomonitoring, PFOS and PFOA were detected in blood samples of almost all individuals assessed, demonstrating ubiquitous exposure. For PFOS, the median of the values reported as median concentrations in a number of studies was higher in adults (7.7 ng/mL) compared to children (3.2 ng/mL), while the opposite was seen for PFOA, where the median of the values reported as median concentrations was 1.9 and 3.3 ng/mL for adults and children, respectively. The breast milk concentrations were usually around 0.9–2% and 1.8–9% of the maternal serum/plasma concentrations for PFOS and PFOA, respectively. Concentrations observed in European populations were comparable to those observed in general populations’ worldwide.
In experimental animal toxicity studies, the liver was a target organ in rodents. For PFOS, increases in relative liver weight were noted from 0.15 mg/kg bw per day and for PFOA, increased absolute and relative liver weight and hepatic peroxisomal β‐oxidation were noted at 0.64 mg/kg bw per day. From long‐term/carcinogenicity studies, PFOS was found to cause tumours in the liver of rats. PFOA induced Leydig cell tumours in Sprague–Dawley rats. Both PFOS and PFOA have developmental neurotoxicity potential and widespread effects on the expression of genes relevant for signal transmission in the brain. From rodent studies, male offspring are more sensitive than females, and the most frequent behavioural outcome reported after PFOS exposure is decreased spontaneous activity, which on the contrary is increased by PFOA. Exposure of rodents to PFOS and PFOA during pregnancy affects both mothers and the development of the offspring. For PFOS, the most sensitive effects were on maternal liver weight (0.3 mg/kg bw per day), placental physiology (0.5 mg/kg bw per day) and on glucose homoeostasis (0.3 mg/kg bw per day). Pathological alterations, following PFOA exposure, included increased liver weight in pups and mothers following exposure at doses of 0.1 and 0.6 mg/kg bw per day, respectively. Male reproductive organs and male sex hormone levels were affected at 0.3 mg/kg bw per day. Low‐dose effects (delay of mammary gland development and changes of levels of metabolic parameters) were noted at 0.01 mg/kg bw per day. No health risks can be deduced from these latter biological response data. PFOS affects various structural and functional parameters in the immune system in rodents. The most sensitive parameter affected by PFOS is the T‐cell‐dependent antibody response to immunisation. The effects of PFOA are similar with both structural and functional parameters influenced. The no‐observed‐adverse‐effect‐level (NOAEL) for immunotoxicity of PFOS and PFOA was 1.66 μg/kg bw per day and 1 mg/kg bw per day, respectively, based on suppression of anti‐SRBC IgM titres. From in vitro and in vivo genotoxicity studies, there is no evidence for a direct genotoxic mode of action for both PFOS and PFOA, however, genotoxicity cannot be excluded. There is some evidence for oxidative stress induced by both PFOA and PFOS.
Human epidemiological studies provide some evidence for a causal association between prenatal exposures to PFOS and PFOA and birth weight. Despite relatively consistent findings, the role of confounding by glomerular filtration rate during pregnancy cannot be excluded. Moreover, there is some uncertainty on the clinical relevance of these findings, as associations with low birth weight (defined as < 2,500 g) have not been reported. Epidemiological studies conducted provide insufficient evidence for a causal association between prenatal exposures to PFOS and PFOA and increased prevalence of birth defects or stillbirths, subfecundity, risk of miscarriage or pregnancy hypertension. Human epidemiological studies provide insufficient support for causal associations between prenatal or perinatal exposure to PFOS/PFOA and neurodevelopment, growth in infancy or childhood, timing of puberty, semen quality or metabolic outcomes. For neurotoxicity outcomes, human epidemiological studies provide insufficient support for causal associations between exposure to PFOS/PFOA and neurobehavioural, neuropsychiatric or cognitive outcomes in childhood or adulthood. For immune outcomes, human epidemiological studies suggest that exposure to PFOS, and possibly PFOA, adversely affect serum antibody response following vaccination in children, and it is concluded that this association is likely to be causal. There are some suggestions from epidemiological studies that prenatal exposures to PFOS and PFOA may lead to increased propensity of infection. With regard to asthma and allergies in children and adults, epidemiological studies provide insufficient support for causal associations between exposures to PFOS and PFOA. For endocrine outcomes, human epidemiological studies provide insufficient support for causal associations between exposure to PFOS/PFOA and timing of puberty, menopause, menstrual cycle changes, endometriosis, duration of breastfeeding, semen quality, levels of sex hormones or thyroid function. For metabolic outcomes, human epidemiological studies provide strong support for causal associations between exposure to PFOS and PFOA and increased serum levels of cholesterol and support for a causal association between exposure to PFOA and increased serum levels of the liver enzyme alanine transferase (ALT). However, there is insufficient support for causal associations with diabetes, obesity and metabolic syndrome. Human epidemiological studies provide insufficient support for causal associations between exposure to PFOS and PFOA, and changes in kidney function or serum levels or uric acid. For carcinogenicity outcomes, human epidemiological studies provide insufficient support for carcinogenicity of PFOS and PFOA. This conclusion applies to both studies conducted in occupationally exposed individuals and among those exposed to background levels. For cardiovascular outcomes, human epidemiological studies provide insufficient support for causal associations between exposure to PFOS/PFOA and increased risk of cardiovascular disease. This also applies to other outcomes, like risk of ulcerative colitis, osteoarthritis, rheumatoid arthritis or bone mineral density.
With regard to the possible mode of action in relation to liver toxicity, PFOS and PFOA are both ligands of the nuclear receptor peroxisome proliferator activated receptor‐alpha (PPARa), and induce liver growth, proliferation of peroxisomes and induction of peroxisomal β‐oxidation in rodents. Elevated peroxisomal β‐oxidation in rodents may lead to hepatic lipid peroxidation and subsequently to cell death and enhanced release of liver transaminases. It is presently unclear by which mechanisms PFOA and maybe PFOS could increase serum levels of ALT in humans. With regard to the possible mode of action in relation to blood lipid effects, unlike other PPARa agonists, PFOS and PFOA are positively associated with blood cholesterol concentrations in humans and with triglyceride levels. In rodents, PFOS and PFOA may impair the release of cholesterol and/or triglycerides from the liver causing elevated intrahepatic and lowered serum cholesterol and/or triglyceride concentrations. These effects in rodents may not be of human relevance presumably due to species‐specific differences in the function of PPARa affecting the metabolism of lipids. With regard to the possible mode of action in relation to birth weight, in human studies, an inverse relation between PFOS and IGF‐1 levels has been shown which may be associated with a reduced growth rate. In rodents, PFOS and PFOA reduced body weight, which is associated with loss of white adipose tissue, upregulation of uncoupling protein‐1 (UCP‐1) and its association with energy expenditure and regulation of food consumption. With regard to the possible mode of action in relation to immunotoxicity, PFOS and PFOA affect lymphocytes, macrophages and other cells of the immune system. PFASs may modulate gene regulation via peroxisome proliferator activated receptors (PPARs). They influence NF‐κB transcription and gene expression of apoptotic regulators, and immune functionality and activation of T‐cell receptor signalling involved in the regulation of immune responses. PFOS and PFOA share mechanisms, but may also be different as cytokine profiles in lymphoid cells have shown to be differentially affected. With regard to the possible mode of action in relation to carcinogenicity in rodent, PFOS and PFOA act as tumour promoters in rodent liver. Transactivation of rodent PPARa but not of human PPARa appears to mediate the carcinogenic activity of PPARa ligands. A similar mechanism may be anticipated for PFOS and PFOA. PFOA induces Leydig cell adenomas in rat testis, caused by reduced serum testosterone levels and compensatory release of luteotrophic hormone, which stimulates growth of Leydig cells and tumour formation. Leydig cell tumours occur frequently in rodents but rarely in humans. PFOA causes pancreatic hyperplasia, a prestage of tumour formation. As known from another PPARa ligand, altered composition and output of bile acids may enhance the secretion of cholecystokinin, which binds to acinar CKK1 receptor and stimulates growth of this cell type. This mode of action appears to be irrelevant for humans.
For PFOS and outcomes identified in adults, the CONTAM Panel identified the increase of serum cholesterol as the critical effect. Three studies on serum cholesterol showed very similar BMDL5 levels expressed as plasma PFOS (21–25 ng/mL), corresponding to an estimated chronic daily intake of 1.7–2.0 (median 1.8) ng/kg bw per day based on a human physiologically based pharmacokinetic (PBPK) model. For children the lowest BMDL5 is for antibody response after vaccination (10.5 ng/mL). Since for children, the relation between serum concentrations of PFOS and corresponding daily intake rates is not as straight‐forward as in adults, due to the contribution from breastfeeding, the CONTAM Panel considered it not appropriate to calculate which intake rate for children after the end of breastfeeding would correspond to the BMDL5 serum level of PFOS in 5‐year old children. Instead, the serum PFOS levels in the pregnant mothers in the critical study were compared with serum PFOS levels for the other potential critical effects, and serum levels in breastfed children were modelled to illustrate how maternal serum PFOS levels and intake rates would be related to serum PFOS levels in their 5‐year old children. A maternal intake of 1.8 ng/kg per day and 6 months of exclusive breastfeeding was estimated to result in a plasma PFOS level below 10.5 ng/mL. The BMDL5 for reduced birth weight was about the same as for increased cholesterol. The CONTAM Panel noted that there is still some uncertainty, both regarding causality and adversity of reduced birth weight. However, since there is likely confounding by glomerular filtration rate, an intake rate based on increased cholesterol is protective also for reduced birth weight. With serum cholesterol, antibody response after vaccination and birth weight, all considered as potential critical endpoints, the CONTAM Panel found it appropriate to weigh the overall evidence from the human observational studies when setting an health‐based guidance value (HBGV). For these endpoints, the reference points were centred around 1.8 ng/kg bw per day with some variation depending on the outcome and study. Therefore, the CONTAM Panel considers 1.8 ng/kg bw per day as an appropriate reference point. In order to take into account the long half‐life of PFOS, the CONTAM Panel established a tolerable weekly intake (TWI) of 13 ng/kg bw per week. If applied for all age groups, it is protective for adverse effects on vaccination response and reduced birth weight.
For PFOA, the CONTAM Panel considers the increase of serum cholesterol to be the critical effect. Two studies on serum cholesterol showed very similar BMDL5 values expressed as plasma/serum PFOA (9.2–9.4 ng/mL), corresponding to an estimated chronic intake of 0.8 ng/kg bw per day. The CONTAM Panel considered 0.8 ng/kg bw per day to be an appropriate reference point. Based on the long half‐life of PFOA, the CONTAM Panel established a TWI of 6 ng/kg bw per week. It is protective also for increased risk of liver damage, indicated by high serum ALT. It is protective against reduced birth weight, taking into account the fact that there is likely to be an impact of confounding by glomerular filtration rate.
For both established HBGVs, the CONTAM Panel decided not to apply any additional uncertainty factors because the BMD modelling was based on large epidemiological studies from the general population, including potentially sensitive subgroups. The CONTAM Panel also took into account that the BMD modelling was performed on risk factors for disease rather than disease.
For PFOS, mean LB dietary exposure ranged from 1.3 to 20.9 ng/kg bw per week, across age groups and surveys. The high (95th percentile) LB exposure ranged from 3.5 to 165.9 ng/kg bw per week. Therefore, a considerable proportion of the population exceeds the TWI of 13 ng/kg bw per week, by up to 1.6‐ and 13‐fold, for mean LB and high LB exposure, respectively. For PFOS, at the UB, the TWI is exceeded in all surveys at mean exposure, and the high UB (95th percentile) exposures exceed the TWI from 1.7‐ to 15‐fold across surveys and age groups. For PFOA, mean LB dietary exposure estimates range from 1.5 to 18.3 ng/kg bw per week. The high (95th percentile) LB exposures range from 3.4 to 37.6 ng/kg bw per week. Therefore, a considerable proportion of the population exceeds the TWI of 6 ng/kg bw per week, by up to 3‐ and 6‐fold for mean LB and high LB exposure, respectively. For PFOA, at the mean UB, the TWI is exceeded 1.4‐ to 14‐fold across surveys and up to 28‐fold at the high UB (95th percentile) exposure for toddlers. Therefore, it is clear that a considerable proportion of the population exceeds the established TWIs for PFOS and PFOA. The exceedances of the TWIs for PFOS and PFOA at LB exposure estimates are of concern.
The CONTAM Panel is aware of the fact that the present exposure assessment is highly uncertain. Large differences between LB and UB concentrations were observed in foods, as a result of analytical methods being used that are not sufficiently sensitive. This results in a large difference between maximum UB and minimum LB chronic dietary exposure estimates for PFOS and PFOA. The CONTAM Panel considers that the true exposure level for both PFOS and PFOA is closer to the LB than the UB values. This assumption is based on two facts:
Studies performed using the best analytical methods with good sensitivity and high levels of quality control give results with fewer left censored data and confirm occurrence in foods at levels close to the lower bound estimates.
Median LB data in this opinion are consistent with what would be expected based on median population blood serum levels.
The CONTAM Panel recommends the development of analytical methods with higher sensitivity which are easy to perform (sensitive methods exists, but are primarily used by research laboratories, and are quite complex). Data obtained by more sensitive analytical methods with high levels of quality control (to avoid matrix effects or impact of background contamination) are needed in order to increase the proportion of quantified results and thus improve the quality of the dietary exposure assessment. Improved reporting of data in terms of clarifying whether upper or lower bound and clarification of whether or not data are corrected for recovery will reduce uncertainty in exposure estimates. More studies on the effect of cooking and food processing would improve exposure assessments given that most food is consumed after cooking/processing and the data reported in the scientific literature are inconsistent regarding which impact this has on exposure. For many of the outcomes reviewed, the majority of epidemiological studies were cross‐sectional. More longitudinal epidemiological studies are needed, in particular prospective vaccination studies covering more varied types of vaccines and age groups, as well as more studies on other immune outcomes in humans. Moreover, access to individual data in epidemiological studies would be useful in order to perform accurate dose–response analysis and risk characterisation. Most epidemiological studies examine associations between health‐related outcomes and single PFASs separately in spite of co‐exposures. For risk assessment, it would be useful also to report results mutually adjusted for several PFASs so conclusions can be drawn on the independent associations of PFOS and PFOA.
1. Introduction
1.1. Background and Terms of Reference as provided by the European Commission
1.1.1. Background
Following the Scientific Opinion on Perfluorooctane sulfonate (PFOS), perfluorooctanoic acid (PFOA) and their salts,1 the European Commission recommended an EU‐wide monitoring2 of perfluoroalkylated substances in food. The occurrence data generated by this monitoring have been used in the Scientific Report entitled ‘perfluoroalkylated substances in food: occurrence and dietary exposure’.3
1.1.2. Terms of reference
In accordance with Art 29 (1) of Regulation (EC) No 178/2002, the European Commission asks the European Food Safety Authority to prepare an opinion on the risks to human health related to the presence of perfluoroalkylated substances in food, considering existing hazard assessments and available occurrence data.
1.2. Interpretation of the Terms of Reference
Following the agreement reached in June 2017 with the European Commission, the CONTAM Panel decided to address the mandate in two separate opinions, one on perfluorooctane sulfonic acid and perfluorooctanoic acid (EFSA‐Q‐2015‐00526) and another on other perfluoroalkylated substances (EFSA‐Q‐2017‐00549).
1.3. Additional information
1.3.1. Chemistry
Perfluorooctane sulfonic acid (PFOS) and perfluorooctanoic acid (PFOA) belong to the group of per‐and polyfluoroalkyl substances (PFASs).
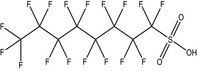
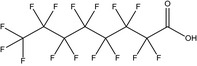
PFASs (R‐X) are compounds consisting of a hydrophobic alkyl chain, of varying length (typically C4–C16) and a hydrophilic end group. PFOS (8 perfluorinated carbons) and PFOA (7 perfluorinated carbons) both have an anionic end group and belong to the perfluoroalkyl sulfonic acids (PFSAs) and the perfluoroalkyl carboxylic acids (PFCAs), respectively (Table 1). PFOS and PFOA appear to be highly persistent because of the strong covalent C–F bond.
Table 1.
Chemical characteristics of PFOS and PFOA and their uses as derived from Buck et al. (2011)
| Acronym | Chemical name | CAS number | Structural formula | Molecular weight | Uses |
|---|---|---|---|---|---|
| PFOS | Perfluorooctane sulfonic acid | 2795‐39‐3 (potassium salt); 1763‐23‐1 (acid) |
|
538.22 (potassium salt)500.13 (acid) | Surfactant |
| PFOA | Perfluorooctanoic acid | 335‐67‐1 |
|
414.07 | Surfactant |
Depending on the synthesis, linear PFOS (n‐PFOS) and PFOA (n‐PFOA) or a mixture of linear and branched PFOS (br‐PFOS) and PFOA (br‐PFOA) are produced (see Section 1.3.3). In environmental and human samples (De Silva and Mabury, 2006), PFOS and PFOA are found as a mixture of the linear and branched isomers (Riddell et al., 2009). Theoretically, there are many geometric PFOS and PFOA isomers that are branched, although only few of them have been identified in technical products, and in samples reported in environmental and human biomonitoring studies. Figure 1 displays linear and monomethyl‐branched isomers for which m refers to a perfluoromethyl branch and the number preceding it indicates the carbon position on which the branch resides (Benskin et al., 2010). Similarly, dimethyl‐substituted‐branched isomers are labelled as m2 and the preceding numbers refer to the locations of the CF3 branching points.
Figure 1.
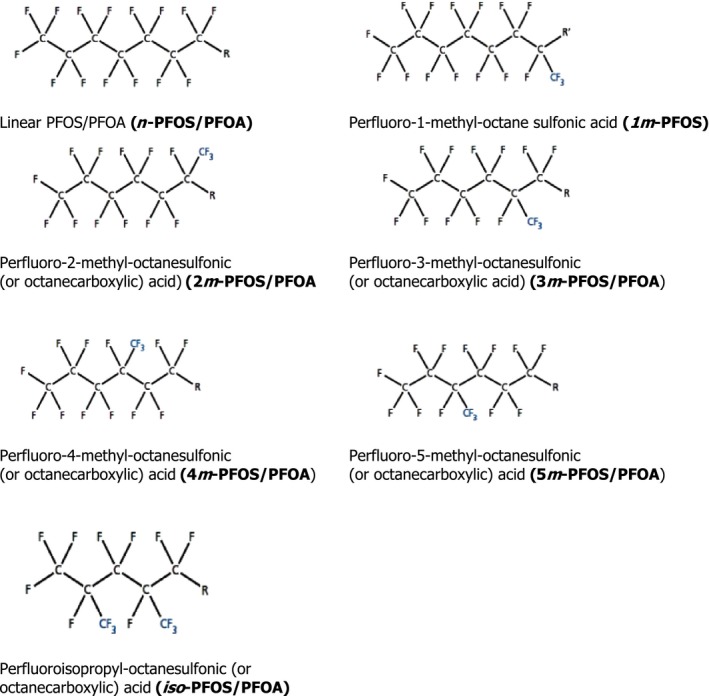
Structure of PFOS/PFOA isomers discussed in this opinion (R = CF2SO3 (PFOS) or CO2 (PFOA); R’ = SO3)
1.3.2. Methods of analysis
1.3.2.1. Analytical methods for PFASs
PFOS and PFOA are normally measured alongside other PFASs as part of multianalyte methods. These do not always measure the same PFASs and some methods measure more compounds than others. But even when only PFOS and PFOA are determined, it is important to know that these compounds can be distinguished from other PFASs, which may co‐elute and have common ion fragments. For these reasons, analytical methods are considered for the whole group of PFASs.
It has been the advances in analytical technology over the past decade that made it possible to measure PFASs in foods and environmental samples at the levels that are typically found. Because PFCAs and PFSAs are not very volatile, they are not amenable to direct analysis by gas chromatography (GC), and because there is no suitable chromophore, liquid chromatography (LC) analysis with ultraviolet detection is also not suitable (Martin et al., 2004). It is possible to analyse using GC if PFCAs and PFSAs are first derivatised to form their methyl esters, and detection is possible either using electron capture detector (Ylinen et al., 1985) or mass spectrometry (MS). Advances in LC coupled to quadrupole tandem mass spectrometry (LC–MS/MS) with electrospray ionisation (ESI) have made this by far the most commonly used instrumental method for measuring PFSAs and PFCAs in food (Jahnke and Berger, 2009). Due to the better separation that is achievable with GC methods, the derivatisation followed by GC–MS is still sometimes used when a higher resolving power is needed to separate isomers that co‐elute when using LC methods, such as for neutral and volatile PFASs, including fluorteleomer alcohols (FTOHs), perfluoroalkane sulfonamides (FASAs), N‐ethyl perfluoroalkane sulfonamides (EtFASAs) and N‐ethylperfluoroalkane sulfonamidoethanols (EtFASEs) (Jahnke and Berger, 2009). LC–MS/MS can be used to measure neutral PFASs and to screen for a large number of non‐ionic and anionic fluorinated surfactants used in food contact materials (Trier et al., 2011).
PFCAs and PFSAs are normally extracted from food using ion‐pair extraction (IPE) or solid–liquid extraction (SLE) methods. Early IPE methods used tetrabutylammonium counter ion at alkaline pH and ethyl acetate as the extraction solvent (Ylinen et al., 1985), but most recent methods for food (Guruge et al., 2008; Vestergren et al., 2012) use methodology first developed for environmental applications where methyl tert–butyl ether is used as the extraction solvent (Hansen et al., 2001). Co‐extraction of lipophilic matrix constituents can cause instrumental problems, which is perhaps the reason why this technique is not used more widely (Powley et al., 2005; van Leeuwen et al., 2009). SLE extraction using solvents with medium polarity such as acetonitrile or methanol is more commonly used, especially for foods with a high fat content (Powley et al., 2005; Berger et al., 2009). Only a few of the methods developed for PFASs and PFCAs have been optimised for the determination of fluorotelomer alcohols (FTOH), FASAs, EtFASAs, EtFASEs and n:2 polyfluoroalkyl phosphoric acid esters (PAPs). Soxhlet with a 2:1 hexane:acetone mixture was the first approach for the analysis of neutral FASAs and EtFASAs (Tittlemier et al., 2006). FASAs, EtFASAs, EtFASEs and anionic PFSAs and PFCAs are all neutral and can be extracted together using SLE (Ostertag et al., 2009; Lacina et al., 2011).
One of the biggest challenges using LC–MS/MS methods using ESI is ion suppression or ion enhancement which can occur when co‐eluting compounds are present in the extract (Mallet et al., 2004). There have been a variety of approaches taken to remove these interfering compounds including the use of carbon, ion‐exchange or silica, all of which have been used with good recovery rates (Powley et al., 2005; Taniyasu et al., 2005; Powley et al., 2008; Kärrman et al., 2009; Ballesteros‐Gómez et al., 2010; Lacina et al., 2011; Vestergren et al., 2012).
The rapid development of LC–MS/MS instrumentation and increased availability of analytical standards has resulted in significant advances in methodology for PFASs with many more individual PFASs being measured and improvements in limits of detection (LODs) of up to three orders of magnitude (Hansen et al., 2001; Ballesteros‐Gómez et al., 2010; Haug et al., 2010a; Lacina et al., 2011; Sundström et al., 2011; Vestergren et al., 2012). The results of these improvements are reflected by overall performance that can be seen by laboratories participating in interlaboratory comparison studies (van Leeuwen et al., 2006; Lindström et al., 2008; Longnecker et al., 2008; van Leeuwen et al., 2009; van der Veen et al., 2012). There nevertheless remains an important need to remain vigilant in terms of quality control when undertaking analysis of food samples for PFASs, and measures such as inclusion of procedural blanks to check for laboratory contamination, estimates of recovery and matrix effects, and regular participation in laboratory intercomparison studies is important to ensure data quality.
Analytical columns used for standard analysis may not be suitable to quantify branched chain molecules and specialist columns designed for this application may be needed to ensure separation (Miralles‐Marco and Harrad, 2015). The same applies to enantiomers if these are to be measured separately. For both situations, it is important to use appropriate analytical standards (Benskin et al., 2010; Miralles‐Marco and Harrad, 2015).
1.3.2.2. Analytical methods for determination of PFASs in biological samples
Similar to food samples, PFOS and PFOA are determined in biological samples using LC–MS/MS. The sample preparation usually involves a combination of protein precipitation, on‐line or off‐line solid‐phase extraction and/or liquid–liquid extraction (Jahnke and Berger, 2009; Salihovic et al., 2013a). Recently, also methods including μ‐SPE (Lashgari and Lee, 2016) and 96‐well plates (Salihovic et al., 2013b) have been applied. If an additional clean‐up is required, dispersed graphitised carbon with glacial acetic acid or clean‐up by filtration is commonly used (Salihovic et al., 2013a).
1.3.3. Synthesis
Most information in this Section is taken from the previous opinion of the CONTAM Panel (EFSA, 2008), which in turn was to a large extent based on information in the 3M assessment (3M Company, 2003), the OECD hazard assessment (OECD, 2002) via the report from UK Environment Agency (Brooke et al., 2004) and the PERFORCE report (de Voogt et al., 2006). Two major processes exist for production of PFOS and PFOA, Simons electrochemical fluorination (ECF) and telomerisation (Hekster et al., 2003). The telomerisation process generates almost exclusively linear PFOS and PFOA, whereas the electrochemical process produces a mixture of branched and linear isomers (see Figure 1) (Buck et al., 2011). In the ECF process, organic feed stocks are dispersed in liquid anhydrous hydrogen fluoride, and an electric current is passed through the solution, leading to the replacement of all of the hydrogen atoms in the molecule with fluorine atoms. In the telomerisation process, tetrafluoroethylene is reacted with iodine pentafluoride (IF5) to produce fluorinated alkyl iodide with linear, even numbered alkyl chain lengths, so called fluorotelomers. Production of fluorotelomer‐based products started around 1974 (van Zelm et al., 2008), whereas production with the ECF process was initiated already in the late 1940s.
For additional information on the synthesis of PFASs dealt with in this opinion, the reader is referred to, e.g. Buck et al. (2011), van Zelm et al. (2008), Löfstedt Gilljam et al. (2016) and OECD (2011).
1.3.4. Production and use of the compounds
The chemical resistance, the surface tension lowering properties and the ability to create stable foams have made PFASs extremely versatile. Since the 1940s, PFASs have been produced and used in numerous commercial and industrial applications, including textile, carpet and leather treatment (water and dirt proofing), surfactants, firefighting foams, metal plating and paper grease‐proofing treatments (Kissa, 2001). Eight‐carbon based molecules dominated the early production of PFASs but as a result of national and international legislations on production and use of PFOS and PFOA, and its possible precursors, a number of other PFASs have been placed on the market. This includes compounds with chain lengths from four to eighteen carbon atoms.
Fluorinated surfactants with fluorinated hydrophobic/oleophobic chains longer than seven fluorinated carbon atoms have reduced water solubility. This means that seven or eight perfluorinated carbons have optimal functionality from a surfactant perspective on low surface tension. This could indicate that transition from production and use of molecules with seven or eight perfluorinated carbons could result in higher demand and production in order to obtain comparable technical performance. The effects of such a transition have been discussed further elsewhere (Danish EPA, 2015).
In the open literature, there are a limited number of reports on the production of PFOS and PFOA. Paul et al. (2009) report on an inventory of global production of PFOS. The authors estimated the total global production during 1970–2002 to have been 122,500 tonnes, whereof 26,500 tonnes was classified as manufacturing wastes. Prevedouros et al. (2006) estimated the total global production of PFCAs to be 4,400–8,000 tonnes, where 3,600–5,700 tonnes represent ammonium perfluorooctanoate (APFO) and 800–2,300 tonnes represent ammonium perfluorononanoate (APFN). The same authors also reported on the production of AFPO. The largest production sites were located in the US and Belgium. Less extensive production was occurring in Italy and Japan. The remaining 10–20% was manufactured from about 1975 at one site in Germany. By 2002, the principal worldwide manufacturer of APFO by the ECF process discontinued external sales and ceased production leaving only a number of relatively small producers in Europe and in Asia (OECD, 2004).
The 3M Company started its production of perfluorinated octylchemicals around 1947 (3M Company, 1999; Kissa, 2001). Production increased in the 1960s and 1970s as a result of a generally increased demand for PFASs where these compounds became a standard additive in aqueous firefighting foams. Production continued to increase throughout the 1980s and 1990s, and it reached its maximum in 2000 just prior to the phase‐out of the perfluorooctyl‐based production. In these days, 3M was the world's leading producer of PFOS‐ and PFOA‐related compounds. These related compounds comprise the possible precursors as well as compounds/intermediates used in the production (for PFOS perfluorooctane sulfonyl fluoride (POSF)) but also salts, aldehydes, amides, etc. According to the 3M Company (2003), the global production of PFOS was decreased from 3,535 tonnes in 2000 to 175 tonnes in 2001. In late 2002, 3M Company closed down its production of PFOS and PFOA. In connection to this, their production of perfluorobutyl‐based products increased, but more precise production volumes have not been identified. This shift away from the perfluorooctyl‐based compounds is likely to be a response to national and international legislations on production and use of PFOS and PFOA, and its possible precursors (OECD, 2006).
OECD has investigated the production of PFSAs and PFCAs and products containing these groups of compounds (OECD, 2006). The report indicates that in 2005, 74–175 tonnes as the sum of PFOS and PFOS‐containing products were manufactured or imported, and of this up to 90 tonnes consisted of POSF. The corresponding figures for PFOA and PFOA‐containing products were estimated to be 69–320 tonnes.
1.3.5. Environmental fate
PFASs have both hydrophobic and oleophobic properties, surface tension lowering properties, as well as chemical resistance. This versatility has resulted in PFASs being used in a plethora of industrial processes as well as numerous consumer products worldwide (Kissa, 2001; Buck et al., 2011). PFOS and PFOA are highly resistant to physical and microbiological degradation (Kissa, 2001), and are thus extremely persistent in the environment and they therefore fulfil international persistent organic pollutant (POP) criteria. In fact, there are no indications that the perfluorinated part of PFOS or PFOA could be decomposed in the environment.
Many PFASs are considered to be potential precursors of PFSAs and PFCAs (see Figure 2), and these precursors are usually not environmentally persistent, but may be transformed in the environment among others through biodegradation. In a study by Peng et al. (2014), Japanese Medaka were exposed to an N‐ethyl perfluorooctanesulfonamido ethanol (FOSE)‐based phosphate diester through water, and N‐ethyl perfluorooctane sulfonamide (EtFOSA), N‐ethyl perfluorooctane sulfonamidoethanol (EtFOSE), perfluorooctane sulfonamide (FOSA) and PFOS were measured in the samples. Polyfluoroalkyl phosphates (PAPs) have been shown to biodegrade to FTOHs and PFCAs. For instance in a study by D'Eon and Mabury (2007), Sprague–Dawley rats were exposed to 8:2 diPAPs and 8:2 mono PAPs, and both PFOA and metabolites previously identified in 8:2 FTOH metabolism studies were observed (D'Eon and Mabury, 2007). It should however be noted that environmental transformation of such precursors occurs in the non‐perfluorinated part of the molecules.
Figure 2.
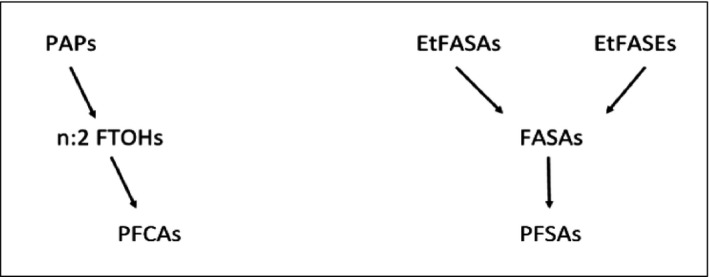
Simplified figure illustrating biodegradation of certain groups of PFASs
The widespread use of PFOS, PFOA and their precursors, in combination with their persistency in the environment, has resulted in a widespread contamination of the environment. PFOS and PFOA are ubiquitous and are found in a variety of compartments, including wildlife and humans (Giesy and Kannan, 2001).
1.3.5.1. Release and distribution in the environment
PFOS and PFOA can be released to the environment at various stages of production, through product use and as a result of disposal of the products at the end of their life (Ahrens and Bundschuh, 2014). It has been shown from environmental monitoring and inventory studies that a substantial amount of the PFOS and PFOA found in the environment has been released into aquatic ecosystems, (Prevedouros et al., 2006; Paul et al., 2009). As a result of high persistency and relatively high water solubility, PFOS and PFOA can undergo long‐range transport as aerosols but also via water currents (Prevedouros et al., 2006; Ahrens et al., 2011). Furthermore, long‐range atmospheric transport of precursors of PFOS and PFOA (Young and Mabury, 2010; Benskin et al., 2011) as well as human activities, as shown by, e.g. Wild et al. (2015), could contribute to the long‐range transport of these compounds. Consequently, historic and current production of PFASs has resulted in, and will for a long time to come, lead to further distribution of PFOS and PFOA in the environment. More specifically, environmental waterways can act as both a mode of transport and as a final sink due to their relatively high water solubility (> 0.5 g/L for PFOA; Kissa, 2001) and due to the low volatility of the PFASs in their deprotonated form (Armitage et al., 2006). Exposure of aquatic organisms can therefore be expected, either directly via contaminated water or indirectly through the ecological food chains.
Important direct releases to aquatic ecosystems come from, for instance, municipal waste water treatment plants, landfill waste sites and industrial plants (Eggen et al., 2010; Post et al., 2012; Arvaniti and Stasinakis, 2015). Atmospheric deposition, as a secondary source is also a major contributor (Ahrens and Bundschuh, 2014). More than 90% of investigated European rivers have shown to be contaminated with PFASs at concentrations between 3 and 1,400 ng/L (Loos et al., 2009, 2010; Möller et al., 2010) and PFASs have also been found in drinking water (Loos et al., 2010; Ahrens and Bundschuh, 2014).
1.3.5.2. Bioaccumulation in aquatic and terrestrial food chains
Bioaccumulation processes for organic chemicals are generally related to octanol–water equilibrium coefficients which reflect how hydrophobic compounds partition into the fatty tissues of living organisms. Unlike lipophilic persistent organic chemicals, such as polychlorinated biphenyls (PCBs) and polybrominated diphenylethers (PBDEs), PFOS and PFOA partition to serum proteins (Han et al., 2003; Jones et al., 2003; Conder et al., 2008; Bischel et al., 2010). Bioaccumulation and biomagnification factors (BAFs and BMFs) determined in the laboratory and in the field are generally consistent with the proteinophilicity of PFASs (Martin et al., 2003a,b; Kelly et al., 2009). In a study by Gebbink et al. (2016), field‐based sediment‐water distribution coefficients (logK D) of 2.7 and 2.5 were reported for PFOS and PFOA, respectively. In the same study, log BAFs from water to Baltic Herring (Clupea harengus) of 4.11 and 2.34 were observed for PFOS and PFOA, respectively.
For land‐based food chains, the bioaccumulation processes are more complex. A study by Stahl et al. (2009) demonstrated that PFOA and PFOS can accumulate in plants after being taken up from soil by the roots. The fact that PFOA and PFOS can be taken up and retained in humans (Olsen et al., 2007) and other mammals (Houde et al., 2006, 2011) suggests that bioaccumulation of PFOA and PFOS may also be important for farm animals. Biomagnification of PFOS in an Arctic terrestrial food chain, from lichen to caribou to wolf, has also been reported (Müeller et al., 2011). BMFs varied greatly with tissue type and compound, but it was concluded that PFOS and PFOA are biomagnified in marine and terrestrial food chains (Kelly et al., 2009; Müeller et al., 2011).
1.3.5.3. Time trends
The occurrence of PFASs in biota varies with time and compound. PFOS showed a profound increase in biota representing various trophic levels at least until the late 1990s. As an example, eggs from guillemot (Uria aalge) sampled at the same island in the Baltic Proper between 1968 and 2003 showed a dramatic increase in the PFOS concentrations from almost zero in 1968 to more than 1,300 ng/g fresh weight in the late 1990s. Thereafter the concentrations have decreased (Holmström et al., 2005) and in 2003 the concentrations were around 550 ng/g. In a compilation by the Swedish Environmental Protection Agency in 2012, temporal trends for PFOS and PFOA were reported from the Baltic Sea area and the Swedish mainland and this is described in Table 2.
Table 2.
Temporal trends for PFOS and PFOA in grey seal (Halichoerus grypus), otter (Lutra lutra) and peregrine falcon (Falco peregrinus)
| Compound | Species | Organ | Period | Concentration trend over time period, ng/g ww | Trend |
|---|---|---|---|---|---|
| PFOS | Peregrine falcon | Egg | 1975–1994 | 10–90a | Increasing |
| 1995–2005 | 90–80a | NS | |||
| Grey seal | Liver | 1969–1995 | 12–620 | Increasing | |
| 1996–2008 | 429–451 | NS | |||
| Otter | Liver | 1972–2011 | 200–2,500a | Increasing | |
| 2002–2011 | 2,500–2,500a | NS | |||
| PFOA | Peregrine falcon | Egg | 1975–2006 | < LOD | NS |
| Grey seal | Liver | 1969–1998 | < LOD–11 | Increasing | |
| 1999–2008 | 2.8–0.6 | Decreasing | |||
| Otter | Liver | 1972–2011 | 1–16a | Increasing | |
| 2002–2011 | 5–16a | Increasing |
1.3.5.4. Contamination of food
Contamination of food with PFOS and PFOA is thought to come via two different main processes, these being firstly from bioaccumulation in aquatic and terrestrial food chains, and secondly, as a result of transfer of PFOS, PFOA and their precursors from contact materials used in food processing and packaging (for further information on migration from food contact materials, including non‐stick coatings used on cookware see Section 3.1.3.1). Contamination from packaging and processing reflects current production and use of these compounds, while bioaccumulation in food chains in general reflects long‐term use. In order to improve the effectiveness of future measures to reduce dietary exposure, it is important to quantify the relative contribution from both of these source groups. Contamination can also arise when food‐producing animals are exposed to sources of pollution, for example boars feeding at dumpsites and other contaminated sites could be exposed to high levels of PFOS and other environmental contaminants, and associated high levels of PFOS and PFOA have been found in edible tissues from such animals (see Section 3.1.2).
1.3.6. Previous risk assessments
In 2008, EFSA published a scientific opinion on PFOS, PFOA and their salts (EFSA, 2008). For PFOS, a tolerable daily intake (TDI) of 150 ng/kg body weight (bw) per day was established, based on a lowest no‐observed‐adverse‐effect‐level (NOAEL) of 0.03 mg/kg bw per day derived from a subchronic study on cynomolgus monkeys, where a decrease in serum total cholesterol and high‐density lipoproteins (HDL), increased thyroid stimulating hormone (TSH) levels and lowered triiodothyronine (T3) concentrations were observed. An uncertainty factor (UF) of 200 was applied to the NOAEL. A UF of 100 was used for inter‐ and intraspecies differences and an additional UF of 2 to compensate for uncertainties related to the duration of the key study and the elimination kinetics of PFOS. The EFSA CONTAM Panel concluded that the exposure to the general population was well below the derived TDI, while highly exposed individuals might slightly exceed this level. Serum PFOS levels in general populations were found to be in the range 200–3,000 times lower than serum levels in the cynomolgus monkeys from which the NOAEL was derived. For PFOA, a benchmark dose for a 10% increase in increased liver weight (BMDL10) of 0.3 mg/kg bw per day based on studies in mice and rats was used to derive a TDI of 1.5 μg/kg bw per day, applying a UF of 200 to the BMDL10. A UF of 100 was used for inter‐ and intraspecies differences and an additional UF of 2 to compensate for uncertainties relating to the internal dose kinetics. The estimated high level dietary exposure of 6 ng/kg bw per day was found to be well below the TDI, and serum levels in humans were around three orders of magnitude lower than levels in rats in the studies from which the BMDL10 was derived. Based on this, the CONTAM Panel concluded that it is unlikely that adverse effects related to the presence of PFOS and PFOA in food are occurring in the general population. The 2012 EFSA scientific report (EFSA, 2012) on the occurrence and dietary exposure of PFASs in food confirmed that dietary exposure to PFOS and PFOA was highly unlikely to exceed the TDIs established by EFSA in 2008.
The Federal Institute for Risk Assessment in Germany (BFR) concluded in 2008 that there is no health risk in the German population arising from dietary exposure to PFOS and PFOA at levels found in food. BFR agreed with the respective TDIs established by EFSA in 2008 but referred to them as provisional TDIs (BfR, 2008).
In 2012, the Swedish Environmental Protection Agency published an Environmental and Health Risk Assessment of 23 PFASs including PFOS and PFOA. For the Swedish general population, the risk characterisation did not indicate any cause for concern for reproductive toxicity or hepatotoxicity. In a subpopulation that consumed contaminated fish, PFOS levels were close to being of concern. In the general population, risk characterisation ratios (RCRs) for hepatotoxicity were highest for PFOS (0.17) and PFOA (0.04) contributing in total with 77% to the cumulative RCRs. For reproductive toxicity, the highest RCR was identified for PFOS (0.14), contributing with 76% to the cumulative RCR. Additionally, for PFOS, immunotoxicity (RCR 229) and for PFOA (RCR 2.6), impaired mammary gland development, were identified as endpoints at very low doses (Swedish EPA, 2012).
In 2014, the United States Environmental Protection Agency (US EPA) selected 0.03 μg/kg bw per day as the reference dose (RfD) for PFOS based on developmental toxicity and increased liver weight in rats as the most sensitive endpoints (US EPA, 2014). For PFOA, an RfD of 0.02 μg/kg bw per day was derived based on the endpoint increased liver weight, in rats and mice (US EPA, 2014).
In 2015, the Danish Environmental Protection Agency established for PFOS a TDI of 0.03 μg/kg bw per day based on developmental toxicity and increased liver weight in rats as the most sensitive endpoints and for PFOA a TDI of 0.1 μg/kg bw per day based on increased liver weight in rats. For FOSA it was stated that no sufficient data were available for derivation of a specific TDI. However, because FOSA is the amide derivate of PFOS and a precursor of PFOS, the Danish Environmental Protection Agency concluded that it seems justifiable to apply the TDI for PFOS to FOSA as well (Danish EPA, 2015).
The Agency for Toxic Substances and Disease Registry (ATSDR), the Federal public health agency of the U.S. Department of Health and Human Services, prepared a draft Toxicological Profile for 13 PFASs including PFOS and PFOA which has been on Public comment up to the 1 December 2015. For PFOS, an intermediate‐duration oral minimum risk level of 0.03 μg/kg bw per day was established. A NOAEL for female monkeys based on increased absolute liver weight was used as the point of departure for establishing the minimum risk level. The minimum risk level was based on back‐calculation from internal doses (serum levels), as using external doses is problematic due to differences in half‐lives. A total UF of 90 was applied due to animal to human extrapolation (3), human variability (10) and lack of developmental and immunological data in monkeys (3). For PFOA, an intermediate‐duration oral minimum risk level of 0.02 μg/kg bw per day was established. The minimum risk level is based on a BMDL where a 10% relative deviation in absolute liver weight for male monkeys was used as the point of departure. A UF of 90 was applied due to animal to human extrapolation (3), human variability (10) and lack of developmental and immunological data in monkeys (3). Back‐calculation from internal doses (serum levels) was applied to establish the minimum risk level, as external doses were problematic to use because of differences in half‐lives (ATSDR, 2015).
In 2015, the Committee for Risk Assessment (RAC), established a Derived No Effect Level (DNEL) for PFOA of 800 ng/mL serum for the general population. This was based on developmental toxicity studies in mice (ECHA, 2015).
In 2016, the German Human Biomonitoring (HBM) Commission decided to set HBM I values for PFOA and PFOS in blood plasma at 2 ng/mL and 5 ng/mL, respectively. The HBM I value represents the concentration of a substance in a body matrix at and below which, adverse health effects are not expected (Bundesgesundheitsblatt Gesundheitsforschung Gesundheitsschutz, 2016; Apel et al., 2017).
In 2016, the US EPA derived an RfD for PFOS of 0.02 μg/kg bw per day based on decreased neonatal rat body weight from a two‐generation study. A pharmacokinetic model was used to calculate a human equivalent dose (HED) NOAEL. A UF of 30 was applied to the HED NOAEL, which included a UF of 10 for intrahuman variability and a UF of 3 to account for toxicodynamic differences between animals and humans. It was concluded that the weight of evidence for a carcinogenic potential of PFOS to humans was too limited to support a quantitative cancer assessment (US EPA, 2016a). For PFOA, US EPA selected in 2016 an RfD of 0.02 μg/kg bw per day based on reduced ossification and accelerated puberty effects observed in a developmental toxicity study in mice. A UF of 300 (10 for intrahuman variability, 3 to account for toxicodynamic differences between animals and human, 10 to account for use of a lowest‐observed‐adverse‐effect‐level (LOAEL) as the point of departure (POD)) was applied to the HED LOAEL. The selected RfD is supported by the other candidate RfDs based on effects on the immune system in a 15‐day short‐term study and on the kidneys of F0 and F1 males in a two‐generation study of developmental and reproductive toxicity. It was concluded that there is ‘suggestive evidence of carcinogenic potential’ for PFOA (US EPA, 2016b). The US EPA issued a lifetime drinking water Health Advisory (HA) for PFOS and PFOA of each 0.07 μg/L based on the respective RfDs. US EPA recommended to compare the sum of the concentrations of PFOS and PFOA to the HA (0.07 μg/L) when these two chemicals co‐occur at the same time and location in a drinking water source.
In 2016, the National Toxicology Program (NTP) concluded from a systematic review of immunotoxicity associated with exposure to PFOS and PFOA that these compounds present an immune hazard to humans. This conclusion was based on a high level of evidence that both PFOS and PFOA suppressed the antibody response from animal studies and a moderate level of evidence from studies in humans. Although the strongest evidence for an effect of PFOS on the immune system was for suppression of the antibody response, there was additional, although weaker evidence that is primarily from studies in experimental animals, that PFOS suppresses disease resistance and natural killer (NK) cell activity. PFOA seems to affect multiple aspects of the immune system. Thereby, strongest effects were observed for suppression of the antibody response and increased hypersensitivity. Weaker effects exist from epidemiological studies with PFOA reducing infectious disease resistance, increased hypersensitivity‐related effects, and increased autoimmune disease (NTP, 2016).
In 2016, the RIVM has derived a health‐based limit value for chronic exposure to PFOA equal to 12.5 ng/kg bw per day based on increased liver weight and hypertrophy in liver cells in rats, as the most sensitive endpoints. Blood serum concentrations in humans that are considered safe as regards the occurrence of liver effects and developmental effects were derived on the basis of toxicological data for various animal species and uncertainty factors. A blood serum concentration of 89 ng/mL blood serum was calculated as the health‐based limit value for prolonged exposure (RIVM, 2016).
In 2016, the International Agency for Research on Cancer (IARC) assessed PFOA and stated that there is limited evidence for carcinogenicity in experimental animals and moderate evidence for mechanisms of PFOA‐associated carcinogenesis, including some evidence for these mechanisms being operative in humans (IARC, 2016). The compound was assigned to group 2B as being possibly carcinogenic to humans (Group 2B).
In 2017, Food Standards Australia New Zealand (FSANZ) established for PFOS a TDI of 0.02 μg/kg bw per day, based on decreased parental and offspring body weight gains in a multigeneration reproductive toxicity study in rats. For PFOA, a TDI of 0.16 μg/kg bw per day based on a NOAEL for fetal toxicity in a developmental and reproductive study in mice was recommended. The TDIs were derived by applying pharmacokinetic modelling to the serum PFOS concentrations measured in experimental animals, to calculate HEDs. A UF of 30 was applied to the respective HEDs, which comprised a default factor of 3 to account for interspecies differences in toxicodynamics and a default factor of 10 for intraspecies differences in the human population (FSANZ, 2017).
1.3.7. Legislation
1.3.7.1. PFOS
Originally in the European Union (EU) Directive 2006/122/EC4 of the European Parliament and of the Council of 12 December 2006, restrictions were laid down on the marketing and use of PFOS for new products in the non‐food area, which applied from 27 June 2008. This Directive also stated that on‐going risk assessment activities for PFOA should be kept under review.
Subsequently, by Regulation (EC) No 552/2009,5 restrictions on the marketing and use of PFOS for new products in the non‐food area were included in Annex XVII of Regulation (EC) No 1907/2006 of the European Parliament and of the Council of 18 December 2006 concerning the Registration, Evaluation, Authorisation and Restriction of Chemicals (REACH), establishing a European Chemicals Agency, amending Directive 1999/45/EC and repealing Council Regulation (EEC) No 793/93 and Commission Regulation (EC) No 1488/94 as well as Council Directive 76/769/EEC and Commission Directives 91/155/EEC, 93/67/EEC, 93/105/EC and 2000/21/EC.6
In 2009 PFOS, its salts and perfluorooctane sulfonyl fluoride (PFOSF) was added to Annex B (Restriction) to the Stockholm Convention. During the review of PFOS, the POPs Review Committee adopted the risk management evaluation.
In accordance with Article 6 of the Stockholm Convention on environmentally sound management of waste, the technical guidelines on the environmentally sound management of wastes containing PFOS, its salts or PFOSF was developed and adopted by the Basel Convention.
The UNECE Convention on Long‐range Transboundary Air Pollution (CLRTAP) contains a Protocol on Persistent Organic Pollutants (POPs) established in 1998 and amended in 2009 where PFOS is proposed to be treated in a similar way as within the Stockholm Convention. This amendment on PFOS has however not yet come into force. The CLRTAP Protocol has so far no text on PFOA.
In 2011, Commission Regulation (EU) No 207/20117 deleted Entry 53 concerning PFOS from Annex XVII of Regulation (EC) No 1907/2006 as PFOS became regulated under Regulation (EC) No 850/20048 by means of Commission Regulation (EU) No 757/2010 of 24 August 2010.9 Currently, the production, placing on the market and use of PFOS, its salts and other derivatives is within the EU regulated under the POP Regulation. Compared to the Stockholm Convention, the numbers of exemptions are fewer in the POP regulation, as alternatives were found to be available to many of those uses.
The derogation was given for production and placing on the market for the following uses until 26 August 2015, (a) wetting agents for use in controlled electroplating systems; (b) photoresists or antireflective coatings for photolithography processes; (c) photographic coatings applied to films, papers or printing plates; (d) mist suppressants for non‐decorative hard chromium (VI) plating in closed loop systems; (e) hydraulic fluids for aviation. Today there are no remaining exemptions.
1.3.7.2. PFOA
On 14 June 2013, the Member State Committee, referred to in Article 76(1)(e) of Regulation (EC) No 1907/2006, identified PFOA as a persistent, bioaccumulative and toxic (PBT) substance, in accordance with Article 57(d) of that Regulation. On 20 June 2013, PFOA was included in the Candidate List of Substances of Very High Concern (SVHC), for possible inclusion into Annex XIV to Regulation (EC) No 1907/2006.
By means of Commission Regulation (EU) 2017/1000,10 PFOA was included in Annex XVII to Regulation (EC) No 1907/2006 of the European Parliament and of the Council concerning the Registration, Evaluation, Authorisation and Restriction of Chemicals (REACH) as regards PFOA, its salts and PFOA‐related substances. Within the scope of entry 68 of this Regulation, PFOA is included, its salts, as well as ‘Any related substance (including its salts and polymers) having a linear or branched perfluoroheptyl group with the formula C7F15– directly attached to another carbon atom, as one of the structural elements’ and ‘any related substance (including its salts and polymers) having a linear or branched perfluorooctyl group with the formula C8F17– as one of the structural elements’. The following substances are excluded from this designation:
-
–
C8F17–X, where X = F, Cl, Br.
-
–
C8F17–C(=O)OH, C8F17–C(=O)O–X′ or C8F17–CF2–X′ (where X′ = any group, including salts)
The substances within the scope of entry 68 shall not, as of 4 July 2020, be manufactured or placed on the market as substances on their own or be used in the production of, or placed on the market in, another substance, as a constituent; a mixture; an article, in a concentration equal to or above 25 ppb of PFOA including its salts, or 1,000 ppb of one or a combination of PFOA‐related substances. There are however a number of exemptions that go beyond 2020: for equipment used to manufacture semi‐conductors and latex printing inks (4 July 2022); textiles for the protection of workers from risks to their health and safety; membranes intended for use in medical textiles and filtration in water treatment, production processes and effluent treatment; plasma nano‐coatings (4 July 2023); medical devices other than implantable medical devices within the scope of Directive 93/42/EEC11 (July 2023).
2. Data and methodologies
2.1. Data
2.1.1. Occurrence in food data
2.1.1.1. Data collection and validation
Following an European Commission mandate to EFSA, a call for annual collection of chemical contaminant occurrence data in food, including PFOS and PFOA, was issued by the former EFSA Dietary and Chemical Monitoring Unit (now DATA Unit)12 in December 2010 with a closing date of 1 October of each year.13 European national authorities and similar bodies, research institutions, academia, food business operators and other stakeholders were invited to submit analytical data on PFAS in food. The data for the present assessment were provided by national authorities from Austria, Belgium, Cyprus, the Czech Republic, Germany, Denmark, Finland, France, Greece, Ireland, Italy, Malta, Norway, Slovenia, Spain and the United Kingdom (UK).
The data submission to EFSA followed the requirements of the EFSA Guidance on Standard Sample Description for Food and Feed (EFSA, 2010a); occurrence data were managed following the EFSA standard operational procedures (SOPs) on ‘Data collection and validation’ and on ‘Data analysis of food consumption and occurrence data’.
By the end of October 2016, a total of 21,411 analytical results of food and beverages on PFOS and PFOA were available in the EFSA database. Data received after that date was not included in the data set used for further evaluation for this opinion.
2.1.1.2. Data analysis
Following the EFSA SOP on ‘Data analysis of food consumption and occurrence data’ to guarantee an appropriate quality of the data used in the exposure assessment, the initial data set was carefully evaluated applying several data cleaning and validation steps. Special attention was paid to different parameters such as ‘Sampling strategy’, ‘Sampling method’, ‘Sampling year’, ‘Sampling country’, ‘Analytical methods’, ‘Reporting unit’, ‘Limit of detection’ and the codification of the different samples under FoodEx classification. The outcome of the data analysis is presented in Section 3.1.1.
In the analysis of PFOS and PFOA occurrence data, the left‐censored data (results below LOD or below limit of quantification (LOQ)) were treated by the substitution method as recommended in the ‘Principles and Methods for the Risk Assessment of Chemicals in Food’ (WHO/IPCS, 2009). The same method is indicated in the EFSA scientific report ‘Management of left‐censored data in dietary exposure assessment of chemical substances’ (EFSA, 2010b) as an option for the treatment of left‐censored data. The guidance suggests that the lower bound (LB) and upper bound (UB) approach should be used for chemicals likely to be present in food (e.g. naturally occurring contaminants, nutrients and mycotoxins). The LB is obtained by assigning a value of zero (minimum possible value) to all samples reported as lower than the LOD (< LOD) or LOQ (< LOQ). The UB is obtained by assigning the numerical value of the LOD to values reported as < LOD and LOQ to values reported as < LOQ (maximum possible value), depending on whether the LOD or LOQ is reported by the laboratory.
2.1.2. Consumption data
2.1.2.1. Food consumption data
The EFSA Comprehensive European Food Consumption Database (Comprehensive Database) provides a compilation of existing national information on food consumption at individual level. It was first built in 2010 (EFSA, 2011a; Huybrechts et al., 2011; Merten et al., 2011). Details on how the Comprehensive Database is used are published in the Guidance of EFSA (EFSA, 2011a). The latest version of the Comprehensive Database updated in 2015 contains results from a total of 51 different dietary surveys carried out in 23 different Member States covering 94,532 individuals.
Within the dietary studies, subjects are classified in different age classes as follows:
Infants: < 12 months old
Toddlers: ≥ 12 months to < 36 months old
Other children: ≥ 36 months to < 10 years old
Adolescents: ≥ 10 years to < 18 years old
Adults: ≥ 18 years to < 65 years old
Elderly: ≥ 65 years to < 75 years old
Very elderly: ≥ 75 years old
Two additional surveys provided information on specific population groups: ‘Pregnant women’ (≥ 15 years to ≤ 45 years old; Latvia) and ‘Lactating women’ (≥ 28 years to ≤ 39 years old; Greece).
For chronic exposure assessment, food consumption data were available from 44 different dietary surveys carried out in 19 different European countries. When for one particular country and age class two different dietary surveys were available, only the most recent one was used. This resulted in a total of 35 dietary surveys selected to estimate chronic dietary exposure. In Appendix A, Table A.1, these dietary surveys and the number of subjects available for the chronic exposure assessment are described.
Table A.1.
Dietary surveys used for the estimation of chronic dietary exposure to PFOS and PFOA
| Country | Survey acronym | Method | Survey period | N of days per subject | N of subjects | ||||||
|---|---|---|---|---|---|---|---|---|---|---|---|
| Infants | Toddlers | Other children | Adolescents (mean age) | Adults | Elderly | Very elderly | |||||
| Austria | ASNS ‐ Adults | 24‐h dietary recall | 2010–2012 | 2 | – | – | – | – | 308 | 67 | 25 |
| ASNS – Children | 24‐h dietary recall | 2010–2012 | 3 | – | 128 | 237 | – | – | – | ||
| Belgium | Regional Flanders | Food record | 2002–2002 | 3 | – | 36 | 625 | – | – | – | – |
| Belgium | Diet National 2004 | 24‐h dietary recall | 2004 | 2 | – | – | – | 576 (16a) | 1,292 | 511 | 704 |
| Bulgaria | NUTRICHILD | 24‐h dietary recall | 2007 | 2 | 861 | 428 | 433 | – | – | – | – |
| Cyprus | Childhealth | Food record | 2003 | 3 | – | – | – | 303 (13a) | – | – | – |
| Czech Republic | SISP04 | 24‐h dietary recall | 2003–2004 | 2 | – | – | 389 | 298 (13a) | 1,666 | – | – |
| Denmark | DANSDA 2005‐08 | Food record | 2005–2008 | 7 | – | – | 298 | 377 (13a) | 1,739 | 274 | 12 |
| Denmark | IAT 2006 07 | Food record | 2006–2007 | 7 | 826 | 917 | – | – | – | – | – |
| Finland | DIPP 2001 2009 | Food record | 2001–2009 | 3 | 500 | 500 | 750 | – | – | – | – |
| Finland | NWSSP07 08 | 48‐h dietary recall | 2007–2008 | 4 | – | – | – | 306 (13a) | – | – | – |
| Finland | FINDIET2012 | 48‐h dietary recall | 2012 | 2 | – | – | – | – | 1,295 | 413 | ‐ |
| France | INCA2 | Food record | 2007 | 7 | – | – | 482 | 973 (14a) | 2,276 | 264 | 84 |
| Germany | VELS | Food record | 2001–2002 | 6 | 159 | 348 | 293 | – | – | – | – |
| Germany | EsKiMo | Food record | 2006 | 3 | ‐ | ‐ | 835 | 393 (11a) | – | – | – |
| Germany | National Nutrition Survey II | 24‐h dietary recall | 2007 | 2 | – | – | – | 1,011 (16a) | 10,419 | 2,006 | 490 |
| Greece | Regional Crete | Food record | 2004–2005 | 3 | – | 838 | – | – | – | – | |
| Greece | DIET LACTATION GR | Food record | 2005–2007 | 3 | – | – | – | – | 65 | – | – |
| Hungary | National Repr Surv | Food record | 2003 | 3 | – | – | – | – | 1,074 | 206 | 80 |
| Ireland | NANS 2012 | Food record | 2008–2010 | 4 | – | – | – | – | 1,274 | 149 | 77 |
| Italy | INRAN SCAI 2005 06 | Food record | 2005–2006 | 3 | 16 | 36 | 193 | 247 (14a) | 2,313 | 290 | 228 |
| Latvia | EFSA TEST | 24‐h dietary recall | 2008 | 2 | – | 187 | 453 (14a) | 1,271 | – | – | |
| Latvia | FC PREGNANTWOMEN 2011 | 24‐h dietary recall | 2011 | 2 | – | – | – | – | 1,002 | – | – |
| Netherlands | VCP kids | Food record | 2006–2007 | 3 | – | 322 | 957 | – | – | – | – |
| Netherlands | VCPBasis AVL2007 2010 | 24‐h dietary recall | 2007–2010 | 2 | – | – | 447 | 1,142 (14a) | 2,057 | 173 | – |
| Netherlands | VCP‐Elderly | Food record;24‐h dietary recall | 2010–2012 | 2 | – | – | – | – | – | 289 | 450 |
| Romania | Dieta Pilot Adults | Food record | 2012 | 7 | – | – | – | – | 1,254 | 83 | 45 |
| Spain | enKid | 24‐h dietary recall | 1998–2000 | 2 | – | 17 | 156 | 209 (12a) | – | – | – |
| Spain | AESAN | Food record | 1999–2001 | 3 | – | – | – | – | 410 | – | – |
| Spain | NUT INK05 | 24‐h dietary recall | 2004–2005 | 2 | – | 399 | 651 (14a) | – | – | – | |
| Spain | AESAN FIAB | 24‐h dietary recall | 2009 | 3 | – | – | – | 86 (17a) | 981 | – | – |
| Sweden | NFA | 24‐h dietary recall | 2003 | 4 | – | – | 1473 | 1,018 (12a) | – | – | – |
| Sweden | Riksmaten 2010 | Food record | 2010–2011 | 4 | – | – | – | – | 1,430 | 295 | 72 |
| United Kingdom | NDNS‐RollingProgrammeYears1‐3 | Food record | 2008–2011 | 4 | – | 185 | 651 | 666 (14a) | 1,266 | 166 | 139 |
| United Kingdom | DNSIYC 2011 | Food record | 2011 | 4 | 1,369 | 1,314 | – | – | – | – | – |
N: number; PFOA: perfluorooctanoic acid; PFOS: perfluorooctane sulfonic acid.
Overall, the food consumption data gathered by EFSA in the Comprehensive Database are the most complete and detailed data currently available in the EU. Consumption data were collected using single or repeated 24‐ or 48‐h dietary recalls or dietary records covering from 3 to 7 days per subject. Owing to the differences in the methods used for data collection, direct country‐to‐country comparisons can be misleading.
2.1.2.2. Food classification
Consumption data were classified according to the FoodEx classification system (EFSA, 2011b). FoodEx is a food classification system developed by EFSA in 2009 with the objective of simplifying the linkage between occurrence and food consumption data when assessing the exposure to hazardous substances. It contains 20 main food categories (first level), which are further divided into subgroups having 140 items at the second level, 1,261 items at the third level and reaching about 1,800 end‐points (food names or generic food names) at the fourth level.
In 2011, a new version of FoodEx, named FoodEx2 has been developed and is described in the scientific document ‘Report on the development of a Food Classification and Description System for exposure assessment and guidance on its implementation and use’ (EFSA, 2011c). The last release of FoodEx2 complements the previous hierarchical classification system of basic codes with more detailed food levels and gives the possibility of reporting additional information through the use of facets and facet descriptors (EFSA, 2015).
2.1.3. Toxicokinetic and toxicological data
Data were obtained from the scientific literature as described in Section 2.2.2.
2.2. Methodologies
2.2.1. Dietary exposure assessment
The CONTAM Panel considered it appropriate to estimate only chronic exposure to PFOS and PFOA (see Section 3.4). As suggested by the EFSA Working Group on Food Consumption and Exposure (EFSA, 2011a), dietary surveys with only 1 day per subject were not considered as they are not adequate to assess repeated exposure. Similarly, subjects who participated only 1 day in the dietary studies, when the protocol prescribed more reporting days per individual, were also excluded for the chronic exposure assessment. Thus, for chronic exposure assessment, food consumption data were used from 35 different and most recent dietary surveys carried out in 19 different European countries present in the latest version of the Comprehensive Database (Appendix A, Table A.1). Not all countries provided consumption information for all age groups, and in some cases the same country provided more than one consumption survey. When for one particular country and age class two different dietary surveys were available, only the most recent one was used.
For calculating chronic dietary exposure to PFOS and PFOA, food consumption and body weight data at the individual level were accessed in the Comprehensive Database.
Occurrence data and consumption data were linked at the lowest (most detailed) FoodEx level possible. In addition, the different food commodities were grouped within each food category to better explain their contribution to the total dietary exposure to PFOS and PFOA (see Section 3.2.1).
The mean and the high (95th percentile) chronic dietary exposures were calculated by combining PFOS and PFOA mean occurrence values for food samples collected in different countries (pooled European occurrence data) with the average daily consumption for each food at individual level in each dietary survey and age class. Consequently, average exposures per day and body weight were obtained for all individuals. On the basis of distributions of individual exposures, the mean and 95th percentile exposures were calculated per survey and per age class. Dietary exposure was assessed using overall European LB and UB mean occurrence of PFOS and PFOA.
All analyses were performed using the SAS Statistical Software (SAS enterprise guide 5.1).
2.2.2. Literature search and appraisal of studies
EFSA outsourced an extensive literature search related to the oral toxicity of PFASs, their precursors and potential replacements, in experimental animals and humans (contract: RC/EFSA/BIOCONTAM/2012/02). The aim of the assignment was to identify and collect all relevant literature regarding PFASs, including PFOS and PFOA. The search was performed in March 2013, covering the period 2008–2013, for PFOS and PFOA. The methodology and the results are detailed in Bull et al. (2014).
The following areas were covered:
Area 1: Data on toxicokinetics (absorption, distribution, metabolism and excretion) in in vitro studies, experimental animals and humans.
Area 2: Data on toxicity in experimental animals (i.e. acute and repeat dose toxicity, immunotoxicity, developmental and reproductive toxicity, neurotoxicity, carcinogenicity and other effects.
Area 3: Data on observations in humans, including epidemiology, case reports and biomarkers of exposure and effects.
In addition to the literature search outsourced by EFSA, further literature searches were performed in June 2016 and December 2016, for the above 3 areas, in order to cover peer‐reviewed literature published between 2013 and November 2016. Further search strategies were designed to identify literature published after 2007, which covered additional areas, including, chemistry, analysis, synthesis, production, use, environmental fate, food occurrence and human exposure. An overview of the search terms is given in Appendix D (Table D.1).
Table D.1.
Search terms
| Human observations | |
| Search terms | perfluoro* OR pfos OR pfoa OR pfas OR ‘fluorotelomer alcohol’ AND ‘human health’ OR ‘adverse effect*’ OR ‘occupational case*’ OR occupational OR epidemiol* OR biomarker OR ‘biological marker’ OR poison* OR ‘incidental poison*’ OR ‘case stud*’ OR adverse OR ‘case control*’ OR ‘case report*’ OR human OR adult OR man OR woman OR men OR women OR female OR male OR child OR children OR infant OR neonate OR maternal OR cohort OR prenatal |
| Biomonitoring | |
| Search terms | perfluoro* OR pfos OR pfoa OR pfas OR ‘fluorotelomer alcohol’ AND teeth OR tooth OR skin OR bone OR sperm or semen OR tissue OR level* OR concentration* OR ‘time trend’ OR milk OR blood OR ‘whole blood’ OR serum OR plasma OR ‘breast milk’ OR biomarker OR ‘human milk’ OR ‘cord blood’ OR urine OR ‘amniotic fluid’ OR faeces OR placenta OR meconium OR hair OR nail* OR sweat OR saliva OR level* OR concentration* |
| Toxicity | |
| Search terms | perfluoro* OR pfos OR pfoa OR pfas OR ‘fluorotelomer alcohol’ AND toxicity OR toxi* OR acute OR subacute OR subchronic OR chronic OR mutagen* OR carcino* OR cardiotox* OR genotox* OR reprotox* OR nephrotox* OR neurotox* OR hepatotox* OR immune OR immuno* OR hematotox* OR haematotox* OR cytotox* OR ‘developmental tox*’ OR thyroid OR endocri* OR endocrine OR estrogen OR oestrogen OR fertility OR tumour OR tumor OR gestat* OR lactat* OR ‘DNA damage’ OR mortality OR adverse OR ‘adverse effect’ OR ‘blood lipid*’ OR ‘serum lipid*’ OR PPAR OR ‘ex vivo’ OR ‘in vitro’ OR ‘in vivo’ OR exvivo OR invitro OR invivo OR cell* OR tissue* OR rodent* OR mouse OR animal* OR rat* OR mice OR rabbit* OR dog* OR monkey* OR ‘experimental animal*’ OR ‘lab* animal*’ |
| Toxicokinetics | |
| Search terms | perfluoro* OR pfos OR pfoa OR pfas OR ‘fluorotelomer alcohol’ AND toxicokinetic* OR absorption OR distribution OR metabolism OR excretion OR ADME OR biotransformation OR pharmacokinetic* OR disposition OR fate OR transfer OR conjugat* OR hydroxylation OR ‘half‐life’ OR ‘half life’ OR PBPK OR ‘physiologically based pharmacokinetic modelling*’ OR uptake OR elimination OR urine OR bile OR faeces OR feces OR milk |
| Chemistry and analysis | |
| Search terms | perfluoro* OR pfos OR pfoa OR pfas OR ‘fluorotelomer alcohol’ AND chemistry OR analysis OR determination OR detection OR spectroscopy OR chromatography OR TLC OR GC OR GC‐MS OR HPLC OR LC‐MS OR ICP‐MS |
| Occurrence in Food | |
| Search terms | perfluoro* OR pfos OR pfoa OR pfas OR ‘fluorotelomer alcohol’ AND occurrence* OR level* OR concentration* OR amount*OR food OR beverage OR ‘drinking water’ OR ‘bottled water’ OR vegetable* OR legume* OR fruit* OR grain* OR cereal* OR poultry OR chicken OR beef OR turkey OR meat OR egg* OR milk OR seafood OR fish OR shrimp OR prawn* OR mollusc* OR feed OR feedstuff OR beef OR pork OR livestock OR bivalve* |
| Food Processing | |
| Search terms | perfluoro* OR pfos OR pfoa OR pfas OR ‘fluorotelomer alcohol’ AND process* OR cook* OR roast* OR fry* OR boil* OR bak* OR ‘thermal processing’ OR sterilisation OR sterilization OR sterilise OR sterilize OR freez* OR heat* |
| (Dietary) Exposure | |
| Search terms | perfluoro* OR pfos OR pfoa OR pfas OR ‘fluorotelomer alcohol’ AND ‘exposure assessment*’ OR ‘dietary exposure assessment*’ OR ‘human dietary exposure assessment*’ |
| (Non‐dietary) Exposure | |
| Search terms | perfluoro* OR pfos OR pfoa OR pfas OR ‘fluorotelomer alcohol’ AND ‘non‐dietary exposure assessment*’ OR ‘human non‐dietary exposure assessment*’ OR ‘exposure pathway*’ OR ‘indoor exposure’ OR ‘dermal exposure’ OR occupational OR dust OR air OR ‘in‐utero’ OR inutero OR ‘in utero’ OR skin |
| Production/Use | |
| Search terms | perfluoro* OR pfos OR pfoa OR pfas OR ‘fluorotelomer alcohol’ AND source* OR application OR use* OR production OR ‘production volume’ OR application |
| Environmental fate | |
| Search terms | perfluoro* OR pfos OR pfoa OR pfas OR ‘fluorotelomer alcohol’ AND ‘environmental fate’ OR ‘environmental monitoring’ OR soil OR biosolid OR manure OR sediment OR sewage OR sludge OR water OR ‘waste water*’ OR ‘ground water*’ OR wastewater* OR groundwater* OR river OR land OR lake OR grass OR vegetation |
Web of Science14 and PubMed15 were identified as databases appropriate for retrieving literature for the present evaluation. The references resulting from the literature search were imported and saved using a software package (EndNote16), which allows effective management of references and citations.
Reviews, relevant scientific evaluations and assessments by national or international bodies were also considered for the current risk assessment. When relevant papers were identified during the risk assessment process (e.g. from other studies or reviews), they were also considered.
The references obtained were screened using title and abstract to identify relevant literature.
The information retrieved was subsequently reviewed by the CONTAM working group (WG) on PFASs in food, and has been used for the present assessment based on expert judgement. Selection of the scientific papers for inclusion or exclusion was based on consideration of the extent to which the study was relevant to the assessment and general study quality considerations.
2.2.3. Benchmark dose analysis
Benchmark dose (BMD) modelling was used for calculation of PFOS/PFOA concentrations in plasma which could be used to derive an health‐based guidance value (HBGV). The EFSA guidance on BMD modelling of experimental animal data (EFSA Scientific Committee, 2017a) cannot be applied for epidemiological data since there are specific challenges that need additional consideration as described below. For BMD modelling, the CONTAM Panel identified a large set of possible models to fit concentration–response data for PFOS/PFOA and the potential critical effects. The best fitting model was selected and the BMD and BMDL were calculated for that model using a benchmark response (BMR) level specifically defined for each study. This is in line with what was done in a previous CONTAM Panel risk assessment for lead (EFSA CONTAM Panel, 2010) based on large human epidemiological studies.
In epidemiological data, there is greater scattering of PFOS and PFOA concentrations compared with data from controlled animal experiments. There is no group with uniform concentration and no control group without exposure due to the ubiquitous nature of these contaminants. Furthermore, due to data protection issues it is difficult to obtain individual data points. Therefore, the human data were analysed grouped as quantiles as presented in the papers or provided by the authors. The main consequences are loss of information (data are grouped at a concentration equal to the median values of each quantile), and increased uncertainty. In some papers (Steenland et al., 2009; Nelson et al., 2010; Eriksen et al., 2013), concentrations in each quantile and/or mean responses were not reported numerically, quantitative values were depicted from published graphs after magnification and numerical digitisation. Modelling was performed using the author's results adjusted for potential confounders.
Curve fitting was performed using commercial curve‐fitting software (TableCurve2D). This commercial software allows over 100 different monotonic models to be tested (including simple models such as linear, exponential, logarithmic models and more complicated models including logistic (Hill), Gompertz model, Lorentzian model or cumulative (log) normal) and compared using different statistical parameters (for goodness of fit‐ r2, DOF r2, standard error and F statistic and for curve fitting, Lorentzian minimization, least square minimization and Pearson minimization) for obtaining the best fitting curve. As the benchmark calculations are dependent on the choice of the dose–effect function (Budtz‐Jørgensen et al., 2001), in the absence of clear guidelines for the modelling of human data, this large possibility of choice in either models or statistical parameters allows a better estimate of the BMD and BMDL in epidemiological data. In addition to the examination of the statistical parameters, also a visual inspection was used to identify the best‐fitting model.
As unexposed individuals rarely exist in observational settings and given the fact that data were aggregated in quantiles, the BMR was considered as an increase relative to the lowest quantile (see Appendix B) which is in line with some results already published on benchmark dose modelling on epidemiological data (Grandjean and Budtz‐Jørgensen, 2013). However, as shown in Section 3.4.2.1, the BMD modelling of a 5% increase of serum cholesterol vs serum PFOA (median in the lowest decile) in the C8 cohort (Steenland et al., 2009) had an overall increase slightly less than 5% (Appendix B, model #6). In this cohort, the participants had much higher levels (mean 80, median 27 ng/mL) than the general populations in the US and Europe. The serum PFOA level was also relatively high in the lowest decile (median 5.5 ng/mL). A serum PFOA concentration of 1 ng/mL (half of the median of the medians in European studies, Section 3.3.2.3, Table 8) was used, as a proxy for the ‘low’ serum PFOA concentrations in European populations.
Table 8.
Summary statistics describing serum concentrations of PFOS and PFOA in European adult and children populations based on studies included in Tables 6 and 7 (2007–2015)
| Concentration in ng/mLa | |||||
|---|---|---|---|---|---|
| Adults | Children | ||||
| PFOA | PFOS | PFOA | PFOS | ||
| Statistics based on medians reported in studies included in Tables 6 and 7 | Median | 1.9 | 7.7 | 3.3 | 3.2 |
| Mean | 2.1 | 7.5 | 3.3 | 3.3 | |
| Minimum | 0.76 | 1.7 | 0.49 | 0.49 | |
| Maximum | 4.9 | 27.4 | 6.9 | 8.6 | |
| Number of studies | 32 | 32 | 8 | 8 | |
| Information based on individual samples reported in studies included in Tables 6 and 7 | Minimum individual samples | 0.03 | 0.06 | 0.45 | 0.47 |
| Maximum individual samples | 80.8 | 392.3 | 19.5 (P95) | 23.0 | |
| Country reporting maximum individual samples | France | France | Germany | Denmark | |
| Reference for maximum | Denys et al. (2014) | Denys et al. (2014) | Fromme et al. (2010) | Mørck et al. (2015) | |
P95: 95th percentile.
For studies reporting the concentrations ng/g it was assumed that 1 g = 1 mL of serum/plasma.
The BMDL was calculated as the lower limit of the 95% confidence interval of the BMD. In this software, the confidence interval is given and calculated as below:
Ŷ+/− t (MSE)1/2 (1'(X'X)−1 1)1/2
Ŷ : predicted value
t : student's t for confidence level and Degree of Freedom (DOF)
1 : coefficient partial derivative vector evaluated at xi
(X'X)−1 : inverse of design matrix
MSE : Mean Square Error = SSE/ DOF
SSE : Sum of square due to error = Σ wi (yi – ŷi)2 for i = 1 to n
with wi : weight
yi : y data value
ŷi : predicted y value
n : number of data points
The weights were based on the inverse square of the SD.
2.2.4. Physiologically based pharmacokinetic modelling
Physiologically based pharmacokinetic (PBPK) modelling was performed in order to estimate the relationships between serum concentrations of PFOA and PFOS and dietary intakes. The resultant BMDLs expressed as PFOS and PFOA levels in plasma, were converted into dietary exposure values, corresponding to life‐time continuous exposure (daily ingested dose). See Appendix C for details on the methodology used.
2.2.5. Methodology applied for risk assessment
The CONTAM Panel applied the general principles of the risk assessment process for chemicals in food as described by WHO/IPCS (2009), which include hazard identification and characterisation, exposure assessment and risk characterisation. In addition to the principles described by WHO/IPCS (2009), any EFSA guidance pertaining to risk assessment and relevant for the present assessment has been duly considered (see Appendix E).
3. Assessment
3.1. Occurrence data
3.1.1. Current occurrence data in food
An initial number of 21,411 results from food samples analysed for PFOS and PFOA from 16 European countries were available for the assessment. The major contributor of PFOS and PFOA data was Germany which reported 62% of the data, followed by Norway and France. Data were reported for samples collected between the years 2000 and 2015, with the majority of the data collected after 2007. For PFOS, 10,889 analytical results were obtained, while 10,522 analytical results were available for PFOA (Table 3). For the majority of results, PFOS data (n = 10,531) were reported without information on the isomers analysed; linear, sum of branched or both types. Only a limited number of results were reported either as linear PFOS or sum of branched PFOS (n = 179 for each). The current data were not systematically checked for possible duplicate occurrence with the data reported in Section 3.1.2. This might have resulted in a partial overlap between the data reported in the scientific literature and the data reported to EFSA and used in the current exposure assessment.
Table 3.
Analytical data for PFOS and PFOA as reported before applying exclusion criteria
| PFASsa | Acronyms | Number of samples | % LC |
|---|---|---|---|
| Perfluorooctane sulfonic acid | PFOS | 10,889 | 74 |
| Perfluorooctanoic acid | PFOA | 10,522 | 91 |
| Total | 21,411 | 83 | |
LC: left‐censored.
Includes analytical data on linear PFOS (n = 179) and branched PFOS (n = 179).
As described in Section 2.1.1, the occurrence data were carefully evaluated and a list of validation steps was applied before being used to estimate dietary exposure.
Outdated results may not reflect the current contamination. Therefore, only results from samples collected from 2007 were retained for the further assessment, and data from samples collected before that year (n = 871 (total); n = 438 for PFOS and n = 433 for PFOA) were excluded.
Close attention was paid to data reported for suspect samples.17 As inclusion of these samples may lead to an overestimation of the contamination levels, the CONTAM Panel decided to exclude them (n = 480 (total); n = 240 for both PFOS and PFOA) from further analysis. However, it should be kept in mind that some of the remaining samples may also have been collected in a more targeted way.18
The Commission Recommendation 2010/161/EC19 recommends a maximum LOQ of 1 μg/kg for the monitoring of PFASs in food. The LODs/LOQs of the PFOS and PFOA data reported to EFSA varied between laboratories, between food matrices and substances, with notably lower LODs/LOQs for drinking water while higher LODs/LOQs were frequently reported for edible offal (particularly for liver) and fish meat. Due to a high percentage of results below LOD/LOQ in combination with high LODs/LOQs, substantial differences between LB and UB scenarios were observed, increasing the uncertainty associated with the dietary exposure estimates. In order to reduce this impact, but not exclude data on foods mainly contributing to the exposure to PFOS and PFOA, an evaluation of LOQs was performed. This evaluation was based on the EFSA internal guidance on the application of LOD/LOQ cut‐offs. A special attention was paid to food categories, which are considered to be potential important contributors to the dietary exposure to PFOS and PFOA. LOQ cut‐offs were finally applied to two food categories, namely ‘Fish and fish products’ and ‘Drinking water’. To identify the most appropriate cut‐off value for these food categories, the distributions of the quantified values (values above LOQ) as well as the reported LOQ were evaluated at the appropriate FoodEx level/food category. A percentile (90th to 95th) derived from the quantified values in each respective food group was selected as the cut‐off value and subsequently applied as cut‐offs to the LOQs reported for these food categories (Appendix A, Table A.2). A value of 14 μg/kg was selected as LOQ cut‐off for the PFOS data in the category ‘Fish and fish products’, a value of 0.01 μg/kg as LOQ cut‐off for the PFOS data on ‘Drinking water’ and a value of 10 μg/kg as LOQ cut‐off for the PFOA data on ‘Fish and fish products’. Using this approach, a total of 41 data points (20 analytical results for PFOS and 21 analytical results for PFOA) were excluded. Out of these, 98% were results below LOD/LOQ. Appendix A, Table A.2 shows the effect of these cut‐offs on the occurrence values for the selected food categories. More details on distribution of LOQs for different PFOS and PFOA and across different food categories are given in Section 3.1.1.3.
Table A.2.
Use of cut‐offs for the LOQs of PFOS and PFOA and food groups and its effect on the final occurrence values
| Food category (FoodEx Level 1) | Number of results before applying cut‐off | LC % | Mean occurrence values before application of cut‐offs (µg/kg) | Cut‐off applied on LOQ | Number of results excluded | Number of results after applying cut‐off | Mean occurrence values after application of cut‐offs (µg/kg) | ||
|---|---|---|---|---|---|---|---|---|---|
| LB | UB | LB | UB | ||||||
| PFOS | |||||||||
| Fish and other seafood | 3,508 | 64 | 2.09 | 2.66 | 14.0 | 18 | 3,490 | 2.08 | 2.59 |
| Drinking water | 453 | 88 | 0.00043 | 0.0031 | 0.01 | 2 | 451 | 0.00045 | 0.0028 |
| PFOA | |||||||||
| Fish and other seafood | 3,505 | 93 | 0.19 | 0.91 | 10.0 | 21 | 3,484 | 0.18 | 0.90 |
LB: lower bound; LC: left‐censored; LOQ: limit of quantification; PFOA: perfluorooctanoic acid; PFOS: perfluorooctane sulfonic acid; UB: upper bound.
Finally, in the final data set a total of 1,392 analytical results (n = 698 results on PFOS and n = 694 results on PFOA) were excluded as described in Appendix A, Table A.3.
Table A.3.
Analytical results excluded from the final data set used to estimate dietary exposure and the criteria applied for exclusion
| Criteria for exclusion | Number of results excluded | ||
|---|---|---|---|
| PFOS | PFOA | Total | |
| Outdated data (data sampled before 2007) | 438 | 433 | 871 |
| Reported as suspect samples (not random sampling) | 240 | 240 | 480 |
| Results eliminated due to application of LOQ cut‐offs on ‘Fish and other seafood’ and ‘Drinking water’ | 20 | 21 | 41 |
| Total | 698 | 694 | 1,392 |
LOQ: limit of quantification; PFOA: perfluorooctanoic acid; PFOS: perfluorooctane sulfonic acid.
Recoveries were reported only for 49% of the PFOS data and for 50% of the PFOA data. The PFOS and PFOA analytical results were submitted to EFSA as corrected for recovery in approximately 50% of cases. 44% of results were not corrected for recovery and for 6% of the results this information was not given. For results which were reported as not corrected for recovery, but for which the recovery rates were available, the results were corrected and used for exposure assessment.
Approximately, 73% of the PFOS and 76% of the PFOA data were obtained for samples collected within official monitoring programs, 11% of the PFOS and 7.9% of the PFOA data were collected within diet studies and the remaining data within other programmes or combination of programmes. Regarding the sampling method, a small part of the analytical results (14% for PFOS and 11% for PFOA) were obtained from pooled samples meaning that the result represented an average of a number of samples taken in equal parts from different consignments/batches and pooled together for the laboratory analysis. Since the level of aggregation for pooled samples matched the level of classification of the individual samples (only similar food matrices were pooled together) results from pooled samples were retained for further evaluation. To ensure a proportionate representation of the individual samples and thus an accurate use of occurrence data in assessing the dietary exposure, the mean concentrations per food category were calculated by weighting the reported analytical results for the number of samples pooled.
All analytical results were expressed on whole weight basis, thus no conversion had to be applied.
The final validated data set available for dietary exposure assessment contained 20,019 analytical results for food samples analysed for PFOS (n = 10,191) and PFOA (n = 9,828).
The analytical results included in the final data set (n = 20,019) and considered for the estimation of dietary exposure to PFOS and PFOA, were obtained from 16 different European countries. Most of the results were from Germany (12,532 analytical results; 6,255 data for the PFOS and 6,277 data for the PFOA), followed by Norway and France (Figure 3). It is worth mentioning that the origin of the samples was not always the European country reporting the data, i.e. the data set also contained samples originating from North and South America, Africa, Asia and Australia, but they were collected in Europe. The samples were collected between 2007 and 2015 with the majority being between 2007 and 2011 (Figure 4).
Figure 3.
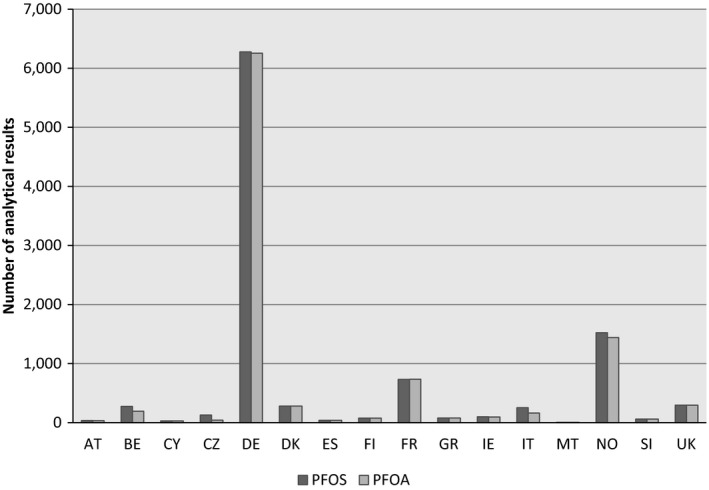
- AT: Austria; BE: Belgium; CY: Cyprus; CZ: Czech Republic; DE: Germany; DK: Denmark; ES: Spain; FI: Finland; FR: France; GR: Greece; IE: Ireland; IT: Italy; MT: Malta; NO: Norway; SI: Slovenia; UK: United Kingdom; PFOA: perfluorooctanoic acid; PFOS: perfluorooctane sulfonic acid.
Figure 4.
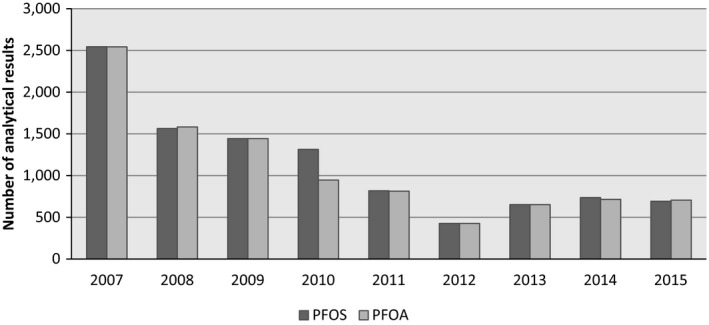
- PFOA: perfluorooctanoic acid; PFOS: perfluorooctane sulfonic acid.
Figure 5 illustrates the number of analytical results divided in quantified results and left‐censored data (results below LOD/LOQ) per substance and food category at FoodEx Level 1.
Figure 5.
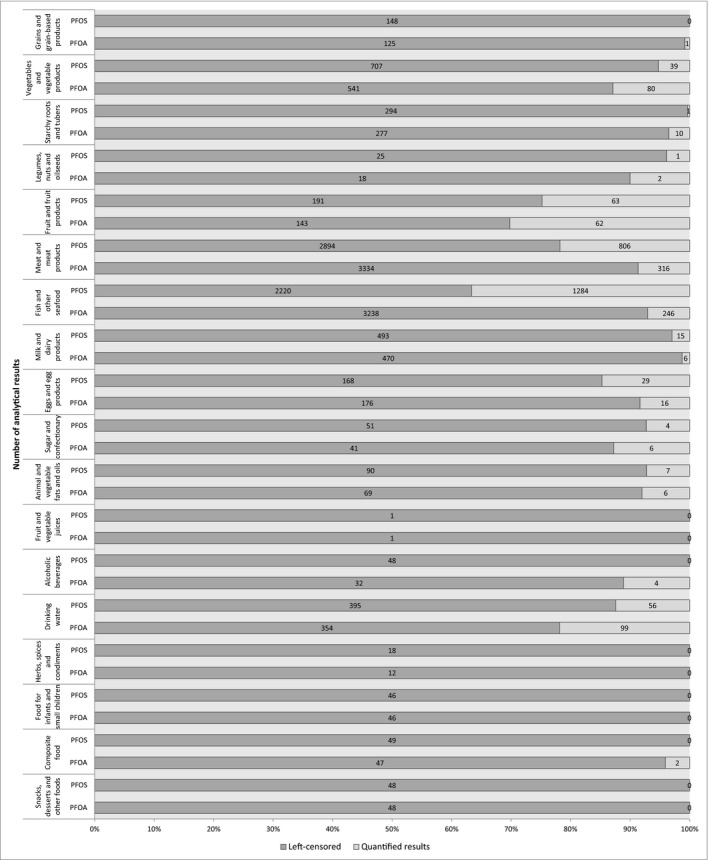
Distribution of analytical results divided in quantified results and left‐censored data (results below the limit of detection (LOD)/limit of quantification (LOQ)) per substance and food category at FoodEx Level 1
The most frequently analysed food categories were ‘Meat and meat products including edible offal’ (n = 3,700 for PFOS, n = 3,650 for PFOA) and ‘Fish and other seafood’ (n = 3,504 for PFOS, n = 3,484 for PFOA). A substantial number of data was also available for the food categories ‘Vegetable and vegetable products’, ‘Milk and dairy products’ and ‘Drinking water’. Other food categories were less represented. The data set was characterised by a high proportion of left‐censored data, with more than 80% of left‐censored data for all food categories except ‘Fish and other seafood’ (63% of left‐censored data for PFOS), ‘Fruit and fruit products’ (75% and 70% of left‐censored data for PFOS and PFOA, respectively) and ‘Meat and meat products’ (78% of left‐censored data for PFOS) (Figure 5).
3.1.1.1. PFOS
PFOS occurrence data were available for 18 FoodEx level 1 food categories (Figure 5). The concentrations of linear and branched isomers (n = 179 for each) reported for the same samples were summed and added to the PFOS occurrence data set for exposure assessment. Therefore, the final data set for PFOS available for the exposure assessment comprised a total of 10,012 analytical results. An overview of the number of data points available for the exposure assessment, the percentage of results below LOD/LOQ, the mean and 95th percentile concentrations for PFOS, are presented in Appendix A, Table A.4 (excel file – under ‘Supporting information’ Section on the web page).
The highest number of available data points correspond to the food category ‘Meat and meat products’ (n = 3,677), in particular to ‘Edible offal, farmed animals’, and to the food category ‘Fish and other seafood’ (n = 3,497), in particular to ‘Fish meat’. Other well‐represented food categories were ‘Vegetables and vegetable products’ (n = 684), ‘Milk and dairy products’ (n = 492) and ‘Drinking water’ (n = 451).20 The highest mean PFOS concentration was obtained for the food category ‘Meat and meat products’ (LB mean = 28.6 μg/kg; UB mean = 29.1 μg/kg), followed by ‘Fish and other seafood’ food category (LB mean = 2.08 μg/kg; UB mean = 2.59 μg/kg).
In the food category ‘Meat and meat products’, quantified values were found in a number of food categories at FoodEx level 2: in livestock meat, in poultry, game mammals, edible offal of farmed animals, edible offal of game mammals, preserved meat and sausages. The levels were particularly high for liver samples of game mammals (LB/UB mean = 215/215 μg/kg; quantified results ranged from 0.002 μg/kg to 3.480 μg/kg) with only 3% of results below LOD/LOQ. In total, 96% of the quantified results were on wild boar liver and therefore, the mean concentration for the food category ‘liver of game mammals’ was strongly influenced by the results obtained on the wild boar liver samples. It is important to mention, that with exception of three results, all data on liver of game mammals were reported by one country (Germany). However, those results were obtained in nine different laboratories and samples were collected each year between 2007 and 2015. Excluding offal (for both game and farmed animals), the mean concentration in the category ‘meat and meat products’ was LB/UB = 0.55/0.75. A possible explanation for such high PFOS concentrations found in wild boar liver is given in Sections 1.3.5 and 3.1.2. Regarding other types of meat, elevated levels were also observed for pork liver and mutton/lamb liver. This can be explained by high bioaccumulation of PFOS in animal liver, which may be considered as the main target organ (Cui et al., 2009; Müeller et al., 2011; Vestergren et al., 2013).
In the food category ‘Fish and other seafood’, PFOS was quantified in all food categories at FoodEx level 2 (with exception of fish products with only one result available), including fish and seafood, unspecified, fish meat, fish offal, crustaceans and water molluscs. The highest PFOS concentrations were measured in fish offal (LB mean = 4.51 μg/kg; UB mean = 5.05 μg/kg), followed by fish meat (LB mean = 2.24 μg/kg; UB mean = 2.77 μg/kg). Within the food category ‘fish meat’, the highest mean concentrations were observed for babel, perch, anchovy, roach, bream and carp.
In the food category ‘Milk and dairy products’, the quantified results represented only 2% of the samples analysed. The mean concentrations ranged from 0.003 μg/kg (LB mean) to 0.21 μg/kg (UB mean). In the food category ‘Eggs and egg products’, 12% of the analytical results were above LOD/LOQ (LB mean = 0.26 μg/kg; UB mean = 0.51 μg/kg).
Across foods of plant origin, PFOS was found in root vegetables, bulb vegetables, fruiting vegetables, brassica vegetables, leaf vegetables and fungi, with the highest mean concentrations measured in wild edible fungi (LB mean = 0.90 μg/kg; UB mean = 1.11 μg/kg).
For the category ‘Drinking water’, PFOS was found above LOD/LOQ in 12% of the analytical results, with the mean concentration ranging from 0.0004 μg/kg (LB mean) to 0.003 μg/kg (UB mean).
For the seven food categories, ‘Grains and grain‐based products’, ‘Fruit and vegetable juices’, ‘Alcoholic beverages’, ‘Herbs, spices and condiments’, ‘Food for infants and small children’, ‘Composite food’ and ‘Snacks, desserts and other foods’, PFOS was not detected or quantified in any of the samples.
3.1.1.2. PFOA
PFOA occurrence data were available for 18 FoodEx level 1 food categories (Figure 5). The PFOA concentrations were much lower than those measured for PFOS, in particular for ‘Meat and meat products’ and ‘Fish and other seafood’. This is supported by studies finding that the bioaccumulation of PFOA is generally lower than for PFOS (Conder et al., 2008; Cui et al., 2009). On the other hand, it is important to note, that quantified results were found for PFOA in a few samples of some food categories (i.e. ‘Grains and grain‐based products’, ‘Alcoholic beverages’, ‘Herbs, spices and condiments’ and ‘Composite food’), for which PFOS was not detected or quantified in any of the samples. An overview of the number of data points available for exposure assessment, the percentage of results below LOD/LOQ, the mean and 95th percentile concentrations of PFOA are presented in Appendix A, Table A.5 (excel file ‐ under ‘Supporting information’ Section on the web page).
‘Meat and meat products’ (n = 3,650) was the most frequently analysed food category. Considering Foodex Level 2 food categories, the highest proportion of quantified values (41%) and the highest concentrations were found in ‘Edible offal, game mammals’ with a mean PFOA concentration of 5.53/8.18 μg/kg (LB/UB). With the exception of one result, all quantified results in this food category were from liver of game mammals (LB mean = 5.46 μg/kg; UB mean = 8.11 μg/kg; quantified results ranged from 1.1 μg/kg to 789 μg/kg), with as many as 97% of the samples being wild boar liver. Therefore, the mean concentration of ‘liver of game mammals’ was highly influenced by the results for the wild boar liver samples. With the exception of three results, all data on liver of game mammals were reported by one country (Germany). The analyses were performed by nine different laboratories and the samples were collected each year between 2007 and 2015. A possible explanation to such high PFOA concentrations found in wild boar liver is given in Sections 1.3.5 and 3.1.2. In comparison to wild boar liver data, PFOA concentrations found in the ‘Edible offal, farmed animals’ were much lower (LB mean = 0.05 μg/kg; UB mean = 1.39 μg/kg) and comprised only 3% of quantified results. Excluding offal (for both game and farmed animals), the mean concentration in the category ‘meat and meat products’ was LB/UB = 0.10/0.34 for PFOA. Quantified results were obtained also for a few samples of livestock meat, poultry, game mammals, and pastes, pâtés and terrines, generally with low PFOA concentration reported.
In the food category ‘Fish and other seafood’ (n = 3,484), a mean concentration of 0.22 μg/kg/0.88 μg/kg (LB/UB), was found for fish meat with 6% of the samples having quantified values; the highest mean concentrations were observed for carp, mackerel and whitefish. Similar concentrations were measured in crustaceans (LB mean = 0.14 μg/kg; UB mean = 0.97 μg/kg), but the proportion of quantified results was higher (24%). PFOA was found in 7% of water molluscs with a mean concentration ranging from LB mean of 0.03 μg/kg to UB mean of 0.57 μg/kg.
Within the food category ‘Milk and dairy products’ (n = 476), PFOA was reported to be above LOD/LOQ in 6 of the 476 analytical results (mainly cow milk and Gouda cheese) and the mean concentration was 0.02 μg/kg/0.21 μg/kg for (LB/UB). In food category ‘Eggs and egg products’, PFOA was found in 8% of the samples (LB mean = 0.11 μg/kg; UB mean = 0.40 μg/kg). In the category ‘Drinking water’, PFOA was quantified in 22% of samples analysed, with a mean concentration of 0.009/0.01 μg/kg (LB/UB).
PFOA was quantified in 13% of the samples reported in the food category ‘Vegetables and vegetable products’ (n = 621), and these samples were mainly carrots, lettuce and spinach. The PFOA concentrations were rather low (LB mean = 0.006 μg/kg; UB mean = 0.21 μg/kg). Out of 205 samples available for the food category ‘Fruit and fruit products’, PFOA was quantified in 30% of the samples, mainly for apples and oranges. The mean PFOA concentration in this food category was 0.005/0.30 μg/kg (LB/UB).
In the following food categories, only a very limited number of quantified results was reported: ‘Grains and grain‐based products’, two wheat and one oat sample (up to 0.03 μg/kg), ‘Legumes, nuts and oilseeds’, one pea and one bean sample (up to 0.03 μg/kg), ‘Starchy roots and tubers’, two potato samples (up to 1.03 μg/kg), ‘Herbs, spices and condiments’, one herb sample (3.00 μg/kg), ‘Sugar and confectionery’, four honey samples (up to 0.47 μg/kg), ‘Animal and vegetable fats and oils’, one butter sample and one margarine sample (0.02 μg/kg for both), ‘Alcoholic beverages’, one beer sample (0.05 μg/kg) and ‘Composite food’, one sample of prepared salad (0.01 μg/kg).
For the three food categories, ‘Fruit and vegetable juices’, ‘Food for infants and small children’, and ‘Snacks, desserts and other foods’, PFOA was not detected or quantified in any of the samples.
3.1.1.3. Analytical methods used to generate the current occurrence data
In cases where classification of the analytical method used for determination of PFOS and PFOA in food was reported by the European Countries, most results were obtained by LC–MS/MS based methods (88%). Very few (< 1%) results were reported as obtained using gas chromatography (GC) based methods. For the remaining data (12%), no information on analytical methods was reported.
LODs/LOQs were reported for 99% of the final data set, and varied between substances, the method used, the food matrix and the laboratory. In the Commission Recommendation 2010/161/EC, a LOQ below 1 μg/kg is recommended for monitoring of PFASs in food. As described above, some very few results using analytical methods with particularly high LOD/LOQ were not included in the final data set. In the final data set, 72% of the LOQs for PFOS and 67% of the LOQs for PFOA were ≤ 1 μg/kg. The highest sensitivity (median LOQ = 0.2 μg/kg for PFOS and median LOQ = 0.4 μg/kg for PFOA) was observed for results from GC based methods. For samples analysed by LC‐MS/MS based methods, the median LOQ was 1.0 μg/kg, both for PFOS and PFOA.
Across food categories, LOQs > 1 μg/kg were mainly observed in the food categories ‘Meat and meat products’ (particularly for offal) ‘Fish and other seafood, Fruit and fruit products’, ‘Grains and grain‐based products’ and ‘animal and vegetable fats and oils’. On the other hand, for ‘Drinking water’, the LOQs were very low (all below 0.50 μg/kg).
The distribution of the LOQs across Foodex Level 1 food categories is illustrated in Figure 6.
Figure 6.
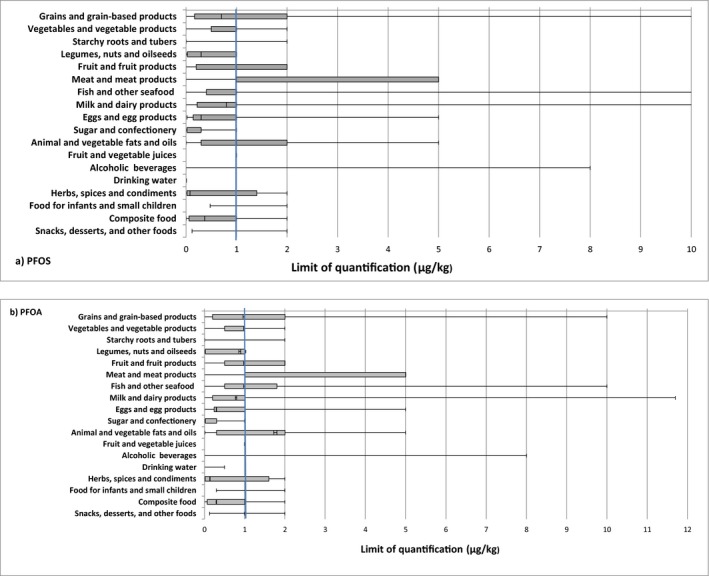
Distribution of the LOQs for PFOS (a) and PFOA (b) across food categories after applying the LOQ cut‐offs (box‐plot showing whiskers at minimum and maximum, box at P25 and P75 with line at P50)
3.1.2. Comparison of previous and current occurrence
There is a vast amount of data in the public domain on the occurrence of PFASs in foods and drinks from various regions around the world or from multi‐national studies. The literature data were not systematically checked for possible duplicate occurrence in the data sets in Section 3.1.1. This might have resulted in a partial overlap between the data reported in the scientific literature and the data reported to EFSA and used in the current exposure assessment. But most of these data are in line with ranges reported in Section 3.1.1 and supports the calculations that have been made using data submitted to EFSA from European Countries. Some of the data reported are generated from samples associated with potential contamination sources, and in these cases, reported concentrations are often higher.
Levels of PFASs in foods were recently reviewed by Vestergren and Cousins (2013).
Many different fish species from different global regions have been analysed for PFASs meaning that fish is probably the best studied of all food types in terms of this contaminant group. This is because several PFASs are present in fish at higher concentrations than in other food groups and because they are also useful as a marker of environmental quality resulting in their use as environmental indicators. PFOS is usually the PFAS that is present at the highest concentration in fish and shellfish (Hoff et al., 2003; Kannan et al., 2005; Gulkowska et al., 2006; Furdui et al., 2007; Tittlemier et al., 2007; Bossi et al., 2008; Ericson et al., 2008; Berger et al., 2009; Del Gobbo et al., 2008; Nania et al., 2009; Ostertag et al., 2009; Hölzer et al., 2011) with concentrations ranging typically from < 0.5 to 23 μg/kg where there is no apparent contamination incident. Lean predatory fish usually have the highest concentrations of PFOS (Bossi et al., 2008; Berger et al., 2009; van Leeuwen et al., 2009) and the trophic level of the species has a strong influence on the concentrations found (see also Section 1.3.5). Farmed fish and shellfish samples usually have lower concentrations of PFOS when compared to wild fish (van Leeuwen et al., 2009), and water contamination and industrial release usually accounts for increased levels of contamination (Berger et al., 2009). Concentrations of PFOS exceeding 100 μg/kg have been reported from some areas with known local pollution sources (Hoff et al., 2003; Kannan et al., 2005; Hölzer et al., 2011; Hrádková et al., 2012). PFOA is found at consistently lower levels in fish, typically between < 0.1 and 0.25 μg/kg, and as a result of this a large proportion of the data reported is left‐censored, i.e. below reporting limits (LODs/LOQs). Data on temporal trends, geographical and species variation are sparse, with most data in mussels and fish and shellfish sampled from near firefighting training sites (Hoff et al., 2003).
PFASs have been measured in food items purchased from several outlets in several studies (3M Company, 2001; Food Standards Agency, 2006; Tittlemier et al., 2007; Ericson et al., 2008; Ericson‐Jogsten et al., 2009; Clarke et al., 2010; Schecter et al., 2010), but many of these studies did not have adequate sensitivity. Such studies used market basket surveys and were from the US (3M Company, 2001; Schecter et al., 2010), Canada (Tittlemier et al., 2007), the UK (Food Standards Agency, 2006; Clarke et al., 2010) and Spain (Ericson et al., 2008; Ericson‐Jogsten et al., 2009). Most data for US foods were left‐censored with reporting limits of 0.02–0.5 μg/kg depending on the compound and food type, but the highest reported levels were for PFOA in butter (1.07 μg/kg), olive oil (1.80 μg/kg), apples (2.35 μg/kg) and PFOS in milk (0.85 μg/kg). PFOA was found in meat and fish products at levels between < 0.02 and 0.3 μg/kg (Schecter et al., 2010). A study of Canadian foods found high levels of PFOA in microwave popcorn (3.6 μg/kg) and roast beef (2.6 μg/kg), and PFOS was found at high concentrations in beef steak (2.7 μg/kg) and saltwater fish (2.6 μg/kg) (Tittlemier et al., 2007). In the UK, a total diet survey reported high levels of PFOS at 10 μg/kg and PFOA at 1 μg/kg in a composite sample consisting of potato based products (Food Standards Agency, 2006). Food of animal origin was the primary source of PFOS in samples from Spain with concentrations ranging from < 0.03–0.654 μg/kg (Ericson et al., 2008; Ericson‐Jogsten et al., 2009). PFOA was only found in milk (0.056 μg/kg) and lettuce (0.164–0.179 μg/kg). In a duplicate diet study from Germany, PFOS and PFOA were measured in 70 and 97 out of 214 samples. Mean concentrations of PFOS and PFOA were 0.06 and 0.69 μg/kg, respectively (Fromme et al., 2007). However, it was later found that the analysis of these samples was influenced by matrix effects, and re‐analysis of the duplicate diet samples using improved methodology, indicated that dietary intake of PFOA and PFOS was overestimated (Vestergren et al., 2012).
Kärrman et al. (2009) reported PFOS (0.008–0.087 μg/kg) and PFOA (0.008–0.040 μg/kg) in 20 duplicate diet samples from Japan.
Advances in analytical technology have meant that recent studies are able to achieve better detection limits and therefore studies using them contain fewer left censored data (Haug et al., 2010a; Lacina et al., 2011; Noorlander et al., 2011; Vestergren et al., 2012). In these studies, despite different countries of origin and sampling strategies, the reported concentrations for PFASs show a similar profile with respect to contamination with PFASs. Fish had higher concentrations of PFOS (0.013–5.400 μg/kg) compared with other food types. This was followed by meat, meat products and chicken eggs which had concentrations of PFOS in the range 0.013–1.281 μg/kg – although there were some anomalies, such as a pooled Swedish egg sample that contained an unusually large amount of PFOS. PFOA has similar concentrations in food samples of both vegetable and animal origin (< 0.003–0.102 μg/kg), whereas PFOS is generally higher in foods of animal origin. These differences in homologue patterns may result from different pollution sources, or could derive from different uptake and elimination pathways in terrestrial and aquatic food webs (see Section 1.3.5).
Most of the studies above focus on widely consumed staple food samples that constitute the bulk of the diet, but there are a few studies reported that have included food that has at some point been in contact with greaseproof packaging materials. For example, high concentrations of PFOA (3.6 μg/kg) have been reported in microwave popcorn.
Vestergren et al. (2012) investigated changes in concentration of PFASs over time using archived market basket surveys. Little change was seen for PFASs in most food categories between the years 1999, 2005 and 2010. Egg‐, meat‐, dairy‐ and potato‐based samples, however, did show some differences. Egg samples from 1999, were found to contain between 30 and 100 times more PFOS (1.281 μg/kg) than in eggs taken in the following years. The meat sample also contained decreasing concentrations of PFOS over the sampling period. Conversely, increasing concentrations of PFOA were found in the dairy and potato samples.
Johansson et al. (2014) also reported temporal trends in dietary exposure to PFASs. Archived samples of eggs, milk and farmed rainbow trout collected between 1999 and 2010, which covered a period when major production changes occurred, were assessed. The results showed significantly decreasing concentrations of PFOS in fish (p < 0.002) and eggs (p < 0.001). Concentrations of PFOS in fish and eggs decreased by a factor of 10 and 40, respectively. In eggs there was also a statistically significant decreasing trend for PFOA.
The consistency between the current occurrence data of PFOS and PFOA as submitted to EFSA (Section 3.1.1) and the occurrence data reported in the literature was evaluated. Since much of the literature data did not provide the mean concentration (LB and UB) required for an accurate comparison, the evaluation should be considered as indicative.
A vast majority of the PFOS and PFOA data reported to EFSA were on fish meat confirming that fish is probably the best studied food source of PFASs. The PFOS data had more samples that were not left censored and had higher concentrations measured, as compared to PFOA (mean LB–UB = 2.2–2.8 μg/kg, max UB = 211 μg/kg for PFOS; mean LB–UB = 0.2–0.9 μg/kg, max = 35.5 μg/kg for PFOA). The literature data showed similar findings and the concentration ranges reported in the literature were in line with the mean concentrations reported to EFSA.
PFOS and PFOA levels for milk and eggs submitted to EFSA are consistent to those reported in the literature, while for other foods of animal origin an accurate comparison was not possible due to limited information (e.g. information on meat type missing). The consistency was observed also for lettuce, while for other foods of vegetable origin (e.g. olive oil, apple, potatoes, etc.), PFAS levels reported to EFSA were at the mean lower than those reported in the literature.
In a study by Stahl et al. (2012), high concentrations of PFOS, and to some extent also PFOA, were found in liver and muscle from wild boars collected in Hesse, Germany. Almost all of the more than 500 animals were below 2 years of age. The mean concentration of PFOS in liver and muscle (wet weight) was reported to be 117 ng/g (median 49 ng/g; max. 1,780 ng/g) and 1.38 ng/g (max 28.6 ng/g), respectively, and the corresponding concentrations of PFOA were reported to be 4.02 ng/g (max 45 ng/g) and < 0.1 ng/g (max 7.4 ng/g), respectively. It should be noted that the range of PFOS in liver was very wide, ranging from < 0.5 ng/g to 1,780 ng/g despite the relatively homogeneous character of the samples. Stahl et al. (2012) reported that these levels are in agreement with previous studies of wild boars reported in only locally available bulletins. Considering the wide range of PFAS concentrations in livers, despite the small variation in age, the explanation to the high concentrations is likely to be found in their intake of contaminated material. Wild boars are omnivorous and in order to find their food they generally root in the soil. This and other aspects of feeding behaviour, including access to dumpsites that often contain municipal waste with household waste that could attract groups of wild boars, may influence exposure for wild boar. Consequently, there is an obvious risk that boars feeding at dumpsites and other contaminated sites could be exposed to high levels of PFOS and other environmental contaminants. These findings were in line (within the same order of magnitude) with those found in a study reported in conference proceedings by Brambilla et al. (2016). Thus, environmental sources can be an important consideration especially for PFOS and PFOA in meat tissues from wild animals (see Section 1.3.5).
3.1.3. Food processing
3.1.3.1. Migration from food contact materials, including non‐stick coatings used on cookware
Domingo (2012) conducted a review of work done up until the date of the review. Polytetrafluoroethene (PTFE) cookware was found to contain only residual PFOA in the low μg/kg range, but PFOA was found in the bag paper from microwave popcorn at concentrations up to 300 μg/kg (Begley et al., 2005). Analysis of PFOA in tubing made from fluorinated ethylene‐propene (FEP) copolymer, in sealants made from PTFE film, and in cookware that had been coated with PTFE, together with migration experiments conducted using PTFE film, suggested that fluoropolymer food contact materials were not likely to be a major source of PFASs. Heating of the cookware to temperatures greater than those likely to be reached during normal domestic practise, did not increase the amount of PFOA available for migration. PFCAs, particularly PFOA, and fluorotelomer alcohols (FTOHs) were released from coated cookware at normal cooking temperatures (179–233°C surface temperature), and therefore have the potential to migrate into food during the cooking process. PFOA was found to volatilise and was present in the gas phase at concentrations ranging from 7 to 337 ng per pan (11–503 pg/cm2) in the four brands of non‐stick frying pans tested (Sinclair et al., 2007). Fluorotelomers 6:2 FTOH and 8:2 FTOH were also found. On repeat use, there was a clear decrease for the telomeres but results were inconsistent for PFOA; one pan showing a decrease and the other no change. The vapour within a prepacked microwave popcorn bag contained PFOA at 5–34 μg/kg, but no detectable amounts were found to have volatilised from plain white corn kernels that had been ‘popped’ in a container made from polypropylene. On the surface of the packaging from one brand of microwave popcorn, several PFCAs and FTOHs were found at concentrations ranging from 0.5 to 6.0 ng/cm2, suggesting that manufacture of the non‐stick coating did not completely remove residual PFOA.
Still et al. (2013) investigated the mass balance of PFASs as a result of industrial production and packaging processes in butter production, and found that phase separation processes could affect concentrations of PFASs in lipophilic and aqueous phases. Storage of butter in packaging coated with a fluorinated polymer increased butter levels of both PFCAs, PFSAs and FTOH.
In summary, there are only a limited number of studies reported about transfer of PFASs used in coating products on cookware. These studies demonstrate that the use of these materials is a potential additional source of contamination that can lead to an increase in exposure to PFASs, although the additional contribution is likely to be small compared with other sources. Occurrence data and exposure estimated based on raw food products will not take this into account, and so will have an impact of reducing overall exposure estimates.
3.1.3.2. Effect of cooking not related to coatings on cookware
Del Gobbo et al. (2008) measured differences in the levels of 17 different PFASs in 18 fish species as a result of cooking (baking, boiling and frying). It was reported that all cooking processes investigated, led to a reduction in PFCAs with baking producing the largest effect; after baking samples for 15 min at 163°C, PFCAs were not detected in any of the samples.
In a review on the effect of cooking on various metals and organic contaminants in foodstuffs, Domingo (2011) found that it was the cooking process that had the greatest impact rather than the food type that was being cooked. Different cooking methods could either reduce or increase the levels of chemical contaminants in food. Although it was reported that cooking procedures whereby fat is released or removed from the product should tend to reduce the total concentrations of organic contaminants, this was not necessarily the case for PFASs since they are not as lipophilic as some other organic contaminants.
Xiao et al. (2012) reported that human exposure to PFOS could result from the sorption of PFOS from contaminated water to food during food preparation (boiling in water), and the effect was enhanced when table salt was used.
Bhavsar et al. (2014) reported that although concentrations of PFOS in fish fillets generally increased during cooking, total amounts of PFOS largely remain unchanged; this was said to be due to the concentration effect that occurs during weight loss as a result of the cooking process. Relatively minor changes after cooking varied according to fish species and cooking method. Vassiliadou et al. (2015) found that the concentrations of the detected PFASs in fish were in most cases higher after frying or grilling, the amount of the increase being consistent with weight loss due to water evaporation.
Lyu et al. (2015) showed that the PFOS degraded at a faster rate with increased boiling times, but was slower with a higher hydronium level or with oxygenation.
In summary, the literature above covers the few papers describing the impact of cooking on PFASs in foods. This limited number of studies gives an inconsistent view about whether or not losses or increases occur.
3.2. Dietary exposure assessment
3.2.1. Current exposure assessment
The CONTAM Panel assessed the chronic dietary exposure (following the methodology described in Section 2.2.1) to PFOS and PFOA.
Prior to linking occurrence and consumption data, some adjustments were carried out on both data sets to obtain as accurate exposure estimates, as possible. First, consumption data were grouped according to the same food categories as described for the occurrence data (food categories as used to estimate chronic dietary exposure; see Appendix A, Tables A.6 and A.7 as excel files – under ‘Supporting information’ Section on the web page).
When no occurrence data were available or all occurrence data within a composite food were left‐censored, the mean concentration of the main ingredient adjusted by a factor corresponding to the part of the portion within the meal was applied. For food category ‘Fish and seafood based meals’ where no/or no adequate occurrence data were available, it was assumed that fish meat represents 70% of the composite meal and the mean concentration of ‘fish meat’ adjusted by a factor of 0.7 was used. ‘Meat‐based meals’ and ‘Egg‐based meals’ were treated as follows: the mean concentration of ‘livestock meat’ and ‘poultry’ adjusted by a factor of 0.5 and ‘eggs, fresh’ adjusted by a factor of 1.0, were used, respectively. For simplification and consistency, the exposure resulting from composite food was added to the food category of the main contributor: ‘Fish and seafood based meals’ to ‘Fish and other seafood’, ‘Meat‐based meals’ to ‘Meat and meat products’, and ‘Egg‐based meals’ to ‘Eggs and egg products’.
Some food categories were considered not suitable for use in the exposure calculation due to either a very low number of samples (< 6 analytical results) (including some citrus and stone fruits, melons and green beans for both PFOS and PFOA and for PFOA only table grapes, peas, sweet corn, fennel, oats, herbs, margarine), or by all data left‐censored consisting of the Foodex 1 categories indicated in Sections 3.1.1.1 and 3.1.1.2. In addition, for the other Foodex 1 categories, many of the subcategories contained all left censored data, i.e. for PFOS, food groups (with > 20 analytical results), included cow milk yoghurt, turkey meat, fish oil, potatoes, tomatoes and asparagus. For PFOA, such food groups included cow milk yoghurt, sheep milk, cooked sausage, mutton, lamb and chicken meat, fish oil, potatoes and French fries, beer pastries and cakes (see Appendix A, Tables A.4 and A.5 as excel files – under ‘Supporting information’ Section on the web page).
Overall, it should be kept in mind that a high proportion of left‐censored data has a major impact on the exposure estimates; the exposure is likely to be underestimated with the lower‐bound approach whereas it may be even highly overestimated with the UB approach.
The contribution (%) of each food category to the overall mean exposure of individual PFASs was calculated for each age group and dietary survey. Estimations of exposure using the LB approach, which is considered to be less influenced by results below LOD/LOQ, were used to explain the contribution of the different food categories.
3.2.1.1. PFOS
Table 4 shows summary statistics of the estimated chronic dietary exposure to PFOS using the available consumption and occurrence data. Detailed mean and 95th percentile dietary exposure estimates for each of the 35 dietary surveys are presented in Appendix A, Table A.8 (excel file – under ‘Supporting information’ Section on the web page).
Table 4.
Summary statistics of estimated chronic dietary exposure to PFOS (ng/kg bw per day) across European countries
| Age group | Minimum | Median | Maximum | |||
|---|---|---|---|---|---|---|
| LB | UB | LB | UB | LB | UB | |
| Mean dietary exposure in total population (ng/kg bw per day) | ||||||
| Infants | 0.25 | 1.77 | 0.39 | 2.25 | 1.23 | 5.71 |
| Toddlers | 0.45 | 3.48 | 0.75 | 7.52 | 2.36 | 12.0 |
| Other children | 0.44 | 2.51 | 0.83 | 4.41 | 2.98 | 7.85 |
| Adolescents | 0.18 | 1.27 | 0.45 | 2.79 | 1.59 | 4.71 |
| Adults | 0.29 | 1.07 | 0.61 | 1.96 | 1.93 | 4.08 |
| Elderly | 0.46 | 1.34 | 0.61 | 1.98 | 1.81 | 3.22 |
| Very elderly | 0.33 | 1.52 | 0.65 | 1.92 | 1.05 | 2.45 |
| 95th percentile dietary exposure in total population (ng/kg bw per day) | ||||||
| Infantsa | 0.90 | 5.15 | 1.19 | 6.37 | 4.34 | 14.0 |
| Toddlersa | 1.26 | 10.2 | 2.09 | 14.0 | 4.10 | 17.5 |
| Other children | 1.12 | 6.32 | 2.43 | 9.44 | 23.7 | 26.9 |
| Adolescents | 0.50 | 3.14 | 1.39 | 5.63 | 10.9 | 12.9 |
| Adults | 0.99 | 3.36 | 1.95 | 4.55 | 11.6 | 12.7 |
| Elderly | 1.41 | 3.53 | 1.94 | 4.23 | 9.49 | 10.8 |
| Very elderlya | 1.16 | 3.35 | 1.83 | 3.75 | 3.70 | 5.20 |
bw: body weight; LB: lower bound; UB: upper bound.
The 95th percentile estimates obtained from dietary surveys/age classes with less than 60 observations may not be statistically robust (EFSA, 2011b) and have therefore not been included in this table.
The highest chronic dietary exposure to PFOS was estimated for the youngest population groups. Concerning the mean estimated dietary exposure, the highest LB estimates were obtained for other children with a maximum exposure of 2.98 ng/kg bw per day, while the UB maximum exposure was observed for toddlers (12.0 ng/kg bw per day). The highest 95th percentile estimates were observed for other children with LB and UB estimates of 23.7 and 26.9 ng/kg bw per day, respectively. High maximum 95th percentile LB and UB exposure estimates were observed also for adolescents and adult populations due to high consumption of fish and fish products reported by a group of high consumers in three dietary surveys.
The dietary exposure estimates obtained for specific groups of the population, namely ‘Pregnant women’ and ‘Lactating women’, were within the range of exposure estimates in adult populations (see Appendix A, Table A.9 as excel file – under ‘Supporting information’ Section on the web page).
The contribution of individual food categories to the total LB mean chronic dietary exposure for PFOS varied between the dietary surveys. This is explained by the specific food consumption patterns in different European countries and even in different regions of one country. Relative contributions of the different food categories to the total estimated intakes, grouped by age classes, are shown in Appendix A, Table A.9 excel file – under ‘Supporting information’ Section on the web page).
Overall, the main contributors to the LB mean chronic dietary exposure to PFOS were the food categories ‘Fish and other seafood’ (contributing up to 86% in adults), followed by ‘Meat and meat products’ (contributing up to 52% in the elderly) and ‘Eggs and egg products’ (contributing up to 42% in infants).
Particularly, ‘Fish meat’ had the highest contribution to the overall PFOS LB mean exposure among the food subgroups within ‘Fish and other seafood’, in all age groups (up to 79% in the elderly). For infants, toddlers and other children, also ‘Fish offal’ made an important contribution (up to 40%); however, this was only true for few surveys. On the other hand, ‘Crustaceans’ and ‘Water molluscs’ contributed less.
Despite high PFOS concentrations measured in liver of game mammals, the exposure to PFOS from this food is negligible as the consumption of such products was reported by only a limited number of subjects (only three subjects consuming liver of game mammals reported in the Comprehensive database). Within the ‘Meat and meat products’, the most important contributing subcategory was ‘Cooked sausage’ (up to 19% in toddlers and other children) and ‘Edible offal, farmed animals’ (up to 20% in very elderly).
‘Eggs and egg products’ was also an important contributor to the overall LB mean PFOS exposure, particularly for infants (up to 41%). Since the levels of PFOS in eggs were not particularly high, the relevant contribution of this food category is likely mainly driven by its relatively high consumption.
‘Milk and dairy products’ had the highest contribution to the overall PFOS LB mean exposure of toddlers (up to 13%), adolescents (up to 12%) and other children (up to 11%). Given the low mean PFOS concentration measured in milk, the exposure is driven by high consumption of this food group, particularly in young age groups, with the exception of infants who usually consume infant formulae, and in fact, the contribution of milk for infants was rather low (up to 4%).
For infants, also ‘Fruits and fruit products’, particularly ‘Pear’ (up to 45%) made an important contribution to the LB mean PFOS exposure. However, this finding must be interpreted with caution due to a limited number of results on pears available for the exposure assessment.
‘Drinking water’ had the highest contribution to the overall LB mean exposure to PFOS in the infant age group (up to 10%), while in other age groups ‘drinking water’ contributed less (up to 3% in adults).
The contribution of other food categories was minor.
3.2.1.2. PFOA
Table 5 shows summary statistics of the estimated chronic dietary exposure to PFOA using the available occurrence and consumption data. The detailed mean and 95th percentile dietary exposure estimates for each of the 35 dietary surveys are presented in Appendix A, Table A.10 (EXCEL sheet).
Table 5.
Summary statistics of the chronic dietary exposure to PFOA (ng/kg bw per day) across European countries
| Age group | Minimum | Median | Maximum | |||
|---|---|---|---|---|---|---|
| LB | UB | LB | UB | LB | UB | |
| Mean dietary exposure in total population (ng/kg bw per day) | ||||||
| Infants | 0.50 | 2.50 | 0.70 | 3.79 | 1.44 | 8.06 |
| Toddlers | 0.34 | 4.02 | 2.01 | 8.78 | 2.61 | 12.1 |
| Other children | 0.34 | 2.29 | 1.00 | 4.83 | 2.16 | 9.74 |
| Adolescents | 0.26 | 1.55 | 0.50 | 2.77 | 0.85 | 4.09 |
| Adults | 0.22 | 1.24 | 0.32 | 1.59 | 0.60 | 3.28 |
| Elderly | 0.21 | 1.20 | 0.32 | 1.86 | 0.44 | 2.85 |
| Very elderly | 0.21 | 1.28 | 0.33 | 1.83 | 0.49 | 2.87 |
| 95th percentile dietary exposure in total population (ng/kg bw per day) | ||||||
| Infantsa | 1.52 | 7.29 | 1.80 | 8.93 | 3.76 | 17.8 |
| Toddlersa | 2.12 | 10.9 | 3.88 | 15.9 | 5.37 | 23.9 |
| Other children | 0.72 | 5.73 | 2.06 | 9.63 | 3.58 | 16.1 |
| Adolescents | 0.68 | 3.77 | 1.01 | 5.66 | 1.60 | 7.62 |
| Adults | 0.54 | 2.75 | 0.66 | 3.48 | 1.11 | 5.82 |
| Elderly | 0.52 | 3.12 | 0.69 | 3.68 | 0.96 | 5.16 |
| Very elderlya | 0.49 | 2.98 | 0.63 | 3.54 | 0.85 | 4.25 |
bw: body weight; LB: lower bound; UB: upper bound.
The 95th percentile estimates obtained from dietary surveys/age classes with less than 60 observations may not be statistically robust (EFSA, 2011b) and have therefore not been included in this table.
Similarly to PFOS, also for PFOA, the highest exposure estimates were observed in the young population groups. For the mean estimated dietary exposure, the highest LB and UB exposure estimates were observed for toddlers with maximum estimates of 2.61 and 12.1 ng/kg bw per day, respectively. At the 95th percentile exposure (highly exposed population), the highest PFOA exposure estimates were observed for toddlers with LB and UB intakes estimates of 5.37 and 23.9 ng/kg bw per day, respectively. In comparison, the PFOA exposure estimates for adult population groups were approximately fivefold lower when considering the 95th percentile exposure. The obtained dietary exposure estimates for specific groups of the population, namely ‘Pregnant women’ and ‘Lactating women’, were within the range of exposure estimates for adult populations (see Appendix A, Table A.11 as excel file – under ‘Supporting information’ Section on the web page).
The contribution of individual food categories to the LB mean chronic dietary exposure to PFOA varied between the dietary surveys, which may be explained by the specific food consumption patterns in the different European countries and even in different regions of one country. Relative contributions of the different food categories to the total estimated intakes, grouped by age classes, are shown in Appendix A, Table A.11 as excel file ‐ under ‘Supporting information’ Section on the web page).
Overall, the most important contributors to the mean chronic dietary exposure to PFOA, across all age groups for the LB scenario, were the food categories ‘Milk and dairy products’ (contributing up to 86% in toddlers), followed by ‘Drinking water’ (contributing up to 60% in infants) and ‘Fish and other seafood’ (contributing up to 56% in very elderly).
It is important to mention that the contribution of ‘Milk and dairy products’, represented only by cow milk and Gouda cheese, was based on a very limited number of quantified values available for these foods (only 2% for cow milk and only 10% for Gouda cheese). This limitation should be kept in mind when interpreting the results.
The ‘usual’ main contributors to PFASs exposure, namely ‘Fish and other seafood’ and ‘Meat and meat products’, did not contribute considerably/as expected to the overall LB mean PFOA exposure. This was due to the fact, that the PFOA concentration levels for these two food categories were rather low with exception of very specific foods, i.e. carp, as compared to other fish species and liver of game animals, as compared to other meat types. Since the carp and liver of game animals are rarely consumed, the overall exposure from ‘Fish and other seafood’ and ‘Meat and meat products’ was not particularly high. As an example, the carp was an important contributor only in three European countries reporting a common consumption of this fish species.
For the other important contributors to the LB mean chronic dietary PFOA exposure, ‘Eggs and egg products’ contributed up to 40% in adults, ‘Potatoes and potatoes products’ contributed up to 11% in toddlers, ‘Meat and meat products’ contributed up to 9% in the elderly, ‘Fruit and fruit products’ contributed up to 8% in toddlers and ‘Vegetables and vegetable products’ contributed up to 5% in pregnant women. Other food categories contributed considerably less (up to 0.6%).
3.2.2. Comparison of previous and current exposure
On the basis of data reported in the scientific literature, there is still insufficient data to make reliable dietary exposure estimates. In common with the current exposure assessment, there are uncertainties due to left censored data, and many reports are not clear whether upper or lower bound data has been used (see Section 3.6.1). There have been many studies that link data from blood monitoring studies to overall exposure and show that blood can be a useful matrix. For many individuals and locations, drinking water can be a significant contributor to overall exposure to PFASs.
As with the findings reported in the current exposure Section above (Section 3.2.1), fish and meat products such as offal are generally the highest reported sources of dietary exposure to PFOS, except where contaminated drinking water has been used to prepare dishes with high water content. For PFOA and other PFCAs, the main sources of exposure are milk and dairy products, fish and other seafood, and also eggs and egg products (Saito et al., 2004; Quinones and Snyder, 2009; Rayne and Forest, 2009).
Some specific reported exposure estimates are discussed below in approximate chronological order of publication. Since the studies were conducted in a variety of ways (Total Diet Study (TDS) or market basket, using local water or distilled water for cooking, etc.), it is not possible to make direct comparisons between estimates.
Average dietary exposure of Canadians to PFASs was reported by Tittlemier et al. (2007). Exposure to the sum of PFCAs and PFOS was estimated to be 250 ng per day using results from TDS samples taken in 2004.
A study by Trudel et al. (2008) found that in North America and Europe, exposure to PFOS and PFOA was in the range of 3–220 ng/kg bw per day and 1–130 ng/kg bw per day, respectively, for a 70 kg person. Most of this was from the intake from foods and drinking water.
Intake of PFASs in the Catalan region of Spain was reported by Ericson et al. (2008) determined by the analysis of 36 composite foodstuffs purchased from random locations. Exposure to PFASs from food was estimated for various age/gender groups. Only PFOS, PFOA, and one other PFAS were found in foodstuffs. The dietary intake of PFOS was estimated to be 62.5 or 74.2 ng per day (assuming LB or medium bound (MB), respectively). Fish, followed by dairy products and meats, were the main contributors to PFOS intake.
In 2008, BFR assessed PFOS and PFOA exposure. PFOS dietary exposure estimates calculated in LB and UB scenarios ranged from 2.3 to 3.7 ng/kg bw per day in average consumers and from 24 to 26 ng/kg bw per day in high consumers (95th percentile occurrence and 95th percentile consumption). For PFOA, the dietary exposure estimates ranged from 0.71 to 0.95 ng/kg bw per day in average consumers and around 13 ng/kg bw per day in high consumers (BfR, 2008).
Fromme et al. (2009) reviewed information published for PFASs in environmental media that could have an impact on human exposure in Western Countries. In particular, PFASs in indoor and ambient air, house dust, drinking water and food were considered. The average (and upper) daily exposure including all potential routes was found to be 1.6 ng/kg bw per day (8.8 ng/kg bw per day) for PFOS and 2.9 ng/kg bw per day (12.6 ng/kg bw per day) for PFOA in adults in the general population based on median and 95th percentile intake rates from a duplicate diet.
A dietary intake estimate for the UK (Clarke et al., 2010) was performed on the basis of the analysis of 252 food samples. This study estimated that the UB dietary intake was 10 ng/kg bw per day for average adult consumers.
A study by Noorlander et al. (2011) estimated dietary exposure for the Dutch population on the basis of analysis of pooled samples from a market basket survey and combining it with a food consumption survey for 6,250 people. The median long‐term intake for PFOS was estimated at 0.3 ng/kg bw per day and for PFOA 0.2 ng/kg bw per day, with corresponding 99th percentile intakes of 0.6 and 0.5 ng/kg bw per day, respectively.
In a Norwegian study comprising 175 men and women with a wide range of sea food consumption, individual dietary intakes were estimated based on data from food frequency questionnaires and a database of PFOS and PFOA concentrations in food purchased in Norway. Median intakes of 1.2 and 0.55 ng/kg bw per day for PFOS and PFOA were estimated, respectively. The estimated intakes were significantly correlated to the serum levels measured in the same individuals using multiple linear regression analysis (Haug et al., 2010b).
A limited time‐trend analysis for the Swedish population was conducted by Vestergren et al. (2012) using samples collected in 1999, 2005 and 2010. The dietary exposure to PFOS varied between 0.86 and 1.44 ng/kg bw per day, and the major contributors were fish and meat. The dietary exposure to PFOA was estimated to be in the range 0.35–0.69 ng/kg bw per day, and low levels (0.008–0.062 ng/kg per day) found in several food categories with associated high consumption such as cereals, dairy products, vegetables and fruit contributed most to the total intake. Dietary intakes of PFOS and PFOA estimated in this study were 4–10 times lower when compared to previous exposure modelling studies.
The first assessment of exposure to PFASs for the Belgian population was reported by Cornelis et al. (2012). PFOS and PFOA were measured in a variety of local foods, in dust from homes and offices, in drinking water and in human serum. The data were combined with data taken from the literature. Using the combined data set, intake from the different sources was calculated for children and adults, and dietary exposure was found to be most significant. For adults, the average dietary intake was 24.2 (P95 40.9) ng PFOS/kg bw per day and 6.1 (P95 9.6) ng PFOA/kg bw per day, whereas for children the dietary intake was about 3 times higher. Potatoes contributed 48 and 28% to the intake of PFOS by children and adults, respectively and for fish and seafood this was 57 and 10%, respectively. Exposure to PFOA came primarily from fruit and vegetables.
Brantsaeter et al. (2013) estimated individual dietary intakes of PFOS and PFOA for 487 pregnant Norwegian women, and median intakes of 44.6 and 34.2 ng/day were reported, respectively. This corresponds to median estimated intakes of 0.64 and 0.49 ng/kg bw per day for PFOS and PFOA, respectively when assuming a body weight of 70 kg. The intake estimates were based on data from food frequency questionnaires and a database of PFOS and PFOA concentrations in food purchased in Norway (Brantsaeter et al., 2013).
Klenow et al. (2013) estimated dietary exposure to selected PFASs for four selected European states including Belgium, the Czech Republic, Italy and Norway. These countries were selected to represent Western, Southern, Eastern and Northern Europe, and were part of the EU project PERFOOD. Seven selected PFASs, including PFOS and PFOA were assessed. Food items were selected on the basis of consumption and those known to have higher levels of PFASs. Average dietary exposure was generally below or close to 1 ng/kg bw per day for all seven PFASs for adults (18–64 years) and children (3–9 years). Exposure estimates did not exceed 4 ng/kg bw per day even in populations with high consumption.
A Total Diet Study (TDS) conducted in France between 2007 and 2009 (Rivière et al., 2014) concluded that the mean dietary exposure estimates for PFOA and PFOS in adults, were 0.74 and 0.66 ng/kg bw per day (UB) respectively. For high consumers (95th percentile), exposure to PFOA was estimated to be 1.50 ng/kg bw per day. For PFOS, the estimated intake was 1.15 ng/kg bw per day (UB). Due to the large amount of data where concentrations were below the LOD (left‐censored), calculated exposures largely depended on the analytical limits, and there was a large difference between LB and UB estimates, resulting in lower exposure values calculated when compared to those reported in other studies which used analytical methods with higher LOD values. The mean exposure to PFOS was estimated to be 0.67 ng/kg bw per day in women of childbearing age, the 95th percentile, UB exposures, were 1.62 ng/kg bw per day for PFOA and 1.17 ng/kg bw per day for PFOS. In children, the mean UB exposure to PFOS was estimated to be 1.38 ng/kg bw per day. The 95th percentile, UB exposures, were estimated to be 3.24 ng/kg bw per day for PFOA and 2.88 ng/kg bw per day for PFOS.
EFSA reported details of occurrence and dietary exposure to PFASs in food in 2012 (EFSA, 2012). The report summarised occurrence data for PFASs collected in 13 European countries during the period 2006–2012. The report considered 54,195 analytical results covering a list of 27 PFASs. The overall proportion of quantified results was very low due to high LODs of the methods used, resulting in a large amount of left censored data. PFASs were found more frequently in fish and other seafood, and in meat and meat products (liver in particular) than in other food groups. For PFOS, the highest UB mean exposure estimate for the adult population was 5.2 ng/kg bw per day, and the highest 95th percentile estimate was 10 ng/kg bw per day. For toddlers, the age class having the highest exposure, estimates were about three times higher. For PFOS and across all age groups, ‘Fish and other seafood’ (50–80%) followed by ‘Fruits and fruit products’ (8–27%) and ‘Meat and meat products’ (5–8%) contributed most to the total PFOS intake. For PFOA, the mean chronic dietary exposure for adults was up to 4.3 ng/kg bw per day, and about triple for toddlers (the age class having the highest exposure). The food groups responsible for the largest proportion of the exposure to PFOA for all age groups were ‘Fruits and fruit products’ (18–39%) and ‘Fish and other seafood’ (7.6–27%), but high variations were observed as a result of different dietary habits.
The occurrence data used for the present exposure assessment for PFOS and PFOA were similarly characterised by a high proportion of results below LOD/LOQ, and with the highest mean concentrations reported for fish and meat, in particular for liver. As compared to exposure estimates reported in 2012 (EFSA, 2012), the current LB and UB estimated PFOS exposure is on average 30% lower, and besides fish and meat, also the food category ‘Eggs and egg‐based products’ was among the most important contributors to the mean PFOS exposure. For PFOA, the current exposure estimates are on average fourfold higher using the LB approach and on average 30% lower using the UB approach as compared to the 2012 assessment. Milk and drinking water were the main contributors to the mean PFOA exposure. In the 2008 opinion (EFSA, 2008), the exposure estimates were based on a much smaller data set and indicative dietary intakes of PFOS of 60 ng/kg bw per day for average consumers, and 200 ng/kg bw per day for high consumers of fish were reported. Indicative average and high level dietary exposure estimates for PFOA of 2 and 6 ng/kg bw per day were reported, respectively. The intake estimates reported in the 2008 opinion were made on the basis of a lack of satisfactory analytical data, and many assumptions were made in order to derive the exposure estimates.
3.2.3. Non‐dietary exposure
PFOS and PFOA are extremely persistent and thus the environmental degradation can be considered negligible (Kissa, 2001). On the other hand, precursors of PFOS and PFOA may be biodegraded, and thus contribute to the internal dose of those compounds. Further information on precursors is given in Section 1.3.5.
As PFOS, PFOA and their precursors have been produced in large volumes and used in a wide variety of consumer products, the indoor environment might be contaminated with these compounds. In particular, exposure to PFOS and PFOA may occur through inhalation of indoor air as well as with dermal contact and ingestion of house dust. Exposure due to direct contact with consumer products may also occur.
3.2.3.1. Exposure through air and dust
As PFOS and PFOA have low volatility, the exposure through air is mainly due to inhalation of volatile PFOS and PFOA precursors (Stock et al., 2010). Generally, the concentrations of precursors are higher in indoor than outdoor air, and the between‐room variability is considerable (Harrad et al., 2010; Haug et al., 2011a; Ericson‐Jogsten et al., 2012; Fromme et al., 2015).
Exposure to PFOS and PFOA may also occur through ingestion of house dust. The concentrations in various houses may differ substantially, and often some samples have much higher concentrations than others, thus resulting in a log‐normal distribution of the data set (Harrad et al., 2010). Also, for dust, exposure through biodegradation of precursors may happen, and in a review by Eriksson and Kärrman (2015) it was reported that the concentrations of some of the precursors in dust from various countries were similar or even higher than the concentrations of PFOS and PFOA (Eriksson and Kärrman, 2015).
3.2.3.2. Dermal exposure
Exposure to PFOS and PFOA through dermal contact with consumer products can occur, and as for dust and air, indirect exposure from biodegradation of precursors may contribute to the exposure. Both PFOS, PFOA and precursors have been found in a large number of products including carpets, textiles, waxes, paints, food contact materials, non‐stick cookware and personal care products (Begley et al., 2005; Washburn et al., 2005; Sinclair et al., 2007; Fujii et al., 2013; Liu et al., 2014a; Kotthoff et al., 2015). The dermal absorption of PFOS and PFOA has been reported to be low (e.g. the dermal absorption of (APFO) was only 0.048% (Fasano et al., 2005)), but little is known about the precursors. Even though knowledge is limited, so far the dermal exposure to PFOS and PFOA has been thought to be low. Trudel et al. (2008) found that the contribution to the total uptake dose was less than 1% in any of the scenarios for dermal exposure from wearing of treated clothes, from deposition of spray droplets on skin while impregnating, from skin contact with treated carpet and with upholstery, and from deposition of dust on skin. This was also the case for infants, toddlers and children. However, a more recent study indicates that the potential for dermal absorption of PFOA is significant in both mouse and human skin and that of dermal absorption is dependent on the ionisation state (Franko et al., 2012).
3.2.3.3. Relative contribution to overall exposure
Based on available exposure data from the literature, total intakes as well as relative proportions of the intakes for adults have been modelled or measured for PFOS and PFOA (Trudel et al., 2008; Fromme et al., 2009; Vestergren and Cousins, 2009; Egeghy and Lorber, 2011; Haug et al., 2011b). These studies indicate that for background exposed adults, consumption of food is generally the major source of exposure for PFOS and PFOA (> 70%), but several studies have shown that drinking water may be the main exposure source in areas with contaminated drinking water (Emmett et al., 2006; Hölzer et al., 2008; Vestergren and Cousins, 2009). For instance, in the paper by Vestergren and Cousins (2009), drinking water contributed to around 75% of the exposure in a scenario with point sources of drinking water contamination.
To exemplify, the relative proportion of various pathways to the overall exposure of PFOS and PFOA have been assessed in a background exposed Norwegian study population (n = 41), where individual intakes from diet, dust and air were calculated (Haug et al., 2011b). Food contributed to 67–84% of the median total intake for PFOA and 88–99% for PFOS using different exposure factors such as the dust ingestion rate. Similarly, the median relative contribution from drinking water varied between 0.57% and 0.68% for PFOS, and 9.1% and 11% for PFOA. Dust contributed to 0.41–1.6% of the median PFOS intake and 5–14.8% of the PFOA intake. The median intake of PFOS from air contributed to 0.1% to 11% of the overall exposure, while it was 0.13–10.6% for PFOA. It is worth mentioning, that on an individual basis the relative contribution from different exposure pathways varied a lot.
3.3. Hazard identification and characterisation
3.3.1. Toxicokinetics
3.3.1.1. Experimental animals
3.3.1.1.1. PFOS
Based on animal experiments, mainly performed in rodents, the EFSA opinion published in 2008 (EFSA, 2008) reported that orally administered PFOS is well absorbed but poorly eliminated. It is mainly found in the liver, kidneys and blood with lower levels in most other organs including the central nervous system. After absorption, PFOS binds to albumin and to liver fatty acids binding protein (L‐FABP), which may contribute to its high retention in the liver. It can cross the placenta and enter the fetus where it is mainly located in the liver. Repeated administration results in hepatic bioaccumulation. PFOS is not known to be metabolised and the elimination of the parent compound in rats occurs mostly in urine and to a lesser extent via faecal excretion.
Animal studies have shown that PFOS is excreted in bile and undergoes extensive intestinal reabsorption, resulting in a prolonged elimination half‐life of the compound (Yu et al., 2011; ATSDR, 2015). Whereas gender influence on biliary excretion of PFOS remains unexplored, several studies carried out in rodents and non‐human primates indicate limited differences between males and females in PFOS elimination (De Silva et al., 2009; Chang et al., 2012).
Chang et al. (2009) investigated the toxicokinetics of PFOS in rats exposed to this chemical during gestation and lactation. Sprague–Dawley rats were administered daily oral doses of either vehicle control or PFOS (as potassium salt) at 0.1, 0.3 and 1.0 mg/kg bw per day, from gestational day (GD) 0 (day positive for mating) through to postnatal day (PND) 20. In addition, pregnant females received the same doses through to GD 19 and sacrificed on GD 20 in order to obtain maternal and fetal serum and tissue samples at the end of gestation. Serum, liver and brain PFOS concentrations were determined by LC–MS/MS through PND 21 in dams and PND 72 in pups. PFOS appeared to concentrate in the livers of dams and pups, with liver PFOS concentrations in pups at least twice as high as corresponding serum concentrations. At GD 20 and for the lowest dose tested, liver average concentrations were 8.3 and 3.2 μg/g for dams and fetuses, whereas in brain PFOS concentrations were 0.15 and 1.23 μg/g, respectively. At PND 21, for the same dose group, PFOS hepatic concentrations were 5.98 and 5.28 μg/g for male and female pups, respectively, whereas in brain PFOS concentrations were 0.22 and 0.23 μg/g, respectively. Whereas liver concentrations were essentially the same in both sexes, marked differences were observed between males and females in serum PFOS concentrations but only on PND 72.
In a study in which pregnant Sprague–Dawley rats were exposed daily by gavage to PFOS at doses of 0.1, 0.6 and 2.0 mg/kg bw per day from GD 2 to 21, concentrations found in the heart of weaned rats at PND 21 were 0.8, 4.1 and 9.6 μg/g, respectively and were approximately twofold higher than in serum (Xia et al., 2011).
The tissue distribution of radioactivity was investigated in adult male C57/BL6 mice following dietary exposure for 1, 3 or 5 days to 0.031 mg/kg bw per day or 23 mg/kg bw per day of 35S‐PFOS (Bogdanska et al., 2011). The highest levels were detected in the liver, lung, blood and kidney. The PFOS distribution pattern varied according to the dose, showing a lower proportion in the blood and a higher proportion in the tissues, particularly the liver, at the highest dose tested. Both radioactivity counting and whole‐body autoradiography revealed the presence of PFOS in all tissues examined, including thymus and bone (comprising bone marrow). At both doses, in most of the tissues, including liver, lung, kidney and brain, the level of PFOS increased with the length of exposure.
Borg et al. (2010) investigated the distribution of radioactivity in dams, fetuses (GD 18 and 20) and pups (PND 1) following gavage administration of 35S‐PFOS (12.5 mg/kg bw) to C57/BL6 mice at GD 16. In the dams, the liver and lungs exhibited the highest concentrations of radioactivity at all the time‐points, whereas in the fetuses and pups, the kidneys and liver contained the highest concentrations on GD 18 and the lungs and liver on GD 20 and PND 1. The hepatic concentration of 35S‐PFOS in the fetuses and the pups was about 1.7‐fold lower than in the maternal liver. In fetuses and pups, the level in brain was similar at all the time‐points, corresponding to the level in maternal blood but was 3.8‐ to 5.4‐fold higher than in the maternal brain. Regional differences in the distribution within the brain were observed, with a somewhat lower level in the perinatal cortex.
In pregnant CD‐1 mice administered daily by gavage with 0.3 or 3 mg PFOS/kg bw per day throughout gestational and lactation periods, average concentrations of PFOS measured in maternal livers at PND 21 were 49.1 and 338.9 μg/kg, respectively and were approximately 3 times higher than in serum (Wan et al., 2014). At the same time, the levels of PFOS found in pup livers were 20.1 and 243.0 μg/g, respectively, which was about twice the PFOS concentration in pup sera.
A series of studies was undertaken by Chang et al. (2012) to determine the toxicokinetics of PFOS in rats, mice and monkeys. The absorption of ingested PFOS in male Sprague–Dawley rats given a single oral dose of potassium 14C‐PFOS at 4.2 mg/kg was estimated to be > 95%, based on the retention in the carcass (excluding the gastrointestinal tract and its contents). Following a single intravenous (i.v.) dose of 14C‐PFOS (4.2 mg/kg bw, administered as potassium salt), an average of 30.2% of the radioactivity was recovered in the urine of male rats over 89 days and an average of 12.6% was found in faeces over 64 days. On day 89 post‐dose, 25.2% and 2.8% of the administered dose was found in liver and plasma, respectively. Two days following a single oral dose of 14C‐PFOS (4.2 mg/kg bw) the urinary and faecal elimination corresponded to 2.24% and 3.52% of the dose, respectively. Additional experiments were carried out with unlabelled PFOS in male and female Sprague–Dawley rats, CD‐1 mice and cynomolgus monkeys. The principal differences observed between species in the toxicokinetic parameters measured were in elimination rates. The serum elimination half‐lives ranged from 33 to 37 days in rodents, whereas it was approximately 120 days in monkeys.
Tarazona et al. (2016) investigated the toxicokinetics of PFOS in female white New Zealand rabbits administered by gavage at a dose of 0.2 μg/kg bw, 3 days a week (equivalent to a daily dose of 0.085 μg/kg bw) during 102 days, followed by a depuration period of 129 days. The serum concentrations of PFOS were measured by LC–MS. PFOS was found to be totally absorbed and the Cmax value was 20.42 μg/L and was observed at the end of the exposure period. The steady‐state concentration was estimated at about 36 μg/L and could be reached after approximately 1 year. The serum elimination half‐life was estimated to be 87 days.
Two studies suggested isomer‐specific disposition following per os exposure to rats. In a first experiment, Benskin et al. (2009) administered by gavage a single dose of perfluorinated compounds to male Sprague–Dawley rats. The dose consisted of 400 μg/kg bw PFOS (270 μg/kg bw n‐PFOS), 500 μg/kg bw PFOA (400 μg/kg bw n‐PFOA), 390 μg/kg bw perfluorononanoic acid (PFNA) (200 μg/kg bw n‐PFNA and 190 μg/kg bw iso‐PFNA), and 30 μg/kg bw perfluorohexane sulfonic acid (PFHxS) isomers which were present as impurities in the PFOS standard. The concentration of PFOS isomers in tissues decreased in the order liver > lung > kidneys > blood > spleen > heart > testes > intestine > muscle > brain > fat. At day 3, tissues showed equivalent isomer profiles. For most perfluorinated isomers, including PFOS, branched isomers had lower blood half‐lives than the corresponding linear isomer. The exception to this trend was for 1 m‐PFOS, which was three fold more persistent in blood (t½ = 102 days) than linear PFOS (t½ = 33.7 days). For most tissues, depuration half‐lives were lower than in blood. However, in the liver, all PFOS isomer half‐lives were between a factor of 1.8 (n‐PFOS) and 3.8 (unidentified branched PFOS isomer) longer than those in blood and did not show the same trend as blood, wherein branched isomers had shorter half‐lives compared to those of the linear isomer. The 1 m‐PFOS isomer, which had the longest half‐life in blood, had no measurable elimination from the liver at all. To confirm these findings, male and female Sprague–Dawley rats were dietary exposed to the same mixture of isomers for 12 weeks, followed by a 12‐week depuration period. The diet contained 500 ng/g PFOA (80% n‐PFOA), PFOS (70% n‐PFOS), and linear and isopropyl perfluorononanoate (De Silva et al., 2009). At the end of the exposure period, the concentration in blood of branched PFOS isomers was generally higher than for n‐PFOS. The highest concentrations were observed for 1 m‐PFOS. However, due to the fact that there was no strong evidence for steady‐state being reached in males or females for any isomer after 12 weeks of exposure, these results must be interpreted with caution. With the exception of 1 m‐PFOS, which exhibited longer elimination half‐lives than the n‐isomer, elimination rates of the major branched PFOS isomers were not statistically different from n‐PFOS.
In addition to PFOS binding to rat L‐FABP, which may contribute to PFOS high retention in rat liver (EFSA, 2008), PFOS is known to bind to serum proteins. Recently, relative binding affinity of PFOS isomers to whole calf serum and human serum were investigated (Beesoon and Martin, 2015), demonstrating a higher binding affinity of linear PFOS to serum proteins, relative to branched isomers. This result was confirmed by the measurement of the dissociation constants (Kd) of individual PFOS isomers with human serum albumin. Linear PFOS was much more tightly bound (Kd = 8 [±4] 10−8 M) than branched PFOS isomers (Kd from 8 [±1] 10−5 M to 4 [±2] 10−4 M). These data could partly explain the longer half‐life generally observed for linear PFOS compared to branched isomers (Benskin et al., 2009; De Silva et al., 2009).
Whereas several papers identified the role of renal organic anion transporters in the disposition of PFOA in rats (see following sections), the role of these proteins in the transport of PFOS in mammals is not established.
In summary, the data published during the last years provide further evidence that PFOS is readily absorbed after dietary exposure, binds to serum albumin and accumulates primarily in the liver. It can be transferred to the fetus during gestation and elimination rates may differ significantly according to species. Branching of the perfluoroalkyl chain may have an impact on the toxicokinetics of PFOS. In the serum, PFOS is bound to albumin, linear alkyl chains displaying a stronger binding than branched chains. Although no studies were identified on specific renal transporters for PFOS, resorption of PFOS from the glomerulate filtrate via transporters in the kidney tubules is believed to be a major contributor to the long half‐life of this compound. The serum elimination half‐lives in rats and mice were slightly higher than one month, whereas in rabbits and monkeys, the serum elimination half‐life was 3–4 months.
3.3.1.1.2. PFOA
As described in the previous EFSA opinion (EFSA, 2008), oral intake of PFOA results in rapid and almost complete absorption. In rats, PFOA is mainly found in the liver, kidneys and blood with lower levels in many other organs including the brain. PFOA can be transferred to the fetus during gestation. Major gender difference and dose dependence in tissue concentrations and half‐lives were described for PFOA disposition in rats. Studies conducted in vivo and in vitro have not found metabolites of PFOA. Elimination half‐lives of about 1 day and 1 week were measured in female and male rats, respectively. In cynomolgus monkey, the elimination half‐life was estimated at approximately one month but limited gender differences were observed regarding the disposition of PFOA in this species. Although urinary excretion was found to be the major route of elimination in most of the investigated species, strong differences were observed in rats between males and females. In the first 24 h, in females, most of the ingested dose was eliminated in urine, whereas in males urinary excretion represented less than 10% of dose. Protein‐binding and expression of transporters were found to play an important role in determining distribution and elimination of PFOA in experimental animals.
More recently, a series of studies on the disposition of PFOA in rodents was undertaken and some of them provided details on the mechanisms contributing to the sex differences in elimination of PFOA in rats. Cui et al. (2009, 2010) investigated the distribution and elimination of PFOA in male Sprague–Dawley rats. Animals were given 5 or 20 mg PFOA/kg bw by gavage, once a day for 4 weeks. At the end of the experiment and for both concentrations tested, levels in main target organs were in the order of kidney > liver > lung > blood ≈ heart > testes > spleen ≈ brain. No dose‐related accumulation was found. This study confirmed that urine was the main excretion route for PFOA in rats. During the first 24 h, about 18–22% of the administered PFOA was eliminated in urine, depending on the dose, whereas faecal excretion was about 7–8%.
Rigden et al. (2015) investigated the urinary excretion of PFOA in male Sprague–Dawley rats administered this compound (10, 33 or 100 mg/kg bw per day) by gavage for 3 consecutive days. They found that 17 ± 6%, 36 ± 10%, and 56 ± 14% of the total dose administered was eliminated in urine in the low‐, medium‐ and high‐dose group, respectively, showing that the fraction of PFOA excreted in urine increased with the dose administered.
Studies conducted in rats have demonstrated that PFOA is excreted in bile and undergoes extensive reabsorption from the gastrointestinal tract (ATSDR, 2015). Sex differences in elimination of PFOA have been observed in hamsters, but unlike the rat, male hamsters excreted PFOA more rapidly than females (ATSDR, 2015).
As reviewed by Han et al. (2012), biliary excretion does not seem to be a major factor contributing to the gender‐ or species‐dependent elimination of PFOA, in contrast to renal elimination. The process of renal elimination, including glomerular filtration, tubular secretion and tubular reabsorption, depends on the affinity of PFOA to bind to plasma proteins (mainly serum albumin) and organic anion transport proteins (OATs). Only the unbound fraction of PFOA in blood is available for glomerular filtration, whereas cellular uptake (transporting into the cell) and efflux (transporting out of the cell) is mediated by OATs. Male and female rats showed no gender difference in the binding of PFOA to serum proteins. Han et al. (2012) compared the published literature on PFOA‐serum albumin binding parameters determined in bovine rat and human, on the basis of the association constant (Ka) and the number of binding sites. The binding affinity was found to vary from 10−1 to 10−3 M for low affinity binding site and from 10−4 to 10−6 M for the high affinity binding site, with limited differences between species or between males and females. In a recent study, it was shown that PFOA could bind into site I in subdomain IIA of bovine serum albumin (Chen et al., 2015).
In contrast to serum albumin binding, carrier‐mediated PFOA renal transport was shown to be sex hormone‐regulated and species‐related (Han et al., 2012). In rat, OAT1 and OAT3 which are localised in the basolateral membrane of the proximal tubular cells, facilitate PFOA renal tubular secretion, whereas the organic anion‐transporting polypeptide (Oatp) 1a1, which is expressed in the apical membrane of the proximal tubular cells has been shown to transport PFOA from the urine back into the proximal tubule cells, facilitating renal reabsorption (Buist et al., 2002; Nakagawa et al., 2008; Yang et al., 2009a; Weaver et al., 2010). Oatp1a1 mRNA and Oatp1a1 expression level are both markedly higher in male than in female rat kidney (Yang et al., 2009a). In addition, this renal transporter was shown to be regulated by sex hormones (Gotoh et al., 2002), suggesting that Oatp1a1‐mediated tubular reabsorption could be the mechanism for the sex‐dependent renal elimination of PFOA in rats. In humans, (see Section 3.3.1.2.2 for further details), OAT4 (not expressed in rats) and urate transporter 1 (URAT1), but not Oatp1a2 (the closest orthologous of rat Oatp1a1), were shown to mediate PFOA renal tubular reabsorption (Yang et al., 2010), whereas OAT1 and OAT3 have been reported to mediate PFOA renal tubular secretion (Han et al., 2012). These data suggest that gender and species differences in PFOA half‐lives are, at least in part, driven by expression of transporters in the kidney.
PFOA was reported to be able to bind to L‐FABP and thus to compete with some natural ligands of this protein (Luebker et al., 2002; Woodcroft et al., 2010); however, in experimental animals as in humans, the affinity was less than for PFOS (Luebker et al., 2002; Zhang et al., 2013a; see also Section 3.3.1.2.2).
To evaluate the disposition of PFOA in the pregnant and lactating dam and offspring, pregnant CD‐1 mice received a single dose of 0.1, 1 or 5 mg PFOA/kg bw by gavage on GD 17 (Fenton et al., 2009). Maternal and pup fluids and tissues were collected over time. Pups exhibited significantly higher serum PFOA concentrations compared to their respective dams: for example, a single 0.1 mg/kg PFOA per os administration to a pregnant mouse induced circulating serum PFOA concentrations of 44–216 ng/mL in dams and 117–326 ng/mL in pups. The body burden in pups increased after birth until at least PND 8, regardless of dose. The milk/serum distribution ratio ranged from slightly more than 0.1 to over 0.5 in mice, depending on dose, with the lowest doses tested demonstrating the highest ratios over time. These values are in agreement with previous studies in rats reporting a distribution ratio of 0.1 (Hinderliter et al., 2005).
Macon et al. (2011) measured the concentration of PFOA in offspring from CD‐1 mice dosed daily by gavage for all or half of the gestation time. In the full‐gestation study, mice were administered 0.3, 1.0, and 3.0 mg PFOA/kg bw per day, from GD 1 to 17. In the late‐gestation study, mice were administered 0.01, 0.1 and 1.0 mg PFOA/kg bw per day from GD 10 to 17. PFOA concentrations remained elevated in liver and serum for up to 4 weeks. In female offspring corresponding to full gestation exposure to 1 mg PFOA/kg bw per day for instance, the concentration in serum was 11 026 ± 915 ng/mL, 1,247 ± 208 ng/mL and 71 ± 8 ng/mL at PND 7, PND 28 and PND 84, respectively. In liver, at the same sampling times, concentrations were 8,134 ± 740 ng/g, 2,007 ± 560 ng/g and 55 ± 12 ng/g, respectively, whereas in brain the concentration was 479 ± 41 ng/g at PND 7 but below LOQ (35 ng/g) at PND 28 and PND 84. Similar values and trends were reported in male offspring. Values observed in the serum of female offspring from the late gestation exposure study (1 mg PFOA/kg bw per day group) were 16,305 ± 873 ng/mL, 11,880 ± 1,448 ng/mL and 2,025 ± 281 ng/mL at PND 1, PND 7 and PND 21, respectively.
The concentrations of PFOA found in serum of female offspring from CD‐1 and C57Bl/6 dams exposed to PFOA by gavage (0.01, 0.1, 0.3 or 1.0 mg/kg bw per day) between GD 1 and 17 (Tucker et al., 2015) were in accordance with those previously reported by Macon et al. (2011) under similar experimental conditions.
In a study dealing with the developmental effects of PFOA in mice female offspring prenatally exposed to 0.3 mg PFOA/kg bw per day throughout gestation period, Koskela et al. (2016) found that the concentration in pooled tibias and femurs was 3.0 and 3.7 ng PFOA/g at 13 and 17 months, respectively.
Isomer‐specific disposition of PFOA in rodents was investigated by Benskin et al. (2009) in male Sprague–Dawley rats administered by gavage a single dose of 500 μg/kg bw PFOA (400 μg/kg bw n‐PFOA) in mixture with PFOS, PFNA and PFHxS (see methodological details in Section 3.3.1.1.1). The concentration of PFOA isomers in tissues decreased in the order liver > blood > kidneys >lungs > heart > testes > spleen > fat > intestine > muscle > brain > fat, with the linear isomer being predominant in all samples at all sampling times. In blood, the half‐life of linear PFOA was 13.4 days whereas for branched isomers it varied from 1.28 days to 9.10 days. Tissue half‐lives were either similar to or less than those estimated for blood. Preferential elimination of branched isomers occurred primarily via urine. In another study (De Silva et al., 2009), male and female Sprague–Dawley rats were dietary exposed to the same mixture of isomers for 12 weeks, followed by a 12‐week depuration period (see methodological details in Section 3.3.1.1.1). At the end of the exposure period, the relative accumulation in blood of branched PFOA isomers was generally lower than for n‐PFOA. The blood depuration half‐life for n‐PFOA was 9.1 days (only estimated in males). Two minor unidentified branched isomers had half‐lives longer than that of n‐PFOA (t½ = 16.0 days and 21.2 days, respectively). Linear PFOA was found to more strongly bind to human serum albumin compared to branched PFOA isomers (Beesoon and Martin, 2015), but no data were identified regarding the isomer‐specific binding to OATs.
Overall, these data confirm the extensive gastrointestinal absorption of PFOA. In plasma, most of PFOA was found to be bound to proteins, the primary PFOA‐binding protein being serum albumin. PFOA is not metabolised and is predominantly distributed to blood and liver. It can cross the blood–placenta barrier and enter the fetus where it is mainly found in the liver. It is excreted unchanged primarily via the kidneys. Biliary and faecal excretion also contribute to the elimination of PFOA, which may be subject to extensive enterohepatic recirculation. The gender and species differences in serum half‐life are mainly due to hormonally regulated renal reabsorption of PFOA by organic ion transporters expressed in membranes of kidney proximal tubule cells.
3.3.1.2. Humans
3.3.1.2.1. PFOS
Studies of the absorption of PFOS in humans following oral exposure were not identified. However, indirect evidence of oral absorption of PFOS was provided in studies showing significant associations between environmental levels (e.g. drinking water) and concentrations in human serum, suggesting that PFOS is readily absorbed (ATSDR, 2015). PFOS binds to proteins (mainly albumin) in serum (Kerstner‐Wood et al., 2003; Zhang et al., 2009; Luo et al., 2012) and mainly accumulates in the liver, kidney and blood (Olsen et al., 2003a; Pérez et al., 2013). As far as it is known, PFOS is not metabolised in humans and its renal clearance is very low, probably due to active renal reabsorption. Elimination half‐lives of PFOS in humans were estimated to vary between 4.5 and 7.4 years with limited gender or age differences in workers (EFSA, 2008; ATSDR, 2015). A recent study reported the shortest elimination half‐life of 1.9 years, based on the annual decline from 2008 to 2012 (n = 302) of PFOS concentration in the serum of workers from a fluorochemical plant in China (Fu et al., 2016).
Pérez et al. (2013) measured the concentrations of 21 PFASs in 99 samples of autopsy tissues (brain, liver, lung, bone and kidney) from subjects who had been living in Tarragona (Catalonia, Spain). PFOS was predominantly found in liver (median value: 41.9 ng/g, range: LOD–405), kidney (55 ng/g, range: LOD–269) and lung (28.4 ng/g, LOD–61.8); mean concentration in brain was 4.9 ng/g (range: LOD–22.5), whereas no trace of PFOS was found in bones. LOD was 3 ng/g for liver, lung, brain and bone samples, and 6 ng/g for kidney.
Yeung et al. (2013a) investigated 12 PFASs in serum samples (n = 25) from liver donors with no known liver disease and histologically normal liver tissues (n = 9) collected during liver resection surgery. The median PFOS concentration was 7.29 ng/mL (range 1.43–34.9 ng/mL) and 5.03 ng/g (range 1.30–10.8) in serum and liver, respectively.
When incubated with separate human‐derived plasma fractions, PFOS was found to be highly bound to albumin (99.8%) and to low‐density lipoproteins (95.6%), whereas binding to alpha‐ and gamma‐globulins was 59.4% and 24.1%, respectively (Kerstner‐Wood et al., 2003). A binding constant of 2.2 × 10⁻⁴ M and a binding ratio of PFOS to human albumin of 14 moles PFOS/mole albumin were reported by Chen and Guo (2009). Distribution and binding to human donor plasma lipoprotein fractions was investigated by Butenhoff et al. (2012a). Percent binding of PFOS (10 μg/mL in saline) to isolated human plasma protein fractions in saline at 100% physiological concentration was 95.6%. The majority of PFOS was found in lipoprotein‐depleted plasma. Plasma density gradient fractionation indicated that 9% of PFOS distributes to lipoprotein‐containing fractions.
Kärrman et al. (2006) found that average concentrations of PFOS in plasma was only 1.2 times higher than in whole blood, whereas Ehresman et al. (2007) found that whole blood concentrations of PFOS were approximately half that of plasma or serum, irrespective of the concentration. These values suggest that there was no selective retention of PFOS by red blood cells. More recently, Hanssen et al. (2013) investigated the relative distribution of PFASs between plasma and whole blood in both maternal and umbilical cord samples. For PFOS, the median ratio was 2.05 for cord samples and 1.90 for maternal samples.
Jin et al. (2016) investigated the isomer‐specific partitioning of several PFASs between plasma and blood cells. For total PFOS, the mean plasma:whole blood concentration ratio was 1.5 ± 0.4. The mean n‐PFOS percentages in plasma and in whole blood were the same (approximately 50%), whereas the majority of branched isomers was found in the plasma, following the rank order of 1m > 4m > 3 + 5m > Σm2 > iso > n. Linear PFOS chains display stronger protein binding than branched chains (Beesoon and Martin, 2015).
Several studies have examined maternal–fetal transfer, measuring the concentrations of perfluoroalkylated compounds in maternal and cord serum or plasma. In studies reporting PFOS concentrations in matched mother–infant pairs, fetal–maternal ratio was in the 0.3–0.6 range (ATSDR, 2015; Manzano‐Salgado et al., 2015).
Zhang et al. (2013b) examined the distribution of PFOS between maternal blood, cord blood, the placenta and amniotic fluid. Compared to the mean PFOS value in maternal blood, the mean levels in the cord blood, placenta and amniotic fluid were 21%, 56% and 0.14% of the mean levels in the mother's blood, respectively.
Elimination of absorbed PFOS occurs in urine and bile. Renal elimination includes glomerular filtration and tubular secretion as well as the process of reabsorption. The renal clearance values for PFOS, as estimated by Harada et al. (2005), are 0.012 mL/kg per day for men and 0.019 mL/kg per day for women, which are low in comparison with the values found in experimental animals. Analyses of individual isomers of PFOS in paired Chinese human blood and urine samples were performed by Zhang et al. (2013c). The average renal clearance for linear PFOS was found to be 0.045 mL/kg per day (95% confidence interval (CI): 0.032–0.057) in young females (age < 50 years) and 0.031 mL/kg per day (95% CI: 0.021–0.042) in male and older female group. Older females and males have longer estimated half‐lives than young females, suggesting the importance of monthly menstruation as a pathway for excretion. The estimate of the half‐life of PFOS in menstruating women was 4.0 years vs 4.7 years in men (Wong et al., 2014). For branched PFOS, depending on isomers, renal clearance varied from 0.019 mL/kg per day to 0.093 mL/kg per day in the first group and from 0.016 mL/kg per day to 0.063 mL/kg per day in the second group. Among the major PFOS isomers, 1m‐PFOS had the lowest renal clearance efficiency, followed by n, iso, 4m and 3 + 5m (Zhang et al., 2013c). Linear PFOS chains display stronger binding than branched chains (Beesoon and Martin, 2015).
Harada et al. (2007) showed that biliary excretion of PFOS was important in humans, with a clearance estimated at 2.98 mL/kg per day. However, 97% of PFOS excreted into bile was estimated to be reabsorbed from the gastrointestinal tract. In the same paper, it was found that the presence of PFOS in the cerebrospinal fluid (CSF) was very low, with a median ratio of PFOS concentrations in CSF/PFOS concentrations in serum of 0.09, suggesting that PFOS cannot easily pass through the blood–brain barrier.
Based on serum analysis, the mean half‐life in retired U.S. fluorochemical production workers (24 males, 2 females) (Olsen et al., 2007) was 5.4 years (95% CI: 3.9–6.9 years; geometric mean: 4.8 years, 95% CI 4.0–5.8). Estimates for the two females in the same study were 4.9 and 6.8 years.
Transfer of PFOS to breast milk appears to be a significant route of elimination of PFOS during breastfeeding and consequently an important exposure route for nursing infants. The ratio of the concentrations in milk vs plasma was calculated to be in the range 0.01–0.02 (Kärrman et al., 2007; Kim et al., 2011a; Liu et al., 2011). Mondal et al. (2014) investigated the association of breastfeeding with maternal PFOS serum concentrations, but also with infant PFOS serum concentrations. Each month, breastfeeding was associated with a 3% decrease in maternal serum concentration of PFOS, but resulted concomitantly in a 4% increase in infant PFOS serum concentration.
Papadopoulou et al. (2016) determined PFOS concentrations in plasma samples of 3‐year‐old children collected in 2010–2011 and maternal serum samples collected around delivery at 2007–2008 in Norway. A positive correlation was found between maternal and child concentrations of PFOS (Spearman's correlation coefficients: 0.52) and PFOS levels in children serum (4.76 ± 0.49 ng/mL), were equivalent to those in maternal plasma (5.55 ± 0.45 ng/mL). Every month of breastfeeding was associated with an increase of 3.3% PFOS plasma levels in toddlers, independently of maternal prenatal PFOS concentration.
In summary, these data indicate that PFOS is extensively absorbed in humans and readily distributes in plasma, liver, kidney and lung. In plasma, PFOS is mainly bound to albumin and to a lesser extent, to globulins. Both urine and bile are PFOS routes of excretion, with a biliary resorption rate of 97%, which could contribute to the long half‐life in humans (5.4 years). In women, breast milk and menstruation fluids are additional elimination routes of PFOS. Urinary excretion of PFOS is dependent on the isomeric composition of the mixture present in blood and the gender/age/kidney function of the individuals. PFOS has been detected in umbilical cord blood, breast milk and plasma samples of breastfed toddlers indicating that maternal transfer occurs pre‐ and postnatally.
Further information on factors that may have an impact on the internal doses of PFASs is given in Section 3.3.2.6.
3.3.1.2.2. PFOA
PFOA is absorbed from the gastrointestinal tract in humans. In a clinical study conducted by Elcombe et al. (2013), reported by IARC (2016), a group of 43 subjects from age 39 to 78 years, all with tumours of varying tissue origin, and comprising an equivalent number of males and females, were given an oral dose of 50–1,200 mg of a purified straight‐chain isomer of the ammonium salt of PFOA each week, for up to 6 weeks. Rapid absorption was observed with a peak plasma concentration noted at ca 1.5 h. No age or sex differences were found.
It has been estimated that more than 90% of PFOA was bound to serum albumin in human blood (IARC, 2016). A binding constant of 2.7 × 10⁻⁵ M and a binding ratio of PFOA to human albumin of 5.8 moles PFOS/mole albumin were reported by Chen and Guo (2009). PFOA also has affinity for human serum transthyretin (TTR) and for L‐FABP (IARC, 2016). Weiss et al. (2009) tested the binding capacity of PFOA and PFOS to TTR and found that the binding potency of these PFASs was approximately 15‐fold lower than the natural ligand thyroxine. However, in a study examining the correlation between PFOS exposure and TTR‐bound thyroxine, no association was found (Audet‐Delage et al., 2013, see Section 3.3.4.6.3)
Pérez et al. (2013) measured the concentrations of 21 perfluoroalkylated substances in 99 samples of autopsy tissues (see above). PFOA was predominantly found in bone (median value: 20.9 ng/g, range: LOD–234), followed by the lung (median value: 12.1 ng/g, range: LOD–87.9), the liver (median value: 4.0 ng/g, range: LOD–98.9) and the kidney (median value: 1.5 ng/g, range: LOD–11.9). PFOA was not detected in the brain. LOD was 3 ng/g for liver, kidney and bone samples, 2.4 ng/g for brain and 6 ng/g for lung. In matched samples of serum and liver from subjects who underwent liver transplantation (Yeung et al., 2013a; see above for details), PFOA levels ranged from 0.44 to 45.5 ng/mL and 0.10 to 2.3 ng/g, respectively. Because these results are different from a liver‐to‐serum ratio of approximately 1, as previously reported by Maestri et al. (2006) in non‐occupationally exposed humans, the authors suggested that pathological changes in the diseased liver may alter the distribution of PFOA within the liver, thus affecting its partitioning between serum and liver compartments.
The average concentration of PFOA in plasma from the general population was found to be 1.2–1.4 times higher than in whole blood (Kärrman et al., 2006; Jin et al., 2016). However, for occupationally exposed groups concentrations of PFOA in blood was approximately half that of plasma or serum (Ehresman et al., 2007). Hanssen et al. (2013) found that the relative distribution of PFOA between plasma and whole blood in both maternal and umbilical cord samples was 1.8 and 2.0, respectively. All these values suggest that there was no selective retention of PFOA by red blood cells.
The isomer‐specific partitioning of PFOA between plasma and blood cells was investigated by Jin et al. (2016) in 60 samples collected from the Chinese population. The linear isomer was found to be predominant (> 90%) in plasma and whole blood samples, the percentage of n‐PFOA in plasma being somewhat higher than that in whole blood, but the difference was not statistically significant. Linear PFOA is more strongly bound to human serum albumin compared to branched PFOA isomers (Beesoon and Martin, 2015).
PFOA can be transferred to the fetus during pregnancy. ATSDR reported fetal/maternal serum ratios ranging from 0.32 to 1.30 (ATSDR, 2015). In recent studies conducted in Europe, this ratio was close to 0.8 (Cariou et al., 2015; Manzano‐Salgado et al., 2015).
Elimination of absorbed PFOA occurs in urine and bile. The renal clearance values for PFOA, as estimated by Harada et al. (2005), were 0.033 mL/kg per day for men and 0.027 mL/kg per day for women. Biliary clearance for PFOA was estimated to be 1.06 mL/kg per day (Harada et al., 2007), which is substantially higher than renal clearance in humans and might represent a major excretion route. However, approximately 89% of the PFOA excreted into bile was estimated to be reabsorbed from the gastrointestinal tract (Harada et al., 2007). More recently, Fujii et al. (2015) estimated that the reabsorption of PFOA excreted in bile was 98%. The ratio of the median concentration of PFOA in the cerebrospinal fluid samples to the concentration in serum was found to be 0.018, suggesting that crossing the blood–brain barrier occurs at a very limited extent (Harada et al., 2007). This finding was supported by the work of Fujii et al. (2015) who reported a cerebrospinal fluid/serum ratio of 0.031.
OAT1 and OAT3 on the basolateral membrane of human proximal tubular cells have been identified as contributing to renal secretion of PFOA, whereas OAT2 is not involved in this process. Besides secretion, PFOA can also be reabsorbed by transport from the tubular lumen across the brush‐border membrane into the proximal tubular cell. Two human renal brush‐border membrane carriers, OAT4, which is only expressed in human kidney, and URAT1 are involved in the initial step in the reabsorption of PFOA (Nakagawa et al., 2009; Yang et al., 2010; Han et al., 2012). The polymorphism of OATs in human populations and its consequence in the toxicokinetics of drugs and contaminants they transport have been reported in a limited number of articles. Naturally occurring genetic variants of OAT4 were identified in public databases and by resequencing DNA samples from individuals comprising four distinct ethnic groups. Nine total non‐synonymous variants demonstrating altered transport of endogenous substrates were identified (Shima et al., 2010), but no publications focused on PFOA were identified.
The studies investigating the fate of radiolabelled PFOA in rodents (Vanden Heuvel et al., 1991; Kemper, 2003; ATSDR, 2015) failed to detect any biotransformation product in urine, faeces or tissues of exposed animals. Fluorine‐19 nuclear magnetic resonance (NMR) analysis of various body fluids and liver of rats administered a single intraperitoneal (i.p.) dose of PFOA displayed resonances of the parent compound but did not reveal any evidence of metabolism. Radiolabelled PFOA was not metabolised when incubated with human liver, kidney or intestine subcellular fractions (Kemper and Nabb, 2005) and no metabolites were detected in studies conducted in humans.
Han et al. (2012) estimated that in humans the percentage of tubular reabsorption of PFOA was 99.94% and reported a renal clearance of 0.03 mL/kg per day. Fujii et al. (2015) estimated renal, bile and faecal clearances in humans. The values reported were 0.044 ± 0.01, 2.62 ± 3.6 and 0.052 ± 0.05 mL/kg per day, respectively. The renal clearance of PFOA individual isomers was investigated by Zhang et al. (2013c). The average renal clearance for linear PFOA was found to be 0.29 mL/kg per day in young females (age < 50 years) and 0.79 mL/kg per day in male and older female group. For branched PFOA, renal clearance varied from 0.57 mL/kg per day to 1.2 mL/kg per day in the first group and from 0.39 mL/kg per day to 0.92 mL/kg per day in the second group, depending on isomers. All these values are higher than those described previously by Harada et al. (2005) and Han et al. (2012). For branched PFOA, the elimination half‐lives were estimated to vary from 0.53 to 1.4 years in young females and from 1.3 to 2.5 in all males and other females, depending on the isomers, whereas for linear PFOA, the half‐lives in both groups were approximately 2.5 years. These values are comparable with the data published for humans (from 2.3 to 8.5 years), as previously reported (EFSA, 2008; ATSDR, 2015). Elimination rates were not different in males and females.
Maternal–infant transfer of PFOA via breast milk was investigated by several groups during the last decade. The ratio of the concentrations in milk vs plasma was calculated to be in the range 0.03–0.12 (ATSDR, 2015), indicating that the transfer occurs at a significant extent, representing an important excretion for lactating mothers, but also a critical exposure route for nursing infants. The lactational transfer of PFOA was recently studied by Mondal et al. (2014), showing that each month, breastfeeding was associated with 3% decrease in maternal serum concentration of PFOA, but resulted concomitantly in 6% increase in infant PFOA serum concentration.
In Norway, PFOA concentrations in plasma of children at the age of 3 years were found to be positively and significantly correlated with levels of PFOA measured in serum of mothers collected around delivery (Spearman's correlation coefficients: 0.55) (Papadopoulou et al., 2016). Approximately 98% of the samples for children had higher concentrations than in those of their mothers’. Every month of breastfeeding was associated with an increase of 4.7% in PFOA plasma levels in toddlers, independently of maternal prenatal PFOA concentrations.
In summary, these data indicate that once absorbed PFOA distributes in plasma, liver, kidney, lung and bone and does not undergo metabolism. In plasma, PFOA is mainly bound to albumin. PFOA is eliminated primarily in the urine, with lesser amounts eliminated in the faeces. Biliary excretion of PFOA was significantly higher than serum clearance via the urine, but does not substantially contribute to overall elimination, due to high biliary reabsorption. Humans have a high estimated percentage of PFOA renal tubular reabsorption (99.94%) due to the high affinity of PFOA for human uptake transport proteins such as OAT1, OAT3 and URAT1. Several studies estimated the half‐lives of PFOA in humans, most of them suggesting values between 2 and 4 years. In women, breast milk and menstruation fluids contribute to the elimination of PFOA. The half‐lives of the branched chain PFOA isomers are shorter than those for the linear molecules, suggesting that renal resorption is less efficient with the branched chains. PFOA has been detected in umbilical cord blood, breast milk and plasma samples of breastfed toddlers indicating that maternal transfer occurs pre‐ and postnatally.
Further information on factors that may have an impact on the internal doses of PFASs is given in Section 3.3.2.6.
3.3.1.3. PBPK modelling
Physiologically based pharmacokinetic models are quantitative descriptions of the absorption, distribution, metabolism and excretion (ADME) of chemicals in biota based on inter‐relationships among key physiological, biochemical and physicochemical determinants of these processes (WHO/IPCS, 2010). These models are not only used to translate external exposures into an internal (target) dose in the body, but are also developed to extrapolate between different routes of exposure and between different species.
Several PBPK models of PFOA and PFOS have been reported in rodents, monkeys and humans, including during gestation and lactation for rats and humans (see ATSDR, 2015). This subsection will mainly focus on monkey and human models.
Loccisano et al. (2011) developed a PBPK model for simulating the kinetics of PFOA and PFOS in monkeys and humans. The monkey model was based on multi‐compartmental models developed by Andersen et al. (2006) and Tan et al. (2008) for simulating the kinetics of plasma and urinary PFOA and PFOS in monkeys following intravenous and oral dosing. The models described by these authors evaluated the quantitative role of renal reabsorption via high efficiency transporters in controlling the persistence of PFOA and PFOS in monkeys (Andersen et al., 2006; Tan et al., 2013). The model simulations were consistent with the observed serum data in both intravenous and repeated oral dosing studies with PFOA and PFOS at different exposure levels. The PBPK model published by Loccisano et al. (2011) for monkeys contains compartments for plasma, gut, liver, kidney, renal filtrate, fat, skin and rest of the body. Data utilised in developing and evaluating the monkey model included single‐dose intravenous and oral studies and repeated‐dose oral studies conducted in Cynomolgus monkeys (Seacat et al., 2002; Noker and Gorman, 2003; Butenhoff et al., 2004a). Only the free fraction of PFOA and PFOS in plasma was assumed to be available to partition into tissues. Tissue–plasma partition coefficients were derived from observations in rodents. For PFOA, the partition coefficients were estimated from tissue concentration data reported by Kudo et al. (2007) following a single intravenous dose of PFOA to male Wistar rats. For PFOS, the partition coefficients were derived from tissue concentration data resulting from 5 days of dietary dosing in male C57Bl/6 mice (DePierre, personal communication cited by Loccisano et al., 2011). A description of saturable renal reabsorption was implemented in the filtrate compartment, using the transporter maximum and the transporter affinity constant as parameters. Given the limited sex difference in the elimination kinetics in monkeys (Butenhoff et al., 2004a), the same parameters for renal tubular reabsorption of PFOA and PFOS were used for males and females. Binding of PFOA and PFOS in the liver was assumed to be negligible. The physiological parameters for the monkey model were described in Loccisano et al. (2011). The model simulation was consistent with available pharmacokinetic data for monkeys.
The monkey PBPK model was extrapolated to humans (Loccisano et al., 2011). For both PFOA and PFOS, the parameters used for humans such as the tissue–plasma partition coefficient, the free fraction in plasma or the transporter affinity constant were those previously described for monkey. The transporter capacity was adjusted for each chemical to get the correct half‐life, which is higher in humans compared to monkeys. Physiological parameters for the human model were those reported by Brown et al. (1997). Data used in evaluating the human model consisted of serum measurements in residents from Little Hocking (Ohio, USA) or Arnsberg (Germany) who were exposed to PFOA‐contaminated drinking water. It was assumed that drinking water was the only source of exposure to PFOA. The adequacy of the model to predict PFOA and PFOS concentrations in humans was also assessed on the basis of the available data from American Red Cross adult blood donors and from retired fluorochemical workers reported by Olsen et al. (2007, 2008). In general, PFOA and PFOS intakes and exposure durations were not known with certainty in the populations examined by Olsen et al. (2007) and, as a result, the data provided by these authors do not yield confident evaluations of the ability of the human model to predict intake‐plasma level relationships. Follow‐up monitoring after a cessation or decrease in exposure can provide data that allow evaluation of the ability of the model to accurately simulate elimination kinetics. Predicted declines in serum PFOA concentrations encompassed observed group mean declines when the transporter maximum (Tm) for renal tubular reabsorption was set to yield elimination half‐times of 2.3 or 3.8 years. Group mean declines in serum PFOS were well predicted for some but not all populations, when the Tm for renal tubular reabsorption was optimised to yield an elimination half‐time of 5.4 years. In addition to renal reabsorption which is considered as the main process responsible for the long half‐lives of PFOA and PFOS in humans, plasma protein binding is another possible cause of this slow clearance. A better characterisation of this binding and consequently of the free fraction estimate would probably improve the model prediction.
Because the PBPK model developed by Loccisano et al. (2011) resulted in an overestimation of the concentrations of PFOA and PFOS in various tissues of people from the Tarragona region (Spain), with the exception of PFOS in liver and kidney, Fàbrega et al. (2014) decided to adapt it to estimate the PFAS content in human tissue compartments. In addition to plasma, gut, liver, fat, kidney, renal filtrate and the remaining body compartments, the adapted PBPK model included lungs and brain. Since it is not a potential site of absorption and/or accumulation, skin was removed. Model calibration and evaluation was conducted on the basis of data on PFOA and PFOS levels in food and drinking water from Tarragona County (Domingo et al., 2012a,b) and by using concentration levels in human tissues from people living in the same area (Ericson et al., 2007; Pérez et al., 2013). The Fábrega model was calibrated and evaluated by using the same set of experimental data based on autopsy tissues from subjects residing in the Tarragona County area. According the WHO guidance (WHO/IPCS, 2010), the Fàbrega model cannot be considered as formally validated because evaluation with independent data was not performed. A sensitivity analysis was carried out to understand the degree of influence of input parameters on the final outcome (Fàbrega et al., 2016). The elimination constants (transporter maximum and transporter affinity constant) as well as the free fraction and the intake were the most influential parameters. The evaluation of the PBPK model by visual comparison of the simulation results with experimental values as suggested by Chiu et al. (2007) indicates that the concentrations of both PFOS and PFOA fell within the range of the model simulations, resulting in the model being considered valid. In contrast, according to the statistical treatment (Student's t‐test), the model was not validated for the PFOS in lungs and kidneys, as well as for PFOA in brain and lungs.
The human model described in Loccisano et al. (2011) as well as the PBPK models for PFOA and PFOS in pregnant, lactating, fetal and neonatal rat (Loccisano et al., 2012) were subsequently extended to include simulations of pregnancy and lactation in humans (Loccisano et al., 2013). The changes made to the adult human model were the addition of mammary tissue, placenta, and fetal compartments, and a milk compartment for lactation. Only the mother was assumed to have direct exposure to PFASs, and only the free fraction of chemical in plasma was assumed to be available for uptake into tissues. Transport into tissues was flow‐limited. Clearance of PFASs in the mother occurs by urinary elimination from the filtrate compartment in both models; clearance in the infant is described with a generic first‐order rate constant from the central compartment. Fetal exposure to PFASs is through placental transfer, which is described as a bidirectional transfer process (from mother to fetus and fetus to mother) between free chemical in the placenta and fetal plasma. Placental transfer was described as a simple diffusion process, although the possibility that placental transport is also facilitated by an active transport process cannot be ruled out. OAT4, which is expressed in human kidney proximal tubule cells, is also expressed in human placenta and may also play a role in transport of PFOA and PFOS there. However, the possible roles that these transporters play in placental transport of PFOA and PFOS remains to be elucidated; thus, a description using simple diffusion was used in the current model. Rate constants for placental transfer were initially those from the rat model, adjusted to yield predicted maternal/fetal plasma ratios that agreed with observed maternal/fetal ratios in cord blood. An amniotic fluid compartment was included in the rat models and also in the human models. Transfer rates between the amniotic fluid compartment and the fetal body are described as simple diffusion and were the same as those used in the rat model. Transport of chemical from fetal plasma into the rest of fetal body compartment was also flow‐limited.
The lactation model included additional compartments for mammary milk and a lumped compartment representing the infant. Transfer of PFASs to milk is simulated as flow‐limited exchange between plasma and milk, governed by mammary tissue blood flow and a milk/plasma partition coefficient. Only the free fraction of chemical in plasma was available for transfer into milk. The infant was exposed only through milk, and breastfeeding lasted for 6 months post‐partum. The milk/plasma partition coefficient was calibrated to yield predictions of observed milk/plasma ratios. Transfer from maternal milk to infants is the product of the milk concentration and milk production rate (assumed to be equal to sucking rate). The pregnancy and the lactation models for PFASs were evaluated by comparing predicted maternal/fetal plasma ratios and predicted maternal plasma/milk ratios, respectively, with observations from various human monitoring studies.
The agreement between the predicted and observed concentrations of PFOA and PFOS in maternal plasma or milk, or in infant or cord plasma was good, with the ratios of predicted to observed concentrations all within a factor of 2. The sensitivity analysis identified the model parameters for which additional data would be most helpful. Data on plasma protein binding of PFOS and PFOA and how that is affected by pregnancy, placental transfer kinetics, and renal resorption of PFOS and PFOA in pregnant and lactating women, the fetus, and infant would improve model predictions. One application of the lactation and pregnancy models is the comparison of internal dose in the pregnant mother and fetus and lactating mother and nursing infant. During gestation, maternal and fetal levels of PFOA are similar and both decrease as gestation progresses. For PFOS, the same trend of decreasing concentration is observed; however, the maternal levels of PFOS are about twice what is observed in the fetus. During lactation, however, the concentration of PFOS and PFOA in the infant is equal to or higher than the mother's concentration, indicating that milk is a route of excretion for the mother and also that intake in breast milk is a substantial source of exposure for the infant. Another application of the model is to estimate maternal exposure to PFOA and PFOS using observed maternal blood PFOS and PFOA concentrations from biomonitoring studies in pregnant or lactating women.
3.3.1.4. Transfer
The transfer of a mixture of PFASs from contaminated feed into the edible tissues of 24 fattening pigs was investigated by Numata et al. (2014). The animals were fed the contaminated diet for 21 days. The mean concentration of PFOS was 137 ± 13 μg/kg and represented approximately 30% of total PFASs; the mean concentration of PFOA was 22.4 ± 2.6 μg/kg. The BAF (ratio of the concentration in the tissue vs concentration in feed) for PFOS was found to be 17.9, 9.7 and 503 in whole animals, meat and liver, respectively. The BAFs for PFOA were estimated to be 7.9, 5.3 and 32.8 in whole animals, meat and liver, respectively.
In sheep fed over a 21‐day period a corn silage contaminated by both PFOS (90 μg/kg dry matter) and PFOA (33 μg/kg dry matter), resulted in a dietary exposure of approximately 1.3 μg/kg bw per day and 0.5 μg/kg bw per day, respectively. The concentrations of PFOS and PFOA in milk over the whole exposure period were in the ranges 3.4–8.9 μg/L and 0.2–0.7 μg/L (ranges between animals), respectively, and the ratios of milk to plasma were 1:17 and 1:20, respectively. The estimated transfer of PFOS and PFOA into sheep milk was ≤ 2% and ≤ 0.4%, respectively (Kowalczyk et al., 2012).
In similar conditions (28 days dietary exposure to a mixture of PFASs), the PFOS transfer into milk, from dairy cows, was investigated by Kowalczyk et al. (2013). On the basis of the daily intake of PFAS‐contaminated grass silage and hay, the total intake of PFOS and PFOA were 7.6 ± 3.2 μg/kg bw per day and 2.0 ± 1.2 μg/kg bw per day, respectively. The estimated transfers of PFOS and PFOA into milk were found to be approximately 5 and 0.1%, respectively.
In a published thesis (Dennhöfer, 2011), female Japanese quails were dosed for 6 weeks with an equal amount PFOS and PFOA through feed (0.38, 0.66, 1.16 or 2.0 mg PFOS and PFOA/kg feed; 0.19, 0.33, 0.58 or 1.000 mg PFOS and PFOA/kg bw per day) or drinking water (0.66 or 1.16 mg PFOS and PFOA/L drinking water; 0.33 or 0.58 mg PFOS and PFOA/kg bw per day). Both compounds were excreted in eggs and accumulating in tissues (liver and muscle) in a dose‐related manner. Concentrations of PFOA measured on day 35 in eggs from the feed trial were 1.6 ± 0.2, 3.4 ± 0.2, 4.9 ± 1.2 and 12 ± 3.1 mg/kg dry weight (dw), respectively. Concentrations of PFOS were 3.3 ± 0.05, 6.6 ± 1, 9 ± 2.1 and 29.8 ± 6 mg/kg dw, respectively. In eggs, measured PFOA concentrations from the water trial were 6.4 ± 0.5 and 11.5 ± 0.6 mg/kg dw; PFOS concentrations were measured as 11.1 ± 3.6 and 23.6 ± 3.1 mg/kg dw, respectively. In the liver, 0.4–0.8% of the total cumulative dose were found for PFOA and 0.2–0.8% for PFOS. The muscle tissue contained 0.6–3.6% of the total cumulative dose of PFOA and 0.4–1.6% of the total cumulative dose of PFOS.
Martin et al. (2003a) exposed juvenile rainbow trout (Oncorhynchus mykiss) to a mixture of PFCAs and PFSAs for 34 days in the diet. The concentration of PFOS in feed was 0.54 mg/kg and represented 8.3% of total PFASs. The PFOS BAF was 0.32 ± 0.05, indicating that dietary exposure does not result in bioaccumulation of PFOS in juvenile trout. This result was confirmed by Goeritz et al. (2013) in adult rainbow trout dietary exposed for 28 days to a mixture of PFASs. The concentration of PFOS in feed was 0.50 mg/kg and represented 20% of total PFASs. In these experimental conditions, a BAF of 0.42 was calculated for PFOS. In rainbow trout dietary exposed to PFAS mixtures in which PFOA amounted to 0.42 mg/kg (Martin et al., 2003a) or 0.5 mg/kg (Goeritz et al., 2013), the PFOA BAF was 0.04. In a study performed by Mortensen et al. (2011), juvenile Atlantic salmon (Salmo salar) were force‐fed at days 0, 3 and 6 gelatine capsules containing PFOS or PFOA (each dose corresponding to 0.2 mg/kg bw). Levels of PFOS continuously increased in the blood, liver and kidney during the treatment period, whereas a steady state was observed after 3 days in the salmons exposed to PFOA. At the end of the exposure period, the PFOS average concentrations in whole blood, liver and kidney were approximately 3.0, 3.5 and 1.5 ng/g tissue, respectively, whereas for PFOA, the values were approximately 0.8, 0.3 and 0.4 ng/g tissue, respectively.
3.3.2. Biomonitoring
3.3.2.1. Selection of biomarker and appropriate matrix for assessing internal dose
Due to high persistency, PFOS and PFOA are not metabolised in the human body, and can thus be measured unchanged in biological matrices. The preferred matrix for measuring internal doses of PFOS and PFOA in humans is blood, and due to practical reasons specifically plasma or serum (Butenhoff et al., 2006). Some studies have assessed the distribution of PFOS and PFOA between whole blood, serum and plasma, and the concentrations in whole blood need to be multiplied with 2 to be comparable with serum or plasma (Ehresman et al., 2007).
Studies on breast milk and urine have also been conducted, but the concentrations are considerably lower when compared to blood, thus making the determinations more challenging (Haug et al., 2011b; Kim et al., 2011a, 2014; Liu et al., 2011; Li et al., 2013; Zhang et al., 2013c). The breast milk concentrations are usually around 0.9–2% and 1.8–9% of the maternal serum/plasma concentrations for PFOS and PFOA, respectively (Kärrman et al., 2007; Haug et al., 2011b; Kim et al., 2011a; Liu et al., 2011). Furthermore, breast milk as a sample matrix is suitable only for a limited part of the general population, which is not particularly interesting for compounds that are bioaccumulative.
Concentrations of PFOS and PFOA in non‐invasive matrices such as hair and nails have been determined in a few studies, but so far it is unclear how to compare the results to concentrations in other biological matrices (Li et al., 2013; Alves et al., 2014, 2015). A limited number of studies have also measured other biological matrices from humans, such as liver and amniotic fluid, but usually with the aim to explore the distribution of PFOS and PFOA in the body rather than for biomonitoring purposes (Jensen et al., 2012; Stein et al., 2012; Pérez et al., 2013; Yeung et al., 2013a).
3.3.2.2. Time trends
Due to changes in production and use of PFOS and PFOA, the exposure and thus also blood levels are thought to vary over time (see Section 1.3.4). To explore trends, several European time trend studies have been conducted (Kärrman et al., 2007; Haug et al., 2009; Wilhelm et al., 2009; Sundström et al., 2011; Glynn et al., 2012; Schröter‐Kermani et al., 2013; Yeung et al., 2013b,c; Axmon et al., 2014; Nøst et al., 2014; Gebbink et al., 2015; Liu et al., 2015; Bjerregaard‐Olesen et al., 2016; Stubleski et al., 2016). In general, increasing concentrations of PFOS and PFOA were observed from the early 1970s until around year 2000, while the concentrations have in most studies been observed to decrease after that.
To illustrate this, the results from a German study using samples from the German Environmental Specimen bank (Yeung et al., 2013b,c) are presented below. This study was chosen as it presents results for both genders, has satisfactory quantification limits and includes many sampling years. Samples were collected from students (age 20–29 years) in two cities: Münster (270 samples, approximately 10 samples per year from 1982 to 2009, mean age 24 years) and Halle (150 samples, approximately 10 samples per year from 1995 to 2009, mean age 23 years). Both in Münster and Halle, approximately the same number of men and women were included in the study.
PFOS: In the samples from Münster, the mean PFOS concentration increased from 27.5 ng/mL (males) in 1,982 to 41 ng/mL in 1986, and then it gradually decreased to 25 ng/mL in 1991 for males. Following this, the concentration was quite stable up to 2001 when it started decreasing more rapidly. In 2009 the mean concentration in males was 7.1 ng/mL. A similar trend was observed for the Halle samples, a quite stable mean concentration for males around 20–25 ng/mL was observed between 1995 and 1999 and then the concentration has been gradually decreasing to a mean of 6.9 ng/mL in males 2009.
PFOA: The trend for PFOA in the Münster samples was very similar to the trend for PFOS, except that no particular decrease in the concentration was observed between 1990 and 2009. The mean concentration for males in 1982 was 7.59 ng/mL, while the highest mean concentration for males of 23.4 ng/mL was observed in 1986. The mean concentration for males in 2009 was 3.45 ng/mL. For the samples from Halle, the PFOA mean concentration for males was quite stable around 5–8 ng/mL from 1995 to 2000, when it started decreasing. The mean concentration in males in 2009 was 2.73 ng/mL.
3.3.2.3. Levels in general European populations with serum or plasma samples collected from 2007–2008 and onwards
Concentrations of PFOA and PFOS in plasma and serum from European adults and children are described in detail in Tables 6 and 7. Included in the tables are results from European studies on general populations, where samples have been collected in 2007–2008 and onwards. Only results from the most recent years have been described for the time trend studies. In Table 8, descriptive statistics summarising all studies included in Tables 6 and 7 are shown, for both adults and children.
Table 6.
Concentrations of PFOS and PFOA in general European adult populations with serum or plasma samples collected from 2007–2008 and onwards
| Year | Country | Study population | Median, ng/mL | Geometric mean, ng/mL | Arithmetic mean, ng/mL | Min, ng/mL | Max, ng/mL | Reference |
|---|---|---|---|---|---|---|---|---|
| PFOS (total) | ||||||||
| 2007 | Sweden | n = 10, women, mean age; 48 years (range 36–56 years). Serum | 10.2 | NR | NR | NR | NR | Axmon et al. (2014) |
| 2010–2011 | Sweden | n = 270, women, median age: 50 years (range 22–75 years). Serum | 11.20 | NR | NR |
3.89 (P5) |
25.41 (P95) | Bjermo et al. (2013) |
| 2008–2010 | Sweden | n = 153 males, mean age: 67 years (53–79 years). Whole blood | 8.6 | 8.5 | 10 | 1.7 | 29 | Bao et al. (2014) |
| 2007–2011 | Sweden | n = 201, men with prostate cancer. Median age 67 years (range 49–79 years). Serum | 9.0 | NR | 11 | 1.4 | 69 | Hardell et al. (2014) |
| 2007–2011 | Sweden | n = 186, men without prostate cancer. Median age 67 years (range 50–79 years). Serum | 8.3 | NR | 10 | 1.7 | 49 | Hardell et al. (2014) |
| 2008–2011 | Sweden | n = 150, primiparous women, within the third week after delivery. The county has a known contamination of the drinking water with PFAS. Mean age 30.2 years (range 21–40 years). Serum | 6.6** | NR | 7.0** | 0.21** | 20** | Gyllenhammar et al. (2015) |
| 2010 | Sweden | n = 36 pools of serum. Primiparous women living in Uppsala county, donated serum samples within the third week after delivery. Age 19–41 years | NR | NR | NR | 5.1 | 7.6 | Glynn et al. (2012) |
| 2012 | Sweden | n = 3 pools primiparous women living in Uppsala County, donated serum samples within the fourth week after delivery. Serum | NR | NR | NR | 5.61** | 6.73** | Gebbink et al. (2015) |
| 2011–2014 | Sweden | n = 579, men and women, 80 years | 7.6*** | 7.8*** | 9.4*** | 0.2*** | 65*** | Stubleski et al. (2016) |
| 2007–2008 | Norway | n = 41, women, mean age: 36.7 years (range 25–45 years). Serum | 6.7 | NR | 6.9 | 2.3 | 15 | Haug et al. (2011b) |
| 2007–2008 | Norway | n = 123, pregnant women. Plasma | 4.99 | NR | 5.37 | 1.63 | 17.7 | Gützkow et al. (2012) |
| 2007–2008 | Norway | n = 99, pregnant women. Plasma | 5.5 | NR | 5.6 | 1.4 | 11.0 | Granum et al. (2013) |
| 2007–2009 | Norway | n = 391, pregnant women, age: mean 31 (18–43 years). Serum | 8.03 | NR | 8.81 | 0.3 | 35.8 | Berg et al. (2014) |
| 2012–2014 | Norway | n = 74, 59 consumers and 15 non‐consumers of fish from AFFF‐affected waters. Median age 58.5 years (range 32–79 years). Serum |
27.4(HC) 13.2(NC) |
28.0(HC) 9.56(NC) |
44.6(HC) 14.5(NC) |
10.1 (HC, P10) 1.76 (NC, P10) |
127 (HC, P90) 32 (NC, P90) |
Hansen et al. (2016) |
| 2008–2009 | Denmark | n = 247, adult men. Mean age: 19.6 years. Serum | 7.79 | NR | 8.46 |
4.28 (P5) |
14.59 (P95) |
Joensen et al. (2013) |
| 2011 | Denmark | n = 200 samples of serum from pregnant women. Serum | 8.4 | NR | 9.1 | 3.1 | 26 | Vorkamp et al. (2014) |
| 2010–2012 | Denmark | n = 392, newly pregnant women. Serum | 8.10 | NR | NR |
1.25 (P5) |
26.12 (P95) |
Jensen et al. (2015) |
| 2011 | Denmark | n = 145, women, mean age: 41 years (range 31–52 years). Plasma | 7.57 | NR | 8.30 | 2.52 | 24.38 | Mørck et al. (2015) |
| 2008–2013 | Denmark | n = 1507, pregnant women, primiparous, median age between 29 and 31 for the four quartiles of participants. Serum | 8.3 | NR | NR |
6.0 (IQR) |
10.8 (IQR) | Bach et al. (2016) |
| 2007–2009 | Faroe Islands | n = 487, pregnant women, mean age: 30.6 years. Serum | 8.26 | NR | NR | 6.22 (IQR) | 10.71 (IQR) | Timmermann et al. (2017) |
| 2010–2013 | Greenland | n = 207 pregnant women age > 18 years, Inuits. Serum | 10.15 | 10.50 | 12.46 | 2.46 | 61.3 | Long et al. (2015) |
| 2008–2009 | France | n = 38 Pregnant women, mean age 34.6 years (range 26–45 years). Serum | 2.9 | NR | 3.2 | 0.062 | 13 | Porpora et al. (2013) |
| 2008 | France | n = 478, age 18 and 75 years, males and females, had current residence in targeted areas and had a fishing license. Serum | 12.1 | 13.4 | 18.8 | 1.9 | 392.3 | Denys et al. (2014) |
| 2010–2013 | France | n = 100 pregnant women, median age of 32 years (20–46 years). Serum | 3.065 | NR | 3.67 | 0.316 | 24.5 | Cariou et al. (2015) |
| 2007–2009 | Germany | n = 44, pregnant women, mean age: 33 years (range 21–43 years), samples collected during pregnancy. Plasma | 3.2 | NR | 3.5 | NR | NR | Fromme et al. (2010) |
| 2010 | Germany | n = 18, male and female, age 20–29 years. Plasma | 3.7 | 3.8 | NR | 1.9 | 12.1 | Schröter‐Kermani et al. (2013) |
| 2008 | Italy | n = 230; 109 women and 121 men, the age ranged from 20 to 65 years. Serum | 6.31 | 5.77 | 6.86 | 0.06 | 29.6 | Ingelido et al. (2010) |
| 2011–2012 | Italy | n = 549 women, mean age: 27.7 (range 20–40 years). Serum | 2.43** | NR | 3.06** | 0.34** | 58.9** | De Felip et al. (2015) |
| 2009–2010 | Spain | n = 46, males and females, age: 19–53 years. Whole blood | NR | NR | 0.77 | 0.09 | 3.35 | Gómez‐Canela et al. (2015) |
| 2010–2012 | Slovakia | n = 120. Pregnant women. Age range 18–45 years. Plasma | 1.69 | 1.60 | 1.79 | < LOQa (NR) | 3.3 | Uhl (2016) |
| 2010–2012 | Austria | n = 114. Pregnant women. Age range 18–45 years. Plasma | 1.77 | 1.82 | 2.01 | 0.65 | 3.8 | Uhl (2016) |
| 2015 | Czech Republic | n = 300, men and women, mean age 40.8 years. Serum | 2.43 | 2.29 | NR | 0.072 | 51.1 | Sochorová et al. (2016) |
| PFOA | ||||||||
| 2007 | Sweden | n = 10, women, mean age; 48 years (range 36–56 years). Serum | 2.93 | NR | NR | NR | NR | Axmon et al. (2014) |
| 2010–2011 | Sweden | n = 270, women, median age: 50 years (range 22–75 years). Serum | 2.25 | NR | NR |
0.76 (P5) |
5.05 (P95) | Bjermo et al. (2013) |
| 2008–2010 | Sweden | n = 153 males, mean age: 67 years (53–79 years). Whole blood | 1.9 | 1.8 | 2.0 | 0.35 | 6.4 | Bao et al. (2014) |
| 2007–2011 | Sweden | n = 201, men with prostate cancer. Median age 67 years (range 49–79 years). Serum | 2.0 | NR | 2.3 | 0.320 | 15 | Hardell et al. (2014) |
| 2007–2011 | Sweden | n = 186, men without prostate cancer. Median age 67 years (range 50–79 years). Serum | 1.9 | NR | 2.0 | 0.345 | 8.4 | Hardell et al. (2014) |
| 2008–2011 | Sweden | n = 150, primiparous women, within the third week after delivery. The County has a known contamination of the drinking water with PFAS. Mean age 30.2 years (range 21–40 years). Serum | 1.5** | NR | 1.6** | 0.2** | 13** | Gyllenhammar et al. (2015) |
| 2010 | Sweden | n = 36 pools of serum. Primiparous women living in Uppsala county, donated serum samples within the third week after delivery. Age 19–41 years | NR | NR | NR | 1.4 | 2.0 | Glynn et al. (2012) |
| 2012 | Sweden | n = 3 pools primiparous women living in Uppsala County, donated serum samples within the fourth week after delivery. Serum | NR | NR | NR | 1.29** | 1.73** | Gebbink et al. (2015) |
| 2011–2014 | Sweden | N = 579, men and women, 80 years | 2.5 | 2.5 | 2.8 | 0.33 | 15 | Stubleski et al. (2016) |
| 2007–2008 | Norway | n = 41, women, mean age: 36.7 years (range 25–45 years). Serum | 1.4 | NR | 2.0 | 0.28 | 22 | Haug et al. (2011b) |
| 2007–2008 | Norway | n = 123, pregnant women. Plasma | 1.12 | NR | 1.25 | 0.36 | 4.24 | Gützkow et al. (2012) |
| 2007–2008 | Norway | n = 99, pregnant women. Plasma | 1.1 | NR | 1.1 | 0.2 | 2.7 | Granum et al. (2013) |
| 2007–2009 | Norway | n = 391, pregnant women, age: mean 31(18–43 years) Serum | 1.53 | NR | 1.70 | 0.28 | 11.0 | Berg et al. (2014) |
| 2012–2014 | Norway | n = 74, 59 consumers and 15 non‐consumers of fish from AFFF‐affected waters. Median age 58.5 years (range 32–79 years). Serum |
2.42 (HC) 2.21 (NC) |
2.40 (HC) 1.93 (NC) |
2.55 (HC) 2.35 (NC) |
1.43 (HC, 10P) 0.62 (NC, 10P) |
3.80 (HC, 90P) 5.01 (NC, 10P) |
Hansen et al. (2016) |
| 2008–2009 | Denmark | n = 247, adult men. Mean age: 19.6 years. Serum | 3.02 | NR | 3.46 |
1.82 (P5) |
6.15 (P95) |
Joensen et al. (2013) |
| 2011 | Denmark | n = 200 samples from pregnant women. Serum | 1.8 | NR | 2.2 | 0.31 | 9.7 | Vorkamp et al. (2014) |
| 2010–2012 | Denmark | n = 392, newly pregnant women. Serum | 1.58 | NR | NR |
0.31 (P5) |
9.71 (P95) |
Jensen et al. (2015) |
| 2011 | Denmark | n = 145, women, mean age: 41 years (range 31–52 years). Plasma | 1.59 | NR | 1.8 | 0.35 | 8.19 | Mørck et al. (2015) |
| 2008–2013 | Denmark | n = 107, pregnant women, primiparous, median age between 29 and 31 for the four quartiles of participants. Serum | 2.0 | NR | NR |
1.5 (IQR) |
2.6 (IQR) | Bach et al. (2016) |
| 2007–2009 | Faroe Islands | n = 487, pregnant women, mean age: 30.6 years. Serum | 1.40 | NR | NR | 0.95 (IQR) | 1.95 (IQR) | Timmermann et al. (2017) |
| 2010–2013 | Greenland | n = 207, pregnant women age > 18 years, Inuits. Serum | 1.19 | 1.19 | 1.34 | 0.29 | 6.21 | Long et al. (2015) |
| 2008–2009 | France | n = 38, pregnant women, mean age 34.6 years (range 26–45 years). Serum | 2.4 | NR | 2.9 | 0.2 | 9.1 | Porpora et al. (2013) |
| 2008 | France | n = 478, age 18 and 75 years, males and females, had current residence in targeted areas and had a fishing license. Serum | 3.9 | 3.9 | 4.7 | 0.4 | 80.8 | Denys et al. (2014) |
| 2010–2013 | France | n = 100, pregnant women, median age of 32 years (20–46 years). Serum | 1.045 | NR | 1.22 | 0.309 | 7.31 | Cariou et al. (2015) |
| 2007–2009 | Germany | n = 44, pregnant women, mean age: 33 years (range 21–43 years), samples collected during pregnancy. Plasma | 2.4 | NR | 2.6 | NR | NR | Fromme et al. (2010) |
| 2010 | Germany | n = 18, male and female, age 20–29 years. Plasma | 3.2 | 3.1 | NR | 0.8 | 8.7 | Schröter‐Kermani et al. (2013) |
| 2008 | Italy | n = 230; 109 women and 121 men, the age ranged from 20 to 65 years. Serum | 3.59 | 3.32 | 4.15 | 0.22 | 51.9 | Ingelido et al. (2010) |
| 2011–2012 | Italy | n = 549, women, mean age: 27.7 (range 20–40 years). Serum | 1.55** | NR | 1.70** |
< LOQa (0.1)** |
9.99** | De Felip et al. (2015) |
| 2009–2010 | Spain | n = 46, males and females, age: 19–53 years. Whole blood | NR | NR | 0.45 |
< LOQa (0.03) |
1.08 | Gómez‐Canela et al. (2015) |
| 2010–2012 | Slovakia | n = 120, pregnant women. Age range 18–45 years. Plasma | 4.88 | 4.05 | 5.57 | 0.9 | 17 | Uhl (2016) |
| 2010–2012 | Austria | n = 114, pregnant women. Age range 18–45 years. Plasma | 1.70 | 1.65 | 1.78 | < LOQa (NR) | 3.3 | Uhl (2016) |
| 2015 | Czech Republic | n = 300, men and women, mean age 40.8 years. Serum | 0.756 | 0.716 | NR | 0.028 | 8.97 | Sochorová et al. (2016) |
AFFF: aqueous film forming foam; P5: 5th percentile; P10: 10th percentile; P90: 90th percentile; P95: 95th percentile; HC: high consumers; NC: non‐consumers; IQR: Interquartile range; NR: not reported; LOQ: limit of quantification; **: reported in ng/g; ***: Linear PFOS.
The term LOQ has been used for both limit of quantification, limit of detection and method detection limit.
Table 7.
Concentrations of PFOS and PFOS in general European children populations with serum or plasma samples collected from 2007–2008 and onwards
| Year | Country | Study population | Median, ng/mL | Geometric mean, ng/mL | Arithmetic mean, ng/mL | Min, ng/mL | Max, ng/mL | Reference |
|---|---|---|---|---|---|---|---|---|
| PFOS (total) | ||||||||
| 2011 | Denmark | n = 145, children, mean age: 8.7 years (range 6–11 years). Plasma | 8.63 | NR | 9.02 | 2.77 | 23.01 | Mørck et al. (2015) |
| 2007–2009 | Germany | n = 44, infants, age: 6 months. Plasma | 3.0 | NR | 3.3 | NR |
8.1 (P95) |
Fromme et al. (2010) |
| 2007–2009 | Germany | n = 24, infants, age: 19 months. Plasma | 1.9 | NR | 2.2 | NR |
4.6 (P95) |
Fromme et al. (2010) |
| 2007–2008 | Germany | n = 112, children, mean age 6.6 years. Plasma | 3.58 | NR | 3.93 | 1.70 | 17.7 | Wilhelm et al. (2015) |
| 2009–2010 | Germany | n = 101, children, mean age 8.5 years. Plasma | 3.30 | NR | 3.69 | 1.34 | 16.5 | Wilhelm et al. (2015) |
| 2010–2011 | Norway | n = 112, toddlers, age: 3 years. Serum | 4.63 | 4.76 | NR | 1.20 | 18.38 | Papadopoulou et al. (2016) |
| 2012–2013 | Italy | n = 25, children and adolescents, with diabetes type 1, mean age 8.04 years (range 3.15–13.1 years). Serum | 0.95 | 1.09 | 1.53 | 0.48 | 6.68 | Predieri et al. (2015) |
| 2012–2013 | Italy | n = 19, children and adolescents, control group, mean age 8.04 years (range 1.88–13.6 years). Serum | 0.49 | 0.54 | 0.56 | 0.47 | 0.93 | Predieri et al. (2015) |
| PFOA | ||||||||
| 2011 | Denmark | n = 145, children, mean age: 8.7 years (range 6–11 years). Plasma | 3.02 | NR | 3.20 | 1.40 | 6.65 | Mørck et al. (2015) |
| 2007–2009 | Germany | n = 44, infants, age: 6 months. Plasma | 6.9 | NR | 8.0 | NR |
19.5 (P95) |
Fromme et al. (2010) |
| 2007–2009 | Germany | n = 24, infants, age: 19 months. Plasma | 4.6 | NR | 5.1 | NR |
11.4 (P95) |
Fromme et al. (2010) |
| 2007–2008 | Germany | n = 112, children, mean age 6.6 years. Plasma | 4.58 | NR | 5.01 | 1.77 | 12.1 | Wilhelm et al. (2015) |
| 2009–2010 | Germany | n = 101, children, mean age 8.5 years. Plasma | 3.56 | NR | 3.88 | 1.93 | 7.98 | Wilhelm et al. (2015) |
| 2010–2011 | Norway | n = 112, toddlers, age: 3 years. Serum | 2.63 | 2.77 | NR | 0.99 | 8.89 | Papadopoulou et al. (2016) |
| 2012–2013 | Italy | n = 25, children and adolescents, with diabetes type 1, mean age 8.04 years (range 3.15–13.1 years). Serum | 0.49 | 0.52 | 0.53 | 0.46 | 0.83 | Predieri et al. (2015) |
| 2012–2013 | Italy | n = 19, children and adolescents, control group, mean age 8.04 years (range 1.88–13.6 years). Serum | 0.48 | 0.50 | 0.50 | 0.45 | 0.67 | Predieri et al. (2015) |
P95: 95th percentile; NR: not reported.
As can be seen from Table 8, the minimum and maximum concentrations of PFOS and PFOA for individuals varied quite a lot. However, ratios between the highest and lowest median concentrations were in the range 6–18. Thus, it can be concluded that, even though the design, populations (e.g. sex, age, race), analytical methods and geographic location vary between the studies, the median concentrations of PFOS and PFOA are similar. This is also true when comparing with general populations worldwide (Haines and Murray, 2012; Wan et al., 2013; Zhang et al., 2014a; Khalil et al., 2016).
3.3.2.4. Levels in blood from occupationally exposed adults
Elevated serum concentrations have been observed in fluorochemical production workers (Olsen, 2015), with mean concentrations of both PFOS and PFOA in the range of 500–7,000 ng/mL (Fromme et al., 2009). A detailed discussion on levels in fluorochemical production workers can be found in Olsen (2015).
Two Nordic studies have reported elevated concentrations of PFOA in serum from professional ski waxers compared to background exposed adults. A median PFOA concentration of 112 ng/mL whole blood (range 4.8–535 ng/mL) was observed in the Swedish study (Nilsson et al., 2010) and 50 ng/mL serum (range 20–174 ng/mL) in the Norwegian study (Freberg et al., 2010).
In a study from Australia, elevated serum concentrations of PFOS (median of 66 ng/mL) were observed in firefighters when compared to the general population (Rotander et al., 2015) Furthermore increased PFOA concentrations were reported in blood from US firefighters (Tao et al., 2008; Shaw et al., 2013; Dobraca et al., 2015).
3.3.2.5. Levels in blood from populations with elevated drinking water exposure
Elevated concentrations of PFOS and PFOA have been observed in several US communities, which have been affected by environmental releases that have contaminated the drinking water. In an area in Minnesota (USA) where the levels in the drinking water in some wells were above the state's health risk limits for PFOA and/or PFOS, the geometric mean serum concentrations for persons drinking water from the wells were three to four times higher for PFOS and PFOA than what has been reported in the general US population (MDH, 2012). A similar situation was registered in Alabama (USA), where two to four times higher serum concentrations of PFOS and PFOA when compared to the general US population were observed (ATSDR, 2013). In the Mid‐Ohio River Valley in the USA, six water districts were contaminated with PFOA. In an extensive assessment of blood from almost 67,000 persons, the geometric mean concentration for PFOA was more than five times higher than the concentrations reported in the general adult population (Frisbee et al., 2009).
In Arnsberg, Germany an area with elevated drinking water levels was identified (Skutlarek et al., 2006). Following this, a biomonitoring study was conducted and elevated concentrations of PFOA with geometric mean concentrations of 23.4, 23.6 and 30.3 ng/mL for children, women and men, respectively were observed (Hölzer et al., 2008). Several measures were introduced, and two years later the levels had declined with 39% and 26% for women/children and men, respectively (Brede et al., 2010). Another episode of contamination of drinking water has been reported in Ronneby County, Sweden. In a first screening, blood samples from adults and children were analysed and elevated levels of a number of PFASs were found. Concentrations up to around 60 and 1,200 ng/mL were observed for PFOA and PFOS, respectively (Jakobsson et al., 2014).
These episodes with environmental releases resulting in increased exposure to the general populations, reveals that even though most general populations worldwide are exposed to PFOS and PFOA to a similar extent, a considerably higher exposure might be experienced (Post et al., 2012).
3.3.2.6. Factors that may have an impact on the internal dose
Humans are exposed to PFOS and PFOA from the conception throughout their lives. Several studies have measured concentrations of these contaminants in paired samples of maternal blood and cord blood, demonstrating considerable transplacental transfer and high correlations between maternal and cord blood (Apelberg et al., 2007a; Kim et al., 2011a; Gützkow et al., 2012; Ode et al., 2013; Porpora et al., 2013; Zhang et al., 2013b; Zhang and Qin, 2014; Fisher et al., 2016). After birth, breast milk has been identified as a major source of exposure to PFOS and PFOA (Fromme et al., 2010; Haug et al., 2011b; Papadopoulou et al., 2016). Pre‐ and postnatal exposure has also been described in a two‐generation pharmacokinetic model, which was validated using measured concentrations in children (Verner et al., 2016). The model showed that the daily intake through breastfeeding and the internal PFOS and PFOA concentrations can be much higher in nursing infants than in mothers.
No clear regional differences in exposure to PFOS and PFOA have been observed for general populations. However, there are indications of lower prevalence of these compounds in low‐income countries (Kannan et al., 2004; Fromme et al., 2009). Several biological factors may influence the body burden of PFOS and PFOA, including age, gender and ethnicity. An increase of contaminant levels in body fluids with age has been well documented for polychlorinated legacy POPs, such as PCBs (Laden et al., 1999), however for PFOS and PFOA, the age dependency seems to be more questionable (Fromme et al., 2009). As described by Nøst et al. (2014), age dependency is complicated to assess as the exposure to these contaminants has changed over time, and thus it is difficult to distinguish between the effect of changes in the exposure and accumulation due to age. Furthermore, several other factors also have an impact on the PFAS levels, and thus complicates the assessments of age dependency. However, as several of these compounds have long elimination half‐lives (see Section 3.3.1), accumulation with age is anticipated. On the other hand, the exposure to infants and toddlers might be higher than the exposure to adults, among others because of low body weight for infants and toddlers, resulting in higher blood levels for children compared to adults.
Differences in blood concentrations of PFOS and PFOA between sexes have been observed in a large number of studies (Fromme et al., 2009; Ingelido et al., 2010; Haines and Murray, 2012; Bjermo et al., 2013), with levels in females usually being lower than in males. Sex‐related differences in exposure (Kato et al., 2015), physiological differences including urinary elimination due to renal reabsorption (Han et al., 2012), menses (Wong et al., 2014), pregnancy and lactation (Brantsaeter et al., 2013) are likely causes of this. Studies from the US indicate ethnic differences in body burdens of PFOS and PFOA, with mean serum concentrations of Mexican Americans being lower compared to non‐hispanic whites (Calafat et al., 2007; Khalil et al., 2016). Inconsistent results on associations between PFOS and PFOA concentrations in blood and body weight/body mass index (BMI) for adults have been reported. Some studies have reported inverse associations (Eriksen et al., 2011; Kato et al., 2014; Lauritzen et al., 2016), while others have found positive (Halldorsson et al., 2008) or no associations (Rylander et al., 2009). Several studies have assessed the impact of socio‐economical status on the concentrations of PFOS and PFOA in blood. Many studies have found increasing PFOS and PFOA concentrations with increasing income (Calafat et al., 2007; Nelson et al., 2012; Brantsaeter et al., 2013; Jain, 2014; Kato et al., 2014; Sagiv et al., 2015), while the influence of education is not as consistent (Apelberg et al., 2007b; Calafat et al., 2007; Halldorsson et al., 2008; Nelson et al., 2012; Brantsaeter et al., 2013; Jain, 2014; Kato et al., 2014; Sagiv et al., 2015).
3.3.2.7. Linear and branched isomers
As has been described above (see Section 1.3.1) PFOS and PFOA may exist as both linear and branched isomers, whereof some of the branched isomers are chiral compounds. In most biomonitoring studies, the sum of linear and branched isomers are reported. However, determining isomer patterns have been of particular interest for exploring sources of exposure (Martin et al., 2010; Miralles‐Marco and Harrad, 2015). Miralles‐Marco and Harrad (2015) have summarised the relative proportion of linear PFOS in blood from various studies, and found that it could vary from around 50% to 80%. In contrast, the relative proportion of linear PFOA in blood was found to be around 98% (Beesoon et al., 2011).
3.3.2.8. Summary
To summarise, the most commonly used matrix for biomonitoring of PFOS and PFOA is blood, and specifically serum or plasma. Following an increase from the early 1970s, decreasing concentrations of these two compounds have been observed in many time trend studies after the year 2000. For PFOS, the medians of the median concentrations in serum/plasma in the studies included in this opinion are 7.7 ng/mL (range 0.06–392.3 ng/mL) and 3.2 ng/mL (range 0.47–23.0 ng/mL) for adults and children, respectively. Similarly, medians of the median concentrations for PFOA are 1.9 ng/mL (range 0.03–80.8 ng/mL) and 3.3 ng/mL (range 0.45–19.5 (95th percentile) ng/mL). As can be seen from the range, for some individuals in general populations, much higher concentrations of PFOS and PFOA have been reported, and this is also the case for occupationally exposed adults as well as for persons experiencing elevated exposure from for instance contaminated drinking water. Several other factors may have an influence on the concentrations measured in serum or plasma, such as; age, gender and socio‐economical status.
3.3.3. Toxicity in experimental animals
With a few exceptions, information is missing whether linear or branched forms of PFASs were applied in acute, subchronic and chronic toxicity studies, as outlined below.
3.3.3.1. Acute toxicity
In the EFSA, 2008 scientific opinion on PFOS, PFOA and their salts (EFSA, 2008), an oral LD50 value for PFOS of 251 mg/kg bw was reported for CD rats. Oral LD50 values of PFOA were found to be 680 and 430 mg/kg bw in male and female CD rats, respectively. The target organ identified was the liver. A further study confirmed an oral LD50 > 500 mg/kg bw in male rats and an LD50 between 250 and 500 mg/kg bw in female animals (EFSA, 2008). Table 9 lists the available acute toxicity studies for PFOS and PFOA published since 2007. In accordance with the previous EFSA, 2008 opinion, it can be concluded that PFOS and PFOA have moderate acute toxicity after oral administration.
Table 9.
Acute studies
| Substance (Purity) | Species/dose route/doses | Most sensitive endpoints | Highest dose with no effect (mg/kg bw) | Significant effect level (mg/kg bw) | LD50 mg/kg bw | Reference |
|---|---|---|---|---|---|---|
| PFOS | ||||||
| PFOS (potassium salt, 86.9% purity) |
Sprague–Dawley rats (f) No/sex/group: 5–15 Single oral application: 0 or 15 mg/kg bw |
Decreases in serum total T3, T4 and reverse T3 within 24 h | N/A | 15 | N/A | Chang et al. (2008) |
| PFOS (potassium salt, ≥ 98% purity) |
Wistar rats (m) No/sex/group: 2–3 Single oral application: 0, 125, 250, or 500 mg/kg bw |
Ultrasound‐evoked convulsions | 125 | 250 |
> 250 < 500 |
Sato et al. (2009) |
| PFOS (potassium salt, ≥ 98% purity) |
ICR mice (m) No/sex/group: 2–3 Single oral application: 0, 125, 250, or 500 mg/kg bw |
Ultrasound‐evoked convulsions | N/A | 125 | ~ 500 | Sato et al. (2009) |
| PFOS (98% purity) |
C57Bl/6 mice (m) No/sex/group: 10 Oral gavage: 0, 300, 400, 500, 600, or 700 mg/kg bw |
N/A | N/A | N/A | 579 | Xing et al. (2016) |
| PFOA | ||||||
| PFOA (free acid, 96% purity) |
C57Bl/6 mice (m) No/sex/group: 4–5 Single i.p. administration: 0 or 40 mg/kg bw |
Decr mRNA and protein of Oatp1a1 Oatp1a4, Oatp1b2 | N/A |
40 40 |
N/A | Cheng and Klaassen (2008a) |
| PFOA (96% purity) |
C57Bl/6 mice (m) No/sex/group: 5 single i.p. administration: 0 or 40 mg/kg bw |
Incr mRNA and protein of Cyp2B Cyp4A |
N/A |
40 40 |
N/A | Cheng and Klaassen (2008b) |
| PFOA (> 90% purity) |
Wistar rats (m) No/sex/group: 2–3 Single oral application: 250–1,000 mg/kg bw |
N/A | 1,000 | N/A | N/A | Sato et al. (2009) |
bw: body weight; f: female; i.p.: intraperitoneal; m: male; N/A: not applicable; PFOA: perfluorooctanoic acid; PFOS: perfluorooctane sulfonic acid; T3: triiodothyronine; T4: thyroxine.
3.3.3.2. Repeated dose toxicity
3.3.3.2.1. PFOS
In the EFSA, 2008 opinion (EFSA, 2008), the liver was considered to be the major target organ for repeated dose toxicity of PFOS in rodent studies, as indicated by increased liver weight, vacuolisation and hypertrophy of hepatocytes, and induction of peroxisomal β‐oxidation. PFOS was also found to reduce body weight and serum levels of cholesterol, triglycerides and triiodothyronine. Male rats appeared to be more sensitive than females. A study on cynomolgus monkeys served to determine the earliest measurable response of primates to PFOS exposure and to reduce uncertainty in human health risk assessment. Male and female animals received the potassium salt of PFOS at 0, 0.03, 0.15 or 0.75 mg/kg bw per day for 26 weeks (Seacat et al., 2002). Only the 0.75 mg/kg bw per day dose exerted toxicity, such as mortality of one‐third of male monkeys, decreased body weights, increased liver weights with hepatocellular hypertrophy and vacuolation, lowered serum total cholesterol, lowered triiodothyronine concentrations (without evidence of hypothyroidism), and lowered oestradiol levels. In the liver, no evidence for peroxisomal or cell proliferation could be obtained. No adverse effects occurred at a dose of 0.03 mg/kg bw per day. At 0.15 mg/kg bw per day some serum parameters were altered occasionally, such as inorganic phosphate or total thyroxine. In the EFSA, 2008 opinion (EFSA, 2008) it was concluded that monkeys show a steep dose response and are more sensitive than rats.
Since the release of the EFSA opinion numerous further studies on repeated dose toxicity have been published. These are listed in Table 10.
Table 10.
Repeated dose toxicity studies for PFOS
| Substance (Purity) | Species/Experimental design and doses | Most sensitive endpoints | Highest dose with no effect (mg/kg bw per day) | Significant effect level (mg/kg bw per day) | Serum/tissue level of PFOS | Reference |
|---|---|---|---|---|---|---|
| PFOS (potassium salt, linear form, ≥ 98% purity) |
Sprague–Dawley rats (m,f) No/sex/group: 15 Duration: 28 days Diet: 2, 20, 50 or 100 mg/kg in chow; (equivalent to: 0, 0.14, 1.33, 3.21 or 6.34 mg/kg bw per day for males; 0, 0.15, 1.43, 3.73 or 7.58 mg/kg bw per day for females) |
Incr rel liver weight (m) Incr rel liver weight (f) Decr serum T4 level (m, f) Decr serum cholesterol (f) Incr mRNA of Cyp4A22 (m) Incr mRNA of ACOX 1 (m) Incr mRNA of ACOX 1 Cyp4A22, (f) |
0.14 N/A 0.14/0.15 1.43 0.14 1.33 1.43 |
1.33 0.15 1.33/1.43 3.73 1.33 3.21 3.73 |
Concentration (in μg/g) in males: At 0.14 mg/kg bw per day in serum 0.95 ± 0.13 liver 48.3 ± 5.8 At 1.33 mg/kg bw per day in serum 13.5 ± 1.5 liver 560 ± 104 Concentration (in μg/g) in females: At 0.15 mg/kg bw per day in serum 1.5 ± 0.23 liver 43.4 ± 6.8 At 1.43 mg/kg bw per day in serum 15.4 ± 1.6 liver 717 ± 59 At 3.73 mg/kg bw per day in serum 31.9 ± 3.6 liver 597 ± 158 |
Curran et al. (2008) |
| PFOS (potassium salt, 98% purity) |
Sprague–Dawley rats (m) No/sex/group: 10 Duration: 28 days Gavage: 0, 5, 20 mg/kg bw per day |
Incr relative liver weight Incr relative kidney weight Incr relative testis weight |
N/A |
5 5 5 |
Concentration (in μg/g or mL) at 5 mg/kg bw per day: Blood. 72 ± 25.7 Liver: 345 ± 40 Kidney: 93.9 ± 13.6 Lung: 46.6 ± 17.8 Heart: 168 ± 17. Testis: 39.5 ± 10 Brain: 13.6 ± 1 |
Cui et al. (2009) |
| PFOS (tetrabutyl ammonium salt, 98% purity) |
C57Bl/6 (H‐2) mice (m) No/sex/group: 4 Duration: 10 days Diet: 0, 0.001%, 0.005%, 0.02%; (equivalent to 2, 10, 40 mg/kg bw per day) |
Incr liver weight Decr spleen weight Decr thymus weight Decr body weight Decr body fat weight |
2 10 10 10 10 |
10 40 40 40 40 |
Concentration (in μg/g or mL) in serum at 0 mg/kg bw per day: 0.029 ± 0.01 2 mg/kg bw per day: 50.8 ± 2.5 10 mg/kg bw per day: 96.7 ± 5.2 40 mg/kg bw per day: 340 ± 16 |
Qazi et al. (2009a) |
| PFOS (potassium salt, purity not specified, Fluka) |
Wistar rat (m) No/sex/group: 5–6 Duration: 13 weeks Diet: 0, 2, 8, 32 or 128 ppm (equivalent to 0, 0.1–0.2, 0.4–0.8, 1.5–3.5, 5.6–13.9 mg/kg bw per day) |
Decr body weight Incr rel liver weight Incr rel brain weight |
0.4–0.8 0.41 0.41 |
1.5–3.5 1.6 1.6 |
Concentrations in (mg/kg) at PFOS doses of 0.4–0.8 mg/kg bw per day: Serum: 44.1 ± 5.6 Brain: 6.9 ± 1.4 Liver: 135 ± 42.7 Kidney: 36 ± 11.2 Concentrations in (mg/kg) at PFOS doses of 1.5–3.5 mg/kg bw per day: Serum: 177 ± 20 Brain: 22.3 ± 114 Liver: 647 ± 113 Kidney: 188 ± 46.8 |
Kawamoto et al. (2011) |
| PFOS (potassium salt, > 98% purity, 3M) |
Sprague–Dawley rats (m/f) No/sex/group 12 Duration: 28 days Gavage: 0, 1.25, 5, 10 mg/kg bw per day |
Incr relative liver weight (m, f) Incr mRNA of f CYP4A1 (m) Incr serum aspartate aminotransferase (AST) (m) |
5 1.25 5 |
10 5 10 |
Kim et al. (2011b) | |
| PFOS (potassium salt, 86.9% purity) |
Sprague–Dawley rats (m) No/sex/group: 10 Duration: 1, 7, 28 days Diet: 20 or 100 ppm; (equivalent to 0, 1.7 ± 0.3 and 7.9 ± 2.1 mg/kg bw per day) |
Incr hepat. ACOX activity (day 28) Incr rel liver weight (day 28) Incr hepat. proliferation (day 7) Incr hepat. proliferation (day 28) Incr hepat. apoptotic index (day 7) Decr serum cholesterol (day 28) |
N/A N/A N/A 1.7 N/A N/A |
1.7 1.7 1.7 7.9 1.7 1.7 |
Concentrations (μg/g or μg/mL) at 2.4 mg/kg bw per day in Serum: 34.9 ± 3.9 (day 7) and 94.3 ± 11.6 (day 28) Liver: 70.1 ± 11 (day 7) and 235.3 ± 20.9 (day 28) |
Elcombe et al. (2012) |
| PFOS (98% purity) |
CD‐1 mice (m) No/sex/group: 4 Duration: 3,7,14,21 days Gavage: 0, 1, 5, 10 mg/kg bw per day |
Incr rel liver weight (day 7) Incr total hep triglycerides (day 7, 21) Decr serum LDL/VLDL level (day 21) Incr hepat. ACOX mRNA (day 7) |
N/A 1 1 1 |
1 5 5 5 |
NR | Wan et al. (2012) |
| PFOS (> 98% purity) |
Balb/c mice (m) No/sex/group: 4 Duration: 14 days Gavage: 0, 5 or 20 mg/kg bw per day |
Incr abs and rel liver weight Incr hepatic lipid concentration Decr serum HDL‐cholesterol Decr serum triglycerides, cholesterol, LDL‐cholesterol |
N/A N/A N/A 5 |
5 5 5 20 |
NR | Wang et al. (2014a) |
| PFOS (98% purity) |
C57BL/6J mice (m) No/sex/group: 10 Duration: 30 days Gavage: 0, 2.5, 5, 10 mg/kg bw per day |
Incr rel liver weight Incr ALP Incr AST Incr ALT Incr GGT |
N/A 2.5 N/A 2.5 N/A |
2.5 5 2.5 5 2.5 |
Serum concentrations (μg/mL) at 2.5 mg/kg bw day: 70.2 ± 2.4 at 5 mg/kg bw per day: 130.6 ± 6.5 |
Xing et al. (2016) |
| PFOS (> 98% purity, linear form) |
Sprague–Dawley rats (m) No/sex/group: 8–10 Duration: 91 days Drinking water: 0, 1.7, 5 or 15 mg/L (equivalent to 0.09, 0.25 or 0.75 mg/kg bw per daya) |
Incr rel & abs liver weight Decr total serum T4 Decr mRNA of hepatic deiodinase 1 Incr mRNA of hepatic UGT1A |
0.09 0.09 0.25 0.09 |
0.25 0.25 0.75 0.25 |
Serum concentrations (μg/mL) at 0.09 mg/kg bw per day: 5 ± 0.3 at 0.25 mg/kg bw per day: 33.6 ± 2.1 at 0.75 mg/kg bw per day: 88.2 ± 4.2 |
Yu et al. (2009) |
| PFOS (> 98% purity, linear form) |
Wistar rats (f) No/sex/group: 12–13 Duration: 5 days Gavage: 0, 0.2, 1 or 3 mg/kg bw per day |
Decr total serum T4 Decr total serum T3 Incr mRNA of hepatic Oatp2 |
0.2 1 1 |
1 3 3 |
Serum concentrations (μg/mL) at 0.2 mg/kg bw per day: 1.1 ± 0.1 at 1 mg/kg bw per day: 8.2 ± 0.1 at 3 mg/kg bw per day: 33.5 ± 1.8 |
Yu et al. (2011) |
| PFOS (87% purity, from 3M) |
C57Bl/6 mice (m) No/sex/group: 5–6 Duration: 21–23 days Diet: 0, 0.003%, 0.006%, 0.012% (equivalent to 6, 12 or 24 mg/kg bw per daya) |
Incr rel liver weight Incr serum ALT Hepatic steatosis Incr hepatic triglycerides |
N/A N/A N/A N/A |
6 6 6 6 |
NR | Zhang et al. (2016a) |
ACOX: acyl‐CoA oxidase; ALP: alkaline phosphatase; ALT: alanine aminotransferase; AST: aspartate aminotransferase; bw: body weight; f: female; GGT: gamma‐glutamyl transferase; HDL: high‐density lipoproteins; LDL: low‐density lipoproteins; m: male; N/A: not applicable; NR: not reported; Oatp: organic anion‐transporting polypeptide; PFOA: perfluorooctanoic acid; PFOS: perfluorooctane sulfonic; T3: triiodothyronine; T4: thyroxine; UGT: uridine 5′‐diphospho‐glucuronosyl transferase; VLDL: very low‐density lipoprotein.
Calculated using EFSA default values (EFSA, 2012).
Most studies focused on hepatic effects of PFOS. Elevated relative liver weight and induction of enzymes, being indicative of enhanced peroxisomal β‐oxidation, could be seen in a consistent way. The most sensitive parameter observed was a statistically significant increase in the relative liver weight in female Sprague–Dawley rats, occurring at a dose of 0.15 mg/kg bw per day after 28 days of treatment (Curran et al., 2008). This increase was based on a clear dose‐dependent increase in absolute liver weight, which reached significance at the next higher dose of 1.43 mg/kg bw per day. Similar observations are reported by Yu et al. (2009) at 0.25 mg/kg bw in male rats after 91 days of treatment. With regard to further effects in the liver, elevated peroxisomal β‐oxidation could be observed at doses of 1.3–3.7 mg/kg bw after 28 days of treatment in rats of both sexes (Curran et al., 2008; Elcombe et al., 2012). Elevated intrahepatic lipid levels, and increased liver enzymes and lowered lipids in the serum occur mostly at somewhat higher doses.
Two studies compared the effects in male and female rats, i.e. Curran et al. (2008) observed similar serum and liver concentrations of PFOS in both sexes and also the impact on liver transaminases was comparable between male and female rats. Kim et al. (2011b) did not find any gender difference with regard to the induction of relative liver weight. In males, elevated Cyp4A1 mRNA was observed at 5 mg/kg bw per day.
A further sensitive parameter appears to be the decrease of serum T4 levels occurring at 0.25 mg/kg bw per day in male rats after 91 days of treatment (Yu et al., 2009). The authors stated that induction of hepatic enzymes, involved in the metabolism of thyroid hormones, could account for this effect.
In summary, the rodent liver appears to be the major target organ for repeated dose toxicity of PFOS, as indicated by increased liver weight, hypertrophy of hepatocytes, and induction of peroxisomal β‐oxidation, which agrees with the EFSA opinion of 2008 (EFSA, 2008).
3.3.3.2.2. PFOA
In the EFSA opinion 2008 (EFSA, 2008), the liver was considered to be the major target organ for subacute toxicity of PFOA in rodent studies, as indicated by increased relative liver weight and the induction of hepatic peroxisomal β‐oxidation. A special focus was given to studies on cynomolgus monkeys to eliminate uncertainties in human health risk assessment. In a 90‐day oral toxicity study on rhesus monkeys applying doses of 0, 3, 10, 30 and 100 mg/kg bw per day, PFOA resulted in mortality of all monkeys at week 5, at 100 mg/kg bw per day, and three monkeys from the 30 mg/kg bw per day group at week 3 (Goldenthal et al., 1978). In another study, male cynomolgus monkeys received PFOA at 0, 3, 10 or 30 (reduced to 20) mg/kg bw per day for 26 weeks (Butenhoff et al., 2002). The liver weight was increased dose dependently due to mitochondrial proliferation. Signs of liver injury were not found at either 3 or 10 mg/kg bw per day, while hepatic damage and reduced body weight became evident at 30/20 mg/kg bw per day. There were no further treatment‐induced changes. A NOAEL could not be derived, due to increased liver weight at 3 mg/kg bw per day. It was concluded that the liver appears to be a target organ of PFOA also in primates. In the EFSA opinion 2008 the lowest NOAEL identified was 0.06 mg/kg bw per day, derived from a subchronic study in male rats. In this study (Perkins et al., 2004), animals were treated with 0, 0.06, 0.64, 1.94 and 6.5 mg/kg bw per day for 13 weeks. Elevated absolute and relative liver weights, an induction of peroxisomal β‐oxidation and mild hepatocellular hypertrophy were seen at 0.64 mg/kg bw per day.
Since the release of the EFSA opinion in 2008 additional studies on repeated dose toxicity of PFOA have been published. These are listed in Table 11.
Table 11.
Repeated dose toxicity studies for PFOA
| Substance (Purity) | Species/Experimental design and doses | Most sensitive endpoints | Highest dose with no effect (mg/kg bw pe day) | Significant effect level (mg/kg bw per day) | Serum/tissue level of PFOA | Reference |
|---|---|---|---|---|---|---|
| PFOA (ammonium salt, > 98% purity) |
ICR mice (m) No/sex/group: 5–6 Duration: 21 days Drinking water: 0, 2, 10, 50 or 250 mg/L; (equivalent to 0, 0.49 ± 0.04, 2.64 ± 0.15, 17.63 ± 1.15, 47.21 ± 3.57 mg/kg bw per day) |
Incr rel liver weight Incr serum ALT |
N/A 0.49 |
0.49 2.64 |
NR | Son et al. (2008) |
| PFOA (96% purity) |
Sprague–Dawley rats (m) No/sex/group: 10 Duration: 28 days Gavage: 0, 5, 20 mg/kg bw per day |
Incr rel liver weight Incr rel kidney weight Incr rel testis weight |
N/A N/A N/A |
5 5 5 |
Concentration (in μg/g or mL) at 5 mg/kg bw per day: Blood. 39.2 ± 14.4 Liver: 218 ± 21 Kidney: 228 ± 37 Lung: 63 ± 11.3 Heart: 35.5 ± 17.66 Testis: 16.7 ± 16.9 Brain: 10.5 ± 9.8 |
Cui et al. (2009) |
| PFOA (ammonium salt, > 98% purity) |
29S4/SvlmJ mice (m) No/sex/group: 9–10 Duration: 4 weeks Gavage: 0, 12.5, 25, 50 μmol/kg bw per day; (equivalent to 0, 5.4, 10.8, 21.5 mg/kg bw per day) |
Incr rel liver weight Incr ALT Incr serum triglycerides Decr serum cholesterol |
N/A N/A N/A 5.4 |
5.4 5.4 5.4 10.8 |
Concentration (in μg/g or mL) at 5.4 mg/kg bw per day: Blood. 20.6 ± 2.4 Liver: 181.2 ± 6.3 at 10.8 mg/kg bw per day: Blood. 46.9 ± 3.2 Liver: 198.8 ± 15.4 at 21.5 mg/kg bw per day: Blood. 64.2 ± 6.5 Liver: 211.6 ± 13.3 |
Minata et al. (2010) |
| PFOA (> 96% purity) |
Balb/c mice (m) No/sex/group: 4 Duration: 14 days Gavage: 0, 5, 10 or 20 mg/kg bw per day |
Incr relative liver weight Decr serum triglycerides |
N/A 5 |
5 10 |
NR | Wang et al. (2013a) |
| PFOA (96% purity) |
Kunming mice (m) No/sex/group: 4 Duration: 14 days Gavage: 0, 2.5, 5, 10 mg/kg bw per day |
Incr relative liver weight Incr serum ALT Incr hepatic malondialdehyde level |
N/A N/A N/A |
2.5 2.5 2.5 |
NR | Yang et al. (2014) |
ALT: alanine aminotransferase; bw: body weight; m: male; N/A not applicable; NR not reported; PFOA: perfluorooctanoic acid; PFOS: perfluorooctane sulfonic acid.
Studies in rats and mice from 2008 onwards confirmed that the liver is the main target organ for PFOA induced toxicity, as indicated by increased relative liver weights. Son et al. (2008) observed a LOAEL of 0.49 mg/kg bw per day for increases in relative liver weight in mice. Elevated liver enzymes in serum occurred at doses of about 2.5 mg/kg bw per day in mice in two independent studies (Son et al., 2008; Yang et al., 2014). Evidence for liver damage was also obtained by enhanced lipid peroxidation, as indicated by elevated hepatic malondialdehyde concentrations at daily doses of 2.5 mg/kg bw per day (Yang et al., 2014). Some alterations in kidney and serum thyroid hormone levels were observed at higher PFOA doses. All studies used male animals impairing any comparison between sexes. PFOA elevated the relative liver weight and exhibited similar serum concentrations in rats and mice at a similar dose range, indicating that both species appear to have the same sensitivity towards PFOA.
3.3.3.3. Developmental and reproductive toxicity
3.3.3.3.1. PFOS
In the EFSA, 2008 opinion (EFSA, 2008), a review article on developmental toxicity (Lau et al., 2004), and an OECD report (2002) were reviewed. Data were available from different animal species including rabbits, mice and rats, the latter being used in a two‐generation study. EFSA (2008) summarised effects regarding fetal or neonatal survival or defects that are generally detected below doses at which maternal toxicity occurs with the exception of perhaps one study in New Zealand white rabbits (Case et al., 2001). Reduction in fetal weight, cleft palate, anasarca, bone effects and cardiac abnormalities were observed. Dose–response curves were steep, with a high mortality rate being observed early after birth. Studies aiming to determine sensitive windows of development, point to a late gestational period as being particularly sensitive. The authors of the study in question were able to derive LOAELs, NOAELs and or were able to perform benchmark dose analysis. The values for parental effects were more sensitive than those obtained for effects in F1 and F2 generations of a two‐generation reproduction study. The most sensitive LOAEL of 0.4 mg/kg bw per day and corresponding NOAEL of 0.1 mg/kg bw per day was derived for overall parental effects (Luebker et al., 2005). This study was used by FSANZ to derive a TDI of 20 ng/kg bw per day (FSANZ, 2017). This TDI was based on decreased parental and offspring body weight gain which became apparent in this multigeneration reproductive toxicity study in rats. Because of the marked variation in the half‐life of PFOS amongst species, authors applied a pharmacokinetic modelling approach on the use of the NOAEL. Furthermore, a default uncertainty factor was set to account for pharmacokinetic differences. The CONTAM Panel noted that the compound used in the study by Luebker et al. (2005) had a purity of 86.9%, raising the question of whether the observed effects and their magnitude are due to PFOS exposure only.
The following sections review the literature after the publication of the EFSA opinion in 2008, and Table 12 summarises the studies listed here.
Table 12.
PFOS reproductive and developmental toxicity
| Substance/(Purity) | Species/Experimental design and doses | Most sensitive endpoints | Highest dose with no effect (mg/kg bw per day) | Significant effect level (mg/kg bw per day) | Serum/tissue levels of compound | Reference | ||
|---|---|---|---|---|---|---|---|---|
| Mother | Offspring | Mother | Offspring | |||||
| PFOS (98% K+‐Salt) |
ICR mice 15 dams/group (5 each selected for specific endpoints Exposure: 0, 1, 10, 20 mg/kg bw per day, GD 1–17/18 |
Reduced weight gain Increased liver weight Liver hypertrophy Decreased neonatal survival Developmental/teratological alterations Sternal defects |
10 1 10 |
1 1 N/A |
20 10 20 |
10 10 1 |
NR | Yahia et al. (2008) |
| PFOS (98% K+‐Salt) |
C57BL/6J‐Apc+/+ female mated with C67BL6J‐Min/+ males (n = 20/21) Exposure: 0, 0.1, 3 mg/kg bw per day experimental block 1 per drinking water 0, 0.01, 0.1, 3 mg/kg per bw day experimental block 2 per drinking water GD 1–17 ApcMin/+ genotype mice were terminated at 11 weeks of age for tumorigenesis. Wild‐type mice were kept until week 20 for obesogenic effects |
No obesogenic effects, no intestinal tumorigenesis Comparative study approach revealed that mild toxicity effects seen for PFOA did not occur in response to PFOS |
0.1 mg/kg bw per day: 2.2/2.7 μg/mL in GD 18 Dams, 0.48/0.54 μg/mL dams after weaning and 0.38/0.3 μg/mL pups after weaning 3.0 mg/kg bw per day: 36.6/44.6 μg/mL in GD 18 dams; 17.2/22.2 μg/mL Dams after weaning and N/A pups after weaning |
Ngo et al. (2014) | ||||
| PFOS (purity 98%, K+‐salt) |
ICR mice Exposure 0, 9, 13, 20, 30 mg/kg bw per day by gavage GD 1–14/18 Additionally: 20 mg/kg bw per day GD 1–15 and 50 mg/kg bw per day GD 11–15 Dams 5–8 Fetuses: 67–103 (examined animals, total number higher) |
Liver weight increase Liver weight decrease Sharp increase in cleft palate between 13 and 20 mg/kg bw per day=> threshold mechanism |
13 50% effective dose expected 17.7 mg/kg bw per day |
13 13 50% effective concentration for cleft palate 121 μg/mL |
20 |
20 20 |
In dams 30 mg/kg bw per day lead to 162.3 μg/mL | Era et al. (2009) |
| PFOS (purity 98%, salt not specified) |
Sprague–Dawley rats Exposure: 0, 0.1, 0.6, 2 mg/kg bw per day, per gavage GD 2–21 Dams: 10 per group Follow‐up offspring: Neonatal survival PND 4 (all), survivors until PND 21: 6 per group |
Increase mortality of offspring at 2 mg/kg bw per day Reduced body weight offspring Increased heart to body weight ratio at PND Cardiac mitochondrial injury Altered expression levels of genes |
0.6 0.6 0.6 0.6 0.6 |
2 2 2 2 2 |
Serum, dose‐dependent increase: 4.26 μg/mL at 2 mg/kg bw per day Heart, dose‐dependent increase: 9.59 μg/g at 2 mg/kg bw per day |
Xia et al. (2011) | ||
| PFOS (purity 98%, salt not specified) |
CD1 mice Exposure: 0, 0.3, 3 mg/kg bw per day GD 1–PND 21 Dams: 6 per group (sacrifice after weaning (PND 21)) Offspring: animals per treatment equally distributed in a low‐ and a high‐fat feeding group. Termination on PND 63 |
Increased liver weight Increased HOMA‐IR Liver weight increase Elevated fasting glucose Additional effects related to high fat diet |
0.3 N/A |
N/A N/A |
3 0.3 |
0.3 0.3 |
Serum levels at 0.3 mg/kg bw per day: 0.3 μg/mL in males and 0.51 μg/mL in females Serum levels at 3 mg/kg bw per day: 3.36 μg/mL in males and 3.4 μg/mL in females Liver levels at 0.3 mg/kg bw per day: 4 μg/g in males and 3.3 μg/g in females Liver levels at 3 mg/kg bw per day: 12.3 μg/g in males and 13.8 μg/g in females Values for F1 adults on standard diets. Values on high fat diet higher for both genders |
Wan et al. (2014) |
| PFOS (source, purity and salt not specified) |
Sprague–Dawley rats Exposure: 18.75 mg/kg bw per day GD 2–6 by gavage 10–12 Offspring animals per group |
Delayed weight gain Reduced birth weight both genders Increase blood pressure in male offspring from PND 7–52 Increase blood pressure in female offspring from PND 37–65 |
N/A N/A N/A N/A |
18.75 18.75 18.75 18.75 |
NR | Rogers et al. (2014) | ||
| PFOS (purity not specified, K+‐salt) |
CD1 mice Exposure: 0, 0.5, 2, 8 mg/kg bw per day, GD 11–16 10 dams per group |
Body weight decrease Dose‐dependent decrease of placental weight and capacity Dose‐dependent increase of number of resorptions and dead fetuses Decrease in the numbers of glycogen trophoblast cells in the junctional zone and the number of sinusoidal trophoblast giant cells in the labyrinth zone Decrease of mPL‐II, mPLP‐Cα and mPLP‐K expression levels and serum concentrations |
2 |
N/A N/A N/A N/A |
8 |
0.5 0.5 0.5 0.5 |
NR | Lee et al. (2015) |
| PFOS, purity not specified |
Sprague–Dawley rats Exposure: 0, 5, 20, mg/kg bw per day, GD 1–GD 19 n = 4 per group |
Decreased body weight Decreased body weight Decreased testis weight Change anogenital distance Increased apoptosis rate in testis Decreased number of Leydig cells Decreased testosterone Decreased progesterone |
5 |
N/A 5 5 5 5 5 N/A |
20 |
5 20 20 20 20 20 5 |
NR | Zhao et al. (2014) |
bw: body weight; f: female; GD: gestational day; m: male; N/A: not applicable; NR; not reported; PFOA: perfluorooctanoic acid; PFOS: perfluorooctane sulfonic acid; PND: postnatal day.
Neonatal survival and teratology
ICR mice which were orally exposed by gavage during gestation (GDs 0–18) to 0, 1, 10 and 20 mg/kg bw per day of PFOS (K+ salt) produced a number of developmental defects which were detectable both in prenatal and postnatal outcomes. All neonates were alive at birth and died within hours, probably from lung atelectasis and severe dilatation of intracranial blood vessels as suggested from histological examination of tissues from neonates (Yahia et al., 2008). For dams exposed to 20 mg/kg bw per day, a reduction in body weight gain from PND 11 onwards was noted which was associated with reduced food consumption and increased water intake. A statistically significant increase in liver weight was observed at 10 and 20 mg/kg bw per day, while livers of dams dosed with 20 mg/kg bw per day were hypertrophic. The number of pups was unaffected by the treatment, but survival rate at 10 mg/kg bw per day was reduced to 55% and at the 20 mg/kg bw per day, pups survived only for a few hours after birth. In addition, the statistically significant occurrence of a number of developmental/teratological phenotypes became apparent, including, reduced body weight (10, 20 mg/kg bw per day), cleft palate (10, 20 mg/kg bw per day), delayed ossification (20 mg/kg bw per day), delayed eruption of incisors (10, 20 mg/kg bw per day), wavy ribs (10, 20 mg/kg bw per day), curved fetus and spina bifida occulta (both 10, 20 mg/kg bw per day). The only malformations which were also detectable at 1 mg/kg bw per day were sternal defects.
C57BL/6J‐Apc+/+ female mice mated with C67BL6J‐Min/+ male mice were used to comparatively test whether PFOA and PFOS have obesogenic effects and stimulate an increase in spontaneous intestinal tumorigenesis (Ngo et al., 2014). The experiment was performed in two blocks using gestational exposure from GD 1 to GD 17. In block 1, animals were treated with 0, 0.1 and 3 mg/kg bw per day, whereas doses of 0, 0.01 and 0.1 mg/kg bw per day were given in block 2. In the tested doses, PFOS (like PFOA) neither acted as an obesogen nor did it stimulate increases in tumorigenesis. The mild toxicity effects of PFOA (see Section 3.3.3.3.2) were not observed for PFOS.
A study by Era et al. (2009) aimed to unravel the mechanism responsible for the cleft palate phenotype caused by PFOS exposure. A sharp increase in incidences of cleft palate was detected following exposure of 13 mg/kg bw per day (7.3% incidence) and 20 mg/kg bw per day (78.3% incidence). This sharp increase of cases of cleft palate was paralleled by a comparatively small increase of serum levels of PFOS from 110.7 ± 13.4 μg/mL at 13 mg/kg bw per day to 138.6 ± 0.9 μg/mL at 20 mg/kg bw per day. Overall, this dose–response relationship for cleft palate was interpreted by the authors as a threshold mechanism. Fusion potential was investigated using explant cultures from solvent‐ and PFOS‐treated animals. No statistically significant differences between cultures were found, pointing to the prevention of elevation of the palatal shelves as a mechanism, as fusion potential was retained upon exposure.
A statistically significant increase in mortality rate of 22% at PND 3 was found at 2 mg PFOS/kg bw per day in a study in which pregnant Sprague–Dawley rats were exposed to 0, 0.1, 0.6 and 2 mg/kg bw per day (Xia et al., 2011). The findings included a statistically significant decreased body weight at birth, which persisted in surviving pups at later time points (PNDs 7, 14 and 21). Transmission electron microscopy revealed morphological changes of the mitochondria in the heart following exposure to 2 mg/kg bw per day of PFOS.
To shed light into the mechanism of developmental growth retardation by PFOS, emphasis was given on placental production of hormones of the PRL family (Lee et al., 2015). Ten pregnant CD1 mice per group were treated with PFOS at 0, 0.5, 2, 8 mg/kg bw per day, from GD 11 to 17. On GD 17, the animals were sacrificed. On the maternal side, a decrease in body weight gain over time was observed at 8 mg/kg bw per day. The number of pregnant mice and the number of implantations was not significantly different among treatment groups. However, placental weight, placental capacity and number of resorptions and dead fetuses were dose dependently reduced in a statistically significant manner, compared to untreated controls. These findings were accompanied by histopathological changes (necrotic areas) in the placenta, detectable at 0.5 mg/kg bw per day. Dose‐dependent decreases in the numbers of glycogen trophoblast cells in the junctional zone and the number of sinusoidal trophoblast giant cells in the labyrinth zone were noted. Statistical significance was reached at 0.5 mg/kg bw per day for sinusoidal trophoblast giant cells and at 2 mg/kg bw per day for glycogen trophoblast cells. Fetal weight was also shown to be reduced, while statistical significance was only noted at 2 and 8 mg/kg bw per day. There was a statistically significant, dose‐dependent increase in the number of resorptions and dead fetuses which was accompanied by a decreased number of live fetuses, attaining statistical significance at 2 and 8 mg/kg bw per day. On a molecular level, a dose‐dependent decrease of placental expression of members of the prolactin family of genes was detected which correlated with decreased concentrations of mPL‐II, mPLP‐Cα and mPLP‐K in serum, with effects for the latter two reaching statistical significance at 0.5 mg/kg bw per day. A correlation between placental levels of prolactin family members and fetal weight was apparent.
Metabolic Effects
The effects of perinatal exposure to PFOS on glucose metabolism were investigated in a study by Wan et al. (2014). Six‐ to eight‐week‐old pregnant CD‐1 mice (6 dams per group) were treated orally with 0.3 or 3 mg/kg bw per day from day of mating until PND 21. Vehicle‐treated animals served as a control. Two pups per dam were sacrificed on PND 21, as were the mothers. All other pups were subjected to a follow‐up experiment in which animals were either fed a standard rodent diet or a high fat diet. The experiment was terminated on PND 63. On the maternal side, an increased liver weight was detected at 3 mg/kg bw per day and an increased HOMA‐IR index at 0.3 and 3 mg/kg bw per day, although fasting glucose and insulin levels were not statistically altered in comparison to controls. Body weights of the offspring did not significantly differ in control and treatment groups. Relative liver weights were increased in both sexes at 3 mg/kg bw per day, compared to controls. At the same dose the hepatic mRNA expression levels of Cyp4a14, Lpl, Cd36, Ir and Igf‐r1 were significantly elevated in both sexes, whereas the levels of Prl‐r and Igf‐1 were found to be downregulated, thereby correlating to elevated serum and tissue levels of PFOS. Fasting glucose levels at PND 21 in both genders were not statistically significantly altered. Fasting serum insulin levels were elevated at both doses (0.3 and 3 mg/kg bw per day) in male but not in female offspring at PND 21. The HOMA‐IR index was however not affected. In PND 63 animals, the accumulating PFOS levels following exposure to 0.3 and 3 mg/kg bw per day were significantly higher in both sexes in animals fed high fat diet when compared to animals fed regular diet. In animals fed the regular diet, the relative liver weight was only elevated in males at 3 mg/kg bw per day, whereas fasting serum glucose was elevated in males and females in response to both doses (0.3 and 3 mg/kg bw per day). Fasting insulin serum levels were only elevated in response to the high dose. Oral glucose tolerance test did not produce statistically significant differences between treatment groups. This was different in animals fed the high fat diet. Liver weight was again only increased in males following treatment with 3 mg/kg bw per day. In both sexes, fasting insulin serum levels were elevated at 3 mg/kg bw per day, which was also the case for fasting serum glucose levels in males. In females at PND 63, fasting serum glucose levels followed a dose–response relationship. AUC in the oral glucose tolerance test was elevated in both sexes at 3 mg/kg bw per day. The HOMA‐IR index was significantly different in both sexes at 3 mg/kg bw per day, between exposed and control groups, as well as between animals fed regular diet and high fat diet.
Cardiovascular Biology
In the study by Xia et al. (2011, see above section for study description), the heart to body weight ratio increased in response to treatment with 2 mg/kg bw per day of PFOS. To investigate this further, the hearts of weaned (PND 21) offspring were investigated with ultrastructure analysis by electron microscopy for mitochondrial injury and for global gene expression profiling by microarray as well as consecutive quantitative polymerase chain reaction (qPCR) and Western blot analyses. Significant vacuolisation and inner membrane injury at 2 mg/kg bw per day were detected as indicators of cardiac mitochondrial injury, which was associated with changes of expression of genes relevant for mitochondrial function.
In another gestational exposure study, the impacts of several environmental compounds, including PFOS, on blood pressure were compared (Rogers et al., 2014). Exposure of pregnant Sprague–Dawley rats to 18.75 mg/kg bw per day of PFOS, by gavage, during GDs 2–6, resulted in delayed maternal weight gain and reduced birth weights of male and female offspring. A statistically significant increase in blood pressure was detected at PND 7 in males, which persisted at least until PND 52. An even more pronounced elevated blood pressure was detected in females at PND 37 and 65.
Male reproductive system
To study the impact of PFOS on the male reproductive system, 8‐week‐old CD‐1 male mice were treated with 0, 1, 5 and 10 mg/kg bw per day of PFOS for 7, 14 or 21 days (Wan et al., 2011). Decreased body weight at PND 19–21 at the 10 mg/kg bw per day dose and an increased liver weight at the 5 and 10 mg/kg bw per day dose were noted. Serum testosterone levels and epididymal sperm counts were decreased at 10 mg/kg bw per day. Gene expression analysis by qPCR in the 21‐day treatment group in the testes, revealed a dose‐dependent downregulation of steroidogenic enzymes, including Cyp11a1, Cyp17a1, Hsd3b, Hsd17b and Star. All effects reached the level of statistical significance at 5 and 10 mg/kg bw per day, and the expression levels for Hsd17b at 1 mg/kg bw per day. Lhr was found to be downregulated at the two highest doses, Fshr at 10 mg/kg bw per day. Other genes which were downregulated at 5 and/or 10 mg/kg bw per day in the 21 day treatment comprise Igf1, Igf1r. Two members of the inhibin subunit family were found to be downregulated at all three doses.
Zhao et al. (2014) treated pregnant Sprague–Dawley rats with 5 and 20 mg/kg bw per day of PFOS from GD 1 to GD 19. A reduced body weight at 20 mg/kg bw per day was noted for mothers, which was also detectable in male offspring at 5 and 20 mg/kg bw per day. In male pups, testosterone levels were reduced in response to treatment with PFOS (20 mg/kg bw per day), whereas progesterone levels were decreased at 5 and 20 mg/kg bw per day. The reduction of testosterone was accompanied by a decreased number of Leydig cells and an increased apoptosis rate at the same dose. Total testis weight in offspring was decreased at 20 mg/kg bw per day, as was the anogenital distance, a general marker for male reproductive differentiation.
In conclusion, PFOS clearly affects developmental processes with the impact on maternal liver weight (0.3 mg/kg bw per day) placental physiology (0.5 mg/kg bw per day) and on aspects of glucose homoeostasis (0.3 mg/kg bw per day) being the most sensitive endpoints. A NOAEL for these effects was not identified.
3.3.3.3.2. PFOA
In their previous opinion, the CONTAM Panel derived a TDI for PFOA of 1.5 μg/kg bw from liver effects occurring in a subchronic study with male rats EFSA (2008). Data on developmental and reproductive toxicity studies using exposure to low doses of PFOA were limited. In fact, the most sensitive endpoint identified for developmental and reproductive toxicity originated from a study by Abbott et al. (2007). In this study, a reduction in neonatal survival was observed at 0.6 mg/kg bw per day which resulted in a NOAEL of 0.3 mg/kg bw per day.
In addition, from a two‐generation reproduction study on PFOA, in which Sprague–Dawley rats were given 1, 3, 10 or 30 mg/kg bw per day PFOA, by oral gavage, NOAELs for reproductive function (30 mg/kg bw per day), sexual maturation (10 mg/kg bw per day) and for body weight as well as increased liver weight (< 1 mg/kg bw per day) in both parental and F1 male animals could be derived (Butenhoff et al., 2004b). In another study using a comparative approach pregnant wild‐type 129S1/SvlmJ and PPAR knock‐out mice were treated with 0.1–20 mg/kg bw per day of PFOA. Both toxicological and mechanistic findings were obtained. Toxicologically a NOAEL of 0.3 mg/kg bw per day could be derived for neonatal survival which was lower than the one for eye opening (1 mg/kg bw per day). The most sensitive parameter was a change in liver weight in offspring at the lowest dose investigated (0.1 mg/kg bw per day). Mechanistically, knockout of PPARalpha (PPARa) apparently had no effect on outcomes directly related to pregnancy but was involved in the detected postnatal effects, e.g. on liver weight, eye opening and growth defects, which occurred at high doses (Abbott et al., 2007). Different species were investigated by Lau et al. (2004), Lau et al. (2006). In the teratological studies (reviewed by Lau et al., 2004), PFOA was investigated in rabbits and rats. No teratological effects were reported for rabbits below 50 mg/kg bw per day whereas NOAELs could be derived for maternal (5 mg/kg bw per day) and developmental toxicity (150 mg/kg bw per day) in rats. In their second study, exposure of pregnant CD‐1 mice from GD 1 until birth with 1, 3, 5, 10, 20, 40 mg/kg bw per day resulted in numerous effects including resorption of litters, reduced percentage of live fetuses, reduced weight of fetuses, reduced postnatal survival and growth deficits. Although these parameters showed that endpoints were affected at different doses, none of the parameters were affected in the 1 mg/kg bw per day dose group.
FSANZ recently derived a TDI for PFOA of 160 μg/kg bw from the NOAEL for fetal toxicity in a study in mice on developmental and reproductive toxicity (Lau et al., 2006). Another candidate point of departure resulted from the same study for maternal toxicity. The Swedish EPA in addition considered, but did not use, changes in mammary gland development (Macon et al., 2011) and body weight gain (Hines et al., 2009). These studies are discussed in more detail below.
The following section reviews the literature after the publication of the EFSA opinion in 2008, and Table 13 summarises these studies.
Table 13.
PFOA reproductive and developmental toxicity
| Substance/(Purity) | Species/Experimental design and doses | Most sensitive endpoints | Highest dose with no effect (mg/kg bw per day) | Significant effect level (mg/kg bw per day) | Serum/tissue levels of compound | Reference | ||
|---|---|---|---|---|---|---|---|---|
| Mother | Offspring | Mother | Offspring | |||||
| PFOA, ammonium salt > 98% pure |
CD‐1 mice Exp. 1: 0,1, 3, or 5 mg/kg bw per day; n = 5, 5, 8, 7 dams Exp. 2: 0, 0.01, 0.1, 0.3, 1 or 5 mg/kg bw per day; n = 14 dams except for 5 mg/kg bw per day n = 10 Exposure GD 1–17 |
Transient body weight gain at mid age observation group of the pups (21–33 weeks) Increase of insulin and leptin 0.01–0.1 mg/kg bw per day. |
N/A N/A |
0.01–0.3 0.01 |
Hines et al. (2009) | |||
| PFOA, ammonium salt > 98% pure |
CD1 mice Full gestational study (GD 1–17): 0, 0.3, 1, 3 mg/kg bw per day, dams (n = 13) Late gestational study: 0, 0.01, 0.1, 1.0 mg/kg bw per day, dams (n = 7–13) Offspring: 7–9 animals per litter |
Full gestational exposure: Transient (until PND 7) increase in liver weight Decreased mammary gland developmental score Late gestational exposure: decreased mammary gland developmental score number of terminal endbuds |
N/A N/A N/A 0.01 |
0.3 0.3 0.01 0.1 |
Serum at 0.3 mg/kg bw per day: 4,980 (PND 7) – 16 ng/mL (PND 84) Liver at 0.3 mg/kg bw per day: 2,078 (PND 7) – 43 ng/g (PND 84) Serum at 0.01 mg/kg bw per day: 284.5 (PND 1) – 16.5 ng/mL (PND 21) Serum at 0.1 mg/kg bw per day: 2,303.5 ng/mL (PND 1) – 131.7 ng/mL (PND 21) |
Macon et al. (2011) | ||
| PFOA, ammonium salt 98% pure |
CD‐1 mice, 163 dams equally distributed to treatment groups, 6–7 females and 3–4 males per litter after birth C57Bl/mice, 41 dams divided to 5 groups, litter sizes > 5 were maintained Exposure 0, 0.01, 0.1, 0.3 1.0 mg/kg bw per day, GD 1–17 |
CD‐1 mice: Decrease of mammary gland development score C57Bl/6 mice: Decrease of mammary gland development score |
0.01 (PND 21) N/A (PND 35, PND 56) 0.1 (all time points) |
0.1 (PND 21) 0.01 (PND 35, PND 56) 0.3 (all time points) |
Serum at 0.01 and 0.1 mg/kg bw per day: 74.8 ng/mL (PND 21) 14.3 ng/mL (PND 35), < LOQ (PND 56) Serum at 0.1 mg/kg bw per day: 457.3 ng/mL (PND 21) Serum at 0.1 mg/kg bw per day: 247.1 (PND 21), 27.7 ng/mL (PND 61) Serum at 0.3 mg/kg bw per day: 891.3 ng/mL (PND 21), 9.3 ng/mL (PND 61) |
Tucker et al. (2015) | ||
bw: body weight; f: female; GD: gestational day; m: male; LOQ: limit of quantification; PFOA: perfluorooctanoic acid; PND: postnatal day.
It is noteworthy that 4 studies reported biological effects at doses in the exposure range of 0.01 mg/kg bw per day. These studies are discussed below in the Section ‘Studies reporting low dose biological responses’.
Studies reporting low dose biological responses
In three studies, biological effects in response to PFOA were detected at a dose of 0.01 mg/kg bw per day (Hines et al., 2009; Macon et al., 2011; Tucker et al., 2015). For another study, a BMDL5 of 6.2 μg/kg per day was calculated for the decrease of triglyceride levels (using a BMD) approach (Slob, 2002) with the PROAST software versions 38.0 and 38.1 (http://www.rivm.nl/proast)). However, authors judged this value as borderline informative, because in their analysis a BMDU/BMDL ratio of 100, was calculated (Van Esterik et al., 2016). These studies reporting effects at low doses comprise the investigation of metabolic endpoints (Hines et al., 2009; Van Esterik et al., 2016) and of mammary gland development (Macon et al., 2011; White et al., 2011; Tucker et al., 2015). Since none of the studies provides a direct link to potential adverse outcomes, the CONTAM Panel could not consider these data as a reference point of departure for reasons specified in the sections below.
In a study with CD‐1 mice exposed to PFOA at 0, 0.01, 0.1, 0.3, 1 or 5 mg/kg bw per day, by gavage, from GD 1 to 17, no difference in live pup numbers was observed, while postnatal mortality was not assessed (Hines et al., 2009). However, as briefly mentioned above a transient body weight gain of the pups at the mid‐age observation group (21–33 weeks) was observed for 0.01–0.3 mg/kg, which was accompanied by a transient increase in serum levels of leptin and insulin in the 0.01 and 0.1 mg/kg groups. At 18 months of age, abdominal fat weight and relative amounts of white fat were decreased in the 1 mg/kg bw per day and 5 mg/kg bw per day exposure groups, the 3 mg/kg bw per day group was not assessed. Interscapular brown fat weight and relative brown fat weight were significantly increased at 18 months relative to control. Authors claim low dose effects in response to PFOA exposure. This study was discussed as a potential point of departure in the report of the Swedish EPA on PFAS (Report 6513, Swedish EPA, 2012). The effect on leptin could not be detected in a study with a similar design using two diets (Quist et al., 2015), a control diet, which was the same as in the study above (Hines et al., 2009) and an experimental high fat diet. In animals, which were fed the control diet, the effect of PFOA on leptin could not be found when analysed at PND 91 (Quist et al., 2015). Due to the inconsistency of the leptin response within studies of a similar design, and because of the lack of a link of transiently elevated leptin to an adverse outcome the CONTAM Panel decided not to use this study further.
Van Esterik et al. (2016) investigated whether early exposure to low doses of PFOA could program C57BL/6JxFVB hybrid mice for metabolic impairment later in life. No general developmental and reproductive toxicity effects became apparent. Whenever possible, authors subjected dose–response data obtained to BMD modelling (BMD) approach (Slob, 2002) with the PROAST software versions 38.0 and 38.1 (http://www.rivm.nl/proast). In males, a dose‐dependent decrease in body weight was observed from PND 4 until 21 weeks, when the diet was changed from normal diet to high fat diet. In females, this effect persisted even after feeding of a high fat diet for 2 weeks, with a BMDL5 of 849 μg/kg bw per day. Male organ metrics were only affected for absolute and relative liver weight, which increased, and tibial length, which decreased. Female organs were not affected except for a decrease in femur and tibia length, femur weight and weight of the quadriceps femoris muscle. The effects were weak as indicated by high BMDL levels. Absolute and relative weights of perigonadal and particularly perirenal (BMDL5 of 65 μg/kg bw per day) fat pads exhibited a negative dose–response relationship. On the histopathological level, the two parameters eosinophilic appearance and karyomegaly in the liver were altered (p = 0.07) at 300 and 3,000 μg/kg bw per day. No statistically significant histopathological changes were found in the brown adipose tissue. To explain the metabolic phenotypes, both lipid parameters and endocrine parameters involved in the regulation of energy homoeostasis were investigated. None of the parameters showed a significant response to PFOA in males, while a dose‐dependent decrease of cholesterol (BMDL5 402 μg/kg bw per day) and triglycerides (BMDL5 6.2 μg/kg bw per day) became apparent in females. Because the parameter triglycerides had borderline informative value (BMDU/BMDL = 100), the authors considered the next lowest effect, namely the BMDL for perirenal fat pad weight in females at 65 μg/kg bw per day, as more relevant.
Delay of mammary gland development, as a consequence of PFOA exposure, was reported in a study in which pregnant CD‐1 mice, which were either treated during the entire gestational period (GD 1–17; 0, 0.3, 1.0, 3 mg/kg bw per day) or during the second half of gestation (GD 10–17; 0, 0.01, 0.1, 1.0 mg/kg bw per day; Macon et al., 2011). Prenatal PFOA exposure elevated relative liver weights transiently even in the 0.3 mg/kg treatment group in both females and males. Although this effect dissipated at PND 7 it has to be stated that it occurred at a dose that was lower than the previously reported LOAEL in CD‐1 mice (Lau et al., 2006; Wolf et al., 2008a). At higher doses, the liver weight remained higher for longer periods. Exposure during the entire gestational period led to statistically significant changes in mammary gland development scores at the lowest dose of 0.3 mg/kg bw per day for examinations of the gland at PND 14, 21, 42 and 84. Late gestational exposure during PND 10–17 lead to similar results for doses of 0.1 and 1 mg/kg bw per day. The overall developmental score, summary evaluation of longitudinal and lateral growth, Δ longitudinal and Δ lateral growth, terminal end buds (TEB) and terminal ends, at PND 21 was significantly changed at doses of 0.01 mg/kg bw per day and higher. As this summary assessment was more sensitive than the assessment of each of the individual parameter, the latter were listed in addition, with the number of terminal endbuds as being the most sensitive individual parameter showing significant reduction at 0.1 mg/kg bw per day. These low‐dose effects of PFOA were confirmed for CD‐1 mice in a comparative study with CD‐1 and C57Bl/6 mice (Tucker et al., 2015). In this study, timed pregnant dams were given oral daily doses of 0, 0.01, 0.1, 0.3 or 1.0 mg mg/kg bw per day of PFOA from GD 1 to 17. Mammary gland developmental scores (1 = poor development; 4 = best) were derived from whole mount preparations at PND 21, 35 and 56 for CD‐1 mice and on PND 21 and PND 61 for C57Bl/6 mice. The mammary gland development score comprised the assessment of lateral and longitudinal epithelial growth, branching density, changes in epithelial growth, appearance of budding from ductal tree, number of differentiating duct ends and the presence or absence of terminal end buds. No treatment group showed an effect on absolute and relative body weight or liver weight. Neither was puberty onset affected by the respective treatments. However, mammary gland development scores were decreased. At 0.01 mg/kg bw per day this decrease became apparent in CD‐1 mice in tissues of PND 35 and PND 56 whole mounts. It was significantly decreased for all three time periods observed in the 0.1, 0.3 and 1.0 mg/kg bw per day treatment groups. Data for individual items of the scoring process are not available. C57Bl/6 mice responded less sensitively and only for the treatment at 0.3 and 1.0 mg/kg bw per day, at PND 21 and 61. Authors concluded that the mammary gland is the most sensitive pubertal parameter, regardless of the strain. In an additional study, White et al. (2011) investigated whether gestational exposure to PFOA or gestational exposure followed by a chronic, lifelong, low dose exposure through the drinking water containing 5 ppb of PFOA, would impact on lactational function and subsequently on the development of the offspring. To address this issue CD‐1 mice received 0, 1 or 5 mg/kg bw per day of PFOA from GD 1 to GD 17. Two additional groups of mice were first gestationally treated with 0 or 1 mg/kg bw per day as described above and then received lifelong exposure to 5 ppb of PFOA through the drinking water. Mammary gland development at PND 22, 42 and 63 was assessed in the F1 offspring and then also in the F2 offspring, following breeding with F1 offspring. The measured mammary gland score was correlated to general developmental parameters like live fetuses, prenatal loss, postnatal survival, lactational parameters, body and liver weight. Authors conclusively showed that lifelong exposure to 5 ppb in the drinking water is sufficient to reduce mammary gland developmental score at PND 22, PND 42 and PND 63 in F1 offspring, as well as at PND 42 in F2 offspring. Maternal mammary gland indices during weaning (PND 22) were improved in F0 dams following exposure and decreased in F1 dams at weaning (PND 22). However, at none of the investigated time points an impact on the number of live fetuses, prenatal loss, postnatal survival, body and liver weight became apparent following chronic exposure to 5 ppb of PFOA through the drinking water. In addition, in a lactational challenge test with F1 dams at PND 10, no statistically significant impact on milk volume or timed nursing behaviour could be found. The authors concluded that the delay in mammary gland development, which translated also in histopathological changes of the organ, did neither result in deficits in lactation nor in deficits in growth and survival, which can be regarded as proxy measures of nutritional support.
Despite the fact that responses in the mammary gland occurred at low doses, the CONTAM Panel decided not to use the data on mammary gland development for the risk assessment. The observations for the developmental score at 0.01 mg/kg bw per day in the mammary gland are generally speaking, indicative for a delayed pubertal transition of the mammary gland. Delayed developmental transition, as such, cannot be considered as an adverse health outcome. Furthermore, the developmental score summarises results of several individual parameters and none of the individual ones were as sensitive as the sum parameter (0.1 mg/kg bw per day and above). In addition, pubertal development was not generally affected, because no influence of PFOA exposure on vaginal opening could be detected. At present, it is not clear whether this biological effect occurring at a low dose has to be regarded as adverse. The transition of the mammary gland during puberty is regarded as a highly sensitive window of susceptibility for interference with environmental impacts in humans and rodents. This interference thereby appears to be linked to breast cancer risk with the terminal end buds as the most fragile structure in the rodent mammary gland (Martinson et al., 2013). This is long known in the field of chemical carcinogenesis of the mammary gland (Russo and Russo, 1996), whereas the concept of the terminal endbud structure as a target for chemoprevention of mammary gland carcinogenesis was established more recently (Hilakivi‐Clarke, 2007). In summary, the developing mammary gland represents a sensitive structure for environmental influences modifying the risk for the development of breast cancer.
Maternal effects and neonatal survival
Since the release of the EFSA opinion in 2008, a number of gestational exposure studies have been performed to study the impact of PFOA (salt unknown, 90% pure) on the pregnant female as well as on their offspring. In a study which was primarily aimed to characterise neonatal mortality (Yahia et al., 2010), 15–19 pregnant ICR mice were treated by gavage at doses of 1, 5, 10 mg/kg bw per day from GD 0 to 17 for dams euthanised on GD 18 for the assessment of prenatal parameters. Exposure from GD 0 to 18 was used for all parameters, which were assessed postnatally. For evaluation, 5–9 dams/group were euthanised on GD 18, the other 10 dams were maintained in the study to give birth. On the maternal side the major effects were related to liver weight gain and changes in serum biochemical parameters. A dose‐dependent increase in liver weight became apparent, with weight gain changes at 5 and 10 mg/kg bw per day reaching the level of statistical significance. Out of 20 parameters measured, 12 were statistically different at 10 mg/kg bw per day, three (total protein, globulin and phosphorus) at 5 mg/kg bw per day and 2 (phosphorus and blood urea nitrogen) at 1 mg/kg bw per day. In pups, neonatal survival was affected. All died within 6 h after birth in the 10 mg/kg bw per day group, whereas 16% of pups died within 4 days of observation following treatment with 5 mg/kg bw per day. This effect was not detectable for PFOS in the comparative experimental setup used. In addition, the liver weight of the pups was significantly changed in a non‐linear manner. For the lowest dose (1 mg/kg bw per day), an increase in liver weight was detected, whereas exposure to 5 and 10 mg/kg bw per day of PFOA decreased liver weight. The number of live pups was also found to be reduced to 49% at PND 7 in a study in which CD‐1 mice were gavage dosed with 5 mg/kg bw per day of PFOA, to study expression of PPAR in fetal and post‐natal mouse tissues (Abbott et al., 2012). C67BL6J‐Min/+ mice were used as another model to comparatively test whether PFOA and PFOS have obesogenic effects and stimulate an increase in spontaneous intestinal tumorigenesis in these mice (Ngo et al., 2014). PFOA neither acted as an obesogen nor did it stimulate increases in tumorigenesis. However, there was a lower survival of pups at 3 mg/kg bw per day and an increased liver weight at low doses of PFOA (as low as 0.01 mg/kg bw per day), which however, showed no dose dependency.
Survival rate was shown to be dependent on the PPARa status. In a comparative study, Albrecht et al. (2013) used pregnant 129/Sv mice, which carried either a wild‐type mPPARa, were null‐mutated or were humanised by expressing hPPARa. Following treatment with 3 mg/kg bw per day of PFOA from GD 1 to 17, a reduced neonatal survival was found in mice carrying the wild‐type mPPARa but not in humanised or knockout mice. These observations point to species differences in the responsiveness to PFOA through PPARa, which is further substantiated by the observation that μg orders of ammonium perfluoroctanoate may activate mouse PPARa in vivo but not the human counterpart in humanised Svv/129 genetically modified mice carrying a hPPARa Tet‐Off construct (Nakamura et al., 2009). With this study, the results of Abbott et al. (2007) could be confirmed for mPPARa, but also showed that hPPARa seems not responsive.
Hepatotoxicity
In this study, hepatotoxicity was comparatively investigated using CD‐1 mice, as well as 129/Sv wild‐type and PPARa knockout mice. Animals thereby underwent the same experimental protocol. In brief, mice were exposed from GD 1 to 17 to 0, 0.01, 0.1, 0.3, 1 or 5 mg/kg bw per day PFOA and tissues of the offspring were collected at 18 months of age (Filgo et al., 2015). No statistical significance could be reached for tumorigenic alterations in CD1 mice. Numerous non‐neoplastic alterations in livers of CD‐1 mice were noted, among them dose‐dependent increases in Ito cell and centrilobular hepatocyte hypertrophy following prenatal PFOA exposure, reaching the level of significance above controls at 5 mg/kg bw per day PFOA. No significant neoplastic alterations were found in 129/Sv wild‐type and PPARa knockout mice. Non‐neoplastic lesions were numerous again with bile duct hyperplasia and bile duct hyaline droplet accumulation being dose dependent in 129/Sv PPARa knockout, but not in wild‐type mice. The author′s main conclusions were based on the fact that liver lesions occured in all three animal models, with occurence in PPARa knockout animals thereby pointing to the fact that these lesions occur independent of PPARa (Filgo et al., 2015).
Mammary gland
For interference of mammary gland development by exogenous substances, several windows of susceptibility have been identified (Martinson et al., 2013), among them the pubertal period. To cover this period of mammary gland development a comparative study in Balb/c and C57BL/6 mice was performed in which animals were orally treated with 0, 1, 5, 10 mg/kg bw per day PFOA (ammonium salt, 98% pure) by oral gavage for 4 weeks starting at PND 21 (Yang et al., 2009b). An increase in absolute liver weight (5, 10 mg/kg bw per day) and relative liver weight (1, 5, 10 mg/kg bw per day) was observed in both strains. Regarding reproductive parameters, a significant delay in vaginal opening was observed for 1 mg/kg bw per day and no vaginal opening at all for 5 and 10 mg/kg bw per day in Balb/c mice. The picture in C57BL/6 mice was slightly different with a significant delay of vaginal opening at 5 mg/kg bw per day and no vaginal opening at 10 mg/kg bw per day. Strain specific differences were also resolved for uterine development. For uterine parameters a dose dependent decrease of absolute and relative weight was observed for uteri of Balb/c mice, whereas 1 mg/kg bw per day PFOA increased absolute and relative uterine weight in C57BL/6 mice and only 10 mg/kg bw per day lead to a decrease in uterine weight. To assess mammary gland development, three parameters of the developing mammary gland were investigated: ductal length, number of terminal endbuds and number of terminal ducts. In Balb/c mice, a significant reduction of all three parameters was observed for 5 and 10 mg/kg bw per day. In C57BL/6 mice, this decrease of all three parameters was only observed for 10 mg/kg bw per day PFOA, whereas 1 and 5 mg/kg bw per day of PFOA increased the number of terminal end buds and stimulated terminal ducts, with the effect for 5 mg/kg bw per day reaching the level of statistical significance. Since the two mice strains responded with different sensitivity, which might be indicative for strain specificity, Balb/C mice were also treated with 0.1 mg/kg bw per day of PFOA. At this dose no findings were noted compared to the control. Follow‐up studies investigated the PPARa dependency of the observed effects. Using 5 mg/kg bw per day of PFOA in a comparative approach to treat C57BL/6 mice and PPARa knock‐out mice, revealed that the stimulating effect in the mammary gland is independent of this receptor (Zhao et al., 2010a). In contrast, the decrease in mammary gland development at high doses (7.5 mg/kg bw per day) was found be strictly dependent on PPARa (Zhao et al., 2012). Another study comparatively investigated the role of the timing of exposure to PFOA (0, 3, 5 mg/kg bw per day) in utero vs postnatal and in addition included cross‐fostering of pups to create groups of treated/untreated pups nursed by treated/untreated dams (White et al., 2009). Irrespective of the timing of exposure and irrespective of the fact whether in utero only or by lactation too, mammary gland development was retarded with the exception of lactational exposure at 3 mg/kg bw per day.
Uterus
Low dose effects of PFOA were tested in an immature uterotrophic assay in CD‐1 mice (Dixon et al., 2012) using 0, 0.01, 0.1 and 1 mg/kg bw per day doses of PFOA. A statistically significant increase of 1.48‐fold (total uterine weight) and 1.46‐fold (relative uterine weight) was detected for the 0.01 mg/kg bw per day treatment group. This oestrogenic effect was only minimally, if at all supported by an extended histological analysis of uterine, cervical and vaginal tissue.
Male reproductive parameters
Zhang et al. (2014b) exposed 8‐week‐old male BalbC mice with 0.31, 1.25, 5 and 20 mg/kg bw per day PFOA for 28 days. Reduced testis weight became apparent at 20 mg/kg bw per day. At 5 mg/kg bw per day, sperm count was reduced, sperm motility and sperm progression increased, as was the percentage of teratosperm. At 1.25 mg/kg bw per day, a mild disturbance of the histology of the seminiferous tubules became apparent and the testosterone and progesterone levels were found to be decreased at this dosage of 1.25 mg/kg bw per day.
Eight‐week‐old 129/Sv mice, which were wild type regarding mPPARa, or null‐mutated or humanised by expressing hPPARa, were treated for 42 days with either 0, 1 or 5 mg/kg per day with the ammonium salt of PFOA. Potential impacts on the male reproductive system were investigated. Although the sperm count was not altered, sperm abnormalities became apparent at 1 and 5 mg/kg per day in wild‐type and humanised mice, which were absent in PPARa null‐mutated mice and were associated with decreased testosterone levels at the same doses (Li et al., 2011). Changes in the expression levels of several genes analysed were observed at the same dose ranges as physiological effects.
Bone
Bone samples derived from the experiment performed by Onishchenko et al. (2011) were analysed for bone effects. Six pregnant C57Bl/6 dams per group were exposed to 0.3 mg/kg bw per day of PFOA throughout gestation, vehicle treatment served as a control. The offspring was sacrificed at the age of 13 (n = 5) or 17 (n = 5) months. The periostal areas and medullary areas, but not the cortical areas of the femurs, were increased at 17 months of age, the bone mineral density of the femur remained unaffected. While periostal and medullary areas were changed similarly in the tibia, tibial bone mass was decreased both at 13 and 17 months of follow up (Koskela et al., 2016). Biomechanical properties were unchanged.
In conclusion, PFOA clearly impacts on developmental processes e.g. mammary gland development and on metabolic processes at doses as low as 0.01 mg/kg bw per day. However, these developmental changes represent biological effects and a health risk can be deduced, indirectly. The most sensitive pathological change was noted at 0.1 mg/kg bw per day for increased liver weight in pups.
| Substance/(Purity) | Species/Experimental design and doses | Most sensitive endpoints | Highest dose with no effect (mg/kg bw per day) | Significant effect level (mg/kg bw per day) | Serum/tissue levels of compound | Reference | ||
|---|---|---|---|---|---|---|---|---|
| Mother | Offspring | Mother | Offspring | |||||
| PFOA, ammonium salt 98% pure |
Pregnant CD‐1 mice receiving 0, 1, 5 mg/kg bw per day PFOA by oral gavage from GD 1 to 17. Pregnant CD‐1 mice receiving 0 and 1 mg/kg bw per day PFOA by gavage from GD 1 to 17 and additional drinking containing 5 ppb of PFOA from GD 7 until termination of the experiment for P0,F1 and F2 generations Dams: n = 5–12 Litter size neonates F1: 12–13 pups Litter size neonates F2: 10 pups |
Postnatal survival (F1) | 1 | 5 |
P0 dams at weaning (PND 22) Control + 5 ppb: 74.8 ng/mL 1 mg/kg bw per day: 6,658 ng/mL 1 mg/kg bw per day + 5 ppb: 4,772 ng/mL 5 mg/kg bw per day: 26,980 ng/mL |
White et al. (2011) | ||
| F1 developmental indices mammary gland without PFOA in drinking water (PND 22, 42, 63) | N/A | 1 |
F1 pups PND 22 Control + 5 ppb: 21.3 ng/mL 1 mg/kg bw per day: 2,444 ng/mL 1 mg/kg bw per day + 5 ppb: 2,744 ng/mL 5 mg/kg bw per day: 10,045 ng/mL |
|||||
| F1 developmental indices mammary gland with PFOA in drinking water (PND 22, 42, 63) | N/A | 5 ppb |
F1 pups PND 42 Control + 5 ppb: 48.9 ng/mL 1 mg/kg bw per day: 610 ng/mL 1 mg/kg bw per day + 5 ppb: 558 ng/mL 5 mg/kg bw per day: 1,581 ng/mL |
|||||
| F1 maternal indices mammary gland without PFOA in drinking water (PND 10) | N/A | 1 |
F1 pups PND 63 Control + 5 ppb: 66.2 ng/mL 1 mg/kg bw per day: 211 ng/mL 1 mg/kg bw per day + 5 ppb: 187 ng/mL 5 mg/kg bw per day: 760 ng/mL |
|||||
| F1 maternal indices mammary gland with PFOA in drinking water (PND 10) | N/A | 5 ppb |
F1 dams at weaning (PND 22) Control + 5 ppb: 86.9 ng/mL 1 mg/kg bw per day: 9.3 ng/mL 1 mg/kg bw per day + 5 ppb: 173 ng/mL 5 mg/kg bw per day: 18.7 ng/mL |
|||||
| F2 developmental indices mammary gland without PFOA in drinking water (PND 63) | N/A | 1 |
F2 pups PND 22 Control + 5 ppb: 26.6 ng/mL 1 mg/kg bw per day: 4.6 ng/mL 1 mg/kg bw per day + 5 ppb: 28.5 ng/mL 5 mg/kg bw per day: 7.8 ng/mL |
|||||
| F1 developmental indices mammary gland without PFOA in drinking water (PND 42) | N/A | 5 ppb |
F2 pups PND 42 Control + 5 ppb: 57.4 ng/mL 1 mg/kg bw per day: 0.4 ng/mL 1 mg/kg bw per day + 5 ppb: 72.8 ng/mL 5 mg/kg bw per day: 0.4 ng/mL |
|||||
|
F1 pups PND 62 Control + 5 ppb: 68.5 ng/mL 1 mg/kg bw per day: 1.1 ng/mL 1 mg/kg bw per day + 5 ppb: 69.2 ng/mL 5 mg/kg bw per day: 1.2 ng/mL |
||||||||
| PFOA Na+ Salt > 99% |
Female C57BL/6J mice mated with male FVB mice Supplemented through feed: 0, 0.017, 0.056, 0.17, 0.56, 1.75.6 and 17 mg/kg bw per day (Corresponding exposure: 0, 3, 10, 30, 100, 300, 1,000 and 3,000 μg/kg bw per day) Feeding to females was started 2 weeks prior to mating and maintained through mating, gestation and lactation (6 F0 females) Follow up of 9 offspring animals per sex into juvenile and adult stages Switch to high fat diet at 21 weeks |
Litter size Body weight perirenal fat pads (negative dose–response relation) Cholesterol (female offspring) Triglycerides (female offspring) |
0.3 |
BMDU (week 25) 5,645 μg/kg bw per day BMDU 362 μg/kg bw per day BMDU 1,284 μg/kg bw per day BMDU 623 μg/kg bw per day |
1 |
BMDL (week 25) 849 μg/kg bw per day BMDL 65 μg/kg bw per day BMDL 402 μg/kg bw per day BMDL 6.2 μg/kg bw per day (borderline informative, BMDU/BMDL = 100) |
Van Esterik et al. (2016) | |
| PFOA ammonium salt, 97.99% pure | 129S1/SvlmJ wild‐type and PPARa knockout mice, 0.1, 0.3, 0.6, 1, 3, 5, 10, 20 mg/kg bw per day, GD 1–17 |
Relative liver weight Relative liver weight Postnatal survival |
0.6 |
N/A 0.3 |
1 |
0.1 0.6 |
Serum at 0.6 and 1 mg/kg bw per day: 17.4 and 26.3 μg/mL Serum at 0.1 mg/kg bw per day : 0.8 μg/mL Serum at 0.3 and 0.6 mg/kg bw per day: 2.15 and 3.81 μg/mL |
Abbott et al. (2007) |
| PFOA ammonium salt, 98% pure | CD1 mice, GD 1–birth, 0, 1, 3, 5, 10, 20, 40 mg/kg bw per day |
Liver weight resorption of litters, reduced percentage of live fetuses, reduced weight of fetuses, reduced postnatal survival and growth deficits (ossification) |
N/A | 1 | 1 | 3 | Lau et al. (2006) | |
| PFOA, purity 90%, salt unknown | ICR mice, 15–19 dams/group, 1, 5, 10 mg/kg bw per day, exposure GD 1–17/18 |
Dose dependent liver weight gain, Significant change of 12 out of 20 metabolic parameters with phosphorus and urea levels being most sensitive Decreased neonatal survival Increased liver weight |
1 N/A |
1 N/A |
5 1 |
5 1 |
Yahia et al. (2010) | |
| PFOA ammonium salt, 98% pure |
C57BL/6J‐Min/+‐mice 10–24 dams/group 0.1 and 3 mg/kg bw per day (study 1) and 0.01 and 0.1 mg/kg bw per day (study 2) Exposure: GD 1 to 14–18 |
Decreased neonatal survival (not detectable for PFOS) Small increase of liver weight at 0.01 mg/kg bw per day, but not at 0.1 mg/kg bw per day |
0.1 N/A |
3 0.01 (not detectable at 0.1) |
Serum levels in pups at 0.01/0.1/3 mg/kg bw per day: 12–26, 213–216/N/A ng/mL | Ngo et al. (2014) | ||
| PFOA ammonium salt, 98% pure | CD‐1 mice, 5 dams/group, 5 mg/kg bw per day, exposure GD 1–17 | Decreased neonatal survival | N/A | 5 | Abbott et al. (2012) | |||
| PFOA ammonium salt, 98% pure |
BALB/c and C57BL/6 mice (comparative approach); n = 20 0, 1, 5, 10 mg/kg bw per day Exposure: PND 21 for 28 days (pubertal period) |
Increase of relative liver weight in both strains Delayed vaginal opening Balb/c mice Delayed vaginal opening C57BL/6 mice Dose dependent decrease uterine wet weight in Balb/c mice Increase of uterine wet weight for C57/BL6 mice Reduction of ductal length, number of terminal endbuds and number of terminal ducts in Balb/c mice Increase of mammary gland parameters in C57/BL6 mice |
N/A N/A 1 N/A N/A 1 N/A |
1 1 5 1 1 5 1 |
Yang et al. (2009b) | |||
| PFOA ammonium salt, 98% pure |
CD1 mice Full gestational study (GD 1–17): 0 (n = 48), 3 (n = 28), 5 (n = 36) mg/kg bw per day (pregnant dams) cross‐fostering during lactational exposure leading to 7 groups Early life effects cross foster and restricted‐exposure study at 5 mg/kg bw per day |
Mammary gland development retardation irrespective of the timing of exposure | N/A | 3 | White et al. (2009) | |||
| PFOA ammonium salt, 98% pure |
CD1 mice PND 18, 3‐day uterotrophic assay 0, 0.01, 0.1, 1 mg/kg bw per day (n = 8) |
1.46‐fold increase of uterine wet weight. Further supported by histopathological examination | N/A | 0.01 | Dixon et al. (2012) | |||
| PFOA ammonium salt, 98% pure |
BALB/c mice, adult 0, 0.31, 1.25, 5, 20 mg/kg bw per day, n = 16, 28 days |
Sperm count reduced, sperm motility, sperm progression increased, percentage of teratosperm increased Testosterone and progesterone levels decreased Mild phenotype in seminiferous tubules |
1.25 0.31 0.31 |
5 1.25 1.25 |
Zhang et al. (2014b) | |||
| PFOA ammonium salt, 98% pure |
129/Sv wild‐type, PPARa knockout mice, humanised PPARa mice, adult 0, 1, 5 mg/kg per day, n = 8–10, 42 days |
Sperm abnormalities, decreased testosterone level | N/A | 1 | Li et al. (2011) | |||
| PFOA ammonium salt, 98% pure |
CD‐1 mice, 12, 12, 14, 13, 12, and 6 pregnant dams resulting in 29, 29, 37, 26, 31, and 21 female offspring, exposure 0.01, 0.1, 0.3, 1, 5 mg/kg bw per day, GD 1–17 129/Sv WT mice, 7, 7, 5, 3, and 5 pregnant dams resulting in 10, 10, 8, 6, and 8 female offspring, exposure 0, 0.1, 0.3, 0.6, 1 mg/kg bw per day, GD 1–17 129/Sv PPARa ko mice, 5, 9, 8, 7, and 9 pregnant dams resulting in 6, 10, 10,9, and 9 female offspring, exposure 0.1, 0.3, 1, 3 mg/kg bw per day, GD 1–17 Investigation at 18 months |
CD1 mice: Several non‐neoplastic alterations in livers 129/Sv mice: bile duct hyperplasia in 129/Sv PPARa knockout, but not wild‐type mice liver lesions can occur independent of PPARa |
1 1 |
5 5 |
Filgo et al. (2015) | |||
| PFOA salt not specified, 96% pure |
C57BL/6/Bkl female mice Exposure 0, 0.3, mg/kg bw per day, during gestation, n = 6 dams per group |
Periostal areas and medullary areas of the femur were increased at 17 months of age, the bone mineral density of the femur unaffected. Tibial bone mass was decreased both at 13 and 17 months. Biomechanical properties unaffected | N/A | 0.3 |
Bone levels: 13 months: control 0.73 ng/g, PFOA 3 ng/g 17 months: control 0.64 ng/g, PFOA 3.7 ng/g |
Koskela et al. (2016) | ||
bw: body weight; f: female; GD: gestational day; m: male; N/A: not applicable; LOQ: limit of quantification; PFOA: perfluorooctanoic acid; PFOS: perfluorooctane sulfonic acid; PND: postnatal day.
3.3.3.4. Neurotoxicity
From 2008 to 2016, several studies were published on neurotoxicity of PFOS and PFOA and they are summarised in Table 14.
Table 14.
Neurotoxicity
| Substance (Purity) | Species/Experimental design and doses | Most sensitive endpoints | Highest dose with no effect (mg/kg bw per day | Significant effect level (mg/kg bw per day) | Serum/tissue concentration | Reference |
|---|---|---|---|---|---|---|
| Perfluorooctane sulfonic acid (PFOS) | ||||||
| PFOS | Rat, Wistar, gastric perfusion single dose 0, 12.5, 25, 50 mg/kg bw (n = 5/group) |
Decreased motor ability Decreased glutamate content in cortex |
12.5 (mg/kg) | 25 (mg/kg) | NR | Yang et al. (2009c) |
| PFOS; purity > 98% | Rat, Sprague–Dawley repeated oral exposure, 91 days1.7, 5, 15 mg/L (0.153, 0.45, 1.35 mg/kg bw per daya) (n = 8–10, per group) | Increased CaMKII and c‐Jun expression in the hippocampus and cortex | N/A | 0.153 | Brain: 0.56, 3.25, 17.21 μg/g | Liu et al. (2010a) |
| PFOS; purity analytical grade | Mouse, C57Bl/6 repeated oral exposure, start at 8 weeks for 3 months 0.43, 2.15, 10.75 mg/kg bw per day (n = 15 per group) | Increased apoptosis and glutamate in the hippocampus and decreased dopamine in the caudate putamen | 0.43 | 2.15 | NR | Long et al. (2013a) |
| PFOS; purity N/A | Rat, Sprague–Dawley repeated oral exposure, PND 60, killed at the end of treatment 3, 6 mg/kg bw per day for 28 days (n = 7 per group) | Increased activity of the hypothalamic DA system | N/A | 3 | NR | Salgado et al. (2015) |
| PFOS; purity N/A | Rat, Sprague–Dawley repeated oral exposure, PND 60, killed at the end of treatment 0.5, 1, 3, 6 mg/kg bw per day for 28 days (n = 6 per group) | Downregulation of mRNA expression for DRD1 in amygdala; Upregulation of DRD2 in frontal cortex and hippocampus | N/A | 6 | NR | Salgado et al. (2016) |
| PFOS; purity > 98% | Mouse, NMRI developmental exposure, single dose, PND 101.4, 21 μmol/kg bw gavage (0.75, 11.3 mg/kg bw) oral (n = 4–7 per group) | Decreased locomotor activity | N/A | 11.3 (mg/kg bw) at age 2 months; 0.75 (mg/kg bw) at age 4 months | NR | Johansson et al. (2008) |
| PFOS; purity > 98% | Mouse, NMRI developmental exposure, single dose, PND 1,021 μmol/kg gavage bw (11.3 mg/kg bw) oral (n = not reported) | Increased CAMKII, GAP43 and synaptophysin protein level in hippocampus; synaptophysin and Tau protein level in cortex; | N/A | 11.3 (mg/kg bw) | NR | Johansson et al. (2009) |
| PFOS; purity N/A | Rat, Sprague–Dawley developmental exposure, GD 0–PND 200.1, 0.3, 1 mg/kg bw per day, oral (n = 5 or 15 or 20 per group, each pup derived from different litters) | Increased locomotor activity | 0.1 | 0.3 | NR | Butenhoff et al. (2009) |
| PFOS; purity > 98% | Rat, Wistar developmental exposure, GD 1–PND 1; GD 1–PND 21; PND 1–PND 213.2 mg/kg feed per day oral (n = 10 per group, each pup from different litters) | Gene expression (microarray) in cerebral cortex | N/A | 3.2 | Serum & brain at PND 1, 7, 14, 21, 35 | Wang et al. (2010) |
| PFOS; purity > 98% | Rat, Wistar developmental exposure, GD 0–PND 0; GD 0–PND 35; PND 0–PND 353.2 mg/kg feed per day oral (n = 6 per group, each pup from different litters; 12–14 litters) | Downregulation of CaM and upregulation of CaMKII and CREB expression in the hippocampus | N/A | 3.2 (mg/kg food per day) | Brain at PND 1, 7, and 35 | Liu et al. (2010b) |
| PFOS; purity > 98% | Rat, Sprague–Dawley developmental exposure, GD 2–210, 0.1, 0.6, 2 mg/kg bw per day, oral(n = 10 dams/exposure) | Upregulation of astrocyte markers (GFAP and S100B) in hippocampus at PND 0, and in both hippocampus and cortex at PND 21 | N/A | 0.1 |
PND 0, serum: ND, 1.5, 24.6, 45.7 ppm PND 0, hippocampus: ND, 0.6, 7.4, 17.4 ppm PND 0, cortex: ND, 0.4, 5.2, 13.43 ppm PND 21, serum: ND, 0.4, 1.9, 4.3 ppm PND 21, hippocampus: ND, 0.3, 1.6, 6.1 ppm PND 21, cortex: ND, 0.1, 1.0, 3.7 ppm |
Zeng et al. (2011b) |
| PFOS; purity > 98% | Rat, Sprague–Dawley developmental exposure, GD 0–200, 0.1, 0.6, 2 mg/kg bw per day, oral (n = 10 dams/exposure) |
Downregulation of synaptophysin and synapsin 2 at PND 0. Downregulation of synapsin 1 & 2; length of synaptic active zone in CA1 at PND 21 |
N/A | 0.1 |
Serum and hippocampus at PND 0: ND; 1.5; 24.6; 45.7 ppm; ND, 0.6, 7.4, 17.4 ppm. At PND 21: ND, 0.4, 1.9, 4.3 ppm; ND, 0.3, 1.6, 6.1 ppm. |
Zeng et al. (2011a) |
| PFOS; purity 0.96 | Mouse, C57Bl/6 developmental exposure, GD 1–PND 00.3 mg/kg bw per day, oral (n = 6 per group each pup derived from different litters) | Decreased locomotor activity in males only | N/A | 0.3 | Brain: 3.1 μg/g; liver: 11.8 μg/g | Onishchenko et al. (2011) |
| PFOS; purity N/A | Mouse, NMRI developmental exposure, single dose, PND 1,021 μmol/kg bw(11.3 mg/kg bw) oral (n = 4–7 per group) | Gene expression: downregulation of AChE, nAChR‐b2 in cortex, and upregulation of mAChR‐5 in hippocampus at PND 11; decreased locomotor activity at age 2 months | N/A | 11.3 (mg/kg bw) | NR | Hallgren et al. (2015) |
| PFOS; purity > 98% | Rat, Wistar developmental exposure, GD 1–PND 0; GD 1–PND 35; PND 0–PND 355, 15 mg/L (0.45, 1.35 mg/kg bw per daya) oral (n = not reported) | Decreased mRNA expression of GAP‐43 | N/A | 5 mg/L (0.45 mg/kg bw per daya) | NR | Wang et al. (2015a) |
| PFOS; purity > 98% | Rat, Sprague–Dawley developmental exposure, GD 0–PND 90; PND 0–90; GD 0–PND 01.7, 5, 15 mg/L in drinking water (0.15, 0.45, 1.35 mg/kg bw per daya) oral (n = 3 or 6 per group, from at least 3 litters) | Increased mRNA expression and phosphorylation of Tau and mRNA expression of App | N/A | 1.7 mg/L (0.15 mg/kg bw per daya) | Serum: 18.5, 59.3, 288 μg/mL after continuous exposure; 1.9 μg/mL after prenatal exposure; 220 μg/mL after only postnatal exposure to 1.35 mg/kg bw per day | Zhang et al. (2016b) |
| PFOS; purity N/A | Mouse, NMRI developmental exposure, single dose, PND 1,021 μmol/kg (11.3 mg/kg bw) oral (n = 4–7 per group) | Gene expression: downregulation of DRD5 in cortex, and upregulation of TH in the hippocampus at PND 11; downregulation of DRD2 and TH in cortex at age 2 months | N/A | 11.3 (mg/kg bw) | NR | Hallgren and Viberg (2016) |
| Perfluorooctanoic acid (PFOA) | ||||||
| PFOA; purity 0.96 | Mouse, NMRI developmental exposure, single dose, PND 101.4, 21 μM/kg bw (0.58; 8.7 mg/kg bw) oral (n = 4–7 per group) per group) | Decreased locomotor activity | N/A | 8.7 mg/kg at age 2 months; 0.58 mg/kg at ages 4 months | NR | Johansson et al. (2008) |
| PFOA; purity 0.96 | Mouse, NMRI developmental exposure, PND 1,021 μM/kg bw (8.7 mg/kg bw) oral (n = not reported) | Increased CAMKII, GAP43, synaptophysin and Tau protein level in hippocampus; synaptophysin and Tau protein level in cortex; | N/A | 8.7 mg/kg | NR | Johansson et al. (2009) |
| PFOA; purity > 98% | Mouse, C57Bl/6 developmental exposure, GD 1–PND 00.3 mg/kg per bw day oral (n = 6 per group each pup derived from different litters) | Increased locomotor activity in males only | N/A | 0.3 mg/kg bw per day | Brain: 0.7 μg/g; liver 16.3 μg/g | Onishchenko et al. (2011) |
| PFOA, MeHg (alone or in combination); purity N/A | Rat, Wistar developmental exposure, GD 1–PND 2,110 μg/ml (10 ppm) in drinking water | Increased locomotor activity at PND 36 | N/A | 10.12 mg/kg per day | NR [only for MeHg] | Cheng et al. (2013) |
| PFOA; purity N/A | Mouse, C57Bl/6 developmental exposure, GD 7–PND 21PFOA 0.1 mg/kg bw per day; oral (n = 9 per group) | Males: Increased locomotor activity at age 2 months | N/A | 0.1 mg/kg bw per day | NR | Sobolewski et al. (2014) |
bw: body weight; f: female; GD: gestational day; m: male; N/A: not applicable; NR: not reported; LOQ: limit of quantification; PFOA: perfluorooctanoic acid; PFOS: perfluorooctane sulfonic acid; PND: postnatal day.
Conversion from mg/L to mg/kg bw calculated using EFSA guidance on selected default values. Oral defines exposure via ingestion of drinking water, food, or via gavage.
3.3.3.4.1. PFOS
Acute exposure
Yang et al. (2009c) treated male Wister rats (5/group) with a single dose of PFOS (0, 12.5, 25 or 50 mg/kg bw) given once by oral gavage. The spontaneous motor ability was decreased when compared to controls. Five days after treatment, the content of glutamate was significantly decreased in the hippocampus at the dose of 50 mg/kg bw. In cortex, the glutamate content was lowered also at the dose of 25 mg/kg bw.
Repeated exposure
Liu et al. (2010a) treated adult male Sprague–Dawley rats (8–10/group) with the potassium salt of PFOS at 0, 1.7, 5.0 or 15.0 mg/L (0.153, 0.45 or 1.35 mg/kg bw per day) in drinking water for 91 consecutive days. Even at the lowest dose, there was an increase in CaMKII and c‐jun in cortex and hippocampus.
In a study by Long et al. (2013a), adult C57BL6 mice were treated with 0, 0.43, 2.15 or 10.75 mg/kg bw per day, via gavage for a period of 3 months. Impairment in spatial learning and memory were observed after exposure to 2.15 or 10.75 mg/kg bw per day. There was an increase in apoptosis in the hippocampus accompanied by increased glutamate, and decreased dopamine in caudate putamen in the 10.75 mg/kg bw per day PFOS group.
In a study by Salgado et al. (2015), adult male rats were treated with 3 or 6 mg PFOS/kg bw daily for 28 days. At the end of the treatment, the serum levels of prolactin and oestradiol were measured, as well as the concentrations of dopamine and its metabolites (DOPAC and HVA), and GABA in the anterior and mediobasal hypothalamus. The levels of prolactin and oestradiol in the serum were reduced at both doses, while the concentrations of both GABA and dopamine were increased in the anterior hypothalamus only. In addition, the ratios of DOPAC and HVA to dopamine were decreased, indicating a reduced dopamine metabolism in the anterior hypothalamic area. These data suggest that the inhibition of prolactin secretion by PFOS in adult male rats is mediated by the periventricular hypophysial dopaminergic neurons, GABA‐ergic cells from the supraoptic and paraventricular nuclei, as well as by oestradiol. Exposure to 6 mg PFOS/kg bw per day decreased the expression of DRD1 mRNA in the amygdala and upregulated the expression DRD2 in frontal cortex and hippocampus (Salgado et al., 2016).
Developmental exposure
Comparative studies with 1.4 and 21 μmol/kg bw of PFOS (0.75 mg/kg bw and 11.3 mg/kg bw) and PFOA (0.58 mg/kg bw and 8.7 mg/kg bw) were performed by Johansson et al. (2008, 2009). The treatment consisted of a single gavage treatment to NMRI mice at postnatal day 10. Behavioural parameters (locomotion, rearing and total activity), and habituation were investigated in 2‐ and 4‐month‐old mice. Reduced locomotion and reduced rearing at an early observation period was detectable at the high dose (11.3 mg/kg bw), a reduced total activity at this early observation period (0–20 min) was detectable in 2‐month‐old mice with both doses of PFOS (0.75 mg/kg bw and 11.3 mg/kg bw). Similar effects were induced by 0.75 mg/kg bw in 4‐month‐old mice (Johansson et al., 2008). After exposure to 11.3 mg/kg bw, increased levels of CAMKII, GAP43 as well as synaptophysin were detected in the hippocampus and cortex, respectively (Johansson et al., 2009).
Butenhoff et al. (2009) performed a developmental exposure study according to test guideline EPA OPPTS870.6300 and OECD 426 with 25 female rats per dosing group. Pregnant Sprague–Dawley rats received oral doses of 0.0, 0.1, 0.3 or 1.0 mg/kg bw per day of PFOS (potassium salt) from gestational day 0 until PND 20. Offspring were observed through to PND 72, when the animals were killed and underwent macroscopic necropsy and neuropathological examination. Locomotor activity, acoustic startle reflex, and learning and memory were also tested in different subsets of pups originating from different litters. For male offspring, a LOAEL for maternal exposure of 0.3 mg/kg bw per day could be derived based on increased locomotor activity at PND 17. The associated LOAEL for female offspring was described to be a maternal dose of 1 mg/kg bw per day based on the increase in activity at PND 21.
In a study by Liu et al. (2010b), gene expression of calcium‐dependent signalling molecules was analysed following dietary exposure to 3.2 mg/kg food per day of PFOS through gestation and lactation of Wistar rats. Downregulation of calmodulin (CaM) and upregulation of Ca2+/calmodulin‐dependent kinase II (CaMKII) and cAMP‐response element‐binding (CREB) expression in the hippocampus suggest that the neurotoxic effects of PFOS may be mediated by changed molecules in calcium signalling pathways.
Zeng et al. (2011a) exposed pregnant Sprague–Dawley rats to 0.1, 0.6, 2 mg/kg bw per day of PFOS via gavage from GD 0 to GD 20. Ultrastructural and molecular analyses performed on hippocampi from pups at PND 0 and PND 21 showed a reduction of the active zone of the synapses at all three doses investigated, whereas a decrease in the number of vesicles per μm2 was significantly reduced following exposure to 0.6 and 2 mg/kg bw per day. These ultrastructural alterations were associated with a dose dependent down regulation of synapsin1 (Syn1), synapsin2 (Syn2) and synaptophysin (Syp) expression at both investigated time points (PND 0 and PND 21). The effects on synapsin3 (Syn3) were less pronounced and reached statistically significant at 0.6 and 2 mg/kg bw per day at PND 0. These findings provide a morphological and molecular hint for the impairment of cognitive functions induced by PFOS. By using a similar experimental model and the same doses of PFOS, Zeng et al. (2011b) showed an inflammation‐like glial response in the hippocampus at PND 0, and in both hippocampus and cortex at PND 21.
Onishchenko et al. (2011) performed a comparative study between PFOS and PFOA at the dose of 0.3 mg/kg bw per day in C57BL/6/Bkl mice. Pregnant mice were exposed throughout gestation using palatable food bits to avoid gastric gavage. On PND 21, pups were subcutaneously injected with a sterile microtransponder and their behaviour examined in the home cage. PFOS exposed males showed reduced locomotor activity in a new surrounding. In addition, muscle strength of PFOS exposed males was significantly reduced as shown in the hanging wire test. These data appear to contradict the report by Butenhoff et al. (2009), but the following differences in experimental design may account for the diverging results: (1) species: rat vs mouse; (2) time of testing: juvenile (PND 17) vs young adult (1.5–2 months); and (3) time of testing in relation to exposure: during exposure vs ~ 2 months after the exposure ceased. In addition, sex‐related differences are consistent in both studies.
In a study by Hallgren et al. (2015), male NMRI mice were exposed to PFOS (11.3 mg/kg bw) by gavage at PND 10. The expression of genes related to cholinergic signalling was analysed 24 h and 2 months after exposure in the cerebral cortex and the hippocampus. 24 h after exposure, there was significant downregulation of cortical AChE and b2 nicotinic receptor, and a significant upregulation of m5 muscarinic receptor. At the age of 2 months, no significant change in gene expression regulation was found in either cortical or hippocampal samples. In spontaneous exploration, PFOS‐exposed mice display lower activity than controls.
Wang et al. (2015a) used the same study design as in the microarray study from 2010 (Wang et al., 2010). Wistar rat dams were exposed to 5 or 15 mg/L PFOS throughout gestation and until weaning to investigate gene expression in the hippocampus at PND 7 and PND 35. Rats prenatally exposed to PFOS (15 mg/L) displayed impaired spatial learning and memory, and downregulation of plasticity‐related genes, which may explain the decline in learning and memory abilities.
In a study by Zhang et al. (2016b), pregnant Sprague–Dawley rats were exposed to PFOS in drinking water (1.7, 5 or 15 mg/L, 0.15, 0.45, 1.35 mg/kg bw per day) from GD 0 until PND 21. After weaning, the exposure regimen was continued in offspring until PND 90. The pups exposed to the highest dose were cross‐fostered as described in Wang et al., 2015a. The protein and mRNA expression of proteins related to Alzheimer's disease (AD) pathology (Tau, App, BACE‐1, PS‐1 and GSK‐3b) was analysed in hippocampal homogenates at PND 90. The authors report that exposure to PFOS particularly at the highest dose leads to an increase in AD‐like pathology, including Tau hyperphosphorylation and Ab1‐42 accumulation in the hippocampus. These data suggest that the exposure to PFOS may be aetiologically relevant for the development of aging‐related neurodegenerative diseases.
Hallgren and Viberg (2016), using the same exposure regimen previously described (see Hallgren et al., 2015), observed a downregulation in the expression of dopamine receptor 5 (DRD5) in the cortex, and an upregulation of the expression of tyrosine hydroxylase (TH) in the hippocampus at PND 11. At the age of 2 months, the authors report a significant downregulation of hippocampal TH and DRD2 in PFOS‐exposed mice, which may explain the alterations in spontaneous activity.
3.3.3.4.2. PFOA
In the studies by Johansson et al. (2008, 2009) reported also in the PFOS Section, NMRI mice were exposed to PFOA (0.58 mg/kg bw and 8.7 mg/kg bw), at PND 10. Behavioural parameters (locomotion, rearing and total activity), and habituation were investigated in 2‐ and 4‐month old mice. Reduced locomotion and rearing at an early observation period (0–20 min) was only detectable at the high dose (8.7 mg/kg bw). Reduced total activity was detectable in 2‐month‐old mice with both doses of PFOA (0.58 mg/kg bw and 8.7 mg/kg bw). The effects were more pronounced when mice were 4 months old. The reduced activity at the high dose persisted in any of the 20 min intervals examined until 80–100 min, then behaviour switched and PFOA‐treated animals became hyperactive in the 100–120 min interval.
Onishchenko et al. (2011), also reported in the PFOS Section, reports on the effects of PFOA at (0.3 mg/kg bw per day) in C57BL/6 mice. Pregnant mice were exposed throughout gestation (GD 1–PND 0) using palatable food bits to avoid gastric gavage. On PND 21, the pups were subcutaneously injected with a sterile microtransponder to monitor locomotor activity in the home cage. The effects on behaviour were sex‐dependent as follows: the exposed males were more active than the controls, while the exposed females showed decreased activity. In addition, only the females exposed to PFOA show decreased motor coordination in the rotarod test. However, the circadian distribution of inactive periods (typically associated with sleeping) displayed a similar pattern in both sexes: exposed mice have less inactive periods overall, and the most consistent change occurring in the light (inactive) phase of the dark–light cycle.
In a study investigating the effects of simultaneous exposure to PFOA and MeHg (Cheng et al., 2013), adult female Wistar rats were exposed to PFOA in drinking water (10 μg/mL (10 ppm)) from GD 1 until PND 21. The effect induced by PFOA alone was an increase in locomotor activity at PND 36.
Sobolewski et al. (2014) exposed C57Bl/6 mice to PFOA 0.1 mg/kg bw per day, alone or in combination with mixtures of endocrine disruptors, via palatable food between GD 7 and PND 21. The offspring were tested starting from PND 60 to investigate cognitive and motor functions. The male rats exposed to PFOA alone displayed increased horizontal movement, decreased resting time, and decreased habituation upon repeated testing. In the novel object recognition test (assessing non‐spatial hippocampal‐dependent memory), both male and females exposed to PFOA showed lower exploration during the initial phase, with males having overall lower time exploring the objects.
Summary
Altogether, it appears that both PFOS and PFOA exert neurotoxic effects at doses of 0.1–0.3 mg/kg bw per day or higher. The analysis of behaviour shows that the most frequent alterations observed are related to locomotor activity. While PFOS exposure mostly decreases spontaneous activity, PFOA increases it. A sex‐related difference has been observed in several developmental exposure studies with males being more sensitive than females.
3.3.3.5. Immunotoxicity
3.3.3.5.1. PFOS
The following studies on PFOS are summarised in Table 15.
Table 15.
Immunotoxicity PFOS
| Substance/(Purity) | Species/Experimental design and doses | Most sensitive endpoints | Highest dose with no effect (mg/kg bw per day) | Significant effect level (mg/kg bw per day) | Serum/tissue levels of compound | Reference |
|---|---|---|---|---|---|---|
| PFOS, 98% | Mice (4–8 males per group), administered via diet for 10 days, at 0.001 or 0.02% (2 or 40 mg/kg bw per day) (0.02% equals a total of 6 mg/animal over 10 days) | Several immune parameters up or down, but also body weight gain | N/A | 0.02% (40 mg/kg bw per day) | 340 μg/mL | Qazi et al. (2009a,b) |
| PFOS, 98% | Mice (4 males), restricted food diet, 10 days, 0.001, 0.002, 0.02 (1.6, 3.1 or 23.5 mg/kg bw per day) | Reduced B‐cell numbers | 0.02% (23.5 mg/kg bw per day) | 0.002% (3.1 mg/kg bw per day) | NR | Qazi et al. (2012) |
| PFOS, 98% | Mice (8 per group, males and females), gavage, 5, 20 mg/kg bw per day, 14 days | Thymus and spleen histopathology, but in addition to liver effects and PPARa changes | 5 | 20 | 25.2 μg/mL 4,89 μg/mL | Wang et al. (2011a) |
| PFOS, 85% | Mice (5 females per group), gavage, 20 mg/kg bw per day, 7 days | Values various immune parameters reduced, but in addition to body weights | N/A | 20 | NR | Vetvicka and Vetvickova (2013) |
| PFOS, 98% | Mice (12 males per group), gavage, 1, 5, 10 mg/kg bw per day, 7 days | Ex vivo apoptotic parameters in splenocytes and thymocytes up and down | N/A | 1 | NR | Zhang et al. (2013d) |
| PFOS, 98% | Mice (12 males per group), gavage, 5, 20, 40 mg/kg bw per day, for 7 days | Reduced NK activity, antibody response, lymphocyte proliferation | N/A | 5 | NR | Zheng et al. (2009, 2011) |
| PFOS, 85% | Mice (5 females per group), gavage, 20 mg/kg bw per day, 21 days | Reduced antibody response and NK activity, but accompanied by body weight effects | N/A | 20 | NR | Vetvicka and Vetvickova (2013) |
| PFOS | Mice (5 males per group), food, 0.25 mg/kg bw per day for 28 days | Effects on body weight and liver No immune effects | 0.25 | N/A | NR | Qazi et al. (2010) |
| PFOS, 98% | Mice (5 females per group), gavage, 0.0331, 0.0993, 9.3 mg/kg bw per day, 28 days | TNF‐α and IL‐6 up and down, but no dose response | N/A | 0.0331 | NR | Mollenhauer et al. (2011) |
| PFOS, 98% | Mice (5–10 females), gavage, 3.31, 16.6, 33.1), 166 μg/kg bw per day, 28 days | Increased ex vivo IL‐6 | N/A |
3.31 μg/kg bw per day (0.00331 mg/kg bw per day) |
NR | Fair et al. (2011) |
| PFOS, 98% | Mice (15 males per group), diet, 0.14, 1.33, 3.21, 6.31 mg/kg bw per day, 28 days | Reduced total IgG1 levels in serum | N/A | 1.33 | NR | Lefebvre et al. (2008) |
| PFOS, 98% | Mice (5 males or females per group), gavage, 0.166, 1.66, 3.31, 16.6, 33.1, 166 μg/kg per day, 28 days | Reduced specific antibody response |
0.166 μg/kg per day (0.000166 mg/kg bw per day) |
1.66 μg/kg bw per day (0.00166 mg/kg bw per day) |
131 ng/mL 91.5 ng/mL |
Peden‐Adams et al. (2008) |
| PFOS | Mice (30 female mice per group), gavage, 5, 25 μg/kg per day, 21 days | Reduced survival after challenge with influenza virus |
5 μg/kg per day (0.005 mg/kg bw per day) |
25 μg/kg per day (0.025 mg/kg bw per day) |
670 ng/mL 189 ng/mL |
Guruge et al. (2009) |
| PFOS, 98% | Mice (10–12 males per group), gavage, 8.3, 16.7, 83.33, 416.7, 833.3 μg/kg bw per day for 60 days | IL‐4 and IL‐10, apoptotic lymphocytes, gene expression TNF‐α, IL‐1β, values up and down |
8.3 μg/kg per day (0.0083 mg/kg bw per day) |
83.33 μg/kg bw per day (0.0833 mg/kg bw per day) |
8.21 μg/mL | Dong et al. (2009, 2011, 2012a) |
bw: body weight; IgG: immunoglobulin G; IL: interleukin; NK: natural killer (cell); N/A: not applicable; NR: not reported; PFOS: perfluorooctane sulfonic acid; PPAR: peroxisome proliferator‐activated receptors; TNF: tumour necrosis factor.
Short‐term exposure studies
Qazi et al. (2009b) carried out a number of studies to investigate immunotoxicity of PFOS. The first study investigated the effect of PFOS on circulating neutrophils and the inflammatory response of macrophages following LPS stimulation. PFOS (the tetraammonium salt, 98% purity) was administered to groups of 8 male C57BL/6 (H‐2b) mice via the diet at 0.001% or 0.02% (corresponding to 2 or 40 mg/kg bw per day when calculated using EFSA default values (EFSA Scientific Committee, 2012)) for 10 days. Half of the animals were given an i.v. dose of LPS. 0.02% PFOS was reported to give a total intake of 6 mg/animal over the 10 days (equivalent to 40 mg/kg bw per day). Following 0.02% PFOS administration, body weight, thymus, spleen and epididymal fat weights were reduced compared to controls. Food consumption was also reduced by 25%, and a significant reduction in the number of total white blood cells and lymphocytes, but not neutrophils, was observed. Moreover, 0.02% PFOS markedly reduced the number of macrophages in the bone marrow, but not the spleen or peritoneal cavity. The ex vivo production of TNF‐α and IL‐6 by macrophages isolated from animals treated with 0.02% PFOS was modestly increased. Moreover, PFOS enhanced the ex vivo production of TNF‐α and IL‐6 by peritoneal and bone marrow (but not splenic) macrophages stimulated with LPS either in vitro or in vivo. These results may indicate immunomodulatory activity, but cannot rule out that the effects are secondary to a general toxic effect. In two subsequent studies by the same authors (Qazi et al., 2009a, 2012), the results were largely confirmed, i.e. effects on the thymus and thymocytes as well as effects on the spleen (weights and cellularity) were noted, but always in the context of other general toxicity. In the study by Qazi et al. (2012), recovery from exposure effects was investigated. In a 10‐day recovery study, food consumption and body weight recovered, whereas relative weights of liver, thymus, and spleen remained unchanged or showed slight recovery. The number of myeloid cells recovered after 10 days, but none of the subpopulations of B‐cell lineage did.
Wang et al. (2011a) administered a regular diet or high fat diet containing 10% more lard and 3% more cholesterol with PFOS (98% purity, 0, 5, 20 mg/kg bw per day) via oral gavage for 14 days (vehicle not given) to groups of BALB/c mice (8 male or female mice). In the regular diet groups, 5 mg/kg bw per day PFOS and more significantly increased the relative liver weight and 20 mg/kg bw per day PFOS reduced body weight and food consumption compared with controls. The thymus and spleen showed atrophy (72.7% and 42.8% in males, and 41.6% and 42.8% in females, respectively), while the ventral fat was significantly decreased. Vasodilation and congestion were also reported in the thymus at both dose levels. The cortico‐medullary junction was virtually indistinguishable at 20 mg/kg bw per day, as well as dilation of the splenic sinus. In the high‐fat diet groups, 20 mg/kg bw per day significantly increased thymus and spleen atrophy, and significantly decreased thymus and spleen weights, compared with controls (85.1% and 50.0% in males and 76.6% and 35.9% in females, respectively). Histopathologically, more serious atrophy was observed in the immune organs, and adipocytes were found in the lobules of the thymus in high fat diet animals fed 20 mg/kg bw per day PFOS. Apoptotic bodies in the cytoplasm of thymocytes and splenocytes were also reported, with similar findings between high fat and regular fat diet animals dosed with PFOS, and PPARa and IL‐6 expression was upregulated in both the thymus and spleen at both dose levels. These results suggest that PFOS may indirectly attack the immune organs by interfering with lipid metabolism, leading to co‐senescence of the thymus and spleen.
In a study by Vetvicka and Vetvickova (2013), PFOS (purity 85%, in phosphate buffered saline) was administered at 20 mg/kg bw per day via oral gavage to groups of 5 female BALB/c mice for 7 days. PFOS significantly inhibited phagocytosis (by peripheral blood neutrophils) and NK splenic activity. It also suppressed T‐lymphocyte proliferation but not B‐cell proliferation. A significant decrease in cellularity of both the spleen and thymus was observed, although splenocyte subpopulations were not affected. Also, from this study, it cannot be ruled out that these effects on immune parameters resulted from general toxic effects as at this concentration all these effects were seen while also body weights were depressed from day 4 of treatment while liver mass was increased (Vetvicka and Vetvickova, 2013).
However, in line with direct effects of PFOS on components of the immune system, PFOS was reported to induce apoptosis in splenocytes and thymocytes isolated from mice exposed to PFOS (potassium salt, purity 98%), at 1, 5 or 10 mg/kg bw per day for 7 days (Zhang et al., 2013d). A significant increase in the number of G1 cell populations was seen after treatment with 5 mg/kg bw per day in splenocytes and in thymocytes treated with 10 mg/kg bw per day. In both cell types harvested from mice exposed at the two highest doses, ROS production was increased and mitochondrial membrane potential reduced. PFOS also increased the activities of superoxide dismutase, catalase and glutathione reductase, and decreased glutathione‐S‐transferase and glutathione peroxidase activities in splenocytes. The expression of Bax, caspase‐9, p53 and caspase‐3 were significantly increased by > 5 mg/kg bw per day PFOS compared with controls, whereas Bcl‐2 expression was significantly downregulated by PFOS (> 5 mg/kg bw per day) (Zhang et al., 2013d).
Zheng et al. (2009) administered PFOS (potassium salt, purity > 98%) at 0, 5, 20 or 40 mg/kg bw per day via oral gavage to groups of 12 male C57BL/6 mice for 7 days. The immune system was investigated functionally by sensitising animals to SRBC by an i.p. dose of SRBCs 5 days before sacrifice. Body weight and food intake were significantly decreased following doses of 20 and 40 mg/kg bw per day. At both doses, splenic and thymic cellularity was markedly decreased, serum corticosterone was significantly increased, and T‐ and B‐lymphocyte proliferation was reduced. Lymphocyte subpopulations were also decreased in the top two dose groups, compared with controls. Analysis of T‐lymphocytes subpopulations in the spleen and thymus showed significant decreases at 40 or 20 mg/kg bw per day, respectively. NK‐cell activity, lymphocyte proliferation and plaque‐forming activity (IgM dependent) were reduced at lower exposure doses, i.e. at 5 mg/kg bw per day, indicating a specific immunotoxic effect. In another study by the same group (Zheng et al., 2011), PFOS administered via oral gavage to groups of 12 male C57BL/6 mice at 0, 5 or 20 mg/kg bw per day for 7 days caused decrements in body weight, relative thymic and splenic weights at the highest dose, and dose‐dependent increased relative liver weight at the two highest doses. Serum corticosterone was also significantly increased at the top dose. Significant increased secretion of IL‐4 from splenocytes was reported at 20 mg/kg bw per day) while a decreased number of lymphocytes secreting IL‐2 was also seen. In all dose groups, total levels of IgM were significantly reduced in a dose‐related fashion. In contrast, levels of total IgG were elevated at 5 mg/kg bw per day while unaffected at 20 mg/kg bw per day.
Taken together, there are several signs of immune effects due to short‐term PFOS exposure, some of which may be indirect effects of PFOS via general toxicity. PFOS may indirectly influence the immune organs by interfering with lipid metabolism, leading to co‐senescence of the thymus and spleen. Some effects remain even after exposure while general toxic effects resolve, while in addition, functional immune effects, in particular specific antibody production and NK activity, are seen at lower doses without overt toxicity. These point at a direct immunotoxic effect that may be dependent on induction of apoptosis in lymphocytes.
Studies using exposure periods up to 28 days
Vetvicka and Vetvickova (2013) administered PFOS at 20 mg/kg bw per day via oral gavage to BALB/c mice (groups of 5 females) for 21 days (purity 85%). To study antibody responses, animals were treated for 1 week then injected twice (one week apart) with ovalbumin. While an effect on body weight was observed, significantly reduced NK splenic activity and antibody responses were also noted in the exposed animals at this dose.
Qazi et al. (2010) administered PFOS via the diet to groups of 5 male B6C3F1 mice at 0.25 mg/kg bw per day for 28 days. The total administered dose (TAD) was 7 mg/kg bw (equivalent to a TAD of 5.55 mg/kg bw PFOS anion). Body weight was reduced significantly although food consumption and serum corticosterone levels were not altered. Relative liver mass was significantly elevated (5.3 ± 0.12 vs control 4.8 ± 0.14), whereas no effects were reported for thymus, spleen or fat. No effects on circulating lymphocytes, the number of cells in the thymus or spleen, the number of plasma cells secreting anti‐SRBC IgM, the levels of IgM, IgG directed to SRBCs or IgM antibody response to TNP were recorded (Qazi et al., 2010).
Mollenhauer et al. (2011) administered PFOS (in potassium salt, purity > 98%) at 0, 0.0331, 0.0993 or 9.3 mg/kg bw per day to female B6C3F1 mice (5/group) via oral gavage for 28 days, to yield a TAD of 1, 3 or 300 mg/kg bw (reported as free ion doses). Some animals were also dosed with i.p. LPS. At the highest dose level, body weight and relative spleen weight were reduced whereas relative liver weight was significantly increased. At 1 mg/kg TAD, serum TNF‐α was reduced whilst serum IL‐6 was increased, but these changes were not seen at higher doses, hence no dose–effect relationship was established. Variable effects were noted for various parameters (TNF‐α by peritoneal macrophages following in vitro LPS stimulation; IL‐6, TNF‐α, IL‐1 or IL‐10,) but only at the higher dose at which effects on body weights were also noted.
In another study, Fair et al. (2011) administered PFOS (potassium salt, purity > 98%) to female B6C3F1 mice (groups of 5 or 10 animals/treatment, depending on endpoint under consideration) at 0, 3.31, 16.6, 33.1 or 166 μg/kg bw per day by oral gavage in Milli‐Q water containing 0.5% Tween 20 for 28 days (TAD of 0.1, 0.5, 1 or 5 mg/kg bw). In this study, no effects on body weight, adrenal, spleen, thymus, lung, liver, kidney or brain relative weights were reported for PFOS‐exposed animals, but relative uterine weight was reduced by 49% at 5 mg/kg bw. Some immune parameters were not influenced, such as ex vivo production of IL‐4, IL‐5 and IL‐6 following in vitro stimulation by either anti‐CD3 or PMA at any PFOS dose level. Ex vivo production of IL‐6 following anti‐CD40‐stimulated B‐lymphocytes in vitro was, measured only at 0.1 and 1 mg/kg bw TAD. Anti‐CD40 stimulated IL‐6 production was increased at both concentrations, but to the same extent, hence did not show a clear dose–response relationship. IL‐6 production in LPS‐stimulated B‐lymphocytes was also increased at both concentrations, which was statistically significant only 1 mg/kg bw TAD.
Lefebvre et al. (2008) administered PFOS (potassium salt, ≥ 98% purity) via the diet at 0, 2, 20, 50 or 100 mg/kg diet for 28 days to groups of 15 male or female Sprague–Dawley rats (calculated doses stated in the paper; males, 0.14 ± 0.02, 1.33 ± 0.24, 3.21 ± 0.57 and 6.31 ± 1.35 mg/kg bw per day; females 0.15 ± 0.02, 1.43 ± 0.24, 3.73 ± 0.57, 7.58 ± 0.68 mg/kg bw per day). There were two concurrent study protocols: one in which animals were only exposed to PFOS, the other where animals were also immunised to keyhole limpet haemocyanin (KLH), to investigate functional immune parameters, i.e. antibody production to KLH and delayed‐type hypersensitivity to KLH. In the study performed according the first protocol, body weight of both males and females was depressed by 50 and 100 mg/kg diet and the relative liver weight was increased, relative to controls, in a dose–response manner, in both sexes. The numbers of apoptotic lymphocytes in the thymus were increased from 50 mg/kg diet in males and at 100 mg/kg diet in female rats. A trend towards increasing T cells and T‐helper cells, and decreasing B cells, with increasing dose levels of PFOS was seen in both sexes. Significant elevation of levels of IgG, IgG2a and IgG2c was reported with increasing PFOS dose, whereas serum IgG1 levels were reduced at 2 and 20 mg/kg diet. In the study performed according the second protocol, there was just a trend towards increasing IgG specific for KLH in males, but not in females. The delayed hypersensitivity response to KLH was not altered by PFOS. Also, T‐cell and B‐cell proliferation ex vivo following Con A or LPS stimulation of splenocytes were not altered by PFOS treatment.
Peden‐Adams et al. (2008) also administered doses of PFOS (potassium salt, purity > 98%, 0, 0.166, 1.66, 3.31, 16.6, 33.1 or 166 μg/kg bw per day) to B6C3F1 mice (groups of 5 male or female) via oral gavage (0.5% Tween 20 in Milli‐Q water) for 28 days. The TAD over 28 days was 0, 0.005, 0.05, 0.1, 0.5, 1 or 5 mg PFOS/kg bw (reported as free ion doses). There were no signs of overt toxic effects on body weight or organ masses (spleen, thymus, liver, kidney, gonads (uterus or testes)) following PFOS exposure, nor was the cellularity and viability of spleen and thymus. NK‐cell activity was not altered in females but was significantly increased by 2‐ to 2.5‐fold in males exposed to ≥ 0.5 mg/kg bw TAD. In contrast, plasma lysozyme was unaltered in males but was increased in females at 0.1 and 5.0 mg/kg bw TAD. SRBC‐specific IgM response was suppressed in males (52–78%) and females (50–74%) at ≥ 0.05 and ≥ 0.5 mg/kg bw TAD, respectively. In males, T‐cell CD4/CD8 subpopulations in the thymus were not affected by PFOS whereas the numbers of all T‐cell subpopulations were altered in the spleen at ≥ 0.1 mg/kg bw TAD (CD4‐/CD8+ and CD4‐/CD8‐ were increased whilst CD4+/CD8− and CD4+/CD8+ were decreased). In females, the numbers of T‐cell populations were minimally affected by PFOS. Splenic CD4–/CD8+ cells were decreased at ≥ 0.1 mg/kg TAD, whereas CD4+/CD8− were decreased at 0.1 and 0.5 mg/kg bw TAD only. In a separate experiment, female mice were dosed with 0.344 mg PFOS/kg bw per day for 21 days (TAD, 0.7 mg/kg bw) and, 7 days before termination, animals were injected i.v. with TNP. Serum levels of TNP‐specific IgM were significantly suppressed (62%) compared with controls, following challenge with TNP‐LPS. The authors determined a LOAEL of 0.05 mg/kg bw TAD for males and 0.5 mg/kg bw TAD for females (i.e. a LOAEL of 1.66 μg/kg per day). Serum concentrations in male mice at 0.05 mg/kg bw TAD were 14‐fold lower than those measured in humans with occupational exposure to PFOS (Peden‐Adams et al., 2008).
Guruge et al. (2009) administered PFOS (potassium salt, purity not given) at lower doses (0, 5 or 25 μg/kg bw per day) via oral gavage to groups of 30 female B6C3F1 mice for 21 days prior to virus inoculation with mouse‐adapted influenza virus A/PR/8/34 (H1N1). Animals were observed for signs of morbidity and mortality for a further 20 days. Body weight and organ masses were not affected by PFOS treatment. The survival rates on day 20 after virus infection were 46%, 30% and 17% in controls, 5 and 25 μg/kg bw per day, respectively. Hence, a dose‐dependent increase in mortality related to influenza infection was seen in PFOS‐treated animals, being significantly at 25 μg/kg bw per day.
The conclusions drawn based on the short‐term studies are supported by the outcome of the studies in which somewhat longer exposure (up to 28 days) was investigated. Whereas effects on various immune parameters were observed, often they were observed in the presence of more general toxicity. However, functional effects on the immune system, albeit not always consistently, were noted in the absence of overt toxicity, i.e. at levels as low as 3.3 μg/kg bw per day.
Subchronic exposure studies
Dong et al. (2009, 2011) investigated the chronic effects of PFOS on immunotoxicity in male C57BL/6 mice. PFOS (potassium salt, purity 98%) was administered via oral gavage (in deionised water in 2% Tween 80) to groups of 10 mice at dose levels of 0, 8.3, 83.33, 416.67, 833.33 or 2,083.33 μg/kg bw per day for 60 days (to achieve total doses of 0.5, 5, 25, 50 or 125 mg/kg bw). Body weight was depressed by PFOS in a dose‐dependent manner, food consumption was significantly reduced at 50 and 125 mg/kg bw TAD and relative spleen, thymus and kidney weights were reduced at 25 and 50 mg/kg bw liver weight was increased from 5 mg/kg bw TAD. Serum corticosterone was significantly increased from 50 mg/kg bw TAD. B‐lymphocyte and T‐lymphocyte proliferation was reduced at 50 and 125 mg/kg bw TAD, respectively. A dose level of 5 mg/kg bw TAD also resulted in a significant increase in NK cell activity, whilst 50 and 125 mg/kg bw TAD resulted in a significant reduction in NK cell activity. The NOAEL and LOAEL, based on liver mass, were 0.5 and 5 mg/kg bw TAD, respectively, indication that in this study immune parameters investigated were not the most sensitive. In contrast to this were results of a follow‐up study by the same group (Dong et al., 2011). In this follow‐up study, the subchronic effects of PFOS on type 1 (IL‐2 and IFN‐γ) and type 2 (IL‐4 and IL‐10) cytokines were evaluated in male C57BL/6 mice (Dong et al., 2011). K+PFOS was administered via oral gavage to groups of 12 male mice at dose levels of 0, 8.3, 16.7, 83.33, 416.7 or 833.3 μg/kg bw per day for 60 days (to achieve total doses of 0.5, 1, 5, 25, 50 or 125 mg/kg bw). Animals were immunised with SRBCs on day 54 and serum was obtained from 6 animals per dose group for SRBC specific IgM analysis 7 days later. Body weight was significantly reduced at 50 mg/kg bw TAD and food consumption was reduced by 33%. No significant changes in body weight or food consumption were reported at any other dose level. Relative spleen, thymus and kidney weights were significantly reduced at 50 mg/kg bw TAD. Relative liver weight was significantly increased from 25 mg/kg bw TAD. There were no changes in serum corticosterone levels at any dose. Specific IgG2 and delayed hypersensitivity response to SRBCs were not significantly altered by the PFOS dosing. However, PFOS caused a dose‐related increase in IL‐4 and IL‐10 secretion at 5 and 50 mg/kg bw TAD, respectively, whereas IL‐2 and IFN‐γ were decreased at 50 mg/kg bw TAD. A TAD dose of 50 mg/kg bw significantly decreased the number of IL‐2+ and IL‐10+ ‐secreting lymphocytes. A dose‐related decrease in the synthesis of SRBC‐specific IgM levels in sera was reported at doses of 5 mg/kg bw TAD and higher, and specific IgG, IgG1 and IgE were significantly elevated at 50 mg/kg bw TAD, indicating that functional effects on the immune system were noted at doses not causing other toxicity.
A further study by Dong et al. (2012a) investigated the subchronic effects of PFOS on inflammation in male C57BL/6 mice administered K+PFOS (0, 8.3, 16.7, 83.33, 416.7 or 833.3 μg/kg bw per day) via oral gavage (in deionised water in 2% Tween 80) to groups of 12 male mice for 60 days (to achieve total doses of 0.5, 1, 5, 25, 50 or 125 mg/kg bw). One day after the cessation of dosing, 6 animals per group were injected with LPS. Body weight and a reduction in food consumption were depressed by PFOS at > 25 mg/kg bw TAD, in a dose‐related manner. Dose‐related decreases in relative spleen, thymus and kidney weights were also reported. At 125 mg/kg bw TAD, total peritoneal cells were reduced although the total number of macrophages (CD11b+) was significantly increased. PFOS markedly increased the ex vivo production of TNF‐α, IL‐1β, and IL‐6 in peritoneal and splenic macrophages when stimulated either in vitro or in vivo with LPS. An increase in gene expression of TNF‐α, IL‐1β and c‐myc was reported at from 50 mg/kg bw, and IL‐6 at 125 mg/kg bw TAD (Dong et al., 2012a).
The same group showed that PFOS also induced apoptosis and necrosis in primary splenocytes and thymocytes isolated from mice treated with PFOS at 1, 5 or 50 mg/kg bw per day for 60 days (Dong et al., 2012b). An increase in apoptotic cells was seen in splenocytes and thymocytes following 5 and 50 mg/kg bw per day PFOS exposure respectively, compared with controls. Necrosis was only seen in both cells after treatment with the highest concentration. At 50 mg/kg bw per day mitochondrial membrane potential and associated Bcl‐xl expression was decreased compared with controls, while p53 was significantly increased. Bcl‐2 and Bax expression remained unchanged following PFOS exposure (Dong et al., 2012b).
Also, the subchronic studies showed functional effects on the immune system in the absence of other toxicities. As such, the data are in line with the outcome of the short‐term and medium‐term exposure studies. In addition, a possible mechanism by which some of the immunotoxic effects are caused may be the induction of apoptosis in lymphocytes.
Data on effects of exposure to PFOS on hypersensitivity response in animals are inconsistent. Dietary exposure to PFOS (4 mg/kg diet through 12 weeks of age) was associated with greater airway sensitivity to methacholine; however, the association was not consistent as other airway measures did not support hyperresponsiveness (i.e. no effect on airway resistance, tissue resistance or elastance) and some results suggested suppression (e.g. blunted OVA‐induced rise in leucocytes and macrophages in BALF) (Ryu et al., 2014). Dong et al. (2011) reported that oral PFOS exposure (0.8333 mg/kg bw per day via gavage) for 60 days was associated with increased antigen‐specific IgE levels following SRBC challenge.
Based on these results, it can be concluded that PFOS disturbs homoeostasis of the immune system and is therefore immunotoxic at doses as low as 1.66 μg/kg bw per day.
3.3.3.5.2. PFOA
The following studies on PFOS are summarised in Table 16.
Table 16.
Immunotoxicity PFOA
| Substance/(Purity) | Species/Experimental design and doses | Most sensitive endpoints | Highest dose with no effect (mg/kg bw per day) | Significant effect level (mg/kg bw per day) | Serum/tissue levels of compound | Reference |
|---|---|---|---|---|---|---|
| PFOA, 97% | Mice (5 females per group), 7 days, gavage, 20 mg/kg bw per day | Several immune parameters reduced, but also body weight gain and liver | N/A | 20 | NR | Vetvicka and Vetvickova (2013) |
| PFOA, 98% | Mice (16 females), 10 days, gavage, 0, 30 mg/kg bw per day. Followed by nil or exposure for 5 days | Reduced antibody responses but also body weight gain | N/A | 30 | NR | DeWitt et al. (2008) |
| PFOA, 98% |
Mice (6 males), Drinking water for 15 days 3.75, 7.5, 15, 30 mg/kg bw per day or 0.94, 1.88, 3.75, 7.5 mg/kg bw per day |
Reduced antibody response | 3.75 | 7.5 | 35.33 μg/ml | Dewitt et al. (2009) |
| PFOA, 98% | Mice (4–8 males per group), food for 10 days, 0.001 or 0.02% (2 or 40 mg/kg bw per day) (0.02% equals a total of 5.2 mg/animal over 10 days) | Values several immune parameters up or down, but also body weight gain | N/A | 0.02% (40 mg/kg bw per day) | NR | Qazi et al. (2009a, b) |
| PFOA, 98% | Mice (4 males per group), restricted food diet, 10 days, 0.001, 0.002, 0.02 (1.6, 3.1 or 23.5 mg/kg bw per day) | Reduced B‐cell numbers | 0.002% (3.1 mg/kg bw per day) | 0.02% (23.5 mg/kg bw per day) | NR | Qazi et al. (2012) |
| PFOA, 96% | Mice (5 females per group), gavage, 20 mg/kg bw per day, 21 days | Various immune parameters reduced | N/A | 20 | NR | Vetvicka and Vetvickova (2013) |
| PFOA, 100% | Mice (5–6 males per group), drinking water, 21 days, 0.49, 2.64, 17.63, 47.21 mg/kg bw per day | Reduced CD8 levels | N/A | 0.49 | NR | Son et al. (2009) |
| PFOA, 100% | Mice (10–20 males), gavage, 0.3, 1, 10, 30 mg/kg bw per day, 29 days | Various immune parameters reduced, but also body weight gain, liver | 1 | 10 | NR | Loveless et al. (2008) |
| PFOA, 100% | Rats, gavage (10–20 males, 0.3, 1, 10, 30 mg/kg bw per day, 29 days | Body weight, haematopoiesis, but no immune effects | No immune effects | N/A | NR | Loveless et al. (2008) |
| PFOA | Mice (8–10 females per group, diet, 4 mg/kg diet at day 2 of gestation though to 12 weeks of age | Increased airway hyperresponsiveness | N/A | 4 mg/kg diet | 4.8 μg/mL | Ryu et al. (2014) |
bw: body weight; N/A: not applicable; NR: not reported; PFOA: perfluorooctanoic acid.
Short‐term exposure on immunotoxicity parameters in mice
Vetvicka and Vetvickova (2013) investigated the immunotoxic effects of PFOA and PFOS in mice. PFOA (purity 96%, in phosphate buffered saline) was administered at 20 mg/kg bw per day via oral gavage to female BALB/c mice (groups of 5 mice) for 7 days. Body weight was depressed from day 4 of treatment while liver mass was increased. Mice showed significant inhibition of phagocytosis and natural killer (NK) cell activity, and decreased antibody responses compared to controls. No significantly effect was seen on cellularity in the spleen, but significant reduction of cellularity was noted in the thymus. In the spleen, significantly suppressed T‐lymphocyte proliferation, inhibited B‐lymphocyte proliferation, inhibited phagocytosis and reduced NK were noted. The CONTAM Panel noted that whereas this study indicates that several immune parameters, including functional parameters, are influenced by PFOA at the concentration of 20 mg/kg bw per day for 7 days, there was a simultaneous effect on body weight gain and liver, it cannot be ruled out that some of these effects are indirect effects rather than direct effects of PFOA exposure.
DeWitt et al. (2008) performed an oral exposure experiment in female C57BL/J mice, in which initial doses of 0 or 30 mg/kg bw per day PFOA (98% purity, ammonium salt) were administered by oral gavage (using a water vehicle) for 10 days, after which time half the group was treated with the vehicle alone (recovery group) whilst the remaining half was given further daily doses for days 11–15 (constant group). Eight mice per group were used for endpoints, with the exception of antibody production where 16 animals/dose were used. At 30 mg/kg bw per day, significantly reduced body weights were noted. Body weights recovered in animals in the recovery group. Relative liver weights were significantly increased in both the constant and recovery groups, while IgM synthesis after immunisation to sheep red blood cells (SRBCs) was significantly decreased compared with controls in both constant and recovery groups. In subsequent dose–response studies by this group (DeWitt et al., 2009), female C57BL/6N mice received PFOA via drinking water at doses of 3.75, 7.5, 15 or 30 mg/kg bw per day or 0.94, 1.88, 3.75 or 7.5 mg/kg bw per day for 15 days, and were immunised intravenously with SRBC for immunoglobulin responses or bovine serum albumin (BSA) on day 10 of exposure to assess delayed hypersensitivity response. SRBC‐specific IgM synthesis was suppressed at ≥ 3.75 mg/kg bw per day in a dose‐dependent manner, but no effects of PFOA treatment on delayed hypersensitivity were reported (DeWitt et al., 2008). The CONTAM Panel notes that again, this study indicates that oral exposure to PFOA leads to decreased values of immune parameters. Whereas at the higher concentration used, there is an effect on body weight and liver, for which reason it cannot be concluded whether the decrement was due to direct effects on the immune system or represent indirect effects. However, the dose–response studies reveal effects on the antibody response to Sheep red blood cells at lower concentrations, i.e. from 3.75 mg/kg bw per day. As there were no effects on body weight at these doses, direct effects seem evident. The CONTAM Panel noted that especially the humoral arm of the immune system seems affected; delayed type hypersensitivity responses were not affected.
In order to further shed light on whether effects of PFOA on the immune system were direct effects, or rather present indirect effects through an influence on corticosterone levels that may be influenced by PFOA exposure, the same authors (Dewitt et al., 2009) performed a study in which NH4 +PFOA (98% purity; 3.75, 7.5 or 15 mg/kg bw per day) was administered via drinking water for 10 consecutive days (groups of 6 animals/treatment group) to female C57BL/6N mice that were either adrenalectomised or sham‐operated. After exposure the mice were immunised with SRBCs. Serum corticosterone levels were significantly higher in sham‐surgical animals exposed to 15 mg/kg bw per day by approximately 157% compared with controls, whereas levels were not significant different in adrenalectomised, PFOA dosed animals. Exposure to 15 mg/kg bw per day reduced body weight in both sham‐operated and adrenalectomised mice, and significantly reduced IgM titres in sham‐operated as well as in adrenalectomised animals, by 15% and by 18%, respectively. Following exposure to 7.5 mg/kg bw per day PFOA, body weight was reduced in adrenalectomised mice, and reduced immunoglobulin M (IgM) titres by 11.8% in adrenalectomised animals. The CONTAM Panel notes that this study indicates that in mice functional effects of exposure to PFOA is observed while there was still an effect on body weights, but that the effect appears independent from corticosterone levels.
Qazi et al. (2009b) investigated the effect of PFOA on circulating neutrophils and the inflammatory response of macrophages following lipopolysaccharide (LPS) stimulation after oral exposure. NH4 +PFOA, 98% purity, was administered via the diet to male (C57BL/6 (H‐2b)) mice at 0.001% or 0.02% (corresponding to 2 or 40 mg/kg bw per day, when calculated using EFSA default values (EFSA Scientific Committee, 2012)) for 10 days (groups of 8 mice/analysis group), following which half of the animals were given an intravenous dose of LPS. 0.02% PFOA was reported to give a dose of 5.2 mg/animal over the 10 days (doses/kg bw were not reported). Food consumption and body weight were reduced following 0.02% PFOA administration. At this concentration, also reduced numbers of total white blood cells, lymphocytes and neutrophils was observed. Moreover, PFOA markedly reduced the number of macrophages in the bone marrow, but not in the spleen or peritoneal cavity, despite overall cellularity being strikingly reduced. The ex vivo production of TNF‐α was modestly increased by peritoneal and bone marrow macrophages but reduced in spleen cells following PFOA (0.02% (40 mg/kg bw per day) exposure. IL‐6 was also increased in peritoneal cells, but not in bone marrow cells. In vitro stimulation of peritoneal, bone marrow and spleen cells with LPS enhanced the production of both TNF‐α and IL‐6 and the in vivo exposure to PFOA potentiated these ex vivo TNF‐α and IL‐6 responses. The serum levels of these cytokines in response to in vivo LPS stimulation was elevated by 0.02% PFOA. The authors conclude that the results are consistent with an immunosuppressive effect of 0.02% PFOA in the diet and an augmented inflammatory response to LPS at that concentration. The Panel considers that in this study effects of exposure are noted, but at a dose where there is also a considerable effect of feed intake and body weight.
Qazi et al. (2009a) performed subsequent studies to investigate cellular composition of the thymus and spleen following exposure to PFASs. PFOA was administered to groups of 4 male C57BL/6 (H‐2b) mice via the diet at 0 or 0.02% (40 mg/kg bw per day) for 10 days. Following exposure, food consumption, body weight, liver weight and epididymal fat weights were markedly depressed. In addition, relative thymus and spleen weight were reduced. There were marked decreases in total thymocytes and splenocytes following exposure to PFOA and the morphology of the thymus was significantly different to controls (the thymic cortex of exposed animals was smaller and virtually devoid of cells and the cortical/medullary junction was not distinguishable).
In a further study (Qazi et al., 2012), groups of four male C57BL/6(H‐2) mice were administered doses of 0, 0.001, 0.002 or 0.02% (indicated by author corresponding to 0, 1.6, 3.1 or 23.5 mg/kg bw per day) in the PFOA diet for 10 consecutive days, following which recovery was allowed for a further 10 days. In separate experiment, control animals were fed a restricted diet (35% reduction in normal daily food consumption) to allow comparison of organ effects with high‐dose PFOA, which had previously been shown to reduce dietary intake. Again, at 0.02% PFOA (23.5 mg/kg bw per day), significant reductions in food intake, body weights, and relative weights liver and epididymal fat pads were reported. In addition, reduced weights of thymus and spleen, and marked reductions in the numbers of thymocytes (96%), splenocytes (64%) and bone marrow cells (27%) were also reported, as well as B‐lymphoid and myeloid cells. Dietary restriction in control animals reduced body weight and relative weights of liver, thymus, spleen and epididymal fat pads. The total numbers of B‐lymphoid cells and pro/pre‐B and immature B cells were reduced by dietary restriction in a similar manner to PFOS‐treated animals. Exposure to 0.002% PFOA (3.1 mg/kg bw per day) significantly reduced the number of B‐lymphoid cells without any effect on myeloid cells. In the 10‐day recovery study, food consumption and body weight recovered, whereas relative weights of liver, thymus, spleen showed only slight recovery. The numbers of myeloid cells recovered after 10 days, but none of the subpopulations of B‐cell lineage. The CONTAM Panel notes that the studies by Qazi et al. (2009a,b, 2012) show effects on cellular composition of the thymus, spleen, and bone marrow, and that the effects observed are in line with an immunosuppressive and inflammatory activity of PFOA. Some effects are similar to effects noted after food restriction, and may be associated with inhibition of food consumption. The CONTAM Panel notes that recovery of an effect on food consumption and body weight takes place after terminating exposure, while effects on immune parameters, once established, are still evident after terminating exposure.
Studies using longer exposure periods
Vetvicka and Vetvickova (2013) administered PFOA (20 mg/kg bw per day; purity 96%, in phosphate buffered saline) via oral gavage to groups of 5 female BALB/c mice for 21 days. For antibody formation, animals were treated for one week then injected twice (one week apart) with ovalbumin, and total antibodies to ovalbumin determined. Effects on body weights were not reported. PFOA significantly reduced NK splenic activity, total antibodies to ovalbumin and the formation of IgM directed against tri‐nitrophenyl (TNP).
Son et al. (2009) administered PFOA (ammonium salt, 98% pure) in drinking water ((0, 2, 10, 50 or 250 mg/L (ppm)), equivalent to 0, 0.49 ± 0.04, 2.64 ± 0.15, 17.63 ± 1.15, 47.21 ± 3.57 mg/kg bw per day) for 21 days to Male ICR mice (5–6/group). Mean body weight was decreased in a dose‐dependent manner and markedly decreased at 250 ppm (26% reduction at 250 ppm compared with 19% gain in controls). In the spleen, CD8 + lymphocyte populations were decreased by approximately 50% compared with controls at all dose levels and CD4 + lymphocyte populations were increased at 50 and 250 ppm (43% and 106%, respectively). In the thymus, exposure to 250 ppm significantly increased CD8+ lymphocytes (110%) whereas CD4+ was not altered. Atrophy, with decreased thickness of the cortex and medulla, and more densely arranged lymphoid cells in the cortex, were also reported. PFOA at 250 ppm also increased the expression of proinflammatory cytokines TNF‐α, IL‐1β and IL‐6 in the spleen but not in the thymus and C‐myc expression was increased in both the spleen and the thymus.
Loveless et al. (2008) administered NH4 + PFOA (100% pure, 0, 0.3, 1, 10, 30 mg/kg bw per day) via oral gavage to groups of 20 male CD‐1 mice and 10 male CD rats for 29 days. Mice and rats in the 30 mg/kg bw per day group were either given an i.v. dose of SRBCs or NANO pure water for 5 days from day 23 or 24, respectively (termed 30/0 mg/kg bw per day group). In mice, 10 and 30 mg PFOA/kg bw per day caused a marked loss in body weight and a tripling in liver weight. 10 and 30 mg/kg bw per day also caused a 2.3‐fold increase in serum corticosterone, a moderate reduction in triglycerides (47% and 32% of controls, respectively), an increase in blood neutrophils and monocytes, and a decrease in peripheral blood lymphocytes (at 30 mg/kg bw per day only). Immune effects included reduced IgM titres to SRBCs (at the 10 and 30 mg/kg bw per day), decreased spleen and thymus weights and numbers of cells in these. In rats, doses of 10 mg/kg bw per day and higher caused a reduction in body weight and an increase in relative liver weights and liver hepatocellular hypertrophy (moderate), with evidence of hepatocellular necrosis. Haemoglobin and haematocrit were slightly (91% and 92%) but significantly reduced at 10 and 30 mg/kg bw per day, respectively, and reticulocytes were moderately increased in the 30 mg/kg bw per day group, associated with extra‐medullary haematopoiesis. Unlike mice, no effects on SRBC‐IgM titres were reported. In the 30 mg/kg bw per day group, increased haematopoiesis in the spleen was reported, but no changes in total spleen cell number or thymocyte number was seen.
Ryu et al. (2014) studied effects of dietary exposure to PFOA (4 mg/kg diet through 12 weeks of age) that they found associated with increased airway hyperresponsiveness in male and female mice following methacholine. However, they compared only one exposure dose to controls and therefore the results are not informative as to whether or not there is a dose response.
Taken together, the CONTAM Panel notes that the evidence available suggests that exposure to PFOA has effects on the immune system in vivo. The immunotoxic effects in vivo were revealed by the cellular composition of bone marrow, spleen, and thymus, and functional effects were noted to include decreased antibody responses to T‐cell dependent antigens and increased specific IgE antibody responses and inflammatory responses. These data suggest a dysregulation of the immune system, with different influences on innate vs acquired immunity. Effects were usually seen at doses that also induce general toxic effects such as on food intake and body weights. Whereas efforts have been made to rule out indirect effects, such as through corticosterone, indirect effects cannot be ruled out. On the other hand, recovery experiments show that immune effects may be longer lived than effects on body weight and liver. Based on the 28‐day oral exposure study of Loveless et al. (2008), the NOAEL for systemic toxicity was 0.3 mg/kg bw per day based on single‐cell/focal hepatocellular necrosis at 1 mg/kg bw per day. The NOAEL for immunotoxicity was 1 mg/kg bw per day based on suppression of anti‐SRBC IgM titre.
3.3.3.6. Genotoxicity
In 2008, EFSA concluded that, based on the negativity in a large series of in vitro and/or in vivo short‐term tests at gene and/or chromosome or DNA repair levels, genotoxicity does not appear to be a property of PFOS and that the weight of evidence indicates an indirect (non‐genotoxic) mechanism for the carcinogenicity of PFOS (EFSA, 2008). For PFOA, notwithstanding the positive results in an in vitro chromosomal assay in CHO cells at a toxic concentration, EFSA concluded that the negative outcome in a comprehensive series of in vitro and in vivo short‐term tests at gene and/or chromosome level indicates that PFOA is devoid of significant genotoxic activity (EFSA, 2008). This section summarises available PFAS genotoxicity studies published since 2007.
The CONTAM Panel has identified one study of genotoxicity in humans. In 604 fertile men from Greenland, Poland and Ukraine, no associations were found between PFASs in serum (PFOS, PFOA, PFNA and PFHxS) and sperm chromatin structure, apoptotic markers in semen or reproductive hormones in serum (Specht et al., 2012). The authors concluded that exposure to PFOS, PFOA, PFNA and PFHxS in these fertile men are not associated with DNA damage in sperm cells.
Tables 17 and 18 list all available in vitro and in vivo genotoxicity studies identified since 2007 for PFOS and PFOA, respectively.
Table 17.
In vitro and in vivo genotoxicity of PFOS
| Test system | Cells/animals | Concentration/Treatment | Result | Comment | Reference |
|---|---|---|---|---|---|
| In vitro | |||||
| Mutation frequencies at redBA/gam gene loci (Spi‐assay) | gpt delta transgenic mouse embryonic fibroblasts | 0, 1–20 μM, 24 h |
Positive ≥ 10 μM |
At 10 μM (24 h) no effects on cell viability; at 20 μM 50% decrease in cell viability and increased y‐H2AX (foci not quantified, significantly increased Western Blot signal); catalase treatment decreased PFOS induced mutations and the number of y‐H2AX positive cells | Wang et al. (2015d) |
| Micronuclei(CBMN) | HepG2 cells | 0, 5–300 μM, 24 h | Negative | Significant cytotoxicity ≥ 300 μM, 24 h; no significant ROS induction (5–300 μM, 1 or 24 h) | Florentin et al. (2011) |
| DNA strand breaks and FPG sensitive sites (Comet assay) | HepG2 cells | 0, 100, 400 μM, 24 h | Negative | Significant increase in ROS production (DCFH‐DA), 0.4–2,000 μM, 3 h400 μM for 24 h resulted in a LDH release of 43% | Eriksen et al. (2010) |
| DNA strand breaks(Comet assay) | HepG2 cells | 0, 5–300 μM, 1 or 24 h | Negative | Significant cytotoxicity from ≥ 300 μM, 24 h; no significant ROS induction (5–300 μM, 1 or 24 h) | Florentin et al. (2011) |
| 0, 0.2–20 μM, 24 h |
Positive ≥ 0.2 μM |
Cytotoxicity > 20 μM, 24 h; no dose dependency, positive for ROS (DCFDA fluorescence) ≥ 0.2 μM | Wielsøe et al. (2015) | ||
| SHE cells | 0, 0.00037–93 μM, 5 or 24 h | Negative | PFOS induced SHE cell transformations (7 days treatment) at non‐cytotoxic concentrations (0.37, 3.7 μM) | Jacquet et al. (2012a) | |
| In vivo | |||||
| Micronuclei | Rat | 0, 0.6–2.5 mg/kg, 30 days, via gavage every 48 h |
Positive ≥ 1.25 mg/kg |
Erythrocytes in bone marrow; ≥ 0.6 mg/kg increased number of polychromatic erythrocytes and increased damage as assed by comet assay scores | Çelik et al. (2013) |
| Micronuclei, Comet Assay | Rat | 0.6–2.5 mg/kg, 30 days, via gavage every 48 h | Positive (all doses) | Peripheral blood; 2.5 mg/kg ~ 1% LD50, 0.6 mg/kg no behavioural or neurotoxic effects | Eke and Çelik (2016) |
| Transgenic animal mutation assay | gpt delta transgenic mouse | 1.5, 4, 10 mg/kg per day via oral gavage for 28 days | Negative | Mutation frequencies (Spi‐) and frequencies of micronucleated polychromatic erythrocytes increased, but not in a significant manner | Wang et al. (2015d) |
| DNA damage(Hus‐1:GFP Foci) | Caenorhabditis elegans | 0, 0.25–25 μM (12–60 h) |
Positive ≥ 0.25 μM, 24 h |
Also positive for ROS, decreased number of germ cells, mitotic cell cycle arrest | Guo et al. (2016) |
| Comet assay (alkaline) | Green mussel (Perna viridis) | 0, 0.01–1,000 μg/L for 7 days |
Positive ≥ 100 μg/L |
Liu et al. (2014b) | |
| Comet assay (alkaline) | Paramecium caudatum | 0, 10, 30, 100 μM (1, 3 h) 0, 10, 30 μM (24 h) | Negative | 100 μM PFOS for 6 h 100% toxicity | Kawamoto et al. (2010) |
| Comet assay (alkaline) | Earthworms | 0, 0.25–8 μg/cm2, 48 h |
Positive ≥ 0.25 μg/cm3 |
Xu et al. (2013) | |
|
Comet assay (alkaline) Micronuclei |
Zebrafish | 0, 0.4–1.6 mg/L, 30 days incubation of embryos |
Positive ≥ 0.4 mg/L Positive ≥ 0.8 mg/L |
Measured in peripheral blood cells; significance not given Measured in peripheral blood cells; significance given |
Du et al. (2014) |
| DNA strand breaks (alkaline precipitation) | Gull (Larus michahellis) eggs | 0, 100, 200 ng/g egg (injected) | Negative | Parolini et al. (2016) | |
DCFDA: dichlorofluorescin diacetate; DCFH‐DA: dichlorodihydrofluorescein diacetate; LDH: lactate dehydrogenase; PFOS: perfluorooctane sulfonic acid; ROS: reactive oxygen species; SHE: Syrian hamster embryo.
Table 18.
In vitro and in vivo genotoxicity studies of PFOA
| Test system | Cells/animals | Concentration/Treatment | Result | Comment | Reference |
|---|---|---|---|---|---|
| In vitro | |||||
| Bacterial reverse mutation assay (Ames test) | S. Typhimurium TA98, TA100, TA102, TA104 |
100, 500 μM (−S9) 100, 500 μM (+S9) |
Negative Negative |
Fernández Freire et al. (2008) | |
| S. Typhimurium TA98,TA100, TA1535, TA1537, TA1538 |
5 μmol/plate (−S9) 5 μmol/plate (+S9) |
Negative Negative |
Only highest applied non‐cytotoxic dose shown; mean of two independent experiments | Buhrke et al. (2013) | |
| Mutation frequencies at CD59 gene loci | Human hamster hybrid cells (AL) |
0–200 μM, 1–8 days 0–200 μM, 16 days |
Negative Positive at 200 μM |
Cytotoxicity at ≥ 100 μM, 1 day; induction of ROS and decrease of PFOS induced mutations by treatment with ROS scavenger |
Zhao et al. (2010b) |
| Mitochondrial‐DNA deficient AL cells | 0–200 μM, 16 days | Negative | |||
| Micronuclei(CBMN) | HepG2 cells | 0, 5–400 μM, 1 or 24 h | Negative | Significant cytotoxicity ≥ 200 μM, 24 h; no significant ROS induction (5–400 μM, 1 or 24 h) | Florentin et al. (2011) |
| Micronuclei | HepG2 cells | 0, 50–400 μM, 24 h |
Positive ≥ 100 μM |
Also positive for strand breaks, 8‐OHdG (≥ 100 μM, 3 h) and ROS (≥ 100 μM, 2 h); both dose dependent | Yao and Zhong (2005) |
| Micronuclei(OECD 487) | V79 cells | 10 μM (−S9, +S9), 3 h (+21 h post‐incubation) | Negative | IC50 (neutral red) 47 μM, 72 h | Buhrke et al. (2013) |
| DNA strand breaks and FPG sensitive sites (Comet assay) | HepG2 cells | 0, 100, 400 μM, 24 h | Negative |
Significant increase in ROS production (DCFH‐DA), 0.4–2,000 μM, 3 h 400 μM for 24 h resulted in a LDH release of ≤ 5% |
Eriksen et al. (2010) |
| DNA strand breaks(Comet assay) | HepG2 cells |
0, 5–400 μM, 1 or 24 h 0, 0.2–20 μM, 24 h 0, 50–400 μM, 1 h |
Negative Positive ≥ 10 μM Positive ≥ 50 μM |
Significant cytotoxicity ≥ 200 μM, 24 h; no significant ROS induction (5–400 μM, 1 or 24 h).Cytotoxicity > 200 μM, 24 h; positive for ROS (DCFDA fluorescence) ≥ 0.2 μMAlso positive for micronuclei, 8‐OHdG (≥ 100 μM, 3 h)and ROS (≥ 100 μM, 2 h); both dose dependent |
Florentin et al. (2011) Wielsøe et al. (2015) Yao and Zhong (2005) |
| Syrian hamster embryo (SHE) cells | 0, 0.00037–300 μM (0–124 μg/mL, 5 or 24 h | Negative | PFOA alone did not induce SHE cell transformation frequency in a 7 day treatment; the combination BaP/PFOA induced cell transformation at all PFOA concentrations tested | Jacquet et al. (2012b) | |
| DNA strand breaks (Comet assay) | Human lymphoblastoid (TK6) cells | 0, 125, 259, 500 ppm, 2 h | Positive ≥ 250 ppm | The authors state that cells are viable (as measured by trypan blue). However, data are not shown. | Yahia et al. (2014) |
| 8‐OHdG(LC‐MS/MS) | Human lymphoblastoid (TK6) cells | 0, 125, 259, 500 ppm, 2 h | Positive ≥ 250 ppm | The authors state that cells are viable (as measured by trypan blue). However, data are not shown. | Yahia et al. (2014) |
| In vivo | |||||
| Comet assay | Green mussel (Perna viridis) | 0, 0.01–1,000 μg/L for 7 days | Positive ≥ 1,000 μg/L | Liu et al. (2014b) | |
| Comet assay (alkaline) | Paramecium caudatum |
0, 10, 30, 100 μM (1, 3 h) 0, 10, 30 μM (24 h) |
(positive) 100 μM, 12 and 24 h |
At pH 13 but not at pH 12.1 DNA migration | Kawamoto et al. (2010) |
DCFDA: dichlorofluorescin diacetate; DCFH‐DA: dichlorodihydrofluorescein diacetate; LDH: lactate dehydrogenase; PFOA: perfluorooctanoic acid; ROS: reactive oxygen species; SHE: Syrian hamster embryo; SOD: superoxide dismutase; TrxR: thioredoxin reductase.
PFOS increased mutation frequencies at redBA/gam gene loci in gpt delta transgenic mouse embryonic fibroblasts (Wang et al., 2015b). PFOS failed to induce DNA strand breaks in SHE cells (Jacquet et al., 2012a) and DNA strand breaks or micronuclei in human HepG2 cells (Eriksen et al., 2010; Florentin et al., 2011). In another HepG2 study, concomitantly with increased ROS production, a non‐dose‐dependent increase in strand breaks was observed (Wielsøe et al., 2015). PFOS induced micronuclei and DNA strand breaks in rat bone marrow and peripheral blood (Çelik et al., 2013; Eke and Çelik, 2016), but did not increase mutation frequencies in gpt delta transgenic mice. DNA damage followed PFOS treatment was observed in Caenorhabditis elegans, green mussels, earthworms and zebrafish (Table 17).
PFOA did not induce mutations in bacteria (Fernández Freire et al., 2008; Buhrke et al., 2013), but increased mutation frequency at CD59 loci in human hamster hybrid cells at the highest applied (cytotoxic) concentration after long‐term (16 days) incubation (Zhao et al., 2010b). Four studies reported no genotoxic effects (DNA strand breaks, micronuclei) after PFOA treatment in HepG2 (Florentin et al., 2011; Eriksen et al., 2010), V79 (Buhrke et al., 2013) and SHE cells (Jacquet et al., 2012b). Three studies reported increased micronuclei, strand breaks and 8OHdG in HepG2 (Yao and Zhong, 2005; Wielsøe et al., 2015) and TK6 cells (Yahia et al., 2014). In two studies these effects were accompanied by an increase in cellular ROS. The CONTAM Panel identified for PFOA no recent genotoxicity studies in animals.
The CONTAM Panel concluded that for PFOS and PFOA the available data are inconclusive. Recent studies provide some evidence that the observed effects are related to oxidative stress (Yao and Zhong, 2005; Wielsøe et al., 2015; Guo et al., 2016). The CONTAM Panel identified no evidence for a direct genotoxic mode of action, either in vitro or in vivo.
3.3.3.7. Long‐term toxicity and carcinogenicity
When evaluating rodent long‐term studies performed before 2008, PFOS was found to be hepatotoxic and to induce tumours in the liver. It was also stated that there was limited evidence for the induction of thyroid and mammary gland tumours (EFSA, 2008). For non‐neoplastic effects, in the liver a NOAEL for PFOS of 0.14 mg/kg bw per day was derived for male and female rats. Based on the absence of genotoxicity of PFOS in a series of genotoxicity assays, a liver tumour‐promoting effect of this compound has been assumed, an effect largely attributed to a PPARa agonism mode of action.
Before 2008, several carcinogenicity studies have been evaluated showing that PFOA induces not only hepatomegaly, but also hepatocellular adenomas, Leydig cell adenomas and pancreatic acinar cell hyperplasia in rodents (EFSA, 2008). Based on negative results in a series of genotoxicity tests an indirect (non‐genotoxic) mechanism for carcinogenicity was assumed. This was confirmed in a two‐stage assay for hepatocarcinogenesis, i.e. liver carcinogenesis was promoted in male rats initiated with diethylnitrosamine, followed by treatment with PFOA for 12 months.
It was assumed that the induction of liver tumours in rats by PFOA is mediated largely by a PPARa agonism mode of action. However, evidence has been gained for PPARa‐independent effects of PFOA, which might contribute to carcinogenesis, e.g. the induction of Leydig cell tumours may be due to hormonal imbalance resulting from induction of the cytochrome P450 enzyme and aromatase or interference with hormone receptors (ATSDR, 2015). The mechanism of PFOA‐induced pancreatic acinar cell tumours remains to be elucidated. It was suggested that PPARa stimulation might alter bile flow, bile acid composition and the subsequent release of cholecystokinin (CCK), which may promote pancreatic cell proliferation and tumour formation (ATSDR, 2015).
In 2016, EPA (US EPA, 2016b) evaluated PFOA and concluded that data were insufficient to understand the mode of action underlying PFOA‐induced testicular and pancreatic tumours. According to EPA's Cancer Guidelines tumorigenic effects of chemicals in animals are presumed to be relevant for humans in case of absence of sufficient data to establish a mode of action.
In 2016, IARC (2016) evaluated PFOA and stated that there is limited evidence for carcinogenicity in experimental animals and moderate evidence for mechanisms of PFOA‐associated carcinogenesis, including some evidence for these mechanisms being operative in humans. The compound was assigned to group 2B as being possibly carcinogenic to humans (Group 2B).
Following the EFSA opinion of 2008 (EFSA, 2008), no new studies in mammalians have been conducted so far. However, old studies were published in more detail and material thereof was subjected to histopathological re‐evaluation. Some new data have been generated in a trout two stage‐hepatocarcinogenesis model.
3.3.3.7.1. PFOS
Butenhoff et al. (2012b) re‐evaluated a two‐year toxicity and cancer bioassay in male and female Sprague–Dawley rats, published first by Thomford (2002). The potassium salt of PFOS (86.9% purity; impurities: 4.73% PFHxS; 0.71% PFCAs (perfluorobutanoic acid; perfluoropentanoic acid; PFOA); 1.45% metals (calcium, magnesium, sodium, nickel, iron); 0.59% inorganic fluoride) was applied for 104 weeks at dietary doses of 0, 0.024, 0.098, 0.242, 0.984 mg/kg bw per day to males and at 0, 0.029, 0.120, 0.299, 1.251 mg/kg bw per day to females. Additional groups were fed the highest dose for the first 52 weeks, after which they were fed control diet until study termination. PFOS caused reductions in body weight in males fed the highest dose, which was evident throughout the observation period of 104 weeks. Male rats exhibited a statistically significant increased survival at the two highest treatment levels. In groups receiving the highest dose of PFOS, serum levels of total cholesterol (in males) and of glucose were decreased, while urea nitrogen was elevated. Statistically significant increases in hepatocellular adenoma were observed in males and females at the highest PFOS dose. In this treatment group, a single hepatocellular carcinoma occurred in a female animal. There were no treatment‐related findings for thyroid gland, kidney or bladder (see Table 19). The authors concluded that the liver tumour formation may be due to a PPARa/CAR/PXR‐mediated mode of action (see Section 3.3.5.5).
Table 19.
Long‐term toxicity and carcinogenicity
| Substance (Purity) | Species/Experimental design and doses | Most sensitive endpoints | Highest dose with no effect (mg/kg bw per day) | Significant effect level (mg/kg bw per day) | Serum/tissue level of PFOS | Reference |
|---|---|---|---|---|---|---|
| Perfluorooctane sulfonic acid (PFOS) | ||||||
| PFOS (potassium salt, 86.9% purity) |
Sprague–Dawley rats (m/f) No/sex/group: 60–70 Duration: 103–106 weeks Diet at 0, 0.5, 2, 5, or 20 mg/kg (For males equivalent to 0, 0.024, 0.098, 0.242, 0.984 mg/kg bw per day For females equivalent to 0, 0.029, 0.120, 0.299, 1.251 mg/kg bw per day) |
Incr serum urea nitrogen (f, wk 53) Incr serum urea nitrogen (m, wk 53) Incr serum ALT (m, wk 14 + 53) Hepatic centrolob hypertrophy (m, wk 104) Hepatic adenoma (m, wk 104) Hepatic adenoma (f, wk 104) |
0.12 0.024 0.242 0.024 0.242 0.299 |
0.299 0.098 0.984 0.098 0.984 1.251 |
Concentrations in (μg/mL) serum (f, wk 14) at 0.029 mg/kg bw per day: 7.0 ± 1; at 0.12 mg/kg bw per day: 27.3 ± 2.3 Serum (m, wk 14) at 0.024 mg/kg bw per day: 4 ± 0.8; at 0.098 mg/kg bw per day: 17.1 ± 1.2 Liver (m, wk 14) at 0.242 mg/kg bw per day: 358 ± 28.8; at 0.984 mg/kg bw per day: 568 ± 107 Liver (m, wk 104) at 0.242 mg/kg bw per day: 70.5 ± 63.1; at 0.984 mg/kg bw per day: 189 ± 141 Liver (f, wk 104) at 0.299 mg/kg bw per day: 131 ± 61.4, at 1.251 mg/kg bw per day: 381 ± 176 |
Butenhoff et al. (2012b) |
| Perfluorooctanoic acid (PFOA) | ||||||
| PFOA (ammonium salt, 97.2% purity, linear & branched) |
Sprague–Dawley rats (m/f) No/sex/group: 50–65 Duration: 104 weeks Diet: 30 or 300 ppm (Equivalent to: males: 1.3, 14.2 mg/kg bw per day; females: 1.6, 16.1 mg/kg bw per day) |
Incr serum ALT (m, month 3–18) Incr serum AST (m, month 6–12) Incr serum ALP (m, month 3–6 s) Hep hypertrophy (m, wk 104) Brain weight (m, wk 104) Spleen weight (f, wk 104) Fibroadenoma in mammary gland (f, wk 104) Leydig cell adenoma (m, wk 104) |
N/A N/A N/A 1.3 N/A N/A 1.6 1.3 |
1.3 1.3 1.3 14.2 1.3 1.6 16.1 14.2 |
Butenhoff et al., 2012b | |
ALP: alkaline phosphatase; ALT: alanine aminotransferase; AST: aspartate aminotransferase; bw: body weight; f: female; m: male; N/A: not applicable; PFOA: perfluorooctanoic acid; PFOS: perfluorooctane sulfonic acid; wk: week.
Benninghoff et al. (2012) used a two‐stage chemical carcinogenesis model in trout to study whether PFOS and PFOA are complete carcinogens or tumour promoters. For further details, see Section 3.3.5.5. Hepatocarcinogenesis was initiated by aflatoxin B1 (AFB1). Thereafter, trout received 100 mg/kg PFOS (2.5 mg/kg bw per day) for 5 days per week, for 6 months via the diet. PFOS enhanced the incidence but not the size of liver tumours when compared with AFB1‐initiated animals fed control diet. No tumours occurred in the liver in the group treated with PFOS only. This indicates some tumour‐promoting effects of PFOS in the liver of trout.
To conclude, the re‐evaluation of the long‐term carcinogenicity study confirmed that the liver is the main target organ for chronic toxicity and carcinogenicity of PFOS. The data, obtained so far, provide some evidence that PFOS may act as a tumour promoter in the liver of rats and fish.
3.3.3.7.2. PFOA
In a former 2‐year carcinogenicity study with the ammonium salt of PFOA (97.2% purity, linear and branched) male and female Sprague–Dawley rats (50/group) were fed 0, 30 or 300 mg/kg (corresponding to 0, 1.3 or 14.2 mg/kg bw per day for males and 0, 1.6 or 16.1 mg/kg bw per day for females) (Sibinski, 1987). There were significant increases in the incidence of Leydig cell tumours in the highest dose group. Although the authors concluded that proliferative lesions in the mammary gland were not elevated above the historical control level and normal expected background incidence in this rat strain, the outcome of the study was heavily discussed. As a result, a pathology working group reviewed the original slides. In 2010, a consensus was published that the incidence of mammary‐gland neoplasms was not affected by chronic dietary administration of PFOA (Hardisty et al., 2010).
Butenhoff et al. (2012b) also re‐evaluated this study and presented many details, which have not been published before. In males receiving 14.2 mg/kg bw per day, mean body weights were lower and survival in these rats was greater than that seen either in the 1.3 mg/kg bw per day or the control group. In both sexes, the highest dose elevated liver weight, hepatocellular hypertrophy, portal mononuclear cell infiltration, hepatocellular vacuolation (without hepatocellular necrosis), and increased ALT, AST and ALP in serum. A significant elevation of Leydig cell tumours occurred in males fed 14.2 mg/kg bw per day, while tumours of the liver and acinar pancreas were not increased dose dependently. For fibroadenomas in the mammary gland, the incidences were 22%, 42% and 48% in the controls, at 1.6 mg/kg bw per day and at 16.1 mg/kg bw per day, respectively. However, only the increase in the highest dose group was significant when compared with concurrent controls (see Table 19). Caverly‐Rae et al. (2014) re‐evaluated material of the Butenhoff study and found a significantly elevated incidence of pancreatic acinar cell hyperplasia in the highest dose group. The re‐evaluation process did not obtain evidence for tumour formation in the pancreas.
In a 2‐years study, male Sprague–Dawley rats received PFOA at 14 mg/kg bw per day (Cook et al., 1994; Biegel et al., 2001). There was a significant increase in the incidence of Leydig cell adenomas, liver cell adenomas and pancreatic acinar cell tumours in the treated rats. The pancreatic lesions were re‐evaluated, by Caverly‐Rae et al. (2014). A significant increase in the incidence of pancreatic acinar cell hyperplasia was identified but no evidence for pancreatic tumours were obtained. This supported the assumption that the pancreas is a target of PFOA.
Benninghoff et al. (2012) used a two‐stage chemical carcinogenesis model in trout to study whether PFOA is a complete carcinogen or a promoter of aflatoxin B1 (AFB1) or N‐methyl‐N‐nitro‐N‐nitrosoguanidine (MNNG)‐induced liver cancer. PFOA was applied for 5 days per week, for 6 months, via the diet at a dose of 2,000 mg/kg (approximately 50 mg/kg bw per day). PFOA enhanced the incidence and size of liver tumours when compared with AFB1‐ or MMNG‐initiated animals fed control diet. No tumours occurred in the liver in the group treated with PFOA only. This indicates tumour‐promoting effects of PFOA in the liver of trout.
To conclude, no new study was published since 2008. Two studies showed that PFOA induced Leydig cell tumours, which was confirmed by the re‐evaluation of one of the studies. This tumour entity occurs frequently in rodents, due to disturbances in the hypothalamic–hypophyseal–gonadal axis, which regulates testosterone production by Leydig cells via release of luteotropic hormone. Any increase in luteotrophic hormone increases the risk for growth stimulation and tumour promotion of Leydig cells in the rodent testis. However, this tumour entity is very rare in humans and the human relevance of the findings in the animal bioassays is not known.
The re‐evaluation process confirmed that in one study PFOA induced liver cell adenomas and in the other not. Both studies applied 14 mg/kg bw per day as maximal PFOA dose to male Sprague–Dawley rats. The reason for the differences in tumour outcomes is presently unclear. In rainbow trout, PFOA is a liver tumour promoter, indicating a phylogenetically more or less independent mode of action of PFOA in the liver and supporting the assumption that PFOA may be a hepatic tumour promoter in other species as well. Several re‐evaluation processes on the material obtained from one study brought inconsistent data with regard to the tumourigenic effect of PFOA in the mammary gland.
The CONTAM Panel concluded that, due to lack of consistent data and knowledge on the mode of action, it cannot be excluded that PFOA is carcinogenic to humans. This assessment agrees with the classification of PFOA by IARC as a group 2B carcinogen.
3.3.4. Observations in humans
In this section, a number of epidemiological studies in humans are referred to and assessed. Under the various subheadings (per outcome) the basic order is chronological, but if a specific cohort is re‐examined later, then this breaks the chronological order, so that several studies of a specific outcome in the same cohort are placed together.
Many different cohorts have been studied. The largest one, called C8, has been used in several studies, and is therefore described here.
The C8 cohort is named after the DuPont C8 plant in West Virginia where PFOA was used in the production of fluoropolymers since 1952. The plant contaminated the drinking water in several water districts in Ohio and West Virginia. In 2001, a group of residents filed a class‐action lawsuit due to the PFOA exposure. As part of a pre‐trial settlement a baseline survey was conducted, including extensive questionnaires and blood sampling in 2005–2006. Serum was analysed for PFOA and PFOS. The levels of PFOA were much higher than in other general population samples from this period, while levels of PFOS were in the same range as in other studies, since PFOS was not used or emitted at the C8 plant. The cohort consists of about 69,000 individuals (adults and children) who had consumed drinking water contaminated by PFOA from the C8 plant. Some (about 4,000) had also been working at the plant. Later also previous exposure to PFOA (since 1952) was retrospectively estimated using quantified exposure in a subset of participants at recruitment combined with data on area of residence and previous occupation (Shin et al., 2011a). Part of the participants in the C8 cohort were re‐examined in 2010. Some studies have only examined residents never working at the C8 plant, while other studies included both workers and residents‐only.
3.3.4.1. Acute outcomes
No human observations on acute effects (effects after short‐term exposure) were found.
3.3.4.2. Fertility and pregnancy outcomes
3.3.4.2.1. Birth weight as continuous outcome
Several studies have examined associations between PFOS and PFOA in pre‐pregnancy (n = 2), pregnancy (n = 11) samples or cord blood (n = 4) and birth weight (Table 20). Fewer studies (n = 6, Table 21) have reported associations with more clinically relevant outcomes such as low birth weight (LBW, < 2,500 g), or small for gestational age (SGA: birth weight < 10th percentile of average for gestational age and gender) as these outcomes require a relatively large sample size.
Table 20.
Studies examining associations between serum concentrations of PFOS and PFOA in pregnancy or at birth with birth weight as a continuous outcome. Significant associations are indicated in bold
| Study | Study year | Country | N | Sample | Outcome | Unit for βa | PFOA | PFOS | ||
|---|---|---|---|---|---|---|---|---|---|---|
| Median or mean (ng/mL) | β (95% CI) | Median or mean (ng/mL) | β (95% CI) | |||||||
| Pregnancy serum or cord blood concentrations | ||||||||||
| Lauritzen et al. (2017)b | 1986–1988 | NO | 265 | Week 17–20 | Birth Records | g/1‐Ln | 1.6 | 37 (−99, 174) | 9.7 | 74 (−31, 178) |
| SE | 159 | Week 17–20 | Birth Records | g/1‐Ln | 2.3 | −359 (−596, −122) | 16.4 | −292 (−500, −84) | ||
| Maisonet et al. (2012) | 1991–1992 | UK | 447 | Week 10–28 | Birth Records | T3 vs T1 | 3.7 | −133 (−237, −30) | 19.7 | −140 (−238, −42) |
| Fei et al. (2007) | 1996–2002 | DK | 1,400 | Week 4–14 | Birth Records | g/1‐ng/mL | 5.6c | −11 (−21, −0.5) | 35.3c | −0.5 (−2.3, 1.4) |
| Wang et al. (2016) | 2000–2001 | TW‐boys | 117 | 3rd trimester | Birth Records | z‐score/1‐Ln | 2.0d | 0.04 (−0.05, 0.12) | ||
| TW‐girls | 106 | 3rd trimester | Birth Records | z‐score/1‐Ln | 2.0d | −0.08 (−0.18, 0.01) | ||||
| Lenters et al. (2016)e | 2002–2004 | GL/PO/UA | 1,250 | 2nd‐3rd trimester | Birth records | g/1‐Ln | 1.4d | −79 (−137, −20) | 9.4 d | −69 (−153, 15) |
| Kobayashi et al. (2017) | 2002–2005 | JP | 177 | Week 24–41 | Birth records | g/1‐Ln | 1.4 | −49 (130, 32) | 5.3 | −56 (−163, 51) |
| Apelberg et al. (2007a) | 2004–2005 | US | 293 | Cord blood | Birth Records | g/1‐Ln | 1.6 | −161 (−270, −52) | 5.0 | −69 (−149, 10) |
| Washino et al. (2009) | 2002–2005 | JP | 429 | Week 25–35 | Birth Records | g/1‐Log10 | 1.3 | −75 (−192, 42) | 5.2 | −149 (−297, −1) |
| Hamm et al. (2010) | 2005–2006 | CA | 252 | Week 15–16 | Birth Records | T3 vs T1 | 1.5 | 15 (−107, 137) | 7.8 | 71 (CI:−55, 197) |
| Wu et al. (2012) | 2007 | CN | 167 | At delivery | Self‐report | g/1‐Log10 | 11.5 | −267 (−573, −37) | – | – |
| Whitworth et al. (2012a) | 2003–2004 | NO | 901 | Week 17 | Birth Records | Q4 vs Q1 | 2.2 | −106 (−220, 7) | 13.0 | −85 (−194, 24) |
| Kwon et al. (2016) | 2006–2010 | KR | 268 | Cord Blood | Birth records | g/1‐Logf | 0.9 | −78 (−154,‐2) | 0.6 | −49 (−96, −3) |
| Chen et al. (2012) | 2004–2005 | TW | 429 | Cord blood | Birth Records | g/1‐Ln | 1.8d | −19 (−64, 25) | 5.9d | −110 (−176, −45) |
| Shi et al. (2017) | 2012 | CN | 170 | Cord blood | Birth Records | g/1‐Log10 | 1.1 | 162 (−128, 454) | 1.0 | 160 (−12, 332) |
| Bach et al. (2016) | 2008–2013 | DK | 1,507 | < 13 weeks | Birth Records | Q4 vs Q1 | 2.0 | 7 (−10, 23) | 8.3 | −8 (−30, 14) |
| Pre‐pregnancy serum concentrations | ||||||||||
| Darrow et al. (2013)g | 2005–2006 | US | 710 | Pre‐pregnancyd | Self‐report | g/1‐Ln | 31.0d | −5 (−22, 33) | 15.6d | ‐49 (‐90, ‐8) |
| Robledo et al. (2015) | 2005–2008 | US‐boys | 113 | Pre‐pregnancyd | Self‐report | g/1‐SD of Ln | 5.0d | 5 (−85, 95) | 21.6d | 38 (−73, 148) |
| US‐Girls | 117 | Pre‐pregnancyd | Self‐report | g/1‐SD of Ln | 3.2d | −62 (−159, 36) | 12.4d | 14 (−81, 110) | ||
CI: confidence interval; SD: standard deviation; T: tertile; Q: quartile; NO: Norway; SE: Sweden; UK: the United Kingdom; GL: Greenland; PO: Poland; UA: Ukraine; DK: Denmark; US: United Sates; JP: Japan; CA: Canada; CN: China; KR: Korea (South); TW: Taiwan.
Hamm et al. (2010): T3: > 10 ng/mL for PFOS and > 2.1 ng/mL for PFOA. T1 < 6.1 ng/mL for PFOS and < 1.1 for PFOA.
Whitworth et al. (2012a): Q4: > 16.6 ng/mL for PFOS and > 3.0 ng/mL for PFOA. Q1 < 10.3 ng/mL for PFOS and < 1.7 ng/mL for PFOA.
Maisonet et al. (2012): T3: > 23 ng/mL for PFOS and > 4.4 ng/mL for PFOA. T1 < 16.6 ng/mL for PFOS and < 3.1 for PFOA.
Wu et al. (2012): recruitment of 108 women from contaminated e‐waste are with median of 17.0 ng/mL and 59 subjects from less contaminated are with median of 6.3 ng/mL.
β: the regression coefficient for the linear association between PFOS and PFOA exposure and change in birth weight. The unit is given in the column to the right which can be either continuous (g birth weight per unit increase in terms of ng/mL, SD or Log/LN‐transformed exposure; or mean change in birth weight when exposure is modelled as binary (that is T1 vs T3).
This study oversamples SGA cases and reported results from NO and SE participants separately.
Mean.
Geometric mean.
Only term births included (gestation weeks 37–42). For consistency with other results reported in the Table, the adjusted linear regression estimates as reported in supplemental tables are shown (not penalised regression coefficients where other contaminants have been adjusted for, as reported in the main text).
No logarithmic base given.
Blood samples drawn at enrolment (2005–2006) but serum concentrations are associated with pregnancies occurring after recruitment until 2010. Greater than 99% of all birth occurred within 3 years from the drawing of the blood sample.
Table 21.
Studies examining the association between serum concentrations of PFOS and PFOA during pregnancy and low birth weight and small for gestational age
| Study | Outcome | Total no cases/N or % | PFOA | PFOS | ||
|---|---|---|---|---|---|---|
| Comparison (ng/mL) | OR (95% CI) | Comparison (ng/mL) | OR (95% CI) | |||
| Pregnancy serum or cord blood concentrations | ||||||
| Lauritzen et al. (2017) | SGA from NO | 91/265 | Per 1‐Ln | 0.7 (0.3, 1.3) | Per 1‐Ln | 0.7 (0.4, 1.2) |
| SGA from SE | 52/159 | Per 1‐Ln | 5.3 (1.7–16.4) | Per 1‐Ln | 2.5 (0.9–6.8) | |
| Fei et al. (2007) | LBWa | 24/1,400 | < 3.9 vs > 7.0 | 2.4 (0.3, 22.3) | < 6 vs > 43 L | 4.8 (0.6, 41.2) |
| Fei et al. (2007) | SGAa | 121/1,400 | < 3.9 vs > 7.0 | 1.0 (0.6, 1.7) | < 6 vs > 43 L | 1.0 (0.6, 1.7) |
| Hamm et al. (2010) | SGA | 16/252 | < 1.1 vs > 2.1 | 1.3 (0.4, 4.5) | < 6.1 vs > 10 | 0.3 (0.1, 0.7) |
| Whitworth et al. (2012a) | SGAa | 60/901 | < 1.7 vs > 3.0 | 1.0 (0.3, 2.8) | < 10.3 vs > 16.6 | 1.3 (0.5, 3.4) |
| Pre‐pregnancy serum concentrations, prospective b | ||||||
| Darrow et al. (2013) | LBW | 46/783 | < 6.9 vs > 37.2 | 1.06 (0.3, 3.5) | < 8.6 vs > 21.4 | 0.82 (0.3, 2.7) |
| Serum concentrations, drawn close to pregnancy b | ||||||
| Stein et al. (2009) | LBW | 5.0%c | ≤ 21.3 vs > 21.3 | 0.7 (0.5, 1.2) | ≤ 17.7 vs > 17.7 | 1.5 (1.1, 1.9) |
CI: confidence interval; OR: odds ratio; LBW: low birth weight; SGA: small for gestational age.
The Table only shows the effect estimate for the dichotomous comparison between the highest and lowest exposure groups as defined in these studies. Consistent with these non‐significant findings the p‐value for trend was in all cases > 0.10 (for PFOA the p for trend was 0.13 for LBW in the study by Fei et al. (2007). No trend test was performed by Hamm et al. (2010) as exposure was dichotomised as high vs low (binary).
Blood samples drawn at enrolment (2005–2006) but serum concentrations are associated with pregnancies occurring after recruitment until 2010. Greater than 99% of all birth occurred within 3 years from the drawing of the blood sample.
Total no cases/N: 80/1589 for PFOA, 243/4561 for PFOS.
Birth weight as continuous outcome: samples drawn prior to or at delivery
A brief summary of studies that have either prospectively (n = 13) or cross sectionally (n = 4, cord blood) examined associations between serum concentrations of PFOS and/or PFOA with birth weight as continuous outcome are presented in Table 20. Studies with fewer than 100 participants (Inoue et al., 2004; Callan et al., 2016; Lee et al., 2016) were excluded from this review as they were considered to be insufficiently powered, taking into consideration that there were several larger studies available. Of these 17 studies, 7 reported a significant inverse association for PFOA, while 6 studies reported a significant inverse association for PFOS. Most of the other studies also reported inverse associations, although statistical significance was not reached. In those studies, this may at least partly be explained by modest sample size (8 studies had < 300 participants). This conclusion is also supported by the fact that in larger studies (n ~ 700–1,500), reporting inverse associations with birth weight, the observed effect size was relatively modest. The smaller studies were, on the other hand, divergent both in terms of the effect size and direction of the observed associations (a few studies even reported non‐significant positive association with birth weight). The exposure ranges in the studies on birth weight differed widely with mean/median maternal serum or cord blood levels ranging from 0.9 to 31.0 ng/mL for PFOA and 1.0 to 35.3 ng/mL for PFOS.
With respect to individual studies, the study by Darrow et al. (2013) was one of several studies from the C8 cohort that examined associations between exposures to PFOA and birth outcomes. The other studies (Nolan et al., 2009; Stein et al., 2009; Savitz et al., 2012a,b) relied on indirect or retrospective measures of exposures. In the study by Darrow et al. (2013), serum samples from 710 women were drawn pre‐pregnancy at enrolment (2005–2006) and associations with birth weight were examined among pregnancies occurring until 2010. More than 99% of all births occurred within 3 years from the drawing of the blood sample. Serum PFOA concentrations were substantially elevated with the mean (SD) for serum PFOA being 31.0 ng/mL (50.5) while serum PFOS levels were comparable to those observed in the general population. No association was observed for PFOA while a significant inverse association was observed for PFOS. Some care must be taken when comparing this study to the other studies in Table 20, as it is difficult to predict if and how the time interval between drawing of pre‐pregnancy serum samples and later delivery may have had on the effect estimates, despite adjustment. Since PFOA has a shorter half‐life than PFOS and drinking water concentrations were rapidly decreasing when subjects were recruited (Avanasi et al., 2016) pre‐pregnancy concentrations for PFOA may have been a less accurate marker for pregnancy exposure compared PFOS. Still, one strength of this study is, however, that pre‐pregnancy serum samples should be less influenced by physiological changes in pregnancy such as increased glomerular filtration rate (Verner et al., 2015) and hemodilution (Savitz, 2007) that may act as a confounder for the association with birth weight. Darrow et al. (2013) also reported results for pregnancies that occurred prior to enrolment (retrospective analyses), thereby including 1,470 births as compared to 710 births for the prospective analyses. Results were similar or slightly weaker compared to the prospective analyses. In a comparable but much smaller study, Robledo et al. (2015) examined sex specific (113 boys and 117 girls) associations between pre‐pregnancy serum samples of PFOS and PFOA and birth weight. No significant associations were observed.
With respect to the larger studies summarised in Table 20, Fei et al. (2007) reported a significant inverse association between maternal serum concentrations (n = 1,400) of PFOA (mean 5.6 ng/mL) and birth weight with a modest reduction of −5 g in birth weight per 1 ng/mL increase in maternal concentrations (corresponding to around 50–60 g reduction in birth weight over the effective exposure range). No association was observed for PFOS. In another large (n = 1,250) study by Lenters et al. (2016) a ~ 3‐fold increase in maternal PFOA (mean 1.6 ng/mL) concentrations was significantly associated with a −79 g reduction in birth weight. The corresponding reduction for PFOS (mean 9.4 ng/mL) was a −69 g, which was non‐significant. Similarly, Whitworth et al. (2012a) reported a borderline significant inverse association between maternal concentrations of PFOA (median 2.2 ng/mL, n = 901) of −106 g comparing the highest to lowest quartile of exposure. The corresponding non‐significant reduction in birth weight for PFOS (median 13.0 ng/mL) was −85 g. In another large study (n = 1,507) by Bach et al. (2016), with relatively low serum concentrations (median for PFOS and PFOA of 2.0 and 8.3 respectively) no associations with birth weight were observed. Only nulliparous women were included in that study.
Overall, the effect estimates reported in Table 20 for PFOA were slightly stronger compared to those reported for PFOS. Some caution is necessary when comparing the effect estimates, as authors either reported their associations based on categorical exposure (tertiles or quartiles) or they reported their effect estimates per 1‐unit increase on a logarithmic scale (natural logarithm (Ln ~ 3‐fold and Log10 = 10‐fold increase in exposure). It also has to be taken into consideration that cord blood concentrations are lower than those in maternal serum (Fei et al., 2007). As a result, associations among studies using cord blood may appear to occur at lower levels than those observed in studies using maternal serum.
With respect to confounder control, all studies accounted for important host factors including maternal weight and parity and length of gestation. Many of these studies also accounted for socio‐occupational status or education in their adjusted models (Washino et al., 2009; Fei et al., 2007; Chen et al., 2012; Whitworth et al., 2012a; Wu et al., 2012; Bach et al., 2016; Lenters et al., 2016; Wang et al., 2016). The study by Whitworth et al. (2012a) was the only study that accounted for serum albumin in their adjusted models. The argument for including serum albumin was, according to the authors, that serum albumin levels have been associated with adverse pregnancy outcomes. Given the strong binding of PFASs to serum albumin this adjustment may have inflated their confidence intervals. The authors noted in their publication that serum albumin appeared to be a confounder for the PFOS‐birth weight association, while adjustment for albumin had limited influence on their effect estimate for PFOA.
Birth weight as dichotomous outcome: samples drawn prior to or at delivery
Only 6 of the 17 studies reviewed in Table 20 examined associations between concentrations of PFOS and PFOA and low birth weight (< 2,500 g) or small for gestational age (SGA). In addition, one study from the C8 cohort examined retrospectively, the relationship between baseline serum concentrations of PFOS and PFOA with pregnancies occurring up to 5 years earlier (Stein et al., 2009). A summary of study characteristics and the effect estimates are shown in Table 21.
Overall, findings from these studies were divergent. As an example, a nested case–control study of 265 and 159 mother child pairs from Norway and Sweden (pregnancies from 1986 to 1988), respectively, where SGA children were oversampled (Lauritzen et al., 2017) reported an increased risk of SGA related to PFOA among the Swedish but not the Norwegian participants. A borderline significant positive association was also observed for PFOS. It is worth noting, however, that maternal concentrations of PFOS and PFOA were considerably higher among the Swedish compared to the Norwegian participants (see Table 21). A significant positive association was also observed between PFOS concentrations and low birth weight in the retrospective study by Stein et al. (2009). Non‐significant associations were reported for the other four studies reviewed in Table 21.
A limitation of the studies reviewed in Table 21 is the relatively small samples size and low power. As an example, only the studies by Stein et al. (2009) and Fei et al. (2007) were sufficiently powered (at β = 0.8 at α = 0.05) to detect an association corresponding to an OR of ~ 1.5 and ~ 1.6 for LBW and SGA, respectively. In the study by Fei et al. (2007) a non‐significant association for SGA was observed with odds ratios centred around 1. For LBW which had a prevalence of ~ 1.7%, Fei et al. (2007) only had a power of ~ 50% to detect the observed odds ratio of ~5 when comparing the highest to the lowest quartile of maternal concentration for PFOS. All the other studies in Table 21 had a power less than 80% to detect any association below ~ 3, due to limited samples size. With only 16 SGA cases there is limited information that can be drawn from the effect estimates reported by Hamm et al. (2010).
C8‐studies on low birth weight using indirect retrospective measures of exposure
Savitz et al. (2012a) examined retrospectively associations between estimated previous exposure to PFOA in relation to self‐reported birth outcomes, including term low birth weight (n = 399 cases), for 11,737 pregnancies (1990–2006). Past exposures were derived from measured serum concentrations at enrolment into the C8‐project (2005–2008). In a later case–control study (Savitz et al., 2012b), the authors extracted information from birth records (as opposed to self‐report in the other study) resulting in 918 term low birth weight cases and 3,616 controls. No association with low birth weight were observed in both studies with OR centred around 1. Similarly, Nolan et al. (2009) reported null associations when comparing birth weight distributions across different water services (used as proxy for PFOA exposure). No consistent associations with preterm delivery or birth defects were observed in these studies either.
The strength of these two studies are the wide range of exposure to PFOA in the study population, which should be less prone to disturbances due to physiological changes in pregnancy compared to studies relying on serum concentrations in background exposed population. However, relying on retrospective exposure assessment extrapolating several years backwards in time, or using water services as proxy for exposure is a major limitation. Despite limitations, these studies were sufficiently powered to examine rare outcomes such as low birth weight and they do not provide indications to support that PFOA may be associated with low birth weight or major birth defects.
Summary
Although not all studies reported significant inverse association with birth weight it appears that there is an overall tendency towards an inverse correlation between concentrations of PFOS/PFOA and birth weight. This conclusion is based primarily on the results reported in the larger studies as lack of consistency among some of the studies reviewed in Table 21 may be influenced by relatively small sample sizes. What complicates matters further is the fact that there is evidence to suggest that the inverse association between PFOA and PFOS may be partly explained by maternal physiology. One suggested mechanism is confounding by maternal glomerular filtration rate that is positively related to the rate of excretion of PFOS and PFOA; as well as being a positive predictor of birth weight (Morken et al., 2014). PBPK models for PFOS and PFOA have suggested that around half, but not all, of the effect size for birth weight may be explained by this mechanism (Verner et al., 2015).
Despite the fact that studies reporting results on LBW and SGA were generally underpowered or limited due to use of retrospective exposure assessment, there were no strong indications that the observed decrease in birth weight translates into increased risk of LBW or SGA. In that context, the biological relevance of an inverse association with birth weight on its own is unclear. Whether a modest reduction in birth weight is an indication of some adverse events that will become apparent later cannot, however, be excluded. Overall, despite relatively consistent inverse associations being observed, some uncertainty about the causality of these findings remains.
3.3.4.2.2. Preterm delivery
Many of the studies reviewed above in relation to birth weight also examined associations with preterm delivery (gestational age less than 259 days). Overall, no consistent associations were observed for PFOA and as an example Chen et al. (2012) observed a positive association between maternal PFOS (mean 5.9 ng/mL) concentrations and preterm delivery (odds ratio 2.5 (95% CI: 1.5, 4.1) per ~ 3‐fold increase in PFOS concentrations; n = 429 with 40 preterm cases). No association was observed for PFOA. On the other hand, Whitworth et al. (2012a) (n = 901, 35 preterm cases) observed a significant inverse associations between maternal concentrations of PFOS (odds ratio of 0.3 (95% CI: 0.1, 1.0) comparing > 16.6 vs < 10.3 ng/mL) and PFOA (odds ratio of 0.1 (95% CI: 0.03, 0.6) > 3.0 vs < 1.7 ng/mL) and preterm delivery. Other studies found no significant associations between any of the maternal PFOS and PFOA concentrations examined and preterm delivery (Fei et al., 2007; Hamm et al., 2010; Darrow et al., 2013; Bach et al., 2016).
Concerning results from non‐prospective studies based on the C8 cohort, the retrospective studies by Savitz et al. (2012a,b) reviewed above in relation to birth weight found no consistent association between relatively high maternal exposures to PFOA (estimated exposure) and preterm delivery. On the other hand, the retrospective study by Stein et al. (2009) that examined measured serum concentrations of PFOA in relation to previous birth outcomes observed an increased risk of preterm delivery at relatively high exposure (odds ratio of 1.4 (95% CI: 1.1, 1.7) comparing > 121 vs < 20 ng/mL, n = 1,571, 329 preterm cases).
In the light of these divergent findings, there is insufficient evidence to suggest that maternal exposure to PFOS and PFOA is associated with increased risk of preterm delivery.
3.3.4.2.3. Birth defects and stillbirths
To date, mainly exposure to PFOA, and in a few cases PFOS, have been examined in relation to stillbirth and/or birth defects. All these studies have been based on subjects recruited into the C8 cohort. The overall findings have been null. As an example, Stein et al. (2014a) found no indications among participants from the C8 cohort that exposure to PFOA (median ~10 ng/mL) was associated with birth defects. In this study, a total of 10,262 births occurring from 1990 to 2006 were included, resulting in 325 birth defects, recorded through maternal report. Exposure during pregnancy was estimated based on serum samples drawn in 2005–2006 when the women were recruited. Although there was a significant increased risk of brain defects (odds ratio 2.6 (95% CI: 1.2, 5.1)), this effect estimate was based on only 13 cases and would need to be replicated before any conclusions can be drawn. For the other defects examined including gastrointestinal, kidney, craniofacial, eye, limb, genitourinary and heart, no associations were detected. These null findings are in line with other reports focusing on PFOA and/or PFOS exposures in subjects from the C8 cohort (Stein et al., 2009; Nolan et al., 2010; Savitz et al., 2012a). No associations with stillbirths have been reported from these studies either (Stein et al., 2009; Savitz et al., 2012b)
These C8‐studies (all except Nolan et al. (2010) were reviewed in detail in the Section on birth weight (Section 3.3.4.2.1) partly covered the same population but differed in terms of how exposure was retrospectively assessed. As such, these studies cannot be considered as independent and a notable limitation of these studies is that their retrospective assessment of exposure may be prone to misclassification. Still based on these findings, there is currently no evidence to suggest that exposure to PFOS at background levels, or elevated exposure to PFOA, are associated with birth defects or stillbirths.
3.3.4.2.4. Time to pregnancy
In a subcohort of 1,240 women from the Danish National Birth cohort, Fei et al. (2009) observed a relatively strong positive association between maternal serum concentrations of PFOA (median 5.5 ng/mL) and PFOS (median 35.5 ng/mL) in pregnancy and infertility defined as time to pregnancy of more than 12 months. Serum samples were drawn in weeks 6–12 of gestation and information on time to pregnancy were recorded though telephone interviews at around week 12 of gestation. Comparing women in the highest (> 43 ng/mL) to the lowest (< 26 ng/mL) quartile of maternal PFOS concentrations the odds ratio of infertility was 1.8 (95% CI: 1.1, 3.0). The corresponding odds ratio when comparing the highest (> 6.9 ng/mL) to lowest (< 3.9 ng/mL) quartile of PFOA concentrations was 2.5 (95% CI: 1.5, 4.4). Although the p value for linear trend was strongly significant for PFOS (p = 0.03) and PFOA (p = 0.006), clear dose response was lacking as the odds ratios in the three upper quartiles were all elevated and comparably in magnitude (~1.7 to 2.5) compared to the lowest quartile. Still, this first study published in 2007 provided some evidence to suggest that PFOS and PFOA could potentially reduce fecundity. Results, stratified by parity, were not reported in this study.
Vélez et al. (2015) examined associations between maternal serum concentrations of PFOS and PFOA (median: 4.7 and 1.7 ng/mL, respectively) with subfecundity and infertility (defined as time to pregnancy > 12 months or infertility treatment in the index pregnancy) among 2001 women recruited before week 10 of gestation in 10 cities across Canada, in 2008–2011. Blood samples were drawn during the first trimester. Maternal PFOA concentrations were associated with longer time to pregnancy, that was also reflected in increased odds of infertility (OR for infertility: 1.3 (95%: 1.1, 1.5)). The associations for PFOS were in the same direction but were not significant. Results, stratified by parity, were not reported in this study and no adjustment was made for parity.
Other studies have, however, not been in line with these findings. Whitworth et al. (2012b) examined using a case–control analysis nested within the Norwegian Mother and Child Cohort Study (2003–2004), the association between second trimester maternal concentrations (median) of PFOS (13.0 ng/mL) and PFOA (2.2 ng/mL) with subfecundity defined as time to pregnancy of more than 12 months. The analysis was based on 416 cases and 485 randomly selected controls. Overall, an increased risk of subfecundity was observed with an odds ratio of 1.6 (95% CI: 1.1, 2.3) when comparing those with concentrations of > 16.6 ng/mL vs < 10.3 ng/mL for PFOS and 2.0 (95% CI: 1.4, 3.0) when comparing those with concentrations of > 3.0 ng/mL vs < 1.7 ng/mL for PFOA. When stratifying by parity (~50% were primiparous) the corresponding odds ratios for PFOS were 0.7 (95% CI: 0.4, 1.3) and 2.1 (95% CI: 1.2, 3.8) for primiparous and parous women respectively. For PFOA, the corresponding odds ratios were 0.5 (95% CI: 0.2, 1.2) and 2.1 (95% CI: 1.0, 3.4) for primiparous and parous women, respectively. The authors concluded that the increased risk that was driven by the result from parous women could be explained by reverse causation. The argument was that breastfeeding is an important route of elimination for both PFOS and PFOA. After breastfeeding, concentrations of PFOS and PFOA increase again until equilibrium is reached between the rate of uptake and elimination. If most parous women in this population had previously breast fed their infant, higher body burden of PFOS and PFOA among parous women could be explained by longer inter‐pregnancy interval. As a result, the apparent increase in risk of subfecundity among parous women only may simply reflect longer inter‐pregnancy interval rather than direct toxicity of these compounds, particularly as no association was observed for primiparous women.
Jørgensen et al. (2014) examined the relationship between serum concentrations of PFOS (median 10.6 ng/mL) and PFOA (median 1.7 ng/mL) with time to pregnancy in 938 pregnant women from Greenland (48%), Poland (22%) and Ukraine (30%). No consistent associations were observed for time to pregnancy or infertility defined as time to pregnancy of more than 13 months.
Another study (Vestergaard et al., 2012) enrolling 222 Danish first time pregnancy planning women (1992–1995) that were followed for six menstrual cycles or until conception, examined associations between pre‐pregnancy serum concentrations of PFOS (35.5 ng/mL) and PFOA (5.6 ng/mL) with time to pregnancy. No association with time to pregnancy was observed.
A cohort of 501 US couples who were followed over a 12‐month period (Buck Louis et al., 2013) observed no association with fecundity for quantified maternal pre‐pregnancy concentrations (means) of PFOS (20.1 ng/mL) and PFOA (5.0 ng/mL).
Finally Bach et al. (2015a), observed no association between maternal serum concentrations (medians) of PFOS (8.3 ng/mL) and PFOA (2.00 ng/mL) with time to pregnancy, among 1,372 women from the Aarhus Birth Cohort (2008–2013). Serum samples were drawn during pregnancy prior to week 20 of gestation and time to the current pregnancy was recorded through questionnaires in early pregnancy.
In conclusion, given the potential for reverse causality and null associations reported in all (Vestergaard et al., 2012; Whitworth et al., 2012b; Buck Louis et al., 2013; Jørgensen et al., 2014; Bach et al., 2015a) but two studies (Fei et al., 2009; Vélez et al., 2015), there is insufficient evidence to suggest that exposure to PFOS/PFOA may adversely affect fecundity.
3.3.4.2.5. Miscarriage
In a subset of women from the C8 cohort (n = 1,129), Darrow et al. (2014) examined prospectively the associations between serum concentrations (medians) of PFOS (14.3 ng/mL) and PFOA (18.0 ng/mL) in relation to miscarriage in the subsequent pregnancy. Serum samples were drawn in 2005–2006 and information on later pregnancy outcomes were collected in follow‐up interviews conducted in 2008–2011. No association was observed between serum concentrations of PFOA and miscarriage. However, for PFOS the odds ratio for miscarriage per threefold increase in serum PFOS concentrations was 1.21 (95% CI: 0.94, 1.55). In these analyses, the same subject could be included more than once through different pregnancies over the follow‐up period (repeated miscarriages). In a subanalysis restricted to the first pregnancy conceived after drawing of the serum sample, the corresponding odds ratio was strengthened 1.34 (1.02, 1.76). The association for PFOS was more pronounced among primiparous compared to multiparous subjects. The primiparous women do not have the same risk of reverse causation pathway as has been suggested for time to pregnancy. Concerning the shape of the relationship further, the authors noted lack of clear dose response as the odds ratios were significantly elevated (1.7–1.9) in all four quintiles above the referent (lowest) quintile.
In addition, two other publications from the C8 cohort have reported non‐significant associations between exposures to PFOA and PFOS and risk of miscarriages (Stein et al., 2009; Savitz et al., 2012a). For more detailed description of the design of these studies, see Section 3.3.4.2.1 on birth weight. The retrospective design of these studies is, however, a limitation.
Using a case–control design nested within a prospective cohort of 2,874 women from Odense Denmark, Jensen et al. (2015) examined the association between serum concentrations (medians) of PFOS (8.0 ng/mL) and PFOA (1.5 ng/mL) with risk of miscarriage. Of the women recruited into the cohort, 88 suffered miscarriage and 56 of those had stored serum samples drawn prior to week 12 of gestation. These 56 cases were compared with 336 randomly selected controls from the cohort who had serum drawn prior to week 12 of gestation. In addition, 51 miscarriage cases were compared to 204 controls that were matched on parity and gestational day of serum sampling. No association was observed for PFOS or PFOA.
Indications of increased risk of pregnancy loss related to PFOS (median 12.2 ng/mL) and PFOA (median 3.3 ng/mL) were also not observed in a cohort of 501 US couples recruited preconception (Buck Louis et al., 2016). Of these 501 women, 344 became pregnant and of these 98 suffered pregnancy loss. However, information on 24 out of the 344 pregnancies was missing due to loss to follow‐up. In the same study, the authors also examine associations between PFOS and PFOS with sex ratios (Bae et al., 2015). No significant differences were observed.
Although the report of increased risk of miscarriage reported for PFOS (Darrow et al., 2014) is noteworthy, particularly given relatively large sample size and prospective design findings from other studies have been inconsistent. There is therefore only limited evidence to suggest that PFOS or PFOA are associated with increased risk of pregnancy loss.
3.3.4.2.6. Pregnancy hypertension
A total of five studies from the C8 cohort (Nolan et al., 2010; Stein et al., 2009; Savitz et al., 2012a,b; Darrow et al., 2014) and one from the Norwegian Mother and Child Cohort Study (Starling et al., 2014) have examined associations between PFAS and pregnancy hypertension and/or preeclampsia.
In the study by Stein et al. (2009), a total of 1,589 and 4,566 pregnancies were included in the analyses for PFOA and PFOS, respectively. These participants had provided blood samples at enrolment (2005–2006) and provided information on pregnancy outcomes and complications in past pregnancies up to 5 years prior to recruitment. For PFOA the inclusion criteria were that the women had lived in the same water district from the start of pregnancy and until enrolment. No such restriction was needed for PFOS because unlike PFOA, exposure should reflect background levels. Serum PFOS (median 13.6 ng/mL) and PFOA (median 21.2 ng/mL) concentrations at enrolment were used as markers of exposure during previous pregnancies and information on preeclampsia was based on maternal self‐report. Overall when modelling exposure as continuous maternal PFOS or PFOA concentrations at recruitment, PFOS/PFOA were not associated with preeclampsia occurring in previous pregnancies over the past 5 years. Odds ratios per interquartile range (10–50 ng/mL for PFOA and 9–18 ng/mL for PFOS) were 1.1 (95% CI: 0.9, 1.4) for PFOA and 1.1 (0.9, 1.3) for PFOS. However, when comparing maternal concentrations among those below the 50th percentile (< 13 ng/mL) with those above the 90th (> 23 ng/mL) percentile for PFOS the odds ratio showed an increased risk 1.6 (95% CI: 1.2, 2.3) of preeclampsia for PFOS while no such risk was observed for PFOA (> 121 ng/mL vs < 21; OR 0.9 (95% CI: 0.5, 1.8)).
Nolan et al. (2010) compared the likelihood of pregnancy complications according to exposure to PFOA contaminated drinking water using PFOA concentrations in different water services in the Little Hocking district in Ohio as a proxy for exposure. Based on their simple group comparison (individual exposure not quantified) using outcomes extracted from the Ohio Department of Health (n = 1,548 pregnancies), no association with pregnancy hypertension or eclampsia was observed. The obvious limitation of this study is the lack of exposure assessed on an individual basis.
Darrow et al. (2013) examined women from the C8 cohort who provided a blood sample at enrolment (2005–2006) and completed at least one follow‐up interview, and reported at least one live birth between 2005 and 2010. In the follow‐up questionnaire, women were asked about their reproductive history since enrolment. Birth outcomes and pregnancy complications were extracted through health records. Pregnancy‐induced hypertension (with or without proteinuria) was defined as the onset of hypertension after the 20th week of gestation. A total of 1,600 retrospective and prospective pregnancies (hereof 106 cases) were included in their main analyses but when restricting their samples to prospective pregnancies only (occurring after drawing of the blood sample), only 770 pregnancies were included (43 cases). Maternal concentrations in the samples drawn at enrolment for the 5th, 50th and 95th percentile were 3.7, 14.3 and 114 ng/mL for PFOA and 5.1, 13.9 and 31.8 ng/mL for PFOS. Maternal PFOA concentrations were associated with pregnancy induced hypertension when both prospective and retrospective cases were included (OR: 1.27 (95% CI: 1.05, 1.55) per ~3‐fold increase in exposure) while the corresponding effect estimate was similar but non‐significant when only prospective cases were examined (1.23 (95% CI: 0.92, 1.64)). The corresponding effect estimates for PFOS were 1.47 (95% CI: 1.06, 2.04) when retrospective and prospective cases were included; and 2.02 (95% CI: 1.11, 3.66) when only prospective cases were included. Taking into considerations loss of statistical power when retrospective cases were excluded and the similar effect estimates observed for both analyses PFOS and PFOA appeared to be associated with induced pregnancy hypertension.
Savitz et al. (2012a) examined retrospectively, associations between estimated past exposures to PFOA in relation to self‐reported preeclampsia (n = 730 cases), for 10,186 pregnancies occurring between 1990 and 2006. Past exposures were derived from measured serum concentrations at enrolment into the C8‐project (2005–2006). Estimated maternal concentrations of PFOA was positively associated with increased risk of self‐reported preeclampsia (odds ratio of 1.13 (95% CI: 1.00, 1.28) per ~3‐fold increase in exposure). When comparing those with concentrations > 63.1 ng/mL to those with < 6.8 ng/mL the odds ratio indicated around 20% increase in risk (1.2 (95% CI: 1.0, 1.6)).
In a later case–control study (Savitz et al., 2012b) on the same population, the authors extracted information from birth records (as opposed to self‐reporting in their previous study) resulting in 224 cases of pregnancy induced hypertension and 3,604 controls. No association was observed between estimated maternal concentrations of PFOA with pregnancy‐induced hypertension (odds ratio of 1.02 (95% CI: 0.86, 1.21) per ~ 3‐fold increase in exposure). Also when comparing those with concentrations > 21.0 ng/mL to those with < 6.8 ng/mL, no increased risk was observed (1.0 (95% CI: 0.7, 1.5)).
In a case–control study nested within the Norwegian Mother and Child Cohort study, Starling et al. (2014) examined prospectively the association between serum PFOS/PFOA levels in samples drawn around gestation weeks 17–20 and preeclampsia. A total of 466 cases and 510 controls recruited in 2003–2007 were included in their analyses. Only women with no previous live‐ or stillbirths and no history of chronic hypertension were included in the study. Preeclampsia cases (occurring after week 20) were identified based on medical health records and the accuracy of this outcome assessment had previously been assessed in a validation study. The 5th, 50th and 95th percentiles for PFOA were 2.1, 2.8 and 5.2 ng/mL, respectively. The corresponding numbers for PFOS were 9.7, 12.9 and 25.5 ng/mL in this large prospective study, no association with validated cases of preeclampsia were observed and the reported hazard ratios for PFOS and PFOA were tightly centred around 1.0.
As a part of a lawsuit settlement the C8 Science Panel previously concluded that there was a ‘probable link’ between PFOA exposure and pregnancy‐induced hypertension. The words ‘probable link’ would indicate that it was more likely than not, that among class action members a connection existed between PFOA exposure and pregnancy induced hypertension in the exposed community. Although a link between exposure to either PFOA and PFOS and pregnancy induced hypertension or preeclampsia was observed in some but not all of the five C8 studies reviewed above, the large prospective study from the Norwegian Mother and Child Cohort study found not indications of an association between PFOS and PFOA with validated cases of preeclampsia (Starling et al., 2014). The PFOS concentrations in that study were comparable to those reported by Stein et al. (2009) and Darrow et al. (2013) where a positive association with preeclampsia was observed. However, the PFOA concentrations among the Norwegian participants were far lower compared to those observed in the C8 studies. Due to lack of replication in other independent data there is insufficient evidence to suggest that PFOS or PFOA are associated with pregnancy induced hypertension or preeclampsia.
3.3.4.3. Developmental outcomes
3.3.4.3.1. Neurodevelopment
Fei et al. (2008) studied the association between PFOS and PFOA and Apgar score and developmental milestones (e.g. sitting, walking, language, as reported by mothers) in a sample from the Danish National Birth Cohort (N = 1,400) recruited between 1996 and 2002. The study was funded by 3M. PFOS and PFOA were determined in plasma of the pregnant women in the first trimester (mean levels around 35 and 5.5 μg/L). Development was assessed by telephone interviews with mothers at 6 and 18 months. A number of potential confounders were adjusted for. There was no consistent association between PFOS or PFOA levels and overall or any specific developmental delay.
This Danish cohort was also used to study associations between PFOS and PFOA during pregnancy and behavioural and coordination problems in children (N = 787 and N = 586) at 7 years of age (Fei and Olsen, 2011). Such problems were identified with validated questionnaires by parents. Mean PFOS and PFOA levels were 34 and 5.5 μg/L. There were no positive associations between PFOS or PFOA levels and behavioural and coordination problems.
Liew et al. (2014) studied the association between PFOS and PFOA in pregnant women and the risk of cerebral palsy (CP) in their children in a case–control study (156 CP cases and 550 controls) from the same Danish birth cohort. Cases were collected from a National CP register with validated diagnoses. Median PFOS and PFOA levels were 28 and 4.1 μg/L. A number of potential confounders were taken into account. For an increase in ln PFOS with one unit (an increase by a factor 2.7), the OR for CP was 1.7 (95% CI 1.0–2.8) in boys and 0.7 in girls. For ln PFOA, the corresponding OR among boys was 2.1 (95% CI 1.2–3.6), while it was 0.8 among girls.
Finally, Liew et al. (2015) also performed a case–control study of attention‐deficit hyperactivity disorder (ADHD) and autism in the same cohort. Cases of ADHD (N = 220) and autism (N = 220) were randomly selected among cases identified in the cohort by linking with national disease registries, and random controls were selected from the cohort, frequency‐matched for sex. Median PFOS and PFOA levels in maternal plasma were 27 and 4.0 ng/mL. A number of potential confounders were adjusted for. Relative risks in the fourth quartile of PFOS and PFOA were 0.8 (95% CI: 0.6–0.98) and 1.1 (95% CI: 0.9–1.4) for ADHD and 0.9 (95% CI: 0.6–1.3) and 1.0 (95% CI: 0.7–1.4) for autism.
The C8 cohort, consisting of individuals exposed to PFOA‐contaminated drinking water was used for studying associations between PFOS and PFOA and neuropsychological performance at age 6–12 years, as reported by Stein et al. (2013). The authors approached families if children had been living in the same district, had serum PFOS/PFOA levels determined in 2005–2006, and whose parents had agreed to further studies. In total, 320 children could be included in the study. Extensive neuropsychological testing was performed in 2009–2010. Performance was compared with estimated PFOA exposure in the pregnant mothers (modelled exposure from drinking water at geocoded addresses) and with PFOS/PFOA levels in the children 3–4 years before neuropsychological testing. Mean PFOS and PFOA levels in the children in 2005–2006 (at a mean age of 6 years) were 21 and 92 μg/L (median PFOA 35 μg/L). The mean estimated PFOA in the pregnant mothers was 116 μg/L. A large number of potential confounders were taken into account. For several outcomes, there were indications of a neuroprotective effect of PFOA exposure, but overall the results provided no support for adverse effects of PFOS/PFOA on neuropsychological functioning at 6–12 ages.
The Danish Aarhus birth cohort was used by Strøm et al. (2014) to study the association between serum PFOS and PFOA in the mothers (pregnancy week 30) and risk of ADHD and depression during follow‐up through year 2010 (age of about 22 years). PFOS/PFOA levels were as indicated above, and a number of potential confounders were adjusted for. The cases (ADHD N = 27, depression N = 104) were ascertained from hospital registers and prescription of relevant medications. In addition, the authors studied associations with scholastic performance in the 9th grade (age about 16 years). No significant associations were found between PFOS and PFOA and any of these outcomes. Point estimates for the HR of diagnoses were below one for the third tertiles of PFOS/PFOA while the slopes for scholastic performance were slightly negative.
Chen et al. (2013) studied the associations between PFOS and PFOA in cord blood of 239 infants and neurodevelopment at 2 years of age from Taiwan. Development (cognitive, language, gross‐motor, fine motor, social and self‐help) was assessed by trained staff. Mean PFOS and PFOA levels were 7.0 and 2.5 μg/L. Potential confounders, related to mothers, and the home environment were included in the statistical models. PFOS in cord blood was associated with slower overall development, mainly in the motor domains, but to some extent also in the self‐help domain. There were some similar tendencies for PFOA, but none of them statistically significant.
Braun et al. (2014) examined associations between PFOS and PFOA in pregnant mothers (N = 175) in Ohio (the HOME study), and autistic behaviour (a Social Responsiveness Scale, SRS, based on questionnaires to mothers) in their children at 4–5 years of age. The GM levels were 13 μg/L for PFOS and 5.6 μg/L for PFOA in the women (mostly at 16 weeks), recruited in 2003–2006. A number of potential confounders were adjusted for. There were no statistically significant associations between PFOS or PFOA and results from the SRS scale; the beta coefficient was slightly positive for PFOS and slightly negative for PFOA.
The HOME cohort was also used to study associations between PFOS/PFOA and clinical neurobehavioural examination at 5 weeks of age in 327 children (Donauer et al., 2015). There was a borderline association between maternal log10 PFOA level and one of 11 neurobehavioural scales (low muscle tone/hypotonic, N = 84). In an additional analysis using about half of the children without any signs of abnormal behaviour as reference, the risk of being hypotonic increased significantly with higher maternal PFOA levels (OR 3.8, 95% CI: 1.1–13 and relative risk 2.2, 95% CI: 1.1–4.6 per 10‐fold increase of PFOA). No associations were found for PFOS levels.
Finally, the HOME cohort was used to study associations between maternal serum PFOS/PFOA (levels as above) and executive function (flexibility, goal planning, and information processing), as estimated from a parent‐reported questionnaire (named BRIEF) in about 200 children at 5 and 8 years of age (Vuong et al., 2016). There was a significant association between maternal serum PFOS and worse executive functions in children (about 7% higher (worse) scores per 2.7‐fold increase in maternal serum PFOS.
Ode et al. (2014) performed a case–control study of the association between ADHD and PFOS and PFOA in children aged 8–12 years, based on 206 cases of ADHD and 206 controls from Malmo, Sweden. Classification of ADHD was based on clinical diagnosis at a child psychiatry department. PFOS and PFOA levels were measured in bio‐banked cord serum samples from cases and controls. A number of potential confounders were adjusted for. Median levels of PFOS and PFOA were 6.8 and 1.8 μg/L. OR for ADHD were 0.81 (95% CI: 0.50–1.3) for PFOS and 1.1 (0.67–1.7) for PFOA.
Forns et al. (2015) studied the association between PFOS and PFOA in breast milk and cognitive and psychomotor development (parental questionnaires) in children at 6 and 24 months in a Norwegian birth cohort. The analyses were performed in 896 children of mothers recruited in 2003–2009 with data on neuropsychological development (parent‐completed questionnaires) and PFOS/PFOA in breast milk. The median levels of PFOS and PFOA in breast milk were 0.11 and 0.040 ng/mL. A number of potential confounders were adjusted for. No associations were found between the outcomes and breast milk PFOS/PFOA. It was noted that PFOS/PFOA in breast milk reflects not only early postnatal exposure, but also prenatal exposure since correlations have been reported with PFOS/PFOA in maternal serum.
In a Taiwanese cohort of 430 pregnant women, serum PFOS and PFOA levels were measured in the third trimester (year 2000–2001) and then 120 children could be followed up at 5 and 8 years of age for assessing IQ (Wang et al., 2015c). The median maternal serum PFOS was 13 ng/mL and for serum‐PFOA the median was 2.5 ng/mL. After adjustment for a number of potential confounders, no statistically significant associations were found between maternal PFOS/PFOA and children's IQ at 5 or 8 years of age.
A birth cohort (INUENDO) combining data on pregnant mothers and their children (N = 1,106) from three different countries (Greenland, Ukraine and Poland) examined associations between maternal serum levels of PFOS/PFOA (at different stages of gestation) and neurobehavioural development (parental questionnaires) at about 8 years of age (Høyer et al., 2015a). The participation rate was high in Greenland but low in Ukraine and Poland. A number of potential confounders were adjusted for. Median maternal serum concentrations of PFOS were 20, 5.0 and 8.0 ng/mL in Greenland, Ukraine, and Poland. PFOA concentrations were 1.8, 1.0 and 2.7 ng/mL, respectively. PFOA was associated with higher behavioural scores (mainly hyperactivity) in Ukraine children (OR 6.3, 95% CI 1.3–30 in the upper tertile), but not in children from the other countries. There were no associations between maternal PFOS/PFOA levels and motor problems.
Two Taiwanese birth cohorts were used to examine the association between PFOS/PFOA in cord blood and ADHD‐related symptoms (parental questionnaires) in 282 children at 7 years of age (Lien et al., 2016). The response rate for follow‐up was low. The mean PFOS and PFOA levels were 4.8 and 1.6 ng/mL. A number of potential confounders were adjusted for. No associations were found between PFOS/PFOA levels and ADHD‐related symptoms.
Oulhote et al. (2016) studied associations between maternal serum PFOS/PFOA in the end of pregnancy and child behaviour (parent‐reported scales) in 539 Faroese children (born 1997–2000) at 7 years of age. In addition, associations between children's behaviour and their PFOS/PFOA levels (at age 5 and 7) were examined. No associations with maternal levels (PFOS 27 ng/mL, PFOA 3.2 ng/mL) were found and no consistent associations with children's PFOS levels. There were, however, several significant findings when behaviour was compared with serum PFOA levels in the children at age 5 (PFOS 17 and PFOA 4.1 ng/mL) – see Section 3.3.4.4.
Goudarzi et al. (2016) examined associations between PFOS/PFOA in maternal blood and neurobehavioural development (clinical examination) in Japanese children from the Hokkaido birth cohort at 6 (N = 173) and 8 months (N = 133). The median maternal PFOS and PFOA levels were 5.7 and 1.2 ng/mL, respectively. A number of potential confounders were adjusted for. There were no overall associations between maternal PFOS/PFOA levels and neurodevelopment at 18 months. At 6 months, higher maternal log‐transformed PFOA levels were associated with lower scores in one of the developmental scales in girls, but not in boys.
Dutch children were examined by Quaak et al. (2016) for associations between PFOS/PFOA in cord blood and parental‐assessed scales for ADHD and ‘externalising behaviour’ (attention problems and aggressive behaviour) in 59 children. A number of potential confounders were taken into account. No associations were found for ADHD, while for externalising behaviour a significant negative association (‘protective effect’) with PFOA was found in boys (N = 34).
3.3.4.3.2. Growth in infancy and childhood, overweight, metabolic risk factors
In the Danish National birth cohort associations between PFOS and PFOA during pregnancy and (maternally reported) weight, height, and BMI at 5 and 12 months for 1,010 of the children were studied by Andersen et al. (2010). A number of potential confounders were adjusted for. Weight and BMI were inversely related to prenatal PFOS and PFOA (means 33 and 5.2 μg/L). One μg/L increases in PFOS and PFOA were associated with 9 g and 43 g lower weight at 12 months.
In the same cohort, adiposity was examined in 811 children at age 7 (Andersen et al., 2013). Median prenatal PFOS and PFOA levels were 34 and 5.3 ng/mL). Weight, height and waist circumference were measured by mothers and noted in a mailed questionnaire. A number of potential confounders were adjusted for. There was no association between PFOS or PFOA levels and BMI, waist or risk of overweight.
Halldorsson et al. (2012) performed a longitudinal study of the association between PFOS and PFOA in serum in 665 pregnant women, recruited in 1988–1989 from the Aarhus cohort, Denmark, and risk of overweight (BMI, waist circumference, insulin, leptin and adiponectin) in their offspring at 20 years of age. Mean PFOS and PFOA were 22 and 3.7 μg/L. Several potential confounding factors were taken into account. In the female offspring, BMI was significantly higher (point estimate 1.6 units) in the fourth quartile (Q4) of PFOA compared to the first (Q1). For waist, the significant difference between Q4 and Q1 was 4.3 cm. No such associations were found for PFOS. There were similar associations for male offspring, but not statistically significant. There were also positive associations between PFOA in the mothers and insulin, and leptin in the offspring, and inverse associations with adiponectin.
Maisonet et al. (2012) studied the association between prenatal PFOS and PFOA (serum levels in pregnant mothers; median 20 and 3.7 ng/mL) and birth weight and weight at 20 months in 447 girls from Avon, UK (Avon Longitudinal Study of Parents and Children (ALSPAC) study). The girls were selected for another study (of menarche). A number of potential confounders were adjusted for. Findings on birth weight are reported in Section 3.3.4.2.1 Girls in the upper tertile of maternal PFOS weighed about 400 g more at 20 months than girls in the first (referent) tertile, and when adjusted for height the difference was 500 (95% CI 208–791) g. Birth weight in the third tertile of PFOS had, however, been lower. No association was found with maternal PFOA.
The ALSPAC cohort was also used by Maisonet et al. (2015) to study the association between prenatal serum levels of PFOS/PFOA and blood lipids in girls at 7 (n = 115) and 15 (n = 87) years of age. Some covariates were adjusted for. No consistent tendencies were found for PFOS, while blood lipids were highest in children born to mothers in the second PFOA tertile, indicating a nonlinear relation. Moreover, within the lowest PFOA tertile, there were significant associations between prenatal PFOA and total and LDL cholesterol.
de Cock et al. (2014a) studied the association between PFOS and PFOA and growth (weight, height, head circumference) during the first year in 61 Dutch children. PFOS and PFOA were analysed in cord plasma, and in breast milk in the mothers. Mean PFOS and PFOA levels in cord plasma were only 1.6 and 0.9 μg/L, respectively. A number of potential confounders were taken into account. No associations were found between PFOS and growth. For PFOA, an association with height was reported, but the authors do not report in which direction.
The INUENDO cohort (see above) was used to study associations between maternal PFOS/PFOA levels and offspring overweight and central obesity (waist‐to‐hip ratio), but only in the children from Greenland (N = 531) and Ukraine (N = 491) (Høyer et al., 2015b). No consistent associations were found between maternal PFOS/PFOA levels and children's risk of overweight. The risk of having a high waist‐to‐hip ratio tended to be increased in the upper two tertiles of PFOA in Greenland (RR: 1.4, 95% CI: 0.6–3.3) and Ukraine (RR: 1.8, 95% CI: 0.4–7.2) and in a combined analysis the RR was 1.4 (1.05–1.8) for one unit increase of ln PFOA.
A Faroese mother–child cohort (recruited 2007–2009) was used by Karlsen et al. (2017) to study the associations between maternal PFOS and PFOA levels and overweight at 18 months and 5 years of age. Median PFOS and PFOA levels 2 weeks post‐partum were 8.3 and 1.4 ng/mL. A number of potential confounders were adjusted for. The risk of overweight at age 5 (but not at 18 months) was increased in the upper tertile of PFOA (RR: 1.9, 95% CI: 1.1–3.3). There was also a tendency towards an association between PFOS and overweight at 18 months (RR: 1.2, 95% CI: 0.98–1.6), but not at 5 years.
Associations between maternal plasma PFOS/PFOA in early pregnancy and adiposity in children were examined by Mora et al. (2017) in a US birth cohort. BMI, waist circumference, and skinfold thickness were measured at about 3 and 8 years of age (1,006 and 876 children, participation rate 61 and 53% of children with prenatal PFOS/PFOA levels). At 8 years also, fat mass was estimated (using DXA). A number of potential confounders were adjusted for. Serum albumin and estimated pre‐pregnancy GFR were also taken into account. Median maternal PFOS and PFOA levels were 25 and 5.6 ng/mL. No consistent associations were found between maternal PFOS/PFOA and adiposity at about 3 years of age or adiposity in boys at about 8 years. In girls, however, there were non‐significant tendencies towards positive associations between PFOS and PFOA and most adiposity measures.
Fleisch et al. (2017) studied associations between prenatal (maternal plasma at about 10 weeks of gestation in 1999–2002) PFOS/PFOA and glucose homoeostasis (glucose, insulin, HOMA‐IR), leptin and adiponectin in about 500 children from Boston at the median age of eight years. A number of potential confounders were adjusted for. GM maternal PFOS and PFOA were 24 and 5.3 ng/mL. Associations between prenatal PFOS/PFOA and insulin resistance, leptin and adiponectin were null. Associations examined cross‐sectionally using PFOS/PFOA in children's plasma showed an inverse association between PFOS/PFOA and HOMA‐IR.
Associations between prenatal PFOS/PFOA exposure (serum levels in mothers at week 16) and adiposity at the age of 8 in 204 US children from the HOME study, were reported by Braun et al. (2016). GM for PFOS and PFOA were 13 and 5.4 ng/mL. A number of potential confounders were adjusted for. A non‐linear positive association was found for PFOA, with increased BMI, waist circumference and risk of overweight or adiposity in tertile 2 vs tertile 1, but not in tertile 3. There was no association between PFOS and adiposity.
3.3.4.3.3. Puberty and semen quality
Using a nested case–control design Christensen et al. (2011) examined the association between maternal concentrations of PFOS and PFOA with age of menarche in the British ALSPAC cohort. They selected 218 early menarche cases, which reported age at menarche before 11.5 years (median 11.1 years) and 230 random controls (mean age at menarche year 12.6 years). Age at menarche was assessed through self‐reported questionnaires administered with 2‐year intervals between the age of 8–13. Serum PFOS and PFOA concentrations (median 19.8 and 3.7 ng/mL, respectively) were quantified in archived serum samples taken during pregnancy (1991–1992). In short no association was observed with early age of menarche with odds ratios tightly centred around 1.
In a Danish population‐based prospective cohort, Kristensen et al. (2013) examined the association between maternal concentrations of PFOS and PFOA (median: 21.1 and 3.6 ng/mL, respectively) taken around week 30 of gestation and age at menarche and reproductive hormones in 343, 19‐ to 21‐year‐old, female offspring. Age at menarche was assessed through self‐reported questionnaires and blood samples were drawn during clinical examination. Some potential confounders were adjusted for, but not maternal age at menarche. Female offspring of mothers with maternal PFOA concentration of ≥ 4.3 ng/mL had on average 5.3 (95% CI: 1.3, 9.3) months later age of menarche compared to female offspring of mothers whose PFOA concentrations were < 3.0 ng/mL. No consistent associations were observed with reproductive hormones among those females who provided information on contraceptive pill use (n = 171) and in those who provided information on non‐use (n = 75). The analyses on reproductive hormones were complicated due to frequent use of contraceptives.
From the same Danish cohort, Vested et al. (2013) examined the prospective association between serum concentrations of PFOS and PFOA (median: 21.2 and 3.8 ng/mL, respectively) with semen quality in 169 male offspring at 19–21 years of age. Serum samples were drawn in week 30 of gestation and semen quality was assessed using standard clinical procedures. Some potential confounders were adjusted for. When outcomes were log‐transformed, maternal serum concentrations of PFOA were associated with lower offspring sperm concentrations (p for trend 0.01) and lower sperm count (p for trend 0.001) which corresponded to around 34% reduction in both outcomes when comparing offspring of mothers with serum concentrations above 4.4 and below 3.2 ng/mL, respectively. Maternal PFOA concentrations were also significantly associated with higher levels of luteinising hormone and follicle stimulating hormone in these male offspring.
3.3.4.3.4. Summary
In summary, 30 longitudinal studies in 18 cohorts were identified with PFOS/PFOA measurements in serum of pregnant mothers, in cord blood or in breast milk and follow up of various outcomes in children between 6 months and 22 years. Most studies have examined associations between prenatal or perinatal exposure to PFOS/PFOA and later neurobehavioural development and overall they do not provide support for any association. This conclusion is still valid based on the quality and consistency of the studies, for example if most weight is put on studies of large size, good quality of outcome (measured/tested vs parent‐reported), good confounder control. Several of the neurobehavioural studies examined the risk of ADHD/hyperactivity at prenatal exposure (Ode et al., 2014; Strøm et al., 2014; Liew et al., 2015; Lien et al., 2016; Quaak et al., 2016) but no increased risk related to PFOS/PFOA was found.
For overweight in early childhood, the studies are not consistent (Andersen et al., 2010; Maisonet et al., 2012; de Cock et al., 2014a; Karlsen et al., 2017). In later childhood or adolescence, some studies show positive associations with overweight in subgroups (Halldorsson et al., 2012; Karlsen et al., 2017; Mora et al., 2017), while others do not (Andersen et al., 2013; Høyer et al., 2015b), or show exposure‐response relationships, which are difficult to interpret (Braun et al., 2016). For other outcomes (Halldorsson et al., 2012; Maisonet et al., 2015; waist‐to‐hip ratio: Høyer et al., 2015b, insulin and leptin; Fleisch et al., 2017), the data are insufficient (one or two studies for each of these outcomes). The CONTAM Panel concludes that there is insufficient support for associations between prenatal exposure to PFOS or PFOA and early life neurobehavioural development or overweight.
Although the two studies on associations between prenatal (maternal blood) exposure to PFOS/PFOA and age at menarche appear consistent, the ALSPAC study (Christensen et al., 2011) was only designed to test the hypothesis that PFOS and/or PFOA might be associated with earlier age at menarche. If PFOS/PFOA are associated with later age at menarche, then the ALSPAC study would by design (sampling only early age at menarche cases) not detect that. Since age at menarche has a relatively strong heritability component not accounting for this potential confounder in the study by Kristensen et al. (2013) is a clear limitation. Although the results on semen quality by Vested et al. (2013) are interesting, limited conclusions can be drawn from a single epidemiological study and replication is needed. As a result, these three studies provide insufficient evidence to conclude on casual associations with PFOS/PFOA.
3.3.4.4. Neurotoxic outcomes
3.3.4.4.1. Studies in children
Associations between PFOS and PFOA and ADHD and learning problems in children were investigated by Stein and Savitz (2011). This was a cross‐sectional study in the C8 cohort exposed to PFOA from contaminated drinking water. The PFOS and PFOA levels were measured in serum in 2005–2006 in about 11 000 children aged 5–18 years. The mean PFOS and PFOA levels were 23 μg/L (median 20) and 66 (median 28) μg/L. Classification of ADHD was based on interviews (diagnosis made in the health sector, or medication against ADHD). A number of potential confounders were adjusted for. There was no significantly increased OR for ADHD in the three upper quartiles of PFOS compared with the first (Q1; reference) quartile (upper limit of Q1 = 14.8 μg/L). Neither was the OR increased in the three upper quartiles of PFOA (upper limit of Q1 = 13 μg/L). The OR for ADHD in the fourth quartile (Q4) of PFOS was 1.09 (95% CI: 0.93–1.29). The OR in Q4 for PFOA was 0.76 (95% CI: 0.64–0.90). Similar tendencies were found for ADHD medication. No positive associations between PFOS or PFOA were found for the outcome ‘learning problems’.
The same sample of children was also examined for the association between child behaviour and serum PFOA by Stein et al. (2014b). The assessment of behaviour in this study was based on a large number of clinical scales for assessment of executive function, ADHD‐like behaviour, emotional or behaviour problems, as reported by the children's mothers and teachers. A number of potential confounders were adjusted for. The median PFOA level was 35 μg/L. In summary, the associations indicated a protective effect of high PFOA in boys, especially from mothers’ reports, while in girls, mothers’ report indicated adverse effects of high PFOA, which was not supported by teachers’ reports.
Gump et al. (2011) studied the association between PFOS and PFOA and impulsivity in a cross‐sectional study of 83 children aged 9–11 years from north‐west USA. Impulsivity was assessed by a procedure reinforcing delayed response in a computer task, which could be learned during the task. Mean PFOS and PFOA levels were 9.9 and 3.2 μg/L. A number of potential confounders were taken into account. Higher PFOS and PFOA levels were inversely associated with the (reinforced) response, which was assumed to indicate less ability to inhibit the optimal delay in response, and thus increased impulsivity.
Hoffman et al. (2010) performed a cross‐sectional study of the association between PFOS and PFOA and diagnosis of ADHD (51 cases) in 571 children aged 12–15 years, examined in the US National Health and Nutrition Examination Survey (NHANES) 1999–2004. Median PFOS and PFOA levels in serum were 23 and 4.4 μg/L. The classification of ADHD was based on parental interviews (diagnosis made in the health sector or medication against ADHD). A number of potential confounders were adjusted for. An interquartile range (IQR) increase of PFOS (16 μg/L) increased the OR for ADHD by a factor of 1.6 (95% CI: 1.1–2.3), and an IQR increase in PFOA (2.7 μg/L) increased the OR for ADHD by a factor 1.4 (95% CI: 1.04–1.3).
As mentioned in the section on neurodevelopment (Section 3.3.4.3.1), Oulhote et al. (2016) studied associations between child behaviour (parent‐reported scales) at age 7, and PFASs levels in the children at age 5 and 7 years in 539 Faroese children. There were no consistent associations with children's PFOS levels. There were, however, several significant findings when behaviour was compared with serum PFOA levels in the children at age 5 (median PFOS 17 and PFOA 4.1 ng/mL): peer relation, conduct problems, internalisation problems and autism screening scores. Associations were driven by effects in girls, while in boys the direction was the opposite. In a structural equation model, adjusted also for pre‐ and postnatal PCB and Hg blood levels there was a significant association between total postnatal PFAS levels (PFOS, PFOA and other PFASs at age 5 and 7) and scores of total behaviour difficulties.
3.3.4.4.2. Studies in adults
In the C8 cohort, cross‐sectional associations between PFOS/PFOA and self‐reported memory impairment were examined in 21,000 adults ≥ 50 years of age (Gallo et al., 2013). The GM PFOS and PFOA levels in 2005–2006 were about 22 and 43 ng/mL. A number of potential confounders were adjusted for. About 20% reported some memory impairment. Statistically significant inverse (‘protective’) associations were found between PFOS as well as PFOA and memory impairment. The OR for memory impairment was 0.85 (95% CI 0.76–0.94) for Q5 vs Q1 of serum PFOS. For serum PFOA the OR was 0.79 (95% CI 0.71–0.88). The authors discuss anti‐inflammatory effects of PFOS/PFOA (via PPARgamma) or residual confounding, as possible explanations.
Power et al. (2013) performed a cross‐sectional study on the associations between serum levels of PFOS and PFOA and self‐reported memory problems or confusion periods in about 1,800 individuals, aged 60–85 years, from the NHANES 1999–2008. A number of potential confounders were taken into account. The GM for PFOS was 23 μg/L and for PFOA 4.1 μg/L. The authors found no significant associations between PFOS or PFOA and these cognitive symptoms. The OR for memory problems or confusion was 0.90 (0.78–1.03) for a doubling of serum PFOS and 0.92 (95% CI: 0.78–1.09) for a doubling of serum PFOA. The OR for memory problems was significantly below 1.0 in some subanalyses of diabetics.
Berk et al. (2014) studied the cross‐sectional association between self‐reported depressive symptoms and serum PFOS/PFOA in 5,400 individuals > 18 years in NHANES surveys 2005–2010. PFOS/PFOA levels are not presented. There were relatively strong inverse (‘protective’) associations between PFOS/PFOA levels and depressive symptoms after adjustment for some potential confounders: OR 0.66 (95% CI 0.47–0.93) for Q4 vs Q1 of PFOS, and OR 0.61 (95% CI 0.43–0.87) for Q4 vs Q1 of PFOA.
3.3.4.4.3. Summary
In summary, these eight cross‐sectional studies, five in children and three in adults, examined various neurobehavioural, neuropsychiatric and cognitive outcomes without finding consistent adverse associations with serum levels of PFOS or PFOA. Several studies found inverse (‘protective direction’) associations.
3.3.4.5. Immune outcomes
Several human observational studies have examined associations between PFOS and PFOA with immune outcomes such as asthma, allergies, serum antibody response to vaccination and propensity for infections. For asthma and allergies, only few prospective studies have been conducted while those studies that have examined antibody response to vaccination have had more robust design. Studies looking at propensity for infection have mostly been based on parental recall several months back in time with the exception of one study where infections were recorded regularly during the follow‐up period with help of text messages (Dalsager et al., 2016). The results from these studies are summarised below.
3.3.4.5.1. Cross‐sectional studies on asthma and allergies in children and adults
Dong et al. (2013) examined association between serum concentrations of PFOS and PFOA and asthma in 10‐ to 15‐year‐old Taiwanese children. The study recruited 231 children who had received a doctor's diagnosis of asthma in the previous year and 225 non‐asthmatic controls. The median concentrations for PFOS and PFOA were around 33 and 1 ng/mL, respectively. A significant positive association with doctor‐diagnosed asthma was observed for both PFOS and PFOA. Comparing the highest to the lowest quartile of PFOS concentrations the OR for increased risk of asthma was 2.6 (95% CI: 1.5, 2.5) and the corresponding OR for PFOS was 4.1 (95% CI: 2.2, 7.4). A significant increase in serum concentrations of IgE, eosinophilic counts, and eosinophilic cationic protein was observed with higher PFOS and PFOA concentrations among asthmatic cases, while a modest non‐significant increase was observed among controls. The Spearman correlation coefficient between PFOS and PFOA was 0.64. No mutual adjustments for PFOS and PFOA were reported. Such analyses would have been helpful for interpreting these findings as it cannot be excluded that the relatively strong associations reported by PFOS and PFOA are partially confounded by each other (or other PFAS reported in this study). Using the same study Zhu et al. (2016) reported some sex specific associations for immunologic markers of asthma but overall these results were unclear.
In another cross‐sectional study of 12‐ to 19‐year‐old children and young adults (n = 638) from the NHANES, Stein et al. (2016a) examined the associations between (PFOS and PFOA (mean 15.0 and 3.6 ng/mL, respectively) and self‐reported asthma, wheeze, allergy and rhinitis. Sensitisation to 19 different allergens was also measured (plants, dust mite, pets, cockroach, shrimp, rodents, mould and food). For all these outcomes no consistent associations were observed.
Concerning studies among adults, a cross‐sectional study from the US examined associations between PFOS and PFOA concentrations (median 31.4 and 12.3 ng/mL, respectively) and asthma among 458 New York State employees and National Guard personnel assigned to work in the vicinity of the World Trade Centre after its collapse in 2011 (Tao et al., 2008). Non‐significant differences in PFOS and PFOA concentrations were observed among subjects classified as symptomatic and asymptomatic. In this selected population concentrations of PFOS and PFOA were higher than in the general US population at the time, possibly due to prior occupational contact with these chemicals.
In another study, Anderson‐Mahoney et al. (2008) compared the expected rates for various disease outcomes (controlling for age and gender) with those observed among 566 adults from Ohio that were exposed to PFOA from contaminated drinking water. A median serum level of 327 ng/mL had previously been reported among a random sample of 74 residents from this population (Emmett et al., 2006). A comparison with data from an NHANES study revealed higher rates of chronic bronchitis, shortness of breath on stairs and asthma as assessed by questionnaires in this exposed population. Due to the potential socioeconomic and lifestyle differences between the exposed communities and the general US population the results from this study are at best hypothesis generating.
Buser and Scinicariello (2016), examined in NHANES (2005–2006), the cross‐sectional association between serum PFOS and PFOA concentrations (median: 15.0 and 3.6 ng/mL, respectively) with food sensitisation (defined as having at least one food‐specific IgE level ≥ 0.35 kU/L) in 637 participants. A prospective association with any food allergy in NHANES 2005–2006 and food allergies (self‐reported: yes to the question ‘What foods are you allergic to’) in NHANES 2007–2010 was also examined (n = 701). No association was observed with food sensitisation. Serum PFOA were associated with increase odds of any food allergies but the odds ratios were unstable with wide confidence intervals and there was no clear dose response. The use of any food allergy as outcomes can be regarded as relatively unprecise.
Osuna et al. (2014) examined pre‐ and postnatal association between PFSO and PFOA in a small pilot study of 28 children from the Faroese Islands. Although the authors reported inverse association between PFOS with anti‐actin IgG the results from this small pilot study do not provide much insight in the absence of further replication.
3.3.4.5.2. Prospective studies on asthma and allergies in children and adults
In a study from Japan, Okada et al. (2012) examined associations between maternal serum concentrations of PFOS and PFOA (median 5.2 and 1.3 ng/mL, respectively) with cord blood IgE concentrations (n = 231) and offspring food allergies, eczema, wheezing, up to 18 months of age (n = 343). Maternal serum was drawn during the second trimester and offspring outcomes on allergies and infections were determined by use of a questionnaire to mothers. No associations were observed with offspring allergies or infections at 18 months of age. A significant inverse association was observed between maternal concentrations of PFOA and cord blood IgE levels in female offspring only.
In a later study, Okada et al. (2014) examined associations between prenatal exposure to PFOS and PFOA (mean 5.0 and 2.0 ng/mL, respectively) and allergic diseases at 12 and 24 months post‐partum among infant 2,063 mother child pairs from the Hokkaido Study on Environment and Children's Health 2003–2009. No consistent associations were observed with odds ratios at higher exposures being below 1.
In Taiwan, Wang et al. (2011b) examined the association between serum cord blood concentrations of PFOS and PFOA (median 5.5 and 1.7 ng/mL, respectively) with both cord blood levels of IgE and children's levels of IgE levels and atopic dermatitis when the children were 2 years of age (n = 244). In their cross‐sectional analyses, cord blood concentrations of PFOA and PFOS were associated with higher cord blood IgE levels. In their prospective analyses, no associations were observed with children's serum levels of IgE or atopic dermatitis at 2 years of age.
A study of 1,238 pregnant women from Canada found no association between maternal serum concentrations of PFOS and PFOA (mean 4.7 and 1.0 ng/mL, respectively) and cord blood concentrations of IgE (Ashley‐Martin et al., 2015).
3.3.4.5.3. Vaccination response
Grandjean et al. (2012), in a study from the Faroe Islands, examined the association between both prenatal and postnatal exposures to PFOS, PFHxS and PFOA with children's antibody concentrations against tetanus and diphtheria at ages 5 and 7 years (n = 462–587). Serum antibody concentrations were quantified both pre‐ and post‐booster at ages 5.0 and 5.2, respectively. Concentrations (mean) of PFOS (27.3 ng/mL), PFHxS (4.4 ng/mL), and PFOA (3.2 ng/mL), were quantified in maternal serum drawn around gestation week 32. The corresponding mean concentrations in children's serum drawn at age 5 (prebooster) were 16.7, 0.6 and 4.1 ng/mL, respectively. Maternal serum concentrations and offspring serum concentrations at age 5 were examined individually, in relation to antibody response at age 5, both pre‐ and post‐booster and at a mean age of 7.5 years. In addition, associations with PFOS, PFOA and PFHxS were examined, combined using structural equation modelling. The main findings of this study were as follows:
Maternal PFAS concentrations: Maternal PFOS concentrations were inversely associated with diphtheria antibody concentrations at age 5 pre‐ and post‐booster (the latter almost significant) while a decrease in diphtheria antibody concentrations at age 7 was observed with increasing PFOA levels. Modelling the combined exposure to PFOS, PFOA and PFHxS, using structural equations, a twofold increase in maternal concentrations of this combined exposure was associated with a −48% (95% CI: −68, −16) decrease in offspring diphtheria antibody concentrations at age 5 prebooster and −42% (95% CI: −66 to −1) decrease in antibody concentrations at age 7. No association was observed between maternal concentrations and offspring tetanus antibody concentrations at age 5 and 7 when these three PFASs were examined individually or combined.
Offspring PFAS concentrations at 5 years prebooster: Cross‐sectional, individual or combined serum levels of PFOS, PFHxS and PFOA at age 5 years were not associated with prebooster tetanus or diphtheria antibody concentrations at age 5. However, a relatively strong inverse association was observed for these serum levels of PFOS, PFHxS and PFOA at age 5 years, with serum antibody concentrations to tetanus at 5 and 7 years post‐booster. Although on two out of six occasions these associations did not reach formal statistical significance the decrease in tetanus antibody concentrations was, for individual compounds, consistent and ranged between ‐10% and ‐36% for each twofold increase in exposure. Similar, but slightly less pronounced inverse trends were observed for diphtheria antibody concentrations at ages 5 and 7 post‐booster (statistically significant for PFOS and PFOA at age 7). When modelling the combined exposure to PFOS, PFHxS and PFOA a twofold increase in serum levels exposure at age 5 was associated with −59% (95% CI: −76, −29) and −46% (−67, −10) decrease in serum antibody response to tetanus and diphtheria at age 7 years, respectively.
Clinical relevance: The authors noted that the odds ratio for antibody concentrations being below the protective level for diphtheria at age 7 for a twofold increase in PFOS and PFOA concentrations at age 5, were 2.4 (95% CI: 0.9–6.4) and 3.3 (95% CI: 1.4, 7.5), respectively.
Based on findings from the same cohort as used in the Grandjean et al. (2012) study, confounding by polychlorinated biphenyls (PCBs)21 could be suspected as both maternal concentrations (Heilmann et al., 2016) and offspring concentrations at 5 years (Heilmann et al., 2010) have been associated with reduced antibody response to the same vaccines. Acknowledging the possibility for confounding (Grandjean et al., 2012), the authors reported the Spearman correlation between PCBs (sum) and PFOS during pregnancy, which was 0.24. The corresponding correlation for the offspring at age 5 was 0.08. These weak correlations essentially rule out strong confounding by PCBs because of in utero or lactational exposures22; and because of offspring own exposures at age 5. This was also demonstrated when the authors adjusted for breast milk concentrations (taken in days 4–5 post‐partum) of PCBs and offspring concentrations at age 5. Without adjustment for PCBs the change in diphtheria concentration at age 7 years per twofold increase in offspring serum concentrations of PFOS at age 5 years was −28% (95% CI: −46 to −3). After further adjustment for maternal pregnancy concentrations and offspring PCBs concentrations at age 5 years, the corresponding estimate was −38% (95% CI: −56, −12). The low correlations observed for PCBs and PFOS in this population, particularly in the children, also suggest that these compounds did not share the same sources of exposure. The same argument applies for PFOA, which was even less correlated with PCBs than PFOS in the Grandjean et al. (2012) study. As a result, confounding by PCBs is considered unlikely. However, even if confounding by PCBs is considered unlikely, effect modification by PCBs is theoretically possible, i.e. that the decrease of antibody response in children with higher PFOS exposure could depend on concomitant exposure to PCBs (effect modification).
Granum et al. (2013) examined, in a subset of children from the Norwegian Mother and Child Cohort study, the associations between maternal serum concentrations at delivery (mean) of PFOS (5.6 ng/mL), and PFOA (1.1 ng/mL) with serum antibody concentrations in 50 children that had followed a routine vaccination program with vaccines against tetanus and Haemophilus influenza type B (Hib) administered at ages 3, 5 and 12 months, and vaccination against measles and rubella at 15 months. In covariate‐adjusted models maternal serum concentrations of PFOS and PFOA were inversely associated with offspring antibody concentration to rubella at age 3 years (n = 50). No associations were, however, observed for Hib, tetanus or measles antibodies.
Stein et al. (2016a) examined cross‐sectionally the associations between (mean) PFOS (20.8 ng/mL) and PFOA (4.1 ng/mL) concentrations with serum antibody concentrations to measles, mumps and rubella among 1,188 children and adolescents (12–19 years) from NHANES. Higher concentrations of PFOS and PFOA were significantly associated with lower serum antibody concentrations for rubella and mumps (somewhat stronger for PFOS). The observed effect size for mumps and rubella ranged from 3% to 13% decrease in antibody concentrations per twofold increase in exposure.
Apart from these three studies (Grandjean et al., 2012; Granum et al., 2013; Stein et al., 2016a) that focused on the exposure during pre‐ and postnatal development, three comparable studies have also been conducted in adults.
Looker et al. (2014) examined, among 411 US adults, associations between serum concentrations of PFOA and PFOS and antibody response following influenza vaccination, and self‐reported occurrence of recent (< 12 months) respiratory infections. Participants had been exposed to PFOA contaminated drinking water and were enrolled into the C8 project in 2005–2006, but were again followed‐up and recruited into this study in 2010. Median serum concentrations of PFOA and PFOS in 2010, prior to vaccination, were 31.5 and 9.2 ng/mL, respectively. After vaccination seroconversion for influenza type B, A/H1N1 and A/H2N3 was 62%, 84% and 65%, respectively. Mean antibody concentrations for influenza type B at 21 ± 3 days post vaccination was significantly lower among those in the highest compared to lowest quartile of PFOA exposure while non‐significant changes were observed for PFOS. However, in covariate adjusted models, where exposure and outcome were both log‐transformed, non‐significant changes were observed in all cases, although a borderline‐significant inverse association (p = 0.09) was observed between PFOA and A/H2N3 antibody response. No associations were observed for either PFOS or PFOA when using self‐reported colds or influenza as an outcome.
Kielsen et al. (2016) examined the relationship between serum concentrations (median for PFOS and PFOA was 9.5 ng/mL and 1.7 ng/mL, respectively) with changes in antibody concentrations for tetanus and diphtheria following booster vaccination in twelve healthy Danish volunteers. Changes in antibody concentration were defined as the difference in concentrations between day 4 and 10 after vaccination. This outcome was used based on the assumption that stable antibody concentrations would be reached 10 days after the vaccination. The baseline concentration of PFOS was inversely associated with the rate of increase in diphtheria antibody concentrations between 4 and 10 days, with a 11.9% (95% CI: 0.3, 21.9) decrease observed per doubling of PFOS exposure. The corresponding, but non‐significant, decrease in antibody concentrations for PFOA was 8.2% (95% CI: −20.9, 6.4). The corresponding effect estimates for tetanus were non‐significant for both PFOS and PFOA.
Stein et al. (2016b) examined the association between serum concentrations (mean) of PFOS (5.2 ng/mL) and PFOA (2.3 ng/mL) with immune response following vaccination against influenza (FluMist). A total of 78 subjects from the US, aged 18–49 provided a baseline blood sample and were then immunised. Blood samples were then drawn after 48–72 h and again, after at least 30 days after vaccination. A total of 13 immune outcomes were explored including cytokine, chemokine and immunoglobulin concentrations in serum. Seroconversion was measured by haemagglutinin inhibition and seroconversion by immunochemistry. Overall, no significant associations were observed between baseline concentrations of serum PFOS/PFOA with the outcomes explored. When interpreting these results, it is worth noting the FluMist generated a limited systemic response to the vaccination (only 9%, as measured by haemagglutinin inhibition and 25%, as measured by immunohistochemistry). This would mean that even if there is a true association between PFOS and/or PFOA and reduced antibody response to FluMist, such an association would be difficult to detect.
3.3.4.5.4. Infections
In the previously mentioned study by Granum et al. (2013) maternal concentrations of PFOS and PFOA were also examined in relation to common cold in the offspring that was assessed by parental report at ages 1, 2 and 3 years (n = 99). The authors observed a significant positive association between the total number of reported episodes of common cold in the offspring, up to 3 years of age (n = 99) and maternal PFOA, but not PFOS, after adjustment for potential confounders. For PFOA, a positive association with a number of reported episodes of gastroenteritis was also observed.
In a similarly designed but larger study, Dalsager et al. (2016) examined associations between maternal serum concentrations (median) for PFOS (8.1 ng/mL) and PFOA (1.7 ng/mL), among 649 mother–child pairs from Odense, Denmark. Maternal serum samples were drawn prior to week 16 of gestation and episodes of infection were recorded every 2 weeks over 12 months from birth, using mobile phone text messages (parental report). Both, the number of days and information on symptoms (grouped into 11 different categories) were recorded. Among the 649 participants, 354 reported symptoms, ranging from rare events such as blood in stools (n = 4) to temperature over 38.5 degrees (n = 283) and runny nose (n = 337). Maternal PFOS concentrations in the upper tertile (above 10.2 ng/mL) compared with the lowest (below 6.9 ng/mL) were significantly associated with increased proportion of days with fever (incidence rate‐ratio: 1.7 (95% CI: 1.2, 2.2), p‐trend = 0.001), while this was not the case for PFOA. An increased odds ratio of experiencing days with fever above the median was found for PFOS (OR: 2.4 (95% CI: 1.3, 4.1)) and for PFOA (OR: 2.00 (95% CI: 1.1, 3.6)). No associations were observed for coughing, nasal discharge, diarrhoea or vomiting.
At least two other studies have not found associations between maternal concentrations of PFASs and offspring propensity for infections. Fei et al. (2010a) examined in a subset of participants from the Danish National Birth Cohort (n = 1,400, 1996–2002), associations between maternal concentrations of PFOS and PFOA and risk of hospitalisation due to infectious diseases, up to 2008. Information on hospital admission was extracted from nationwide registries. Mean concentrations for PFOS and PFOA in maternal serum, drawn in gestation week 4–14, were 35 and 5.6 ng/mL, respectively. At the end of follow‐up 26% of the offspring had been hospitalised at least once. Offspring age at end of follow‐up ranged from 6 to 11 years. In this study, no associations were observed between maternal concentrations of PFOS and PFOA with offspring hospitalisation. The authors noted that they were only able to examine associations with resistance to infections in general, and the study was not designed to examine if prenatal exposure could predict occurrence of specific infections.
Okada et al. (2012) also found no association between second trimester maternal serum concentrations (median) of PFOS (5.2 ng/mL) and PFOA (1.3 ng/mL) and offspring otitis media (parental report) up to 18 months of age (n = 343).
3.3.4.5.5. Summary
Based on the studies reviewed above, there is not much evidence to suggest that PFOS or PFOA are associated with asthma and allergies in children and adults. This conclusion is based on the relatively weak designs of existing studies, which have mostly been cross‐sectional (Tao et al., 2008; Dong et al., 2013; Buser and Scinicariello, 2016; Stein et al., 2016a; Zhu et al., 2016) or comparing rates of asthma using simple group comparisons (Anderson‐Mahoney et al., 2008), making it difficult to draw any conclusions on causality. Results from studies focusing on developmental exposures to PFOS and PFOA and later allergies and/or asthma (Wang et al., 2011b; Okada et al., 2012, 2014; Ashley‐Martin et al., 2015) have been inconsistent. Based on these findings, there is little evidence to suggest that early life exposures to PFOS or PFOA are causally related to allergies or asthma in children.
In contrast to asthma and allergy, there is relatively strong evidence to suggest that serum concentration of PFOS and PFOA are adversely associated with antibody response, following vaccination reported in most (Grandjean et al., 2012; Granum et al., 2013; Looker et al., 2014; Kielsen et al., 2016) but not all (Stein et al., 2016b) studies conducted so far. As expected, stronger and more pronounced associations have been observed in children where the immune system is rapidly developing (Grandjean et al., 2012; Granum et al., 2013) compared to adults who frequently fail to seroconvert in these experiments (Looker et al., 2014; Stein et al., 2016b). In studies that have not used direct vaccination challenge, similar associations for PFOS and PFOA have been reported in early infancy as a result of prenatal exposure (Granum et al., 2013). Comparable, but more modest associations have also been observed cross‐sectionally in 12‐ to 19‐year‐old children (Stein et al., 2016a).
Whereas a decreased antibody response to vaccination may lead to reduced protection to the pathogen at which the vaccine is targeted, a decrement in responses may also imply a reduced functionality of the immune system in a broader sense. In terms of clinical relevance, two different studies have suggested that maternal PFOS and/or PFOA concentrations may result in increased propensity of infections in the offspring during the first months of life (Granum et al., 2013; Dalsager et al., 2016) but other studies found no association with infections (Fei et al., 2010a; Okada et al., 2012). This inconsistency may reflect the broad outcome definitions used in some of these studies as well as the difficulty of recording accurately symptoms and duration of infection using parental report. Although the study by Dalsager et al. (2016) was perhaps the most robust by recording symptoms and duration of infection every 2 weeks over the 12‐month follow‐up period, further replication is needed to confirm these findings.
As with all observational studies, findings of statistically significant associations are by no means evidence that the observed association is causal. However, the study by Grandjean et al. (2012) and later studies have a strong experimental component where antibody production is initiated through vaccination and the increase in antibody concentrations is then followed prospectively in relation to baseline concentrations of PFOS and PFOA. A potential confounder would, therefore, have to be (1) a determinant of antibody production initiated and (2) a determinant of exposure. For PFOS and PFOA dietary and other lifestyle predictors of exposures are, however, not well characterised. Main sources of confounding for many of the outcomes reviewed in this opinion are determinants of excretion that affect circulating concentrations of PFOS and PFOA, as well as of the outcome under consideration. These determinants of excretion include glomerular filtration rate, blood loss, faecal excretion and hemodilution. None of these factors appear likely to affect serum antibody concentrations. Confounding also appears unlikely, as similar associations with serum antibody concentrations, using the same vaccines, have been reported in both children (Grandjean et al., 2012) and adults (Kielsen et al., 2016), where physiological function and lifestyle should differ substantially. Although confounding in observational studies can never be fully excluded, the CONTAM Panel concludes that the association between PFOS and PFOA, with serum antibody concentrations, is likely to be causal.
3.3.4.6. Endocrine outcomes
3.3.4.6.1. Puberty, menopause and menstrual cycle
Lopez‐Espinosa et al. (2011) performed a cross‐sectional study in the US C8 cohort (drinking water contaminated with PFOA) on the association between PFOS and PFOA and delayed puberty in about 3,000 boys and 3,000 girls aged 8–18 years. Median PFOS and PFOA levels were 20.2 and 28.2 μg/L, respectively. In girls, age of puberty was based on a combination of menarche (by questionnaire) and serum oestradiol. In boys, it was based on serum testosterone. A number of potential confounders were adjusted for. Puberty in boys was estimated to have occurred significantly later (about 4–6 months) in the third and fourth quartile of PFOS compared to the first quartile. No association was found for PFOA. In girls, puberty had occurred significantly later (6–10 months) in the third and fourth quartiles of PFOS compared with the first quartile. For PFOA the point estimates for the upper three quartiles, was a delay of about 5 months compared with the first quartile.
The C8 cohort was also used to study the association between PFOS and PFOA and early menopause (Knox et al., 2011a). PFOS and PFOA levels were examined in 26,000 women aged 18–65 years. Median PFOS and PFOA levels were 16 and 23 μg/L in women 43–51 years, and 22 and 33 μg/L in women above 51 years. The study was restricted to about 18,000 non‐pregnant women who did not use birth control pills or hormone replacement therapy, and who had not had hysterectomy. Menopause (yes/no) was asked for, and serum oestradiol was determined. After adjustment for several potential confounders, the ORs of having experienced menopause were significantly higher in the upper four quintiles of PFOS and PFOA compared with the first quintile, e.g. 2.1 (1.6–2.8) in the fifth quintile of PFOS and 1.7 (1.3–2.3) in the fifth quintile of PFOA. Serum oestradiol was negatively associated with PFOS, but there was no association with PFOA levels. The authors considered reverse causation as a possible cause of the association between lower PFOS/PFOA at late menopause (loss of PFASs in menstrual blood), but that it could not explain the association with oestradiol.
For PFOA, Taylor et al. (2014) observed significantly higher risk (HR 1.4, 95% CI 1.1–1.8 for third vs first tertile) of early menopause among 20‐ to 65‐year‐old women from NHANES (1999–2010). No such association was observed for PFOS. The authors noted that their findings could be explained by reverse causation, which is also consistent with results from physiologically based pharmacokinetic models (Wong et al., 2014).
Lyngsø et al. (2014) examined the cross‐sectional association between serum concentrations of PFOS and PFOA (median: 8.0 and 1.5 ng/mL, respectively) with irregular menstrual cycles in 1,623 pregnant women from Greenland, Poland and Ukraine. Serum samples were drawn during the first trimester in pregnancy, and information on menstrual cycle characteristics in the period before pregnancy was retrospectively obtained through self‐reported questionnaires. Short and long cycles were defined as equal or less than 24 days and greater and equal than 32 days, respectively. There was a borderline significant association between PFOA and long menstrual cycle (OR: 1.8 (95% CI: 1.0, 3.3)). No significant association was observed for PFOS. Higher odds of long menstrual cycles would be consistent with lower rate of excretion of these compounds, making reverse causation a likely explanation.
Based on the few studies conducted so far there is little evidence to suggest that exposure to PFOS or PFOA are related to the development of puberty, menopause or menstrual cycle length.
3.3.4.6.2. Endometriosis
Louis et al. (2012) studied the association between PFOS and PFOA and endometriosis in a cross‐sectional study of 600 US women aged 18–44 years. Most of the women were seeking clinical care due to symptoms (operative sample, diagnosis by laparoscopy/laparotomy) but some of them (N = 127) constituted a population‐based sample (diagnosis by MRI). The geometric mean in the two sample levels were 6–7 μg/L for PFOS and 2–3 μg/L for PFOA. Odds ratios for endometriosis (per ln change of PFOS and PFOA; i.e. an increase by a factor of 2.7), adjusted for age and BMI in the operative sample were 1.4 (95% CI: 0.98–2.0) for PFOS and 1.9 (95% CI: 1.2–3.1) for PFOA. Adjusting also for parity reduced the ORs, but may represent over‐adjustment. In the smaller population sample, the ORs were similar with wider confidence intervals.
Campbell et al. (2016) examined cross‐sectionally the association between serum concentrations of PFOS and PFOA (means 16.3 and 3.5, respectively) with endometriosis in 753 women aged 20–50 years from NHANES (2003–2006). Log‐transformed PFOS and PFOA as continuous variables were not significantly associated with increased odds of endometriosis. However, when exposure was classified by quartiles there was a significant trend of increased risk with higher PFOS/PFOA, although the odds ratios did not increase monotonically.
Based on the results from these two cross‐sectional studies and in the absence of prospective studies, there is insufficient evidence that PFOS and PFOA is associated with endometriosis.
3.3.4.6.3. Thyroid function
Thyroid disease in adults and children
Emmett et al. (2006) examined the association between serum PFOA levels (median 354 and interquartile range 771 ng/mL) and self‐ or parent‐reported thyroid disease and TSH among 371 individuals aged 2–89 years, exposed via contaminated drinking water in the C8 area. No association was observed between PFOA and thyroid disease or TSH in analyses unadjusted for potential confounders.
In another study from the same area, 566 exposed residents recruited in 2003 had more often self‐reported ‘thyroid problems’ than expected using compared expected rates from NHANES 2001–2002 (Anderson‐Mahoney et al., 2008). However, the validity of this ecological comparison is uncertain for example due to selection bias.
Melzer et al. (2010) examined the association between serum levels of PFOS and PFOA and self‐reported physician‐diagnosed thyroid disease (ever, and current with medication, type unspecified) with or without medication in about 4,000 participants in NHANES surveys from 1999 to 2006. Thyroid disease was reported by 292 women and 69 men. Mean PFOS levels were 19 ng/mL in women and 25 ng/mL in men. For PFOA these levels were 3.8 and 4.9 μg/L. A number of potential confounders were taken into account. For women, the ORs for thyroid disease were elevated in the upper two quartiles of PFOA, while no such association was found for PFOS. ORs tended to be elevated also for men, but based on few cases. There was no information on whether the thyroid disease cases had been diagnosed as hyper‐ or hypothyroidism.
Lopez‐Espinosa et al. (2012) examined cross‐sectional associations between PFOS (median 29 ng/mL) and PFOA (20 ng/mL) with total T4 and TSH among about 12,000 children in the C8 cohort aged 1–17 years. A number of potential confounders were adjusted for. The OR for parent‐reported hypothyroidism (39 cases) increased with serum PFOA (OR 1.5, 95% CI: 1.0–2.4), but the OR for subclinical hypothyroidism (based on high TSH) was 1.0. Ln PFOS, but not PFOA was significantly associated with total T4 levels (~2% increase in the highest PFOS quartile).
Winquist and Steenland (2014a) examined the association between retrospectively estimated PFOA exposure and thyroid disease among about 32,000 subjects from the C8 cohort. Medical records were reviewed in participants who reported functional thyroid disease or medication for it in questionnaires administered 2008–2011, and 2000 validated cases of hyper‐ or hypothyroidism were used in the analyses. Median PFOA in 2005–2006 was 24 ng/mL. Previous exposure to PFOA (since 1952) was retrospectively estimated using quantified exposure in a subset of participants at recruitment, combined with data on area of residence and previous occupation (Shin et al., 2011a). Data were analysed retrospectively and prospectively by Cox regression. In the retrospective analyses there was a significant positive association between estimated exposure to PFOA and thyroid disease with a hazard ratio of about 1.3 when comparing the highest four quintiles of cumulative exposure with the lowest quintile. The point estimates were increased for hypo‐ as well as hyperthyroidism, although not significantly. The association was driven by women, and mainly by hyperthyroidism, and no association was observed for males. In the prospective analyses, based on fewer cases, cumulative PFOA levels tended to increase the risk of thyroid disease (hypothyroidism) among men, but not in women. For prospective analyses based only on measured PFOA levels in 2005–2006, there were no associations with thyroid disease. Using data from the 2007–2010 NHANES surveys with a total of 1,181 adults, Wen et al. (2013) examined cross‐sectional associations between PFOS (GM 14 ng/mL), and PFOA (GM 4.2 ng/mL) with free and total T3 and T4, TSH, and thyroglobulin. The authors then defined subclinical hypothyroidism and hyperthyroidism as TSH > 5.43 and TSH < 0.24 mlU/L, respectively. A threefold increase in serum PFOS concentration was associated with increased risk of subclinical hypothyroidism in females (OR: 3.0, 95% CI: 1.1–8.1, based on 9 cases) and males (OR: 2.0, 95% CI: 1.2–3.3, based on 15 cases). The same was true for PFOA in females (OR: 7.4, 95% CI: 1.1–48), but not for men. There was a positive association between log‐transformed PFOA and T3 in females, but no association with (log‐transformed) TSH, free T4 or free T3.
Thyroid hormones in adults
Olsen and Zobel (2007) examined cross‐sectional associations between serum PFOA levels and thyroid hormones in about 500 3M workers from three 3M plants in the US and Belgium. There was an overall inverse association between serum PFOA and free T4, but no association with total T3 or T4. There was also a tendency towards a positive association between PFOA and TSH.
Dallaire et al. (2009) studied cross‐sectional associations between PFOS and thyroid hormones in 621 Canadian Inuits with a mean serum PFOS of 18 ng/mL, adjusted for a several confounders. PFOS was correlated (r about 0.5) with many PCB congeners. There was a negative association between PFOS and TSH, a positive association with free T4 but a negative association with total T3 and TBG. The authors discussed if the reason could be a competition between PFOS and free T4 for transport proteins as found in rats.
Bloom et al. (2010) compared serum PFOS/PFOA levels, cross‐sectionally, with levels of thyroid hormones in 31 New York anglers. No significant associations were found.
Chan et al. (2011) performed a cross‐sectional study of pregnant (15–20 weeks) Canadian women subject to antenatal screening. Out of 974 maternal sera, the authors selected all (N = 96 ‘cases’) with normal TSH but low (< 10 percentile) free T4 and age‐matched controls (N = 175), among women with normal TSH and free T4 levels between the 50th and 90th percentiles. PFOS and PFOA were measured in these sera. Thus the a priori hypothesis was that PFOS/PFOA would cause hypothyroxinemia (still with normal TSH). Odds ratios (adjusted for potential confounders) for being a case at a threefold increase in PFOS/PFOA were 0.9 (95% CI 0.6–1.2) for PFOS and 0.9 (95% CI 0.7–1.2) for PFOA.
Knox et al. (2011b) examined associations between PFOS/PFOA and thyroid function (T4, T3 uptake, and TSH) in the C8 cohort. Analyses were based on 52 000 adults, without self‐reported prior thyroid disease. Mean PFOS and PFOA levels in women were 20 and 69 μg/L and 27 and 104 μg/L in men. When adjusting for a number of potential confounders, T4 levels increased across PFOS and PFOA quintiles, T3 uptake decreased across PFOS and PFOA quintiles, while TSH levels were unchanged. The differences between Q5 and Q1 were < 10%. Effects were slightly stronger in women than in men. No obvious threshold was seen and there was probably a slight but significant difference already between the first and second quintile. The combination of slightly increased thyroxin and unchanged TSH was interpreted as a likely increase of thyroxine‐binding globulin (TBG) in serum, which was not measured. Consistent with this hypothesis, serum albumin (which only binds a minor part of T4) was weakly, but significantly positively associated with PFOS and PFOA levels.
Ji et al. (2012) examined the association between serum concentrations of PFOS/PFOA and total T4 and TSH among 633 Koreans aged < 12 years. Median serum levels were 8.0 ng/mL for PFOS and 2.7 ng/mL for PFOA. A number of potential confounders were adjusted for. There were no associations between PFOS or PFOA and TSH or T4.
Jain (2013) examined associations between PFOS/PFOA and thyroid hormones in 1,540 individuals ≥ 12 years from the NHANES survey 2007–2008. Those with thyroid problems or medications, current pregnancy or missing variables had been removed. The mean serum PFOA was 4.1 ng/mL, and the mean serum PFOS level was not reported. A number of potential confounders were taken into account. TSH was higher in the upper tertile of serum PFOA, but not associated with serum PFOA as a continuous variable. PFOA was positively associated with total T3 but not with free T3 or free T4. There were no associations between serum PFOS and thyroid hormones.
The association between PFOS/PFOA and TSH was examined cross‐sectionally in 903 pregnant women (about 18th week of gestation) in the Norwegian Mother and Child cohort, MoBa (Wang et al., 2013b). About half of the women had been selected due to subfecundity. Those who reported previous thyroid disease were excluded. The GM of serum PFOS and PFOA were 13 and 2.1 ng/mL. Several potential confounders were adjusted for. There was a statistically significant association between serum PFOS and ln TSH, but the magnitude of association was limited. The risk of ‘high’ TSH (> 7.5 IU/mL) was not associated with serum PFOS. For serum PFOA no association was found.
Lin et al. (2013a) examined cross‐sectional associations between PFOS/PFOA and thyroid hormones (TSH, free T4) in 567 Taiwanese individuals aged 12–30 years. GM was 7.8 ng/mL for serum PFOS and 2.7 ng/mL for serum PFOA. A number of potential confounders were adjusted for. There were no significant associations between PFOS/PFOA and thyroid hormones.
Audet‐Delage et al. (2013) studied the hypothesis that PFOS binds to one of the circulating thyroid hormone binding proteins, TTR. In a cross‐sectional study of 120 Inuit women, the association between PFOS (GM 11 ng/mL) and TTR‐bound T4 was studied cross‐sectionally. No association with PFOS was shown.
Wang et al. (2014b) performed a cross‐sectional study of PFOS/PFOA and thyroid hormones (TSH, T3, T4 and free T4) in 285 pregnant mothers (third trimester) in Taiwan with no known thyroid disease, and thyroid hormones were also measured in cord blood in 116 of their neonates. The median maternal PFOS and PFOA were 13 and 2.4 ng/mL, respectively. Several potential confounders were adjusted for. There were no significant associations between PFOS/PFOA and maternal or cord blood thyroid hormones.
Shrestha et al. (2015) examined associations between PFOS (GM 32 ng/mL) and PFOA (GM 9.2 ng/mL) and thyroid hormones (TSH, T4, free T4, T3) in 87 US adults aged 55–74 without underlying thyroid disease. After adjustment for potential confounders (including PCB) there was a statistically significant association between serum PFOS and T4 and free T4.
Webster et al. (2014) examined associations between PFOS/PFOA levels and thyroid hormones in 152 pregnant (measured twice in early second trimester) Canadian non‐smoking women. The median serum PFOS and serum PFOA levels were 4.8 and 1.7 ng/mL. Analyses were adjusted for week of gestation and presence of TPO antibodies (positive in 14 women, indicating possible autoimmune thyroid disease). Overall there were no significant associations between PFOS/PFOA and thyroid hormones. However, in the 14 women with TPO antibodies there was a significant positive association between PFOS and PFOA levels and TSH (but not with free T4).
Lewis et al. (2015) studied associations between PFOS/PFOA and thyroid hormones (TSH, T4, free t4, T3, free T3) in 1,682 individuals 12–80 years enrolled in NHANES 2011–2012. Median serum PFOS and PFOA levels were 4–10 ng/mL (in various age groups) and 1.5–2.6 ng/mL (in various age groups) in adult females, 8–11 ng/mL (in various age groups) and 2.4–2.5 ng/mL (in various age groups) in adult males, and slightly lower in adolescents. There were no overall associations between PFOS/PFOA and thyroid hormones. In results stratified by sex and four age groups, there were a few significant findings for the most important hormones (TSH, free T4 and free T3): a positive association between PFOS and TSH in male adolescents, a negative association between PFOA and TSH in female adolescents, positive associations between PFOS and PFOA vs free T4 in women aged 20–39 years, and a positive association between PFOA and free T4 in female participants aged 60–80 years.
Berg et al. (2015) examined associations between PFOS/PFOA and thyroid hormones in 375 pregnant women in Norway. PFOS/PFOA were measured around gestation week 18, and thyroid hormones (TSH, free T4, T4, free T3, T3) as well as thyroid hormone binding proteins were measured in the same samples, and also 3 days and 6 weeks post‐partum. Median PFOS and PFOA levels were 8.0 and 1.5 ng/mL. Some potential confounders were adjusted for and also binding proteins in repeated measures analyses (mixed effects models). There was a positive association between PFOS and TSH, but no associations with the other hormones and no associations between PFOA and hormone levels.
Kato et al. (2016) studied associations between PFOS/PFOA and thyroid hormones in 392 Japanese mother–infant pairs in the Hokkaido study. Median maternal serum PFOS and PFOA levels (24–41 weeks of gestation) were 5.2 and 1.2 ng/mL. Thyroid hormones (FSH and free T4) were determined in mothers in early pregnancy (around week 11) and also in their infants at age 4–7 days. In models adjusted for potential confounders, there was an inverse association between maternal PFOS and maternal TSH, but not free T4, and there were no associations between PFOA and thyroid hormones. There was a significant positive association between maternal PFOS and infants’ TSH, but no other associations between PFOS/PFOA and infants’ thyroid hormones.
Webster et al. (2016) studied associations between PFOS/PFOA and thyroid hormones (TSH, T4, free T4, T3, free T3) in 1,525 adults from NHANES 2007–2008, excluding those with a history of thyroid disease. GM PFOS and PFOA levels were 14 and 4.2 ng/mL. Several confounders were adjusted for, and results were also stratified for presence of thyroid peroxidase antibodies (TPOab, present in 9%) and urinary iodine classified as low (< 100 μg/L) in 26%. In individuals with normal urinary iodine and no TPOab there was a slight (1%) increase in free T3 at an IQR increase of PFOA, but no association for the other hormones and null for PFOS. However, in 26 individuals with TPOab and low urinary iodine, there were positive associations between PFOS/PFOA and TSH, and free T3, and an inverse association with free T4 (PFOS only). The authors suggest that the results could support a ‘multiple hit’ hypothesis with those who have TPO antibodies and low urinary iodine (about 1% of the US population) being a sensitive group.
In a study of 157 mother–infant pairs, Yang et al. (2016) examined cross‐sectional associations between maternal concentrations of PFOS/PFOA and maternal and infant thyroid hormones (TSH, free T4, T4, free T3, T3). Median maternal serum PFOS and PFOA were 4.4 and 1.6 ng/mL, while cord serum levels were 1.2 ng/mL for PFOS and PFOA. In analyses adjusted for potential confounders, there was an inverse association between maternal PFOS and maternal TSH. There was also an inverse association between maternal PFOA and infant free T3 and between infant PFOS and infant free T3.
Thyroid hormones in newborns and children
de Cock et al. (2014b) examined the association between PFOS/PFOA in cord plasma with T4 levels in heel prick blood spots among 64 Dutch newborns (4–7 days old). Median PFOS and PFOA levels were 1.6 and 0.9 ng/mL. A number of potential confounders were adjusted for. No association with T4 was observed among boys, while T4 was significantly higher in the fourth quartile of PFOA concentrations among the girls.
As mentioned above, Wang et al. (2014b) found no significant associations between PFOS/PFOA in maternal serum and cord blood thyroid hormones.
Shah‐Kulkarni et al. (2016) examined associations between PFOS/PFOA and thyroid hormones (TSH, T4, T3) in cord blood of 279 newborns from Seoul, Korea. GM levels were 0.66 (PFOS) and 0.91 (PFOA) ng/mL. Several potential confounders were adjusted for. There were no significant associations between ln PFOS or PFOA and any of the cord blood thyroid hormones.
Kim et al. (2016) compared serum concentrations of PFOS/PFOA between 27 cases of infants with congenital hypothyroidism and 13 control infants. Concentrations of PFOA (median: 5.4 vs 2.1 ng/mL) were significantly higher in the cases compared to controls, while PFOS levels were similar (5.3 vs 4.1 ng/mL). There were no positive associations between PFOS/PFOA and thyroid antibodies. Maternal PFOS/PFOA levels were not available.
As mentioned above, Yang et al. (2016) found an inverse association between maternal PFOA and infant free T3 and between infant PFOS and infant free T3.
As mentioned above, Kato et al. (2016) found a significant positive association between maternal PFOS and infant TSH.
The above studies are summarised in Table 22.
Table 22.
Reports on associations between serum levels of PFOS and/or PFOA and thyroid disease of thyroid hormones
| Author | Population, country and number of subjects | Type | Serum PFOS/PFOA levels (ng/mL) | Findings | Comments |
|---|---|---|---|---|---|
| Thyroid disease | |||||
| Emmett et al. (2006) | C8, general pop, N = 371 | CS | High, mean PFOA 354 | PFOA vs thyroid disease and TSH: null | No confounding adjustment. Not informative |
| Anderson‐Mahoney et al. (2008) | C8, general pop, N = 566 | CS, ecological | No serum data | Self‐reported ‘thyroid problems’ more common than in NHANES | No confounding adjustment. Non‐informative ecological study |
| Melzer et al. (2010) | NHANES, USA, 4,000 | CS, L | PFOS 19 in women and 25 in men. PFOA 3.8 and 4.9 | PFOA: OR for thyroid disease + in women. PFOS: Null | Disease self‐reported. Adjusted for potential confounders |
| Lopez‐Espinosa et al. (2012) | C8, 12,000 children 1–17 years | CS, L | Median PFOS 29, median PFOA 20 | PFOA: OR for hypo‐thyroidism increased, but not OR for high TSH. PFOS vs T4+ | Few (39) cases. Adjusted for potential confounders |
| Winquist and Steenland (2014a) | C8, 32,000 (including 3,700 workers) | L |
Yearly historical serum PFOA modelled and calibrated vs measured levels. median PFOA 26 in 2005‐6 |
Thyroid disease (N = 2,000) vs modelled PFOA + in females (retrospective analyses), and (+) in males (prospective analyses) | Adjusted for potential confounders. Cases of thyroid disease validated in medical records |
| Wen et al. (2013) | NHANES, USA, 1,181 | CS |
PFOS: 14 PFOA: 4.2 |
PFOS vs hypothyroidism + in women and men PFOA vs hypothyroidism + and T3+ for women |
Adjusted for potential confounders. Few (24) cases. Diagnoses based on cut‐offs for TSH. Not consistent with results on continuous scale |
| Thyroid hormones | |||||
| Olsen and Zobel (2007) | Occup (3M), USA and Belgium, 506 | CS | Median PFOS 720, median PFOA 1100 | PFOA vs FT4−, and TSH (+). Results for PFOS not given | Adjusted for potential confounders |
| Dallaire et al. (2009) | Inuits, 621, Canada | CS | PFOS GM 18 | PFOS vs TSH−, FT4+ | Adjusted for potential confounders |
| Bloom et al. (2010) | NY anglers, 31 | CS |
PFOS GM 20 PFOA GM 1.3 |
Null | Too small study to be informative |
| Chan et al. (2011) | Pregnant women, Canada, 96 + 175 | CS, analysed as case–control |
PFOS GM 15 PFOA GM 3.2 |
Cases: high FT4, Controls: normal FT4, Both: normal TSH. No association btw PFOS or PFOA and case/ctrl status |
Matched + further adjustment for potential confounders |
| Knox et al. (2011b) | C8, adults, 520,000 | CS | PFOS mean in women 20 and 27 in men. PFOA 69 in women and 104 in men |
PFOS vs T4+, TSH null PFOA vs T4+, TSH null |
Adjusted for potential confounders. Authors’ interpretation: increase in TBG |
| Ji et al. (2012) | Adults, Korea, 633 | CS |
PFOS median 8.0 PFOA median 2.7 |
Null for TSH and T4 | Adjusted for potential confounders |
| Jain, 2013 | NHANES, USA, ≥ 12 years, 1,540 | CS | PFOA mean 4.1, PFOS not reported. |
PFOA vs TSH (+), T3+, but null for FT3, FT4. PFOS vs TSH (+) |
Adjusted for potential confounders |
| Wang et al. (2013b) | Pregnant women, Norway, 903 | CS |
PFOS GM 13 PFOA GM 2.1 |
PFOS vs TSH + PFOA: null |
Adjusted for potential confounders |
| Lin et al. (2013a) | Young individuals, Taiwan, 567 | CS |
GM PFOS 7.8 GM PFOA 2.7 |
PFOS vs TSH, FT4 null PFOA vs TSH, FT4 null |
Adjusted for potential confounders |
| Audet‐Delage et al. (2013) | Inuit women, Canada, 120 | CS | GM PFOS 11 | PFOS vs transthyretin‐bound T4 null | Adjusted for potential confounders |
| Wang et al. (2014b) | Pregnant women, 285 newborns, Taiwan, 116 | CS |
PFOS median 13 PFOA median 2.4 |
PFOS vs TSH, T3, T4, FT4: null PFOA vs TSH, T3, T4, FT4: null |
Adjusted for potential confounders |
| Shrestha et al. (2015) | Elderly, USA, 87 | CS |
PFOS: GM 32 PFOA: GM 9.2 |
PFOS vs FT4, T4+ PFOA vs T4 (+) |
Adjusted for potential confounders (also PCB) |
| Webster et al. (2014) | Pregnant women, Canada, 152 | CS |
PFOS median 4.8 PFOA median 1.7 |
Overall null. In 14 women with TPO antibodies PFOS and PFOA vs TSH+ | Adjusted for gestational week and TPO antibodies |
| Lewis et al. (2015) | NHANES, USA, 1682, results by age groups | CS |
PFOS: medians 4–11 PFOA: medians 1.5–2.6 |
Overall null. Some significant findings in subgroups by age and sex) |
Adjusted for potential confounders |
| Berg et al. (2015) | Pregnant women, Norway, 375 | CS, but repeated sampling |
PFOS: median 8.0 PFOA: median 1.5 |
PFOS vs TSH+, null for FT4, T4, FT3, T3. PFOA: null |
Hormones measured three times. Adjusted for some potential confounders |
| Kato et al. (2016) | Mother–infants pairs, Japan, 392 | CS |
PFOS median 5.2 PFOA median 1.2 |
Maternal PFOS vs mat. and infant TSH+ PFOA: null |
Adjusted for potential confounders |
| Webster et al. (2016) | Adults NHANES, USA, 1,525 | CS |
PFOS GM 14 PFOA GM 4.2 |
No TPOab and normal U‐I: PFOS vs FT3 + but null for TSH, T3, T4, FT4 and for PFOA. TPOab and low U‐I: Several sign. assoc for PFOS and PFOA |
Adjusted for potential confounders. 26 out of 1,525 had TPO antibodies and low U‐iodine |
| de Cock et al. (2014b) | Newborns, Netherlands, 64 | CS |
PFOS median 1.6 PFOA median 0.9 |
PFOS vs T4 (heel prick): null. PFOA vs T4 in girls + |
Adjusted for potential confounders |
| Shah‐Kulkarni et al. (2016) | Newborns, Korea, 279 | CS | PFOS GM 0.7 and PFOA 0.9 in cord blood | PFOS and PFOA vs TSH, T4, T3: null | Adjusted for potential confounders |
| Kim et al. (2016) | 27 cases of infants with congenital hypothyroidism, 13 controls | CS |
PFOS: Medians 5.3 and 4.1. PFOA: Medians 5.4 and 2.1 |
PFOA higher in cases. No associations btw PFOS or PFOA and antibodies | No confounding adjustment Maternal levels not available |
| Yang et al. (2016) | Mother–infant pairs, Beijing, 157 | CS |
PFOS: maternal 4.4, infant 1.2 PFOA: maternal 1.6, infant 1.2 |
Maternal PFOS vs maternal TSH: – Maternal PFOA vs Infant FT3: – Infant PFOS and infant FT3: – |
Adjusted for potential confounders |
CS: cross‐sectional (study); FT4: free T4; FT3: free T3; GM: geometric mean; L: longitudinal (study); N: number of subjects; PFOA: perfluorooctanoic acid; PFOS: perfluorooctane sulfonic acid; T3: triiodothyronine; T4: thyroxine; TPO: thyroid peroxidase; TSH: thyroid stimulating hormone. A ‘+’ sign denotes a positive association and a ‘‐’ denotes an inverse association.
Summary
In summary, four studies from the C8 cohort and two from NHANES studied thyroid disease. The study by Melzer et al. (2010) did not differentiate between hyper‐ and hypothyroidism, and the disease occurrence was self‐reported. The study by Wen et al. (2013) suggests that PFOS and PFOA may increase the risk of hypothyroidism, but it was cross‐sectional and based on few cases and not consistent with the overall result for thyroid hormones. Also, the C8 study by Winquist and Steenland (2014a) suggests that PFOA may increase the risk of thyroid disease, especially hypothyroidism in females, but there was no average increase in TSH (Knox et al., 2011b) in those without thyroid disease.
Associations between serum levels of PFOS and/or PFOA and thyroid hormones were analysed in twenty cross‐sectional studies (and transthyretin‐bound T4 in one study). Fourteen of them examined associations in adults only, three of them combined analyses in pregnant women with analyses in newborns, and three studies examined only outcomes in newborns. The most important biomarkers for assessment of thyroid function are TSH, free T4 and free T3, where T3 is the active hormone. Changes in free hormones are a result of changes in thyroid function, governed by pituitary‐derived TSH, while levels of total T4 and T3 also are affected by levels of thyroid binding proteins, and may therefore change without clinical implications for thyroid function. At normal pituitary function, TSH is the most sensitive marker of hypothyroidism and increases before lower levels of T4 or T3 are detected. Primary hyperthyroidism is accompanied by high levels of free and total T3 and T4, and also by an abnormally low TSH.
Most studies examined TSH levels. Only two of them (Wang et al., 2013b; Berg et al., 2015) found a significant positive overall association between PFOS and TSH. None of the studies showed an overall association with PFOA. In addition, there were some positive findings in subgroups. Eleven studies examined free T4. Positive associations were found only in two studies, Dallaire et al. (2009) in Inuits, and Shrestha et al. (2015), in a small group of elderly. One study (Olsen and Zobel, 2007) reported an inverse association between PFOA and free T4. Few studies examined free T3, and two of them (Kim et al., 2016; Yang et al., 2016) reported a possible association.
Therefore, overall, the studies do not support an association between PFOS/PFOA and changes in thyroid hormones. This is true also if only the large studies (> 500), with adjustment for potential confounders, in non‐occupationally exposed populations are considered (Dallaire et al., 2009; Knox et al., 2011b; Ji et al., 2012; Jain, 2013; Lin et al., 2013a; Wang et al., 2013b; Lewis et al., 2015; Webster et al., 2016). Neither are there any consistent associations between PFOS/PFOA in maternal or cord serum in six studies examining such associations.
The CONTAM Panel concluded that there is insufficient support for associations between PFOS or PFOA and thyroid disease or changes in thyroid hormones.
3.3.4.6.4. Duration of breastfeeding
In the light of findings from animal studies suggesting that PFOA might impair lactation (White et al., 2007, see also Section 3.3.3.3), these findings were followed up on in human observational settings where associations between concentrations of PFOS and PFOA in pregnancy has been examined as predictors of duration of breastfeeding.
Fei et al. (2010b) examined the association between maternal concentrations of PFOA (median 5.2 ng/mL) and PFOS (median 33 ng/mL) with duration of any breastfeeding and exclusive breastfeeding using Cox‐proportional hazard model, among 1,346 women from the Danish National Birth Cohort (1996–2002). Maternal serum samples were drawn between weeks 4 and 14 of gestation and information on duration of breastfeeding was extracted through telephone interviews at months 6 and 18 post‐partum. Overall, maternal PFOS and PFOA concentrations were significantly associated with shorter duration of any breastfeeding and exclusive breastfeeding. As an example, the hazard ratio for termination of exclusive breastfeeding was 1.37 (95% CI: 1.14, 1.64) in the fourth quartile of PFOS and 1.37 (95% CI: 1.12, 1.69) in the fourth quartile of PFOA (p for trend < 0.01 in both cases). However, when stratifying by parity, the association was only present among multiparous women (55% of the women, p for trend < 0.01 in all cases) while no association was observed among primiparous women (45% of the women, p for trend > 0.20 in all cases). One explanation of these inconsistent findings could be reverse causation. That is, longer lactation in previous pregnancy would lead to lower concentrations in the next pregnancy and women who with long duration of exclusive breastfeeding are likely to breastfeed their offspring in a similar manner in the next pregnancy.
Romano et al. (2016) also examined the association between maternal PFOS (median 5.5 ng/mL) and PFOA (13.9 ng/mL) concentrations among 336 US women from the HOME study (2003–2006). For most women (~90%) maternal serum samples were drawn around week 16 of gestation but if not available, serum samples drawn around week 26 of gestation were used. Women in the highest (> 7.6 ng/mL) compared to lowest quartile (< 3.8 ng/ml) of PFOA exposure had 1.77 (95% CI: 1.23, 2.54) and 1.41 (95% CI: 1.06, 1.87) higher relative risk of terminating any breastfeeding before 3 and 6 months, respectively. No clear differences were observed between primiparous (n = 43%) and multiparous (n = 57%) women in sensitivity analyses. However, the confidence intervals for the effect estimates were inflated in these stratified analyses, reflecting low statistical power making these analyses inconclusive.
Timmermann et al. (2017) examined associations between serum PFOS and PFOA concentrations and duration of breastfeeding by combining two Faroese birth cohorts formed in 1997–2000 and 2007–2009 with 640 and 490 pregnant women, respectively (n = 1,130 in total). Both cohorts relied on serum samples drawn in week 34–36 of gestation. Duration of breastfeeding was based on maternal report at 18 months in the 1997–2000 cohort. However, in the 2007–2009 cohort, duration of breastfeeding was assessed by maternal report 5 years post‐partum. In this combined data the median (25th to 75th percentile) for PFOS was 19.5 ng/mL (8.7–28.2) and for PFOA 2.4 ng/mL (1.5–3.6). A doubling of PFOS and PFOA levels was associated with shorter mean duration of breastfeeding of 1.4 (95% CI 0.6, 2.1) and 1.3 (95% CI 0.7, 1.9) months. The corresponding mean reduction in exclusive breastfeeding for PFOS and PFOS were 0.3 (95% CI: 0.1, 06) and 0.5 (95% CI: 0.3, 0.7) months per doubling of exposure, respectively. These associations were more pronounced among primiparous women.
Overall, the results of these three studies suggest that concentrations of both PFOS and PFOA may predict shorter duration of breastfeeding. Although examining length of breastfeeding may suggest problems with lactation it is an indirect measure. A more direct question capturing problems of establishing and maintaining milk supply would have provided better insight. In addition, since there is a well‐defined mechanism for reverse causation which is in line with the results by Fei et al. (2010b) and that the other large study by Timmerman relied partly on maternal report on breastfeeding several years later (5 years post‐partum), these three studies do not allow firm conclusions to be drawn on the link between exposure to PFOS and PFOA and duration of breastfeeding.
3.3.4.6.5. Semen quality and sex hormones
Joensen et al. (2009) examined the cross‐sectional association between serum concentrations of PFOS, PFOA with semen quality and sex hormones in a sample of 105 Danish men of around 19 years of age. Blood and semen samples were collected during clinical examination in 2003 when these men were reporting for military service. The mean serum PFOS and PFOA concentrations were 24.5 and 4.9 ng/mL, respectively. When these men were categorised according to high, medium or low exposure based on the sum of PFOS and PFOA concentrations, significantly lower semen quality (concentration and % normal sperm) were observed in the highest compared to lowest group of exposure. However, when looking at the association between PFOS and PFOA, individually no association with semen quality or sex hormones were observed. The strength of this study was that the men recruited were a representative sample of young men who did not have knowledge of their own fertility.
Results from later cross‐sectional studies, measuring semen quality by standard clinical procedures, have been null:
A similarly designed cross‐sectional study by Joensen et al. (2013) of 247 19‐year‐old Danish men reporting for military service found no association between concentrations (median) of PFOS (7.8 ng/mL) and PFOA (3.0 ng/mL) and semen quality. Serum PFOS concentrations were, however, inversely associated with testosterone, calculated free testosterone, and free androgen index. But with over 100 associations tested in their analyses the few significant associations reported may have been results of chance findings,
In a cross‐sectional study of 256 males who along with their partners were attending an in vitro fertilisation clinic, Raymer et al. (2012) reported no association between PFOS (median 6.4 ng/mL) or PFOA (1.3 ng/mL) and semen quality. In this study serum concentrations of PFOA were positively correlated with luteinising hormone.
In two cross‐sectional studies among 548 (Specht et al., 2012) and 588 (Toft et al., 2012) men from Greenland, Ukraine, and Poland (same study population), no consistent association was observed between serum concentrations of PFOS and PFOA (medians 18.4 and 3.8 ng/mL, respectively) and semen quality or reproductive hormones. The authors noted that there was an inverse association between PFOS exposure and sperm morphology but taken into consideration that a total of 50 statistical tests were performed, this association may have occurred simply by chance. In this population, Specht et al. (2012) examined associations between PFOS or PFOA with sperm DNA fragmentation, apoptosis or reproductive hormones. No consistent associations were observed.
Louis et al. (2015) examined the association between serum PFOS/PFOA concentrations (median: ~ 20 and 5 ng/mL, respectively) and semen quality among 501 male partners of couples from Texas and Michigan (US) who were discontinuing contraception. No consistent association between serum PFOS/PFOA concentrations and sperm quality were observed. Although some significant associations were observed (of varying direction) the number was not greater than expected from the around 70 different associations tested for in their analyses.
In summary, among adult males the overall evidence from these cross‐sectional studies does not support the hypothesis that serum PFOA and PFOS concentrations are predictors of semen quality or adverse changes in reproductive hormones.
3.3.4.7. Metabolic outcomes
3.3.4.7.1. Serum lipids
Several early studies of associations between occupational exposure to PFOS and/or PFOA and serum lipids (Ubel et al., 1980; Gilliland and Mandel, 1996; Olsen et al., 1999, 2000; Olsen and Zobel, 2007; Sakr et al., 2007a,b) were reviewed in the previous assessment (EFSA, 2008). It was concluded that some studies showed associations between PFOA and serum lipids but others did not. Mean or median levels of PFOS and PFOA were usually around or above 1,000 μg/L. Most of the studies were cross‐sectional. The largest one, in about 1,000 workers (Sakr et al., 2007a) and funded by DuPont, found a significant positive association between serum PFOA and serum cholesterol. The magnitude of the association was 4 mg/dL (about 2%) higher total cholesterol (TC) at an increase of serum PFOA with 1 μg/mL (1,000 μg/L) and somewhat stronger in participants not taking lipid‐lowering medication. A few studies had a longitudinal design. Olsen et al. (2003b), in collaboration with 3M, showed a significant association between change of serum PFOA and change of cholesterol (about 3% increase per increase of serum PFOA with 1 μg/mL) in 174 workers, but no such association for serum PFOS. Another longitudinal study, funded by DuPont, performed by Sakr et al. (2007b) found a significant positive association between serum PFOA and serum cholesterol in about 450 workers with repeated measurements of PFOA and cholesterol. The point estimate of the magnitude of the association was an increase of serum cholesterol with 1 mg/dL for each increase of serum PFOA with 1 μg/mL (1,000 μg/L). The two longitudinal studies had no information on use of lipid‐lowering medication. An early cross‐sectional study was performed by Emmett et al. (2006) in 371 residents exposed to high PFOA in drinking water (median serum PFOA 354 ng/mL). Potential confounders were not adjusted for. The correlation coefficient between serum PFOA and serum cholesterol was not statistically significant.
After 2007–2008 several studies have been performed in the general population. They are listed in Table 23 together with the studies reviewed by EFSA for the 2008 Opinion (EFSA, 2008).
Table 23.
Reports on associations between serum levels of PFOS and/or PFOA and serum levels of lipids
| Author | Population country and Number of subjects | Type | PFAS levels in ng/mL | Findings | Comments |
|---|---|---|---|---|---|
| Studies reviewed in EFSA, 2008 | |||||
| Ubel et al. (1980) | Occup (3M), USA, 57 | CS | High, 1,000–70,000 of organic F | Probably null | Incomplete presentation |
| Gilliland and Mandel (1996) | Occup (3M), USA, 115 | CS | High, mean serum fluorine 3,300 | Null | |
| Olsen et al. (1999) | Occup (3M), USA, 295 | CS | High, mean PFOS about 2,000 | Unclear, inconsistent | Incomplete presentation |
| Olsen et al. (2000) | Occup (3M), USA, 265 | CS | High, mean PFOA about 6,000 | Null | Incomplete presentation |
| Olsen et al. (2003b) | Occup (3M), USA and Belgium 518 (CS) and 174 (L) | CS + L | High, mean PFOS and PFOA about 1,000 |
CS: PFOS vs TC and TG + CS: PFOA vs TC and TG + L: PFOA vs TC and TG + PFOS: Null |
No info on lipid‐lowering medications |
| Olsen and Zobel (2007) | Occup (3M), USA and Belgium, 506 | CS | High, mean PFOS about 1,000, mean PFOA about 2,000 |
PFOA vs HDL − PFOA vs TG + |
|
| Sakr et al. (2007a) | Occup (DuPont), USA, 1,025 | CS | High, median PFOA 400 median 200 |
PFOA vs TC, LDL, VLDL + null for HDL and TG |
Info on lipid‐lowering medications available. When excluding those, betas increased (since older workers had more medications and higher PFOA) |
| Sakr et al. (2007b) |
Occup (DuPont), USA, 454 with > 2 measurements of PFOA |
L | High, mean PFOA about 1,000 |
PFOA vs TC + Null for LDL, HDL and TG |
Good longitudinal design and analyses. No info on lipid‐lowering medications |
| Emmett et al. (2006) | General pop exposed in C8 area, 371 | CS | High, mean PFOA 354 | Null | Crude statistics (correlation coefficient). No confounding control |
| Later studies | |||||
| Steenland et al. (2009) | C8, 46,000 adults | CS | Median PFOS 20 median PFOA 27 |
PFOS and PFOA vs TC, LDL and TG + Null for HDL |
Lipid lowering meds excluded. Associations shown also in the low deciles where slopes were steepest |
| Frisbee et al. (2010) |
C8, 12,500 children 1–18 years |
CS |
Mean PFOS 23 Mean PFOA 69 |
PFOS vs TC, LDL and HDL + PFOA vs TC, LDL and TG + |
Steeper slopes in the lower quintiles |
| Fletcher et al. (2013) | C8, 290 | CS |
GM PFOS 8.3 GM PFOA 41 |
PFOS and PFOA vs genes involved in transport or clearance of cholesterol + | Different genes for PFOS and PFOA, and the genes were not associated with cholesterol |
| Fitz‐Simon et al. (2013) | C8, 560 | L |
GM PFOS 10 ‐> 8 GM PFOA 75 ‐>31 |
Change in PFOS and PFOA vs change in TC and LDL + | Good longitudinal design. Lipid‐lowering meds excluded |
| Winquist and Steenland (2014b) | C8, 32,000 (28,500 from general pop + 3,700 workers at C8 plant) | L | Median PFOA in 2005: workers 113 and general pop 24. Modelled cumulative PFOA: 20 percentile 215 ng/mL*yr and 80 percentile 1,820 ng/mL*yr |
PFOA vs self‐reported hypercholesterolaemia in retrospective analyses + Null (close to inverse) in prospective analyses |
Retrospective analyses (mean 33 yrs) until 2005–2006. Prospective analyses (mean 4 yrs) from 2005–2006 until 2008–2011. Inverse relation btw PFOA and self‐reported coronary artery disease |
| Nelson et al. (2010) | NHANES, USA, 860 adults | CS |
Median PFOS 20 Median PFOA 3.8 |
PFOS and PFOA vs TC, non‐HDL and LDL (subgroup) + | Adjustment also for serum albumin did not affect results. Adjustment also for saturated fat |
| Château‐Degat et al. (2010) | Canada, Inuits, 723 | CS | GM PFOS 19 | PFOS vs TC (+), HDL +, non‐HDL +, LDL null, chol/HDL ratio − | |
| Lin et al. (2011) | Taiwan, 287 (12–30 years) | CS |
Median PFOS 8.9 Median PFOA 2.4 |
PFOS and PFOA vs TC, LDL, HDL, TG all null | |
| Fisher et al. (2013) | Canada CHMS, 2,700 | CS |
GM PFOS 8.4 GM PFOA 2.5 |
PFOS and PFOA vs TC (+) | |
| Wang et al. (2012) | China, 55 workers and 132 nearby residents | CS |
Median PFOS 33/34 Median PFOA 1630/280 |
PFOS:null for TC, LDL, HDL PFOA null apart for – for HDL in workers |
No information on lipid‐lowering drugs. Limited confounder adjustment |
| Eriksen et al. (2013) | Denmark DCH, 753 | CS |
Mean PFOS 36 Mean PFOA 7.1 |
PFOS vs TC + PFOA vs TC + |
Lipid‐lowering meds excluded. Adjustment also for intake of eggs and animal fat |
| Fu et al. (2014) | China, 133 | CS |
Median PFOS 1.5 Median PFOA 1.4 |
PFOS vs TC, LDL null PFOA vs TC, LDL + |
|
| Starling et al. (2014) | Norway, 891 (pregnant women) | CS |
Median PFOS 13 Median PFOA 2.3 |
PFOS vs TC +, HDL +, LDL (+), TG null PFOA vs TC, HDL, LDL, TG null |
Adjustment for serum albumin reduced betas by 15% |
| Geiger et al. (2014a) |
NHANES, USA, 815 (12–18 years) |
CS |
Mean PFOS 18 Mean PFOA 4.2 |
PFOS vs TC, LDL +, HDL and TG null PFOA vs TC, LDL +, HDL and TG null |
|
| Zeng et al. (2015) | Taiwan, 225 (14 years) | CS |
Median PFOS 29 Median PFOA 1.0 |
PFOS vs TC, LDL, TG +, HDL null PFOA vs TC, LDL, TG +, HDL null |
|
| Maisonet et al. (2015) | UK, 88–115. Exposure in pregnant women, outcome in children | L |
Median PFOS 20 Median PFOA 3.6 |
PFOS vs TC, LDL, HDL, TG: possibly nonlinear PFOA vs TC, LDL, HDL, TG: possibly nonlinear |
Difficult to interpret. Increasing at low levels and decreasing at high levels. serum lipids highest in second PFOA tertile |
| Skuladottir et al. (2015) |
Denmark, 854 (pregnant women) |
CS |
Mean PFOS 22 Mean PFOA 4.1 |
PFOS vs TC + PFOA vs TC + |
Adjustment for food groups (meat, vegetables, fish etc.) or saturated fat did not affect the results |
C8: study performed in the ‘C8’ area where drinking water was contaminated by PFOA from a DuPont plant; CHMS: Canadian Health Measures Survey; CS: cross‐sectional study; DCH: Diet Cancer and Health; GM: geometric mean; HDL: High density lipoprotein; L: longitudinal study; LDL: low‐density lipoprotein (cholesterol); N; number of subjects; Occup: occupationally exposed; TC: total cholesterol; TG: triglycerides; VLDL: very low‐density lipoprotein; yr: year.
A ‘+’ sign denotes a positive association, ‘(+)’ denotes a strong tendency or borderline statistical significance, and a ‘−’ denotes an inverse association.
In most of the studies, a number of potential confounders were adjusted for (usually age, sex, BMI, smoking, and often also some measure of SES and physical exercise, and sometimes use of lipid‐lowering drugs, use of alcohol, etc.).
Steenland et al. (2009) examined associations between PFOS and PFOA and serum lipids cross‐sectionally in the C8 cohort. The study included about 46,000 adults > 18 years of age not taking cholesterol‐lowering medications. Median PFOS and PFOA levels were 20 and 27 μg/L. Blood samples were delivered at any time of the day and were analysed for total and HDL cholesterol, and triglycerides. LDL cholesterol was estimated from total cholesterol, HDL cholesterol and triglycerides. A number of potential confounders were adjusted for. Total and LDL cholesterol, and triglycerides increased significantly by each decile of PFOS and PFOA, while no clear trend was found for HDL. The ratio total cholesterol/HDL also increased with increasing PFOS and PFOA. Although the magnitude of association was modest (about 4% increase in total cholesterol from the lowest deciles to the medians, corresponding to differences in PFOS and PFOA of about 15 μg/L), the OR of high cholesterol increased by 40–50% from the lowest to the highest quartiles of PFOS and PFOA, corresponding to an increase of PFOS with about 15 μg/L and PFOA with about 60 μg/L. Associations between total cholesterol and PFOS/PFOA remained statistically significant also after mutual adjustment, but with an attenuation of 20–30% (Steenland et al., 2009).
A similar cross‐sectional study of 12,500 children 1–18 (mean 11) years from the C8 cohort was reported by Frisbee et al. (2010). The mean PFOS and PFOA levels were 23 and 69 ng/mL. A number of potential confounders were adjusted for. Total, LDL and HDL cholesterol were positively associated with PFOS. Total and LDL cholesterol and triglycerides were positively associated with PFOA. The slopes were consistently steeper in the lower ends of serum PFOS and PFOA level distributions. Total and LDL cholesterol increased by 8.5 and 5.8 mg/dL from quintile 1 to quintile 5 of PFOS and by 4.6 and 3.8 mg/dL for PFOA. The ORs for abnormally high total and LDL cholesterol were increased in the fifth quintile of PFOS compared with the first quintile (Total: OR: 1.6, 95% CI: 1.4–1.9; LDL: 1.6, 95% CI: 1.3–1.9). For PFOA the corresponding ORs were 1.2, 95% CI: 1.1–1.4 and 1.4, 95% CI: 1.2–1.7).
A cross‐sectional study of associations between PFOS and PFOA and expression of a number of genes (from whole blood RNA) involved in cholesterol metabolism was performed in 290 individuals from the C8 cohort (Fletcher et al., 2013). The study was performed in 2010, 4–5 years after the baseline study and a number of potential confounders were taken into account. GM mean for PFOS was 8.3 μg/L and for PFOA 41 μg/L. Significant associations were found between PFOS/PFOA and the expression of several genes involved in transport and clearance of cholesterol. The associations were, however, different for PFOS and PFOA, and differed between men and women. There were no associations between the expression of these genes and levels of total cholesterol, LDL or HDL cholesterol.
A longitudinal study of changes in serum lipids and changes in serum PFOS and PFOA was performed in a subgroup of participants from the C8 study (Fitz‐Simon et al., 2013). These individuals had participated in the cross‐sectional C8 study in 2005–2006, and were followed up with new serum samples in 2010. Those who had reported taking lipid‐lowering drugs were excluded, leaving 560 participants for the study. During follow‐up, the GM PFOS fell from 19 to 8.2 μg/L and PFOA fell from 75 to 31 μg/L. The GM levels of serum lipids changed little during follow‐up. The authors examined associations between (log‐transformed) changes in serum lipids and (log‐transformed) changes in PFOS and PFOA within individuals, adjusted for a number of potential confounders at baseline and at follow‐up, also taking into account changes in these confounders from baseline to follow‐up. A 50% decrease in PFOS (a decrease of about 10 μg/L) was associated with a 3.2% (95% CI 1.6–4.8%) decrease in total cholesterol and a 5.0% (95% CI 2.5–7.4) decrease in LDL cholesterol. For a 50% decrease in PFOA, the corresponding decrease was 1.7% (95% CI 0.3–3.0%) for total cholesterol and 3.6% (95% CI 1.5–5.7%) for LDL cholesterol. In summary, this longitudinal study, although limited in size, provides relatively strong support for a positive causal association between serum PFOA and serum cholesterol.
Winquist and Steenland (2014b) performed a longitudinal study of associations between modelled PFOA exposure and self‐reported (questionnaire data) hypercholesterolaemia (with medication), coronary artery disease and hypertension in 28,500 participants in the C8 community cohort and 3,700 workers from the C8 plant. PFOA intake was modelled based on PFOA in drinking water, water consumption and other factors (Winquist et al., 2013). A pharmacokinetic model was then used to generate estimated yearly PFOA serum concentrations (Shin et al., 2011a). For the workers, serum PFOA levels were estimated from work histories and historical serum PFOA levels among employees (Woskie et al., 2012). Modelled serum PFOA levels were calibrated and validated against measured levels at baseline in 2005–2006 (Winquist et al., 2013), showing a Spearman correlation coefficient of 0.71. In the workers the median was 113 μg/L and in the general population 24 μg/L. Retrospective analyses of self‐reported disease (hypercholesterolaemia, coronary artery disease and hypertension) were performed from the age of 20 years (but not before 1,952 when the C8 plant started) through 2005–2006, and the median duration of follow‐up was 33 years. Prospective analyses were performed from the baseline survey (2005–2006) and until the follow‐up questionnaire (2008–2011); median duration of follow‐up 4.4 years. Self‐reported coronary artery disease was validated against medical records with good agreement. Hypercholesterolaemia and hypertension were not validated. A number of potential confounders were adjusted for, also allowing these confounders to vary over time. In the retrospective analyses of the combined data‐set the hazard ratios (HR) for hypercholesterolaemia were increased in quintiles (Q) 2–5 of modelled cumulative exposure (serum PFOA) when Q1 was used as reference, e.g. HR 1.24 (95% CI 1.15–1.33) in Q2 and 1.19 (95% CI 1.12–1.28) in Q5. Analyses based on yearly PFOA levels (i.e. serum PFOA in the year of diagnosis) gave similar results. To some extent this was the case also for retrospective analyses of the community cohort only, but in Q4 and Q5 the HRs were just below 1.1 and not statistically significant from zero. Prospective analyses (from 2005–2006 to 2008–2011) showed no positive associations with serum PFOA levels. HRs for Q2–Q5 were all below 1.0 and for Q5 (HR about 0.85) even the upper 95% confidence limit was below 1.0. There were no positive associations between modelled PFOA levels (cumulative or yearly) and self‐reported coronary heart disease or hypertension, in retrospective or prospective analyses. In the prospective analyses for coronary heart disease the point estimates for HRs for Q2–Q5 were around 0.7 and for Q2, Q3, and Q5, the upper 95% CL was below 1.0. In summary, retrospective analyses show significant positive associations between long‐term estimated serum PFOA levels and self‐reported high cholesterol levels with medication. The prospective analyses show, however, rather an inverse association. The prospective analyses should have higher quality, but the power is lower. The retrospective analyses will be much influenced by individuals entering the cohort early and by the years with highest PFOA levels (about 1995–2007). If PFOA levels are causally related to hypercholesterolaemia, it is puzzling that the association between estimated serum PFOA and coronary artery disease tends to be inverse. Taken together this large longitudinal study does not provide convincing evidence for a causal association between serum PFOA and increased serum cholesterol.
A cross‐sectional study of the association between PFOS and PFOA and cholesterol, body weight and insulin resistance was performed in 860 adults 20–80 years of age, not taking cholesterol‐lowering medication, from NHANES 2003–2004 (Nelson et al., 2010). Median serum PFOS and PFOA levels were 20 μg/L and 3.8 μg/L. Total cholesterol (TC) and non‐HDL cholesterol (total minus HDL) in serum were determined in all participants and LDL cholesterol in half of them. A number of potential confounders were adjusted for. TC was about 7% higher (13 mg/dL higher) in the fourth quartile (Q4) of PFOS than in the first quartile (Q1); the difference in PFOS between Q4 and Q1 was 27 μg/L. The result for non‐HDL cholesterol and LDL showed similar results, but for LDL the association was not statistically significant. There were significant associations with TC and non‐HDL also for PFOA, with somewhat smaller differences in blood lipids between Q4 and Q1 (borderline significance), but much stronger slopes in linear regression models. An increase of PFOA with 5 μg/L (the approximate difference between Q4 and Q1) corresponded to an increase of TC with 6 mg/dL.
Château‐Degat et al. (2010) examined the association between PFOS and blood lipids cross‐sectionally in 723 adults (mean age 37 years) of Inuit origin in Nunavik, Northern Quebec. The geometric mean PFOS level was 19 μg/L. In models (with PFOS in quartiles) adjusted for age, sex BMI and smoking, there was a significant positive association between PFOS and TC, and HDL. The ratio TC/HDL was negatively associated with PFOS. In models further adjusted for other potential confounders (varying between lipid outcomes) such as lipid‐lowering drugs, and n‐3 PUFAs, a positive association remained for HDL, but was not statistically significant for TC (p = 0.09). The negative association with TC/HDL ratio remained statistically significant.
Lin et al. (2011) studied the association between PFOS and PFOA and various metabolic outcomes: glucose homoeostasis (plasma glucose, serum insulin, HOMA‐IR), blood lipids (HDL, LDL, total cholesterol, triglycerides), serum CRP, and adiponectin in a cross‐sectional study of 287 young people from Taiwan, who had been subject to a mass urine screening. Most of them were in the age range 20–30 years and the median PFOS and PFOA levels were 8.9 and 2.4 μg/L. No significant associations were found between PFOS or PFOA and the metabolic biomarkers in adjusted models including a number of potential confounders.
Wang et al. (2012) performed a cross‐sectional study of associations between serum PFOS/PFOA and blood lipids in 55 male workers at a fluorochemical plant and 132 nearby residents in China. The median PFOS and PFOA levels were 33 and 1,600 ng/mL in the workers, and 34 and 280 ng/mL in the nearby residents. The authors also examined liver enzymes (see Section 3.3.4.7.2) and micro‐RNA. Analyses were adjusted for age and BMI, since they found smoking and alcohol habits not to be associated with blood lipids. No associations were found between PFOS/PFOA and blood lipids, with the exception of a slight inverse association between ln serum PFOA and HDL.
Fisher et al. (2013) examined associations between PFOS and PFOA and plasma lipids, glucose homoeostasis, and metabolic syndrome in 2,700 fasting participants aged 18–74 years in the national Canadian Health Measures Survey (CHMS). The GM PFOS and PFOA levels were 8.4 and 2.5 μg/L, increasing with age, and male sex. In analyses adjusted for these factors and a number of other potential confounders, there were no associations between PFOS or PFOA and glucose homoeostasis or metabolic syndrome. For plasma lipids, there were weak non‐significant associations between PFOS/PFOA and cholesterol. The OR for high cholesterol was 1.4 (0.9–2.1) in the highest quartile of PFOS with Q1 as reference, and 1.5 (0.9–2.6) in the highest quartile of PFOA.
Eriksen et al. (2013) performed a cross‐sectional study of the association between whole blood lipids and PFOS and PFOA in plasma in samples collected in 1993–1997 in 753 individuals, aged 50–65 years, from the Danish Cancer and Health cohort. These individuals were originally random controls to cases diagnosed with certain types of cancer and most of them were men. A number of potential confounders were adjusted for. Mean PFOS and PFOA levels were 36 and 7 μg/L. Total cholesterol was significantly associated with PFOS and PFOA, about 4–5 mg/dL (2%) higher per interquartile range (about 5 μg/L for PFOS and about 4 μg/L for PFOA).
Fu et al. (2014) performed a small (N = 133) cross‐sectional study of the association between PFOS and PFOA and blood lipids in a Chinese sample aged 0–80 (mean 30) years, coming for a health check‐up. Analyses were adjusted for age, gender and BMI, but there was no information on use of lipid‐lowering medications. The median PFOS and PFOA levels were low: 1.5 and 1.4 μg/L. There was a statistically significant association between total cholesterol and LDL and PFOA, but not for PFOS.
In a cross‐sectional study of 891 pregnant women, Starling et al. (2014) studied the association between PFOS and PFOA and blood lipids. A number of potential confounders were adjusted for. Mean PFOS and PFOA levels were 13 and 2.3 μg/L. Total cholesterol was significantly associated with PFOS, about 4 mg/dL (2%) higher per interquartile range (about 6 μg/L). There was no significant association with PFOA. There was also a significant association between ln‐transformed PFOS and total cholesterol, indicating a less steep slope at higher PFOS levels. There was also a significant positive association between PFOS and HDL, and a borderline association with LDL, of the same relative magnitude as for total cholesterol. Point estimates for the association between blood lipids and PFOA were positive but far from statistically significant. In this study also serum albumin levels were available. Associations between PFOS and HDL were attenuated (about 15%) when serum albumin was added to the models, but associations were still significant.
Geiger et al. (2014a) performed a cross‐sectional study of the association between PFOS/PFOA and serum lipids in 815 adolescents (12–18 years) from the NHANES surveys 1999–2008. The mean PFOS and PFOA levels were 18 and 4.2 ng/mL. A number of potential confounders were adjusted for. Total and LDL cholesterol levels were positively associated with PFOS and PFOA, when tertile 3 was compared with tertile 1 and when ln PFOS/PFOA were entered in adjusted models as continuous variables. Moreover, the adjusted odds ratios for abnormally high total and LDL cholesterol in youth were increased in the upper tertiles of PFOS (OR 1.5, 95% CI 1.1–2.2 and OR 1.8, 95% CI 1.1–2.8) and PFOA (OR 1.5, 95% CI 1.1–2.1 and OR 1.6, 95% CI 1.0–2.5) compared with the first tertiles.
Zeng et al. (2015) performed a cross‐sectional study of the associations between PFOS and PFOA and blood lipids among 225 healthy school children aged 12–15 years in Taiwan. Median PFOS and PFOA levels were 29 and 1.0 ng/mL, respectively. A number of potential confounders were adjusted for. There were significant positive associations between PFOS and PFOA on the one hand and total and LDL cholesterol and triglycerides on the other, while there were no significant associations with HDL. Total cholesterol was 22 mg/dL higher in the upper quartile (median 62 ng/mL) compared with the lower quartile (median 8.4 ng/mL). For PFOA, the shape of the association was difficult to interpret. An increase of ln PFOA with one unit (about threefold increase) was associated with 5–7 mg/dL increase in TC and LDL, but the analyses per quartile indicated that the association was due to blood lipids in the upper PFOA quartile (median 2 ng/mL).
The ALSPAC cohort referred to regarding developmental outcomes (see Section 3.3.4.3) was also used by Maisonet et al. (2015), to study the association between prenatal serum levels of PFOS/PFOA and blood lipids in girls at 7 (n = 115) and 15 (n = 87) years of age. Some covariates were adjusted for. No consistent tendencies were found for PFOS, while blood lipids were highest in children born to mothers in the second PFOA tertile, indicating a nonlinear relation. Moreover, within the lowest PFOA tertile, there were significant associations between prenatal PFOA and total and LDL cholesterol.
Skuladottir et al. (2015) examined, in a cross‐sectional study, associations between serum PFOS and PFOA and total cholesterol in 854 Danish pregnant women. The mean PFOS and PFOA levels were 22 and 4.1 ng/mL. A number of potential confounders were adjusted for, also intake per day of major food groups (meat and meat products, dairy products, fish, vegetables, fruits and cereals) as well as saturated fat. There was a positive association between intake of meat and PFOS/PFOA, and a negative association between intake of vegetables and PFOS/PFOA but no such associations with cholesterol. For saturated fat, however, there was a positive association with PFOS (but not PFOA) as well as with cholesterol. However, when food groups or saturated fat were included in regression models, the positive associations between PFOS/PFOA and cholesterol remained essentially unchanged.
Summary
In summary, there are 26 studies (in 16 cohorts) published on associations between PFOS and/or PFOA and serum lipids. Sixteen studies in the general population have been published after the previous EFSA assessment (EFSA, 2008). Most of them (Steenland et al., 2009; Frisbee et al., 2010; Nelson et al., 2010; Eriksen et al., 2013; Fitz‐Simon et al., 2013; Fu et al., 2014; Geiger et al., 2014a; Starling et al., 2014; Skuladottir et al., 2015; Zeng et al., 2015) show significant positive associations between PFOS and/or PFOA and total cholesterol, and results for LDL cholesterol (fewer studies) are similar while associations for HDL were usually null. Some show tendencies towards positive associations or the results are difficult to interpret. Only two of these studies (Lin et al., 2011; Wang et al., 2012) show clear null results.
The authors of the cross‐sectional studies have usually been cautious when discussing their results, noting that the results do not prove causality. In almost all of the papers cited above, the authors have noted that the findings in humans are not consistent with the results in experimental animals, showing a PPARa‐mediated decrease in serum lipids after administration of PFOS or PFOA (at high dose). Potential mechanisms for the opposite findings in humans have been discussed only in vague terms.
The large study by Steenland et al. (2009) was commented on in a paper by Kerger et al. (2011). These authors noted that although there was a significant dose–response relationship between PFOS/PFOA and total cholesterol, other criteria used to help assessing causality were not fulfilled. The authors were concerned that complex relations between PFOS/PFOA and factors having a very strong association with cholesterol (such as BMI, age, and menopause status) might bias the dose response and that the lowest decile of C8 may not be the most appropriate reference stratum.
Several explanations, other than a causal effect of PFOS/PFOA, for the positive associations between PFOS/PFOA and increased serum lipids have been discussed.
First, there is the possibility that PFOS/PFOA bind to serum lipoproteins (see Toxicokinetics Section 3.3.1.2). Then increasing serum lipids could result in higher levels of PFOS/PFOA, i.e. a case of ‘reverse causation’. Binding of PFOS/PFOA to serum proteins or lipoproteins have been investigated in two studies. Han et al. (2003) found that > 90% of PFOA in serum was bound to serum albumin, in rats as well as in humans. Butenhoff et al. (2012a) confirmed that albumin would bind more PFOS and PFOA than would lipoprotein fractions. The authors then examined binding of PFOS and PFOA in a single human plasma sample (from a blood donor, total serum PFOS 25 ng/mL and PFOA 9 ng/mL) in various plasma and lipoprotein fractions. The largest parts of PFOS and PFOA were found in the plasma fraction depleted of lipoproteins but containing albumin. Using density gradient ultracentrifugation, the authors found that < 5% of PFOS was found in lipoprotein fractions (0.8% in LDL, 3.3% in HDL), but when spiking the sample with PFOS at 8,000 ng/mL, 8.5% was bound to lipoprotein fractions (1.8% in LDL and 4.4% in HDL). For PFOA the binding was lower, probably ≤ 1%. Irrespective of whether e.g. 10% or 1% of PFOS/PFOA are bound to the plasma lipoprotein fractions, changes in plasma PFOS/PFOA will only occur if a change in cholesterol causes a change of the distribution of PFOS/PFOA between plasma and non‐plasma compartments (e.g. liver, kidney). If only the distribution within the plasma compartment changes, e.g. if an increase in cholesterol increases the fraction of PFOS/PFOA bound to cholesterol, but decreases the fraction bound to albumin, then the total plasma concentration of PFOS/PFOA will be unchanged, and there will be no ‘reverse causation’. If an increase in cholesterol will indeed increase the size of the plasma PFOS/PFOA compartment (relative to other body pools), it could potentially be important, but the slopes between PFOS/PFOA and cholesterol, would not be compatible with the empirical results. For example, if 10% of plasma PFOS/PFOA is bound to cholesterol, then a 10% increase of total cholesterol would cause a 1% increase of plasma PFOS/PFOA – and the slope in a regression with cholesterol as the dependent variable would be extremely steep (10% increase in cholesterol at 1% increase in plasma PFOS/PFOA, and a 100% increase at a 10% increase in plasma PFOS/PFOA). And if only 1% of PFOS/PFOA is bound to cholesterol, the slopes would be even more extreme. The slopes in the studies cited above are completely different. For example, in the study by Nelson et al. (2010), an increase of PFOS from about 10 ng/mL in quartile 1 to 40 ng/mL in quartile 4 (an increase by 400%) was associated with an increase of total cholesterol by only 14 mg/dL (about 7%). In the longitudinal study by Fitz‐Simon et al. (2013), a 50% decrease in PFOS (a decrease of about 10 μg/L) was associated with only a 3.2% (95% CI 1.6–4.8%) decrease in total cholesterol. Regarding albumin, this is not much of an issue, since serum albumin has not been used as a dependent variable at PFOS/PFOA exposure. Nelson et al. (2010) adjusted for albumin and found that the associations between PFOS/PFOA and serum lipids remained similar. Starling et al. (2014) did the same, and found that the associations were only slightly attenuated. Thus the data available on PFOS/PFOA binding to plasma lipids and other compartments indicate that ‘reverse causation’ is very unlikely to explain the relatively consistent reports on associations between PFOS/PFOA and blood lipids.
A second possible non‐causal explanation is confounding. Diet could be a confounder if a diet rich in items, which increase serum cholesterol is also rich in PFOS/PFOA. Intake of saturated or animal fat was, however, adjusted for in several studies (Nelson et al., 2010; Eriksen et al., 2013; Skuladottir et al., 2015) where positive associations were found between PFOS/PFOA and serum lipids. The study by Skuladottir et al. (2015) also examined the impact of major food groups without finding that dietary habits would affect the results. Thus it seems unlikely that associations between PFOS/PFOA and plasma lipids are due to confounding by saturated fat or other common dietary items.
Another potential source of confounding could be related to intestinal reabsorption of PFOS/PFOA. As has been described in the Section on toxicokinetics (Section 3.3.1.2), PFOS/PFOA are excreted in bile, but to a high extent (according to one study 97% for PFOS and 89% for PFOA) reabsorbed in the intestine. Nevertheless, clearance by this route may be as important as by renal excretion. Factors which decrease reabsorption will lead to a lower body burden of PFOS/PFOA. If such factors also are associated with lower cholesterol there will be confounding. Such confounding has, however, not been documented.
Finally, there is the possibility of confounding by other environmental factors, which covary with intake of PFOS/PFOA and also increase serum lipids. No such factors have however been demonstrated.
In conclusion, the opinion by the CONTAM Panel is that it is likely that associations between serum PFOS and PFOA levels and serum cholesterol are causal, i.e. that increased levels of PFOS and PFOA cause increased levels of serum cholesterol. For the PFOA association, there is no further increase above a serum level of about 25 ng/mL. Increased serum cholesterol, especially the LDL fraction, is associated with increased cardiovascular risk, also in the ‘normal range’ (cholesterol levels of 5–6 mmol/L, 190–230 mg/dL) (Lewington et al., 2007; Piepoli et al., 2016) in prospective observational studies. Also, treatment with cholesterol‐lowering drugs decreases cardiovascular risk (Mihaylova et al., 2012; Piepoli et al., 2016). For example, a 5% increase in total cholesterol will increase the risk of cardiovascular disease by at least 5%, which is a clinically relevant risk.
3.3.4.7.2. Liver
Some early studies of associations between occupational exposure to PFOS and/or PFOA and possible effects on liver (Olsen et al., 2003b; Sakr et al., 2007a,b) and a small community study (Emmett et al., 2006) were available when the previous assessment was performed by EFSA (EFSA, 2008), but this outcome was not specifically commented on.
Olsen et al. (2003b) examined the association between serum PFOS and PFOA and serum liver function tests in a cross‐sectional study of 518 3M employees in Belgium and USA. Mean PFOS and PFOA levels were about 1,000 ng/mL (given as 1 ppm). In unadjusted analyses, levels of ALT and gamma glutamyl transferase (GGT) were significantly higher in quartile 4 vs quartile 1 (adjusted analyses not presented). Adjusted logistic regression analyses were performed on the number of individuals with liver function tests above the reference range. Point estimates for the odds ratios of abnormal ALT was 2.1 (95% CI 0.6–7.3) and for GGT it was 2.0 (95% CI 0.7–5.8).
Emmett et al. (2006) studied the association between serum PFOA in a cross‐sectional study of 371 residents exposed to high PFOA in drinking water (median serum PFOA 354 ng/mL) in the C8 area. Potential confounders were not adjusted for. The regression coefficients for serum liver function tests vs serum PFOA were not statistically significant.
Sakr et al. (2007a) studied the association between serum PFOA and serum liver function tests in about 1,000 workers at DuPont with a median serum PFOA of about 400 ng/mL (0.4 ppm). In confounder‐adjusted analyses, there was a significant association between serum PFOA and GGT, and a tendency towards an association also with AST and ALT, but not bilirubin. The magnitude of association was small: liver enzymes were log‐transformed and GGT increased by 5% per increase of serum PFOA by 1,000 ng/mL.
Sakr et al. (2007b) also performed a smaller longitudinal study in about 450 workers with repeated measurements of PFOA and liver function tests. There was a significant positive association between serum PFOA and ALT and an inverse relation between serum PFOA and total bilirubin. The magnitude of the associations was small; an increase of serum ALT with 1–2% per increase of serum PFOA with 1,000 ng/mL. No association was found for AST, GGT or alkaline phosphatase (ALP).
From 2008 and onwards, further studies in the general population have been published.
A cross‐sectional ecological study of health status in a sample of inhabitants in the C8 area was reported by Anderson‐Mahoney et al. (2008). Prevalences of self‐reported symptoms and diseases were compared with prevalences in NHANES 2001–2002, taking age and gender into account. Prevalence ratios were not found to be increased for ‘liver problems’.
Associations between PFOS and PFOA and biomarkers of liver function were examined by Gallo et al. (2012) in a cross‐sectional study of 47,000 adults in the C8 cohort. Median (IQR) PFOS and PFOA levels were 20 (14–29) and 28 (14–71) μg/L. In multivariable models, ALT was weakly but significantly associated with PFOS and PFOA, while no consistent results were found for GGT or direct bilirubin. The magnitude of association for ALT was about 2% increase in ALT at an IQR increase of PFOS or PFOA. The OR for high ALT (about 11% of the population) was 1.25 (95% CI 1.1–1.4) in the highest decile of PFOS and 1.5 (1.3–1.8) in the highest decile of PFOA when decile 1 was used as a reference.
Lin et al. (2010) examined associations between PFOS and PFOA and liver function tests (ALT, GGT and total bilirubin) in 2,200 adults from NHANES surveys 1999–2004. The mean serum PFOS was 25 ng/mL and for serum PFOA it was 4.6 ng/mL. In adjusted models, there were significant positive associations between ln serum PFOA and serum levels of ALT and GGT, but not bilirubin. For PFOS, there was a borderline positive association with ALT only. The magnitude of the association indicated an increase of serum ALT with about 5% and serum GGT with about 2% at a doubling of serum PFOA.
Darrow et al. (2016) performed a longitudinal study of associations between modelled historical PFOA exposure and biomarkers of liver injury in 28,800 participants in the C8 community cohort and 1,900 workers from the C8 plant examined in 2005–2006. PFOA intake was modelled based on PFOA in drinking water, water consumption and other factors (Winquist et al., 2013). A pharmacokinetic model was then used to generate estimated yearly PFOA serum concentrations, including 2005–2006 when liver function tests were performed (Shin et al., 2011a). For the workers, serum PFOA levels were estimated from work histories and historical serum PFOA levels among employees (Woskie et al., 2012). Modelled serum PFOA levels were calibrated and validated against levels measured in a subgroup in 2005–2006 (Winquist et al., 2013), showing a Spearman correlation coefficient of 0.71. The median PFOA in 2005–2006 was 17 ng/mL (93 among ever C8 workers and 15 among never C8‐workers). Retrospective analyses of self‐reported, but medically validated, liver disease were performed from the age of 20 years (but not before 1952 when the C8 plant started) through 2008–2011, and the median duration of follow‐up was 33 years. The survival analysis of liver disease was performed in a somewhat larger group (31,600, including 3,700 workers). There was a significant positive association between serum ALT in 2005–2006 and modelled cumulative PFOA levels or modelled serum PFOA for 2005–2006. There were significant negative associations between serum direct bilirubin and modelled PFOA levels. There was no association with GGT. There was a 6% increase in ALT in the fifth quintile of ALT compared with the first quintile using modelled cumulative exposure and 5% using modelled serum PFOA in 2005–2006. The odds ratios for serum ALT above normal were significantly increased in quintiles 2–4 of cumulative exposure, highest in quintile 4 (OR 1.20, 95% CI: 1.06–1.35). Associations were weaker for modelled serum PFOA in 2005–2006, but mostly statistically significant. There were no significant associations between modelled serum PFOA and liver disease, in fact point estimates of hazard ratios for quintile 5 were below 1, for example 0.87 (0.6–1.3) for enlarged liver, fatty liver or liver cirrhosis (427 cases in the total cohort).
Wang et al. (2012) examined associations between PFOS/PFOA and liver enzymes in a sample of Chinese workers and residents (see Section 3.3.4.7.1 on serum lipids), finding essentially null results.
Gleason et al. (2015) studied associations between serum PFOS/PFOA and serum levels of liver function biomarkers (ALT, AST, GGT and ALP) in a cross‐sectional study of about 4,300 individuals from NHANES surveys 2007–2010. The median levels of PFOS and PFOA were 11 ng/mL and 3.7 ng/mL. A number of potential confounders were adjusted for. Significant positive associations were found between serum PFOA and ln‐transformed levels of ALT, AST, GGT and bilirubin, and the results were similar when calculating odds ratios of having a liver function biomarker higher than the 75th percentile of levels in the NHANES surveys. The magnitude of the association corresponded to an increase of liver function biomarkers with 2–4% at a doubling of serum PFOA. For serum PFOS, the only statistically significant association was with total bilirubin.
Rantakokko et al. (2015) studied serum PFOS and PFOA levels in extremely obese subjects undergoing bariatric surgery. There were some inverse associations between PFASs levels and grade of histologic inflammation in the liver. No association was found between PFOS or PFOA and liver enzymes 12 months after surgery.
The above studies are summarised in Table 24.
Table 24.
Reports on associations between serum levels of PFOS and/or PFOA and liver disease or serum markers of liver function
| Author | Population, country and N | Type | Serum PFAS levels in ng/mL) | Findings | Comments |
|---|---|---|---|---|---|
| Olsen et al. (2003b) | Occup (3M), USA and Belgium 518 | CS | Mean PFOS and PFOA about 1,000 |
PFOS and PFOA vs ALT and ALP in males + (unadjusted). GGT and total bilirubin – Abnormal ALT and GGT (+) ALP null |
Alcohol habits differed in USA and Belgium. Overall not very informative |
| Sakr et al. (2007a) | Occup (DuPont), USA, 1,025 | CS | Median PFOA 400, median 200 | PFOA vs GGT + ALT (+) Bilirubin, ALP null | Adjusted for some potential confounders |
| Sakr et al. (2007b) |
Occup (DuPont), USA, 454 with > 2 measurement of PFOA |
L | Mean PFOA about 1,000 | PFOA vs ALT +, bilirubin – GGT, ALP null | Adjusted for some potential confounders |
| Emmett et al. (2006) | General pop exposed in C8 area, 371 | CS | Mean PFOA 354 ng/mL | PFOA vs AST, ALT, GGT, ALP null | No confounding adjustment. Not informative |
| Anderson‐Mahoney et al. (2008) | C8, N = 566 | CS, ecological | No serum data | PFOA (ecological) vs self‐reported symptoms and liver diseases null | Crude non‐informative ecological study |
| Gallo et al. (2012) | C8, 47,000 | CS | Median PFOS 20, median PFOA 28 ng/mL. |
PFOS vs ALT +, and ‘high’ ALT + (decile 10 vs decile 1). GGT and direct bilirubin null PFOA vs ALT +, and ‘high’ ALT + (D10 vs D1). GGT and direct bilirubin null |
Adjusted for potential confounders |
| Lin et al. (2010) | NHANES, USA 2,200, adults | CS | Mean PFOS 25 ng/mL, mean PFOA 4.6 ng/mL |
PFOA vs ALT + GGT +, bilirubin null PFOS vs ALT (+) |
Adjusted for potential confounders |
| Darrow et al. (2016) |
C8, USA, 28,800 from C8 community and 1,900 C8 workers. For survival analysis (liver disease) 31,600, including 3,700 workers. |
CS, L |
Yearly serum PFOA modelled (historical PFOA exposure, calibrated against measured PFOA. Median PFOA at 2005–6 when examined 15 ng/mL (general pop) and 93 ng/mL (workers) |
CS: Modelled PFOA vs ALT +, abnormal ALT +, direct bilirubin ‐, GGT null. L, retrospective: Modelled PFOA vs ALT +, liver disease (‐) |
Adjusted for potential confounders |
| Wang et al. (2012) | China, 55 workers and 132 nearby residents | CS | Median PFOS 33/34 and PFOA 1,630/280 | PFOS and PFOA vs ALT: Null | Limited confounder adjustment |
| Gleason et al. (2015) | NHANES, USA, 4,300 | CS | Median PFOS 11 ng/mL, median PFOA 3.7 ng/mL |
PFOS vs bilirubin +, ALT, AST, GGT null. PFOA vs ALT, AST, GGT, and bilirubin + |
Adjusted for potential confounders |
| Rantakokko et al. (2015) | Extremely obese subjects 213–215 undergoing surgery, Finland, 161 | CS | Mean PFOS 3.9 ng/mL, mean PFOA 2.6 ng/mL |
PFOA vs inflammation (histology) in the liver –. PFOS vs inflammation (histology) in the liver (–). PFOS and PFOA vs ALT 12 months after surgery null |
Adjusted for potential confounders. Special group, limited relevance |
ALT: alanine aminotransferase; AST: aspartate aminotransferase; C8: study performed in the ‘C8’ area where drinking water was contaminated by PFOA from a DuPont plant; CS: cross‐sectional study; HDL: High density lipoprotein; L: longitudinal study; GGT: gamma‐glutamyl transferase; Occup: occupationally exposed; PFOA: perfluorooctanoic acid; PFOS: perfluorooctane sulfonic acid.
In summary, some early studies in occupationally exposed workers indicated that serum levels of PFOA may affect ALT, a liver enzyme (Sakr et al., 2007a,b). A large cross‐sectional study of the C8 cohort (Gallo et al., 2012) showed an association between serum levels of PFOS/PFOA and ALT, and this was supported in a study using modelled PFOA exposure based on PFOA intake from drinking water (Darrow et al., 2016). These studies found no associations with GGT or bilirubin. Two NHANES studies (Lin et al., 2010; Gleason et al., 2015) found associations between serum levels of PFOA and ALT and GGT, while results for serum PFOS were inconsistent.
Common causes of elevated liver enzymes such as ALT are obesity, insulin resistance, high alcohol consumption, various medications, hepatitis and various systemic diseases. BMI and alcohol was adjusted for in the studies summarised above. Five cross‐sectional studies (Sakr et al., 2007a; Lin et al., 2010; Gallo et al., 2012; Gleason et al., 2015; Darrow et al., 2016) found an association between serum PFOA and ALT. There was some support also from two longitudinal studies (Sakr et al., 2007b; Darrow et al., 2016). It seems likely that the association between PFOA and ALT is causal. It is, however, unclear if this is clinically relevant, because the magnitude of association seems to be very small, and no association with liver disease has been shown. The study by Darrow et al. (2016) had a relatively good power to assess liver disease, and diagnoses were validated in medical records, but no increased risk related to PFOA exposure was found. The most common liver disease associated with an increase of serum ALT is non‐alcoholic fatty liver disease (NAFLD), including liver steatosis only, or non‐alcoholic steatohepatitis (NASH), which also includes inflammation and/or fibrosis. The main pathophysiologic factor for NAFLD is the metabolic syndrome, characterised by central obesity, insulin resistance, and often also hypertension, increased TG and decreased HDL. However, no association between serum PFOA and the metabolic syndrome has been shown – see next Section 3.3.4.7.3. Therefore, even if there is a causal association between serum PFOA and serum ALT, which is likely, it is not possible to conclude that increased serum PFOA will cause NAFLD.
The CONTAM Panel concludes that a causal positive association between PFOA and ALT is likely, but that the adversity of a change within the reference range has not been shown. For PFOS, data are inconsistent. However, in the C8 cohort, which is very large, an association was also found between PFOA and ALT above the reference range (Gallo et al., 2012). The CONTAM Panel considered this to be an adverse effect of PFOA in spite of the argument raised above against adversity of an increase of serum ALT within the reference range.
3.3.4.7.3. Diabetes, obesity, and metabolic syndrome
Lin et al. (2009) examined cross‐sectional associations between PFOS and PFOA and glucose homoeostasis and metabolic syndrome in 1,443 adults and adolescents (12–19 years) from NHANES samples 1999–2004. Data were available on fasting plasma glucose and insulin, and beta cell function and insulin resistance were assessed. Plasma glucose, blood lipids, waist, blood pressure and medications were used to define metabolic syndrome. In adults, PFOS and PFOA tended to be positively associated with lower plasma glucose, and higher insulin levels, resulting in favourable associations with beta cell function, but also with increased insulin resistance (for PFOS). Among indicators of metabolic syndrome, HDL cholesterol increased with higher serum PFOS, but the overall risk of metabolic syndrome was not significantly increased. In adolescents PFOS and PFOA levels were significantly inversely related to weight and plasma glucose, but overall risk of metabolic syndrome was not significantly decreased.
In the C8 cohort, cross‐sectional analyses were performed of associations between serum PFOA and type 2 diabetes, and PFOA and fasting glucose in non‐diabetics (MacNeil et al., 2009). The median PFOA level in the total population, > 50,000 people, was 28 μg/L. The main analyses of diabetes were restricted to individuals who had been living in the same water district > 10 years, 1,055 persons with type 2 diabetes confirmed in medical records and about 12,000 without type 2 diabetes. Prevalence odds ratios were calculated for deciles of PFOA with the lowest decile as reference, adjusted for age and other potential confounders. All the other nine deciles had adjusted ORs below 1.0 (varying between 0.58 and 0.87), without any trend. Thus the results did not support the hypothesis that high PFOA levels would increase the risk of type 2 diabetes. Neither were there any indications of increased fasting glucose in the higher PFOA deciles.
The association between estimated exposure to PFOA in the first 20 years of life and overweight or obesity at age 20–40 years was examined in 8,764 participants from the C8 cohort by Barry et al. (2014). Exposure to PFOA in the first few years of life was based on maternal serum PFOA and later exposure on PFOA in drinking water. The median estimated serum PFOA in the first three year of life was only 3.8 ng/mL (more than 50% had only background exposure), but in about 20% it was > 10 ng/mL. BMI at follow‐up was calculated from self‐reported weight and height. A number of potential confounders were adjusted for. There were no associations between estimated PFOA in the firsts few year of life or the average over the first 20 years and risk of overweight or obesity.
A longitudinal study of the association between PFOA and risk of type 2 diabetes was performed in about 28,500 community residents and 3,700 workers from the C8 cohort (Karnes et al., 2014). Annual serum concentrations of PFOA were estimated from PFOA in drinking water, and work histories as described above (Section 3.3.4.7.2; Darrow et al., 2016). The median cumulative lifetime exposure (the main metric used) was about 360 ng/ml‐years (e.g. 10 years of serum PFOA 36 ng/mL). The diabetes diagnosis (N > 4,000) was self‐reported in 2008–2011, but it was validated in medical records in 93% of the cases. A number of potential confounders were adjusted for. No associations were found between cumulative exposure to PFOA and incidence of diabetes, as analysed with Cox‐regression with or without a lag time before year of diagnosis. Nor was there any association between lifetime PFOA and serum glucose, as measured in 2008–2011.
Steenland and Woskie (2012) performed a cohort mortality study on various malignant and non‐malignant outcomes in 5,791 DuPont workers employed at any time between 1948 and 2002. Exposure to PFOA was estimated annually for each worker on the basis of job category and serum concentrations in a subgroup (drawn 1979–2004, mean concentration ~350 ng/mL), and cumulative exposure was estimated. There were 38 deaths from diabetes which resulted in a standardised mortality rate of about 1.9 (95% CI 1.4–2.6) compared to a reference group of other DuPont workers, but not different from a reference group of the general US population. There was no dose–response trend vs estimated cumulative exposure.
Melzer et al. (2010) examined the occurrence of self‐reported physician‐diagnosed diabetes in a cross‐sectional study of 3,974 adults in NHANES 1999–2006. The actual aim of the study was to investigate thyroid disease. The mean serum PFOS and PFOA levels were 22 and 4.3 ng/mL. There were no significant associations between PFOS or PFOA and ever diabetes diagnosis. Point estimates of ORs in quartile 4 were below 1.
A cross‐sectional study of the association between PFOS and PFOA, and body weight and insulin resistance was performed in 860 adults 20–80 years of age, not taking cholesterol‐lowering medication from NHANES 2003–2004 (Nelson et al., 2010), see also Section 3.3.4.7.1. Median serum PFOS and PFOA levels were 20 μg/L and 3.8 μg/L. No consistent associations were found between PFOS or PFOA and body weight, BMI or insulin resistance (HOMA‐IR).
As mentioned above (Section 3.3.4.7.1), Lin et al. (2011) studied the association between PFOS and PFOA and glucose homoeostasis (plasma glucose, serum insulin, HOMA‐IR), and adiponectin in a cross‐sectional study of 287 young people from Taiwan, who had been subject to a mass urine screening. The median PFOS and PFOA levels were 8.9 and 2.4 μg/L. No significant associations were found in adjusted models between PFOS or PFOA and markers of glucose homoeostasis, or adiponectin.
As mentioned above (Section 3.3.4.7.1), Fisher et al. (2013) examined associations between PFOS/PFOA and glucose homoeostasis, and metabolic syndrome in 2,700 fasting Canadians aged 18–74 years. The GM PFOS and PFOA levels were 8.4 and 2.5 μg/L. In adjusted analyses, there were no associations between PFOS or PFOA and glucose homoeostasis or metabolic syndrome.
Lind et al. (2014) studied the association between diabetes, insulin secretion, and insulin resistance, and serum levels of linear PFOS (linear isomer of PFOS (L‐PFOS)) and PFOA in a cross‐sectional study of a population‐based sample of 1,016, 70‐year‐old individuals in Sweden. The mean L‐PFOS and PFOA levels were 13 and 3.3 ng/mL. There were no significant associations between PFOS or PFOA levels and these outcomes, but for PFOA the OR for diabetes was nearly significantly decreased if a nonlinear logistic regression model was used. There was, however, a weak association between the proinsulin/insulin ratio and PFOA.
A cross‐sectional study of the association between PFOS/PFOA and glycemic control and overweight was performed in a representative sample of 499 Danish children (part of the European Youth Heart (EYHS) study), aged 8–10 years in 1997 (Timmermann et al., 2014). The median serum PFOS and PFOA levels were 42 and 9.3 ng/mL. A number of potential confounders were adjusted for. Overall, no associations were found between PFOS or PFOA and plasma glucose, insulin, beta cell function (HOMA‐beta), insulin resistance (HOMA‐IR), BMI, waist circumference or skinfold thickness. There was, however, an interaction between BMI and plasma insulin, and in the subgroup of overweight children (N = 59), there were significant positive associations between PFOS/PFOA and insulin, but not with glucose. Thus, there were also significant associations between PFOS/PFOA and HOMA‐beta and HOMA‐IR.
The same cohort was studied longitudinally by Domazet et al. (2016), this time with outcome measurements in 2003 (at age 15, N = 201) and 2009 (at age 21, N = 202) vs PFOS/PFOA at age 9 (1997). The authors now found positive associations between serum PFOS determined at 9 years of age and BMI, waist circumference and skinfold thickness at 15 years of age, and for waist and skinfold thickness also at age 21. For serum PFOA at age 9, there were some tendencies in the same directions for these overweight outcomes at age 15, but not statistically significant. There were no similar associations between PFOS/PFOA at 15 years of age and overweight outcomes at 15 or 21 years of age, instead higher PFOA at age 21 was associated with lower waist circumference. Regarding glucose homoeostasis there were no clear findings when comparing PFOS/PFOA at age 9 with these outcomes at age 15 or 21.
Predieri et al. (2015) compared serum PFOS/PFOA levels in 25 children (mean age 8 years) at onset of type 1 diabetes with 19 ‘control’ children (mean age 11 years) referred to the same clinic due to short stature. Mean PFOS in the diabetic children (1.5 ng/mL) was significantly higher than in the controls (0.6 ng/mL), while mean PFOA was 0.5 ng/mL in both groups. Potential confounders were not adjusted for.
In a small prospective study, Zhang et al. (2015) examined the association between PFOS/PFOA and gestational diabetes (GDM) in USA. In a cohort of women who discontinued contraception with the intent of becoming pregnant, 258 had a pregnancy lasting > 28 weeks and 28 of them developed GDM. In serum samples collected at enrolment, GM PFOS and PFOA levels were about 12 and 3.2 ng/mL. The OR of GDM per SD increase of PFOA (0.43 ng/mL) was 1.9 (1.1–3.0). For PFOS it was 1.1 (0.8–1.7).
A cross‐sectional study of associations between PFOS/PFOA and glucose homoeostasis among 571 Taiwanese adults from outpatient cardiology clinics (but free of self‐reported coronary heart disease, stroke or diabetes) was reported by Su et al. (2016). Mean serum PFOS was 3.2 ng/mL and mean PFOA was 8.0 ng/mL. Glycated haemoglobin and glucose levels at fasting as well as during an oral glucose tolerance test were associated with PFOS (significant increase with increasing PFOS) and PFOA (significant decrease with higher PFOA), when a number of potential confounders were adjusted for. The adjusted OR for diabetes was 3.4 (95% CI: 1.2–9.7) in Q4 for PFOS and 0.16 (95% CI: 0.05–0.50) in Q4 for PFOA.
The association between PFOS/PFOA levels in early pregnancy and development of GDM and impaired glucose tolerance (IGT) at the end of pregnancy, was examined in a prospective study of 1,259 women in Canada (Shapiro et al., 2016). GMs for serum PFOS and PFOA were 4.6 and 1.7 ng/mL, and 44 developed GDM and 49 IGT. No associations were found between PFOS or PFOA levels and risk of GDM or IGT.
In summary, 15 studies were identified on the associations between PFOS and or PFOA and glucose homoeostasis or diagnosis of diabetes (Lin et al., 2009, 2011; MacNeil et al., 2009; Melzer et al., 2010; Nelson et al., 2010; Steenland and Woskie, 2012; Fisher et al., 2013; Karnes et al., 2014; Lind et al., 2014; Timmermann et al., 2014; Predieri et al., 2015; Zhang et al., 2015; Domazet et al., 2016; Shapiro et al., 2016; Su et al., 2016). Two of them (Zhang et al., 2015; Shapiro et al., 2016) examined the risk of gestational diabetes. Overall, the results do not indicate adverse effects on glucose homoeostasis or increased risk of diabetes. There were some indications that PFOA may increase insulin production. Several of these studies (Lin et al., 2009; Nelson et al., 2010; Timmermann et al., 2014; Domazet et al., 2016) also examined adiposity, as did some other studies (Barry et al., 2014). Overall, the results do not indicate an increased risk of overweight or obesity due to exposure to PFOS or PFOA. Thus, the CONTAM Panel concludes that there is no evidence that PFOS or PFOA increases the risk of metabolic syndrome.
3.3.4.8. Kidney and Uric acid
3.3.4.8.1. Kidney
Shankar et al. (2011b) performed a cross‐sectional study of the association between serum PFOS/PFOA and estimated glomerular filtration rate (eGFR), based on the MDRD equation in 4,600 participants ≥ 20 years in NHANES surveys from 1999 to 2008. The median PFOS and PFOA levels were 19 and 4.1 ng/mL. In models adjusted for various potential confounders eGFR was 6.7 mL/min/1.73 m2 lower in the fourth quartile of serum PFOS and 5.7 mL/min lower in Q4 of PFOA. The OR for eGFR < 60 mL/min (defined as chronic kidney disease, CKD) was 1.8 (95% CI: 1.0–3.3) in Q4 for serum PFOS and 1.7 (95% CI: 1.0–2.9) in Q4 for serum PFOA. The authors mention that reverse causality cannot be excluded.
The occupational cohort of DuPont workers mentioned in the Section on diabetes (3.3.4.7.3) examined mortality in chronic kidney disease. There were only 13 cases, which was higher than expected using other DuPont workers as reference group (Steenland and Woskie, 2012).
The association between PFOS/PFOA and eGFR (Schwarz formula) was examined in 9,660 children and adolescents aged 1–18 years (mean 12 years) from the C8 cohort by Watkins et al. (2013). The median serum levels of PFOS and PFOA were 20 and 28 ng/mL in 2005–2006. Analyses are mainly reported by PFOA quartiles, and median serum PFOA in Q1‐Q4 were 9.1, 19, 41, and 139 ng/mL. The eGFR was 2.9 mL/min/1.73 m2 lower in Q4 for PFOS compared with Q1, and for PFOA the difference between Q4 and Q1 was 0.8 mL/min. Most of this difference was found already between Q1 and Q2. An IQR for ln‐transformed PFOA (1.63), corresponded to 0.7 mL/min lower eGFR. When the analysis for PFOA was repeated but using estimated serum PFOA (from drinking water, see above), there was no association between estimated serum PFOA and eGFR. Therefore, the authors conclude that reverse causation is a likely cause of the association between (measured) serum PFOA and eGFR, i.e. that lower GFR causes higher serum PFOA, rather than vice versa.
Dhingra et al. (2016) examined the association between PFOA exposure and diagnosed chronic kidney disease (CKD) in a retrospective cohort study in about 28,000 adults in the C8 cohort. Cases of CKD from 1951 up to about 2010, validated in medical records, with data on covariates and absence of other kidney disease were included in the analyses (N = 397, 187 of which were diabetics). Yearly serum PFOA levels were estimated from models of PFOA in drinking water (described above). The mean and median cumulative exposure was 3.3 and 0.6 mg/mL*year (for example corresponding to 11 year with 300 ng/mL). Mean and median levels in 2005–2006 were 83 and 28 ng/mL. The authors also performed a prospective cohort study, analysing only new‐onset cases after 2005–2006 (N = 212 out of the 397 cases). A number of potential confounders were adjusted for. No associations were found between estimated cumulative PFOA exposure and CKD in the retrospective cohort study (HR for upper quintile 1.24, 95% CI: 0.9–1.8) or in the prospective study (HR for upper quintile 1.12, 95% CI: 0.7–1.8). Sensitivity analyses using year‐specific serum PFOA also showed no associations with CKD.
Kataria et al. (2015) studied, cross‐sectionally, the association between PFOS/PFOA and kidney function (and uric acid) among 1,960 adolescents in NHANES 2003–2010. Median PFOS and PFOA levels were 12.8 and 3.5 ng/mL. A number of potential confounders were adjusted for. An inverse association was found between PFOS/PFOA and eGFR (Schwartz formula); point estimate 9.5 mL/min/1.73 m2 lower eGFR in the fourth quartile of PFOS and 6.6 mL/min lower in the fourth quartile of PFOA. The overall median eGFR was 140 mL/min/1.73 m2. The authors discuss the possibility of reverse causality, but express doubt that a moderate decrease of GFR could ‘cause’ a large increase in PFOS/PFOA.
In summary, three cross‐sectional studies found a relatively strong association between serum PFOS/PFOA and estimated GFR. Authors in all studies mention the possibility of reverse causality as a possible explanation for these findings. Although there may be some ‘reverse causality’, it is not realistic that a decrease of eGFR by 5–10% could cause a several‐fold increase in serum PFAS. However, eGFR is very poorly correlated with measured GFR in the normal GFR range. The equations are based not only on serum creatinine, but also on age, sex, height and weight, and these latter variables are associated with serum levels of PFOS/PFOA. Therefore, adjustment for these variables is complicated. For PFOA the longitudinal study of the C8 cohort showed no significant association with chronic kidney disease. The CONTAM Panel concludes that the evidence is insufficient that PFOS/PFOA exposure causes reduced GFR or kidney disease. The possibility of reverse causality is very relevant also for other outcomes based on serum markers, which are eliminated by renal excretion, e.g. uric acid.
3.3.4.8.2. Uric acid
Steenland et al. (2010) examined the association between PFOS and PFOA and serum uric acid (UA) in the C8 cohort. In 55,000 adults > 20 years of age the median PFOS and PFOA levels were 20 and 28 μg/L. In models adjusted for various potential confounders, serum UA increased significantly with each decile of PFOS and PFOA, with differences in serum UA between the highest and the lowest deciles of about 5%. The association between PFOA and serum UA was present also for the lowest deciles, with PFOA levels similar to those in the US population. The OR for hyperuricemia was about 1.3 (95% CI: 1.2–1.4) for the highest quintile of PFOS and 1.5 (95% CI: 1.4–1.6) in the highest quintile of PFOA.
Another cross‐sectional study of the association between serum PFOS and PFOA and serum UA was performed in 3,900 participants ≥ 20 years in NHANES surveys from 1999 to 2006 (Shankar et al., 2011a). The median PFOS and PFOA levels were 18 and 4.5 μg/L. In models adjusted for various potential confounders, serum UA increased significantly with each quartile of PFOS and PFOA, with differences in serum UA between the highest and the lowest quartiles of about 5–8%. The ORs for hyperuricemia were significantly increased in the upper three quartiles of PFOS and the upper two quartiles of PFOA compared with the lowest quartile. Possible mechanisms discussed were oxidative stress in the liver and competition between PFOS/PFOA and UA regarding organic anion transporters in the kidney.
Lin et al. (2013b) examined associations between PFOS/PFOA and serum UA in a cross‐sectional study of 644 young people from Taiwan, who had been subject to a mass urine screening. The focus of the study was carotid intima‐media thickness. Most of them were in the age 20–30 years and the GM PFOS and PFOA levels were about 7.9 and 2.6 ng/mL. No significant associations were found between PFOS or PFOA and serum UA in adjusted models including a number of potential confounders.
Geiger et al. (2013) performed a cross‐sectional study of the association between PFOS/PFOA and serum UA in 1,772 adolescents (12–18 years) from NHANES surveys 1999–2008. The mean PFOS and PFOA levels were 18 and 4.3 ng/mL. A number of potential confounders were adjusted for. Serum UA was weakly, but significantly associated with PFOS and PFOA. The ORs for hyperuricemia were 1.7 (95% CI: 1.1–2.5) for PFOS and 1.6 (95% CI: 1.1–2.3) for PFOA.
Kataria et al. (2015) studied, cross‐sectionally, the association between PFOS/PFOA and serum UA (and kidney function) among 1,960 adolescents in the NHANES 2003–2010. Median PFOS and PFOA levels were 12.8 and 3.5 ng/mL. A number of potential confounders were adjusted for. Serum UA was 0.21 mg/dL higher in the fourth quartile of PFOS and 0.19 mg/dL in the fourth quartile of PFOA (overall median 5.0 mg/dL). Also, the adjusted ORs for high serum UA (defined as fourth quartile) were increased in the fourth quartiles of PFOS/PFOA. The main focus of the study was kidney function (see above).
In the cross‐sectional study by Gleason et al. (2015), mentioned above (Section 3.3.4.7.2 on Liver) associations between serum PFOS/PFOA and serum UA were examined in about 4,300 individuals from NHANES surveys 2007–2010. The median levels of PFOS and PFOA were 11 ng/mL and 3.7 ng/mL. A number of potential confounders were adjusted for. A significant positive association was found between ln serum PFOA and serum UA, and the OR for high serum UA (above 75%) was 1.9 (95% CI 1.4–2.6) while there was no such association for PFOS.
Associations between PFOS/PFOA and serum UA were examined in a cross‐sectional study of 225 Taiwanese children (12–15 years) by Qin et al. (2016). The mean PFOS and PFOA levels were 29 and 0.5 ng/mL. There was a significant association between ln serum PFOA and uric acid in a model adjusted for potential confounders, and the adjusted OR for high serum UA was 2.2 (95% CI 1.3–3.6). No significant associations were found for PFOS.
In summary, seven studies examined associations between PFOS/PFOA and serum UA. Four of them found a positive association between serum PFOS and serum UA and six of them found such an association for serum PFOA. The associations may well be causal, but they may also be confounded by glomerular filtration rate (GFR). It is well known that reduced GFR increases serum UA (which is eliminated by renal excretion). If a lower GFR increases serum levels of PFASs, then this can also explain associations between PFAS and serum UA. Thus, the evidence is insufficient to conclude that exposure to PFASs causes increased levels of uric acid in serum.
3.3.4.9. Carcinogenicity outcomes
3.3.4.9.1. Occupational exposures or high exposures due to local contamination
Steenland and Woskie (2012) found significant dose–response mortality trends for malignant and non‐malignant renal disease (12 and 13 cases, respectively) with estimated higher PFOA exposures among 5,791 occupationally exposed DuPont chemical plant workers form West Virginia. A minimum of 1‐day employment was sufficient to be included in the study at any time between 1948 and 2002. Exposure to PFOA was estimated annually for each worker on the basis of job category and by taking into considerations serum concentrations from 1,308 workers (drawn 1979–2004, mean concentration ~350 ng/mL). Comparing the highest (> 2,700 ppm) and lowest (< 904 ppm) quartile of exposure among exposed workers, the standardised mortality ratios were 2.7 (95% CI: 1.2, 5.3) for kidney cancer and 8.6 (95% CI: 3.5, 17.7) for chronic renal disease. However, when comparing all exposed workers to unexposed workers from other DuPont factories as referent, the standardised mortality ratios were 3.1 (95% CI: 1.7, 5.3) for chronic renal disease and 1.3 (95% CI: 0.7, 2.2) for kidney cancer.
Two similar studies among 3M factory workers from Minnesota have also been conducted. These workers were also occupationally exposed to (APFO) and the outcomes covered by these studies were mortality rates and cancer incidences. Both studies overlap considerably in terms of the subjects included but differ in length of follow‐up and methodology used for exposure assessment. In this population, the mean serum concentration among 145 participants providing blood samples in 2,000 was ~800 ng/mL. In both studies one of the inclusion criteria among exposed workers was a minimum of 365 days employment:
Lundin et al. (2009) examined cause‐specific mortality rates among workers who had been employed at 3M from 1947 to 1997 with end of follow‐up in 2002. Workers were grouped according to presumed ‘definite’, ‘probable’ and ‘minimal’ exposure to PFOA depending on the workers position and role within the manufacturing process. The results from this study suggested that moderate and high compared to low exposure to PFOA was positively associated with prostate cancer (16 cases in total), with hazard ratios (HR) of 3.0 (95% CI: 0.9, 9.7) and 6.6 (95% CI: 1.1, 37.7), respectively. These findings were in line with two previous reports from this cohort (Gilliland and Mandel, 1993; and Lundin et al., 2009). No consistent associations were observed for bladder or liver cancers.
Later Raleigh et al. (2014) compared mortality rates and cancer incidence among 4,668 3M Minnesota workers exposed to ammonium PFOA between 1947 and 2002. As comparison group, they used factory workers from Minnesota and Wisconsin that had not been occupationally exposed to ammonium PFOA (n = 4,359). Exposure to PFOA was estimated using task‐based job exposure, taking into consideration among other things, work history records, monitoring data, average annual production. Based on these group comparisons, the authors found no significant differences in hazard rates for dying from cancers of the liver, pancreas, testes, kidney and breast. In contrast to previous studies for this same cohort, no association was also observed with prostate cancer (24 cases in total). The HR for dying from bladder cancer were slightly elevated among workers in the highest quartile of exposure (HR: 1.7 (95% CI 0.9, 3.2)).
Apart from the occupational studies described above, a few studies (some partly overlapping) have examined associations between different PFAS and incidence of cancer in the C8 Health Study Project. Although actual serum concentrations were available for a subset of participants providing a baseline blood samples (2005–2006), historical exposure at time of death or cancer diagnoses had to be estimated back in time, based on residence history and other predictors of exposure; and in some cases, using the baseline serum sample as reference point. In short, the results from these studies are as follows:
Vieira et al. (2013) examined associations between PFOA exposure and cancer among residents living near the C8 plant (n = 25,107). In their analyses, the authors included as outcomes incidence of 18 cancers (excluding kidney, pancreatic, testicular and liver cancers reported in later paper), diagnosed from 1996 through 2005. Exposure to PFOA was based on simple group comparison according to residence. Subjects were ranked according to estimated historical exposure to contaminated drinking water, which was based on several assumptions relating to duration of residence in a particular location. The authors reported positive association between high (estimated as > 110 ng/mL in serum) exposure to PFOA and kidney cancer (OR: 2.0 (95% CI: 1.0, 3.9)). Non‐significant differences were observed for 17 other cancer outcomes examined, although the OR for testicular cancer (OR 2.8 (95% CI 0.8, 9.2)) and prostate cancer (OR 1.5 (95% CI: 0.9, 3.3.)) were slightly elevated.
Using part of the same cohort as Vieira et al. (2013), Barry et al. (2013) examined associations between PFOA with 21 different types of cancers ((including kidney, pancreatic, testicular and liver cancers. In contrast to Vieira et al., 2013) they re‐interviewed the cohort in 2008–2011 and included all cancer cases that could be verified between 1952 and 2011. A total of 32,254 subjects were included with 2,507 cancer cases. PFOA concentrations were estimated based on residence history and other predictors of PFOA exposure in this community and these estimates were validated against baseline PFOA concentrations in a subset of participants (Shin et al., 2011a,b). The mean serum levels in 2005–2006 among non‐occupationally exposed and occupationally exposed residents were 24 and 113 ng/mL respectively. In this cohort, PFOA concentrations were positively associated with kidney and testicular cancer. In terms of the effect size, the hazard ratios were 1.10 (95% CI: 0.98, 1.24) and 1.34 (95% CI: 1.00, 1.79) for kidney and testicular cancers respectively, for 1‐unit increases in ln‐transformed serum PFOA. Effect estimates for colorectal, prostate and liver cancers were non‐significant and centred around NULL.
Innes et al. (2014) examined the association between baseline (2005–2006) concentrations (median) of PFOS (20 ng/mL) and PFOA (28 ng/mL) and colorectal cancer among 47,359 subjects form the C8 cohort. Colorectal cancer cases were diagnosed between 1966 and until recruitment in 2006. In short, a strong inverse association was observed between measured baseline (2005–2006) concentrations of PFOS and PFOA with colorectal cancers occurring between 1966 and 2006. These associations were stronger among cases occurring closer to the blood sample measurement. Although the authors adjusted from self‐reported anaemia it is quite possible that blood loss related to tumour progression and or treatment (surgery) may account for these associations (blood loss is a known pathway of PFOA excretion). Particularly as anaemia might have been underdiagnosed during the long retrospective period. These results are also in contrast to the results reported from Barry et al. (2013) where exposure was estimated based on residence history. Without replication in another independent study the results from this study are inconclusive.
Concerning results on prostate cancer form the C8 cohort, a cross‐sectional study by Ducatman et al. (2015) using the blood samples collected in 2005–2006, among 25,412 participants, found no association between measured serum levels of PFOA with Prostate‐Specific Antigen above 4.0 (686 cases, 2.7%), which is a marker of prostate disease, including prostate cancer.
Alexander and Olsen (2007) examined association between exposure to PFOS retrospectively according to work history records among 1,400 occupationally exposed workers and bladder cancer. The total number of cancer cases was six from questionnaire survey and 5 from death certificates. In this underpowered study, no association was observed.
3.3.4.9.2. Background exposed population
Eriksen et al. (2009) investigated prospectively the associations between plasma levels (mean) of PFOS (33.9 ng/mL) and PFOA (6.2 ng/mL) and cancer risk among participants in the Danish Cancer Society Cohort. From enrolment, between 1 December 1993, and 31 May 1997, and through 1 July 2006, 713 participants with prostate cancer, 332 with bladder cancer, 128 with pancreatic cancer, and 67 with liver cancer were identified. A subcohort of 772 participants were randomly selected for comparison. Non‐significant associations were observed for all the outcomes examined although for PFOS there was a borderline non‐significant increased risk observed for prostate cancer (incidence rate ratio of 1.38 (95% CI: 0.99, 1.93) comparing the highest vs the lowest quartile). One methodological limitation in this study is the use of one baseline blood sample. Environmental levels were increasing during the time of baseline recruitment between 1993 and 1997 (Haug et al., 2009) but then decreased rapidly during the follow‐up period. It is unclear if ranking subjects based on just one sample is sufficiently accurate to detect any risk.
Hardell et al. (2014) examined the association between serum concentrations (median) of PFOS (8.7 ng/mL) and PFOA (2.0 ng/mL) among 201 newly diagnosed cases with prostate cancer from Örebro Sweden (2007–2011); and 186 controls matched for age and area of residence. Non‐significant associations were observed for PFOS and PFOA when comparing concentrations among cases and controls. However, in a subset of participants with heredity as risk factor (number of cases ranging between 6 and 11 and number of controls ranging between 19 and 24) a significantly increased risk was observed for both compounds (odds ratios ~2.5). Given the small number of heritable cases, these findings would need to be replicated to provide better indication if there is a potential gene ‐ environment interaction.
Bonefeld‐Jørgensen et al. (2014) examined in a case–control (250 cancer cases and 233 matched controls) setting the association between approx. median exposure PFOS (~30 ng/mL) and PFOA (~5 ng/mL) with breast cancer using blood samples drawn in early pregnancy among women participating in the Danish National Birth Cohort (1996–2002, mean age ~30 years). No associations with breast cancer were observed.
3.3.4.9.3. Summary
Overall studies among background exposed population provide little evidence to suggests that exposure to PFOS and PFOA is associated with increased cancer risk. The strengths of these studies are that they have relied on direct quantification of exposure in serum as opposed to estimating exposure through indirect measures. Two studies (Eriksen et al., 2009; Hardell et al., 2014) have suggested that prostate cancer may be a relevant outcome to examine further, at least in the case of PFOS. However, these findings are only suggestive.
Occupational studies and studies among individuals being exposed through contaminated drinking water (the C8 cohort) have predominantly focused on exposure to PFOA (but not PFOS) and cancer incidence and/or mortality. These studies have often been partly overlapping (Lundin et al., 2009; Barry et al., 2013; Vieira et al., 2013; Raleigh et al., 2014). In all but one of these studies (Innes et al., 2014), retrospective assessment of PFOA was used based on residence/occupation and other predictors of past exposure. Although ranking of subjects with respect to past exposure may in some cases provide reliable estimates (Shin et al., 2011a), there is still a great deal of uncertainty when taking into consideration changes in production volume of PFOA from the early 1950s to present day; as well as changes in industrial hygiene over time. In addition, many of these studies examined association between past exposure to PFOA with cancer cases occurring from the early 1950s to 2000 (Lundin et al., 2009; Barry et al., 2013; Innes et al., 2014; Raleigh et al., 2014). Temporal changes in incidence rates, diagnoses, changes in other risk factors and survival changes from the 1950s to present may result in biased non‐comparable outcomes. What influence this may have on the reported associations is difficult to predict. It is therefore not surprising that the overall results for the high exposure studies are inconsistent. Still these studies have suggested that high exposure to PFOA may potentially increase risk of kidney, testicular and bladder cancer. Some suggestions of a modest association with prostate cancer (Eriksen et al., 2009; Lundin et al., 2009; Vieira et al., 2013) have also been reported.
Based on the review above, it is concluded that studies among background and occupationally exposed individuals provide limited evidence to suggest that exposure to PFOS and PFOA are associated with increased cancer risk. This conclusion is in line with the conclusion from the recent IARC report on PFOA (IARC, 2016), which concluded that there was limited evidence for carcinogenicity.
3.3.4.10. Cardiovascular outcomes
Sakr et al. (2009) studied ischaemic heart disease (IHD) mortality in a retrospective cohort of 4,747 DuPont workers who had ever worked at the APFO plant from start of production in 1948 until the end of 2002. Exposure to PFOA was categorised as low, medium or high, based on job titles and serum PFOA by these job titles in a 2004 survey, and a cumulative exposure index was created for each worker based on duration of work multiplied by the estimated exposure intensity for the job titles. Workers were then categorised in quartiles of cumulative exposure. Risk of IHD was estimated using survival analysis (Cox‐regression), adjusted for age, sex, race, and calendar year, but no information was available on smoking or other individual IHD risk factors. The median duration of employment was 23 years and the median estimated cumulative exposure was 5.1 ppm‐years (integrative measure, e.g. 5 years with an average level of 1,020 ng/mL = 1.02 ppm). No overall significant increase in IHD morality (239 deaths) was found in the highest quartile of estimated PFOA exposure (relative risk 1.1, 95% CI 0.7–1.7) using the lowest quartile as a reference. When various lags (latency times) were tested, there was a tendency towards an increased risk at 10‐year lag, but not at 5, 15 or 20 years lag.
Simpson et al. (2013) assessed the associations between exposure to PFOA and incidence of stroke among 35,000 individuals ≥ 20 years of age from the C8 cohort ((1,900 workers and 28,500 residents exposed via drinking water. Serum PFOA determinations were available for most of them in 2005–2006 median 113 ng/mL in workers and 24 ng/mL in residents). Historical serum PFOA levels were also estimated as described previously for the C8 cohort (Section 3.3.4.7.1 on serum lipids). Incidence of stroke was compared with estimated cumulative serum PFOA (as a continuous variable or by quintiles) using Cox‐regression based on 825 validated cases of stroke, and adjustment for potential confounders. The hazard ratios in quintiles 2–4 were all significantly above 1.0 (reference quintile 1), but the HR in Q5 was only 1.13 (95% CI 0.9–1.4) and there was no significant trend. There was no association with estimated serum PFOA as a continuous variable. When restricting the observation to the period before 1999, there were some significant positive associations between estimated cumulative serum PFOA and stroke. A smaller prospective substudy (252 cases occurring after inclusion in 2005–2006) showed no association with cumulative serum PFOA.
As mentioned in the Section on serum lipids (Section 3.3.4.7.1), Winquist and Steenland (2014b) performed retrospective and prospective analyses of associations between modelled PFOA levels (cumulative or yearly) in the C8 cohort and self‐reported coronary heart disease or hypertension, but without finding any positive associations. In the prospective analyses for coronary heart disease, the point estimates for HRs for Q2–Q5 were around 0.7.
Min et al. (2012) examined cross‐sectional associations between serum PFOA and serum homocysteine (often associated with cardiovascular risk) and blood pressure in about 2,200 adults from NHANES surveys 2003–2006. The GM serum PFOA level was 4 ng/mL. Analyses were adjusted for a number of potential confounders and for serum PFOS (which was correlated with serum PFOA, but no information on levels is given). Log‐transformed serum homocysteine increased significantly with increasing log‐transformed serum PFOA, but the magnitude of association was minimal. There was a significant positive association between serum PFOA and systolic blood pressure (about 2 mm Hg at a doubling of serum PFOA). The OR for hypertension was 1.7 (95% CI 1.2–2.4) when comparing the highest quartile of serum PFOA with the lowest, and the trend was statistically significant.
Shankar et al. (2012) performed a cross‐sectional study on the association between PFOA and self‐reported cardiovascular disease as well as peripheral arterial disease (PAD), defined as an ankle‐brachial index blood pressure of < 0.9. They studied 1,200 participants in NHANES 1999–2003 aged ≥ 40 years. The median serum PFOA was about 4 μg/L. Adjusting for a number of potential confounders (including total cholesterol), the OR for self‐reported physician‐diagnosed coronary heart disease, heart attack or stroke was 2.0 (95% CI 1.1–3.6) and the OR for PAD was 1.8 (1.03–3.1). Analyses stratified for sex, smoking and BMI showed point estimates of OR similar to those in the total group.
The same group studied cross‐sectional associations between PFOS/PFOA and blood pressure in 1,655 children (age 12–18 years) participating in NHANES surveys 1999–2008 (Geiger et al., 2014b). Mean serum PFOS and serum PFOA levels were 18 and 4.4 ng/mL. A number of potential confounders were adjusted for. Linear regression showed no associations between PFOS/PFOA and blood pressure. The ORs for high blood pressure (above the 95% percentile) in the upper quartiles were 0.69 (95% CI 0.4–1.2) for PFOS and 0.77 (95% CI 0.4–1.6).
Lin et al. (2013b) studied, cross‐sectionally, the association between intima‐media thickness (as a measure of atherosclerosis) in the carotid artery (CIMT) and serum levels of PFOS and PFOA in 644 individuals from Taiwan, aged 12–30 years. Recruited at a mass‐screening of urine (Section 3.3.4.7.1; Lin et al., 2011), serum PFOS and serum PFOA were about 7.9 and 2.6 ng/mL. There was a slight positive but statistically significant trend of increase in CIMT with increasing serum PFOS after adjustment for potential confounders (5% increase in Q3 and 4% in Q4). No such association was found for serum PFOA. Similar results were found be the same authors (Lin et al., 2016) when analysing some additional subjects and performing some subanalyses.
Watkins et al. (2014) studied DNA methylation in 685 adults from the C8 cohort examined longitudinally with follow‐up in 2010. DNA methylation (in a region called LINE‐1) in blood leucocytes collected in 2010 was positively associated with PFOS in 2005–2006 as well as PFOS in 2010. The authors comment that hypomethylation has been associated with increased serum lipids and cardiovascular risk, but in the present study DNA methylation was instead increased. No association was found for PFOA.
Mattsson et al. (2015) performed a case–control study (nested in a cohort) of the association between PFOS/PFOA and incident coronary heart disease (CHD, fatal or non‐fatal). Cases and age‐matched controls (231 pairs) were obtained from a cohort of 1,782 men living in rural Sweden. Median serum PFOS and PFOA at recruitment 1990–1991 were 22 and 4.1 ng/mL. For part of the age‐control pairs still alive, blood samples were collected also in 2002–2003, and then levels had decreased about 10%. There were no associations between PFOS/PFOA and risk of CHD (OR for Q4 of serum PFOS 0.9, 95% CI: 0.6–1.6 and OR for Q4 of serum PFOA 0.9, 95% CI: 0.7–1.8).
Lind et al. (2017) studied cross‐sectional associations between L‐PFOS and PFOA in serum in about 1,000 elderly Swedish individuals (Lind et al., 2014; Section 3.3.4.7.3 on diabetes, obesity, and metabolic syndrome). No significant associations were found between PFOS/PFOA and CIMT, carotid atherosclerotic plaques or the echogenicity of the plaques.
In summary, five cross‐sectional and four longitudinal studies (Sakr et al., 2009; Simpson et al., 2013; Winquist and Steenland, 2014b; Mattsson et al., 2015) examined associations between PFOS/PFOA and cardiovascular outcomes (mortality, coronary heart disease, stroke, hypertension and atherosclerosis). Altogether, these studies do not show any clear causal association between PFOS/PFOA and cardiovascular disease. However, if there is only a small increase of relative risk (1.05–1.1), these studies would not be able to demonstrate it.
3.3.4.11. Other studies/various outcomes
An early cross‐sectional study of a population sample from the area with contaminated water from the C8 plant was published by Emmett et al. (2006). It was a (mainly random) sample of 371 inhabitants who had been living in the affected water district for at least two years. About 90% were adults, and 18 of them had been occupationally exposed at the C8 plant. The median PFOA level was 354 μg/L. The authors examined a number of serum and blood biomarkers and found essentially no associations with thyroid hormone levels, liver and kidney function tests, cholesterol levels or haematological variables. Nor were there any significant associations between PFOA levels and self‐reported liver or thyroid disease.
A cross‐sectional ecological study of health status in a sample of inhabitants in the C8 area was reported by Anderson‐Mahoney et al. (2008). Prevalences of self‐reported symptoms and diseases were compared with prevalences in NHANES 2001–2002, taking age and gender into account. Prevalence ratios were found to be increased for cardiovascular problems, respiratory disease, kidney disease and diabetes.
3.3.4.11.1. Ulcerative colitis
Steenland et al. (2013) studied the association between PFOA and incidence of a number of autoimmune diseases (ulcerative colitis, Crohn's disease, rheumatoid arthritis, type‐1 diabetes, multiple sclerosis and systemic lupus erythematosus) in 32,254 individuals from the C8 cohort, 12% of which had been working at the C8 plant. Exposure to PFOA (since 1952) was retrospectively estimated using serum PFOA levels in a subset of participants at recruitment combined with data on area of residence, drinking water intake, previous occupation (job‐exposure matrix), and a pharmacokinetic model. The participants (or next of kin for 4% of participants) were interviewed in 2008–2011 regarding autoimmune diseases. A number of potential confounders were adjusted for. Only cases validated against medical records were considered. Associations were analysed by Cox‐regression (from birth or from year 1952). A significant positive trend was found for ulcerative colitis (151 cases) with an increased relative risk already in the second PFOA quartile (RR 1.8; 95% CI: 1.04–3.0) increasing to RR 2.9 (95% CI: 1.7–5.0) in the forth quartile. A separate prospective analysis based on measured serum PFOA in 2005–2006 and follow‐up until 2008–2011 showed increased point estimates for the RR, but statistically non‐significant (only 30 cases). There was no increased risk of other autoimmune diseases.
Associations between PFOA and the incidence of various diseases were studied by Steenland et al. (2015) in 3,713 workers from the C8 cohort. These workers were also included in several studies of disease incidence in the combined C8 cohort of residents and workers (Barry et al., 2013; Steenland et al., 2013; Winquist and Steenland, 2014a,b). In the present paper, workers were studied separately. The workers or next of kins (6%) were interviewed in 2008–2011. For a large number of deceased workers, next of kin interviews could not be performed. About half of the workers had their serum PFOA level determined in 2005 (median 113 ng/mL). For all workers, yearly serum PFOA levels were estimated retrospectively as described above. Diseases were validated in medical records, apart from some common diseases: osteoarthritis, hypertension and hypercholesterolaemia. A number of potential confounders were adjusted for. Associations were analysed by Cox‐regression (from year 1951 or from age 20). Significant positive trends were found for ulcerative colitis (28 cases) and rheumatoid arthritis (29 cases). The only statistically significant relative risk in quartile 4 was for ulcerative colitis (RR 6.6; 95% CI: 1.5–29) when a ten‐year lag was used. There was no increased risk of self‐reported osteoarthritis.
In summary, these results from the C8 cohort suggest an association between serum PFOA (but not PFOS) and risk of ulcerative colitis. More studies are needed to assess this hypothesis.
3.3.4.11.2. Osteoarthritis and rheumatoid arthritis
Innes et al. (2011) examined cross‐sectional associations between PFOS/PFOA and self‐reported physician‐diagnosed osteoarthritis in about 49,000 individuals > 20 years of age in the C8 cohort. Median PFOS and PFOA levels were 20 and 28 ng/mL. More than 3,700 individuals reported osteoarthritis, which was (as expected) strongly affected by age, but also with a number of other potential confounders. There was a significant positive association between PFOA and osteoarthritis. In multivariable adjusted models the prevalence odds ratio in the highest quartile of PFOA was 1.3 (95% CI: 1.1–1.5), and it was significantly increased also in the third quartile (> 28 ng/mL). For PFOS there was an association in the opposite direction. The OR in quartile 4 of PFOS was 0.8 (95% CI: 0.7–0.9). The authors discuss the possibility that inflammation or PPAR‐mediated changes in bone metabolism could be involved, but cannot explain the divergent findings for PFOA and PFOS.
Uhl et al. (2013) performed a cross‐sectional study of PFOS/PFOA and self‐reported physician‐diagnosed osteoarthritis in 3,809 individuals 20–84 years of age in NHANES surveys 2003–2008. The median PFOS and PFOA levels in serum were 13.6 and 4.2 ng/mL. A number of potential confounders were adjusted for. There was a significant positive association between PFOS and osteoarthritis with ORs 2.0 (95% CI: 1.4–3.5) and 1.8 (1.1–3.0) in the third and fourth quartiles. For PFOA, there was a borderline significant increase in Q4 (OR 1.6; 95% CI: 0.99–2.4). In sex‐stratified models, the ORs for PFOS were similar for women and men (although the increase was not statistically significant) while for PFOA the increase was only found among women (OR in Q4 2.0; 95% CI: 1.2–3.2). In men, the OR in Q4 was 0.8 (95% CI: 0.4–1.7). The authors discuss the same possible mechanisms as did Innes et al. (2011), and state that the reason for increased susceptibility in women might be endocrine effects by PFOA.
In the afore‐mentioned studies by Steenland et al. (2013, 2015) where ulcerative colitis was studied, there was no association between PFOA and rheumatoid arthritis (Steenland et al., 2013) or osteoarthritis (Steenland et al., 2015).
In summary, the three cross‐sectional studies on osteoarthritis (Innes et al., 2011; Steenland et al., 2013; Uhl et al., 2013) provide only limited support for an association between PFOA and risk of osteoarthritis, and for PFOS the results are inconsistent.
3.3.4.11.3. Bone mineral density
Lin et al. (2014) studied cross‐sectionally the association between serum PFOS/PFOA and bone mineral density as well as self‐reported fracture in 2,339 individuals aged ≥ 20 years from NHANES surveys 2005–2008. Bone mineral density was assessed using dual‐energy X‐ray absorptiometry (DXA) of the spine and the hip. Self‐reported physician‐diagnosed history of fracture of hip, wrist or spine was collected from a questionnaire. Geometric means of PFOS and PFOA were 15 and 4.0 ng/mL. A number of potential confounders were adjusted for. Effect modification of sex and menopause status was examined. There was no overall association between PFOS/PFOA and bone mineral density. In pre‐menopausal women, there was a small significant inverse association between PFOS and lumbar spine bone mineral density (about 2% per threefold increase of PFOS), but no association for hip or wrist, no association in men or post‐menopausal women, and no associations with PFOA. No associations were found between PFOS/PFOA and fracture.
Khalil et al. (2016) used the NHANES survey 2009–2010 for a similar cross‐sectional study of associations between PFOS/PFOA and bone mineral density (measured by DXA) in spine and femur, as well as self‐reported physician‐diagnosed osteoporosis. In 1914 individuals age 12–80 years, the mean serum PFOS and PFOA levels were 13 and 3.7 ng/mL. A number of potential confounders were adjusted for. In women, bone mineral density in femur was significantly lower in the highest quartile of PFOS. The association was significant in 368 post‐menopausal women but not in 590 pre‐menopausal women. No association with PFOS was found for spine bone mineral density. In men, non‐significant associations with PFOS in the same direction were found, but significant only for bone mineral density in the femoral neck. Associations between PFOA and bone mineral density in women were generally in the same (inverse) direction as for PFOS, but not statistically significant. The adjusted odd ratio for osteoporosis in women (77 cases) was increased in the upper quartile of PFOA (OR 2.6, 95% CI: 1.01–6.7), but not in the upper quartile of PFOS (OR 1.1, 95% CI: 0.4–3.2).
In summary, these two cross‐sectional NHANES studies show some inverse associations on associations between PFOS/PFOA and bone mineral density, but only in subgroups and for some sites, with limited consistency between the two studies. The magnitudes of the associations were small and may be due to residual confounding and/or reverse causation. The latter would be mediated by higher PFOS/PFOA in women with early menopause, which in turn decreases bone mineral density.
3.3.4.11.4. C‐reactive protein
Genser et al. (2015) in a paper on multi‐level regression analysis based on the C8 cohort, present slight but statistically significant associations between serum PFOA and C‐reactive protein, within water districts as well as between water districts. Because serum CRP is a well‐known risk factor for cardiovascular disease, this may be relevant in the discussion of cardiovascular risk in PFOA‐exposed populations.
3.3.5. Mode of action
3.3.5.1. Liver Toxicity
3.3.5.1.1. PPARa transactivation, hepatic peroxisomal β‐oxidation and hepatomegaly
PFOS and PFOA were found to affect the liver of rodents by increasing the absolute and/or relative weight of the organ (see Section 3.3.3.2). This was often found to be associated with centrilobular hypertrophy of hepatocytes. Subsequent analyses of liver tissue samples revealed that PFOS and PFOA increase the expression and activity of peroxisomal β‐oxidation enzymes, accompanied by the intrahepatic proliferation of peroxisomes.
The induction of peroxisomal β‐oxidation of PFOS or PFOA in rodents is primarily due to transactivation of the nuclear receptor PPARa, as shown in mice lacking the PPARa receptor (EFSA, 2008). Wolf et al. (2008a) addressed the question whether the induction of liver growth by PFOA is also mediated by PPARa. CD‐1 mice, WT and PPARa ‐/‐ mice (SV/129 background) were treated with seven daily gavages of the ammonium salt of PFOA (1, 3 or 10 mg/kg bw per day). PFOA induced dose‐dependent hepatocyte hypertrophy, peroxisome proliferation and labelling index (LI) of proliferating cell nuclear antigen (PCNA) labelled hepatocytes in WT mice. In KO mice, 10 mg PFOA/kg bw per day caused also a dose‐dependent increase in relative liver weight and LI but also hepatocyte vacuolation, for which the authors could not provide a reasonable explanation. The vacuolation was due to a diffuse accumulation of variably sized cytoplasmic vacuoles with fuzzy borders, which might have contributed to elevated relative liver weights and the enhanced hepatocellular replication.
Also human liver is affected by PPARa ligands. Hypolipidemic drugs of the fibrate type are ligands of PPARa and are prescribed frequently to lower elevated plasma triglyceride levels in humans. The activities of peroxisomal, mitochondrial and/or microsomal fatty acid oxidation are induced by this type of compounds. So far occurrence of hepatomegaly or intrahepatic peroxisome proliferation has not been reported for patients receiving treatment with fibrates. Due to lack in liver biopsies, products of PPARa target genes were determined in patients’ sera and elevated protein levels of APOA2, ANGPTL4 and FGF21, confirmed that PPARa agonists are able to activate effectively this receptor in human liver (Kersten and Stienstra, 2017).
For functional studies, a transgenic mouse strain was generated with the murine PPARa being replaced by the human counterpart. The transgene showed intrahepatic expression at levels similar to those of the WT animals (Cheung et al., 2004). Upon treatment with the very potent peroxisome proliferator Wy‐14.643, hPPARa mice showed lowered serum triglycerides and elevated peroxisomal, mitochondrial, and microsomal fatty acid oxidation enzymes, albeit at a somewhat lower extent than in wild‐type mice. In contrast to the WT controls, hPPARa mice did not exhibit hepatomegaly, hepatocellular DNA synthesis or elevated expression of cell cycle genes. Cheung et al. (2004) deduced that the regulation of lipid metabolism by PPARa is disconnected from the regulation of cell proliferation. One study investigated the effect of PFOA in the PPARa‐humanised murine model (Nakamura et al., 2009). Male WT, PPARa‐/‐ and hPPARa mice received the ammonium salt of PFOA at 0, 0.1 or 0.3 mg/kg bw per day for 2 weeks by gavage. PFOA increased both hepatic mRNA and/or protein levels of PPARa target genes (Cyp4a10, peroxisomal thiolase, bifunctional protein) and the relative liver weight only in WT but not in PPARa‐/‐ or hPPARa mice. In PFOA‐treated hPPARa animals, concentrations of cholesterol and triglycerides in the liver and serum remained unaffected while in the WT animals, PFOA left the serum lipid levels unchanged but increased the intrahepatic concentrations of cholesterol and triglycerides. From these studies, Cheung et al. (2004) and Nakamura et al. (2009) concluded that hPPARa might be less functionally active than the mouse variant and may not be associated with the activation of signaling cascades leading to liver growth. It has been suggested that the differences in the transactivation efficacy between hPPARa and its wild‐type counterpart in the murine model may be due to species‐specific features in coactivator recruitment and/or sequence of cis‐acting DR‐1 elements in the promoter region of the genes (Viswakarma et al., 2010).
In reporter gene assays, nuclear receptors and the responsive element of the luciferase promoter may be well attuned to each other, which allows for comparing the pure transcriptional activation of the human or rodent PPARa by ligands in an identical cellular background. When using COS‐1 cells for this assay, the lowest observed effects concentrations for PFOA were 1 μM/10 μM and for PFOS 90 μM/30 μM at the murine/human PPARa, respectively (Wolf et al., 2008b). This indicates that PFOA is more potent than PFOS and that the human receptor shows similar affinities or transactivation capacities by PFASs as the murine counterpart. Bjork and Wallace (2009) compared the gene expression patterns induced by PFOS and PFOA in rat and human hepatocytes. As observed by Wolf et al. (2008b), PFOA was more potent than PFOS in inducing transcripts (ACOT1, CYP4A11) in primary rat hepatocytes. Further experimentation with PFOA revealed that the compound elevated mRNA of ACOX and ACOT1 solely in rat hepatocytes but failed to do so in human hepatocytes or human HepG2 cells at concentrations of up to 200 μM. A significant induction of CYP4A11 at 20 μM of PFOA became evident in primary human hepatocytes, which occurred at 5 μM in the rat counterparts. This is some evidence that species‐specific features in gene regulatory processes, i.e. the interaction of the receptor with the promoter region and/or coactivator recruitment at the individual gene level may account for the absent or weak response in human liver cells to PFOA.
When PFOS and PFOA were compared to other PFASs in in vitro studies, there was a trend towards elevated transcriptional activation of both rodent and human PPARa with increasing chain length up to the length of C9 and a trend to lower activity for PFASs with chains of > C9 (Wolf et al., 2008b; Björk and Wallace, 2009; Naile et al., 2012). Wolf et al. (2014) investigated whether binary combinations of PFOS and PFOA act in an additive fashion to activate PPARa in a mouse one‐hybrid in vitro model. At low concentrations, all combinations produced concentration–response curves that resembled highly the predicted curves for both, i.e. response addition and concentration addition. However, at higher concentrations the response curves deviated from the predicted models.
3.3.5.1.2. Other nuclear receptors
Since 2008, in vivo and in vitro studies addressed the question whether further nuclear receptors may be involved in mediating the action of PFOS and PFOA. Rosen et al. (2008) compared the transcript profiles of the livers of WT and PPARa‐/‐ mice treated with PFOA for 7 days. It was shown that 85% of the genes altered by PFOA were dependent on PPARa. The PPARa‐independent genes were often involved in lipid homoeostasis and xenobiotic metabolism. These effects may be due to activation of PPARgamma, CAR (constitutive activated/androstane receptor) or the transcription factor Nrf2 (nuclear factor erythroid 2‐related factor 2). By the analyses of transcriptome patterns induced by PFOS or PFOA in rat and human primary hepatocytes, Bjork et al. (2011) deduced that multiple receptor systems, such as PPARa, CAR, PXR and LXRa, are activated by these compounds. The activation of PXR by PFOS was confirmed by Bijland et al. (2011). Ren et al. (2009) determined the potential role of CAR/PXR in mediating effects of PFOS and PFOA in rat liver by performing a meta‐analysis of transcript profiles from published studies. The authors concluded that PFOA and PFOS activate PPARa, CAR and PXR in rats, but not in chicken and fish. Long et al. (2013b) reported that 1 nM‐100 μM of PFOS or PFOA failed to transactivate the aryl hydrocarbon receptor (AhR) in a reporter gene assay using mouse hepatoma cells (Hepa1.12cR). This high level of complexity may explain that Naile et al. (2012) observed compound‐specific effects on transcript levels of 7 genes, involved in fatty acid and cholesterol synthesis in rat H4IIE hepatoma cells, e.g. PFOA induced peroxisomal 3‐ketoacyl‐CoA thiolase about sevenfold, while PFOS downregulated the gene by approximately fivefold.
3.3.5.1.3. Cytotoxicity
PFOS and PFOA may exert cytotoxicity, as shown in in vivo experiments. Elevated serum levels of AST or ALT were found in rodents at 2.5 mg/kg bw per day of PFOS (30 days of treatment) or PFOA (14 days of treatment), respectively (Yang et al., 2014; Xing et al., 2016). PPARa regulates synthesis, conjugation, and transport of cytotoxic bile acids, and thus is essential for the homoeostasis of these potentially harmful endogenous compounds. Minata et al. (2010) tested the hypothesis that activation of PPARa protects against chemically induced hepatobiliary injuries in rodents which may mask the potential toxicity of PFOA. WT and PPARa–/– mice (9–10/group) were treated with ammonium salt of PFOA (> 98% purity; 0, 5.5, 10.8, 21.6 mg/kg bw per day; by gavage) for 4 weeks. In WT mice, PFOA induced dose‐dependent hepatocellular damage. Some cholangiopathy could be observed at 10.8 and 21.6 mg/kg bw per day. In PPARa–/– mice, PFOA produced marked fat accumulation, severe cholangiopathy, hepatocellular damage, apoptotic cells, especially in bile ducts, oxidative stress and upregulation of TNF‐α mRNA. Thus, PPARa appears to be protective against PFOA‐induced hepatobiliary injury. Also Wolf et al. (2008a) observed liver toxicity of PFOA in mice lacking PPARa (see above). These findings indicate that in WT animals hepatocellular damage appears to be predominant while in animals without functional PPARa cytotoxicity occurs mainly in the biliary tract.
The reasons for the cytotoxic effects of PFOS and PFOA are not elucidated in detail so far, but may be due to an altered hepatocellular lipid metabolism, as outlined in Section 3.3.3.2. Due to enhanced peroxisomal β‐oxidation, which generates hydrogen peroxide in the first step of long‐chain fatty acid degradation, it was assumed that peroxisome proliferators, like PFOS and PFOA, may enhance the formation of reactive oxygen species and consequently of lipid peroxidation products in the liver.
Also effects on mitochondria may contribute to the cytotoxicity of PFOA. Walters et al. (2009) treated male Sprague–Dawley rats (5/group) with the ammonium salt of PFOA (no further specifications) at 0 or 30 mg/kg bw per day by gavage for 28 days. This treatment induced genes associated with mitochondrial biogenesis indicated by a preferential stimulation of mitochondrial DNA transcription. The authors suggested that this was via activation of the peroxisome proliferator‐activated receptor (Pgc)‐1α pathway. Implication of the Pgc‐1α pathway is consistent with PPARgamma transactivation by PFOA. Mashayekhi et al. (2015) treated isolated rat liver mitochondria with relatively high concentrations of PFOA (0.5–1.5 mM). This caused ROS elevation in both mitochondrial complexes I and III, mitochondrial membrane potential collapse, swelling, cytochrome c release and decreased ATP level, which induces apoptosis or necrosis.
Further biochemical alterations may affect the urea cycle. Walters and Wallace (2010) administered 0 or 30 mg/kg bw of PFOA to adult male Sprague–Dawley rats via daily gavage for 28 days. They found decreased hepatic mRNA and/or protein of urea cycle genes (Cps1, Ass1, Asl) and of the ammonia generating gene Gls2. However, the amount of S133 phosphorylated CREB, a regulator of urea cycle gene transcription, was increased. The authors concluded that PFOA favours the catabolism of lipids over proteins and thereby suppresses urea cycle gene expression.
3.3.5.1.4. Altered hepatocellular lipid metabolism
It has been assumed that the PFOS/PFOA‐induced peroxisomal β‐oxidation of long‐chain fatty acids enhances the intrahepatic generation of hydrogen peroxide, which may cause subsequent lipid peroxidation. Indeed, elevated hepatic malondialdehyde levels were reported after in vivo treatment of mice with PFOA (2.5 mg/kg bw per day) for a period of 14 days (Yang et al., 2014).
In theory, the elevated activity of peroxisomal β‐oxidation should degrade long‐chain fatty acids and the intrahepatic content of lipids should decrease. However, several studies reported on an increased hepatic lipid content after treatment of mice with PFOS at 5 mg/kg bw per day for 14 days (Wang et al., 2014a). This may be due to intrahepatic accumulation of triglycerides, as described for PFOS (6 mg/kg bw per day, Zhang et al., 2016a) and other PFASs (Kawashima et al., 1995; Zhang et al., 2008; Wang et al., 2015d). Wan et al. (2012) investigated this effect systematically and reported that PFOS elevated hepatic gene expression levels of fatty acid translocase (FAT/CD36) and lipoprotein lipase (Lpl), while serum levels of very‐low‐density lipoproteins and the rate of mitochondrial β‐oxidation were reduced. The authors concluded that the altered lipid metabolism caused the intrahepatic accumulation of fatty acids and triglycerides. Such hepatic lipid overloading may lead to steatohepatitis and may be considered a symptom for severe metabolic disturbances predisposing for hepatic inflammation and necrosis.
In contrast to enhanced lipid content as described above, reduced lipid content in murine hepatocytes was seen occasionally, as reported for PFOA (Yan et al., 2015). The authors focused on the MoA of PFOA‐induced alterations in hepatocellular cholesterol metabolism. Generally, the synthesis of cholesterol is regulated tightly by endogenous cholesterol. In the endoplasmic reticulum, SREBP (sterol regulatory element‐binding protein 1 and 2) serves as intracellular cholesterol sensor and main regulator of cholesterol biosynthesis. The transcriptional regulation of SREBPs is generally enhanced by SREBPs through a feed‐forward mechanism, insulin signalling and LXR‐RXR heterodimers (Bengoechea‐Alonso and Ericsson, 2007; Jeon and Osborne, 2012). In the presence of cholesterol, the SREBP protein binds to SCAP and INSIG‐1. If cholesterol is lacking, SREBP maturation takes place, i.e. INSIG‐1 dissociates from the SREBP‐SCAP complex, which allows the complex to migrate to the Golgi apparatus, where SREBP is cleaved. When being cleaved, SREBP translocates to the nucleus, and acts as a transcription factor for low‐density lipoprotein (LDL) receptor and HMG‐CoA reductase. The LDL receptor scavenges circulating LDL from the blood, and HMG‐CoA reductase is one of the key enzymes in the cholesterol biosynthesis.
Yan et al. (2015) observed that transcriptional activities of PPARa and SREBPs were enhanced by PFOA in mouse livers, as shown by upregulation of target genes. PFOA treatment enhanced also hepatic SREBP maturation, while proteins blocking the ER‐Golgi transport of SREBP precursors (INSIG1, INSIG2), or being involved in SREBP proteolysis were decreased. The transcript levels of miR‐183‐96‐182, which is thought to regulate SREBP maturation, were elevated by PFOA. The authors concluded that PFOA induced maturation of SREBPs by activating the miR‐183‐96‐182 cluster. Although SREBP was activated in this study, the total hepatic cholesterol was reduced. The authors hypothesised that this may be due to PPARa activation resulting in cholesterol deficiency in the liver, followed by secondary SREBP maturation.
3.3.5.2. Blood lipids
PFOS and PFOA were shown to lower serum triglycerides and/or cholesterol levels in rodents at 1.7 mg/kg bw per day and 10 mg/kg bw per day, respectively (Minata et al., 2010; Elcombe et al., 2012; Wang et al., 2013a). The opposite is true in humans showing a positive correlation between plasma cholesterol and PFOS/PFOA serum concentrations and in some, but not in all studies also a positive association between elevated triglycerides and PFOS and/or PFOA (see Section 3.3.4.7.1).
It is known since decades that PPARa agonists decrease serum triglyceride levels in rodents and humans. Via activation of PPARa they increase the activity of lipoprotein lipase, which causes a decrease in triglyceride levels. LDL changes from small, dense morphology to large particles that are more rapidly cleared by the liver. In this organ, the induced peroxisomal β‐oxidation may contribute to the degradation of long‐chain fatty‐acids, deriving from the triglycerides. PPARa activation also increases HDL production. It may be deduced that PFASs with documented PPARa trans‐activation, may act in a similar way.
The effect of PFOS and PFOA on plasma cholesterol levels appears to be more complex. In contrast to observations in rodents, human studies show a positive correlation between plasma cholesterol and PFOS as well as PFOA serum concentrations. This observation contrasts to effects of other PPARa agonists, prescribed to patients suffering from elevated blood lipids. Bezafibrate, fenofibrate or gemfibrozil are known to lower not only serum triglycerides but also the hepatic production and release of LDL‐cholesterol, albeit to a moderate and variable extent.
In general, cholesterol is transported via chylomicrons, VLDL, LDL, IDL or HDL. Chylomicrons carry cholesterol from the intestinal tract to muscle and other tissues for energy or fat production. Unused cholesterol remains in chylomicron remnants and is taken up by the liver. Cholesterol, not used for bile acid synthesis, is released from the liver via VLDL, containing apolipoprotein B100 and apolipoprotein E, and being degraded by lipoprotein lipase in blood endothelium to IDL. If IDL is not taken up by blood vessels or liver, IDL is losing gradually triacylglycerols in the bloodstream until it becomes LDL with high cholesterol concentration. Thus, LDL particles are the major blood cholesterol carriers. LDL molecules contain apolipoprotein B100, recognised by LDL receptors in peripheral tissues. LDL receptors are used up during cholesterol absorption, and its synthesis is regulated by SREBP. Accordingly, LDL receptor synthesis is activated in case of intracellular deficiency in cholesterol and vice versa. HDL particles are important for the cholesterol transport back to the liver, a process known as reverse cholesterol transport.
The positive correlation between cholesterol and PFOS/PFOA serum concentrations in humans and the inverse correlation in rodents might be explained by the fact that the hypolipidemic activity of PPARa may be activated more readily in rodents than in humans. To simulate the situations in humans several studies investigated the impact of PFASs on rodents fed with a high‐fat diet. Rebholz et al. (2016) studied PFOA effects in C57BL/6 and BALB/c mice, kept on a fat‐ and cholesterol‐rich diet. This resulted in marked hypercholesterolaemia in C57BL/6 mice but less robust hypercholesterolaemia in BALB/c mice. The PFOA‐induced hypercholesterolaemia was associated with increased liver masses and altered expression of genes associated with hepatic sterol output, specifically bile acid production. Wang et al. (2014a) fed male BALB/c mice with regular or high fat diets and treated the animals with PFOS for 2 weeks. PFOS induced lipid accumulation in hepatocytes, which was more pronounced in the high fat diet group than in groups on standard chow. Independent of the diet, all PFOS‐treated mice showed reduced levels of serum lipid and lipoprotein. The authors concluded that PFOS may inhibit the secretion and normal function of low‐density lipoproteins.
Further mechanistic studies focused on the effect of PFASs on the production of VLDL and HDL. Bijland et al. (2011) used APOE*3‐Leiden.CETP (E3L.CETP) mice, which harbour attenuated clearance of apoB‐containing lipoproteins and exhibit a human‐like lipoprotein metabolism on a Western‐type diet. Mice were kept on a Western‐type diet with PFOS for 4–6 weeks. PFOS increased weight and triglyceride content of the liver and markedly reduced plasma triglycerides, very low‐density lipoprotein (VLDL), non‐HDL‐cholesterol, HDL‐cholesterol and HDL production. The reduction in VLDL was mainly due to enhanced lipoprotein lipase‐mediated VLDL‐triglyceride clearance and decreased production of VLDL‐triglyceride and VLDL‐apolipoprotein B. The decreased VLDL‐TG production was mostly due to lowered secretion of VLDL from the liver, resulting in intrahepatic lipid accumulation. Also the hepatic concentrations of cholesteryl esters and free cholesterol were elevated. This was associated with decreased faecal bile acid excretion and decreased hepatic expression of Cyp7a1.
As outlined above, it has been shown that the serum cholesterol lowering effect of PFOS or PFOA in rodents may be due to an impaired export of cholesterol by hepatocytes. Zhang et al. (2016a) observed that one PFOS molecule forms stable ion‐pairs with two molecules of choline. Subsequently they tested the hypothesis that this mechanism results in hepatic steatosis. Groups of mice received PFOS in combination with either a standard diet a marginal methionine/choline‐deficient (mMCD) diet or a diet, supplemented with choline. mMCD aggravated PFOS effects like hepatic steatosis and triglyceride accumulation, signs of oxidative stress, and increases in serum levels of ALT, bile acids and bilirubin. Interestingly, in these animals serum PFOS concentrations became higher while liver PFOS concentrations were lower. In contrast to mMCD, supplemental dietary choline prevented PFOS‐induced effects, such as elevations in serum ALT, intrahepatic accumulation of triglyceride and oxidative damage. The authors concluded that PFOS may cause hepatic steatosis by reducing the choline required for hepatic VLDL production and export by forming an ion pair with choline.
As outlined above, Nakamura et al. (2009), treated male wild‐type, PPARa‐/‐ and hPPARa mice with 0.1 or 0.3 mg/kg bw per day of the ammonium salt of PFOA for 2 weeks. This relatively low dose of PFOA elevated the intrahepatic concentration of total cholesterol in WT animals, but left the plasma concentrations unaffected. In hPPARa mice, the basal level of total cholesterol in plasma was significantly higher than in the WT controls but was not increased further by PFOA. Furthermore, PFOA elevated transcript and/or protein levels of PPARa target genes only in the liver of wild‐type animals, but not in hPPARa mice. The authors concluded that hPPARa may be less responsive to PFOA than that of wild‐type mice when a relatively low dose is applied. The same group investigated the effect of higher doses of PFOA (1 or 5 mg/kg bw per day) in WT and hPPAR mice after a treatment period of 6 weeks (Nakagawa et al., 2012). Again, a higher basal total cholesterol level in plasma was observed in the humanised mice when compared to WT controls. When applying 5 mg PFOA/kg bw per day, the intrahepatic cholesterol concentrations were not affected while total cholesterol in plasma was lowered in both, hPPARa and WT animals. This indicates that in hPPARa mice, PFOA‐induced effects on the cholesterol metabolism are divergent to WT animals at the low doses only, when insufficient transactivation of hPPARa may occur. There is one mechanistic study in humans. Fletcher et al. (2013) investigated the expression of genes involved in cholesterol metabolism in 290 individuals exposed to PFOS and PFOA via drinking water. In men there were reduced mRNA levels of genes involved in cholesterol transport (Niemann Pick type C1, NPC1; ATP‐binding cassette subfamily G, ABCG; PPARa) at elevated PFOA levels. In women, there were elevated levels of mRNA of a gene being important for cholesterol mobilisation (neutral cholesterol ester hydrolase 1, NCEH1). There was also a positive association between PFOS levels and expression of genes involved in both cholesterol mobilisation and transport in women (NCEH1, PPARa), but this was not observed in men. The authors concluded that these alterations may partly explain the development of hypercholesterolaemia by PFOS and PFOA.
To conclude, there is no clear mechanistic explanation for the observation that PFOS reduces the blood cholesterol level in rodents and exert the opposite effect in humans. The same holds for PFOA, although involvement of PPARa in mediating these divergent responses cannot be excluded.
3.3.5.3. Immunotoxicity
Both in rodent and in human studies, effects on the immune system have been noted (see Sections 3.3.3.5 and 3.3.4.5). An important outcome of both exposure to PFOS and PFOA was the depression of antibody responses to vaccination. Different components of the immune system come into action while producing specific antibodies, such as macrophages/antigen presentation cells, and lymphoid cells. In vitro studies, using these cells, or cell lines representing these cells, have been carried out.
Brieger et al. (2011) isolated peripheral blood mononuclear cells (PBMCs) from heparinised whole blood collected from eleven human donors. They incubated the cells with 15.6, 31.3, 62.5, 125, 250 or 500 μg/mL PFOA (ammonium salt) for 24, 48 and 72 h to assess cytotoxicity, or with 0, 1, 10 or 100 μg/mL PFOA and concanavalin A to investigate the effect on cell proliferation. A decrease in viability of PBMCs was observed following exposure to 250 and 500 μg/mL. In the absence or presence of concanavalin A, PFOA induced no significant differences in numbers of proliferating T lymphocytes. There was a linear relationship between LPS‐stimulated TNF‐α and IL‐6 release and the donor's past PFOA exposure.
Corsini et al. (2011) investigated the in vitro immunotoxic potential of PFOA (ammonium salt) and PFOS (potassium salt) on human peripheral blood leucocytes (PBLs) from whole blood, and the macrophage like cell line THP‐1. Cells were incubated with 0, 0.1, 1 or 10 μg/mL PFOA alone or in the presence of LPS or PHA. PFOA caused no cytotoxic effects on whole blood cells or THP‐1 cells at up to 100 μg/mL for 48 h. PFOA induced a dose‐related decrease in LPS‐induced TNF‐α release in PBLs whereas IL‐6 and IL‐8 were unaffected. Following PHA stimulation of PBLs, PFOA (10 μg/mL) decreased the release of T‐cell derived cytokines IL‐4 and IL‐10, whereas IFN‐γ was unaffected. In THP‐1 cells, PFOA decreased LPS‐induced TNF‐α release as well as TNF‐α mRNA levels (≥ 10 μg/mL), and caused a significant reduction in IL‐8 release (≥ 100 μg/mL). Promoter activity for NF‐κB was also shown to be reduced in a dose‐dependent manner, confirming NF‐κB as a cellular target for PFOA. In studies using THP‐1 cells, PFOA‐induced inhibition of cytokine release at 100 μg/mL was reversed in cells in which PPARa silencing was applied. PFOA inhibited LPS‐induced phosphorylation of p65, necessary for NF‐κB transcription. PFOA also activated PPARa in THP‐1 cells but did not prevent I‐κB degradation.
Singh et al. (2012) incubated HMC‐1 cells (mast cell line) with PFOA to assess histamine release (25–150 μM PFOA for 24 h) and intracellular calcium (200 μM PFOA for 10 min). mRNA analysis, nuclear protein extraction and western blotting (1 h treatment at 50–200 μM) were also undertaken. PFOA induced a time‐ and concentration‐dependent release of histamine from HMC‐1 cells and increased intracellular levels of calcium. The gene expression of TNF‐α, IL‐1β, IL‐6, IL‐8 and β‐actin were all increased dose dependently, peaking at 12 h after exposure. Phosphorylation of p38 was also increased in HMC‐1 cells following exposure to ≥ 50 μM PFOA as well as the translocation of p65 NF‐κB to the nucleus and degradation of IκBα. In addition a dose‐dependent activation of caspase‐1 and COX‐2 were reported.
These in vitro studies support immunotoxicity by PFOA as evidenced by animal and by human studies, showing effects on cells of the immune system, shedding some light on possible molecular interactions such as NF‐κB as a target for PFOA.
In the study by Brieger et al. (2011), PBLs from eleven human donors were also incubated with 3.9, 7.8, 15.6, 31.3, 62.5 or 125 μg/mL PFOS (potassium salt) for 24, 48 and 72 h to assess cytotoxicity, or with 0, 1, 10 or 100 μg/mL PFOS and ConcanavalinA to investigate cell proliferation. No significant reduction in cell viability was observed although limited solubility prevented the higher concentrations being used. No significant effect was noted on cell proliferation. PBMCs were also treated with LPS or PHA in the presence of 0, 0.1, 1, 10 or 100 μg/mL PFOS to assess cytokine release. Basal TNF‐α and IL‐6 levels were increased slightly following PFOS exposure for 48 h. In the presence of LPS, TNF‐α release was reduced by 100 μg/mL PFOS. In contrast, IL‐6 release was slightly enhanced, although not significantly. Blood‐donor plasma PFOS levels were associated with LPS‐induced IL‐6 release, but not of TNF‐α.
Midgett et al. (2015) noted suppressed IL‐2 production by Jurkat cells after exposure to PFOS in vitro. Human PBLs from whole blood and THP‐1 cells were treated with 0, 0.1, 1 or 10 μg/mL PFOS (potassium salt) in the presence of LPS or PHA. PFOS induced a dose‐related decrease in TNF‐α and IL‐6 release in PBLs, whereas IL‐8 was unaffected. Regarding PHA stimulation of PBLs, PFOS (0.1 μg/mL) decreased the release of the T‐cell derived cytokines, IL‐4, IL‐10 and IFN‐γ. PFOS caused no cytotoxic effects on whole blood cells or THP‐1 cells at up to 100 μg/mL PFOS for 48 h, but prevented LPS‐induced IκB degradation. IκB degradation is required for NF‐κB translocation to nuclei. In studies using THP‐1 cells, the effect of PFOS on LPS‐induced cytokine release was unaffected by PPARa silencing (Corsini et al., 2011). In a later study by the same authors, human PBLs and THP‐1 cells were also incubated with PFOS (0.1–10 μg/mL) in the presence of LPS or PHA (PBLs) in order to examine the effects on the inflammatory cytokine response (Corsini et al., 2012). PFOS inhibited the release of TNF‐α, IL‐6, IL‐10 and IFN‐γ from PBLs and THP‐1 cells. PFOS also prevented LPS induced I‐κB degradation and inhibited NF‐κB activation in THP‐1 cells by inhibiting LPS‐induced phosphorylation of P65, necessary for NF‐κB transcription. PFOS did not activate PPARa in THP‐1 cells (Corsini et al., 2012).
Zhang et al. investigated PFOS‐induced apoptosis in murine N9 immune microglial cells (Zhang et al., 2011) and immunocytes (Zhang et al., 2013d). In N9 cells, typical apoptotic cell morphology was observed at 50 μM (condensed chromatin and cellular swelling), 100 μM (chromatin margination and loss of cell volume) and 200 μM (punctate distorted cell membrane). Apoptotic peaks and the percentage of apoptotic cells were also increased in a dose‐dependent manner (2.24, 3.97, 8.32, 20.81, 33.26 and 58.72% for 0, 5, 10, 50, 100 and 200 μM, respectively). PFOS (50 μM) also caused disruption of mitochondrial membrane potential after 24 h exposure, and 5 μM PFOS increased expression of p53, Bax, caspase‐3 and caspase‐6 after 24 and 48 h). Quantities of 50 and 100 μM PFOS downregulated expression of Bcl‐2 after treatment for 24 and 48 h.
Lv et al. (2015) studied effects of in vivo exposure of mice to 2.5–10 mg/kg per day for 31 days followed by a one week recovery period. Global gene expression profiling of the spleens and QRT‐PCR analysis affected genes involved in cell cycle regulation and NRF2 oxidative stress response, and upregulated those in T‐cell, calcium signalling and p38/MAPK signalling pathways.
Based on these results, it may be suggested that PFOS could disturb homoeostasis in lymphoid and other immune related cells, partly by interfering with lipid metabolism and by impacting NF‐κB transcription and affecting gene expression of apoptotic regulators, all resulting in apoptosis and eventually depressed immune functionality and activation of T‐cell receptor signalling and calcium ion influx.
Pennings et al. (2016) studied associations between PFASs exposure measured in maternal blood and gene expression in cord blood in a human cohort. Results from this cohort, was already described in 3.3.4.5.3. (Granum et al., 2013) and indicated an exposure related decrement in antibody responses to vaccination. Pennings et al. (2016) identified 52 genes out of 19,595 tested in this cohort, that were associated with exposure as well as with rubella titres and/or common cold episodes in the offspring up to 3 years of age. The gene set contains several immunomodulatory (and immune associated genes) and suggests PPARdelta and NF‐κB to be involved in the modes of action. Whereas PFOA and PFOS may share common modes of action, there are also differences, as PFOA was not able to suppress IL‐2 production by Jurkat cells in vitro, whereas PFOS could (Midgett et al., 2015).
In concert, the in vitro information supports the in vivo findings that both PFOS and PFOA influence the immune system. This could be brought about by impacting NF‐κB transcription and affecting gene expression of apoptotic regulators, resulting in apoptosis and eventually depressed immune functionality and activation of T‐cell receptor signalling. PFASs may modulate gene regulation, perhaps through certain PPARs, which may be involved in the regulation of immune responses. Yet, there may also be differences in the effects caused by PFOA and PFOS, respectively, as cytokine profiles in lymphoid cells were reported to be differentially affected in one study.
This information on the mode of action of PFOA and PFOS corroborate the findings in humans that PFOA and PFOS exposure may be adversely associated with a reduced antibody response following vaccination as indicated in Section 3.3.4.5.3 and possibly to an increased propensity for infection. From this information, it is however not possible to conclude which PFASs may be the more potent to cause such effects.
3.3.5.4. Birth weight
Reduction of birth weight represents an effect, which was associated with human exposure to PFOS and PFOA (see Section 3.3.4.2.1). Whether there is a correlate in toxicological studies in rodents is debated. Koustas et al. (2014), for example, selected PFOA effects on fetal growth for their prototypic application and testing of the navigation guide systematic review method on animal data. Using this approach, their major conclusion was that the review provided sufficient and clear evidence for PFOA effects on fetal mammalian as well as on non‐mammalian growth and thereby supports effects on reduced human birth weight in epidemiological studies (see Section 3.3.4.2.1). The influence of PFOS and PFOA on fetal growth was consistently seen in animal studies, the effect became usually apparent at higher doses of these compounds than doses at which the most sensitive endpoint was identified in the respective study (see Section 3.3.3.3). Since the effective animal serum concentrations were estimated to be several orders of magnitude higher than those in humans, Negri et al. (2017) concluded that the available toxicological evidence, at least in a quantitative perspective, does not support the epidemiological associations.
Mechanistically, the effects of PFOS and PFOA on birth weight in human and animal studies could be due to reduced growth, as well as to a disturbed energy balance. Hormones of the growth hormone/IGF‐1 axis are intimately linked to growth control. In 6‐ to 9‐year‐old children, Lopez‐Espinosa et al. (2016) showed an inverse relation between serum levels of PFOS and IGF‐1, suggesting an impact of PFOS on the level of this growth mediating hormone. This association was accompanied by reduced levels of sex hormones in the exposed population. A first hint pointing to the involvement of a disturbance in the growth hormone/IGF‐1 axis after exposure to PFOS and PFOA comes from observations in salmon species (Spachmo and Arukwe, 2012), where a downregulation of the expression of members of these axes in response to PFOS and PFOA was observed.
Two studies showed, that exposure to peroxisome proliferators, amongst them PFOA (0.02% added to chow meaning 200 mg/kg feed) for 7 days, leads to a considerable reduction of body weight in mice (Xie et al., 2002, 2003). In the same study it was also shown that this massive weight loss is paralleled by a considerable loss of white adipose tissue in mice. This could not be explained by a reduced food intake observed the 2nd day. Shabalina et al. (2015) followed up on this observation in a similar experiment with 0.02% compound added to chow, an observation period of 10 days using wild‐type and UCP‐1 knock‐out mice. In this follow‐up study, PFOA and PFOS induced reduction in food intake. This effect was more pronounced in response to PFOA than to PFOS and by far more pronounced in WT animals than in UCP‐1 knock‐out mice. The overall response to PFOA and PFOS correlated with an upregulated expression of UCP‐1 in brown adipose tissue of animals (Shabalina et al., 2015). Usually activation of UCP‐1 and its binding to the inner mitochondrial membrane in brown adipose tissue triggers the rapid generation of large amounts of heat in the brown adipose tissue (Symonds et al., 2015). The effect on body weight reduction mediated through UCP‐1 upregulation in response to PFOS and PFOA in the comparative study with UCP‐1 wild‐type and knockout mice was only to a minor degree due to increased thermogenesis and not due to food aversion, as tested in a food preference test. It was therefore assumed that it rather represents a direct effect of UCP‐1 expression on food uptake (Shabalina et al., 2015). PFOS‐ and PFOA‐induced upregulation of UCP‐1 in the light of the developmental biology of brown adipose tissue with a first appearance around mid‐gestation, an increase until birth and a gradual loss through childhood, adolescence and adulthood (Symonds et al., 2015), may contribute to the observed reduction of birth weight in epidemiological studies (see Section 3.3.4.2.1).
3.3.5.5. Carcinogenicity
3.3.5.5.1. Liver
In a carcinogenicity study in rats, performed before 2008, PFOS was found to be tumorigenic in the liver (EFSA, 2008). This was confirmed by the re‐evaluation of the histological material (Butenhoff et al., 2012b). Due to the absence of genotoxicity of PFOS in a series of assays, it was assumed that the tumourigenic activity is based largely on a tumour‐promoting effect of this compound. This assumption was substantiated in a trout two‐stage chemical hepatocarcinogenesis model (Benninghoff et al., 2012).
There are three carcinogenicity studies on PFOA, which were conducted before 2008. In two of these studies, PFOA induced the formation of liver tumours. The third study applied a two stage model of hepatocarcinogenesis and found that PFOA acts as a liver tumour promoter in rats.
Many compounds with a documented PPARa‐agonistic mode of action are liver tumour promoters in long‐term rodent bioassays. It was deduced that the PPARa‐mediated induction of liver growth and/or alterations in lipid‐metabolism may be causally involved in rodent hepatocarcinogenesis. This was confirmed when applying PPARa‐/‐ mice, which often were found to be insensitive towards the tumour‐promoting effects of peroxisome proliferators. However, there are exceptions. Liver injury and hepatocarcinogenesis were observed in knockout animals, when exposed in utero to PFOA (Filgo et al., 2015) or postnatally to di‐ethylhexylphthalate in a long‐term study (Ito et al., 2007). It was hypothesised that an increase in oxidative stress and an intrahepatic deregulation of synthesis and secretion of bile acids cause a higher susceptibility of the knock‐out mice (Ito et al., 2007; Li et al. 2017).
PPARa‐humanised transgenic mice were used to study whether hPPARa mediates not only metabolic alterations but also liver growth, an effect considered causally involved in hepatocarcinogenesis. When treated with the peroxisome proliferator fenofibrate, mice expressing hPPARa, showed reduced serum triglycerides and induction of PPARa target genes in the liver and various other organs to an extent being close to that of WT animals. However, no hepatomegaly or hepatocyte proliferation was evident in these mice. This may indicate that PPARa regulates enzymes of lipid metabolism and liver growth by different modes of action (Yang et al., 2008). The peroxisome proliferator WY‐14.643 induced peroxisomal β‐oxidation in humanised mice, but did not promote liver tumour formation (Morimura et al., 2006). This indicates that transactivation of hPPARa by some peroxisome proliferators may alter lipid metabolism but fails to induce liver growth and liver tumour formation in rodents (Corton et al., 2014). Observations in patients, subjected to long‐term fibrate therapy, support the concept that hPPARa mediates rather metabolic effects than growth in human liver as well (see Section 3.3.5.1).
3.3.5.5.2. Testis
Before 2008, two independent carcinogenicity studies have brought evidence that PFOA induces Leydig cell adenomas in rats (EFSA, 2008). One of the studies was subjected to re‐evaluation confirming the enhanced occurrence of this tumour entity (Butenhoff et al., 2012b). While Leydig cell tumours occur frequently in rats and mice, they are diagnosed rarely in humans. This is largely due to quantitative and qualitative species differences in Leydig cell response to hormonal stimuli (Rasoulpour et al., 2014). In rodents, there are several modes of actions for the induction of this tumour by chemical compounds. In most cases, the primary causes are reduced bioavailability or impaired activity of testosterone leading to sustained increases in circulating luteotrophic hormone, which stimulates growth of Leydig cells. This growth stimulation leads to hypertrophy/hyperplasia and ultimately to tumour formation in the testis.
Previous studies reported on lowered serum testosterone and increased oestradiol levels in male PFOA‐treated rats (Cook et al., 1992; Biegel et al., 1995; Liu et al., 1996). This hormonal dysbalance may be due to induction of the cytochrome P450 isoenzymes, involved in steroid hormone biosynthesis, and of aromatase, the key enzyme of oestrogen biosynthesis (Kraugerud et al., 2011; Gorrochategui et al., 2014; Kang et al., 2016). There is some evidence that also PPARa may be involved in the inhibition of testosterone biosynthesis (Gazouli et al., 2002; Li et al., 2011). Reduced serum testosterone levels, lower reproductive organ weights, and elevated sperm abnormalities were found in PFOA‐treated male WT and humanised PPARa mice, but not in knock‐out animals. Furthermore, PFOA‐treated WT and humanised PPARa animals showed a lowered conversion of cholesterol to pregnenolone and androstanedione in the testis.
3.3.5.5.3. Pancreas
Two studies on the carcinogenicity of PFOA in the pancreas of Sprague–Dawley rats brought contradictory results (Sibinski, 1987; Biegel et al., 2001; Butenhoff et al., 2012b). While one study reported an enhanced occurrence of acinar cell adenoma, the other one could not find any tumorigenic alterations despite of the same PFOA dose and rather similar experimental conditions. Histological material of the two studies was re‐evaluated (Caverly‐Rae et al., 2014). The tumour occurrence in one of the studies was not confirmed. However, evidence for pancreatic hyperplasia was found in both studies indicating that the growth of this organ may be induced by PFOA.
Pancreatic hyperplasia is considered to proceed the development of adenoma and carcinoma. However, the likelihood for progression has not been studied in detail so far. The proposed MoA for the induction of pancreatic acinar cell proliferative lesions by PFOA and further PPARa agonists is based essentially on investigations of WY14.643 (Obourn et al., 1997). In WY‐14.643‐treated rats, hepatic PPARa activation changed the bile acid composition and decreased the total output of bile acids, which caused enhanced secretion of cholecystokinin (CCK) from the intestinal mucosa. In the rat, CCK binds to acinar CKK1 receptor and acts as a growth factor for this cell type. In humans, however, exocrine pancreatic secretion is regulated by a neuronal, cholinergic pathway. In addition, human pancreatic cells do not express functional CCK receptors (Adler et al., 1991; Ji et al., 2001). Thus, this MoA of pancreatic tumour formation appears to be irrelevant for humans.
3.4. Critical effects, dose–response assessment and derivation of a health‐based guidance value
As described below, associations between serum levels of PFOS/PFOA and several health outcomes were considered to be causal and adverse. The majority of these studies were not available for the previous opinion in 2008. In addition, the toxicokinetics of PFOS/PFOA are very different in animals and humans. For the present opinion, the CONTAM Panel decided to use human observations when assessing critical effects and for derivation of an HBGV.
3.4.1. Critical effects
In the Sections on Observations in humans (Section 3.3.4), the CONTAM Panel assessed a large number of epidemiological studies on a number of different health outcomes. Exposure was based on serum/plasma levels of PFOS and/or PFOA, in most cases measured, but in a few cases also estimated from historical serum levels. The following outcomes were considered potential critical effects, i.e. effects for which the evidence of causal associations with exposure to PFOS or PFOA were considered sufficient:
increased serum cholesterol (indicating an increased risk of future cardiovascular disease);
increased prevalence of abnormal serum levels of ALT (indicating an effect on hepatocytes);
decreased antibody response after vaccination (indicating impaired immune function);
decreased birth weight ((which may increase risk of low birth weight below 2,500 g) and risk of future disease).
The rationale for selecting these potential critical effects is presented below, as well as the issue of adversity. For other outcomes described in Section 3.3.4 the evidence for causal associations with PFOS/PFOA were considered insufficient.
3.4.1.1. Serum cholesterol
As described in Section 3.3.4.7.1 and Table 23, 26 studies from 16 different cohorts published on associations between PFOS and/or PFOA and total cholesterol in serum, show consistent positive associations between these PFASs and both serum total cholesterol and for LDL cholesterol.
Table 26.
Summary of the BMD analysis – PFOA
| Human response variable | BMD5 (ng/mL) | BMDL5 (ng/mL) | Number of people (cohort) | Data type | Model used | Reference |
|---|---|---|---|---|---|---|
| Total cholesterol | 12b | 9.4b | 46,294 (C8 health project) | Decile | Lognormal cumulative | Steenland et al. (2009)c |
| 12.4 | 9.2 | 753 (Danish cohort 1996–2002) | Octile | Lognormal cumulative | Eriksen et al. (2013)d | |
| Alanine transferasea | 80 | 21 | 47,092 (C8 health project) | Decile | Logistic | Gallo et al. (2012)e |
| Birth weight | 14.5 | 10.6 | 1,400 (Danish national birth cohort 1996–2002 | Decile | Linear | Fei et al. (2007)f |
| 4.4 | 4.0 | 901 (Norwegian mother and child cohort) | Quartile | Exponential | Whitworth et al. (2012a)g |
BMD: benchmark dose; BMDL5: benchmark dose for a 5% increase; PFOA: perfluorooctanoic acid.
BMD3 and BMDL3 for alanine transferase.
This was modelled extrapolating to a reference value of 1 ng/mL PFOA in serum (half the median of the median PFOA in Table 8). A 5% increase in the response observed in the lowest quantile could not be modelled.
See also Steenland (2017) under ‘Documentation provided to EFSA’.
See also Sørenson (2017) under ‘Documentation provided to EFSA’.
See also Fletcher (2017b) under ‘Documentation provided to EFSA’.
See also Danish national birth cohort (2017) under ‘Documentation provided to EFSA’.
See also Whitworth (2017) under ‘Documentation provided to EFSA’.
As elaborated in the same section, it has been discussed whether these associations are not caused by exposure to PFOS or PFOA, but instead are the results of reverse causation or confounding. The CONTAM Panel concluded that reverse causation is not likely, and that confounding has been examined by adjustment and by special sensitivity analyses.
Many of the studies referred to in Section 3.3.4.7.1 found associations with serum cholesterol both for PFOS and PFOA, and these two compounds were often correlated. In two of the studies used for dose–response assessment this was the case, being the studies by Nelson et al. (2010) and Eriksen et al. (2013) with Spearman correlation coefficients of 0.65 (Nelson et al., 2010) and 0.70 (Eriksen et al., 2013). However, in the largest study based on the C8 cohort exposed to PFOA‐contaminated drinking water (Steenland et al., 2009) the correlation was modest (Spearman 0.32). With a data set of 46,000 adults, separate effects of the two compounds can more easily be disentangled. If PFOS and PFOA were both included in the same model, associations were still statistically significant, but attenuated by 20–30%.
The CONTAM Panel also noted that animal studies have shown decreased (not increased) serum cholesterol levels after exposure to PFOS and PFOA. However, the exposure levels in these animal studies were more than 1,000‐fold higher (4–20 mg/kg bw per day; serum levels about 40 μg/mL) than in the human studies, and the toxicokinetics in animals and humans are different. Moreover, the mechanisms in the animal studies include activation of PPARa (see Section 3.3.5.1). As shown by studies in transgenic mice, human and rodent PPARa appear to differ in function which may affect the lipid/cholesterol metabolism in a species‐specific way. Therefore, the CONTAM Panel considers that the findings for cholesterol in animals cannot be used as evidence against the causal association between PFOS/PFOA and cholesterol in humans.
Typical mean or median serum cholesterol levels in the US or European studies of associations with PFOS/PFOA in the 1990s and 2000s have been 5–6 mmol/L (195–230 mg/dL) with an SD of about 1 mmol/L (about 40 mg/dL). The adversity of increased serum cholesterol is well established also within the reference range where it increases the risk of cardiovascular mortality, especially ischaemic heart disease, and to some extent ischaemic stroke (Lewington et al., 2007; Piepoli et al., 2016) in prospective observational studies. Also, treatment with cholesterol‐lowering drugs decreases the cardiovascular risk (Mihaylova et al., 2012; Piepoli et al., 2016) at these moderate serum cholesterol levels. This supports a conclusion that a moderate increase of serum cholesterol caused by PFOS and PFOA is an adverse effect. The interpretation by the CONTAM Panel of the studies by Lewington et al. (2007), Piepoli et al. (2016) and Mihaylova et al. (2012), is that a 5% increase in total cholesterol will increase the risk of cardiovascular disease by at least 5%, which is a clinically relevant risk. This was the reason for selecting serum cholesterol as a continuous variable, rather than relying only on the prevalence of abnormally high cholesterol levels. Data provided (Fletcher, 2017a) showed that serum cholesterol levels were approximately normally distributed and an increase of serum cholesterol levels by 5% would results in an increased prevalence of cholesterol levels above the reference range (240 mg/dL) by more than 5%.
The adversity of increased serum cholesterol is based on its well‐established causal association with risk of cardiovascular disease, but there are only few large studies on associations between exposure to PFOS/PFOA and cardiovascular disease.
For PFOS, only one study was identified: Lin et al. (2013b, 2016) found a slight positive but statistically significant trend of increase in carotid artery intima media thickness (CIMT) with increasing serum PFOS in 644 young individuals in Taiwan, after adjustment for potential confounders (5% increase in Q3 and 4% in Q4). CIMT is, however, not a clinically relevant outcome in young people.
For PFOA, a cross‐sectional study by Shankar et al. (2012) found significant positive associations between serum PFOA and self‐reported cardiovascular disease (coronary heart disease or stroke) with an odds ratio of about 2 in 1,200 NHANES participants. Also, the risk of peripheral artery disease (PAD, measured ankle‐brachial index < 0.9) was significantly increased. A study of the large C8 cohort showed a slight, and mostly statistically significant association between serum PFOA and the incidence of stroke (Simpson et al., 2013). Another study of the same cohort showed, however, no increase of coronary heart disease, and the point estimates of relative risk in the upper range of PFOA levels were around or below 1.0 (Winquist and Steenland, 2014b). A longitudinal study in an occupational cohort showed no statistically increased risk of ischaemic heart disease mortality. The point estimate for the hazard ratio was 1.1 in the top quartile (5‐year lag) using the lowest quartile as reference (Sakr et al., 2009). No association between PFOA and CIMT was found in the study of young individuals from Taiwan (Lin et al., 2013b, 2016).
Thus, there are no relevant studies of associations between PFOS and cardiovascular disease.
For PFOA, the results across studies are not consistent and they were not powered well enough to show a small increase in risk (RR 1.05–1.1). Therefore, the epidemiological studies of PFOS/PFOA vs cardiovascular disease are not helpful in the assessment of the adversity of increased serum cholesterol due to exposure to these compounds.
3.4.1.2. High serum ALT
As described in Section 3.3.4.7.2 and Table 24, we identified 10 studies from eight cohorts published on associations between PFOS and/or PFOA and serum ALT. Some were early occupational studies with very high exposure to PFOA (Sakr et al., 2007a,b). A large cross‐sectional study of the C8 cohort (Gallo et al., 2012) showed an association between serum levels of PFOS/PFOA and ALT, and for PFOA this was supported in a longitudinal study using modelled exposure based on PFOA intake from drinking water (Darrow et al., 2016). Two NHANES studies (Lin et al., 2010; Gleason et al., 2015) also found associations between PFOA and ALT, while results for serum PFOS were inconsistent.
Thus, there is a consistent positive association between PFOA and ALT at high occupational exposure, in the C8 cohort (cross‐sectionally and longitudinally) and in two NHANES surveys. For PFOS an association was only shown in one large cross‐sectional study of the C8 cohort.
For other liver enzymes than ALT (e.g. GGT), or liver function tests such as bilirubin, the information is limited or there is no consistent association with PFOA.
Common causes of elevated liver enzymes such as ALT are obesity, insulin resistance, high alcohol consumption, various medications, hepatitis, and various systemic diseases. BMI and alcohol were adjusted for in the studies summarised above. It seems likely that the association between PFOA and liver enzymes is causal. However, the CONTAM Panel considers a small increase in serum ALT within the reference range not to be an adverse effect. One reason for this is that no association between serum PFOA and liver disease has been shown in a well‐powered study with diagnoses validated in medical records (Darrow et al., 2016). Second, the most common liver disease associated with an increase of serum ALT is non‐alcoholic fatty liver disease (NAFLD). But the main pathophysiologic factor for NAFLD is the metabolic syndrome, characterised by central obesity, insulin resistance, and often also hypertension, increased TG, and decreased HDL and no association between serum PFOA and the metabolic syndrome has been shown. Third, no consistent associations have been shown with the more liver‐specific enzyme GGT or the liver function test bilirubin.
In the highly exposed C8 cohort, an association was, however, also found between serum PFOA and serum ALT above the reference range. The CONTAM Panel considers this to be an adverse effect of PFOA in spite of the argument raised above against adversity of a small increase of serum ALT within the reference range. The reason for this is that an ALT level above the reference range is clinically more relevant and less sensitive to confounding than an increase within the reference range.
3.4.1.3. Antibody response
As described in Section 3.3.4.5.3, one study among children (Grandjean et al., 2012) and three studies among adults (Looker et al., 2014; Kielsen et al., 2016; Stein et al., 2016b) have examined the association between prebooster concentrations of PFOS and PFOA and serum antibody concentrations following booster vaccination to different vaccines. For both PFOS and PFOA, relatively strong and consistent inverse associations were observed for prenatal (~gestation week 32) and postnatal (offspring age 5 years) exposures with offspring post‐booster antibody concentrations to diphtheria at 5 and 7 years. For tetanus, similar but less pronounced associations were observed. A similar inverse association between serum PFOS concentrations (non‐significant for PFOA) and antibody response to diphtheria following vaccination was also observed in a small Danish study of 12 healthy adults (Kielsen et al., 2016). Similar but not statistically significant trends were reported in adults using three different influenza vaccines (Looker et al., 2014, n = 411) while no such trends were observed among 78 adults where another influenza vaccine was used (Stein et al., 2016b). In these two studies among adults, the response to the vaccination was modest to low with around 60–80% reaching protective levels (defined as fourfold increase in antibody titre) in the study by Looker et al. (2014), while the corresponding number in the study by Stein et al. (2016b) was as low as 9%. Limited response to the vaccination will inevitably lead to less precision in the outcome measure making it less likely that the study is able to detect an association in cases where a true association exists.
Further support for the findings observed in the studies by Grandjean et al. (2012) and Kielsen et al. (2016) comes from observational studies where inverse associations between maternal serum concentration of PFOS and PFOA and serum antibody concentrations to rubella were observed when the offspring were 3 years old (Granum et al., 2013). Significant inverse associations with serum antibody concentrations to rubella and mumps were also observed by Stein et al. (2016a) in 12‐ to 19‐year‐old US adolescents. Information on the timing of the vaccination of these children is lacking, but as it is recommended in the US that children are vaccinated prior to school age, it can be assumed that they were vaccinated before reaching adolescence. The effect noted may therefore represent an effect caused by exposure during childhood rather than during adolescence.
In addition to effects on vaccination responses, associations between maternal concentrations of PFOS and PFOA and offspring rate of infections have been reported in some (Granum et al., 2013; Dalsager et al., 2016) but not all studies (Fei et al., 2010a; Okada et al., 2012). Of these studies, the study by Dalsager et al. (2016) was considered most robust as information on infections was collected weekly during follow‐up using text message instead of relying on retrospective parental report (Okada et al., 2012; Granum et al., 2013) or highly selected outcomes such as hospital admission to any infection (Fei et al., 2010a).
As with all observational studies statistical significance is by no means evidence that the observed association is causal. However, the study by Grandjean et al. (2012) and later studies have a strong experimental component where antibody production is initiated through vaccination and the increase in antibody concentrations is followed prospectively in relation to baseline concentrations of PFOS and PFOA. A potential confounder would, therefore, have to be (1) a determinant of antibody production initiated and (2) a determinant of exposure.
As discussed in Section 3.3.4.5.3, the Faroe Island children studied by Grandjean et al. (2012) were exposed to PCBs, which were also associated with reduced antibody response to the same vaccines. The correlations between PCBs and PFOS/PFOA were weak, and adjustment for PCB exposure did not attenuate associations between PFOS/PFOA and antibody response. Therefore, the CONTAM Panel concluded that the association between PFOS and PFOA with serum antibody concentrations is more likely to be causal than confounded. It is, however, possible that exposure to PCBs could affect the exposure‐response relation between PFOS/PFOA and antibody response.
These results from human observational studies are partly supported by experimental animal studies. In these studies animals were exposed to either compound, and subsequently immunised to sheep red blood cells or to KLH, models which mimic vaccination to a T‐cell‐dependent antigen. Antibody responses, as measured in the serum of these animals, were reduced (see Section 3.3.3.5). Although the animals were exposed to doses several orders of magnitude higher compared to those observed in humans, this information is in line with the findings in humans.
The adversity of reduced antibody response is well established in the sense that a suboptimal response to a vaccine may result in a suboptimal protection. For many vaccinations, thresholds of antibody levels that are protective are not well known, and for practical reasons only established by convention. Vaccination schemes are carried out so, that there is a very good protection, whereas a minor decrement in antibody levels may not imply a clinical consequence. However, certain individuals that are at the lower end of the magnitude of the vaccination response may, because of exposure to PFASs, end up having insufficient titres.
In addition to indicating an influence on the protection gained after vaccination, an effect on the vaccination response may also signify a more general effect on the functionality of the immune system. In experimental animals, effects on antibody responses to T‐cell‐dependent antigens correlate well with effects on host resistance to infections (Luster et al., 1993). For PFASs, this is in line with the findings of effects on the incidence of infections that were observed in children.
Since the date for inclusion of the studies for this opinion, several studies on PFOS (and PFOA) have been published on infections and vaccination related outcomes (Goudarzi et al., 2017; Grandjean et al., 2017; Impinen et al., 2018) and the results from these studies have been in general agreement with the conclusions drawn in this opinion. In particular, the results from the Hokkaido Study on Environment and Children's Health (n = 1,558) showed a positive association between maternal PFOS concentration in pregnancy (median 4.9 ng/mL) with increased odds of infections in the offspring up to 4 years of age.
In summary, although few studies have been conducted to date, there is strong evidence to suggest that serum concentrations of PFOS and PFOA are inversely associated with antibody response in children. The information on possible effects on vaccination titres in adolescents and adults is inconsistent. This may be a consequence to some extent the type of infection that the vaccine targets. More importantly, it is generally accepted that especially the developing immune system is vulnerable to effects of exposure to immunomodulation agents, and this is represented by the strong evidence available in children and the inconsistent information in adolescents and adults. Effects, if any, noted in adolescents and adults, are modest and the clinical relevance can be questioned.
Although inverse associations for PFOS and PFOA and serum antibody response have been reported these associations have been slightly more pronounced for PFOS compared to PFOA (Kielsen et al., 2016; Stein et al., 2016b). Furthermore, in the Grandjean et al. (2012) study, the combined exposure to PFOS, PFHxS and PFOA was more strongly associated with serum antibody concentrations compared to the individual associations for each of these compounds. Of these three compounds, PFOS accounted for 78% of the total exposure and the correlation between PFOS and PFOA in the 5‐year‐old children was around 0.50. A correlation of similar strength has frequently been observed between PFOS and PFOA meaning that statistically independent associations for the two compounds are difficult to disentangle. Based on the above, there is some indirect evidence to suggest that PFOS may be more detrimental which may simply relate to its higher concentrations. As a result, the association for PFOA may be partly confounded by PFOS (the vice versa may also be true). For the reasons explained above, the CONTAM Panel concluded that it is most adequate to apply benchmark dose modelling for PFOS on the immune system using the antibody response as a continuous variable. For the reasons explained above, the CONTAM Panel decided not to apply benchmark dose modelling for PFOA on the Grandjean et al. (2012) study.
3.4.1.4. Birth weight
As described in Section 3.3.4.2.1, of the 17 studies reporting associations between PFOS and PFOA (reviewed in Table 20), 7 studies reported significant inverse association for PFOA, while 6 studies reported significant inverse association for PFOS. Many other studies also reported inverse associations although formal significance was not reached. Lack of associations for some of the non‐significant findings may, at least in some cases, relate to either small size of the studies and low serum concentrations. Previous reviews and meta‐analyses have concluded that PFOA, and to lesser extent PFOS, are inversely associated with birth weight (Lam et al., 2014; Bach et al., 2015b). That is also the conclusion of the CONTAM Panel. As mentioned above, there was usually a relatively strong correlation between PFOS and PFOA in the general population studies.
There is a well‐defined mechanism for confounding for birth weight. During pregnancy, increased hemodilution and glomerular filtration rate are well established determinants of PFOS and PFOA concentrations and both factors may potentially affect birth weight. Physiological based pharmacokinetic models have suggested that around half of the reported associations between PFOS and PFOA with birth weight could be explained by glomerular filtration rate (Verner et al., 2015). On the other hand, the study by Darrow et al. (2013) reported an inverse association between pre‐pregnancy levels of PFOS with birth weight which would in theory eliminate such confounding by design. However, the CONTAM Panel concluded that since a well‐defined confounding mechanism has been established, the causality of the association between PFOS and PFOA and birth weight is more uncertain than it is for other associations discussed in this Section.
In addition, the clinical relevance of slight reduction in birth weight is unclear if the shift in the birth weight distribution does not translate to increased prevalence of more adverse outcomes such as low birth weight (< 2,500 g) or small for gestational age (birth weight below the 10th percentile for gestational age and gender) that are well established predictors for neonatal mortality and morbidity. However, despite their efforts, studies that have addressed these outcomes (see Table 20) have not been sufficiently powered, and therefore this issue has not been resolved.
The CONTAM Panel concludes that there may well be a causal association between PFOS and PFOA and birth weight, but the robustness of existing studies is hampered by a well‐defined mechanism of confounding and the fact that clear biological relevance is not obvious. Nevertheless, the CONTAM Panel found it reasonable to perform BMD modelling on important birth weight studies to examine if potentially critical exposures with respect to birth weight, are sufficiently covered by outcomes judged to be more certain with respect to causality and adversity (serum cholesterol and immune response).
3.4.1.5. Conclusion
Considering the evidence for a causal association with exposure to PFOS or PFOA for the four outcomes above, the view of the CONTAM Panel is that the strongest support for a causal adverse association with PFOS or PFOA is found for increased serum cholesterol (PFOS and PFOA) and decreased antibody response in children (PFOS).
For ALT above the reference range (PFOA), the evidence is somewhat weaker, and for decreased birth weight (PFOS and PFOA) there is still some uncertainty both regarding causality and adversity. Nevertheless, it was decided to perform dose–response assessment for all these four outcomes.
3.4.2. Dose–response assessment
3.4.2.1. BMD modelling
As mentioned in Section 2.2.3, the BMR was considered as an increase over the response observed in the lowest quantile and it was decided to use the median PFOS or PFOA concentration in the lowest quantile and the corresponding response in the BMD modelling (see also Appendix B). For each outcome several models were tested and the best fitting model was used (see Section 2.2.3 and Appendix B).
For serum cholesterol, BMD modelling was performed for PFOS and PFOA for a 5% increase in total cholesterol based on the studies with > 500 individuals and results presented by quantiles (Steenland et al., 2009; Nelson et al., 2010; Eriksen et al., 2013).
In the specific case of BMD modelling of serum cholesterol vs serum PFOA in the C8 cohort (Steenland et al., 2009), using the lowest decile as reference value, the BMD for a 5% increase in cholesterol could not be modelled. This was because the dose–response curve levels off at high serum PFOA concentrations. The median PFOA level in the lowest decile was higher (median 5.5 ng/mL) than in other cohorts and in the biomonitoring studies (see Section 3.3.2). Use of a ‘low’ concentration of 1 ng/mL, being half of the median of the medians of serum PFOA in Europe (1.9 ng/mL, see Section 3.3.2.3, Table 8), allowed modelling (see Appendix B, model #6). The CONTAM Panel is aware that this means an extrapolation outside the aggregated data available in the study by Steenland et al. (2009), but it is still within the range of individual data observed in the lowest decile in the same study. Furthermore, the model fits the data well in the lowest deciles (see Appendix B, model #6), suggesting that the uncertainty in extrapolation below the median in the first decile is not large. The same uncertainty applies to PFOS when extrapolating below the median of the lowest quantile, but would for both substances be model dependent.
For the association between PFOA and serum ALT, BMD modelling was performed for an increase of the absolute risk of ALT above its reference range (> 45 IU/L men, > 34 IU/L women), using the studies by Gallo et al. (2012). Data showing the prevalence of ALT above the reference range, adjusted for covariates, were provided by Fletcher, 2017b (see ‘Documentation provided to EFSA’). A 5% absolute increase in serum ALT did not occur even in the highest decile. A 3% increase of the absolute risk (from 9% to 12%) of high ALT could however be modelled, and will allow a comparison of the BMD for an increase in the risk of high ALT to the BMD for the other potential critical outcomes
For the association between PFOS and antibody response, a decrease in diphtheria antibody levels was used for BMD modelling (see Appendix B). The median in the lowest decile was used as reference. A 5% decrease was selected as a default; however, a 10% decrease was also evaluated resulting in almost identical values.
For birth weight, a BMR of 5% was used. This value corresponds to roughly 170 g decrease in birth weight (assuming a mean birth weight of 3.6 kg). Such decrease in birth weight is similar to that expected among mothers smoking during pregnancy and such a decrease in birth weight is generally considered as clinically relevant (Butler et al., 1972). Epidemiological studies examining associations between environment, nutrition or lifestyle, however, often report more modest associations with birth weight and the adversity of around 50–100 g reduction in birth weight is most often unclear. In the absence of further evidence such modest changes in birth weight are often considered within the reference range.
For each outcome, several models were tested and the best fitting model was used (see Section 2.2.3 and Appendix B).
3.4.2.2. Model‐based estimation of the relationships between plasma concentrations of PFOA and PFOS and dietary intakes to set tolerable daily intakes
Estimation of population intakes of PFOS and PFOA based on plasma/serum concentrations can either be performed by using a one‐compartment steady‐state pharmacokinetic (PK) model or using a physiologically based pharmacokinetic (PBPK) model, in both cases assuming a constant intake rate. This means that measured serum/plasma concentrations can be used to reconstruct past intakes. The daily dietary intake of PFOA and PFOS associated with the BMDL5 concentrations for the potential critical effects in the BMD analysis can thus be calculated using either a PBPK model or a one‐compartment steady‐state PK model.
In the literature, several PBPK models have been applied for PFOS and PFOA in humans (Andersen et al., 2006; Loccisano et al., 2011, 2012, 2013; Fàbrega et al., 2014, 2016; Verner et al., 2015, 2016; Wu et al., 2015; Ruark et al., 2016). Some of them (Loccisano et al., 2013; Verner et al., 2015, 2016; Wu et al., 2015; Ruark et al., 2016) were developed to assess the pharmacokinetic behaviour of PFOA and PFOS in pregnancy, during lactation, or at early menopause, but they are all based on the original Loccisano et al. (2011) model.
The Loccisano et al. (2011) model is a basic PBPK model which has been applied to estimate relationships between serum concentrations of PFOA and PFOS and dietary intakes of the same compounds. The validation steps performed (including sensitivity analysis) for this model demonstrated that the models were giving robust estimations (see Section 3.3.1.3).
The Loccisano et al. (2011) model was modified by Fàbrega et al. (2014) and data from autopsy tissues from residents in the area of Tarragona (Spain) were included. These data were used for calibration of their model. The authors combined results from two studies to determine the partition coefficients (tissue/blood):
the tissue concentrations used were from Pérez et al. (2013);
the blood concentrations used were from Ericson et al. (2007).
Partition coefficients (tissue/blood) were calculated as the ratio between the tissue concentrations and the blood concentration of the same chemical at steady state. However, as the partition coefficients were based on measured concentration in blood and tissue from different subjects (cadavers), the coefficients obtained are subject to relatively high uncertainty. Furthermore, the model was both calibrated and evaluated using the same experimental data from the autopsy tissues. Thus, according to the WHO guidance (WHO/IPCS, 2010), the Fábrega model cannot be considered as validated.
In 2017, Worley et al. published a new PBPK model for PFOA. This model contains four compartments: plasma, liver, the rest of the body tissues and kidney (containing the kidney serum, proximal tubule cells, and kidney filtrate). A description of the gastrointestinal tract (stomach, small intestine) is also added. The authors added in vitro and in vivo data to describe renal excretion and reabsorption of PFOA (specific OATs).
Both the Loccisano et al. (2011) and the Worley et al. (2017) models provided acceptable and similar prediction of PFOA plasma concentrations, which is an acceptance criteria from WHO, i.e. the ratio between the simulated and observed data should be within a factor of 2. In both models, the same studies from Little Hocking, Ohio, USA were used in the model validation. In addition, for the Loccisano et al. (2011) model additional data were used for evaluation i.e. data from an exposed population in Arnberg in Germany23 and data from Red Cross donors from six geographic locations around the US. The comparison of model simulations with experimental data from both of these populations show good prediction,24 and moreover, the level of exposure in these populations was lower than the studies from Little Hocking.
In summary, the Fàbrega et al. (2014, 2016) model was considered not appropriate to use. Furthermore, although both the Worley et al. (2017) model and the Loccisano et al. (2011) model provided acceptable prediction, the Loccisano model (2011) was evaluated using more data and at different levels of exposure, and was thus considered the most appropriate model to use.
In conclusion, the CONTAM Panel decided to estimate the constant intake rates in ng/kg bw per day resulting in the plasma concentrations similar to the BMDLs for the different outcomes applying the Loccisano et al. (2011) model, which was further modified by integrating an equation describing the increase in weight according to age and by correcting some of the parameters (see Appendix C).
The half‐life is dependent on renal resorption through a saturable transport that is thought to be responsible for the long half‐life of PFOA and PFOS. The parameters used to describe renal resorption are the transporter maximum (Tm) (Tm = Tmc*BW^0.75) and the transporter affinity constant (Kt). The CONTAM Panel used a Tmc of 6,000 μg/h/kg^0.75 corresponding to a half‐life of 2.3 years for PFOA and a Tmc of 3,500 μg/h/kg^0.75 corresponding to a half‐life of 5.4 years for PFOS.
The estimated serum levels obtained by this model were also in acceptable agreement with those obtained using a one‐compartment steady‐state PK model, and also the Worley et al. (2017) model, supporting the robustness of the results (see Appendix C).
Conversion of the respective BMDLs (results given in Tables 25 and 26), expressed as PFOS and PFOA concentrations in serum/plasma, into daily dietary intake estimates are given in Tables 27 and 28. The estimates presented in Table 27 and 28 correspond to the life‐time continuous dietary exposures estimates (daily ingested dose) which should not be exceeded in order not to reach the target concentration (BMDLs) at adult age.
Table 25.
Summary of the BMD analysis – PFOS
| Human response variable | BMD5 (ng/mL) | BMDL5 (ng/mL) | Number of people (cohort) | Data type | Model used | Reference |
|---|---|---|---|---|---|---|
| Total Cholesterol | 27 | 25 | 46,294 (C8 health project) | Decile | Lognormal cumulative | Steenland et al. (2009)a , b |
| 31 | 22 | 753 (Danish cohort 1996–2002) | Octile | Sqrt | Eriksen et al. (2013)c | |
| 31 | 21 | 860 (NHANES) | Quartile | Exponential | Nelson et al. (2010) | |
| Vaccination response for children | 11.6 | 10.5 | 431 (Faroese birth cohort 1997–2002) | Decile | Logarithmic | Grandjean et al. (2012)d |
| Birth weight | 36 | 21 | 901 (Norwegian mother and child cohort‐MoBa) | Quartile | Logarithmic | Whitworth et al. (2012a)e |
BMD: benchmark dose; BMDL5: benchmark dose for a 5% increase; PFOS: perfluorooctane sulfonic acid.
For Steenland et al. (2009) using a different reference value of 3.8 ng/mL PFOS in serum (half the median of the median PFOS in Table 8) would result in BMD5 = 25 ng/mL and BMDL5 = 22 ng/mL.
See also Steenland (2017) under ‘Documentation provided to EFSA’.
See also Sørenson (2017) under ‘Documentation provided to EFSA’.
See also Grandjean and Budtz‐Jørgensen (2017) under ‘Documentation provided to EFSA’.
See also Whitworth (2017) under ‘Documentation provided to EFSA’.
Table 27.
Summary of dietary intake estimates that by PBPK modelling predict PFOS serum concentration at the BMDLs for potential critical effects
| Human response variable | BMDL5 (ng/mL) | Reference | Estimated dietary intakes in ng/kg bw per day corresponding to a BMDL5 using the PBPK model (rounded values) |
|---|---|---|---|
| Total cholesterola | 25 | Steenland et al. (2009) | 2.0 |
| 22 | Eriksen et al. (2013) | 1.8 | |
| 21 | Nelson et al. (2010) | 1.7 | |
| Birth weightb | 21 | Whitworth et al. (2012a) | 1.9 |
BMDL5: benchmark dose for a 5% increase; PBPK: physiologically based pharmacokinetic (model).
At 50 years.
At 35 years, relevant age for pregnant women.
Table 28.
Summary of dietary intake estimates that by PBPK modelling predict PFOA serum concentration at the BMDLs for potential critical effects
| Human response variable | BMDL5 (ng/mL) | Reference | Estimated dietary intakes in ng/kg bw per day corresponding to a BMDL5 using the PBPK model (rounded values) |
|---|---|---|---|
| Total cholesterolb | 9.4 | Steenland et al. (2009) | 0.8 |
| 9.2 | Eriksen et al. (2013) | 0.8 | |
| Alanine transferaseb | 21a | Gallo et al. (2012) | 2.0 |
| Birth weightc | 10.6 | Fei et al. (2007) | 1.0 |
| 4 | Whitworth et al. (2012a) | 0.4 |
BMDL5: benchmark dose for a 5% increase; PBPK: physiologically based pharmacokinetic (model).
BMD3 and BMDL3 for alanine transferase.
At 50 years.
At 35 years, relevant age for pregnant women.
For example, the BMDL5 of 25 ng/mL in serum/plasma based on increased cholesterol in adults, correspond to a dietary intake of 2.0 ng/kg bw per day for PFOS, when using the PBPK model from Loccisano et al. (2011) (Table 27).
For children, the relation between serum concentrations of PFOS and corresponding daily intake rates is not as straight‐forward as in adults, as there is a certain ‘starting’ concentration of serum PFOS at birth (dependent on the mother's serum PFOS), and if breastfed, the infant will receive a higher daily dose from breast milk than from diet after end of breastfeeding (see Appendix C (subsection C.2) for an example) which influences the PFOS serum concentration in childhood. Therefore, the CONTAM Panel considered it not relevant to calculate which intake rate for children after end of breastfeeding would correspond to the BMDL5 serum level of PFOS in 5‐year‐old children. Instead the serum PFOS levels in the pregnant mothers in the study by Grandjean et al. (2012) were compared with serum PFOS levels for the other potential critical effects, and some scenarios with breastfed children were modelled to illustrate how maternal serum PFOS levels and intake rates would be related to serum PFOS levels in their 5‐year‐old children (see Appendix C).
3.4.3. HBGV derivation
Since both toxicity as well as underlying modes of toxic action for PFOS and PFOA are not sufficiently understood and might differ, but also overlap, the CONTAM Panel decided not to derive a group HBGV for PFOS and PFOA.
3.4.3.1. PFOS
For outcomes identified in adults, the opinion of the CONTAM Panel is that the increase of serum cholesterol is the critical effect. Three studies (Steenland et al., 2009; Nelson et al., 2010; Eriksen et al., 2013) on serum cholesterol showed very similar BMDL5 values expressed as plasma PFOS (21–25 ng/mL), corresponding to an estimated chronic daily intake of 1.7–2.0 (median 1.8) ng/kg bw per day (see Section 3.4.2.2, Table 27). It is likely that adjustment for PFOA (and maybe other PFASs) would result in somewhat higher BMDL5 values and corresponding daily intake rates (see Section 3.4.1.1).
For children, the lowest BMDL5 is for antibody response after vaccination (10.5 ng/mL). Serum PFOS levels in children are not in steady state and their levels will depend on maternal levels of PFOS in serum, which will also be the most important factor determining the PFOS levels in breast milk. As shown in Appendix C, if the maternal serum PFOS level is 7.7 ng/mL (median estimate for adults, see Scenario 1 in Appendix C, subsection C.2), the 5‐year‐old child, if exclusively breastfed for 6 months, is expected to have a serum PFOS level of about two‐third the BMDL5 of 10.5 ng/mL. However, when the maternal serum PFOS is in the range of the BMDL5 values for increase of serum cholesterol, the child's serum PFOS can be expected not to exceed the BMDL5 of 10.5 ng/mL; see example for a maternal serum PFOS of 22 ng/mL, corresponding to a long‐term maternal intake of 1.8 ng/kg per day (see Scenario 2 in Appendix C, subsection C.2).
The BMDL5 for reduced birth weight (with corresponding dietary intake of 1.9 ng/kg bw per day) was in the same range as for increased cholesterol. The CONTAM Panel noted that there is still some uncertainty both regarding causality and adversity of reduced birth weight, and there is likely an impact of confounding by changes in glomerular filtration rate during pregnancy.
With serum cholesterol, antibody response after vaccination, and birth weight, all considered as potential critical endpoints, the CONTAM Panel found it appropriate to weigh the overall evidence from the human observational studies when setting an HBGV. For these endpoints, the daily calculated intakes resulting in the critical serum concentrations were 1.7–2.0 ng/kg bw per day, depending on the outcome and study. For the increase in serum cholesterol, the critical effect in adults, it was 1.8 ng/kg bw and day. The CONTAM Panel noted that people are usually exposed to a mixture of PFOS and PFOA, which both affect serum cholesterol and birth weight, but there was lack of empirical data to quantify a possible confounding of such co‐exposure.
The CONTAM Panel decided not to apply any additional uncertainty factor because the BMD modelling was based on large epidemiological studies from the general population, including also potentially sensitive subgroups. The CONTAM Panel also took into account that the BMD modelling was performed on risk factors for disease rather than disease. Therefore, the CONTAM Panel considers that 1.8 ng/kg bw per day is an appropriate reference point.
The CONTAM Panel established a TWI of 13 ng/kg bw per week, in order to take into account the long half‐life of this contaminant. At constant intake rates, it will take many years to build up a plasma concentration corresponding to the derived BMDLs. Daily variations in intake of PFOS will therefore not affect serum PFOS levels or toxicity.
3.4.3.2. PFOA
The CONTAM Panel considers the increase of serum cholesterol to be the critical effect. Two studies (Steenland et al., 2009; Eriksen et al., 2013) on serum cholesterol showed very similar BMDL5 expressed as serum PFOA (9.2–9.4 ng/mL). Such levels correspond to an estimated chronic daily intake of about 0.8 ng/kg bw per day. However, the BMDL5 from the study by Steenland et al. (2009) was based on an extrapolation to a low reference value of 1.0 ng/mL, which adds to the model uncertainty as discussed in Section 3.4.2.1. On the other hand, the study by Steenland et al. (2009) is much larger than the study by Eriksen et al. (2013), and therefore more appropriate for BMD modelling. The CONTAM Panel decided to take into account both of these studies, which have their advantages and disadvantages when deriving an HBGV for PFOA.
The issue of co‐exposure to PFOS and PFOA was also considered. Since there is an association between levels of PFOS and PFOA, it is likely that adjustment for PFOS (and maybe other PFASs) would result in somewhat higher BMDL5 values for PFOA. Since the exact extent of such confounding by PFOS is unknown the CONTAM Panel decided not to adjust the estimated chronic daily PFOA intake for other PFASs.
The CONTAM Panel considers 0.8 ng/kg bw per day to be an appropriate reference point and established a TWI of 6 ng/kg bw per week, again based on the long half‐life of this contaminant. The TWI is protective also for increased risk of liver damage, indicated by high serum ALT (see Section 3.4.2.1, Table 26). It is protective against reduced birth weight, taking into account the fact that there is likely to be an impact of confounding by glomerular filtration rate. The CONTAM Panel decided not to apply any additional uncertainty factor because the BMD modelling was based on large epidemiological studies from the general population, including also potentially sensitive subgroups. The CONTAM Panel also took into account that the BMD modelling was performed on risk factors for disease rather than disease.
3.5. Risk characterisation
Large differences between LB and UB concentrations were observed in foods, as a result of analytical methods being used that are not sufficiently sensitive. This contributes to a large difference between LB and UB chronic dietary exposure estimates for PFOS and PFOA (see Section 3.2.1, Tables 4 and 5).
For PFOS, the mean LB dietary exposure ranged from 1.3 (adolescents) to 20.9 (other children) ng/kg bw per week across age groups and surveys. The high (95th percentile) LB exposure ranges from 3.5 (adolescents) to 165.9 (other children) ng/kg bw per week. This compares with the TWI of 13 ng/kg bw per week, and indicates that the mean LB exposure exceeds the TWI by up to 1.6‐fold in some surveys, whereas the high LB exposure exceeds the TWI by up to 13‐fold. At UB exposure, the TWI is exceeded in almost all surveys at mean exposure, and the high (95th percentile) UB exposures exceed the TWI from 1.7‐ to 15‐fold across surveys and age groups.
For PFOA, the mean LB dietary exposure estimates range from 1.5 ng/kg bw per week (elderly and very elderly) up to 18.3 ng/kg bw per week (toddlers). The high (95th percentile) LB exposures range from 3.4 to (very elderly) to 37.6 ng/kg bw per week (toddlers). This compares with the TWI of 6 ng/kg bw per week and indicates that the mean LB exposure exceeds the TWI by threefold in some surveys, whereas at high LB exposure the TWI is exceeded up to sixfold. At the mean UB the TWI is exceeded 1.4‐ to 14‐fold across surveys and up to 28‐fold at the high UB (95th percentile) exposure (toddlers).
The CONTAM Panel considers that the true exposure level for both PFOS and PFOA is closer to the LB than the UB values. Studies performed using the best analytical methods with high sensitivity and high levels of quality control give results with fewer left censored data and confirm occurrence in foods at levels close to the LB estimates. This is discussed further in the Uncertainty Section 3.6.1.
Other supporting evidence is that the median blood serum levels in European populations (see Section 3.3.2) are consistent with what would be expected based on PBPK modelling of median LB intake data in Tables 4 and 5. The median concentrations of PFOS in European adults and children in studies from the late 2000s were 7.7 (range 1.7–27.4) and 3.2 (range 0.49–8.6) ng/mL, which are generally lower than the BMDL5 of 25 ng/mL for increase of serum cholesterol in adults and lower than the BMDL5 of 10.5 ng/mL for decreased vaccination response in children (Section 3.4.2). For PFOA the corresponding median concentrations in adults and children were 1.9 (range 0.76–4.9) and 3.3 (range 0.49–6.9) ng/mL, which are lower than the BMDL5 of 9.4 ng/mL for increase of serum cholesterol. However, as described in Section 3.3.2, for some individuals in general populations, much higher concentrations of PFOS (up to 392 and 23 ng/mL in adults and children respectively) and PFOA (up to 80.8 and 19.5 ng/mL in adults and children respectively) have been reported, which is also in line with the high LB exposure estimates. Although food is the main source, exposure to PFOS, PFOA and their precursors may also occur through inhalation of air, ingestion of dust as well as through dermal contact with for instance consumer products, thus contributing to the internal dose of PFOS and PFOA.
The exceedances of the TWIs for PFOS and PFOA at LB exposure estimates are of concern.
3.6. Uncertainty analysis
3.6.1. Uncertainty in exposure estimates
The occurrence data were mostly reported by three countries (Germany, Norway and France) while other countries submitted only a limited number of data. There is an uncertainty in possible regional differences in PFOS and PFOA contamination of food commodities and it is evident that the data set is not fully representative for the EU food market.
There are very few data points that can be used for exposure estimates for some food categories, especially when exploring the most detailed level of food categories. Thus, exposure from those food groups is highly dependent on the representativeness of the limited number of measurements. The limited number of available analytical results for particular food subgroups (i.e. pear and cow milk), adds uncertainty to the representativeness of the mean concentration values used to estimate exposure. Furthermore, for PFOA, ‘Milk and dairy products’ was an important contributor (up to 86% for toddlers), however, there were only 4 and 6 quantifiable results for cow milk and gouda cheese, respectively.
Additional uncertainty is introduced by exclusion of several food categories due to a very high proportion of left‐censored data, including the Foodex 1 level categories ‘Fruit and vegetable juices’, ‘Food for infants and small children’, and ‘Snacks, desserts and other foods’ for both PFOS and PFOA, and for PFOS only ‘Grains and grain‐based products’, ‘Alcoholic beverages’, ‘Herbs, spices and condiments’ and ‘Composite food’.
In addition, for the other Foodex 1 categories, many of the subcategories contained all left censored data, i.e. for PFOS, food groups (with > 20 analytical results) included cow milk yoghurt, turkey meat, fish oil, potatoes, tomatoes and asparagus. For PFOA, such food groups included cow milk yoghurt, sheep milk, cooked sausage, mutton, lamb and chicken meat, fish oil, potatoes and French fries, beer pastries and cakes (see Appendix A Tables A.4 and A.5 as excel files – under ‘Supporting information’ Section on the web page). Food groups excluded due to limited availability of analytical results (< 6 results per food category) included some citrus and stone fruits, melons and green beans for both PFOS and PFOA and for PFOA only table grapes, peas, sweet corn, fennel, oats, herbs, margarine.
Exposure estimates for PFOS and PFOA are strongly impacted by the wide range of sensitivity of analytical methods used for their analysis. This results in many samples reported as left‐censored (< LOD/LOQ), especially for data generated using less sensitive methods. This gives a wide range of difference between UB and LB exposure estimates. As a result, the use of the LB in this opinion tends to underestimate, while UB tends to overestimate the dietary exposure. Exposure data generated from more sensitive analytical methods with high levels of quality control suggest that true estimates of exposure are closer to LB than UB estimates presented in this opinion (Haug et al., 2010b; Vestergren et al., 2012; Brantsaeter et al., 2013; Klenow et al., 2013).
It is possible that correction for recovery has been treated in different ways by data providers. Methods using stable isotope dilution have an internal (automatic) correction for recovery, whereas other methods do not. It is possible that data that have been corrected for recovery have been mixed in some cases with data that have not been corrected for recovery. There is also a possibility that data from stable isotope methods have been in effect corrected twice, meaning that the uncertainty in terms of correction for recovery could be in either direction.
The information on occurrence in food comes from monitoring programmes, and also from routine measurements within the frame of official food controls, so they originated from both random and targeted sampling. Targeted sampling is usually focussed on known or suspected contamination sites and inclusion of such data may therefore result in an overestimate of exposure.
Where analytical results are reported for composite foods, the assumptions made about composition of these items can give rise to additional uncertainties in the exposure estimate as a result of which category the composite food is given.
Food is consumed after cooking or processing, whereas the occurrence data are based largely on uncooked retail food samples. More of the limited amount of data in the literature is for PFOA than for PFOS, although other PFASs are also used in food contact materials. It is unclear as to the effect of cooking and processing on PFOS and PFOA, with some studies suggesting an increase and others a decrease in final food concentrations.
For calculation of current exposure, data from the last 10 years have been considered and merged. The data have been gathered from results gained using several different methods with varying sensitivity. Improvements in sensitivity over time may give an illusion of decreasing occurrence levels if upper bound data are analysed, whereas this in fact can simply be a reflection of improved methodology. It has therefore not been possible to analyse for time trends in the occurrence data set but decreases in blood serum concentrations suggest that exposure has been decreasing over the last decade. If this is the case, it could result in an overestimation of the current dietary exposure.
While for most of the population, diet is recognised as the main source of exposure to PFOS and PFOA, for some individuals, non‐dietary sources may be significant. Furthermore, PFOS and PFOA can arise as a result of biodegradation of their precursors in the human body. Neither non‐dietary exposure nor exposure to precursors have been considered in the current exposure assessment. However, both of these are taken into account when biomonitoring data are used as a measure of exposure.
Several factors may have had an impact on the representativeness of the biomonitoring data, such as a non‐equal distribution of studies between the European countries, lack of data from a large proportion of European countries and study populations being non‐representative for general populations. Furthermore, the included studies comprised samples collected during ten years, and as decreasing time trends have been observed in human samples from several studies, the collection time points may have had an influence on the aggregated data such as mean and median concentrations.
3.6.2. Uncertainties in hazard identification and characterisation
3.6.2.1. Experimental animal data
Many of the animal studies conducted on PFOS and PFOA used standards that had relatively low purity, and the nature of the impurities was not fully characterised. There is likelihood that the impurities could be other organofluorine compounds or other chemicals with potential to influence studies that were conducted using the material.
Uncertainty in the extent of bile excretion and the enterohepatic recycling of PFOS and PFOA, as well as in the description of transporter mediated excretion and reabsorption, could influence the TK or PBPK model parametrisation and consequently the risk assessment. Previous risk assessments were based on hazard identification and risk characterisation from studies conducted in rodents, which have PFOS and PFOA toxicokinetic profiles divergent from humans.
3.6.2.2. Epidemiological studies in humans
The review of Observations in humans (Section 3.3.4) includes about 200 epidemiological studies. A comprehensive literature review was performed (see Section 2.2.2), but there might be some further studies not identified in the literature review. However, the CONTAM Panel finds it unlikely that such studies would change the selection of potential critical effects and the assessment of causality, adversity and dose response.
The human studies are all observational, since it is not possible to perform long‐term clinical trials of PFOS/PFOA exposure. Longitudinal studies are generally considered more useful than cross‐sectional studies when assessing causality of associations found in observational studies. The majority of the studies cited in Section 3.3.4 are cross‐sectional, but some of them are longitudinal, i.e. plasma levels of PFOS/PFOA were measured before the outcome. For the C8 studies, it is known that there was increased exposure to PFOA in drinking water long before various health outcomes were evaluated.
Selection bias may occur, especially in occupational studies where the so called ‘healthy worker effect’ is an example, but overall the CONTAM Panel finds it unlikely that it has affected the associations described above. There is always a risk of information bias in epidemiological studies, and in the cross‐sectional studies described in Section 3.3.4 the main sources for such bias are misclassification of exposure (plasma levels of PFOS/PFOA) and/or outcomes (for example serum levels of cholesterol, liver enzymes, hormones or markers of kidney function) due to normal variability. Misclassification should, however, be non‐differential, which will attenuate a true exposure‐response relationship. Therefore, true associations may be stronger than those observed, and in some cases true associations may not have been detected.
Confounding is common in epidemiological studies and occurs when other factors can affect plasma levels of PFOS/PFOA as well as the outcomes examined. Examples of factors which may be associated with PFOS/PFOA levels are time period (decreasing levels over time), age (usually increasing with age), sex, BMI and diet. For the critical outcomes identified in this opinion, it was concluded that all relevant confounders where accounted for in statistical analyses. However, there is always the possibility that some identified factor (biological or lifestyle related) that is associated with both outcome and exposure may have acted as a confounder. Confounding by such ‘unknown’ confounder can, in theory, always occur in observational studies. However, in the absence of any clear hypothesis on how such confounding may occur, and repeated replication of same findings in different populations where sources of exposure are likely to differ (such as for serum cholesterol), the existence of such an ‘unknown’ confounder appears unlikely.
Co‐exposure to several PFASs, or other contaminants correlated with PFOS/PFOA levels, also constitutes confounding, if there are similar effects on the outcome of these various compounds. If the correlation between plasma levels of PFOS, PFOA and other PFASs is high, it is difficult to disentangle effects from the respective compounds, and the true effect of a specific compound may be smaller than the effect reported for that compound.
Reverse causality may occur if some outcomes will result in higher or lower plasma levels of PFOS/PFOA. One example of this is decreased kidney function, which will decrease elimination of PFOS/PFOA and therefore tend to increase their plasma levels. This means that an inverse association between renal function and PFOS/PFOA may be caused by reverse causation. Another example is that less loss of PFOS/PFOA by menstruation will tend to increase plasma levels of these compounds. Therefore, a positive association between early menopause and plasma levels of PFOS/PFOA may be caused by reverse causation.
Limited statistical power due to a small number of study participants will make it difficult to detect a true association between PFOS/PFOA and the outcome examined, and the absence of statistically significant associations in small studies therefore has limited validity. This is especially true if the magnitude of the hypothesised effect is small. In spite of this, small studies may show spurious associations, which cannot be replicated in larger studies.
If study participants have special characteristics (e.g. pregnant women, groups with specialised diet or certain diseases), they may not be representative for the general population. Nevertheless, it is important that HBGVs are protective also for sensitive subgroups of the population.
Many epidemiological studies of exposure to PFOS/PFOA use biomarkers, which are indirectly linked to an adverse effect (usually a disease). Such examples are biomarkers of kidney function, hormones or serum lipids. As discussed in the EFSA Guidelines on Biological relevance, there should be prior knowledge of the relation between changes in biomarkers and organ damage or disease states, if such biomarkers are used as potential critical effects (EFSA Scientific Committee, 2017b). Sometimes, there is uncertainty whether changes in biomarkers are just adaptive or are clearly related to an adverse effect.
3.6.2.2.1. Serum cholesterol
As discussed above, the associations between PFOS/PFOA and serum cholesterol are consistent between studies and most sources of confounding have been taken into account. The most important uncertainty is regarding adversity. While it is very well proven that increased serum cholesterol increases the risk of cardiovascular disease, no association between plasma levels of PFOS/PFOA and cardiovascular disease has been shown. This could be due to limited power to demonstrate a limited increase (e.g. a 5% increase) in cardiovascular disease incidence. Another uncertainty is related to co‐exposure to several PFASs, as discussed above.
3.6.2.2.2. Serum alanine transferase
As discussed above, there is some uncertainty regarding the causality of the inverse association between PFOS and PFOA on birth weight that has been relatively consistently reported in prospective studies, using serum concentrations as marker of exposure. Increased elimination rate through urinary excretion and/or increased blood volume expansion as pregnancy progresses are both modest predictors of birth weight as well as lower serum PFOS and PFOA concentrations. As a result, there is a well‐defined confounding mechanism that has not been adequately addressed in existing studies. However, PBPK models have suggested that this mechanism may account for only around half but not the full association (Verner et al., 2015). For birth weight there is therefore some uncertainty on the causality as well as on the true strength of the association. The uncertainty is, however, not large enough for the CONTAM Panel to conclude that the observed association between PFOS and PFOA with birth weight is not adverse.
3.6.2.2.3. Birth weight
As discussed above, there is some uncertainty regarding the causality of the inverse association between PFOS and PFOA on birth weight that has been relatively consistently reported in prospective studies, using serum concentrations as marker of exposure. Increased elimination rate through urinary excretion and/or increased blood volume expansion as pregnancy progresses are both modest predictors of birth weight as well as lower serum PFOS and PFOA concentrations. As a result, there is a well‐defined confounding mechanism that has not been adequately addressed in existing studies. However, PBPK models have suggested that this mechanism may account for only around half but not the full association (Verner et al., 2015). For birth weight there is therefore some uncertainty on the causality as well as on the true strength of the association. The uncertainty is, however, not large enough for the CONTAM Panel to conclude that the observed association between PFOS and PFOA with birth weight is not adverse.
3.6.2.2.4. Vaccination response
In the absence of any likely confounding that, to date, has not been identified, the greatest uncertainty for the inverse association between serum PFOS and PFOA concentrations and antibody response, following vaccinations, primarily relates to how sensitive these associations are to different types of vaccines. That is, it is unclear if these potential adverse associations are specific to the few types of vaccines that have been examined in studies so far, or, if this adverse association is more general. In addition, the conclusion on adversity is based on reduced antibody response alone as a clear link with increased rate of infection has not been demonstrated. Such studies are, however, difficult to perform. Although this can be regarded as a source of uncertainty, it is generally accepted that failing to reach protective antibody concentrations is an adverse event.
In a study with the same group of children, it was shown that NDL‐PCBs can cause a similar overall decrease in the antibody titres as the PFASs. The correlation between the levels of PFOS and NDL‐PCBs was relatively poor and the relative decrease per doubling of the serum levels of PFOS was larger after adjustment for NDL‐PCB levels, indicating no confounding. It is, however, difficult to exclude an effect modification.
3.6.3. Uncertainty in dose–response assessment and HBGV derivation
3.6.3.1. BMD modelling
The use of quantiles (deciles, octiles or quartiles) instead of raw data points in the BMD modelling process increases uncertainty, because data points from different concentrations are grouped and expressed as the median concentration. This may change the confidence interval compared to the use of individual data in either direction.
Since PFOS and PFOA are ubiquitous food and environmental contaminants, there is no such thing as an unexposed control group. It was decided to use the median concentration of the lowest quantile as the reference value in BMD modelling. The choice of the lowest quantile as the reference value introduces an uncertainty, and in most cases, this would represent an underestimation of the risk.
As mentioned in Section 3.4.2.1, in the specific case of BMD modelling of serum cholesterol vs serum PFOA, in the C8 cohort (Steenland et al., 2009), using the lowest decile as reference value, the BMD for a 5% increase in cholesterol could not be modelled. The CONTAM Panel considered that the median PFOA level in the lowest decile (mean 5.5 ng/mL) was higher than in other cohorts and in the biomonitoring studies (see Section 3.3.2). As an example, the median of the medians for serum PFOA in European populations was 1.9 ng/mL, and the 5th percentile in several studies was < 1 ng/mL. The use of 1 ng/mL (half of the median of the medians in European studies) as a proxy for the ‘low’ serum PFOA concentrations was therefore evaluated, resulting in a BMDL5 in the range of other values obtained for PFOA. As it is, however, an extrapolation outside the available aggregated data points (but still within the observable range in the lowest decile) it adds uncertainty to the result of this BMD modelling.
Although the data used for BMD modelling were adjusted for several potential confounders, associations with PFOS and PFOA were not mutually adjusted for each other. This is another source of uncertainty. Since levels of PFOS usually are higher (four to five times) than levels of PFOA, the possible confounding of PFOS on PFOA is probably more important than the confounding of PFOA on PFOS. The CONTAM Panel decided not to adjust the PFOA TWI for PFOS or the PFOS TWI for PFOA since the extent of confounding by such co‐exposure is unknown. This represents an additional source of uncertainty.
3.6.3.2. PBPK modelling
Tissue:plasma partition coefficients for PFASs for all tissues in the model were calculated from tissue concentration data (animal data). Uncertainty remains for extrapolation from animal to human.
Whatever the data or studies used for calibration or validation (although the exposure duration is unknown), simulated results were found inside the uncertainty range of experimental values.
Since parameterisation of PBPK models is based on empirical estimation and experimental data, simulation results may have a high degree of uncertainty. As a consequence, the reliability of model validation is highly affected. A number of approaches have been used to estimate the variability and uncertainty of PBPK models, such as Monte Carlo simulation. Nevertheless, a clear differentiation of uncertainty and variability in modelling has not been conducted.
The most sensitive parameters are elimination constants (Tm and Kt), free fraction of PFOS or PFOA in serum, blood flow to the kidney and cardiac output (see Appendix C). For PFOS and PFOA, around 80% of the uncertainty comes from these four parameters (Fàbrega et al., 2016). The variation in reported half‐lives for PFOS and PFOA is a source of uncertainty in the respective PBPK models.
There is uncertainty in the modelling of plasma levels of PFOS/PFOA in young children, especially in terms of the contribution from breast milk. Some data on PFOS/PFOA levels in breast milk are available, and the average intake in mL per day is known. However, there is no information on possible differences between infants and adults regarding absorption and/or excretion of PFOS/PFOA.
Infants who are breastfed will have an additional exposure during infancy. It will vary with length of breastfeeding and the concentration of PFOS/PFOA in breast milk. Overall, there is uncertainty in translation of maternal intake rates of PFOS/PFOA to serum concentrations in children.
3.6.4. Summary of uncertainties
In Table 29, a summary of the uncertainty evaluation is presented, highlighting the main sources of uncertainty and indicating an estimate of whether the respective source of uncertainty might have led to an over‐ or underestimation of the exposure or the resulting risk.
Table 29.
Summary of qualitative evaluation of the impact of uncertainties on the risk assessment of PFOS and PFOA in food
| Sources of uncertainty | Direction |
|---|---|
| Extrapolation of occurrence data few Member States to whole Europe | +/−a |
| Limited occurrence data from several food groups | +/− |
| Exclusion of several food categories and food groups from the exposure assessment | − |
| Large proportion of left‐censored data in the final data set | +/− |
| Using the substitution method at the lower bound (LB) scenario | − |
| Using the substitution method at the upper bound (UB) scenario | + |
| Combining data that are corrected for analytical recovery with data that are not corrected | +/− |
| Non‐differential misclassification of exposure and/or outcome in human epi studies | − |
| Residual confounding, e.g. from life‐style factors in human epi studies | +/− |
| Confounding by co‐exposure in human epi studies | + |
| Limited statistical power for rare outcomes in human epi studies | − |
| Uncertainty regarding adversity of biomarkers in human epi studies | +/− |
| Lack of raw data points for BMD modelling | +/− |
| Use of a low quantile or the reference value based on half of the median of medians in European studies instead of zero for BMD modellingb | − |
| Extent of bile excretion and gastrointestinal reabsorption | +/− |
| Uncertainty in the contribution from breastfeeding in the vaccination response in children | +/− |
| PBPK modelling | +/− |
+ = uncertainty with potential to cause over‐estimation of exposure/risk; − = uncertainty with potential to cause under‐estimation of exposure/risk.
Although there is a possibility that this could result in an overestimation, it is much more likely to underestimate and therefore a ‘−’ has been inserted into the Table.
For the human epidemiological studies, uncertainties have the potential to cause both over‐ and underestimation of risk. For the potential critical outcomes cholesterol, vaccination response, increased prevalence of ALT above the reference range, and decreased birth weight, the factors that would cause an overestimation of risk are probably somewhat more important than those acting in the opposite direction. The CONTAM Panel considered that the impact of the uncertainties on the risk assessment of PFOS and PFOA is high and are mostly driven by uncertainty in occurrence and dietary exposure data, and for PFOA also in BMD modelling. Overall, the risk assessment is likely to be conservative.
4. Conclusions
PFOS and PFOA belong to the group of per‐ and polyfluoroalkyl substances (PFASs). Linear, branched or linear/branched mixtures of PFOS and PFOA have been produced and are found in human and environmental samples. LC–MS/MS) is commonly used to determine PFOS and PFOA in both food and biological samples. Since the 1940s, PFASs have been produced and used in numerous commercial and industrial applications, including textile, carpet and leather treatment (water and dirt proofing), surfactants, firefighting foams, metal plating and paper grease‐proofing treatments. The widespread use of PFOS, PFOA and their precursors, together with their persistency, has resulted in widespread environmental contamination.
4.1. Occurrence/Exposure
An initial number of 21,411 results for food samples analysed for PFOS (n = 10,889) and PFOA (n = 10,522) from 16 European countries were available for the assessment. The data set was characterised by a high proportion of left‐censored data (results below LOD/LOQ) with 74% of left‐censored data for PFOS and 91% of left‐censored for PFOA. A total of 20,019 analytical results (n = 10,191 for PFOS and n = 9,828 for PFOA) fulfilled the quality criteria applied and have been considered in the assessment.
The highest mean concentrations of PFOS and PFOA were recorded in the food category ‘Meat and meat products’. This was affected by a high mean concentration in liver from game mammals (LB/UB mean = 215/215 μg/kg for PFOS and LB/UB mean = 5.46/8.11 μg/kg for PFOA).
Excluding offal, the mean concentration in the category ‘meat and meat products’ was LB/UB = 0.55/0.75 for PFOS and LB/UB = 0.10/0.34 for PFOA. In edible offal from farmed animals, the concentration was for PFOS (LB/UB mean) 0.66/2.12 μg/kg and for PFOA (LB/UB mean) 0.05/1.39 μg/kg.
High levels were also observed in ‘Fish and other seafood’ (LB/UB mean = 2.08/2.59 μg/kg for PFOS and LB/UB mean = 0.18/0.90 μg/kg for PFOA.
For PFOS, the LB mean dietary exposure ranges from 1.26 (adolescents) to 20.86 (other children) ng/kg bw per week across age groups and surveys. The high (95th percentile) LB exposure range from 3.5 (adolescents) to 165.9 (other children) ng/kg bw per week.
For PFOA, the mean LB dietary exposure estimates range from 1.47 ng/kg bw per week (elderly and very elderly) up to 18.27 ng/kg bw per week (toddlers). The high LB (95th percentile) exposures range from 3.43 (very elderly) to 37.59 (toddlers) ng/kg bw per week.
The most important contributors to the LB mean chronic exposure to PFOS were ‘Fish and other seafood’ (contributing up to 86% in adults), especially ‘Fish meat’, followed by ‘Meat and meat products’ and ‘Eggs and egg products’. Regarding PFOA, ‘Milk and dairy products’ (contributing up to 86% in toddlers, but based on only a few samples with detectable levels for cow milk and gouda cheese), ‘Drinking water’ and ‘Fish and other seafood’ made the largest contribution to the LB mean chronic exposure.
4.2. Hazard identification and characterisation
4.2.1. Toxicokinetics
PFOS and PFOA are readily absorbed through the gastrointestinal tract in mammals including humans; then they distribute predominantly to the plasma and liver, are not metabolised and are excreted in both urine and faeces.
Biological half‐lives of both PFOS and PFOA are different between species and this is mainly due to differences in renal clearance.
Half‐lives of PFOS in rodents are slightly higher than one month, whereas in rabbits and monkeys estimated half‐lives were 3–4 months.
Significant gender differences in the elimination of PFOA are observed in some, but not all species; there are no gender differences in renal clearance in humans. Half‐lives of about one day and one week were measured in female and male rats, respectively. In cynomolgus monkeys the elimination half‐life was estimated at approximately one month and limited gender differences were observed regarding the disposition of PFOA in this species.
The half‐lives of the branched chain PFOS and PFOA isomers are generally shorter than those for the linear molecules, with the exception of 1 m‐PFOS.
For both PFOS and PFOA, maternal transfer occurs prenatally to the fetus and postnatally through breastfeeding.
The estimated half‐life for PFOS in humans is approximately 5 years, whereas for PFOA, several studies estimated a half‐life between 2 and 4 years.
4.2.2. Biomonitoring
PFOS and PFOA were detected in blood samples of almost all individuals assessed, demonstrating ubiquitous exposure.
In adults, the median for PFOS in the different studies ranged between 1.7 and 27.4 ng/mL (median of medians 7.7 ng/mL). For PFOA the median in adults ranged between 0.76 and 4.9 ng/mL (median of medians 1.9 ng/mL). In children, the median for PFOS in the different studies ranged between 0.49 and 8.6 ng/mL (median of medians 3.2 ng/mL). For PFOA the median in children ranged between 0.49 and 6.9 ng/mL (median of medians 3.3 ng/mL).
Using individual data, for PFOS, the concentrations in adults and children ranged from 0.06 to 392 ng/mL and from 0.47 to 23 ng/mL, respectively. For PFOA, the concentrations in adults and children ranged from 0.03 to 81 ng/mL and from 0.45 to 19.5 (P95) ng/mL, respectively.
The breast milk concentrations are usually around 0.9–2% and 1.8–9% of the maternal serum/plasma concentrations for PFOS and PFOA, respectively.
Concentrations observed in European populations were comparable to general populations worldwide.
4.2.3. Toxicity in experimental animals
4.2.3.1. Repeated dose toxicity
The rodent liver is a major target organ of PFOS. The most sensitive parameter was a dose‐dependent increase in the relative liver weight starting at 0.15 mg/kg bw per day.
The effects of PFOS in rodents, i.e. increased organ weight, hypertrophy of hepatocytes, and induction of peroxisomal β‐oxidation are mediated largely by interaction of PFOS with PPARa.
In rodents, PFOA increased absolute and relative liver weight and hepatic peroxisomal β‐oxidation at 0.64 mg/kg bw per day.
PFOA‐induced transactivation of PPARa is the major mechanism, underlying the hepatic effects. Evidence for liver damage was found as enhanced lipid peroxidation and elevated liver enzymes in serum at 2.5 mg/kg bw per day in mice.
4.2.3.2. Developmental and reproductive toxicity
In rodents for PFOS, the most sensitive effects were on maternal liver weight (0.3 mg/kg bw per day), placental physiology (0.5 mg/kg bw per day) and on glucose homoeostasis (0.3 mg/kg bw per day).
Following PFOA exposure, pathological alterations included increased liver weight in mouse pups and mothers following in utero exposure at doses of 0.1 and 0.6 mg/kg bw per day respectively.
In adult male mice, reproductive organs and male sex hormone levels were affected at 0.31 mg/kg bw per day.
For PFOA, biological responses at low doses (delay of mammary gland development in off‐spring animals and changes of levels of metabolic parameters) were noted at 0.01 mg/kg bw per day in mice.
4.2.3.3. Neurotoxicity
In rodents, both PFOS and PFOA have developmental neurotoxicity potential and widespread effects on the expression of genes coding for proteins relevant for signal transmission in the brain.
In rodents, male offspring are more sensitive than females.
The most frequent behavioural outcome reported after PFOS exposure in rodents is decreased spontaneous activity, which on the contrary is increased by PFOA.
4.2.3.4. Immunotoxicity
Various structural and functional parameters are affected by PFOS in mice; the most sensitive parameter affected by PFOS is the T‐cell dependent antibody response to immunisation.
The NOAEL for PFOS derived from the available studies is 1.66 μg/kg bw per day, based on the suppression of anti‐SRBC IgM titres in mice.
Effects of PFOA are similar to the effects of PFOS in mice, with both structural and functional parameters influenced.
The NOAEL for immunotoxicity of PFOA was 1 mg/kg bw per day based on suppression of anti‐SRBC IgM titres in mice.
4.2.3.5. Genotoxicity
No evidence for a direct genotoxic mode of action for both PFOS and PFOA was identified.
There is some evidence for oxidative stress induced by both PFOA and PFOS.
4.2.3.6. Long‐term toxicity and carcinogenicity
PFOS was found to cause tumours in the liver of rats. Mechanistic studies suggested that the compound may act as a tumour promoter.
In Sprague–Dawley rats, PFOA induced Leydig cell tumours. Hormonal dysbalance appears to be the underlying mechanism. Inconsistent effects were noted for pancreatic hyperplasia or tumours in mammary gland and liver.
4.2.4. Human observations
For a number of outcomes listed below and described in Section 3.3.4, the evidence for causal associations with PFOS/PFOA was considered insufficient. The reasons for this included evidence from single or few epidemiological studies, lack of statistical power, risk of bias, lack of external validity or inconsistent findings in the published studies and these are further summarised for the respective outcomes in Section 3.3.4.
For many of the outcomes reviewed, the majority of epidemiological studies were cross‐sectional, but for some outcomes the results from many cross‐sectional studies were consistent and supported also by a few longitudinal studies.
4.2.4.1. Fertility and pregnancy outcomes
Epidemiological studies provide some evidence for a causal association between prenatal exposure to PFOS and PFOA and birth weight. Despite relatively consistent findings, the role of confounding by increased glomerular filtration rate cannot be excluded and some uncertainty on the clinical relevance of these findings exists as associations with low birth weight (defined as < 2,500 g) have not been reported.
Epidemiological studies conducted provide insufficient evidence for a causal association between prenatal exposures to PFOS and PFOA and increased prevalence of birth defects or stillbirths, subfecundity, risk of miscarriage or pregnancy hypertension.
4.2.4.2. Developmental outcomes
Epidemiological studies provide insufficient support for causal associations between prenatal or perinatal exposure to PFOS/PFOA and neurodevelopment, growth in infancy or childhood, puberty, semen quality or metabolic outcomes.
4.2.4.3. Neurotoxicity outcomes
Epidemiological studies provide insufficient support for causal associations between exposure to PFOS/PFOA and neurobehavioural, neuropsychiatric or cognitive outcomes in childhood or adulthood.
4.2.4.4. Immune outcomes
Epidemiological studies suggest that exposure to PFOS, and possibly PFOA, adversely affect serum antibody response following vaccination, with children being the most vulnerable subgroup. This provides strong support for causal associations.
There are some suggestions from epidemiological studies that prenatal exposures to PFOS and PFOA may lead to increased propensity of infection.
Epidemiological studies provide insufficient support for causal associations between exposures to PFOS or PFOA and asthma and allergies in children and adults.
4.2.4.5. Endocrine outcomes
Epidemiological studies provide insufficient support for causal associations between exposure to PFOS/PFOA and timing of puberty, menopause, menstrual cycle changes, endometriosis, milk production measured as duration of breastfeeding, semen quality, sex hormones or thyroid function.
4.2.4.6. Metabolic outcomes
Epidemiological studies provide strong support for causal associations between exposure to PFOS and PFOA and increased serum levels of cholesterol.
Epidemiological studies provide support for a causal association between exposure to PFOA and increased serum levels of the liver enzyme alanine transferase (ALT), but not for liver disease.
There is insufficient support for causal associations with diabetes, obesity and metabolic syndrome.
4.2.4.7. Kidney and uric acid
Epidemiological studies provide insufficient support for causal associations between exposure to PFOS/PFOA and changes in kidney function or serum levels or uric acid.
4.2.4.8. Carcinogenicity outcomes
Epidemiological studies provide insufficient support for carcinogenicity of PFOS and PFOA in humans. This conclusion applies to both studies conducted in occupationally exposed individuals and in the general population.
4.2.4.9. Cardiovascular outcomes
Epidemiological studies provide insufficient support for causal associations between exposure to PFOS/PFOA and increased risk of cardiovascular disease.
4.2.4.10. Other outcomes
Epidemiological studies provide insufficient support for causal associations between exposure to PFOS/PFOA and risk of ulcerative colitis, osteoarthritis, rheumatoid arthritis or bone mineral density.
4.2.5. Mode of action
4.2.5.1. Liver toxicity
PFOS and PFOA, both ligands of the nuclear receptor PPARa, induce liver growth, proliferation of peroxisomes and induction of peroxisomal β‐oxidation in rodents.
Elevated peroxisomal β‐oxidation in rodents may lead to hepatic lipid peroxidation and subsequently to cell death and enhanced release of liver transaminases.
It is presently unclear by which mechanisms PFOS and PFOA may increase serum alanine aminotransferase in humans.
4.2.5.2. Metabolic outcomes – Blood lipids
In rodents, PFOS and PFOA may impair the release of cholesterol and/or triglycerides from the liver causing elevated intrahepatic and lowered serum cholesterol and/or triglyceride concentrations. These effects in rodents may not be of human relevance presumably due to species‐specific differences in the function of PPARa affecting the metabolism of lipids.
4.2.5.3. Birth weight
In human studies, an inverse relation between PFOS and IGF‐1 levels were shown, which may be associated with a reduced growth rate.
In rodents, PFOS and PFOA reduced body weight, which is associated with loss of white adipose tissue, upregulation of UCP‐1 and its association with energy expenditure and regulation of food consumption.
4.2.5.4. Immunotoxicity
PFOS and PFOA affect lymphocytes, macrophages, and other cells of the immune system possibly by modulation of gene regulation via PPARs, NF‐κB transcription and regulation of apoptosis.
PFOS and PFOA share mechanisms, but may also be different as cytokine profiles in lymphoid cells have shown to be differentially affected.
4.2.5.5. Carcinogenicity
PFOS and PFOA act as tumour promoters in rodent liver. Transactivation of rodent PPARa but not of human PPARa appears to mediate the carcinogenic activity of PPARa ligands. A similar mechanism may be anticipated for PFOS and PFOA.
PFOA induces Leydig cell adenomas in rat testis, caused by reduced serum testosterone levels and compensatory releases of luteotrophic hormone, which stimulates growth of Leydig cells and tumour formation. Leydig cell tumours occur frequently in rodents but rarely in humans.
PFOA causes pancreatic hyperplasia, a prestage of tumour formation. As known from other PPARa ligands, altered composition and output of bile acids may enhance the secretion of cholecystokinin, which binds to acinar CKK1 receptor and stimulates growth of this cell type. This MoA appears to be irrelevant for humans.
4.3. Critical effects, dose–response assessment and derivation of a health‐based guidance value
For both PFOS and PFOA, a large number of epidemiological studies in humans have been published, most of them not being available for the previous opinion in 2008. For the present opinion, the CONTAM Panel decided to use human observations when assessing critical effects and for derivation of an HBGV.
Since both toxicity as well as underlying modes of toxic action for PFOS and PFOA are not sufficiently understood and might differ, but also overlap, the CONTAM Panel decided not to derive a group HBGV for PFOS and PFOA.
4.3.1. PFOS
For outcomes identified in adults, the CONTAM Panel considers the increase of serum cholesterol to be the critical key adverse outcome for PFOS. Three studies on serum cholesterol showed very similar BMDL5 levels expressed as serum PFOS (21–25 ng/mL), corresponding to an estimated chronic daily intake of 1.7–2.0 (median 1.8) ng/kg bw per day as calculated with a PBPK‐model for humans.
It is likely that adjustment for PFOA (and maybe other PFASs) would result in somewhat higher BMDL5 values and corresponding daily intake rates.
The CONTAM Panel considered it not appropriate to calculate which intake rate for children after the end of breastfeeding would correspond to the BMDL5 level for serum PFOS in 5‐year old children. Instead, the serum PFOS levels in the pregnant mothers in the critical study were compared with serum PFOS levels for the other potential critical effects, and plasma levels in breastfed children were modelled to illustrate how maternal serum PFOS levels and intake rates would be related to serum PFOS levels in their 5‐year old children.
The BMDL5 for reduced birth weight was the same as for increased cholesterol. The CONTAM Panel noted that there is still some uncertainty both regarding causality and adversity of reduced birth weight. However, since there is likely confounding by glomerular filtration rate, an intake rate based on the BMDL5 for increased cholesterol is protective also for reduced birth weight.
With serum cholesterol, antibody response after vaccination, and birth weight all considered as potential critical endpoints, the CONTAM Panel found it appropriate to weigh the overall evidence from the human observational studies when setting an HBGV. Therefore, the CONTAM Panel considers that 1.8 ng/kg bw per day is an appropriate reference point.
In order to take into account the long half‐life of PFOS, the CONTAM Panel established a TWI of 13 ng/kg bw per week. If applied for all age groups, it is protective for adverse effects on vaccination response and reduced birth weight.
4.3.2. PFOA
The CONTAM Panel considers the increase of serum cholesterol to be the critical effect for PFOA. Two studies on serum cholesterol showed very similar BMDL5 expressed as serum PFOA (9.2–9.4 ng/mL) corresponding to an estimated chronic daily intake of 0.8 ng/kg bw per day as calculated with a PBPK‐model for humans.
The BMDL5 from the larger of the two studies was based on extrapolation to a low serum PFOA of 1 ng/mL, but it is still within the range of individual data observed in the lowest decile. This adds to the uncertainty of the BMDL5. The CONTAM Panel decided to take into account both this study and the smaller one when deriving an HBGV for PFOA.
It is likely that adjustment for PFOS (and maybe other PFASs) would result in somewhat higher BMDL5 levels and corresponding daily intake rates.
The CONTAM Panel considered 0.8 ng/kg bw per day to be an appropriate reference point.
In order to take into account the long half‐life of PFOA the CONTAM Panel established a TWI of 6 ng/kg bw per week. It is protective also for increased risk of liver damage, indicated by high serum ALT. It is protective against reduced birth weight, taking into account the fact that there is likely to be confounding by glomerular filtration rate.
4.3.3. PFOS and PFOA
The CONTAM Panel decided not to apply any additional uncertainty factors because the BMD modelling was based on large epidemiological studies from the general population, including potentially sensitive subgroups. The CONTAM Panel also took into account that the BMD modelling was performed on risk factors for disease rather than disease.
4.4. Risk characterisation
The CONTAM Panel is aware of the fact that the present exposure assessment is highly uncertain. Large differences between LB and UB concentrations were observed in foods, as a result of analytical methods being used that are not sufficiently sensitive. This results in a large difference between maximum UB and minimum LB chronic dietary exposure estimates for PFOS and PFOA.
-
The CONTAM Panel considers that the true exposure level for both PFOS and PFOA is closer to the LB than the UB values. This assumption is based on two facts:
Studies performed using the best analytical methods with high sensitivity and high levels of quality control give results with fewer left censored data and confirm occurrence in foods at levels close to the LB estimates.
Median LB data in this opinion are consistent with what would be expected based on median population blood serum levels.
For PFOS, mean LB dietary exposure ranged from 1.3 to 20.9 ng/kg bw per week, across age groups and surveys. The high (95th percentile) LB exposure ranged from 3.5 to 165.9 ng/kg bw per week. Therefore, a considerable proportion of the population exceeds the TWI of 13 ng/kg bw per week, by up to 1.6‐ and 13‐fold, for mean LB and high LB exposure, respectively.
For PFOS, at the UB, the TWI is exceeded in all surveys at mean exposure, and the high UB (95th percentile) exposures exceed the TWI from 1.7‐ to 15‐fold across surveys and age groups.
For PFOA, mean LB dietary exposure estimates range from 1.5 to 18.3 ng/kg bw per week. The high (95th percentile) LB exposures range from 3.4 to 37.6 ng/kg bw per week. Therefore, a considerable proportion of the population exceeds the TWI of 6 ng/kg bw per week, by up to 3‐ and 6‐fold for mean LB and high LB exposure, respectively.
For PFOA, at the mean UB, the TWI is exceeded 1.4‐ to 14‐fold across surveys and up to 28‐fold at the high UB (95th percentile) exposure for toddlers.
The exceedances of the TWIs for PFOS and PFOA at LB exposure estimates are of concern.
5. Recommendations
Data obtained by more sensitive analytical methods with high levels of quality control (to avoid matrix effects or impact of background contamination) are needed in order to increase the proportion of quantified results and thus reduce uncertainty in the occurrence assessment and the dietary exposure assessment. Improved reporting of data in terms of clarifying whether upper or lower bound and clarification of whether or not data are corrected for recovery will reduce uncertainty in exposure estimates.
More studies on the effect of cooking and food processing would improve exposure assessments given that most food is consumed after cooking/processing and the data reported in the scientific literature are inconsistent regarding the impact this has on exposure.
More longitudinal epidemiological studies are needed, in particular prospective vaccination studies covering more varied types of vaccines and age groups, as well as more studies on other immune outcomes in humans.
Access to individual data in epidemiological studies is needed in order to perform accurate dose–response analysis and risk characterisation.
Most epidemiological studies examine associations between health‐related outcomes and single PFASs separately in spite of co‐exposures. For risk assessment it would be useful, also to report results mutually adjusted for several PFASs so conclusions can be drawn on the independent associations of PFOS and PFOA.
Documentation provided to EFSA
Sørenson, 2017: data provided by Mette Sørenson on 21 September 2017 and used for BMD modelling of the Eriksen et al., 2013 study.
Danish National Birth Cohort, 2017: data provided by Danish National Birth Cohort after contacting the data owners in May 2017 and used for BMD modelling of the Fei et al., 2007 study.
Fletcher 2017b: data provided by Tony Fletcher on 28 June 2017 and used for BMD modelling of the Gallo et al., 2012 study.
Grandjean and Budtz‐Jørgensen, 2017: data provided by Philippe Grandjean and Esben Budtz‐Jørgensen on 31 August 2017 and used for BMD modelling of the Grandjean et al., 2012 study.
Steenland, 2017: information provided by Kyle Steenland on 01 March 2017 and used for BMD modelling of the Steenland et al., 2009 study.
Whitworth, 2017: data provided by Kristina W. Whitworth on 13 July 2017 and used for BMD modelling of Whitworth et al., 2012a study.
Campbell, 2018: modifications to PBPK model codes from Loccisano et al., 2011, were received from Jerry Campbell in February 2018.
Abbreviations
- ACOX
acyl‐CoA oxidase
- AD
Alzheimer's disease
- ADHD
attention deficit hyperactivity disorder
- ADME
absorption, distribution, metabolism and excretion
- AFB1
aflatoxin B1
- AFFF
aqueous film forming foam
- AhR
aryl hydrocarbon receptor
- ALP
alkaline phosphatase
- ALT
alanine aminotransferase
- APFN
ammonium perfluorononanoate
- APFO
ammonium perfluorooctanoate
- AST
aspartate aminotransferase
- AT
Austria
- ATSDR
Agency for Toxic Substances and Disease Registry
- BAF
bioaccumulation factor
- BE
Belgium
- BfR
Federal Institute for Risk Assessment in Germany
- BMD
benchmark dose
- BMDL10
benchmark dose for a 10% increase
- BMI
body mass index
- BMDU
benchmark dose upper confidence limit
- BMF
biomagnification factor
- BMR
benchmark response
- br‐PFOA/PFOS
branched PFOA/PFOS
- BSA
bovine serum albumin
- bw
body weight
- CA
Canada
- CAR
constitutive activated/androstane receptor
- CCK
cholecystokinin
- CHMS
Canadian Health Measures Survey
- CHO
Chinese hamster ovary
- CI
confidence interval
- CIMT
carotid artery intima media thickness
- CKD
chronic kidney disease
- CLRTAP
Convention on Long‐range Transboundary Air Pollution
- CN
China
- CONTAM Panel
EFSA Panel on Contaminants in the Food Chain
- CP
cerebral palsy
- CS
cross‐sectional study
- CSF
cerebrospinal fluid
- CY
Cyprus
- CZ
Czech Republic
- DATA Unit
EFSA former EFSA Dietary and Chemical Monitoring Unit
- DCFDA
dichlorofluorescin diacetate
- DCFH‐DA
dichlorodihydrofluorescein diacetate
- DCH
Diet Cancer and Health
- DE
Germany
- DK
Denmark
- DRD
dopamine receptor
- DT
Default tolerance
- dw
dry weight
- DXA
dual‐energy X‐ray absorptiometry
- ECF
electrochemical fluorination
- eGFR
estimated glomerular filtration rate
- EPA
Environmental Protection Agency
- ES
Spain
- ESI
electrospray ionisation
- EtFASAs
N‐ethyl perfluoroalkane sulfonamides
- EtFASEs
N‐ethylperfluoroalkane sulfonamidoethanols
- EtFOSE
N‐ethyl perfluorooctane sulfonamidoethanolN‐ethylperfluoroalkane sulfonamidoethanols
- f
female
- FASAs
perfluoroalkane sulfonamides
- FAT
fatty acid translocase
- FEP
fluorinated ethylene‐propene
- FI
Finland
- FOSA
perfluorooctane sulfonamide
- FOSE
N‐ethyl fluorooctanesulfonamido ethanol
- FI
Finland
- FR
France
- FSANZ
Food Standards Australia New Zealand
- FTOHs
fluorteleomer alcohols
- GC
gas chromatography
- GD
gestational day
- GDM
gestational diabetes
- GFR
glomerular filtration rate
- GGT
gamma‐glutamyl transferase
- GL
Greenland
- GM
geometric mean
- GR
Greece or HE
- HA
Health Advisory
- HBGV
health‐based guidance value
- HBM
human Biomonitoring
- HC
high consumer
- HDL
high‐density lipoproteins
- HED
human equivalent dose
- HOMA‐IR
Homeostasis Model Assessment–Insulin resistance
- HR
hazard ratio
- IARC
International Agency for Research on Cancer
- IDL
intermediate‐density lipoprotein
- IF5
iodine pentafluoride
- IFN
interferon
- IHD
ischaemic heart disease
- IgG
immunoglobulin G
- IgM
immunoglobulin M
- IGT
impaired glucose tolerance
- IL
interleukin
- i.p.
intraperitoneal
- IPE
ion‐pair extraction
- IQR
Interquartile range
- IR
Ireland
- IT
Italy
- i.v.
intravenous
- JP
Japan
- Ka
association constant
- Kd
dissociation constant
- KLH
keyhole limpet haemocyanin
- KR
Korea (South)
- Kt
affinity constant
- L
longitudinal study
- LB
lower bound
- LBW
low birth weight
- LC
left‐censored
- LC‐MS/MS
LC coupled to quadrupole tandem mass spectrometry
- LDH
lactate dehydrogenase
- LDL
low‐density lipoproteins
- L‐FABP
liver fatty acids binding protein
- LI
labelling index
- LOAEL
lowest‐observed‐adverse‐effect‐level
- LOD
limit of detection
- LOQ
limit of quantification
- Lpl
lipoprotein lipase
- LPS
lipopolysaccharide
- m
male
- MAC
maximum acceptable concentration
- mMCD
marginal methionine/choline‐deficient
- MNNG
N‐methyl‐N‐nitro‐N‐nitrosoguanidine
- MoA
mode of action
- MRI
magnetic resonance imaging
- MS
mass spectrometry
- MT
Malta
- N/A
not applicable
- NAFLD
non‐alcoholic fatty liver disease
- NASH
non‐alcoholic steatohepatitis
- NC
non‐consumer
- NCEH1
neutral cholesterol ester hydrolase 1
- NK
natural killer (cell)
- NMR
nuclear magnetic resonance
- NO
Norway
- NOAEL
no‐observed‐adverse‐effect‐level
- n‐PFOA/PFOS
linear PFOA/PFOS
- NR
not reported
- Nrf2
nuclear factor erythroid 2‐related factor 2
- NTP
National Toxicology Program
- OAT
organic anion transport protein
- Oatp
organic anion‐transporting polypeptide
- Occup
Occupational study
- OECD
Organisation for Economic Co‐operation and Development
- OR
odds ratio
- PAD
peripheral artery disease
- PAPs
polyfluoroalkyl phosphoric acid esters
- PBDEs
polybrominated diphenylethers
- PBL
peripheral blood leukocyte
- PBMC
peripheral blood mononuclear cell
- PBPK
physiologically based pharmacokinetic (model)
- PBT
persistent, bioaccumulative and toxic (substance)
- PCBs
polychlorinated biphenyls
- PCNA
proliferating cell nuclear antigen
- PFBS
perfluorobutane sulfonic acid
- PFCAs
perfluoroalkyl carboxylic acids
- PFDA
perfluorodecanoic acid
- PFDoDA
perfluorododecanoic acid
- PFHpA
perfluoroheptanoic acid
- PFHxA
perfluorohexanoic acid
- PFHxS
perfluorohexane sulfonic acid
- PFNA
perfluorononanoic acid
- PFOA
perfluorooctanoic acid
- PFOS
perfluorooctane sulfonic acid
- PFOSF
perfluorooctane sulfonyl fluoride
- PFSAs
perfluoroalkyl sulfonic acids
- PFUnDA
perfluoroundecanoic acid
- PHA
phytohaemagglutinin
- PIGE
particle‐induced γ‐ray emission
- PK
pharmacokinetic
- PND
postnatal day
- PO
Poland
- POD
point of departure
- POP
persistent organic pollutant
- POSF
perfluorooctane sulfonyl fluoride
- PPAR
peroxisome proliferator‐activated receptors
- PTFE
Polytetrafluoroethene
- PUFA
polyunsaturated fatty acids
- Q
quartile
- qPCR
quantitative polymerase chain reaction
- RCR
risk characterisation ratio
- REACH
Registration, Evaluation, Authorisation and Restriction of Chemicals
- RfD
reference dose
- ROS
reactive oxygen species
- RR
risk ratio
- SA
sensitivity analysis
- SD
standard deviation
- SE
Sweden
- SEM
structural equation modelling
- SGA
small for gestational age
- SHE
Syrian hamster embryo
- SI
Slovenia
- SLE
solid–liquid extraction
- SOD
superoxide dismutase
- SOP
standard operational procedure
- SRBC
sheep red blood cells
- SREBP
sterol regulatory element‐binding protein 1 and 2
- SRS
Social Responsiveness Scale
- S‐UA
serum uric acid
- SVHC
Substances of Very High Concern
- Syn
synapsin
- Syp
synaptophysin
- T
tertile
- T3
triiodothyronine
- T4
thyroxine
- TAD
total administered dose
- TBG
thyroxin binding globulin
- TC
total cholesterol
- TDI
tolerable daily intake
- TDS
Total Diet Study
- TEB
terminal end buds
- TG
triglycerides
- TH
tyrosine hydroxylase
- Tm
Transporter maximum
- TNF
Tumour necrosis factor
- TNP
tri‐nitrophenyl
- TPOab
thyroid peroxidase antibodies
- TrxR
thioredoxin reductase
- TSH
thyroid‐stimulating hormone
- TTR
transthyretin
- TW
Taiwan
- TWI
tolerable weekly intake
- UA
Ukraine
- UB
upper bound
- UCP1
uncoupling protein 1
- UF
uncertainty factor
- UGT
uridine 5’‐diphospho‐glucuronosyl transferase
- UK
United Kingdom
- URAT
urate transporter
- US
United States
- VLDL
very low‐density lipoprotein
- WG
Working Group
- WHO
World Health Organization
- WT
wild type
- ww
wet weight
Appendix A – Occurrence in food, human consumption data and human dietary exposure
1.
Tables A.4–A.11 of Appendix A can be found in the online version of this output (‘Supporting information’ section): https://efsa.onlinelibrary.wiley.com/doi/full/10.2903/j.efsa.2018.5194
Description: Supporting tables on food and feed occurrence and human exposure.
Appendix B – Benchmark Dose Modelling
1.
The outcome results presented in the tables below were performed on data adjusted for potential confounders, as presented by the authors in the respective publications or provided upon request from EFSA. Thus, the results are not ‘raw’ data, but predicted values for the respective PFOS/PFOA quantiles.
1) Steenland et al., 2009 ‐ Total cholesterol vs PFOS
| decile | Median PFOS (ng/mL) | Mean Total cholesterol (mg/dL) | SD |
|---|---|---|---|
| 1 | 6.4 | 197.0 | 62 |
| 2 | 10.5 | 199.3 | 62 |
| 3 | 13.6 | 200.0 | 65 |
| 4 | 16.1 | 203.0 | 60 |
| 5 | 18.8 | 204.0 | 62 |
| 6 | 21.6 | 205.0 | 66 |
| 7 | 24.9 | 205.7 | 61 |
| 8 | 29.2 | 207.7 | 64 |
| 9 | 35.5 | 209.2 | 62 |
| 10 | 49.3 | 209.6 | 62 |
PFOS: perfluorooctane sulfonic acid; SD: standard deviation.
Total number of individuals in the cohort: 46,294. Data on median PFOS levels, mean total cholesterol levels and 95% confidence interval (CI) were obtained by digitising the results from the published paper. The number of subjects per decile was assumed to be equal in each quantile, and the SDs were calculated based on the confidence intervals.
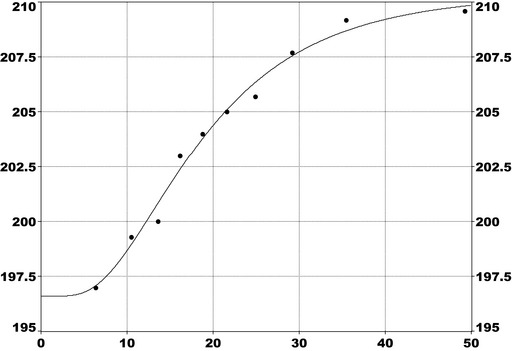
Model: Response = a + 0.5 × b × erfc(−ln(Dose/c)/(20.5 × d))
a = 196.6; b = 13.8; c = 18.2; d = 0.57
BMR: 5%
Reference value: PFOS concentration at first decile = 6.38 ng/mL
BMD: 27 ng/mL
BMDL: 25 ng/mL
erfc: complementary error function
2) Eriksen et al., 2013 ‐ Total cholesterol vs PFOS
| Octile | Median PFOS level (ng/mL) | Mean Total cholesterol (mg/dL) | SD |
|---|---|---|---|
| 1 | 17.0 | 223.0 | 56 |
| 2 | 23.7 | 230.3 | 56 |
| 3 | 28.4 | 235.6 | 56 |
| 4 | 32.2 | 233.0 | 56 |
| 5 | 36.9 | 235.0 | 56 |
| 6 | 41.1 | 237.5 | 56 |
| 7 | 47.9 | 239.0 | 57 |
| 8 | 58.5 | 234.0 | 57 |
PFOS: perfluorooctane sulfonic acid; SD: standard deviation.
Total number of individuals in the cohort: 753. Data on median PFOS levels, mean total cholesterol levels and 95% CI were obtained through author contact. The number of subjects per octile was assumed to be approximately equal in each quantile, and the SDs were calculated based on the confidence intervals.
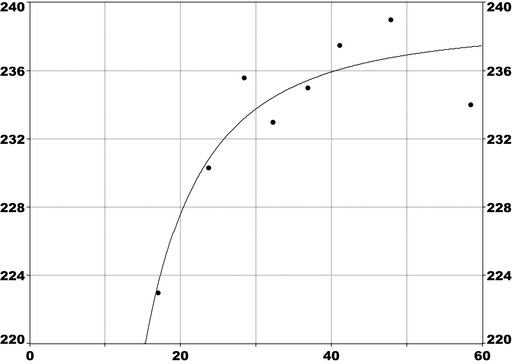
Model: Response = a + b/Dose2
a = 238.7; b = −4427
BMR = 5%
Reference value: PFOS concentration at the first octile = 17 ng/mL
BMD: 31 ng/mL
BMDL: 22 ng/mL
3) Nelson et al., 2010 ‐ Total cholesterol vs PFOS
| Quartile | Median PFOS level (ng/mL) | Mean Total cholesterol (mg/dL) | SD |
|---|---|---|---|
| 1 | 9.9 | 200.0 | 70 |
| 2 | 17 | 205.9 | 70 |
| 3 | 24 | 205.0 | 72 |
| 4 | 38 | 213.6 | 72 |
PFOS: perfluorooctane sulfonic acid; SD: standard deviation.
Total number of individuals in the cohort: 860. Data on median PFOS levels, and numbers in each quantile were available in the published paper. Mean changes in total cholesterol and SEMs were digitised from the published paper.
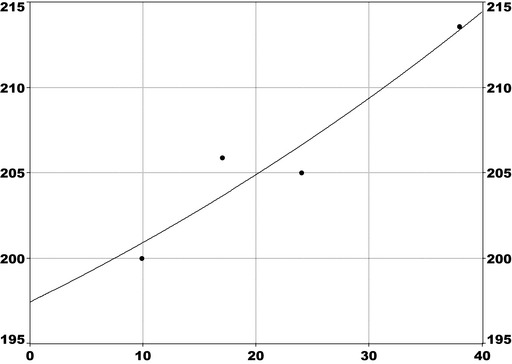
Model: Response = a + b × e(−Dose/c)
a = 170; b = 26.8; c = −81.5
BMR = 5%
Reference value: PFOS concentration of the first quartile = 9.9 ng/mL
BMD: 31 ng/mL
BMDL: 21 ng/mL
4) Grandjean et al. 2012 ‐ Immunotoxicity vs PFOS
| Decile | Median PFOS level (ng/mL) | Log2 Diphtheria antibody concentration (IU/mL) | Mean Diphtheria antibody concentration (IU/mL) | SEM (in log scale) |
|---|---|---|---|---|
| 1 | 10.29 | 0.170 | 1.12 | 0.258 |
| 2 | 12.71 | 0.325 | 1.25 | 0.294 |
| 3 | 14.21 | ‐0.406 | 0.75 | 0.321 |
| 4 | 15.59 | 0.266 | 1.20 | 0.260 |
| 5 | 16.64 | ‐0.420 | 0.74 | 0.285 |
| 6 | 18.17 | ‐0.536 | 0.69 | 0.291 |
| 7 | 19.84 | 0.088 | 1.06 | 0.267 |
| 8 | 21.29 | ‐0.407 | 0.75 | 0.311 |
| 9 | 23.60 | ‐0.189 | 0.87 | 0.312 |
| 10 | 28.40 | ‐0.591 | 0.66 | 0.280 |
PFOS: perfluorooctane sulfonic acid; SEM: standard error of mean.
Total number of individuals in the cohort: 431. Data were obtained through author contact.
Original data are given in log2, so calculations were made in that unit and then converted. The curve below is only given to show the shape of the curve in the same mathematical space as for other models. Numbers in each decile were approximately the same.
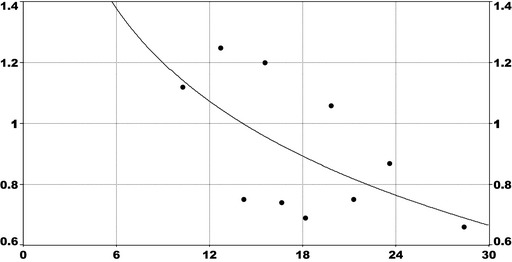
Model: Response = a + b × ln(Dose)
a = 2.15; b = −0.435
BMR = 5%
Reference value: PFOS concentration of the first decile point = 10.29 ng/mL
BMD: 11.6 ng/mL
BMDL: 10.5 ng/mL
5) Whitworth et al., 2012a ‐ Birth weight vs PFOS
| Quartile | Median PFOS level (ng/mL) | Mean Birth weight (g) | SD |
|---|---|---|---|
| 1 | 8.46 | 3778 | 551 |
| 2 | 11.64 | 3734 | 636 |
| 3 | 14.65 | 3683 | 664 |
| 4 | 19.9 | 3676 | 721 |
PFOS: perfluorooctane sulfonic acid; SD: standard deviation.
Total number of individuals in the cohort : 838. Data on number of subjects per quartile, PFOS levels, birth weight and SD were obtained through author contact.
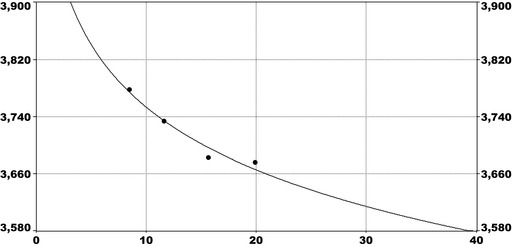
Model: Response = a + b × ln(Dose)
a = 4072; b = −137.9
BMR = 5%
Reference value: PFOS concentration of the first quartile = 8.46 ng/mL
BMD: 36 ng/mL
BMDL: 21 ng/mL
6) Steenland et al. 2009 ‐ Total cholesterol vs PFOA
| Decile | Median PFOA level (ng/mL) | Mean Total cholesterol level (mg/dL) | SD |
|---|---|---|---|
| 1 | 5.5 | 199 | 60 |
| 2 | 9.6 | 202 | 60 |
| 3 | 13.5 | 204 | 60 |
| 4 | 18.2 | 205 | 60 |
| 5 | 24.1 | 206 | 60 |
| 6 | 33.5 | 206 | 60 |
| 7 | 48.3 | 208 | 60 |
| 8 | 70.9 | 207 | 60 |
| 9 | 117 | 208 | 60 |
| 10 | 344 | 210 | 60 |
PFOA: perfluorooctanoic acid; SD: standard deviation.
Total number of individuals in the cohort: 46,294. Data on median PFOA levels, mean total cholesterol levels and 95% CIs, were obtained by digitising the results from the published paper. The number of subjects per decile was assumed to be equal in each quantile, and the SDs were calculated based on the 95% confidence intervals.
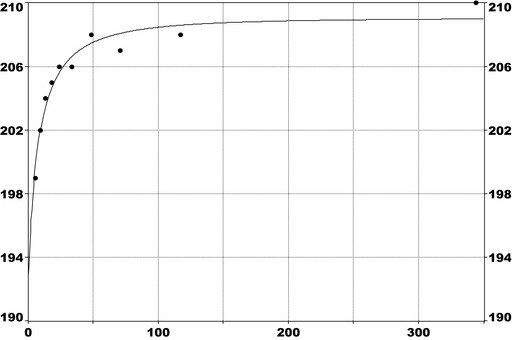
Model: Response = a + 0.5 × b × erfc(−ln(Dose/c)/(20.5 × d))
a = 192.8; b = 16.2; c = 7.55; d = 1.44
BMR = 5%
Reference value: PFOA concentration = 1 ng/mL25
BMD: 12 ng/mL
BMDL: 9.4 ng/mL
erfc: complementary error function
7) Eriksen et al. 2013 ‐ Total cholesterol vs PFOA
| Octile | Median PFOA level (ng/mL) | Mean Total cholesterol (mg/dL) | SD |
|---|---|---|---|
| 1 | 3.3 | 223.0 | 56 |
| 2 | 4.6 | 226.5 | 56 |
| 3 | 5.4 | 231.5 | 56 |
| 4 | 6.2 | 229.0 | 56 |
| 5 | 7.1 | 226.2 | 56 |
| 6 | 7.9 | 237.5 | 56 |
| 7 | 9.3 | 229.4 | 57 |
| 8 | 11.8 | 235.4 | 57 |
PFOA: perfluorooctanoic acid; SD: standard deviation.
Total number of individuals in the cohort: 753. Data on median PFOA levels, mean total cholesterol levels and CI, were obtained through author contact. The number of subjects per octile was assumed to be approximately equal in each quantile, and the SDs were calculated based on the confidence intervals.
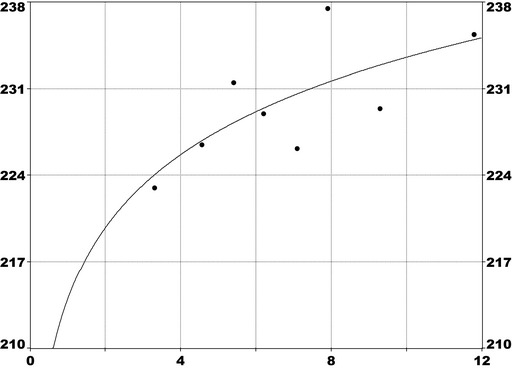
Model: response = 0.5 × a × erfc (−ln(Dose/b)/(20.5 × c))
a = 584; b = 7725; c = 26.2
BMR = 5%
Reference value26: PFOA concentration first octile = 3.3 ng/mL
BMD: 12.4 ng/mL
BMDL: 9.2 ng/mL
erfc: complementary error function
8) Gallo et al. 2012 ‐ Alanine Transferase vs PFOA
| Decile | Median PFOA level (ng/mL) | Number above reference range | Number of individuals | Prevalence (number above reference range/number of individuals) (%) |
|---|---|---|---|---|
| 1 | 5.8 | 417 | 4609 | 9.0 |
| 2 | 9.7 | 446 | 4573 | 9.7 |
| 3 | 13.5 | 494 | 4688 | 10.5 |
| 4 | 17.9 | 516 | 4678 | 11.0 |
| 5 | 24 | 558 | 4639 | 12.0 |
| 6 | 33 | 550 | 4681 | 11.7 |
| 7 | 47.2 | 522 | 4643 | 11.2 |
| 8 | 70.8 | 557 | 4642 | 12.0 |
| 9 | 118 | 547 | 4650 | 11.7 |
| 10 | 355 | 589 | 4649 | 12.6 |
PFOA: perfluorooctanoic acid.
Total number of individuals in the cohort : 47,092. Data were obtained through author contact.
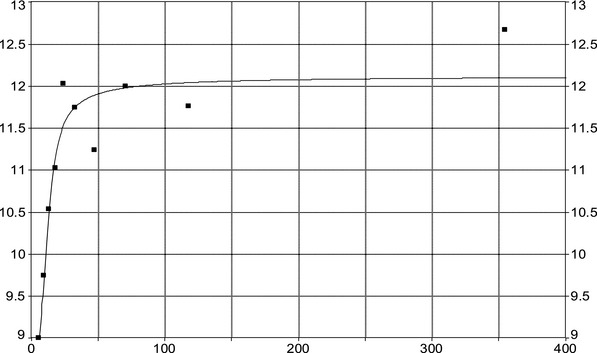
Model: Response = a + (b/π) × (arctan((Dose−c)/d) + π/2) (cumulative Lorentzian curve with intercept).
a = 7.68; b = 4.44; c = 10.4; d = 6.13.
BMR = 3%
Reference value: PFOA concentration at first decile (= 5.8 ng/mL)
BMD: 80 ng/mL
BMDL: 21 ng/mL
9) Fei et al. 2007 ‐ Birth weight vs PFOA
| Decile | Median PFOA level (ng/mL) | Mean Birth weight (g) | SD |
|---|---|---|---|
| 1 | 2.4 | 3737 | 638 |
| 2 | 3.2 | 3754 | 640 |
| 3 | 3.9 | 3657 | 650 |
| 4 | 4.4 | 3675 | 650 |
| 5 | 5.0 | 3696 | 650 |
| 6 | 5.5 | 3702 | 655 |
| 7 | 6.2 | 3643 | 660 |
| 8 | 7.0 | 3660 | 660 |
| 9 | 7.9 | 3690 | 680 |
| 10 | 9.7 | 3597 | 685 |
PFOA: perfluorooctanoic acid; SD: standard deviation.
Total number of individuals in the cohort : 1400. Data were obtained through author contact (the Danish National Birth Cohort). The number of subjects per decile was assumed to be equal in each decile.
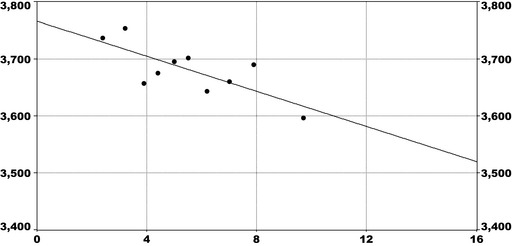
Model: Response = a × Dose + b
a = −15.1; b = 3766
BMR = 5%
Reference value: PFOA concentration at first decile (= 2.4 ng/mL)
BMD: 14.5 ng/mL
BMDL: 10.6 ng/mL
10) Whitworth et al. 2012a ‐ Birth weight vs PFOA
| Quartile | Median PFOA level (ng/mL) | Mean Birth weight (g) | SD |
|---|---|---|---|
| 1 | 1.33 | 3754 | 593 |
| 2 | 1.92 | 3728 | 551 |
| 3 | 2.60 | 3739 | 593 |
| 4 | 3.69 | 3668 | 593 |
PFOA: perfluorooctanoic acid; SD: standard deviation.
Total number of individuals in the cohort: 849. Data on number of subjects in each quartile, PFOA levels, birth weight and SD were obtained through author contact.
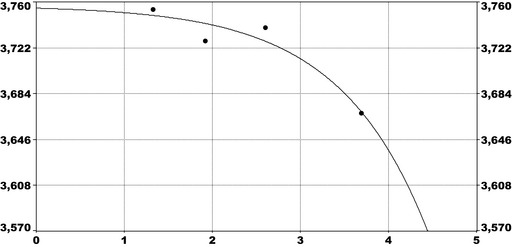
Model: Response = a + b × eDose
a = 3759; b = −2.28
BMR = 5%
Reference value: PFOA concentration at first quartile (= 1.33 ng/mL)
BMD: 4.4 ng/mL
BMDL: 4.0 ng/mL
Appendix C – PBPK Modelling
C.1. Steady‐state concentrations
Figures C.1 and C.2 show steady‐state plasma concentrations of PFOA and PFOS, respectively, using PBPK modelling as described in Section C.3 of this Appendix. The model codes were based on the supplementary material in (Loccisano et al., 2011), with some modifications provided by a co‐author of the original paper (see Campbell, 2018‐ under ‘Documentation provided to EFSA’). When codes differ from the original codes provided by (Loccisano et al., 2011) it is explained in notes to the model code (see Subsections C.3.4.1 and C.3.4.2 of this Appendix).
Figure C.1.
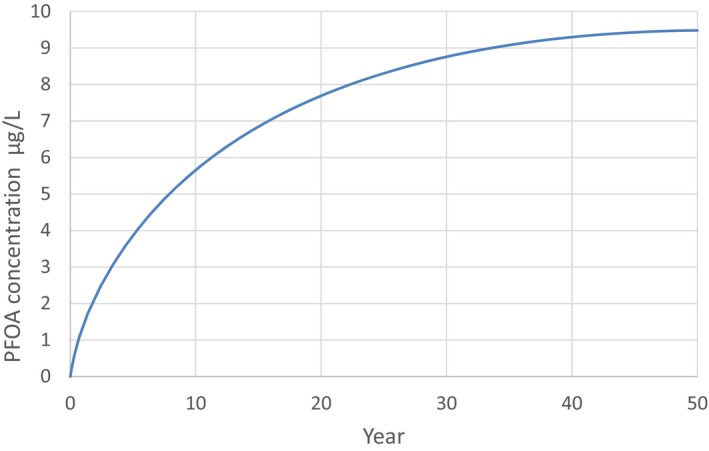
- Estimations are from the PBPK model from Loccisano et al. (2011) (coded and simulated by Berkeley Madonna version 8.3.18).
Figure C.2.
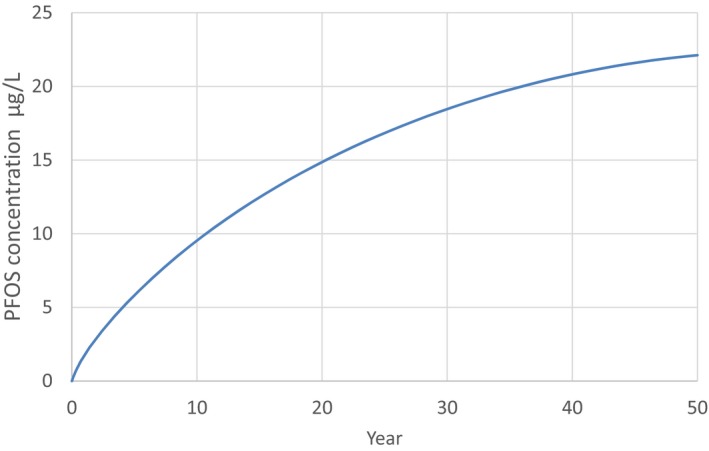
- Estimations are from the PBPK model from Loccisano et al. (2011) (coded and simulated by Berkeley Madonna version 8.3.18).
C.2. Influence of breastfeeding for 6 months
Infants who are breastfed will have an additional exposure during infancy. It will vary with length of breastfeeding and the concentration of PFOS/PFOA in breast milk. Breastfeeding will increase the plasma concentrations of PFOS/PFOA at the end of infancy and also affect the daily ingested dose that should not be exceeded after infancy in order not to reach the BMDL5 at age 5 years. In the examples below (scenarios 1 and 2), the following assumptions have been made: the ratio between cord blood and maternal blood PFOS concentration is 1/3 (ATSDR, 2015; Manzano‐Salgado et al., 2015) and the ratio between breast milk and maternal blood PFOS concentration is 1.5/100 (Kärrman et al., 2007; Haug et al., 2011b; Kim et al., 2011a; Liu et al., 2011). See Subsections C.3.4.3 and C.3.4.4 in this appendix for the modelling codes used.
C.2.1. Breastfeeding Scenario 1
In scenario 1 (Figure C.3), modelling was performed assuming a maternal concentration of 7.7 ng/mL (median of medians for adults from opinion – see Table 8, Section 3.3.2.3 of the opinion). The starting serum concentration of PFOS in the newborn was assumed to be 2.6 ng/mL. The PFOS concentration in breast milk was assumed 0.12 ng/mL. The constant exposure after breastfeeding is 1.8 ng/kg per day.
Figure C.3.
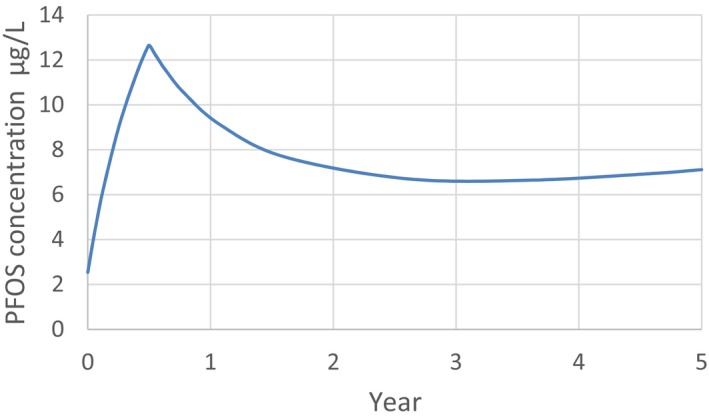
Simulation of PFOS plasma concentration resulting from chronic daily exposure to 1.8 ng/kg bw per day of PFOS from food after 6 months exclusive breastfeeding with milk (800 mL/day) containing 0.12 ng/mL of PFOS and a serum PFOS at birth of 2.6 ng/mL (corresponding to a mother's plasma PFOS concentration of 7.7 ng/mL, median of medians for adults from opinion), estimated from the PBPK model in Loccisano et al. (2011) with some modifications (coded and simulated by Berkeley Madonna version 8.3.18)
The resulting serum concentration in the child at 5 years of age is about 7 ng/mL.
C.2.2. Breastfeeding Scenario 2
In scenario 2 (Figure C.4), modelling was performed assuming a maternal concentration of 22 ng/mL (BMDL5 in Eriksen et al. (2013); see Table 27 of the opinion). The starting serum concentration of PFOS in the newborn was assumed to be 7.3 ng/mL and the PFOS concentration in breast milk was assumed to be 0.33 ng/mL. The constant exposure after breastfeeding is 1.8 ng/kg per day. The resulting serum concentration in the child at 5 years of age is about 9.6 ng/mL.
Figure C.4.
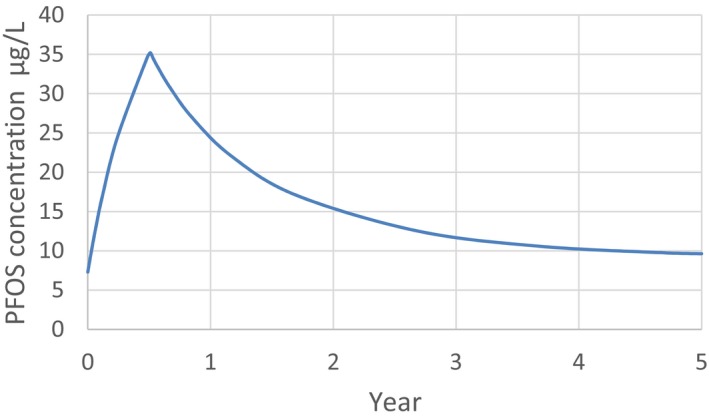
Simulation of PFOS plasma concentration resulting from chronic daily exposure to 1.8 ng/kg bw per day of PFOS from food after 6 months exclusive breastfeeding with milk (800 mL/day) containing 0.33 ng/mL of PFOS and a serum PFOS at birth of 7.3 ng/mL (corresponding to a mother's plasma PFOS concentration of 22 ng/mL, BMDL 5 in), estimated from the PBPK model in Loccisano et al. (2011) with some modifications (coded and simulated by Berkeley Madonna version 8.3.18)
C.3. PBPK Model
C.3.1. Model description
The model from Loccisano et al. (2011) is shown in Figure C.6.
Figure C.6.
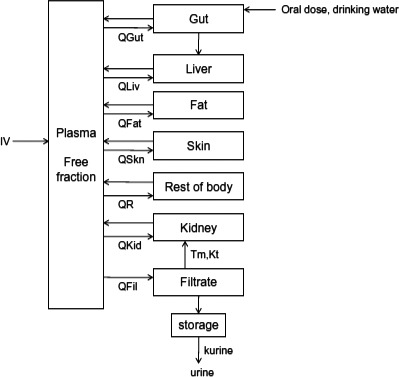
- PBPK: physiologically based pharmacokinetic (model); Kt: affinity constant; PFOA: perfluorooctanoic acid; PFOS: perfluorooctane sulfonic acid; Qs: blood flows into and out of tissues – where Qfil is not a blood flow, but is a clearance (L/h) from the plasma to the filtrate compartment; Tm: Transporter maximum.
The original Loccisano model was slightly modified by integrating a growth equation based on a French survey.27 This study (EAT for French total Diet Study) includes 4,078 subjects with age between 3 and 60 years, and 703 subjects of less than 3 years). The reported data (weight, age) from this study allow building an equation describing the increase in weight according to age (see Figure C.5).
Figure C.5.
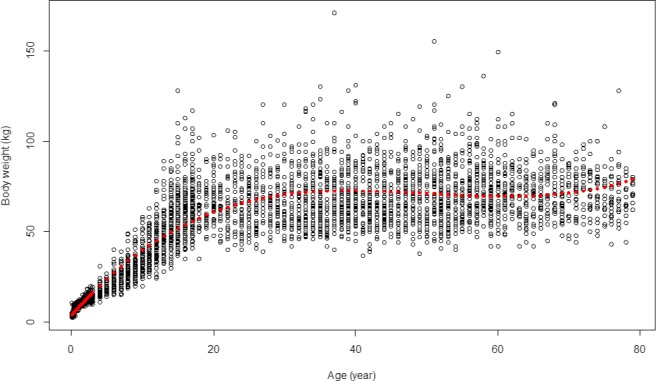
Growth equation based on a French survey, describing the increase in weight according to age, including 4,078 subjects, aged between 3 and 60 years, and 703 subjects of less than 3 years
Briefly, PFOA and/or PFOS are taken up into the plasma (i.v.) or into the gut (oral). From the gut, PFOA and/or PFOS are transported to the liver by the portal blood. Only the free fractions of PFOA and/or PFOS in plasma are assumed to be available for partitioning into tissues. PFOA and/or PFOS is eliminated through the filtrate compartment to storage into urine, while in the filtrate compartment, PFOA and/or PFOS can be reabsorbed back into the plasma through a saturable process with a transporter maximum constant (Tmc) and affinity constant (Kt). The Qs indicate blood flows into and out of tissues. Qfil is not a blood flow – it is a clearance (L/h) from the plasma to the filtrate compartment.
The PBPK model was based on a series of differential equations. The expression to estimate the levels of PFOA and PFOS in non‐elimination tissues is:
where Ci is the cellular concentration in each tissue (pg/mL), Qi is the blood flow (mL/h), free means the free amount of PFASs in plasma (unitless), Ca is the arterial concentration (pg/mL), Ki:p is the partition coefficient (unitless) and Vi is the tissue volume (mL).
The cellular concentrations of PFOA and PFOS in gut were obtained by applying this equation:
where Cg is the cellular concentration in gut (pg/mL), Qg is the blood flow to gut (mL/h), free means the free amount of PFASs in plasma (unitless), Ca is the arterial concentration (pg/mL), Kg:p is the gut partition coefficient (unitless), Intake is theoretical daily intake (pg/h) and Vg is the gut volume (mL).
For the kidney compartment, the following equation was used:
where Ck is the cellular concentration in kidney (pg/mL), Qk is the blood flow to kidney (mL/h), free is the free amount of PFASs in plasma (unitless), Ca is the arterial concentration (pg/mL), Kk:p is the gut partition coefficient (unitless), Tm is the resorption maximum (pg/h), Cfil is the cellular concentration in filtrate (pg/mL), Kt is the affinity constant (ng/mL) and Vk is the kidney volume (mL).
Finally, PFAS concentrations in the filtrate compartment were simulated by applying this equation:
where Cfil is the cellular concentration in filtrate (pg/mL), Qfil is the blood flow to filtrate (mL/h), free is the free amount of PFASs in plasma (unitless), Ca is the arterial concentration (pg/mL), Tm is the resorption maximum (pg/h), Kt is the affinity constant (ng/mL) and Vfil is the filtrate volume (mL).
C.3.2. Model validation
The model was applied in a case study of human individuals living in Little Hocking (Ohio, USA) and Arnsberg (Germany), and exposed to relatively high concentrations of PFOS and PFOA through consumption of drinking water. The result was a PBPK model reasonably capable to estimate the concentration of PFOS and PFOA in the human body.
Coding and simulations for both the PFOA and PFOS models was performed in the Berkeley–Madonna program (Macey et al., 2000).
C.3.3. Parameters used with the software Berkeley‐Madonna version 8.3.18
The parameters applied in this opinion are shown below in Table C.1.
Table C.1.
Parameters for PFOS and PFOA
| Parameters | Values used in the current opinion | Values used in the original Loccisano et al. (2011) |
|---|---|---|
| Integration method | Rosenbrock (Stiff) | Rosenbrock (Stiff) |
| DT min | 1e‐6 | Not described in original publication |
| DT max | 10 | Not described in original publication |
| DT | 0.01 | Not described in original publication |
| Tolerance | 0.01 | Not described in original publication |
DT: default tolerance; PFOA: perfluorooctanoic acid; PFOS: perfluorooctane sulfonic acid.
C.3.4. Model codes applied in the PBPK model used in this Opinion
Modifications and additional information to the code were provided by a co‐author of Loccisano et al. (2011) paper (Campbell, 2018). The codes for PFOA and PFOS therefore differ from the original code described by the authors in supplemental material (Loccisano et al., 2011).
The following changes have been done:
For PFOS, tissue/blood partition coefficient (e.g. liver/blood partition coefficient) has been replaced by tissue/plasma coefficient (e.g. liver/plasma partition coefficient).
There are errors in the values of Tmc and Kt in the supplementary material of the original article. As described in Table 1 of Loccisano et al. (2011) and consistent with Andersen et al. (2006), the units are in mg, so when expressed in µg, to be consistent with other parameters in the codes, they should be:
For PFOA, Tmc = 6,000 and Kt = 55
For PFOS, Tmc = 3,500 and Kt = 23
Loccisano et al. (2011) considered two half‐lives (2.3 years from Bartell et al. (2010) and 3.8 years from Olsen et al., 2007 when running the model simulations, and both appeared to be probable. The half‐life for PFOA of 2.3 years, determined by Bartell et al. (2010) seems to be more reliable as it is based on a large sample size (100 men and 100 women) and exposure results from ingestion of contaminated drinking water. Moreover, this value was supported by a recent paper from Li et al. (2018), where the observed half‐life for PFOA was 2.7 years. The CONTAM Panel decided to use the half‐life of 2.3 years for PFOA.
In addition, the value of QLC (cardiac output to liver), of 0.25 was corrected for the cardiac output to the gut (0.181), resulting in a value of 0.069.
A Tinput of 24 h was applied, instead of the 0.6 h, assuming that exposure was spread over a longer period.
The original Loccisano model was slightly modified by integrating a growth equation based on a French survey. This study (EAT for French total Diet Study) includes 4,078 subjects with age between 3 years and 60, and 703 subjects less than 3 years). The reported data (weight, age) from this study allow building an equation describing the increase in weight according to age.
C.3.4.1. Model codes for PFOS
Based on model codes from Loccisano et al. (2011), with slight modifications by the EFSA CONTAM Panel. Explanation of the modifications from the original model are given in notes in the respective model codes.
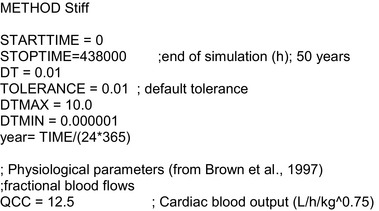
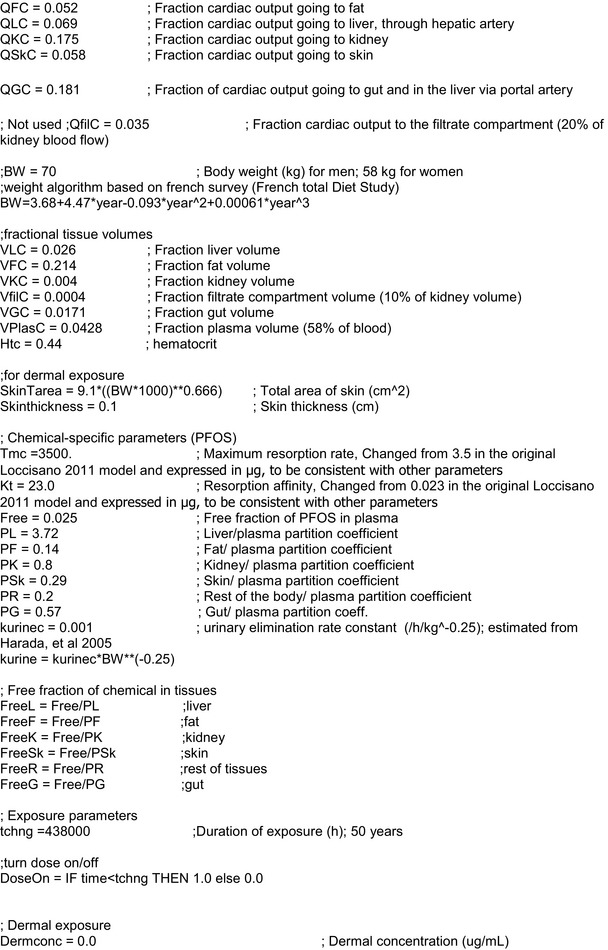
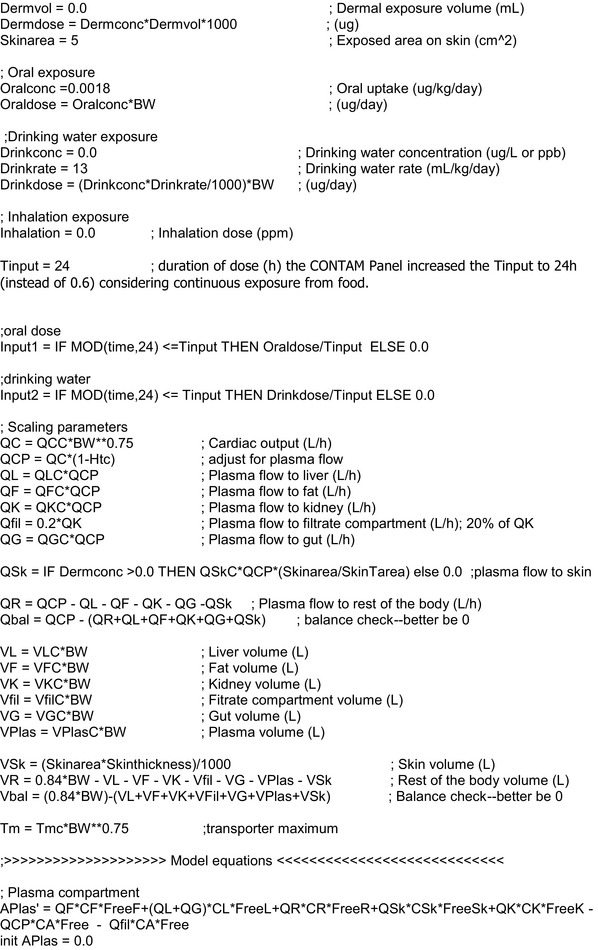
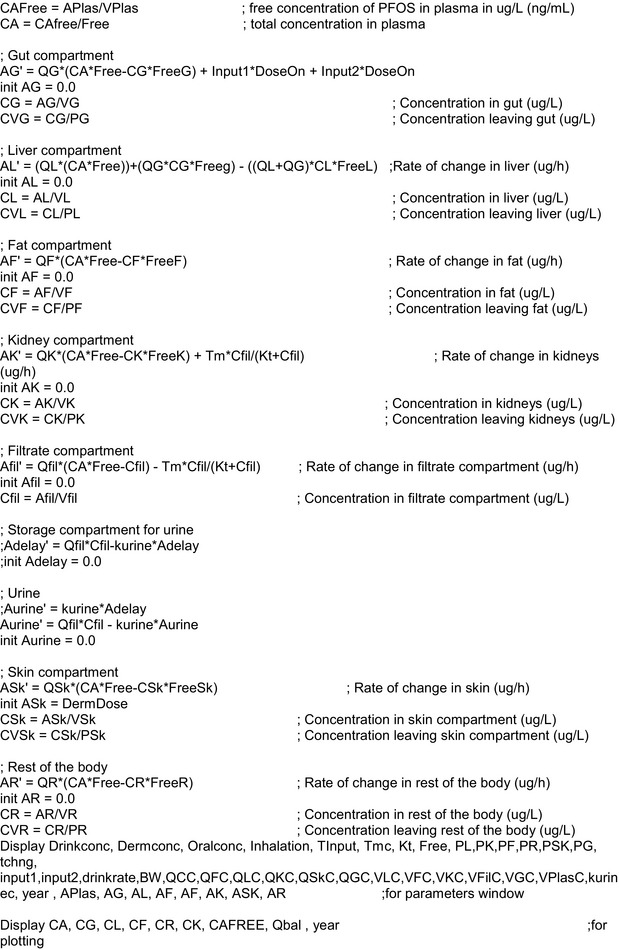
C.3.4.2. Model codes for PFOA
Based on model codes in Loccisano et al. (2011), with slight modifications by the EFSA CONTAM Panel. Explanation of the modifications from the original model are given in notes in the respective model codes.
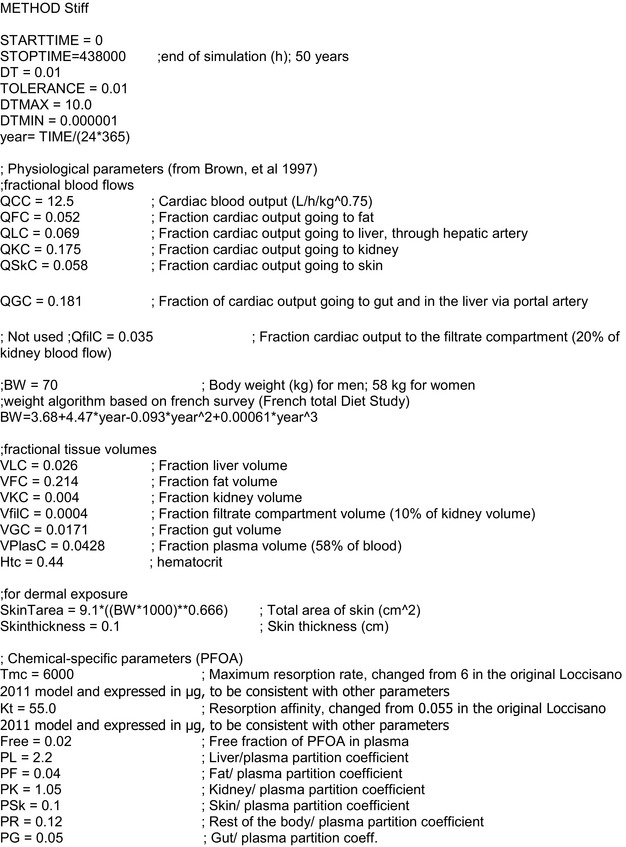
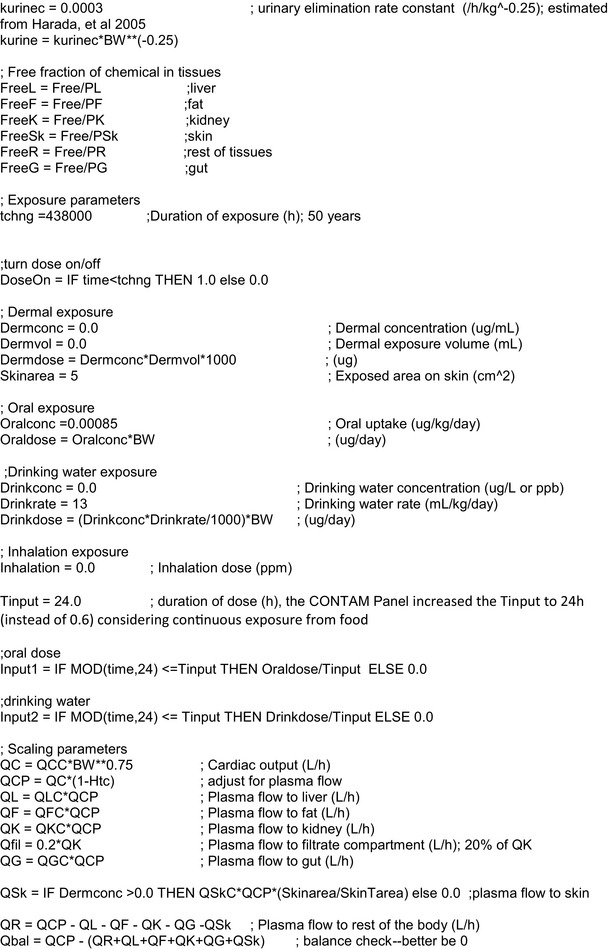
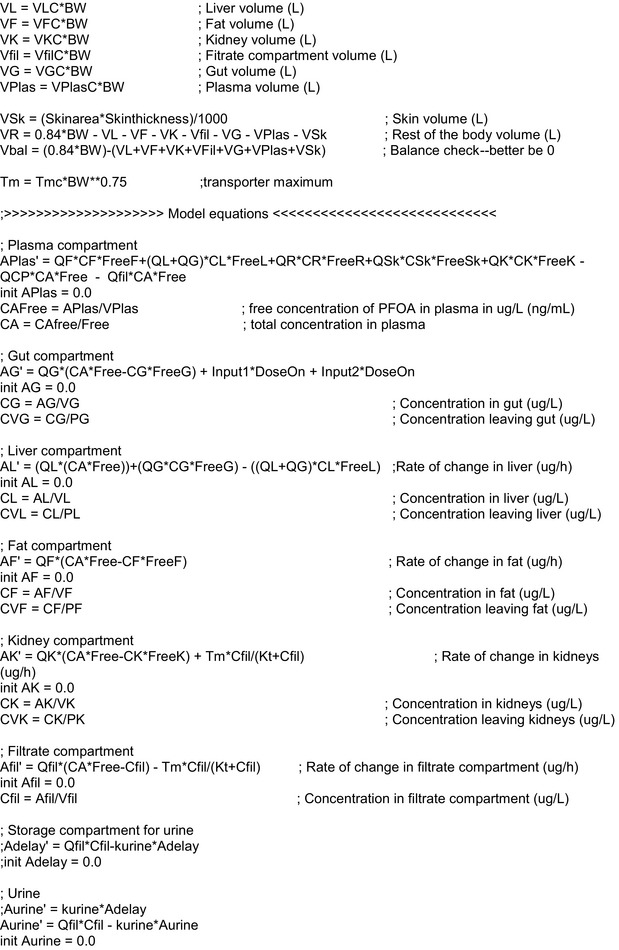
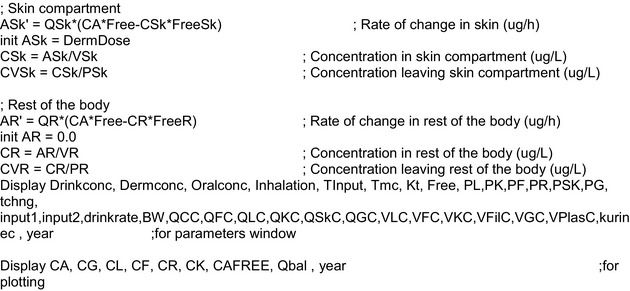
C.3.4.3. Model codes used for Breastfeeding scenario 1
Full model code:
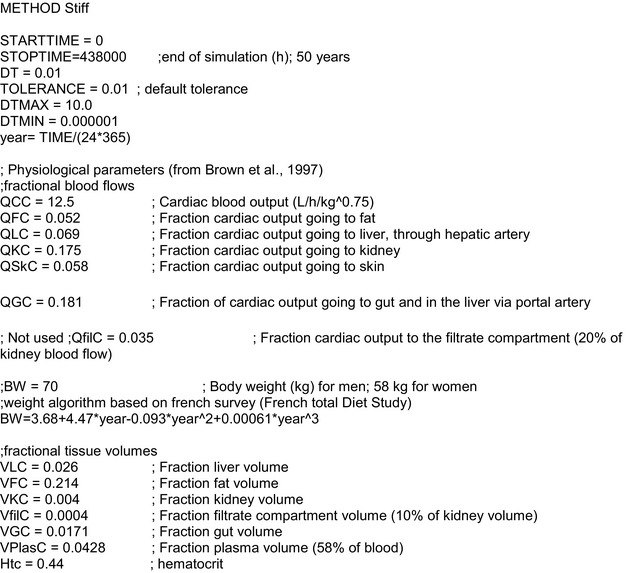
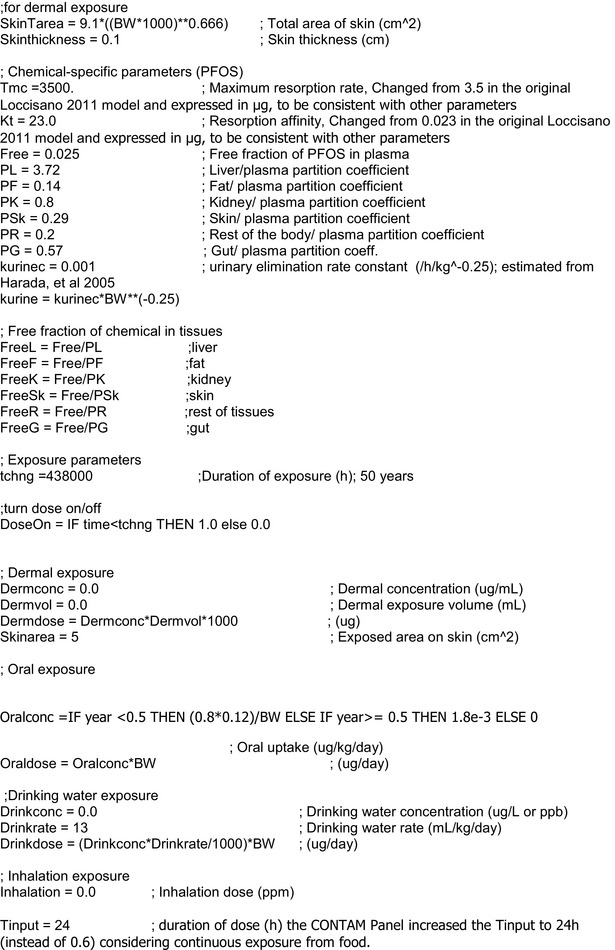
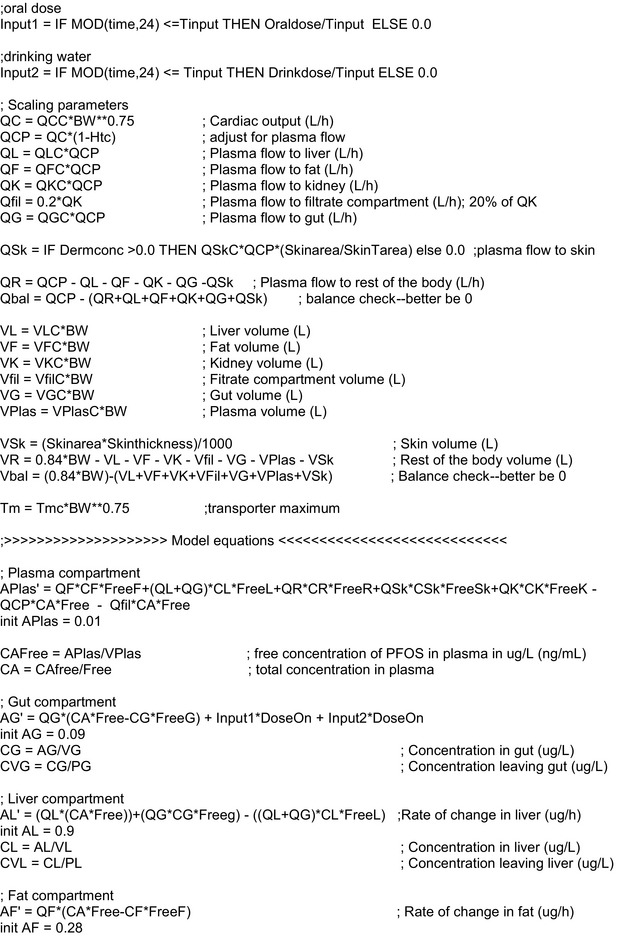
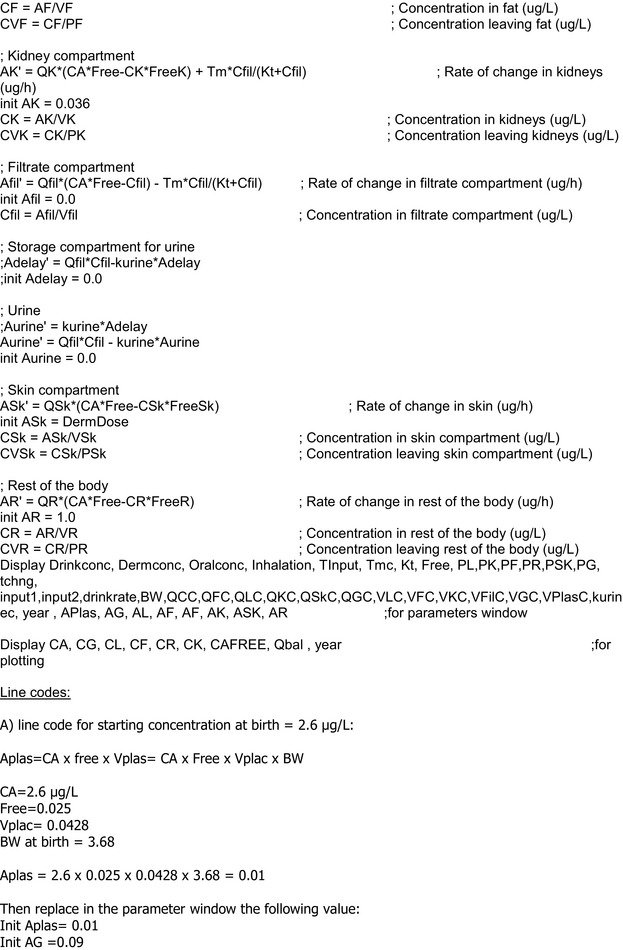
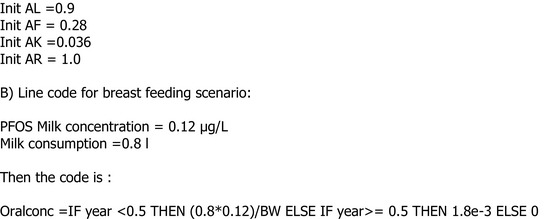
C.3.4.4. Model codes used for Breastfeeding scenario 2
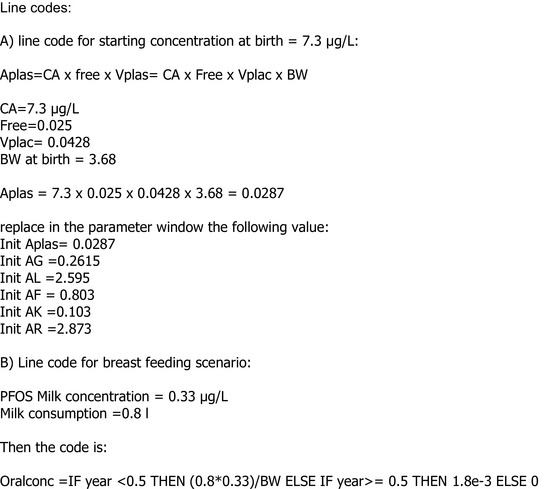
C.4. Comparison with one‐compartment steady‐state pharmacokinetic model
A simple one‐compartment, first‐order PK model estimates the change in concentration in one compartment over time given a specified exposure regime. It takes what comes in, or dose; subtracts what goes out via an elimination rate constant, k; and calculates the change in concentration of a chemical over time. This is shown conceptually by the Figure C.7.
Figure C.7.
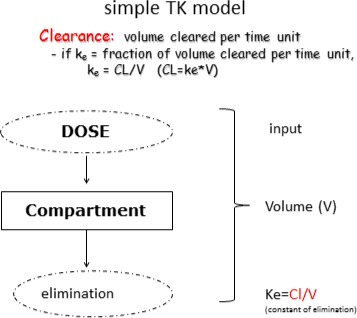
Simple one‐compartment model
This single‐compartment, first‐order PK model which predicts PFOA concentrations in blood serum as a function of dose, elimination rate, and volume of distribution, is used:
where CP is the serum concentration (ng/mL) of PFOA or PFOS, DP is the daily absorbed dose (ng/kg bw per day), Vd is the volume of distribution (mL/kg bw) and kP is the first‐order elimination rate (day_1). Vd and kP are assumed to be constant in this model construct. Assuming steady‐state conditions exist, one can solve for blood serum concentration as follows:
Using a one‐compartment steady‐state PK model, serum or plasma concentrations can be converted to external doses (intakes). The obtained external doses reflect the total intakes from all exposure pathways. These intakes can be compared to current intakes from food. This kind of conversion has previously been applied successfully for PFOS and PFOA (Fromme et al., 2007; Vestergren and Cousins, 2009; Egeghy and Lorber, 2011; Haug et al., 2011b). The PK model predicts the serum concentration as a function of dose (intake), elimination rate and volume of distribution (i.e. the total amount of a PFOS or PFOA in the body divided by its concentration in the serum/plasma). The model is based on an assumption of steady‐state conditions.
Parameters are listed below:
To compare the current intakes from food with the concentrations in blood, a one‐compartment steady‐state PK model was used. The assumptions on half‐life and distribution volume are presented in Table C.2.
Table C.2.
Elimination rates and half‐lives used
| Compound | Half‐life (years) | Reference/comment | Distribution volume | Reference |
|---|---|---|---|---|
| PFOA | 2.3 | Bartell et al. (2010) | 300 mL/kg | Harada et al. (2005) |
| PFOS | 5.4 | Olsen et al. (2007) | 300 mL/kg | Harada et al. (2005) |
PFOA: perfluorooctanoic acid; PFOS: perfluorooctane sulfonic acid.
Using both the PBPK model and the one‐compartment steady‐state PK model, intakes were calculated based on the median of the median serum/plasma concentrations for the European adult population taken from Table 8 of Section 3.3.2.3. The calculated intakes as well as the median serum/plasma concentrations used for the calculations are presented in Table C.3.
Table C.3.
Comparison of calculated intake resulting in similar plasma concentration of PFOS/PFOA using a one‐compartment steady‐state PK model vs a PBPK model, in ng/kg bw per day
| Compound | Calculated intakes (continuous exposure) based on serum/plasma concentrations, in ng/kg bw per day using a PBPK modela | Calculated intakes (continuous exposure) based on serum/plasma concentrations, in ng/kg bw per day using a one‐compartment steady‐state PK model | Median serum/plasma concentration in ng/mL for the European adult population taken from Table 8 (Section 3.3.2.3) |
|---|---|---|---|
| PFOA | 0.17 | 0.5 | 1.9 |
| PFOS | 0.6 | 0.8 | 7.7 |
bw: body weight; PFOA: perfluorooctanoic acid; PFOS: perfluorooctane sulfonic acid; PBPK: physiologically based pharmacokinetic (model); PK: pharmacokinetic (model).
the PBPK model takes into account the body weight change with age.
Table C.4 presents a comparison of prediction according to the Loccisano PFOA PBPK model, PFOA Worley PBPK model and the PFOA one‐compartment steady‐state PK model.
Table C.4.
Comparison between the PBPK models of Loccisano and Worley, and the one‐compartment steady‐state PK model, for simulation of chronic daily exposure of PFOA leading to the plasma concentration of 9.4 ng/mL, which is the BMDL5 for an increase of total cholesterol from Steenland et al. (2009)
| Target plasma concentration of PFOA from BMD analysis | Intake rate in ng/kg‐day estimated from | ||
|---|---|---|---|
| Loccisano PBPK model | Worley PBPK model | One‐compartment steady‐state PK model | |
| BMDL = 9.4 ng/mL (total cholesterol) | 0.85 | 1.2 | 2.3 |
BMD: benchmark dose; PFOA: perfluorooctanoic acid; PBPK: physiologically based pharmacokinetic (model); PK: pharmacokinetic (model). Same half‐life of 2.3 years was used for all models.
Table C.5 presents a comparison of prediction according to the Loccisano PFOS PBPK model, and the PFOS one‐compartment steady‐state PK model.
Table C.5.
Comparison between the PBPK model of Loccisano and the one‐compartment steady‐state PK model, for simulation of chronic daily exposure of PFOS leading to the plasma concentration of 22 ng/mL, which is the BMDL5 for an increase of total cholesterol from Eriksen et al. (2013)
| Target plasma concentration of PFOS from BMD analysis | Intake rate in ng/kg per day estimated from | |
|---|---|---|
| Loccisano PBPK model | One‐compartment steady‐state PK model | |
| BMDL = 22 ng/mL | 1.8 | 2.3 |
BMD: benchmark dose; BMDL: benchmark dose limit; PFOS: perfluorooctane sulfonic acid; PBPK: physiologically based pharmacokinetic (model); PK: pharmacokinetic (model). Same half‐life of 5.4 years was used for both models.
C.5. Sensitivity analysis
Sensitivity analysis (SA) provides a quantitative assessment of the degree of influence of input parameters on the model results.
According WHO guidance (WHO/IPCS, 2010), sensitivity analysis results can be summarised as:
high (absolute value greater than or equal to 0.5)
medium (absolute value greater than or equal to 0.2 but less than 0.5)
low (absolute value greater than or equal to 0.1 but less than 0.
The highest values of sensitivity analysis results (p > 0.1) were obtained for the following parameters: Cardiac output, elimination parameters (glomerular filtration rate and resorption maximum parameters), the free fraction and the haematocrit.
For PFOA and PFOS, the parameter with the highest contribution to the SA was free fraction, and Kt followed by oral intake, Tm, Q. kidney. In general terms, the cardiac output and volumes of tissues showed the smallest contribution, with the only exception of Q. kidney. The reason of the high sensitivity of Q. kidney might be due to the fact that kidney is the elimination tissue, and it has been reported that Q. kidney is a physiological parameter with a low uncertainty.
Appendix D – Literature search
1.
Appendix E – EFSA guidance documents applied for the risk assessment
1.
The following EFSA guidances were followed for the development of the risk assessment:
EFSA (European Food Safety Authority), 2005. Opinion of the Scientific Committee on a request from EFSA related to a harmonised approach for risk assessment of substances which are both genotoxic and carcinogenic. EFSA Journal 2005;3(10):282, 31 pp. https://doi.org/10.2903/j.efsa.2005.282
EFSA (European Food Safety Authority), 2007. Guidance of the Scientific Committee on a request from EFSA related to Uncertainties in Dietary Exposure Assessment. EFSA Journal 2007;4(12):438, 54 pp. https://doi.org/10.2903/j.efsa.2007.438
EFSA (European Food Safety Authority), 2009. Guidance of the Scientific Committee on transparency in the scientific aspects of risk assessments carried out by EFSA. Part 2: General principles. The EFSA Journal 2009;7(5):1051, 22 pp. https://doi.org/10.2903/j.efsa.2009.1051
EFSA (European Food Safety Authority), 2010. Standard sample description for food and feed. EFSA Journal 2010;8(1):1457, 54 pp. https://doi.org/10.2903/j.efsa.2010.1457
EFSA (European Food Safety Authority), 2010. Management of left‐censored data in dietary exposure assessment of chemical substances. EFSA Journal 2010;8(3):1557, 96 pp. https://doi.org/10.2903/j.efsa.2010.1557
EFSA (European Food Safety Authority), 2011. Use of the EFSA Comprehensive European Food Consumption Database in Intakes Assessment. EFSA Journal 2011;9(3):2097, 34 pp. https://doi.org/10.2903/j.efsa.2011.2097
EFSA Scientific Committee, 2011. Scientific Opinion on genotoxicity testing strategies applicable to food and feed safety assessment. EFSA Journal 2011;9(9):2379, 69 pp. https://doi.org/10.2903/j.efsa.2011.2379
EFSA Scientific Committee, 2012. Guidance on selected default values to be used by the EFSA Scientific Committee, Scientific Panels and Units in the absence of actual measured data. EFSA Journal 2012;10(3):2579, 32 pp. https://doi.org/10.2903/j.efsa.2012.2579
EFSA Scientific Committee, 2012. Scientific Opinion on Risk Assessment Terminology. EFSA Journal 2012;10(5):2664, 43 pp. https://doi.org/10.2903/j.efsa.2012.2664
EFSA Scientific Committee, Hardy A, Benford D, Halldorsson T, Jeger MJ, Knutsen HK, More S, Naegeli H, Noteborn H, Ockleford C, Ricci A, Rychen G, Schlatter JR, Silano V, Solecki R, Turck D, Younes M, Bresson J‐L, Griffin J, Hougaard Benekou S, van Loveren H, Luttik R, Messean A, Penninks A, Ru G, Stegeman JA, van der Werf W, Westendorf J, Woutersen RA, Barizzone F, Bottex B, Lanzoni A, Georgiadis N and Alexander J, 2017. Guidance on the assessment of the biological relevance of data in scientific assessments. EFSA Journal 2017;15(8):4970, 73 pp. https://doi.org/10.2903/j.efsa.2017.4970
Supporting information
Occurrence in food, human consumption data and human dietary exposure
Suggested citation: EFSA CONTAM Panel (EFSA Panel on Contaminants in the Food Chain) , Knutsen HK, Alexander J, Barregård L, Bignami M, Brüschweiler B, Ceccatelli S, Cottrill B, Dinovi M, Edler L, Grasl‐Kraupp B, Hogstrand C, Hoogenboom LR, Nebbia CS, Oswald IP, Petersen A, Rose M, Roudot A‐C, Vleminckx C, Vollmer G, Wallace H, Bodin L, Cravedi J‐P, Halldorsson TI, Haug LS, Johansson N, van Loveren H, Gergelova P, Mackay K, Levorato S, van Manen M and Schwerdtle T, 2018. Scientific Opinion on the risk to human health related to the presence of perfluorooctane sulfonic acid and perfluorooctanoic acid in food. EFSA Journal 2018;16(12):5194, 284 pp. 10.2903/j.efsa.2018.5194
Requestor: European Commission
Question number: EFSA‐Q‐2015‐00526
Explanatory note: Due to the nature of the scientific uncertainties described in this opinion and in the minutes of the expert meeting of 24 September 2018 (EFSA/CONTAM/3503) (https://www.efsa.europa.eu/sites/default/files/news/efsa-contam-3503.pdf), and the possible application of the forthcoming Scientific Committee guidance on combined exposure to multiple chemicals, the conclusions of this assessment will be reviewed in parallel with the finalisation of the EFSA scientific opinion on The risks to human health related to the presence in food of perfluoroalkylated substances other than PFOS and PFOA (EFSA‐Q‐2017‐00549). The indicative timeline for this is December 2019. Until such time, the conclusions and derived tolerable weekly intakes shall be considered provisional.
Panel members: Jan Alexander, Lars Barregård, Margherita Bignami, Beat Brϋschweiler, Sandra Ceccatelli, Bruce Cottrill, Michael Dinovi, Lutz Edler, Bettina Grasl‐Kraupp, Christer Hogstrand, Laurentius (Ron) Hoogenboom, Helle Katrine Knutsen, Carlo Stefano Nebbia, Isabelle P Oswald, Annette Petersen, Martin Rose, Alain‐Claude Roudot, Tanja Schwerdtle, Christiane Vleminckx, Günter Vollmer and Heather Wallace.
Acknowledgements: The Panel wishes to thank the hearing experts: Tony Fletcher, Philippe Adam Grandjean and Marco Zeilmaker, and EFSA staff members: Davide Arcella for the support provided to this scientific output. The Panel acknowledges all European Competent Authorities that provided occurrence data on perfluoroalkylated substances in food, and supported the data collection for the Comprehensive European Food Consumption Database. The Panel would also like to thank the following authors and co‐authors for providing additional data in relation to their respective studies: Esben Budtz‐Jørgensen, Jerry Campbell, Jessie A Gleason, Berit Granum, Mette Sørenson, Kyle Steenland and Kristina W Whitworth.
Adopted: 22 March 2018
Notes
Opinion of the Scientific Panel on Contaminants in the Food chain on Perfluoroctane sulfonate (PFOS) perfluorooctanoic acid (PFOA) and their salts. The EFSA Journal (2008) Journal number, 653, 1–131.
Commission Recommendation 2010/161/EU of 17 March 2010 on the monitoring of perfluoroalkylated substances in food. OJ L 68, 18.3.2010, p. 22–23.
European Food Safety Authority, perfluoroalkylated substances in food: occurrence and dietary exposure. EFSA Journal 2012, 10(6) 2743.
Directive 2006/122/EC of the European Parliament and of the Council of 12 December 2006 amending for the 30th time Council Directive 76/769/EEC on the approximation of the laws, regulations and administrative provisions of the Member States relating to restrictions on the marketing and use of certain dangerous substances and preparations (perfluorooctane sulfonates). OJ L 372, 27.12.2006, p. 32–34.
Commission Regulation (EC) No 552/2009 of 22 June 2009 amending Regulation (EC) No 1907/2006 of the European Parliament and of the Council on the Registration, Evaluation, Authorisation and Restriction of Chemicals (REACH) as regards Annex XVII. OJ L 164, 26.6.2009, p. 7–31.
OJ L 396, 30.12.1996, p. 1–520.
Commission Regulation (EU) No 207/2011 of 2 March 2011 amending Regulation (EC) No 1907/2006 of the European Parliament and of the Council on the Registration, Evaluation, Authorisation and Restriction of Chemicals (REACH) as regards Annex XVII (diphenylether, pentabromo derivative and PFOS). OJ L 58, 3.3.2011, p. 27–28.
Regulation (EC) No 850/2004 of the European Parliament and of the Council of 29 April 2004 on persistent organic pollutants and amending Directive 79/117/EEC. OJ L 158, 30.4.2004, p. 7–49.
Commission Regulation (EU) No 757/2010 of 24 August 2010 amending Regulation (EC) No 850/2004 of the European Parliament and of the Council on persistent organic pollutants as regards Annexes I and III. OJ L 223, 25.8.2010, p. 29–36.
Commission Regulation (EU) 2017/1000 of 13 June 2017 amending Annex XVII to Regulation (EC) No 1907/2006 of the European Parliament and of the Council concerning the Registration, Evaluation, Authorisation and Restriction of Chemicals (REACH) as regards perfluorooctanoic acid (PFOA), its salts and PFOA‐related substances. OJ L 150, 14.6.2017, p. 14–18.
Council Directive 93/42/EEC of 14 June 1993 concerning medical devices. OJ L 169, 12.7.1993, p. 1–43.
From 1 January 2014 onwards, Evidence Management Unit (DATA).
Web of Science (WoS), formerly ISI Web of Knowledge, Thomson Reuters. Available at: http://thomsonreuters.com/thomson-reuters-web-of-science/
PubMed, Entrez Global Query Cross‐Database Search System, National Center for Biotechnology Information (NCBI), National Library of Medicine (NLM), Department of the National Institutes of Health (NIH), United States Department of Health and Human Services. Available at: http://www.ncbi.nlm.nih.gov/pubmed/
EndNote X5, Thomson Reuters. Available at: http://endnote.com/
Suspect sampling is defined as a selection of an individual product or establishment in order to confirm or reject a suspicion of non‐conformity. It is not a random sampling, therefore, there is no sample extracted from the population.
Targeted samples are based on certain sampling criteria e.g. monitoring the background contamination in matrices with high accumulation potential or controlling compliance with the maximum levels laid down in the relevant legislation.
Commission Recommendation of 17 March 2010 on the monitoring of perfluoroalkylated substances in food (2010/161/EU).
Concentrations of linear PFOS and branched PFOS were summed for some samples, and thus the number of analytical results may be lower as compared to Figure 5.
PCB congeners 138, 153 and 180 were quantified in maternal serum during pregnancy or breast milk postnatally and in offspring serum at age 5 years. Serum PFOS concentrations were also quantified in maternal serum during pregnancy and offspring serum at age 5 years.
Pregnancy serum and breast milk concentrations of PCBs are highly correlated and both concentrations are strong determinants of offspring own concentrations during early infancy.
As with the Little Hocking population, it is not known how long the people of Arnsberg were exposed to PFOA.
To consider a prediction to be good, the ratio between the simulated and the observed data should be within a factor of 2.
For serum cholesterol versus serum PFOA in the C8 cohort (Steenland et al., 2009) a 5% increase in cholesterol could not be modelled when the lowest decile was used as reference value. This was because the dose‐response curve levels off at high serum PFOA concentrations. The median PFOA level in the lowest decile was higher (median 5.5 ng/mL) than in other cohorts and in the biomonitoring studies (see Section 3.3.2). However, using a ‘low’ concentration of 1 ng/mL, being half of the median of the medians of serum PFOA in Europe (1.9 ng/mL, see section 3.3.2.3, Table 8), allowed modelling.
Using Reference value of 1 ng/mL= BMD: 11 ng/mL, BMDL: 8.1 ng/mL
Arnich N, Sirot V, Rivière G, Jean J, Noël L, Guérin T and Leblanc JC, 2012. Dietary exposure to trace elements and health risk assessment in the 2nd French Total Diet Study. Food Chemistry and Toxicology, 50, 2432–2449.
References
- 3M Company , 1999. Fluorochemical use, distribution and release overview. AR226‐0550.
- 3M Company , 2001. Analysis of PFOS, FOSA and PFOA From Various Food Matrices Using HPLC Electrospray Mass Spectrometry. Analytical Report, June 21, 2001.
- 3M Company , 2003. Environmental and Health Assessment of Perfuorooctane Sulfonic Acid and its Salts. Prepared by 3M in consultation with Moore, J., DABT, Hollyhouse, Inc. Rodricks, J., DABT, and Turnbull, D. DABT, Environ Corp. Warren‐Hicks, W. and colleagues, The Cadmus Group, Inc. August 20, 2003.
- Abbott BD, Wolf CJ, Schmid JE, Das KP, Zehr RD, Helfant L, Nakayama S, Lindstrom AB, Strynar MJ and Lau C, 2007. Perfluorooctanoic acid induced developmental toxicity in the mouse is dependent on expression of peroxisome proliferator activated receptor‐alpha. Toxicological Sciences, 98, 571–581. [DOI] [PubMed] [Google Scholar]
- Abbott BD, Wood CR, Watkins AM, Tatum‐Gibbs K, Das KP and Lau C, 2012. Effects of perfluorooctanoic acid (PFOA) on expression of peroxisome proliferator‐activated receptors (PPAR) and nuclear receptor‐regulated genes in fetal and postnatal CD‐1 mouse tissues. Reproductive Toxicology, 33, 491–505. 10.1016/j.reprotox.2011.11.005 [DOI] [PubMed] [Google Scholar]
- Adler G, Beglinger C, Braun U, Reinshagen M, Koop I, Schafmayer A, Rovati L and Arnold R, 1991. Interaction of the cholinergic system and cholecystokinin in the regulation of endogenous and exogenous stimulation of pancreatic secretion in humans. Gastroenterology, 100, 537–543. [DOI] [PubMed] [Google Scholar]
- Ahrens L, Yeung LWY, Taniyasu S, Lam PKS and Yamashita N, 2011. Partitioning of perfluorooctanoate (PFOA), perfluorooctane sulfonate (PFOS) and perfluorooctane sulfonamide (PFOSA) between water and sediment. Chemosphere, 85, 731–737. [DOI] [PubMed] [Google Scholar]
- Ahrens L and Bundschuh M, 2014. Fate and effects of poly‐ and perfluoroalkyl substances in the aquatic environment: a review. Environmental Toxicology and Chemistry, 33, 1921–1929. [DOI] [PubMed] [Google Scholar]
- Albrecht PP, Torsell NE, Krishnan P, Ehresman DJ, Frame SR, Chang SC, Butenhoff JL, Kennedy GL, Gonzalez FJ and Peters JM, 2013. A species difference in the peroxisome proliferator‐activated receptor α‐dependent response to the developmental effects of perfluorooctanoic acid. Toxicological Sciences, 131, 568–582. 10.1093/toxsci/kfs318 [DOI] [PubMed] [Google Scholar]
- Alexander BH and Olsen GW, 2007. Bladder cancer in perfluorooctanesulfonyl fluoride manufacturing workers. Annals of Epidemiology, 17, 471–478. [DOI] [PubMed] [Google Scholar]
- Alves A, Kucharska A, Erratico C, Xu F, Den Hond E, Koppen G, Vanermen G, Covaci A and Voorspoels S, 2014. Human biomonitoring of emerging pollutants through non‐invasive matrices: state of the art and future potential. Analytical and Bioanalytical Chemistry, 406, 4063–4088. 10.1007/s00216-014-7748-1 [DOI] [PubMed] [Google Scholar]
- Alves A, Jacobs G, Vanermen G, Covaci A and Voorspoels S, 2015. New approach for assessing human perfluoroalkyl exposure via hair. Talanta, 144, 574–583. 10.1016/j.talanta.2015.07.009 [DOI] [PubMed] [Google Scholar]
- Andersen ME, Clewell HJ, Tan YM, Butenhoff JL and Olsen GW, 2006. Pharmacokinetic modeling of saturable, renal resorption of perfluoroalkylacids in monkeys – probing the determinants of long plasma half‐lives. Toxicology, 227, 156–164. 10.1016/j.tox.2006.08.004 [DOI] [PubMed] [Google Scholar]
- Anderson‐Mahoney P, Kotlerman J, Takhar H, Gray D and Dahlgren J, 2008. Self‐reported health effects among community residents exposed to perfluorooctanoate. New Solutions, 18, 129–143. [DOI] [PubMed] [Google Scholar]
- Andersen CS, Fei C, Gamborg M, Nohr EA, Sørensen TI and Olsen J, 2010. Prenatal exposures to perfluorinated chemicals and anthropometric measures in infancy. American Journal of Epidemiology, 172, 1230–1237. 10.1093/aje/kwq289 [DOI] [PubMed] [Google Scholar]
- Andersen CS, Fei C, Gamborg M, Nohr EA, Sørensen TI and Olsen J, 2013. Prenatal exposures to perfluorinated chemicals and anthropometry at 7 years of age. American Journal of Epidemiology, 178, 921–927. 10.1093/aje/kwt057 [DOI] [PubMed] [Google Scholar]
- Apel P, Angerer J, Wilhelm M and Kolossa‐Gehring M, 2017. New HBM values for emerging substances, inventory of reference and HBM values in force, and working principles of the German Human Biomonitoring Commission. International Journal of Hygiene and Environmental Health, 220(Part A), 152–166. [DOI] [PubMed] [Google Scholar]
- Apelberg BJ, Witter FR, Herbstman JB, Calafat AM, Halden RU, Needham LL and Goldman LR, 2007a. Cord serum concentrations of perfluorooctane sulfonate (PFOS) and perfluorooctanoate (PFOA) in relation to weight and size at birth. Environmental Health Perspectives, 115, 1670–1676. 10.1289/ehp.10334 [DOI] [PMC free article] [PubMed] [Google Scholar]
- Apelberg BJ, Goldman LR, Calafat AM, Herbstman JB, Kuklenyik Z, Heidler J, Needham LL, Halden RU and Witter FR, 2007b. Determinants of fetal exposure to polyfluoroalkyl compounds in Baltimore, Maryland. Environmental Science and Technology, 41, 3891–3897. 10.1021/es0700911 [DOI] [PubMed] [Google Scholar]
- Armitage J, Cousins IT, Buck RC, Prevedouros K, Russell MH, MacLeod M and Korzeniowski SH, 2006. Modeling global‐scale fate and transport of perfluorooctanoate emitted from direct sources. Environmental Science and Technology, 40, 6969–6975. [DOI] [PubMed] [Google Scholar]
- Arvaniti OS and Stasinakis AS, 2015. Review on the occurrence, fate and removal of perfluorinated compounds during wastewater treatment. Science of the Total Environment, 524‐525, 81–92. 10.1016/j.scitotenv.2015.04.023 [DOI] [PubMed] [Google Scholar]
- Ashley‐Martin J, Dodds L, Levy AR, Platt RW, Marshall JS and Arbuckle TE, 2015. Prenatal exposure to phthalates, bisphenol A and perfluoroalkyl substances and cord blood levels of IgE, TSLP and IL‐33. Environmental Research, 140, 360–368. 10.1016/j.envres.2015.04.010 [DOI] [PubMed] [Google Scholar]
- ATSDR (Agency for Toxic Substances and Disease Registry), 2013. Health consultation. Exposure investigation report. Perfluorochemical serum sampling in the vicinity of Decatur, Alabama, Morgan, Lawrence, and Limestone counties. U.S. Department of Health and Human Services, Atlanta: Available online: http://www.atsdr.cdc.gov/HAC/pha/Decatur/Perfluorochemical_Serum%20Sampling.pdf [Google Scholar]
- ATSDR (Agency for Toxic Substances and Disease Registry), 2015. Draft Toxicological Profile for Perfluoroalkyls. Available online: https://www.atsdr.cdc.gov/toxprofiles/tp200.pdf [PubMed]
- Audet‐Delage Y, Ouellet N, Dallaire R, Dewailly E and Ayotte P, 2013. Persistent organic pollutants and transthyretin‐bound thyroxin in plasma of Inuit women of childbearing age. Environmental Science and Technology, 47, 13086–13092. 10.1021/es4027634 [DOI] [PubMed] [Google Scholar]
- Avanasi R, Shin HM, Vieira VM and Bartell SM, 2016. Variability and epistemic uncertainty in water ingestion rates and pharmacokinetic parameters, and impact on the association between perfluorooctanoate and preeclampsia in the C8 Health Project population. Environmental Research, 146, 299–307. 10.1016/j.envres.2016.01.011 [DOI] [PMC free article] [PubMed] [Google Scholar]
- Axmon A, Axelsson J, Jakobsson K, Lindh CH and Jönsson BAG, 2014. Time trends between 1987 and 2007 for perfluoroalkyl acids in plasma from Swedish women. Chemosphere, 102, 61–67. 10.1016/j.chemosphere.2013.12.021 [DOI] [PubMed] [Google Scholar]
- Bach CC, Bech BH, Nohr EA, Olsen J, Matthiesen NB, Bossi R, Uldbjerg N, Bonefeld‐Jørgensen EC and Henriksen TB, 2015a. Serum perfluoroalkyl acids and time to pregnancy in nulliparous women. Environmental Research, 142, 535–541. 10.1016/j.envres.2015.08.007 [DOI] [PubMed] [Google Scholar]
- Bach CC, Bech BH, Brix N, Nohr EA, Bonde JP and Henriksen TB, 2015b. Perfluoroalkyl and polyfluoroalkyl substances and human fetal growth: a systematic review. Critical Reviews in Toxicology, 45, 53–67. 10.3109/10408444.2014.952400 [DOI] [PubMed] [Google Scholar]
- Bach CC, Bech BH, Nohr EA, Olsen J, Matthiesen NB, Bonefeld‐Jørgensen EC, Bossi R and Henriksen TB, 2016. Perfluoroalkyl acids in maternal serum and indices of fetal growth: the Aarhus birth cohort. Environmental Health Perspectives, 124, 848–854. 10.1289/ehp.1510046 [DOI] [PMC free article] [PubMed] [Google Scholar]
- Bae J, Kim S, Schisterman EF, Boyd Barr D and Buck Louis GM, 2015. Maternal and paternal serum concentrations of perfluoroalkyl and polyfluoroalkyl substances and the secondary sex ratio. Chemosphere, 133, 31–40. 10.1016/j.chemosphere.2015.03.015 [DOI] [PMC free article] [PubMed] [Google Scholar]
- Ballesteros‐Gómez A, Rubio S and van Leeuwen S, 2010. Tetrahydrofuran–water extraction, in‐line clean‐up and selective liquid chromatography/tandem mass spectrometry for the quantitation of perfluorinated compounds in food at the low picogram per gram level. Journal of Chromatography A, 1217, 5913–5921. 10.1016/j.chroma.2010.07.032 [DOI] [PubMed] [Google Scholar]
- Bao J, Karrman A, Bavel B and Jin Y, 2014. Perfluoroalkyl substances in the blood samples from a male population of Sweden. Chinese Science Bulletin, 59, 388–395. 10.1007/s11434-013-0008-5 [DOI] [Google Scholar]
- Barry V, Winquist A and Steenland K, 2013. Perfluorooctanoic acid (PFOA) exposures and incident cancers among adults living near a chemical plant. Environmental Health Perspectives, 121, 1313–1318. 10.1289/ehp.1306615 [DOI] [PMC free article] [PubMed] [Google Scholar]
- Barry V, Darrow LA, Klein M, Winquist A and Steenland K, 2014. Early life perfluorooctanoic acid (PFOA) exposure and overweight and obesity risk in adulthood in a community with elevated exposure. Environmental Research, 132, 62–69. 10.1016/j.envres.2014.03.025 [DOI] [PubMed] [Google Scholar]
- Bartell SM, Calafat AM, Lyu C, Kato K, Ryan PB and Steenland K, 2010. Rate of decline in serum PFOA concentrations after granular activated carbon filtration at two public water systems in Ohio and West Virginia. Environmental Health Perspectives, 118, 222–228. 10.1289/ehp.0901252 [DOI] [PMC free article] [PubMed] [Google Scholar]
- Beesoon S, Webster GM, Shoeib M, Harner T, Benskin JP and Martin JW, 2011. Isomer profiles of perfluorochemicals in matched maternal, cord, and house dust samples: manufacturing sources and transplacental transfer. Environmental Health Perspectives, 119, 1659–1664. 10.1289/ehp.1003265 [DOI] [PMC free article] [PubMed] [Google Scholar]
- Beesoon S and Martin JW, 2015. Isomer‐specific binding affinity of perfluorooctanesulfonate (PFOS) and perfluorooctanoate (PFOA) to serum proteins. Environmental Science and Technology, 49, 5722–5731. 10.1021/es505399w [DOI] [PubMed] [Google Scholar]
- Begley TH, White K, Honigfort P, Twaroski ML, Neches R and Walker RA, 2005. Perfluorochemicals: potential sources of and migration from food packaging. Food Additives and Contaminants, 22, 1023–1031. 10.1080/02652030500183474 [DOI] [PubMed] [Google Scholar]
- Bengoechea‐Alonso MT and Ericsson J, 2007. SREBP in signal transduction: cholesterol metabolism and beyond. Current Opinion in Cell Biology, 19, 215–222. [DOI] [PubMed] [Google Scholar]
- Benninghoff AD, Orner GA, Buchner CH, Hendricks JD, Duffy AM and Williams DE, 2012. Promotion of hepatocarcinogenesis by perfluoroalkyl acids in rainbow trout. Toxicological Sciences, 125, 69–78. 10.1093/toxsci/kfr267 [DOI] [PMC free article] [PubMed] [Google Scholar]
- Benskin JP, De Silva AO, Martin LJ, Arsenault G, McCrindle R, Riddell N, Mabury SA and Martin JW, 2009. Disposition of perfluorinated acid isomers in Sprague‐Dawley rats; part 1: single dose. Environmental Toxicology and Chemistry, 28, 542–554. 10.1897/08-239.1 [DOI] [PubMed] [Google Scholar]
- Benskin JP, De Silva AO and Martin JW, 2010. Isomer profiling of perfluorinated substances as a tool for source tracking: a review of early findings and future applications. Reviews of Environmental Contamination and Toxicology, 208, 111–160. 10.1007/978-1-4419-6880-7_2 [DOI] [PubMed] [Google Scholar]
- Benskin JP, Phillips V, St Louis VL and Martin JW, 2011. Source Elucidation of Perfluorinated Carboxylic Acids in Remote Alpine Lake Sediment Cores. Environmental Science and Technology, 45, 7188–7194. [DOI] [PubMed] [Google Scholar]
- Berg V, Nøst TH, Huber S, Rylander C, Hansen S, Veyhe AS, Fuskevåg OM, Odland JØ and Sandanger TM, 2014. Maternal serum concentrations of per‐ and polyfluoroalkyl substances and their predictors in years with reduced production and use. Environment International, 69, 58–66. 10.1016/j.envint.2014.04.010 [DOI] [PubMed] [Google Scholar]
- Berg V, Nøst TH, Hansen S, Elverland A, Veyhe A‐S, Jorde R, Odland JØ and Sandanger TM, 2015. Assessing the relationship between perfluoroalkyl substances, thyroid hormones and binding proteins in pregnant women; a longitudinal mixed effects approach. Environment International, 77, 63–69. 10.1016/j.envint.2015.01.007 [DOI] [PubMed] [Google Scholar]
- Berger U, Glynn A, Holmström KE, Berglund M, Ankarberg EH and Törnkvist A, 2009. Fish consumption as a source of human exposure to perfluorinated alkyl substances in Sweden ‐ analysis of edible fish from Lake Vattern and the Baltic Sea. Chemosphere, 76, 799–804. 10.1016/j.chemosphere.2009.04.044 [DOI] [PubMed] [Google Scholar]
- Berk M, Williams LJ, Andreazza AC, Pasco JA, Dodd S, Jacka FN, Moylan S, Reiner EJ and Magalhaes PV, 2014. Pop, heavy metal and the blues: secondary analysis of persistent organic pollutants (POP), heavy metals and depressive symptoms in the NHANES National Epidemiological Survey. British Medical Journal Open, 4, e005142 10.1136/bmjopen-2014-005142 [DOI] [PMC free article] [PubMed] [Google Scholar]
- BfR (Bundesinstitut für Risikobewertung), 2008. Gesundheitliche Risiken durch PFOS und PFOA in Lebensmitteln sind nach dem derzeitigen wissenschaftlichen Kenntnisstand unwahrscheinlich. Stellungnahme 004/2009 des BfR vom 11. September 2008. 40 pp.
- Bhavsar SP, Zhang X, Guo R, Braekevelt E, Petro S, Gandhi N, Reiner EJ, Lee H, Bronson R and Tittlemier SA, 2014. Cooking fish is not Effective in Reducing Exposure to Perfluoroalkyl and Polyfluoroalkyl Substances, 66, 107–114. [DOI] [PubMed] [Google Scholar]
- Biegel LB, Liu RCM, Hurtt ME and Cook JC, 1995. Effects of ammonium perfluoroctanoate on Leydig cell function. Toxicology and Applied Pharmacology, 134, 18–25. [DOI] [PubMed] [Google Scholar]
- Biegel LB, Hurtt ME, Frame SR, O'Connor JC and Cook JC, 2001. Mechanisms of extrahepatic tumour induction by peroxisome proliferators in male CD rats. Toxicological Sciences, 60, 44–55. [DOI] [PubMed] [Google Scholar]
- Bijland S, Rensen PCN, Pieterman EJ, Maas ACE, van der Hoorn JW, van Erk MJ, Havekes LM, Willems van Dijk K, Chang SC, Ehresman DJ, Butenhoff JL and Princen HMG, 2011. Perfluoroalkyl sulfonates cause alkyl chain length‐dependent hepatic steatosis and hypolipidemia mainly by impairing lipoprotein production in APOE*3‐Leiden CETP mice. Toxicological Sciences, 123, 290–303. 10.1093/toxsci/kfr142 [DOI] [PubMed] [Google Scholar]
- Bischel H, MacManus‐Spencer L and Luthy R, 2010. Noncovalent Interactions of Long‐Chain Perfluoroalkyl Acids with Serum Albumin. Environmental Science and Technology, 32−44. [DOI] [PubMed] [Google Scholar]
- Bjermo H, Darnerud PO, Pearson M, Barbieri HE, Lindroos AK, Nälsén C, Lindh CH, Jönsson BAG and Glynn A, 2013. Serum concentrations of perfluorinated alkyl acids and their associations with diet and personal characteristics among Swedish adults. Molecular Nutrition and Food Research, 57, 2206–2215. 10.1002/mnfr.201200845 [DOI] [PubMed] [Google Scholar]
- Bjerregaard‐Olesen C, Bach CC, Long M, Ghisari M, Bossi R, Bech BH, Nohr EA, Henriksen TB, Olsen J and Bonefeld‐Jørgensen EC, 2016. Time trends of perfluorinated alkyl acids in serum from Danish pregnant women 2008–2013. Environment International, 91, 14–21. 10.1016/j.envint.2016.02.010 [DOI] [PubMed] [Google Scholar]
- Bjork JA and Wallace KB, 2009. Structure‐activity relationships and human relevance for perfluoroalkyl acid‐induced transcriptional activation of peroxisome proliferation in liver cell cultures. Toxicological Sciences, 111, 89–99. 10.1093/toxsci/kfp093 [DOI] [PubMed] [Google Scholar]
- Bjork JA, Butenhoff JL and Wallace KB, 2011. Multiplicity of nuclear receptor activation by PFOA and PFOS in primary human and rodent hepatocytes. Toxicology, 288, 8–17. 10.1016/j.tox.2011.06.012 [DOI] [PubMed] [Google Scholar]
- Bloom MS, Kannan K, Spliethoff HM, Tao L, Aldous KM and Vena JE, 2010. Exploratory assessment of perfluorinated compounds and human thyroid function. Physiology & Behavior, 99, 240–245. [DOI] [PubMed] [Google Scholar]
- Bogdanska J, Borg D, Sundström M, Bergström U, Halldin K, Abedi‐Valugerdi M, Bergman Å, Nelson B, DePierre J and Nobel S, 2011. Tissue distribution of 35S‐labelled perfluorooctane sulfonate in adult mice after oral exposure to a low environmentally relevant dose or a high experimental dose. Toxicology, 284, 54–62. [DOI] [PubMed] [Google Scholar]
- Bonefeld EC, Long M, Fredslund SO, Bossi R and Olsen J, 2014. Breast cancer risk after exposure to perfluorinated compounds in Danish women: a case–control study nested in the Danish National Birth Cohort. Cancer Causes Control, 25, 1439–1448. 10.1007/s10552-014-0446-7 [DOI] [PMC free article] [PubMed] [Google Scholar]
- Borg D, Bogdanska J, Sundström M, Nobel S, Håkansson H, Bergman Å, DePierre JW, Halldin K and Bergström U, 2010. Tissue distribution of 35S‐labelled perfluorooctane sulfonate (PFOS) in C57Bl/6 mice following late gestational exposure. Reproductive Toxicology, 30, 558–565. 10.1016/j.reprotox.2010.07.004 [DOI] [PubMed] [Google Scholar]
- Bossi R, Strand J, Sortkær O and Larsen MM, 2008. Perfluoroalkyl compounds in Danish wastewater treatment plants and aquatic environments. Environment International, 34, 443–450. [DOI] [PubMed] [Google Scholar]
- Brambilla G, Testa C and Fedrizzi G, 2016. Occurrence Of Selected Perfluoroacids In Muscle And Liver From Wild Boar: Relevance For Food Safety/Food Security Issues. Organohalogen Compounds, 78, 338–340. [Google Scholar]
- Brantsaeter AL, Whitworth KW, Ydersbond TA, Haug LS, Haugen M, Knutsen HK, Thomsen C, Meltzer HM, Becher G, Sabaredzovic A, Hoppin JA, Eggesbø M and Longnecker MP, 2013. Determinants of plasma concentrations of perfluoroalkyl substances in pregnant Norwegian women. Environment International, 54, 74–84. 10.1016/j.envint.2012.12.014 [DOI] [PMC free article] [PubMed] [Google Scholar]
- Braun JM, Kalkbrenner AE, Just AC, Yolton K, Calafat AM, Sjodin A, Hauser R, Webster GM, Chen A and Lanphear BP, 2014. Gestational exposure to endocrine‐disrupting chemicals and reciprocal social, repetitive, and stereotypic behaviors in 4‐ and 5‐year‐old children: the HOME study. Environmental Health Perspectives, 122, 513–520. 10.1289/ehp.1307261 [DOI] [PMC free article] [PubMed] [Google Scholar]
- Braun JM, Chen A, Romano ME, Calafat AM, Webster GM, Yolton K and Lanphear BP, 2016. Prenatal perfluoroalkyl substance exposure and child adiposity at 8 years of age: The HOME study. Obesity, 24, 231–237. 10.1002/oby.21258 [DOI] [PMC free article] [PubMed] [Google Scholar]
- Brede E, Wilhelm M, Göen T, Müller J, Rauchfuss K, Kraft M and Hölzer J, 2010. Two‐year follow‐up biomonitoring pilot study of residents’ and controls’ PFC plasma levels after PFOA reduction in public water system in Arnsberg, Germany. International Journal of Hygiene and Environmental Health, 213, 217–223. 10.1016/j.ijheh.2010.03.007 [DOI] [PubMed] [Google Scholar]
- Brieger A, Bienefeld N, Hasan R, Goerlich R and Haase H, 2011. Impact of perfluorooctane sulfonate and perfluorooctanoic acid on human peripheral leukocytes. Toxicology In Vitro, 25, 960–968. [DOI] [PubMed] [Google Scholar]
- Brooke D, Footitt A and Nwaogu TA, 2004. Environmental Perfluorooctanesulphonate (PFOS). Reseach Contractor: Building Ltd, Risk and Policy Analysts Ltd. This report was produced Agency′s Science Group. Available at URL: http://environmentagency. gov.uk/commondata/105385/pfos_rer_sept04_864557.pdf
- Brown RP, Delp MD, Lindstedt SL, Rhomberg LR and Beliles RP, 1997. Physiological parameter values for physiologically based pharmacokinetic models. Toxicology and Industrial Health, 13, 407–484. [DOI] [PubMed] [Google Scholar]
- Buck RC, Franklin J, Berger U, Conder JM, Cousins IT, de Voogt P, Jensen AA, Kannan K, Mabury SA and van Leeuwen SPJ, 2011. Perfluoroalkyl and polyfluoroalkyl substances in the environment: terminology, classification, and origins. Integrated Environmental Assessment and Management, 7, 513–541. 10.1002/ieam.258 [DOI] [PMC free article] [PubMed] [Google Scholar]
- Buck Louis GM, Sundaram R, Schisterman EF, Sweeney AM, Lynch CD, Gore‐Langton RE, Maisog J, Kim S, Chen Z and Barr DB, 2013. Persistent environmental pollutants and couple fecundity: the LIFE study. Environmental Health Perspectives, 121, 231–236. 10.1289/ehp.1205301 [DOI] [PMC free article] [PubMed] [Google Scholar]
- Buck Louis GM, Sapra KJ, Barr DB, Lu Z and Sundaram R, 2016. Preconception perfluoroalkyl and polyfluoroalkyl substances and incident pregnancy loss, LIFE Study. Reproductive Toxicology, 65, 11–17. 10.1016/j.reprotox.2016.06.011 [DOI] [PMC free article] [PubMed] [Google Scholar]
- Budtz‐Jørgensen E, Keiding N and Grandjean P, 2001. Benchmark dose calculation from epidemiological data. Biometrics, 57, 698–706. [DOI] [PubMed] [Google Scholar]
- Buhrke T, Kibellus A and Lampen A, 2013. In vitro toxicological characterization of perfluorinated carboxylic acids with different carbon chain lengths. Toxicology Letters, 218, 97–104. 10.1016/j.toxlet.2013.01.025 [DOI] [PubMed] [Google Scholar]
- Buist SC, Cherrington NJ, Choudhuri S, Hartley DP and Klaassen CD, 2002. Gender specific and developmental influences on the expression of rat organic anion transporters. Journal of Pharmacology and Experimental Therapeutics, 301, 145–151. [DOI] [PubMed] [Google Scholar]
- Bull S, Burnett K, Vassaux K, Ashdown L, Brown T and Rushton L, 2014. Extensive literature search and provision of summaries of studies related to the oral toxicity of perfluoroalkylated substances (PFASs), their precursors and potential replacements in experimental animals and humans. Area 1: Data on toxicokinetics (absorption, distribution, metabolism, excretion) in in vitro studies, experimental animals and humans. Area 2: Data on toxicity in experimental animals. Area 3: Data on observations in humans. EFSA supporting publication 2014:EN‐572, 345 pp.
- Bundesgesundheitsblatt Gesundheitsforschung Gesundheitsschutz , 2016. HBM‐I‐Werte fϋr perfluoroctansäure (PFOA) und perfluoroctansulfonsäure (PFOS) im blutplasma. Bundesgesundheitsblatt‐Gesundheitsforschung‐Gesundheitsschutz, 59, 1362–1363. 10.1007/s00103-016-2434-4 [DOI] [PubMed] [Google Scholar]
- Buser MC and Scinicariello F, 2016. Perfluoroalkyl substances and food allergies in adolescents. Environment International, 88, 74–79. 10.1016/j.envint.2015.12.020 [DOI] [PMC free article] [PubMed] [Google Scholar]
- Butenhoff J, Costa G, Elcombe C, Farrar D, Hansen K, Iwai H, Jung R, Kennedy G Jr, Lieder P, Olsen G and Thomford P, 2002. Toxicity of ammonium perfluorooctanoate in male cynomolgus monkeys after oral dosing for 6 months. Toxicological Sciences, 69, 244–257. [DOI] [PubMed] [Google Scholar]
- Butenhoff JL, Kennedy GL Jr, Hinderliter PM, Lieder PH, Jung R, Hansen KJ, Gorman GS, Noker PE and Thomford PJ, 2004a. Pharmacokinetics of perfluorooctanoate in cynomolgus monkeys. Toxicological Sciences, 82, 394–406. 10.1093/toxsci/kfh302 [DOI] [PubMed] [Google Scholar]
- Butenhoff JL, Kennedy GL, Frame SR, O'Connor JC and York RG, 2004b. The reproductive toxicology of ammonium perfluorooctanoate (APFO) in the rat. Toxicology, 196, 95–116. [DOI] [PubMed] [Google Scholar]
- Butenhoff JL, Olsen GW and Pfahles‐Hutchens A, 2006. The applicability of biomonitoring data for perfluorooctanesulfonate to the environmental public health continuum. Environmental Health Perspectives, 114, 1776–1782. [DOI] [PMC free article] [PubMed] [Google Scholar]
- Butenhoff JL, Ehresman DJ, Chang S‐C, Parker GA and Stump DG, 2009. Gestational and lactational exposure to potassium perfluorooctanesulfonate (K+PFOS) in rats: Developmental neurotoxicity. Reproductive Toxicology, 27, 319–330. 10.1016/j.reprotox.2008.12.010 [DOI] [PubMed] [Google Scholar]
- Butenhoff JL, Pieterman E, Ehresman DJ, Gorman GS, Olsen GW, Chang S‐C and Princen HMG, 2012a. Distribution of perfluorooctanesulfonate and perfluorooctanoate into human plasma lipoprotein fractions. Toxicology Letters, 210, 360–365. 10.1016/j.toxlet.2012.02.013 [DOI] [PubMed] [Google Scholar]
- Butenhoff JL, Chang S‐C, Olsen GW and Thomford PJ, 2012b. Chronic dietary toxicity and carcinogenicity study with potassium perfluorooctanesulfonate in Sprague Dawley rats. Toxicology, 293, 1–15. 10.1016/j.tox.2012.01.003 [DOI] [PubMed] [Google Scholar]
- Butler NR, Goldstein H and Ross EM, 1972. Cigarette smoking in pregnancy: its influence on birth weight and perinatal mortality. British Medical Journal, 2, 127–130. [DOI] [PMC free article] [PubMed] [Google Scholar]
- Calafat AM, Kuklenyik Z, Reidy JA, Caudill SP, Tully JS and Needham LL, 2007. Serum concentrations of 11 polyfluoroalkyl compounds in the U.S. population: data from the national health and nutrition examination survey (NHANES). Environmental Science and Technology, 41, 2237–2242. [DOI] [PubMed] [Google Scholar]
- Callan AC, Rotander A, Thompson K, Heyworth J, Mueller JF, Odland JØ and Hinwood AL, 2016. Maternal exposure to perfluoroalkyl acids measured in whole blood and birth outcomes in offspring. Science of the Total Environment, 569–570, 1107–1113. 10.1016/j.scitotenv.2016.06.177 [DOI] [PubMed] [Google Scholar]
- Campbell S, Raza M and Pollack AZ, 2016. Perfluoroalkyl substances and endometriosis in US women in NHANES 2003‐2006. Reproductive Texicology, 65, 230–235. 10.1016/j.reprotox.2016.08.009 [DOI] [PubMed] [Google Scholar]
- Cariou R, Veyrand B, Yamada A, Berrebi A, Zalko D, Durand S, Pollono C, Marchand P, Leblanc JC, Antignac JP and Le Bizec B, 2015. Perfluoroalkyl acid (PFAA) levels and profiles in breast milk, maternal and cord serum of French women and their newborns. Environment International, 84, 71–81. 10.1016/j.envint.2015.07.014 [DOI] [PubMed] [Google Scholar]
- Case MT, York RG and Christian MS, 2001. Rat and rabbit oral developmental toxicology studies with two perfluorinated compounds. International Journal of Toxicology, 20, 101–109. [DOI] [PubMed] [Google Scholar]
- Caverly‐Rae J, Frame S, Kennedy G, Butenhoff JL and Chang SC, 2014. Pathology review of proliferative lesions of the exocrine pancreas in two chronic feeding studies in rats with ammonium perfluorooctanoate. Toxicology Reports, 1, 85–91. 10.1016/j.toxrep.2014.04.005 [DOI] [PMC free article] [PubMed] [Google Scholar]
- Çelik A, Eke D, Ekinci SY and Yıldırım S, 2013. The protective role of curcumin on perfluorooctane sulfonate‐induced genotoxicity: single cell gel electrophoresis and micronucleus test. Food and Chemical Toxicology, 53, 249–255. 10.1016/j.fct.2012.11.054 [DOI] [PubMed] [Google Scholar]
- Chan E, Burstyn I, Cherry N, Bamforth F and Martin JW, 2011. Perfluorinated acids and hypothyroxinemia in pregnant women. Environmental Research, 111, 559–564. 10.1016/j.envres.2011.01.011 [DOI] [PubMed] [Google Scholar]
- Chang S, Thibodeaux J and Eastvold ML, 2008. Thyroid hormone status and pituitary function in adult rats given oral doses of perfluorooctanesulfonate (PFOS). Toxicology, 243, 330–339. [DOI] [PubMed] [Google Scholar]
- Chang SC, Ehresman DJ, Bjork JA, Wallace KB, Parker GA, Stump DG and Butenhoff JL, 2009. Gestational and lactational exposure to potassium perfluorooctanesulfonate (K+PFOS) in rats: Toxicokinetics, thyroid hormone status, and related gene expression. Reproductive Toxicology, 27, 387–399. [DOI] [PubMed] [Google Scholar]
- Chang S, Noker PE, Gorman GS, Gibson SJ, Hart JA, Ehresman DJ and Butenhoff JL, 2012. Comparative pharmacokinetics of perfluorooctanesulfonate (PFOS) in rats, mice, and monkeys. Reproductive Toxicology, 33, 428–440. [DOI] [PubMed] [Google Scholar]
- Château‐Degat ML, Pereg D, Dallaire R, Ayotte P, Dery S and Dewailly E, 2010. Effects of perfluororoctanesulfonate exposure on plasma lipid levels in the Inuit population of Nunavik (Northern Quebec). Environmental Research, 110, 710–717. [DOI] [PubMed] [Google Scholar]
- Chen Y‐M and Guo L‐H, 2009. Fluorescence study on site‐specific binding of perfluoroalkyl acids to human serum albumin. Archives of Toxicology, 93, 255–261. 10.1007/s00204-008-0359-x [DOI] [PubMed] [Google Scholar]
- Chen MH, Ha EH, Wen TW, Su YN, Lien GW, Chen CY, Chen PC and Hsieh WS, 2012. Perfluorinated compounds in umbilical cord blood and adverse birth outcomes. PLoS ONE, 7, e42474 10.1371/journal.pone.0042474 [DOI] [PMC free article] [PubMed] [Google Scholar]
- Chen MH, Ha EH, Liao HF, Jeng SF, Su YN, Wen TW, Lien GW, Chen CY, Hsieh WS and Chen PC, 2013. Perfluorinated compound levels in cord blood and neurodevelopment at 2 years of age. Epidemiology, 24, 800–808. 10.1097/EDE.0b013e3182a6dd46 [DOI] [PubMed] [Google Scholar]
- Chen H, He P, Rao H, Wang F, Liu H and Yao J, 2015. Systematic investigation of the toxic mechanism of PFOA and PFOS on bovine serum albumin by spectroscopic and molecular modeling. Chemosphere, 129, 217–224. 10.1016/j.chemosphere.2014.11.040 [DOI] [PubMed] [Google Scholar]
- Cheng X and Klaassen CD, 2008a. Critical role of PPAR‐alpha in perfluorooctanoic acid‐ and perfluorodecanoic acid‐induced downregulation of Oatp uptake transporters in mouse livers. Toxicological Sciences, 106, 37–45. 10.1093/toxsci/kfn161 [DOI] [PMC free article] [PubMed] [Google Scholar]
- Cheng X and Klaassen CD, 2008b. Perfluorocarboxylic acids induce cytochrome P450 enzymes in mouse liver through activation of PPAR‐alpha and CAR transcription factors. Toxicological Sciences, 106, 29–36. 10.1093/toxsci/kfn147 [DOI] [PMC free article] [PubMed] [Google Scholar]
- Cheng J, Fujimura M, Zhao W and Wang W, 2013. Neurobehavioral effects, c‐Fos/Jun expression and tissue distribution in rat offspring prenatally co‐exposed to MeHg and PFOA: PFOA impairs Hg retention. Chemosphere, 91, 758–764. 10.1016/j.chemosphere.2013.02.016 [DOI] [PubMed] [Google Scholar]
- Cheung C, Akiyama TE, Ward JM, Nicol CJ, Feigenbaum L, Vinson C and Gonzalez FJ, 2004. Diminished hepatocellular proliferation in mice humanized for the nuclear receptor peroxisome proliferator‐activated receptor alpha. Cancer Research, 64, 3849–3854. [DOI] [PubMed] [Google Scholar]
- Chiu WA, Barton HA, DeWoskin RS, Schlosser P, Thompson CM, Sonawan B, Lipscomb JC and Krishnan K, 2007. Evaluation of physiologically based pharmacokinetic models for use in risk assessment. Journal of Applied Toxicology, 27, 218–237. [DOI] [PubMed] [Google Scholar]
- Christensen KY, Maisonet M, Rubin C, Holmes A, Calafat AM, Kato K, Flanders WD, Heron J, McGeehin MA and Marcus M, 2011. Exposure to polyfluoroalkyl chemicals during pregnancy is not associated with offspring age at menarche in a contemporary British cohort. Environment International, 37, 129–135. 10.1016/j.envint.2010.08.007 [DOI] [PMC free article] [PubMed] [Google Scholar]
- Clarke DB, Bailey VA, Routledge A, Lloyd AS, Hird S, Mortimer DN and Gem M, 2010. Dietary intake estimate for perfluorooctanesulphonic acid (PFOS) and other perfluorocompounds (PFCs) in UK retail foods following determination using standard addition LC–MS/MS. Food Additives and Contaminants, 27, 530–545. [DOI] [PubMed] [Google Scholar]
- de Cock M, de Boer MR, Lamoree M, Legler J and van de Bor M, 2014a. First year growth in relation to prenatal exposure to endocrine disruptors ‐ a Dutch prospective cohort study. International Journal of Environmental Research and Public Health, 11, 7001–7021. 10.3390/ijerph110707001 [DOI] [PMC free article] [PubMed] [Google Scholar]
- de Cock M, de Boer MR, Lamoree M, Legler J and van de Bor M, 2014b. Prenatal exposure to endocrine disrupting chemicals in relation to thyroid hormone levels in infants – a Dutch prospective cohort study. Environmental Health, 13, 106 10.1186/1476-069X-13-106 [DOI] [PMC free article] [PubMed] [Google Scholar]
- Conder JM, Hoke RA, de Wolf W, Russell MH and Buck RC, 2008. Are PFCAs Bioaccumulative? A Critical Review and Comparison with Regulatory Criteria and Persistent Lipophilic Compounds. Environmental Science and Technology, 42, 995–1003. [DOI] [PubMed] [Google Scholar]
- Cook JC, Murray SM, Frame SR and Hurtt ME, 1992. Induction of Leydig cell adenomas by ammonium perfluorooctanoate: a possible endocrine‐related mechanism. Toxicology and Applied Pharmacology, 113, 209–2017. [DOI] [PubMed] [Google Scholar]
- Cook JC, Hurtt ME, Frame SR and Biegel LB, 1994. Mechanisms of extrahepatic tumour induction by peroxisome proliferators in Crl: CD BR(CD) rats. Toxicologist, 14, 301. [Google Scholar]
- Cornelis C, D'Hollander W, Roosens L, Covaci A, Smolders R, Van Den Heuvel R, Govarts E, Van Campenhout K, Reynders H and Bervoets L, 2012. First assessment of population exposure to perfluorinated compounds in Flanders, Belgium. Chemosphere, 86, 308–314. [DOI] [PubMed] [Google Scholar]
- Corsini E, Avogadro A, Galbiati V, dell'Agli M, Marinovich M, Galli CL and Germolec DR, 2011. In vitro evaluation of the immunotoxic potential of perfluorinated compounds (PFCs). Toxicology and Applied Pharmacology, 250, 108–116. [DOI] [PubMed] [Google Scholar]
- Corsini E, Sangiovanni E, Avogadro A, Galbiati V, Viviani B, Marinovich M, Galli CL, Dell'Agli M and Germolec DR, 2012. In vitro characterization of the immunotoxic potential of several perfluorinated compounds (PFCs). Toxicology and Applied Pharmacology, 258, 248–255. [DOI] [PubMed] [Google Scholar]
- Corton JC, Cunningham ML, Hummer BT, Lau C, Meek B, Peters JM, Popp JA, Rhomberg L, Seed J and Klaunig JE, 2014. Mode of action framework analysis for receptor‐mediated toxicity: the peroxisome proliferator‐activated receptor alpha (PPARalpha) as a case study. Critical Reviews in Toxicology, 44, 1–49. 10.3109/10408444.2013.835784 [DOI] [PubMed] [Google Scholar]
- Cui L, Zhou QF, Liao CY, Fu JJ and Jiang GB, 2009. Studies on the toxicological effects of PFOA and PFOS on rats using histological observation and chemical analysis. Archives of Environmental Contamination and Toxicology, 56, 338–349. 10.1007/s00244-008-9194-6 [DOI] [PubMed] [Google Scholar]
- Cui L, Liao CY, Zhou QF, Xia TM, Yun ZJ and Jiang GB, 2010. Excretion of PFOA and PFOS in male rats during a subchronic exposure. Archives of Environmental Contamination and Toxicology, 58, 205–213. 10.1007/s00244-009-9336-5 [DOI] [PubMed] [Google Scholar]
- Curran I, Hierlihy SL, Liston V, Pantazopoulos P, Nunnikhoven A, Tittlemier S, Barker M, Trick K and Bondy G, 2008. Altered fatty acid homeostasis and related toxicologic sequelae in rats exposed to dietary potassium perfluorooctanesulfonate (PFOS). Journal of Toxicology and Environmental Health. Part A, 71, 1526–1541. 10.1080/15287390802361763 [DOI] [PubMed] [Google Scholar]
- D'Eon JC and Mabury SA, 2007. Production of perfluorinated carboxylic acids (PFCAs) from the biotransformation of polyfluoroalkyl phosphate surfactants (PAPS): exploring routes of human contamination. Environmental Science and Technology, 41, 4799–4805. [DOI] [PubMed] [Google Scholar]
- Dallaire R, Dewailly E, Pereg D, Dery S and Ayotte P, 2009. Thyroid function and plasma concentrations of polyhalogenated compounds in Inuit adults. Environmental Health Perspectives, 117(9), 1380–1386. 10.1289/ehp.0900633 [DOI] [PMC free article] [PubMed] [Google Scholar]
- Dalsager L, Christensen N, Husby S, Kyhl H, Nielsen F, Høst A, Grandjean P and Jensen TK, 2016. Association between prenatal exposure to perfluorinated compounds and symptoms of infections at age 1‐4years among 359 children in the Odense Child Cohort. Environment International, 96, 58–64. 10.1016/j.envint.2016.08.026 [DOI] [PubMed] [Google Scholar]
- Danish EPA (Danish Environmental Protection Agency), 2015. Perfluoroalkylated substances: PFOA, PFOS and PFOSA. Evaluation of health hazards and proposal of a health based quality criterion for drinking water, soil and ground water. Environmental project No. 1665, 2015. 90 pp.
- Darrow LA, Stein CR and Steenland K, 2013. Serum Perfluorooctanoic Acid and Perfluorooctane Sulfonate Concentrations in Relation to Birth Outcomes in the Mid‐Ohio Valley, 2005–2010. Environmental Health Perspectives, 121, 1207–1213. 10.1289/ehp.1206372 [DOI] [PMC free article] [PubMed] [Google Scholar]
- Darrow LA, Howards PP, Winquist A and Steenland K, 2014. PFOA and PFOS serum levels and miscarriage risk. Epidemiology, 25, 505–512. 10.1097/EDE.0000000000000103 [DOI] [PubMed] [Google Scholar]
- Darrow LA, Groth AC, Winquist A, Shin HM, Bartell SM and Steenland K, 2016. Modeled Perfluorooctanoic Acid (PFOA) Exposure and Liver Function in a Mid‐Ohio Valley Community. Environmental Health Perspectives, 124, 1227–1233. [DOI] [PMC free article] [PubMed] [Google Scholar]
- De Felip E, Abballe A, Albano FL, Battista T, Carraro V, Conversano M, Franchini S, Giambanco L, Iacovella N, Ingelido AM, Maiorana A, Maneschi F, Marra V, Mercurio A, Nale R, Nucci B, Panella V, Pirola F, Porpora MG, Procopio E, Suma N, Valentini S, Valsenti L and Vecchiè V, 2015. Current exposure of Italian women of reproductive age to PFOS and PFOA: a human biomonitoring study. Chemosphere, 137, 1–8. 10.1016/j.chemosphere.2015.03.046 [DOI] [PubMed] [Google Scholar]
- De Silva AO and Mabury SA, 2006. Isomer distribution of perfluorocarboxylates in human blood: potential correlation to source. Environmental Science and Technology, 40, 2903–2909. [DOI] [PubMed] [Google Scholar]
- De Silva AO, Benskin JP, Martin LJ, Arsenault G, McCrindle R, Riddell N, Martin JW and Mabury SA, 2009. Disposition of perfluorinated acid isomers in Sprague Dawley rats. Part 2: subchronic dose. Environmental Toxicology and Chemistry, 28, 555–567. [DOI] [PubMed] [Google Scholar]
- Del Gobbo L, Tittlemier S, Diamond M, Pepper K, Tague B, Yeudall F and Vanderlinden L, 2008. Cooking Decreases Observed Perfluorinated Compound Concentrations in Fish. Journal of Agricultural and Food Chemistry, 56, 7551–7559. [DOI] [PubMed] [Google Scholar]
- Dennhöfer JK, 2011. Untersuchungen zum „Carry‐over“von Perfluorierten Tensiden aus Futtermitteln und Tränkwasser in tierische Lebensmittel am Modell der Legewachtel. Ludwig‐Maximilians‐Universität München, Tierärztlichen Fakultät, Department für Veterinärwissenschaften, Prof, Dr. Ellen Kienzle: p. 139. [Google Scholar]
- Denys S, Fraize‐Frontier S, Moussa O, Bizec BL, Veyrand B and Volatier J‐L, 2014. Is the fresh water fish consumption a significant determinant of the internal exposure to perfluoroalkylated substances (PFAS)? Toxicology Letters, 231, 233–238. 10.1016/j.toxlet.2014.07.028 [DOI] [PubMed] [Google Scholar]
- DeWitt JC, Copeland CB, Strynar MJ and Luebke RW, 2008. Perfluorooctanoic acid‐induced immunomodulation in adult C57BL/6J or C57BL/6N female mice. Environmental Health Perspectives, 116, 644–650. [DOI] [PMC free article] [PubMed] [Google Scholar]
- Dewitt JC, Copeland CB and Luebke RW, 2009. Suppression of humoral immunity by perfluorooctanoic acid is independent of elevated serum corticosterone concentration in mice. Toxicological Sciences, 109, 106–112. [DOI] [PubMed] [Google Scholar]
- Dhingra R, Lally C, Darrow LA, Klein M, Winquist A and Steenland K, 2016. Perfluorooctanoic acid and chronic kidney disease: longitudinal analysis of a Mid‐Ohio Valley community. Environmental Research, 145, 85–92. 10.1016/j.envres.2015.11.018 [DOI] [PubMed] [Google Scholar]
- Dixon D, Reed CE, Moore AB, Gibbs‐Flournoy EA, Hines EP, Wallace EA, Stanko JP, Lu Y, Jefferson WN, Newbold RR and Fenton SE, 2012. Histopathologic changes in the uterus, cervix and vagina of immature CD‐1 mice exposed to low doses of perfluorooctanoic acid (PFOA) in a uterotrophic assay. Reproductive Toxicology, 33, 506–512. 10.1016/j.reprotox.2011.10.011 [DOI] [PMC free article] [PubMed] [Google Scholar]
- Dobraca D, Israel L, McNeel S, Voss R, Wang M, Gajek R, Park JS, Harwani S, Barley F, She J and Das R, 2015. Biomonitoring in California firefighters: metals and perfluorinated chemicals. Journal of Occupational and Environmental Medicine, 57, 88–97. 10.1097/jom.0000000000000307 [DOI] [PMC free article] [PubMed] [Google Scholar]
- Domazet SL, GrØntved Timmermann AG, Nielsen F and Jensen TK, 2016. Longitudinal associations of exposure to perfluoroalkylated substances in childhood and adolescence and indicators of adiposity and glucose metabolism 6 and 12 years later: the European Youth Heart Study. Diabetes Care, 39, 1745–1751. [DOI] [PubMed] [Google Scholar]
- Domingo JL, 2011. Influence of cooking processes on the concentrations of environmental pollutants in food: a review of the published literature. Critical Reviews in Food Science and Nutrition, 51, 29–37. [DOI] [PubMed] [Google Scholar]
- Domingo JL, 2012. Health risks of dietary exposure to perfluorinated compounds. Environment International, 40, 187–195. [DOI] [PubMed] [Google Scholar]
- Domingo JL, Ericson‐Jogsten I, Perelló G, Nadal M, Van Bavel B and Kärrman A, 2012a. Human exposure to perfluorinated compounds in Catalonia, Spain: contribution of drinking water and fish and shellfish. Journal of Agricultural and Food Chemistry, 60, 4408–4415. 10.1021/jf300355c [DOI] [PubMed] [Google Scholar]
- Domingo JL, Jogsten IE, Eriksson U, Martorella I, Perelló G, Nadala M and van Bavel B, 2012b. Human dietary exposure to perfluoroalkyl substances in Catalonia. Spain. Temporal Trend. Food Chemistry, 135, 1575–1582. 10.1016/j.foodchem.2012.06.054 [DOI] [PubMed] [Google Scholar]
- Donauer S, Chen A, Xu Y, Calafat AM, Sjodin A and Yolton K, 2015. Prenatal Exposure to Polybrominated Diphenyl Ethers and Polyfluoroalkyl Chemicals and Infant Neurobehavior. The Journal of Pediatrics, 166, 736–742. 10.1016/j.jpeds.2014.11.021 [DOI] [PMC free article] [PubMed] [Google Scholar]
- Dong GH, Zhang YH, Zheng L, Liu W, Jin YH and He QC, 2009. Chronic effects of perfluorooctanesulfonate exposure on immunotoxicity in adult male C57BL/6 mice. Archives of Toxicology, 83, 805–815. [DOI] [PubMed] [Google Scholar]
- Dong GH, Liu MM, Wang D, Zheng L, Liang ZF and Jin YH, 2011. Sub‐chronic effect of perfluorooctanesulfonate (PFOS) on the balance of type 1 and type 2 cytokine in adult C57BL6 mice. Archives of Toxicology, 85, 1235–1244. [DOI] [PubMed] [Google Scholar]
- Dong GH, Zhang YH, Zheng L, Liang ZF, Jin YH and He QC, 2012a. Subchronic effects of perfluorooctanesulfonate exposure on inflammation in adult male C57BL/6 mice. Environmental Toxicology, 27, 285–296. [DOI] [PubMed] [Google Scholar]
- Dong GH, Wang J, Zhang YH, Liu MM, Wang D, Zheng L and Jin YH, 2012b. Induction of p53‐mediated apoptosis in splenocytes and thymocytes of C57BL/6 mice exposed to perfluorooctane sulfonate (PFOS). Toxicology and Applied Pharmacology, 264, 292–299. [DOI] [PubMed] [Google Scholar]
- Dong GH, Tung KY, Tsai CH, Liu MM, Wang D, Liu W, Jin YH, Hsieh WS, Lee YL and Chen PC, 2013. Serum polyfluoroalkyl concentrations, asthma outcomes, and immunological markers in a case‐control study of Taiwanese children. Environmental Health Perspectives, 121, 507–513. 10.1289/ehp.1205351 [DOI] [PMC free article] [PubMed] [Google Scholar]
- Du J, Wang S, You H, Jiang R, Zhuang C and Zhang X, 2014. Developmental toxicity and DNA damage to zebrafish induced by perfluorooctane sulfonate in the presence of ZnO nanoparticles. Environmental Toxicology, 31, 360–371. 10.1002/tox.22050 [DOI] [PubMed] [Google Scholar]
- Ducatman A, Zhang J and Fan H, 2015. Prostate‐specific antigen and perfluoroalkyl acids in the C8 health study population. Journal of Occupational and Environmental Medicine, 57, 111–114. 10.1097/jom.0000000000000319 [DOI] [PMC free article] [PubMed] [Google Scholar]
- ECHA (European Chemicals Agency), 2015. Opinion on an Annex XV dossier proposing restrictions on Perfluorooctanoic acid (PFOA), its salts and PFOA‐related substances. Adopted on 8 September 2015. Committee for Risk Assessment (RAC). ECHA/RAC/RES‐O‐0000006229‐70‐02/F.
- EFSA (European Food Safety Authority), 2008. Opinion of the Scientific Panel on Contaminants in the Food chain on Perfluorooctane sulfonate (PFOS), perfluorooctanoic acid (PFOA) and their salts. EFSA Journal 2008;6(7):653, 131 pp. 10.2903/j.efsa.2008.653 [DOI] [PMC free article] [PubMed] [Google Scholar]
- EFSA (European Food Safety Authority), 2010a. Standard sample description for food and feed. EFSA Journal 2010;8(1):1457, 54 pp. 10.2903/j.efsa.2010.1457 [DOI] [Google Scholar]
- EFSA (European Food Safety Authority), 2010b. Management of left‐censored data in dietary exposure assessment of chemical substances. EFSA Journal 2010;8(3):1557, 96 pp. 10.2903/j.efsa.2010.1557 [DOI] [Google Scholar]
- EFSA (European Food Safety Authority), 2011a. Use of the EFSA Comprehensive European Food Consumption Database in Exposure Assessment. EFSA Journal 2011;9(3):2097, 34 pp. 10.2903/j.efsa.2011.2097 [DOI] [Google Scholar]
- EFSA (European Food Safety Authority), 2011b. Evaluation of the FoodEx, the food classification system applied to the development of the EFSA Comprehensive European Food Consumption Database. EFSA Journal 2011;9(3):1970, 27 pp. 10.2903/j.efsa.2011.1970 [DOI] [Google Scholar]
- EFSA (European Food Safety Authority), 2011c. Report on the development of a Food Classification and Description System for exposure assessment and guidance on its implementation and use. EFSA Journal 2011;9(12):2489, 84 pp. 10.2903/j.efsa.2011.2489 [DOI] [Google Scholar]
- EFSA (European Food Safety Authority), 2012. Perfluoroalkylated substances in food: occurrence and dietary exposure. EFSA Journal 2012; 10(6):2743 55 pp. 10.2903/j.efsa.2012.2743 [DOI] [Google Scholar]
- EFSA (European Food Safety Authority), 2015. The food classification and description system FoodEx2 (revision 2). EFSA supporting publication 2015:EN‐804, 90 pp. 10.2903/sp.efsa.2015.en-804 [DOI]
- EFSA CONTAM Panel (EFSA Panel on Contaminants in the Food Chain), 2010. Scientific Opinion on Lead in Food. EFSA Journal 2010;8(4):1570, 151 pp. 10.2903/j.efsa.2010.1570 [DOI] [Google Scholar]
- EFSA Scientific Committee , 2012. Guidance on selected default values to be used by the EFSA Scientific Committee, Scientific Panels and Units in the absence of actual measured data. EFSA Journal 2012;10(3):2579. 32 pp.doi: 10.2903/j.efsa.2012.2579 [DOI] [Google Scholar]
- EFSA Scientific Committee , Hardy A, Benford D, Halldorsson T, Jeger MJ, Knutsen KH, More S, Mortensen A, Naegeli H, Noteborn H, Ockleford C, Ricci A, Rychen G, Silano V, Solecki R, Turck D, Aerts M, Bodin L, Davis A, Edler L, Gundert‐Remy U, Sand S, Slob W, Bottex B, Abrahantes JC, Marques DC, Kass G and Schlatter JR, 2017a. Update: guidance on the use of the benchmark dose approach in risk assessment. EFSA Journal 2017;15(1):4658, 41 pp. 10.2903/j.efsa.2017.4658 [DOI] [PMC free article] [PubMed] [Google Scholar]
- EFSA Scientific Committee , Hardy A, Benford D, Halldorsson T, Jeger MJ, Knutsen HK, More S, Naegeli H, Noteborn H, Ockleford C, Ricci A, Rychen G, Schlatter JR, Silano V, Solecki R, Turck D, Younes M, Bresson J‐L, Griffin J, Hougaard Benekou S, vanLoveren H , Luttik R, Messean A, Penninks A, Ru G, Stegeman JA, dervan Werf W , Westendorf J, Woutersen RA, Barizzone F, Bottex B, Lanzoni A, Georgiadis N and Alexander J, 2017b. Guidance on the assessment of the biological relevance of data in scientific assessments. EFSA Journal 2017;15(8):4970, 73 pp. 10.2903/j.efsa.2017.4970 [DOI] [PMC free article] [PubMed] [Google Scholar]
- Egeghy PP and Lorber M, 2011. An assessment of the exposure of Americans to perfluorooctane sulfonate: a comparison of estimated intake with values inferred from NHANES data. Journal of Exposure Science and Environmental Epidemiology, 21, 150 10.1038/jes.2009.73 [DOI] [PubMed] [Google Scholar]
- Eggen T, Moeder M and Arukwe A, 2010. Municipal landfill leachates: a significant source for new and emerging pollutants. Science of the Total Environment, 408, 5147–5157. 10.1016/j.scitotenv.2010.07.049 [DOI] [PubMed] [Google Scholar]
- Ehresman DJ, Froehlich JW, Olsen GW, Chang S‐C and Butenhoff JL, 2007. Comparison of human whole blood, plasma, and serum matrices for the determination of perfluorooctanesulfonate (PFOS), perfluorooctanoate (PFOA), and other fluorochemicals. Environmental Research, 103, 176–184. 10.1016/j.envres.2006.06.008 [DOI] [PubMed] [Google Scholar]
- Eke D and Çelik A, 2016. Curcumin prevents perfluorooctane sulfonate‐induced genotoxicity and oxidative DNA damage in rat peripheral blood. Drug and Chemical Toxicology, 39, 97–103. 10.3109/01480545.2015.1041601 [DOI] [PubMed] [Google Scholar]
- Elcombe CR, Elcombe BM, Foster JR, Chang S‐C, Ehresman DJ and Butenhoff JL, 2012. Hepatocellular hypertrophy and cell proliferation in Sprague–Dawley rats from dietary exposure to potassium perfluorooctanesulfonate results from increased expression of xenosensor nuclear receptors PPARα and CAR/PXR. Toxicology, 293, 16–29. 10.1016/j.tox.2011.12.014 [DOI] [PubMed] [Google Scholar]
- Elcombe CR, Wolf CR and Westwood D, 2013. United States Patent Application Publication. Composition comprising perfluorooctanoic acid. Pub. No.US 2013/0029928.
- Emmett EA, Shofer FS, Zhang H, Freeman D, Desai C and Shaw LM, 2006. Community exposure to perfluorooctanoate: relationships between serum concentrations and exposure sources. Journal of Occupational and Environmental Medicine, 48, 759–770. 10.1097/01.jom.0000232486.07658.74 [DOI] [PMC free article] [PubMed] [Google Scholar]
- Era S, Harada KH, Toyoshima M, Inoue K, Minata M, Saito N, Takigawa T, Shiota K and Koizumi A, 2009. Cleft palate caused by perfluorooctane sulfonate is caused mainly by extrinsic factors. Toxicology, 256, 42–47. 10.1016/j.tox.2008.11.003 [DOI] [PubMed] [Google Scholar]
- Ericson I, Gómez M, Nadal M, van Bavel B, Lindström G and Domingo JL, 2007. Perfluorinated chemicals in blood of residents in Catalonia (Spain) in relation to age and gender: a pilot study. Environment International, 33, 616–623. 10.1016/j.envint.2007.01.003 [DOI] [PubMed] [Google Scholar]
- Ericson I, Martí‐Cid R, Nadal M, Van Bavel B, Lindström G and Domingo JL, 2008. Human exposure to perfluorinated chemicals through the diet: Intake of perfluorinated compounds in foods from the Catalan (Spain) market. Journal of Agricultural and Food Chemistry, 56, 1787–1794. [DOI] [PubMed] [Google Scholar]
- Ericson‐Jogsten I, Nadal M, van Bavel B, Lindström G and Domingo JL, 2012. Per‐ and polyfluorinated compounds (PFCs) in house dust and indoor air in Catalonia, Spain: implications for human exposure. Environment International, 39, 172–180. 10.1016/j.envint.2011.09.004 [DOI] [PubMed] [Google Scholar]
- Ericson‐Jogsten I, Perelló G, Llebaria X, Bigas E, Martí‐Cid R, Kärrman A and Domingo JL, 2009. Exposure to perfluorinated compounds in Catalonia, Spain, through consumption of various raw and cooked foodstuffs, including packaged food. Food and Chemical Toxicology, 47, 1577–1583. 10.1016/j.fct.2009.04.004 [DOI] [PubMed] [Google Scholar]
- Eriksen KT, Sørensen M, McLaughlin JK, Lipworth L, Tjønneland A, Overvad K and Raaschou‐Nielsen O, 2009. Perfluorooctanoate and perfluorooctanesulfonate plasma levels and risk of cancer in the general Danish population. Journal of the National Cancer Institute, 101, 605–609. 10.1093/jnci/djp041 [DOI] [PubMed] [Google Scholar]
- Eriksen KT, Raaschou‐Nielsen O, Sørensen M, Roursgaard M, Loft S and Møller P, 2010. Genotoxic potential of the perfluorinated chemicals PFOA, PFOS, PFBS, PFNA and PFHxA in human HepG2 cells. Mutation Research/Genetic Toxicology and Environmental Mutagenesis, 700, 39–43. 10.1016/j.mrgentox.2010.04.024 [DOI] [PubMed] [Google Scholar]
- Eriksen KT, Sørensen M, McLaughlin JK, Tjonneland A, Overvad K and Raaschou‐Nielsen O, 2011. Determinants of plasma PFOA and PFOS levels among 652 Danish men. Environmental Science and Technology, 45, 8137–8143. 10.1021/es100626h [DOI] [PubMed] [Google Scholar]
- Eriksen KT, Raaschou‐Nielsen O, McLaughlin JK, Lipworth L, Tjønneland A, Overvad K and Sørensen M, 2013. Association between plasma PFOA and PFOS levels and total cholesterol in a middle‐aged Danish population. PLoS ONE, 8, e56969 10.1371/journal.pone.0056969 [DOI] [PMC free article] [PubMed] [Google Scholar]
- Eriksson U and Kärrman A, 2015. World‐wide indoor exposure to polyfluoroalkyl phosphate esters (PAPs) and other PFASs in household dust. Environmental Science and Technology, 49, 14503–14511. 10.1021/acs.est.5b00679 [DOI] [PubMed] [Google Scholar]
- Fàbrega F, Kumar V, Schuhmacher M, Domingo JL and Nadal M, 2014. PBPK modeling for PFOS and PFOA: validation with human experimental data. Toxicology Letters, 230, 244–251. 10.1016/j.toxlet.2014.01.007 [DOI] [PubMed] [Google Scholar]
- Fàbrega F, Nadal M, Schuhmacher M, Domingo JL and Kumar V, 2016. Influence of the uncertainty in the validation of PBPK models: a case‐study for PFOS and PFOA. Regulatory Toxicology and Pharmacology, 77, 230–239. 10.1016/j.yrtph.2016.03.009 [DOI] [PubMed] [Google Scholar]
- Fair PA, Driscoll E, Mollenhauer MAM, Bradshaw SG, Yun SH, Kannan K, Bossart GD, Keil DE and Peden‐Adams MM, 2011. Effects of environmentally‐relevant levels of perfluorooctane sulfonate on clinical parameters and immunological functions in B 6C 3F 1 mice. Journal of Immunotoxicology, 8, 17–29. [DOI] [PMC free article] [PubMed] [Google Scholar]
- Fasano WJ, Kennedy GL, Szostek B, Farrar DG, Ward RJ, Haroun L and Hinderliter PM, 2005. Penetration of ammonium perfluorooctanoate through rat and human skin in vitro. Drug and Chemical Toxicology, 28, 79–90. 10.1081/dct-39707 [DOI] [PubMed] [Google Scholar]
- Fei C, McLaughlin JK, Tarone RE and Olsen J, 2007. Perfluorinated chemicals and fetal growth: a study within the Danish National Birth Cohort. Environmental Health Perspectives, 115, 1677–1682. 10.1289/ehp.10506 [DOI] [PMC free article] [PubMed] [Google Scholar]
- Fei C, McLaughlin JK, Lipworth L and Olsen J, 2008. Prenatal exposure to perfluorooctanoate (PFOA) and perfluorooctanesulfonate (PFOS) and maternally reported developmental milestones in infancy. Environmental Health Perspectives, 116, 1391–1395. 10.1289/ehp.11277 [DOI] [PMC free article] [PubMed] [Google Scholar]
- Fei C, McLaughlin JK, Lipworth L and Olsen J, 2009. Maternal levels of perfluorinated chemicals and subfecundity. Human Reproduction, 24, 1200–1205. 10.1093/humrep/den490 [DOI] [PubMed] [Google Scholar]
- Fei C, McLaughlin JK, Lipworth L and Olsen J, 2010a. Prenatal exposure to PFOA and PFOS and risk of hospitalization for infectious diseases in early childhood. Environmental Research, 110, 773–777. 10.1016/j.envres.2010.08.004 [DOI] [PubMed] [Google Scholar]
- Fei C, McLaughlin JK, Lipworth L and Olsen J, 2010b. Maternal concentrations of perfluorooctanesulfonate (PFOS) and perfluorooctanoate (PFOA) and duration of breastfeeding. Scandinavian Journal of Work, Environment & Health, 36, 413–421. [DOI] [PubMed] [Google Scholar]
- Fei C and Olsen J, 2011. Prenatal Exposure to Perfluorinated Chemicals and Behavioral or Coordination Problems at Age 7 Years. Environmental Health Perspectives, 119, 573–578. [DOI] [PMC free article] [PubMed] [Google Scholar]
- Fenton SE, Reiner JL, Nakayama SF, Delinsky AD, Stanko JP, Hines EP, White SS, Lindstrom AB, Strynar MJ and Petropoulou SS, 2009. Analysis of PFOA in dosed CD‐1 mice. Part 2. Disposition of PFOA in tissues and fluids from pregnant and lactating mice and their pups. Reproductive Toxicology, 27, 365–372. 10.1016/j.reprotox.2009.02.012 [DOI] [PMC free article] [PubMed] [Google Scholar]
- Fernández Freire P, Pérez Martin JM, Herrero O, Peropadre A, de la Pena E and Hazen MJ, 2008. In vitro assessment of the cytotoxic and mutagenic potential of perfluorooctanoic acid. Toxicology in Vitro, 22, 1228–1233. [DOI] [PubMed] [Google Scholar]
- Filgo AJ, Quist EM, Hoenerhoff MJ, Brix AE, Kissling GE and Fenton SE, 2015. Perfluorooctanoic acid (PFOA)‐induced liver lesions in two strains of mice following developmental exposures: PPARα is not required. Toxicologic Pathology, 43, 558–568. 10.1177/0192623314558463 [DOI] [PMC free article] [PubMed] [Google Scholar]
- Fisher M, Arbuckle TE, Wade M and Haines DA, 2013. Do perfluoroalkyl substances affect metabolic function and plasma lipids?—Analysis of the 2007–2009, Canadian Health Measures Survey (CHMS) Cycle 1. Environmental Research, 121, 95–103. 10.1016/j.envres.2012.11.006 [DOI] [PubMed] [Google Scholar]
- Fisher M, Arbuckle TE, Liang CL, LeBlanc A, Gaudreau E, Foster W, Haines D, Davis K and Fraser W, 2016. Concentrations of persistent organic pollutants in maternal and cord blood from the maternal‐infant research on environmental chemicals (MIREC) cohort study. Environmental Health, 15, 59 10.1186/s12940-016-0143-y [DOI] [PMC free article] [PubMed] [Google Scholar]
- Fitz‐Simon N, Fletcher T, Luster MI, Steenland K, Calafat AM, Kato K and Armstrong B, 2013. Reductions in serum lipids with a 4‐year decline in serum perfluorooctanoic acid and perfluorooctanesulfonic acid. Epidemiology, 24, 569–576. [DOI] [PMC free article] [PubMed] [Google Scholar]
- Fleisch AF, Rifas‐Shiman SL, Mora AM, Calafat AM, Ye X, Luttmann‐Gibson H, Gillman MW, Oken E and Sagiv SK, 2017. Early‐life exposure to perfluoroalkyl substances and childhood metabolic function. Environmental Health Perspectives, 125(3), 481–487. 10.1289/EHP303 [DOI] [PMC free article] [PubMed] [Google Scholar]
- Fletcher T, Galloway TS, Melzer D, Holcroft P, Cipelli R, Pilling LC, Mondal D, Luster M and Harries LW, 2013. Associations between PFOA, PFOS and changes in the expression of genes involved in cholesterol metabolism in humans. Environment International, 57–58, 2–10. 10.1016/j.envint.2013.03.008 [DOI] [PubMed] [Google Scholar]
- Fletcher T, 2017a. RE: EFSA_PFAS‐data access/availabily queries. Message to Karen Mackay. email. 12 April 2017.
- Florentin A, Deblonde T, Diguio N, Hautemaniere A and Hartemann P, 2011. Impacts of two perfluorinated compounds (PFOS and PFOA) on human hepatoma cells: cytotoxicity but no genotoxicity? International Journal of Hygiene and Environmental Health, 214, 493–499. [DOI] [PubMed] [Google Scholar]
- Food Standards Agency , 2006. Fluorinated Chemicals: UK Dietary Intake. Food Standards Agency, London. Available at: http://food.gov.uk/science/surveillance/fsisbranch2006/fsis1106
- Forns J, Iszatt N, White RA, Mandal S, Sabaredzovic A, Lamoree M, Thomsen C, Haug LS, Stigum H and Eggesbø M, 2015. Perfluoroalkyl substances measured in breast milk and child neuropsychological development in a Norwegian birth cohort study. Environment International, 83, 176–182. 10.1016/j.envint.2015.06.013 [DOI] [PubMed] [Google Scholar]
- Franko J, Meade BJ, Frasch HF, Barbero AM and Anderson SE, 2012. Dermal penetration potential of perfluorooctanoic acid (PFOA) in human and mouse skin. Journal of Toxicology and Environmental Health. Part A, 75, 50–62. 10.1080/15287394.2011.615108 [DOI] [PubMed] [Google Scholar]
- Freberg BI, Haug LS, Olsen R, Daae HL, Hersson M, Thomsen C, Thorud S, Becher G, Molander P and Ellingsen DG, 2010. Occupational exposure to airborne perfluorinated compounds during professional ski waxing. Environmental Science and Technology, 44, 7723–7728. 10.1021/es102033k [DOI] [PubMed] [Google Scholar]
- Frisbee SJ, Brooks APJr, Maher A, Flensborg P, Arnold S, Fletcher T, Steenland K, Shankar A, Knox SS, Pollard C, Halverson JA, Vieira VM, Jin C, Leyden KM and Ducatman AM, 2009. The C8 health project: design, methods, and participants. Environmental Health Perspectives, 117, 1873–1882. 10.1289/ehp.0800379 [DOI] [PMC free article] [PubMed] [Google Scholar]
- Frisbee SJ, Shankar A, Knox SS, Steenland K, Savitz DA, Fletcher T and Ducatman AM, 2010. Perfluorooctanoic acid, perfluorooctanesulfonate, and serum lipids in children and adolescents: results from the C8 Health Project. Archives of Pediatrics and Adolescent Medicine, 164, 860–869. 10.1001/archpediatrics.2010.163 [DOI] [PMC free article] [PubMed] [Google Scholar]
- Fromme H, Schlummer M, Moller A, Gruber L, Wolz G, Ungewiss J, Bohmer S, Dekant W, Mayer R, Liebl B and Twardella D, 2007. Exposure of an adult population to perfluorinated substances using duplicate diet portions and biomonitoring data. Environmental Science and Technology, 41, 7928–7933. [DOI] [PubMed] [Google Scholar]
- Fromme H, Tittlemier SA, Völkel W, Wilhelm M and Twardella D, 2009. Perfluorinated compounds – Exposure assessment for the general population in western countries. International Journal of Hygiene and Environmental Health, 212, 239–270. 10.1016/j.ijheh.2008.04.007 [DOI] [PubMed] [Google Scholar]
- Fromme H, Mosch C, Morovitz M, Alba‐Alejandre I, Boehmer S, Kiranoglu M, Faber F, Hannibal I, Genzel‐Boroviczény O, Koletzko B and Völkel W, 2010. Pre‐ and postnatal exposure to perfluorinated compounds (PFCs). Environmental Science and Technology, 44, 7123–7129. 10.1021/es101184f [DOI] [PubMed] [Google Scholar]
- Fromme H, Dreyer A, Dietrich S, Fembacher L, Lahrz T and Völkel W, 2015. Neutral polyfluorinated compounds in indoor air in Germany – The LUPE 4 study. Chemosphere, 139, 572–578. 10.1016/j.chemosphere.2015.07.024 [DOI] [PubMed] [Google Scholar]
- FSANZ (Food Standards Australia New Zealand), 2017. Hazard assessment report – Perfluorooctane sulfonate (PFOS), Perfluorooctanoic acid (PFOA), Perfluorohexane sulfonate (PFHxS). 164 pp.
- Fu Y, Wang T, Fu Q, Wang P and Lu Y, 2014. Associations between serum concentrations of perfluoroalkyl acids and serum lipid levels in a Chinese population. Ecotoxicology and Environmental Safety, 106, 246–252. [DOI] [PubMed] [Google Scholar]
- Fu J, Gao Y, Cui L, Wang T, Liang Y, Qu G, Yuan B, Wang Y, Zhang A and Jiang G, 2016. Occurrence, temporal trends, and half‐lives of perfluoroalkyl acids (PFAAs) in occupational workers in China. Scientific Reports, 6, 38039 10.1038/srep38039 [DOI] [PMC free article] [PubMed] [Google Scholar]
- Fujii Y, Harada KH and Koizumi A, 2013. Occurrence of perfluorinated carboxylic acids (PFCAs) in personal care products and compounding agents. Chemosphere, 93, 538–544. 10.1016/j.chemosphere.2013.06.049 [DOI] [PubMed] [Google Scholar]
- Fujii Y, Niisoe T, Harada KH, Uemoto S, Ogura Y, Takenaka K and Koizumi A, 2015. Toxicokinetics of perfluoroalkyl carboxylic acids with different carbon chain lengths in mice and humans. Journal of Occupational Health, 57, 1–12. 10.1539/joh.14-0136-OA [DOI] [PubMed] [Google Scholar]
- Furdui VI, Stock NL, Ellis DA, Butt CM, Whittle DM, Crozier PW, Reiner EJ, Muir DCG and Mabury SA, 2007. Spatial Distribution of Perfluoroalkyl Contaminants in Lake Trout from the Great Lakes. Environmental Science and Technology, 41, 1554–1559. [DOI] [PubMed] [Google Scholar]
- Gallo V, Leonardi G, Genser B, Lopez‐Espinosa MJ, Frisbee SJ, Karlsson L, Ducatman AM and Fletcher T, 2012. Serum perfluorooctanoate (PFOA) and perfluorooctane sulfonate (PFOS) concentrations and liver function biomarkers in a population with elevated PFOA exposure. Environmental Health Perspectives, 120, 655–660. 10.1289/ehp.1104436 [DOI] [PMC free article] [PubMed] [Google Scholar]
- Gallo V, Leonardi G, Brayne C, Armstrong B and Fletcher T, 2013. Serum perfluoroalkyl acids concentrations and memory impairment in a large cross‐sectional study. British Medical Journal Open, 3, e002414 10.1136/bmjopen-2012-002414 [DOI] [PMC free article] [PubMed] [Google Scholar]
- Gazouli M, Yao ZX, Boujrad N, Corton JC, Culty M and Papadopoulos V, 2002. Effect of peroxisome proliferators on Leydig cell peripheral‐type benzodiazepine receptor gene expression, hormone‐stimulated cholesterol transport, and steroidogenesis: role of the peroxisome proliferator‐activator receptor alpha. Endocrinology, 143, 2571–2583. 10.1210/endo.143.7.8895 [DOI] [PubMed] [Google Scholar]
- Gebbink WA, Glynn A and Berger U, 2015. Temporal changes (1997–2012) of perfluoroalkyl acids and selected precursors (including isomers) in Swedish human serum. Environmental Pollution, 199, 166–173. 10.1016/j.envpol.2015.01.024 [DOI] [PubMed] [Google Scholar]
- Gebbink WA, Bignert A and Berger U, 2016. Perfluoroalkyl acids (PFAAs) and selected precursors in the Baltic sea environment: do precursors play a role in food web accumulation of PFAAs? Environmental Science and Technology, 50, 6354–6362. 10.1021/acs.est.6b01197 [DOI] [PubMed] [Google Scholar]
- Geiger SD, Xiao J and Shankar A, 2013. Positive association between perfluoroalkyl chemicals and hyperuricemia in children. American Journal of Epidemiology, 177, 1255–1262. 10.1093/aje/kws392 [DOI] [PMC free article] [PubMed] [Google Scholar]
- Geiger SD, Xiao J, Ducatman A, Frisbee S, Innes K and Shankar A, 2014a. The association between PFOA, PFOS and serum lipid levels in adolescents. Chemosphere, 98, 78–83. [DOI] [PubMed] [Google Scholar]
- Geiger SD, Xiao J and Shankar A, 2014b. No association between perfluoroalkyl chemicals and hypertension in children. Integrated Blood Pressure Control, 7, 1–7. 10.2147/IBPC.S47660 [DOI] [PMC free article] [PubMed] [Google Scholar]
- Genser B, Teles CA, Barreto ML and Fischer JE, 2015. Within‐ and between‐group regression for improving the robustness of causal claims in cross‐sectional analysis. Environmental Health, 14, 60 10.1186/s12940-015-0047-2 [DOI] [PMC free article] [PubMed] [Google Scholar]
- Giesy JP and Kannan K, 2001. Global distribution of perfluorooctane sulfonate in wildlife. Environmental Science and Technology, 35, 1339. [DOI] [PubMed] [Google Scholar]
- Gilliland FD and Mandel JS, 1993. Mortality among employees of a perfluorooctanoic acid production plant. Journal of Occupational Medicine, 35, 950–954. [DOI] [PubMed] [Google Scholar]
- Gilliland FD and Mandel JS, 1996. Serum perfluorooctanoic acid and hepatic enzymes, lipoproteins, and cholesterol: a study of occupationally exposed men. American Journal of Industrial Medicine, 29, 560–568. [DOI] [PubMed] [Google Scholar]
- Gleason JA, Post GB and Fagliano JA, 2015. Associations of perfluorinated chemical serum concentrations and biomarkers of liver function and uric acid in the US population (NHANES), 2007–2010. Environmental Research, 136, 8–14. [DOI] [PubMed] [Google Scholar]
- Glynn A, Berger U, Bignert A, Ullah S, Aune M, Lignell S and Darnerud PO, 2012. Perfluorinated alkyl acids in blood serum from primiparous women in Sweden: serial sampling during pregnancy and nursing, and temporal trends 1996‐2010. Environmental Science and Technology, 46, 9071–9079. 10.1021/es301168c [DOI] [PubMed] [Google Scholar]
- Goeritz I, Falk S, Stahl T, Schäfers C and Schlechtriem C, 2013. Biomagnification and tissue distribution of perfluoroalkyl substances (PFASs) in market‐size rainbow trout (Oncorhynchus mykiss). Environmental Toxicology and Chemistry, 32, 2078–2088. 10.1002/etc.2279 [DOI] [PubMed] [Google Scholar]
- Goldenthal EI, Jessup DC, Geil RG and Mehring JS, 1978. Ninety‐day subacute rhesus monkey toxicity study. 137‐092. Internation Research and Development Corporation.
- Gómez‐Canela C, Fernández‐Sanjuan M, Farres M and Lacorte S, 2015. Factors affecting the accumulation of perfluoroalkyl substances in human blood. Environmental Science and Pollution Research International, 22, 1480–1486. 10.1007/s11356-014-3439-x [DOI] [PubMed] [Google Scholar]
- Gorrochategui E, Pérez‐Albaladejo E, Casas J, Lacorte S and Porte C, 2014. Perfluorinated chemicals: differential toxicity, inhibition of aromatase activity and alteration of cellular lipids in human placental cells. Toxicology and Applied Pharmacology, 277, 124–130. 10.1016/j.taap.2014.03.012 [DOI] [PubMed] [Google Scholar]
- Gotoh Y, Kato Y, Stieger B, Meier PJ and Sugiyama Y, 2002. Gender difference in the Oatp1‐mediated tubular reabsorption of estradiol 17β‐D‐glucuronide in rats. American Journal of Physiology‐Endocrinology and Metabolism, 282, E1245–E1254. 10.1152/ajpendo.00363.2001 [DOI] [PubMed] [Google Scholar]
- Goudarzi H, Nakajima S, Ikeno T, Sasaki S, Kobayashi S, Miyashita C, Ito S, Araki A, Nakazawa H and Kishi R, 2016. Prenatal exposure to perfluorinated chemicals and neurodevelopment in early infancy: The Hokkaido Study. Science of the Total Environment, 541, 1002–1010. 10.1016/j.scitotenv.2015.10.017 [DOI] [PubMed] [Google Scholar]
- Goudarzi H, Miyashita C, Okada E, Kashino I, Chen CJ, Ito S, Araki A, Kobayashi S, Matsuura H and Kishi R, 2017. Prenatal exposure to perfluoroalkyl acids and prevalence of infectious diseases up to 4 years of age. Environment International, 104, 132–138. 10.1016/j.envint.2017.01.024 [DOI] [PubMed] [Google Scholar]
- Grandjean P and Budtz‐Jørgensen E, 2013. Immunotoxicity of perfluorinated alkylates: calculation of benchmark doses based on serum concentrations in children. Environmental Health, 12, 35. [DOI] [PMC free article] [PubMed] [Google Scholar]
- Grandjean P, Andersen EW, Budtz‐Jørgensen E, Nielsen F, Mølbak K, Weihe P and Heilmann C, 2012. Serum vaccine antibody concentrations in children exposed to perfluorinated compounds. JAMA, 307, 391–397. 10.1001/jama.2011.2034 [DOI] [PMC free article] [PubMed] [Google Scholar]
- Grandjean P, Heilmann C, Weihe P, Nielsen F, Mogensen UB, Timmermann A and Budtz‐Jørgensen E, 2017. Estimated exposures to perfluorinated compounds in infancy predict attenuated vaccine antibody concentrations at age 5‐years. Journal of Immunotoxicology, 14, 188–195. 10.1080/1547691x.2017.1360968 [DOI] [PMC free article] [PubMed] [Google Scholar]
- Granum B, Haug LS, Namork E, Stølevik SB, Thomsen C, Aaberge IS, van Loveren H, Løvik M and Nygaard UC, 2013. Pre‐natal exposure to perfluoroalkyl substances may be associated with altered vaccine antibody levels and immune‐related health outcomes in early childhood. Journal of Immunotoxicology, 10, 373–379. 10.3109/1547691x.2012.755580 [DOI] [PubMed] [Google Scholar]
- Gulkowska A, Jiang Q, So MK, Taniyasu S, Lam PKS and Yamashita N, 2006. Persistent perfluorinated acids in seafood collected from two cities of China. Environmental Science and Technology, 40, 3736–3741. [DOI] [PubMed] [Google Scholar]
- Gump BB, Wu Q, Dumas AK and Kannan K, 2011. Perfluorochemical (PFC) exposure in children: associations with impaired response inhibition. Environmental Science and Technology, 45, 8151–8159. 10.1021/es103712g [DOI] [PMC free article] [PubMed] [Google Scholar]
- Guo X, Li Q, Shi J, Shi L, Li B, Zhao G and Wu L, 2016. PFOS exposure causes gonadal developmental toxicity in Caenorhabditis elegans through ROS‐induced DNA damage. Chemosphere, 155, 115–126. 10.1016/j.chemosphere.2016.04.046 [DOI] [PubMed] [Google Scholar]
- Guruge KS, Manage PM, Yamanaka N, Miyazaki S, Taniyasu S and Yamashita N, 2008. Species‐specific concentrations of perfluoroalkyl contaminants in farm and pet animals in Japan. Chemosphere, 73, S210–S215. 10.1016/j.chemosphere.2006.12.105 [DOI] [PubMed] [Google Scholar]
- Guruge KS, Hikono H, Shimada N, Murakami K, Hasegawa J, Yeung LW, Yamanaka N and Yamashita N, 2009. Effect of perfluorooctane sulfonate (PFOS) on influenza A virus‐induced mortality in female B6C3F1 mice. Journal of Toxicological Sciences, 34, 687–691. [DOI] [PubMed] [Google Scholar]
- Gützkow KB, Haug LS, Thomsen C, Sabaredzovic A, Becher G and Brunborg G, 2012. Placental transfer of perfluorinated compounds is selective – A Norwegian Mother and Child sub‐cohort study. International Journal of Hygiene and Environmental Health, 215, 216–219. 10.1016/j.ijheh.2011.08.011 [DOI] [PubMed] [Google Scholar]
- Gyllenhammar I, Berger U, Sundström M, McCleaf P, Eurén K, Eriksson S, Ahlgren S, Lignell S, Aune M, Kotova N and Glynn A, 2015. Influence of contaminated drinking water on perfluoroalkyl acid levels in human serum – A case study from Uppsala, Sweden. Environmental Research, 140, 673–683. 10.1016/j.envres.2015.05.019 [DOI] [PubMed] [Google Scholar]
- Haines DA and Murray J, 2012. Human biomonitoring of environmental chemicals—Early results of the 2007–2009 Canadian Health Measures Survey for males and females. International Journal of Hygiene and Environmental Health, 215, 133–137. 10.1016/j.ijheh.2011.09.008 [DOI] [PubMed] [Google Scholar]
- Halldorsson TI, Fei C, Olsen J, Lipworth L, McLaughlin JK and Olsen SF, 2008. Dietary predictors of perfluorinated chemicals: a study from the Danish National Birth Cohort. Environmental Science and Technology, 42, 8971–8977. 10.1021/es801907r [DOI] [PubMed] [Google Scholar]
- Halldorsson TI, Rytter D, Haug LS, Bech BH, Danielsen I, Becher G, Henriksen TB and Olsen SF, 2012. Prenatal exposure to perfluorooctanoate and risk of overweight at 20 years of age: a prospective cohort study. Environmental Health Perspectives, 120, 668–673. 10.1289/ehp.1104034 [DOI] [PMC free article] [PubMed] [Google Scholar]
- Hallgren S, Fredriksson A and Viberg H, 2015. More signs of neurotoxicity of surfactants and flame retardants – Neonatal PFOS and PBDE 99 cause transcriptional alterations in cholinergic genes in the mouse CNS. Environmental Toxicology and Pharmacology, 40, 409–416. 10.1016/j.etap.2015.06.014 [DOI] [PubMed] [Google Scholar]
- Hallgren S and Viberg H, 2016. Postnatal exposure to PFOS, but not PBDE 99, disturb dopaminergic gene transcription in the mouse CNS. Environmental Toxicology and Pharmacology, 41, 121–126. 10.1016/j.etap.2015.11.016 [DOI] [PubMed] [Google Scholar]
- Hamm MP, Cherry NM, Chan E, Martin JW and Burstyn I, 2010. Maternal exposure to perfluorinated acids and fetal growth. Journal of Exposure Science and Environmental Epidemiology, 20, 589–597. 10.1038/jes.2009.57 [DOI] [PubMed] [Google Scholar]
- Han X, Snow TA, Kemper RA and Jepson GW, 2003. Binding of perfluorooctanoic acid to rat and human plasma proteins. Chemical Research in Toxicology, 16, 775–781. 10.1021/tx034005w [DOI] [PubMed] [Google Scholar]
- Han X, Nabb DL, Russell MH, Kennedy GL and Rickard RW, 2012. Renal elimination of perfluorocarboxylates (PFCAs). Chemical Research in Toxicology, 25, 35–46. 10.1021/tx200363w [DOI] [PubMed] [Google Scholar]
- Hansen KJ, Clemen LA, Ellefson ME and Johnson HO, 2001. Compound‐specific, quantitative characterization of organic fluorochemicals in biological matrices. Environmental Science and Technology, 35, 766–770. [DOI] [PubMed] [Google Scholar]
- Hansen S, Vestergren R, Herzke D, Melhus M, Evenset A, Hanssen L, Brustad M and Sandanger TM, 2016. Exposure to per‐ and polyfluoroalkyl substances through the consumption of fish from lakes affected by aqueous film‐forming foam emissions — A combined epidemiological and exposure modeling approach. The SAMINOR 2 Clinical Study. Environment International, 94, 272–282. 10.1016/j.envint.2016.05.030 [DOI] [PubMed] [Google Scholar]
- Hanssen L, Dudarev AA, Huber S, Odland JØ, Nieboer E and Sandanger TM, 2013. Partition of perfluoroalkyl substances (PFASs) in whole blood and plasma, assessed in maternal and umbilical cord samples from inhabitants of arctic Russia and Uzbekistan. Science of the Total Environment, 447, 430–437. 10.1016/j.scitotenv.2013.01.029 [DOI] [PubMed] [Google Scholar]
- Harada K, Inoue K, Morikawa A, Yoshinaga T, Saito N and Koizumi A, 2005. Renal clearance of perfluorooctane sulfonate and perfluorooctanoate in humans and their species‐specific excretion. Environmental Research, 99, 253–261. 10.1016/j.envres.2004.12.003 [DOI] [PubMed] [Google Scholar]
- Harada KH, Hashida S, Kaneko T, Takenaka K, Minata M, Inoue K, Saito N and Koizumi A, 2007. Biliary excretion and cerebrospinal fluid partition of perfluorooctanoate and perfluorooctane sulfonate in humans. Environmental Toxicology and Pharmacology, 24, 134–139. 10.1016/j.etap.2007.04.003 [DOI] [PubMed] [Google Scholar]
- Hardell E, Karrman A, van Bavel B, Bao J, Carlberg M and Hardell L, 2014. Case‐control study on perfluorinated alkyl acids (PFAAs) and the risk of prostate cancer. Environment International, 63, 35–39. 10.1016/j.envint.2013.10.005 [DOI] [PubMed] [Google Scholar]
- Hardisty JF, Willson GA, Brown WR, McConnell EE, Frame SR, Gaylor DW, Kennedy GL and Butenhoff JL, 2010. Pathology Working Group review and evaluation of proliferative lesions of mammary gland tissues in female rats fed ammonium perfluorooctanoate (APFO) in the diet for 2years. Drug and Chemical Toxicology, 33, 131–137. [DOI] [PubMed] [Google Scholar]
- Harrad S, de Wit CA, Abdallah MA, Bergh C, Bjorklund JA, Covaci A, Darnerud PO, de Boer J, Diamond M, Huber S, Leonards P, Mandalakis M, Ostman C, Haug LS, Thomsen C and Webster TF, 2010. Indoor contamination with hexabromocyclododecanes, polybrominated diphenyl ethers, and perfluoroalkyl compounds: an important exposure pathway for people? Environmental Science and Technology, 44, 3221–3231. 10.1021/es903476t [DOI] [PubMed] [Google Scholar]
- Haug LS, Thomsen C and Becher G, 2009. Time trends and the influence of age and gender on serum concentrations of perfluorinated compounds in archived human samples. Environmental Science and Technology, 43, 2131–2136. [DOI] [PubMed] [Google Scholar]
- Haug LS, Salihovic S, Ericson Jogsten I, Thomsen C, van Bavel B, Linström G and Becher G, 2010a. Levels in food and beverages and daily intake of perfluorinated compounds in Norway. Chemosphere, 80, 1137–1143. [DOI] [PubMed] [Google Scholar]
- Haug LS, Thomsen C, Brantsaeter AL, Kvalem HE, Haugen M, Becher G, Alexander J, Meltzer HM and Knutsen HK, 2010b. Diet and particularly seafood are major sources of perfluorinated compounds in humans. Environment International, 36, 772–778. 10.1016/j.envint.2010.05.016 [DOI] [PubMed] [Google Scholar]
- Haug LS, Huber S, Schlabach M, Becher G and Thomsen C, 2011a. Investigation on per‐ and polyfluorinated compounds in paired samples of house dust and indoor air from Norwegian homes. Environmental Science and Technology, 45, 7991–7998. 10.1021/es103456h [DOI] [PubMed] [Google Scholar]
- Haug LS, Huber S, Becher G and Thomsen C, 2011b. Characterisation of human exposure pathways to perfluorinated compounds — Comparing exposure estimates with biomarkers of exposure. Environment International, 37, 687–693. 10.1016/j.envint.2011.01.011 [DOI] [PubMed] [Google Scholar]
- Heilmann C, Budtz‐Jørgensen E, Nielsen F, Heinzow B, Weihe P and Grandjean P, 2010. Serum concentrations of antibodies against vaccine toxoids in children exposed perinatally to immunotoxicants. Environmental Health Perspectives, 118, 1434–1438. doi: [DOI] [PMC free article] [PubMed] [Google Scholar]
- Heilmann C, Grandjean P, Weihe P, Nielsen F and Budtz‐Jørgensen E, 2016. Reduced antibody responses to vaccinations in children exposed to polychlorinated biphenyls. PLoS Medicine, 3, e311. [DOI] [PMC free article] [PubMed] [Google Scholar]
- Hekster FM, Laane RWPM and de Voogt P, 2003. Environmental and toxicity effects of perfluoroalkylated substances. Reviews of Environmental Contamination and Toxicology, 179, 99–121. [DOI] [PubMed] [Google Scholar]
- Hilakivi‐Clarke L, 2007. Nutritional modulation of terminal end buds: its relevance to breast cancer prevention. Current Cancer Drug Targets, 7, 465–474. [DOI] [PubMed] [Google Scholar]
- Hinderliter PM, Mylchreest E, Gannon SA, Butenhoff JL and Kennedy GL Jr, 2005. Perfluorooctanoate: Placental and lactational transport pharmacokinetics in rats. Toxicology, 211(1–2), 139–148. 10.1016/j.tox.2005.03.010 PMID:15863257. [DOI] [PubMed] [Google Scholar]
- Hines EP, White SS, Stanko JP, Gibbs‐Flournoy EA, Lau C and Fenton SE, 2009. Phenotypic dichotomy following developmental exposure to perfluorooctanoic acid (PFOA) in female CD‐1 mice: low doses induce elevated serum leptin and insulin, and overweight in mid‐life. Molecular and Cellular Endocrinology, 304, 97–105. 10.1016/j.mce.2009.02.021 [DOI] [PubMed] [Google Scholar]
- Hoff PT, Van de Vijver K, Van Dongen W, Esmans EL, Blust R and De Coen WM, 2003. Perfluorooctane sulfonic acid in bib (Trisopteris luscus) and plaice (Pleuronectes platessa) from the Western Scheldt and the Belgian North Sea: distribution and biochemical effects. Environmental Toxicology and Chemistry, 22, 608–614. [PubMed] [Google Scholar]
- Hoffman K, Webster TF, Weisskopf MG, Weinberg J and Vieira VM, 2010. Exposure to polyfluoroalkyl chemicals and attention deficit/hyperactivity disorder in U.S. children 12‐15 years of age. Environmental Health Perspectives, 118, 1762–1767. 10.1289/ehp.1001898 [DOI] [PMC free article] [PubMed] [Google Scholar]
- Holmström KE, Järnberg U and Bignert A, 2005. Temporal Trends of PFOS and PFOA in Guillemot Eggs from the Baltic Sea, 1968–2003. Environmental Science and Technology, 39, 80–84. 10.1021/es049257d [DOI] [PubMed] [Google Scholar]
- Holmström KE, Johansson A‐K, Bignert A, Lindberg P and Berger U, 2010. Temporal Trends of Perfluorinated Surfactants in Swedish Peregrine Falcon Eggs (Falco peregrinus), 1974–2007. Environmental Science and Technology, 44, 4083–4088. 10.1021/es100028f [DOI] [PubMed] [Google Scholar]
- Hölzer J, Midasch O, Rauchfuss K, Kraft M, Reupert R, Angerer J, Kleeschulte P, Marschall N and Wilhelm M, 2008. Biomonitoring of perfluorinated compounds in children and adults exposed to perfluorooctanoate‐contaminated drinking water. Environmental Health Perspectives, 116, 651–657. 10.1289/ehp.11064 [DOI] [PMC free article] [PubMed] [Google Scholar]
- Hölzer J, Göen T, Just P, Reupert R, Rauchfuss K, Kraft M, Müller J and Wilhelm M, 2011. Perfluorinated Compounds in Fish and Blood of Anglers at Lake Möhne, Sauerland Area, Germany. Environmental Science and Technology, 45, 8046–8052. [DOI] [PubMed] [Google Scholar]
- Houde M, Martin JW, Letcher RJ, Solomon KR and Muir DCG, 2006. Biological monitoring of polyfluoroalkyl substance: a review. Environmental Science and Technology, 40, 3463–3473. [DOI] [PubMed] [Google Scholar]
- Houde M, De Silva AO, Muir DCG and Letcher RJ, 2011. Monitoring of perfluorinated compounds in aquatic biota: an updated review. Environmental Science and Technology, 45, 7962e7973. [DOI] [PubMed] [Google Scholar]
- Høyer BB, Ramlau‐Hansen CH, Obel C, Pedersen HS, Hernik A, Ogniev V, Jönsson BA, Lindh CH, Rylander L, Rignell‐Hydbom A, Bonde JP and Toft G, 2015a. Pregnancy serum concentrations of perfluorinated alkyl substances and offspring behaviour and motor development at age 5–9 years – a prospective study. Environmental Health, 14, 2 10.1186/1476-069X-14-2 [DOI] [PMC free article] [PubMed] [Google Scholar]
- Høyer BB, Ramlau‐Hansen CH, Vrijheid M, Valvi D, Pedersen HS, Zviezdai V, Jönsson BA, Lindh CH, Bonde JP and Toft G, 2015b. Anthropometry in 5‐ to 9‐year‐old greenlandic and ukrainian children in relation to prenatal exposure to perfluorinated alkyl substances. Environmental Health Perspectives, 123, 841–846. 10.1289/ehp.1408881 [DOI] [PMC free article] [PubMed] [Google Scholar]
- Hrádková P, Pulkrabová J, Kalachová K, Hloušková V, Tomaniová M, Poustka J and Hajšlová J, 2012. Occurrence of Halogenated Contaminants in Fish from Selected River Localities and Ponds in the Czech Republic. Archives of Environmental Contamination and Toxicology, 62, 85–96. [DOI] [PubMed] [Google Scholar]
- Huybrechts I, Sioen I, Boon PE, Ruprich J, Lafay L, Turrini A, Amiano P, Hirvonen T, De Neve M, Arcella D, Moschandreas J, Westerlund A, Ribas‐Barba L, Hilbig A, Papoutsou S, Christensen T, Oltarzewski M, Virtanen S, Rehurkova I, Azpiri M, Sette S, Kersting M, Walkiewicz A, Serra‐Majem L, Volatier J‐L, Trolle E, Tornaritis M, Busk L, Kafatos A, Fabiansson S, De Henauw S and Van Klaveren JD, 2011. Dietary exposure assessments for children in Europe (the EXPOCHI project): rationale, methods and design. Archives of Public Health, 69, 4 10.1186/0778-7367-69-4 [DOI] [PMC free article] [PubMed] [Google Scholar]
- IARC (International Agency for Research on Cancer), 2016. Monograph Perfluorooctanoic acid. Available online: http://monographs.iarc.fr/ENG/Monographs/vol110/mono110-01.pdf
- Impinen A, Nygaard UC, Lødrup Carlsen KC, Mowinckel P, Carlsen KH, Haug LS and Granum B, 2018. Prenatal exposure to perfluoralkyl substances (PFASs) associated with respiratory tract infections but not allergy‐ and asthma‐related health outcomes in childhood. Environmental Research, 160, 518–523. 10.1016/j.envres.2017.10.012 [DOI] [PubMed] [Google Scholar]
- Ingelido AM, Marra V, Abballe A, Valentini S, Iacovella N, Barbieri P, Porpora MG, Domenico A and De Felip E, 2010. Perfluorooctanesulfonate and perfluorooctanoic acid exposures of the Italian general population. Chemosphere, 80, 1125–1130. 10.1016/j.chemosphere.2010.06.025 [DOI] [PubMed] [Google Scholar]
- Innes KE, Ducatman AM, Luster MI and Shankar A, 2011. Association of osteoarthritis with serum levels of the environmental contaminants perfluorooctanoate and perfluorooctane sulfonate in a large Appalachian population. American Journal of Epidemiology, 174, 440–450. 10.1093/aje/kwr107 [DOI] [PMC free article] [PubMed] [Google Scholar]
- Innes KE, Wimsatt JH, Frisbee S and Ducatman AM, 2014. Inverse association of colorectal cancer prevalence to serum levels of perfluorooctane sulfonate (PFOS) and perfluorooctanoate (PFOA) in a large Appalachian population. BMC Cancer, 14, 45 10.1186/1471-2407-14-45 [DOI] [PMC free article] [PubMed] [Google Scholar]
- Inoue K, Okada F, Ito R, Kato S, Sasaki S, Nakajima S, Uno A, Saijo Y, Sata F, Yoshimura Y, Kishi R and Nakazawa H, 2004. Perfluorooctane sulfonate (PFOS) and related perfluorinated compounds in human maternal and cord blood samples: assessment of PFOS exposure in a susceptible population during pregnancy. Environmental Health Perspectives, 112, 1204–1207. [DOI] [PMC free article] [PubMed] [Google Scholar]
- Ito Y, Yamanoshita O, Asaeda N, Tagawa Y, Lee CH, Aoyama T, Ichihara G, Furuhashi K, Kamijima M, Gonzalez FJ and Nakajima T, 2007. Di(2‐ethylhexyl)phthalate induces hepatic tumorigenesis through a peroxisome proliferator‐activated receptor alpha‐independent pathway. Journal of Occupational Health, 49, 172–182. [DOI] [PubMed] [Google Scholar]
- Jacquet N, Maire MA, Landkocz Y and Vasseur P, 2012a. Carcinogenic potency of perfluorooctane sulfonate (PFOS) on Syrian hamster embryo (SHE) cells. Archives of Toxicology, 86, 305–314. [DOI] [PubMed] [Google Scholar]
- Jacquet N, Maire MA, Rast C, Bonnard M and Vasseur P, 2012b. Perfluorooctanoic acid (PFOA) acts as a tumor promoter on Syrian hamster embryo (SHE) cells. Environmental Science and Pollution Research International, 19, 2537–2549. [DOI] [PubMed] [Google Scholar]
- Jahnke A and Berger U, 2009. Trace analysis of per‐ and polyfluorinated alkyl substances in various matrices—How do current methods perform? Journal of Chromatography A, 1216, 410–421. 10.1016/j.chroma.2008.08.098 [DOI] [PubMed] [Google Scholar]
- Jain RB, 2013. Association between thyroid profile and perfluoroalkyl acids: data from NHANES 2007–2008. Environmental Research, 126, 51–59. 10.1016/j.envres.2013.08.006 [DOI] [PubMed] [Google Scholar]
- Jain RB, 2014. Contribution of diet and other factors to the levels of selected polyfluorinated compounds: data from NHANES 2003–2008. International Journal of Hygiene and Environmental Health, 217, 52–61. 10.1016/j.ijheh.2013.03.008 [DOI] [PubMed] [Google Scholar]
- Jakobsson K, Kronholm Diab K, Lindh C, Persson B and Jönsson B, 2014. Exponering för perfluorerade ämnen (PFAS) i dricksvatten i Ronneby kommun. Available online: http://sodrasjukvardsregionen.se/download/exponering-for-perfluorerade-amnen-pfas-i-dricksvatten-i-ronneby-kommun/
- Jensen MS, Nørgaard‐Pedersen B, Toft G, Hougaard DM, Bonde JP, Cohen A, Thulstrup AM, Ivell R, Anand‐Ivell R, Lindh CH and Jönsson BA, 2012. Phthalates and perfluorooctanesulfonic acid in human amniotic fluid: temporal trends and timing of amniocentesis in pregnancy. Environmental Health Perspectives, 120, 897–903. 10.1289/ehp.1104522 [DOI] [PMC free article] [PubMed] [Google Scholar]
- Jensen TK, Andersen LB, Kyhl HB, Nielsen F, Christesen HT and Grandjean P, 2015. Association between perfluorinated compound exposure and miscarriage in Danish pregnant women. PLoS ONE, 10, e0123496 10.1371/journal.pone.0123496 [DOI] [PMC free article] [PubMed] [Google Scholar]
- Jeon TI and Osborne TF, 2012. SREBPs: metabolic integrators in physiology and metabolism. Trends in Endocrinology and Metabolism, 23, 65–72. [DOI] [PMC free article] [PubMed] [Google Scholar]
- Ji B, Bi Y, Simeone D, Mortensen RM and Logsdon CD, 2001. Human pancreatic acinar cells lack functional responses to cholecystokinin and gastrin. Gastroenterology, 121, 1380–1390. [DOI] [PubMed] [Google Scholar]
- Ji K, Kim S, Kho Y, Paek D, Sakong J, Ha J, Kim S and Choi K, 2012. Serum concentrations of major perfluorinated compounds among the general population in Korea: Dietary sources and potential impact on thyroid hormones. Environment International, 45, 78–85. 10.1016/j.envint.2012.03.007 [DOI] [PubMed] [Google Scholar]
- Jin H, Zhang Y, Jiang W, Zhu L and Martin JW, 2016. Isomer−specific distribution of perfluoroalkyl substances in blood. Environmental Science and Technology, 50, 7808–7815. 10.1021/acs.est.6b01698 [DOI] [PubMed] [Google Scholar]
- Joensen UN, Bossi R, Leffers H, Jensen AA, Skakkebæk NE and Jørgensen N, 2009. Do perfluoroalkyl compounds impair human semen quality? Environmental Health Perspectives, 117, 923–927. 10.1289/ehp.0800517 [DOI] [PMC free article] [PubMed] [Google Scholar]
- Joensen UN, Veyrand B, Antignac JP, Blomberg Jensen M, Petersen JH, Marchand P, Skakkebaek NE, Andersson AM, Le Bizec B and Jørgensen N, 2013. PFOS (perfluorooctanesulfonate) in serum is negatively associated with testosterone levels, but not with semen quality, in healthy men. Human Reproduction, 28, 599–608. 10.1093/humrep/des425 [DOI] [PubMed] [Google Scholar]
- Johansson N, Fredriksson A and Eriksson P, 2008. Neonatal exposure to perfluorooctane sulfonate (PFOS) and perfluorooctanoic acid (PFOA) causes neurobehavioural defects in adult mice. Neotoroxicology, 29, 160–169. [DOI] [PubMed] [Google Scholar]
- Johansson N, Eriksson P and Viberg H, 2009. Neonatal exposure to PFOS and PFOA in mice results in changes in proteins which are important for neuronal growth and synaptogenesis in the developing brain. Toxicological Science, 108, 412–418. 10.1093/toxsci/kfp029 [DOI] [PubMed] [Google Scholar]
- Johansson JH, Berger U, Vestergren R, Cousins IT, Bignert A, Glynn A and Darnerud PO, 2014. Temporal trends (1999‐2010) of perfluoroalkyl acids in commonly consumed food items. Environmental Pollution, 188, 102–108. [DOI] [PubMed] [Google Scholar]
- Jones PD, Hu W, De Coen W, Newsted JL and Giesy JP, 2003. Binding of perfluorinated. Fatty acids to serum proteins. Environmental Toxicology and Chemistry, 22, 2639–2649. [DOI] [PubMed] [Google Scholar]
- Jørgensen KT, Specht IO, Lenters V, Bach CC, Rylander L, Jönsson BAG, Lindh CH, Giwercman A, Heederik D, Toft G and Bonde JP, 2014. Perfluoroalkyl substances and time to pregnancy in couples from Greenland. Poland and Ukraine. Environmental Health, 13, 116 10.1186/1476-069X-13-116 [DOI] [PMC free article] [PubMed] [Google Scholar]
- Kang JS, Choi JS and Park JW, 2016. Transcriptional changes in steroidogenesis by perfluoroalkyl acids (PFOA and PFOS) regulate the synthesis of sex hormones in H295R cells. Chemosphere, 155, 436–443. [DOI] [PubMed] [Google Scholar]
- Kannan K, Corsolini S, Falandysz J, Fillmann G, Kumar KS, Loganathan BG, Mohd MA, Olivero J, Van Wouwe N, Yang JH and Aldoust KM, 2004. Perfluorooctanesulfonate and related fluorochemicals in human blood from several countries. Environmental Science and Technology, 38, 4489–4495. [DOI] [PubMed] [Google Scholar]
- Kannan K, Tao L, Sinclair E, Pastva SD, Jude DJ and Giesy JP, 2005. Perfluorinated compounds in aquatic organisms at various trophic levels in a Great Lakes food chain. Archives of Environmental Contamination and Toxicology, 48, 559–566. [DOI] [PubMed] [Google Scholar]
- Karlsen M, Grandjean P, Weihe P, Steuerwald U, Oulhote Y and Valvi D, 2017. Early‐life exposures to persistent organic pollutants in relation to overweight in preschool children. Reproductive Toxicology, 68, 145–153. 10.1016/j.reprotox.2016.08.002 [DOI] [PMC free article] [PubMed] [Google Scholar]
- Karnes C, Winquist A and Steenland K, 2014. Incidence of type II diabetes in a cohort with substantial exposure to perfluorooctanoic acid. Environmental Research, 128, 78–83. [DOI] [PubMed] [Google Scholar]
- Kärrman A, van Bavel B, Järnberg U, Hardell L and Lindström G, 2006. Perfluorinated chemicals in relation to other persistent organic pollutants in human blood. Chemosphere, 64, 1582–1591. 10.1016/j.chemosphere.2005.11.040 [DOI] [PubMed] [Google Scholar]
- Kärrman A, Ericson I, van Bavel B, Darnerud PO, Aune M, Glynn A, Lignell S and Lindström G, 2007. Exposure of perfluorinated chemicals through lactation: levels of matched human milk and serum and a temporal trend, 1996‐2004, in Sweden. Environmental Health Perspectives, 115, 226–230. 10.1289/ehp.9491 [DOI] [PMC free article] [PubMed] [Google Scholar]
- Kärrman A, Harada KH, Inoue K, Takasuga T, Ohi E and Koizumi A, 2009. Relationship between dietary exposure and serum perfluorochemical (PFC) levels ‐ A case study. Environmental International, 35, 712–717. [DOI] [PubMed] [Google Scholar]
- Kataria A, Trachtman H, Malaga‐Dieguez L and Trasande L, 2015. Association between perfluoroalkyl acids and kidney function in a cross‐sectional study of adolescents. Environmental Health, 14, 89 10.1186/s12940-015-0077-9 [DOI] [PMC free article] [PubMed] [Google Scholar]
- Kato K, Wong L‐Y, Chen A, Dunbar C, Webster GM, Lanphear BP and Calafat AM, 2014. Changes in serum concentrations of maternal poly‐ and perfluoroalkyl substances over the course of pregnancy and predictors of exposure in a multiethnic cohort of Cincinnati, Ohio pregnant women during 2003−2006. Environmental Science and Technology, 48, 9600–9608. 10.1021/es501811k [DOI] [PMC free article] [PubMed] [Google Scholar]
- Kato K, Ye X and Calafat AM, 2015. PFASs in the General Population In: De Wit CA. (ed.). Toxicological Effects of Perfluoroalkyl and Polyfluoroalkyl Substances. Series: Molecular and Integrative Toxicology. Springer International Publishing, Switzerland: pp. 51–76. [Google Scholar]
- Kato S, Itoh S, Yuasa M, Baba T, Miyashita C, Sasaki S, Nakajima S, Uno A, Nakazawa H, Iwasaki Y, Okada E and Kishi R, 2016. Association of PFASs exposure in utero with maternal and infant thyroid hormone levels in the Sapporo cohort of Hokkaido Study on the Environment and Children's Health. Environmental Health and Preventive Medicine, 21, 334–344. 10.1007/s12199-016-0534-2 [DOI] [PMC free article] [PubMed] [Google Scholar]
- Kawamoto K, Oashi T, Oami K, Liu W, Jin Y, Saito N, Sato I and Tsuda S, 2010. Perfluorooctanoic acid (PFOA) but not perfluorooctane sulfonate (PFOS) showed DNA damage in comet assay on Paramecium caudatum. Journal of Toxicological Sciences, 35, 835–841. [DOI] [PubMed] [Google Scholar]
- Kawamoto K, Sato I, Tsuda S, Yoshida M, Yaegashi K, Saito N, Liu W and Jin Y, 2011. Ultrasonic‐induced tonic convulsion in rats after subchronic exposure to perfluorooctane sulfonate (PFOS). Journal of Toxicological Sciences, 36, 55–62. [DOI] [PubMed] [Google Scholar]
- Kawashima Y, Kobayashi H, Miura H and Kozuka H, 1995. Characterization of hepatic responses of rat to administration of perfluorooctanoic and perfluorodecanoic acids at low levels. Toxicology, 99, 169–178. [DOI] [PubMed] [Google Scholar]
- Kelly BC, Ikonomou MG, Blair JD, Surridge B, Hoover D, Grace R and Gobas FAPC, 2009. Perfluoroalkyl Contaminants in an Arctic Marine Food Web: trophic Magnification and Wildlife Exposure. Environmental Science and Technology, 43, 4037–4043. [DOI] [PubMed] [Google Scholar]
- Kemper RA, 2003. Perfluorooctanoic acid: toxicokinetics in the rat. Association of Plastics Manufactures of Europe. Submitted to the U.S. Environmental Protection Agency's Administrative Record. AR226‐1499.
- Kemper RA and Nabb DL, 2005. In vitro studies in microsomes from rat and human liver, kidney, and intestine suggest that perfluorooctanoic acid is not a substrate for microsomal UDP‐glucuronosyltransferases. Drug and Chemical Toxicology, 28, 281–287. 10.1081/DCT-200064468 [DOI] [PubMed] [Google Scholar]
- Kerger BD, Copeland TL and DeCaprio AP, 2011. Tenuous dose‐response correlations for common disease states: case study of cholesterol and perfluorooctanoate/sulfonate (PFOA/PFOS) in the C8 Health Project. Drug and Chemical Toxicology, 34, 396–404. 10.3109/01480545.2011.582502 [DOI] [PubMed] [Google Scholar]
- Kersten S and Stienstra R, 2017. The role and regulation of the peroxisome proliferator activated receptor alpha in human liver. Biochimie, 136, 75–84. 10.1016/j.biochi.2016.12.019 [DOI] [PubMed] [Google Scholar]
- Kerstner‐Wood C, Coward L and Gorman G, 2003. Protein binding of perfluorohexane sulfonate, ‐perfluorooctane sulfonate and perfluorooctanoate to plasma (human, rat, and monkey), and varioushuman‐derived plasma protein fractions. Southern Research Institute.
- Khalil N, Chen A, Lee M, Czerwinski SA, Ebert JR, DeWitt JC and Kannan K, 2016. Association of perfluoroalkyl substances, bone mineral density, and osteoporosis in the U.S. population in NHANES 2009‐2010. Environmental Health Perspectives, 124, 81–87. 10.1289/ehp.1307909 [DOI] [PMC free article] [PubMed] [Google Scholar]
- Kielsen K, Shamim Z, Ryder LP, Nielsen F, Grandjean P, Budtz‐Jørgensen E and Heilmann C, 2016. Antibody response to booster vaccination with tetanus and diphtheria in adults exposed to perfluorinated alkylates. Journal of Immunotoxicology, 13, 270–273. 10.3109/1547691X.2015.1067259 [DOI] [PMC free article] [PubMed] [Google Scholar]
- Kim SK, Lee KT, Kang CS, Tao L, Kannan K, Kim KR, Kim CK, Lee JS, Park PS, Yoo YW, Ha JY, Shin YS and Lee JH, 2011a. Distribution of perfluorochemicals between sera and milk from the same mothers and implications for prenatal and postnatal exposures. Environmental Pollution, 159, 169–174. [DOI] [PubMed] [Google Scholar]
- Kim HS, Jun Kwack S, Sik Han E, Seok Kang T, Hee Kim S and Young Han S, 2011b. Induction of apoptosis and CYP4A1 expression in Sprague‐Dawley rats exposed to low doses of perfluorooctane sulfonate. Journal of Toxicological Sciences, 36, 201–210. [DOI] [PubMed] [Google Scholar]
- Kim D‐H, Lee M‐Y and Oh J‐E, 2014. Perfluorinated compounds in serum and urine samples from children aged 5–13 years in South Korea. Environmental Pollution, 192, 171–178. 10.1016/j.envpol.2014.05.024 [DOI] [PubMed] [Google Scholar]
- Kim DH, Kim UJ, Kim HY, Choi SD and Oh JE, 2016. Perfluoroalkyl substances in serum from South Korean infants with congenital hypothyroidism and healthy infants – Its relationship with thyroid hormones. Environmental Research, 147, 399–404. 10.1016/j.envres.2016.02.037 [DOI] [PubMed] [Google Scholar]
- Kissa E, 2001. Fluorinated surfactants and repellents, 2nd Edition. Surfactant Science Series, Volume 97. Marcel Dekker Inc., New York, 623 pp. ISBN: 0‐8247‐0472‐X. [Google Scholar]
- Klenow S, Heinemeyer G, Brambilla G, Dellatte E, Herzke D and de Voogt P, 2013. Dietary exposure to selected perfluoroalkyl acids (PFAAs) in four European regions. Food Additives & Contaminants: Part A, 30, 2141–2151. [DOI] [PubMed] [Google Scholar]
- Knox SS, Jackson T, Javins B, Frisbee SJ, Shankar A and Ducatman AM, 2011a. Implications of early menopause in women exposed to perfluorocarbons. Journal of Clinical Endocrinology and Metabolism, 96, 1747–1753. 10.1210/jc.2010-2401 [DOI] [PMC free article] [PubMed] [Google Scholar]
- Knox SS, Jackson T, Frisbee SJ, Javins B and Ducatman AM, 2011b. Perfluorocarbon exposure, gender and thyroid function in the C8 Health Project. Journal of Toxicological Sciences, 36, 403–410. [DOI] [PubMed] [Google Scholar]
- Kobayashi S, Azumi K, Goudarzi H, Araki A, Miyashita C, Kobayashi S, Itoh S, Sasaki S, Ishizuka M, Nakazawa H, Ikeno T and Kishi R, 2017. Effects of prenatal perfluoroalkyl acid exposure on cord blood IGF2/H19 methylation and ponderal index: The Hokkaido Study. Journal of Exposure Science and Environmental Epidemiology, 27, 251–259. 10.1038/jes.2016.50 [DOI] [PubMed] [Google Scholar]
- Koskela A, Finnilä MA, Korkalainen M, Spulber S, Koponen J, Håkansson H, Tuukkanen J and Viluksela M, 2016. Effects of developmental exposure to perfluorooctanoic acid (PFOA) on long bone morphology and bone cell differentiation. Toxicology and Applied Pharmacology, 301, 14–21. 10.1016/j.taap.2016.04.002 [DOI] [PubMed] [Google Scholar]
- Kotthoff M, Muller J, Jürling H, Schlummer M and Fiedler D, 2015. Perfluoroalkyl and polyfluoroalkyl substances in consumer products. Environmental Science and Pollution Research International, 22, 14546–14559. 10.1007/s11356-015-4202-7 [DOI] [PMC free article] [PubMed] [Google Scholar]
- Koustas E, Lam J, Sutton P, Johnson PI, Atchley DS, Sen S, Robinson KA, Axelrad DA and Woodruff TJ, 2014. The Navigation Guide—evidence‐based medicine meets environmental health: systematic review of nonhuman evidence for PFOA effects on fetal growth. Environmental Health Perspectives, 122, 1015–1027; 10.1289/ehp.1307177 [DOI] [PMC free article] [PubMed] [Google Scholar]
- Kowalczyk J, Ehlers S, Fürst P, Schafft H and Lahrssen‐Wiederholt M, 2012. Transfer of perfluoroctanoic acid (PFOA) and perfluorooctane sulfonate (PFOS) from contaminated feed into milk and meat of sheep: pilot study. Archives of Environmental Contamination and Toxicology, 63, 288–298. 10.1007/s00244-012-9759-2 [DOI] [PubMed] [Google Scholar]
- Kowalczyk J, Ehlers S, Oberhausen A, Tischer M, Fürst P, Schafft H and Lahrssen‐Wiederholt M, 2013. Absorption, distribution, and milk secretion of the perfluoroalkyl acids PFBS, PFHxS, PFOS, and PFOA by dairy cows fed naturally contaminated feed. Journal of Agricultural and Food Chemistry, 61, 2903–2912. 10.1021/jf304680j [DOI] [PubMed] [Google Scholar]
- Kratzer J, Ahrens L, Roos A, Bäcklin B‐M and Ebinghaus R, 2011. Temporal trends of polyfluoroalkyl compounds (PFCs) in liver tissue of grey seals (Halichoerus grypus) from the Baltic Sea, 1974–2008. Chemosphere, 85, 253–261. [DOI] [PubMed] [Google Scholar]
- Kraugerud M, Zimmer KE, Ropstad E and Verhaegen S, 2011. Perfluorinated compounds differentially affect steroidogenesis and viability in the human adrenocortical carcinoma (H295R) in vitro cell assay. Toxicology Letters, 205, 62–68. 10.1016/j.toxlet.2011.05.230 [DOI] [PubMed] [Google Scholar]
- Kristensen SL, Ramlau‐Hansen CH, Ernst E, Olsen SF, Bonde JP, Vested A, Halldorsson TI, Becher G, Haug LS and Toft G, 2013. Long‐term effects of prenatal exposure to perfluoroalkyl substances on female reproduction. Human Reproduction, 28, 3337–3348. 10.1093/humrep/det382 [DOI] [PubMed] [Google Scholar]
- Kudo N, Sakai A, Mitsumoto A, Hibino Y, Tsuda T and Kawashima Y, 2007. Tissue distribution and hepatic subcellular distribution of perfluorooctanoic acid at low dose are different from those at high dose in rats. Biological and Pharmaceutical Bulletin, 30, 1535–1540. [DOI] [PubMed] [Google Scholar]
- Kwon EJ, Shin JS, Kim BM, Shah‐Kulkarni S, Park H, Kho YL, Park EA, Kim YJ and Ha EH, 2016. Prenatal Exposure to Perfluorinated Compounds Affects Birth Weight Through GSTM1 Polymorphism. Journal of Occupational and Environmental Medicine, 58, e198–e205. 10.1097/JOM.0000000000000739 [DOI] [PubMed] [Google Scholar]
- Lacina O, Hradkova P, Pulkrabova J and Hajslova J, 2011. Simple, high throughput ultra‐high performance liquid chromatography/tandem mass spectrometry trace analysis of perfluorinated alkylated substances in food of animal origin: Milk and fish. Journal of Chromatography A, 1218, 4312–4321. [DOI] [PubMed] [Google Scholar]
- Laden F, Neas LM, Spiegelman D, Hankinson SE, Willett WC, Ireland K, Wolff MS and Hunter DJ, 1999. Predictors of plasma concentrations of DDE and PCBs in a group of U.S. women. Environmental Health Perspectives, 107, 75–81. [DOI] [PMC free article] [PubMed] [Google Scholar]
- Lam J, Koustas E, Sutton P, Johnson PI, Atchley DS, Sen S, Robinson KA, Axelrad DA and Woodruff TJ, 2014. The Navigation Guide – evidence‐based medicine meets environmental health: integration of animal and human evidence for PFOA effects on fetal growth. Environmental Health Perspectives, 122, 1040–1051. 10.1289/ehp.1307923 [DOI] [PMC free article] [PubMed] [Google Scholar]
- Lashgari M and Lee HK, 2016. Micro‐solid phase extraction of perfluorinated carboxylic acids from human plasma. Journal of Chromatography A, 1432, 7–16. [DOI] [PubMed] [Google Scholar]
- Lau C, Butenhoff JL and Rogers JM, 2004. The developmental toxicity of perfluoroalkyl acids and their derivatives. Toxicology and Applied Pharmacology, 198, 231–241. [DOI] [PubMed] [Google Scholar]
- Lau C, Thibodeaux JR, Hanson RG, Narotsky MG, Rogers JM, Lindstrom AB and Strynar ML, 2006. Effects of perfluorooctanoic acid exposure during pregnancy in the mouse. Toxicological Sciences, 90, 510–518. [DOI] [PubMed] [Google Scholar]
- Lauritzen HB, Larose TL, Øien T, Ødland JO, van de Bor M, Jacobsen GW and Sandanger TM, 2016. Factors associated with maternal serum levels of perfluoroalkyl substances and organochlorines: a descriptive study of parous women in Norway and Sweden. PLoS ONE, 11, e0166127 10.1371/journal.pone.0166127 [DOI] [PMC free article] [PubMed] [Google Scholar]
- Lauritzen HB, Larose TL, Øien T, Sandanger TM, Ødland JO, van de Bor M and Jacobsen GW, 2017. Maternal serum levels of perfluoroalkyl substances and organochlorines and indices of fetal growth: a Scandinavian case–cohort study. Pediatric Research, 81, 33–42. [DOI] [PMC free article] [PubMed] [Google Scholar]
- Lee CK, Kang SG, Lee JT, Lee SW, Kim JH, Kim DH, Son BC, Kim KH, Suh CH, Kim SY and Park YB, 2015. Effects of perfluorooctane sulfuric acid on placental PRL‐family hormone production and fetal growth retardation in mice. Molecular and Cellular Endocrinology, 401, 165–172. 10.1016/j.mce.2014.10.026 [DOI] [PubMed] [Google Scholar]
- Lee ES, Han S and Oh JE, 2016. Association between perfluorinated compound concentrations in cord serum and birth weight using multiple regression models. Reproductive Toxicology, 59, 53–59. [DOI] [PubMed] [Google Scholar]
- Lefebvre DE, Curran I, Armstrong C, Coady L, Parenteau M, Liston V, Barker M, Aziz S, Rutherford K, Bellon‐Gagnon P, Shenton J, Mehta R and Bondy G, 2008. Immunomodulatory Effects of Dietary Potassium Perfluorooctane Sulfonate (PFOS) Exposure in Adult Sprague‐Dawley Rats. Journal of Toxicology and Environmental Health‐Part A‐Current Issues, 71, 1516–1525. [DOI] [PubMed] [Google Scholar]
- Lenters V, Portengen L, Rignell‐Hydbom A, Jönsson BA, Lindh CH, Piersma AH, Toft G, Bonde JP, Heederik D, Rylander L and Vermeulen R, 2016. Prenatal Phthalate, Perfluoroalkyl Acid, and Organochlorine Exposures and Term Birth Weight in Three Birth Cohorts: Multi‐Pollutant Models Based on Elastic Net Regression. Environmental Health Perspectives, 124, 365–372. 10.1289/ehp.1408933 [DOI] [PMC free article] [PubMed] [Google Scholar]
- Lewington S, Whitlock G, Clarke R, Sherliker P, Emberson J, Halsey J, Qizilbash N, Peto R and Collins R and Prospective Studies Collaboration, 2007. Blood cholesterol and vascular mortality by age, sex, and blood pressure: a meta‐analysis of individual data from 61 prospective studies with 55,000 vascular deaths. Lancet, 370, 1829–1839. [DOI] [PubMed] [Google Scholar]
- Lewis RC, Johns LE and Meeker JD, 2015. Serum biomarkers of exposure to perfluoroalkyl substances in relation to serum testosterone and measures of thyroid function among adults and adolescents from NHANES 2011‐2012. International Journal of Environmental Research and Public Health, 12, 6098–6114. 10.3390/ijerph120606098 [DOI] [PMC free article] [PubMed] [Google Scholar]
- Li K, Gao P, Xiang P, Zhang X, Cui X and Ma LQ, 2017. Molecular mechanisms of PFOA‐induced toxicity in animals and humans: Implications for health risks. Environment International, 99, 43–54. 10.1016/j.envint.2016.11.014 [DOI] [PubMed] [Google Scholar]
- Li Y, Ramdhan DH, Naito H, Yamagishi N, Ito Y, Hayashi Y, Yanagiba Y, Okamura A, Tamada H, Gonzalez FJ and Nakajima T, 2011. Ammonium perfluorooctanoate may cause testosterone reduction by adversely affecting testis in relation to PPARα. Toxicology Letters, 205, 265–272. 10.1016/j.toxlet.2011.06.015 [DOI] [PMC free article] [PubMed] [Google Scholar]
- Li J, Guo F, Wang Y, Zhang J, Zhong Y, Zhao Y and Wu Y, 2013. Can nail, hair and urine be used for biomonitoring of human exposure to perfluorooctane sulfonate and perfluorooctanoic acid? Environment International, 53, 47–52. 10.1016/j.envint.2012.12.002 [DOI] [PubMed] [Google Scholar]
- Li Y, Fletcher T, Mucs D, Scott K, Lindh CH, Tallving P and Jakobsson K, 2018. Half‐lives of PFOS, PFHxS and PFOA after end of exposure to contaminated drinking water. Occupational and Environmental Medicine, 75, 46–51. 10.1136/oemed-2017-104651 [DOI] [PMC free article] [PubMed] [Google Scholar]
- Lien GW, Huang CC, Shiu JS, Chen MH, Hsieh WS, Guo YL and Chen PC, 2016. Perfluoroalkyl substances in cord blood and attention deficit/hyperactivity disorder symptoms in seven‐year‐old children. Chemosphere, 156, 118–127. 10.1016/j.chemosphere.2016.04.102 [DOI] [PubMed] [Google Scholar]
- Liew Z, Ritz B, Bonefeld‐Jørgensen EC, Henriksen TB, Nohr EA, Bech BH, Fei C, Bossi R, von Ehrenstein OS, Streja E, Uldall P and Olsen J, 2014. Prenatal exposure to perfluoroalkyl substances and the risk of congenital cerebral palsy in children. American Journal of Epidemiology, 180, 574–581. 10.1093/aje/kwu179 [DOI] [PubMed] [Google Scholar]
- Liew Z, Ritz B, von Ehrenstein OS, Bech BH, Nohr EA, Fei C, Bossi R, Henriksen TB, Bonefeld‐Jørgensen EC and Olsen J, 2015. Attention deficit/hyperactivity disorder and childhood autism in association with prenatal exposure to perfluoroalkyl substances: a nested case‐control study in the Danish National Birth Cohort. Environmental Health Perspectives, 123, 367–373. 10.1289/ehp.1408412 [DOI] [PMC free article] [PubMed] [Google Scholar]
- Lin CY, Chen PC, Lin YC and Lin LY, 2009. Association among serum perfluoroalkyl chemicals, glucose homeostasis, and metabolic syndrome in adolescents and adults. Diabetes Care, 32, 702–707. 10.2337/dc08-1816 [DOI] [PMC free article] [PubMed] [Google Scholar]
- Lin CY, Lin LY, Chiang CK, Wang WJ, Su YN, Hung KY and Chen PC, 2010. Investigation of the associations between low‐dose serum perfluorinated chemicals and liver enzymes in US adults. American Journal of Gastroenterology, 105, 1354–1363. 10.1038/ajg.2009.707 [DOI] [PubMed] [Google Scholar]
- Lin CY, Wen LL, Lin LY, Wen TW, Lien GW, Chen CY, Hsu SH, Chien KL, Sung FC, Chen PC and Su TC, 2011. Associations between levels of serum perfluorinated chemicals and adiponectin in a young hypertension cohort in Taiwan. Environmental Science and Technology, 45, 10691–10698. 10.1021/es201964x [DOI] [PubMed] [Google Scholar]
- Lin CY, Wen LL, Lin LY, Wen TW, Lien GW, Hsu SH, Chien KL, Liao CC, Sung FC, Chen PC and Su TC, 2013a. The associations between serum perfluorinated chemicals and thyroid function in adolescents and young adults. Journal of Hazardous Materials, 244–245, 637–644. 10.1016/j.jhazmat.2012.10.049 [DOI] [PubMed] [Google Scholar]
- Lin C‐Y, Lin L‐Y, Wen T‐W, Lien G‐W, Chien K‐L, Hsu SHJ, Liao C‐C, Sung F‐C, Chen P‐C and Su T‐C, 2013b. Association between levels of serum perfluorooctane sulfate and carotid artery intima–media thickness in adolescents and young adults. International Journal of Cardiology, 168, 3309–3316. 10.1016/j.ijcard.2013.04.042 [DOI] [PubMed] [Google Scholar]
- Lin LY, Wen LL, Su TC, Chen PC and Lin CY, 2014. Negative association between serum perfluorooctane sulfate concentration and bone mineral density in US premenopausal women: NHANES, 2005‐2008. Journal of Clinical Endocrinology and Metabolism, 99, 2173–2180. 10.1210/jc.2013-3409 [DOI] [PubMed] [Google Scholar]
- Lin CY, Chen PC, Lo SC, Torng PL, Sung FC and Su TC, 2016. The association of carotid intima‐media thickness with serum Level of perfluorinated chemicals and endothelium‐platelet microparticles in adolescents and young adults. Environment International, 94, 292–299. 10.1016/j.envint.2016.06.004 [DOI] [PubMed] [Google Scholar]
- Lind L, Zethelius B, Salihovic S, van Bavel B and Lind PM, 2014. Circulating levels of perfluoroalkyl substances and prevalent diabetes in the elderly. Diabetologia, 57, 473–479. [DOI] [PubMed] [Google Scholar]
- Lind PM, Salihovic S, van Bavel B and Lind L, 2017. Circulating levels of perfluoroalkyl substances (PFASs) and carotid artery Atherosclerosis. Environmental Research, 152, 157–164. 10.1016/j.envres.2016.10.002 [DOI] [PubMed] [Google Scholar]
- Lindström G, Kärrman A and Van Bavel B, 2008. Accuracy and precision in the determination of perfluorinated chemicals in human blood verified by interlaboratory comparisons. Journal of Chromatography A, 1216, 394–400. [DOI] [PubMed] [Google Scholar]
- Liu RCM, Hurtt ME, Cook JC and Biegel LB, 1996. Effect of the peroxisome proliferator, ammonium perfluorooctanoate (C8), on hepatic aromatase activity in adult male Crl:CD BR (CD) rats. Fundamental and Applied Toxicology, 30, 220–228. [DOI] [PubMed] [Google Scholar]
- Liu X, Liu W, Jin Y, Yu W, Liu L and Yu H, 2010a. Effects of subchronic perfluorooctane sulfonate exposure of rats on calcium‐dependent signaling molecules in the brain tissue. Archives of Toxicology, 84, 471–479. 10.1007/s00204-010-0517-9 [DOI] [PubMed] [Google Scholar]
- Liu X, Liu W, Jin Y, Yu W, Wang F and Liu L, 2010b. Effect of gestational and lactational exposure to perfluorooctanesulfonate on calcium‐dependent signaling molecules gene expression in rats’ hippocampus. Archives of Toxicology, 84, 71–79. 10.1007/s00204-009-0467-2 [DOI] [PubMed] [Google Scholar]
- Liu J, Li J, Liu Y, Chan HM, Zhao Y, Cai Z and Wu Y, 2011. Comparison on gestation and lactation exposure of perfluorinated compounds for newborns. Environment International, 37, 1206–1212. 10.1016/j.envint.2011.05.001 [DOI] [PubMed] [Google Scholar]
- Liu X, Guo Z, Krebs KA, Pope RH and Roache NF, 2014a. Concentrations and trends of perfluorinated chemicals in potential indoor sources from 2007 through 2011 in the US. Chemosphere, 98, 51–57. 10.1016/j.chemosphere.2013.10.001 [DOI] [PubMed] [Google Scholar]
- Liu C, Chang VWC, Gin KYH and Nguyen VT, 2014b. Genotoxicity of perfluorinated chemicals (PFCs) to the green mussel (Perna viridis). Science of the Total Environment, 487, 117–122. [DOI] [PubMed] [Google Scholar]
- Liu Y, Pereira AS, Beesoon S, Vestergren R, Berger U, Olsen GW, Glynn A and Martin JW, 2015. Temporal trends of perfluorooctanesulfonate isomer and enantiomer patterns in archived Swedish and American serum samples. Environment International, 75, 215–222. 10.1016/j.envint.2014.11.014 [DOI] [PubMed] [Google Scholar]
- Loccisano AE, Campbell JL Jr, Andersen ME and Clewell HJ, 2011. Evaluation and prediction of pharmacokinetics of PFOA and PFOS in the monkey and human using a PBPK model. Regulatory Toxicology and Pharmacology, 59, 157–175. 10.1016/j.yrtph.2010.12.004 [DOI] [PubMed] [Google Scholar]
- Loccisano AE, Campbell JL Jr, Butenhoff JL, Andersen ME and Clewell HJ 3rd, 2012. Evaluation of placental and lactational pharmacokinetics of PFOA and PFOS in the pregnant, lactating, fetal and neonatal rat using a physiologically based pharmacokinetic model. Reproductive Toxicology, 33, 468–490. 10.1016/j.reprotox.2011.07.003 [DOI] [PubMed] [Google Scholar]
- Loccisano AE, Longnecker MP, Campbell JLJr, Andersen ME and Clewell HJ, 2013. Development of PBPK models for PFOA and PFOS for human pregnancy and lactation life stages. Journal of Toxicology and Environmental Health. Part A, 76, 25–57. 10.1080/15287394.2012.722523 [DOI] [PMC free article] [PubMed] [Google Scholar]
- Löfstedt Gilljam J, Leonel J, Cousins IT and benskin JP, 2016. Is Ongoing Sulfluramid Use in South America a Significant Source of Perfluorooctanesulfonate (PFOS)? Production Inventories, Environmental Fate, and Local Occurrence. Environmental Science and Technology, 50, 653–659. [DOI] [PubMed] [Google Scholar]
- Long Y, Wang Y, Ji G, Yan L, Hu F and Gu A, 2013a. Neurotoxicity of perfluorooctane sulfonate to hippocampal cells in adult mice. PLoS ONE, 8, e54176. [DOI] [PMC free article] [PubMed] [Google Scholar]
- Long M, Ghisari M and Bonefeld‐Jørgensen EC, 2013b. Effects of perfluoroalkyl acids on the function of the thyroid hormone and the aryl hydrocarbon receptor. Environmental Science and Pollution Research International, 20, 8045–8056. 10.1007/s11356-013-1628-7 [DOI] [PubMed] [Google Scholar]
- Long M, Knudsen AK, Pedersen HS and Bonefeld‐Jørgensen EC, 2015. Food intake and serum persistent organic pollutants in the Greenlandic pregnant women: The ACCEPT sub‐study. Science of the Total Environment, 529, 198–212. 10.1016/j.scitotenv.2015.05.022 [DOI] [PubMed] [Google Scholar]
- Longnecker MP, Smith CS, Kissling GE, Hoppin JA, Butenhoff JL, Decker E, Ehresman DJ, Ellefson ME, Flaherty J, Gardner MS, Langlois E, LeBlanc A, Lindstrom AB, Reagen WK, Strynar MJ and Studabaker WB, 2008. An interlaboratory study of perfluorinated alkyl compound levels in human plasma. An interlaboratory study of perfluorinated alkyl compound levels in human plasma. Environmental Research, 107, 152–159. [DOI] [PMC free article] [PubMed] [Google Scholar]
- Looker C, Luster MI, Calafat AM, Johnson VJ, Burleson GR, Burleson FG and Fletcher T, 2014. Influenza vaccine response in adults exposed to perfluorooctanoate and perfluorooctanesulfonate. Toxicological Sciences, 138, 76–88. 10.1093/toxsci/kft269 [DOI] [PMC free article] [PubMed] [Google Scholar]
- Loos R, Gawlik B, Locoro G, Rimaviciute E, Contini S and Bidoglio G, 2009. EU‐wide survey of polar organic persistent pollutants in European river waters. Environmental Pollution, 157, 561–568. [DOI] [PubMed] [Google Scholar]
- Loos R, Locoro G and Contini S, 2010. Occurrence of polar organic contaminants in the dissolved water phase of the Danube River and its major tributaries using SPE‐LC‐MS2 analysis. Water Research, 44, 2325–2335. [DOI] [PubMed] [Google Scholar]
- Lopez‐Espinosa MJ, Fletcher T, Armstrong B, Genser B, Dhatariya K, Mondal D, Ducatman A and Leonardi G, 2011. Association of Perfluorooctanoic Acid (PFOA) and Perfluorooctane Sulfonate (PFOS) with age of puberty among children living near a chemical plant. Environmental Science and Technology, 45, 8160–8166. 10.1021/es1038694 [DOI] [PubMed] [Google Scholar]
- Lopez‐Espinosa MJ, Mondal D, Armstrong B, Bloom MS and Fletcher T, 2012. Thyroid function and perfluoroalkyl acids in children living near a chemical plant. Environmental Health Perspectives, 120, 1036–1041. 10.1289/ehp.1104370 [DOI] [PMC free article] [PubMed] [Google Scholar]
- Lopez‐Espinosa MJ, Mondal D, Armstrong BG, Eskenazi B and Fletcher T, 2016. Perfluoroalkyl substances, sex hormones, and insulin‐like growth factor‐1 at 6‐9 years of age: a cross‐sectional analysis within the C8 health project. Environmental Health Perspectives, 124, 1269–1275. 10.1289/ehp.1509869 [DOI] [PMC free article] [PubMed] [Google Scholar]
- Louis GM, Peterson CM, Chen Z, Hediger ML, Croughan MS, Sundaram R, Stanford JB, Fujimoto VY, Varner MW, Giudice LC, Kennedy A, Sun L, Wu Q and Kannan K, 2012. Perfluorochemicals and endometriosis: the ENDO study. Epidemiology, 23, 799–805. 10.1097/EDE.0b013e31826cc0cf [DOI] [PMC free article] [PubMed] [Google Scholar]
- Louis GM, Chen Z, Schisterman EF, Kim S, Sweeney AM, Sundaram R, Lynch CD, Gore‐Langton RE and Barr DB, 2015. Perfluorochemicals and human semen quality: the LIFE study. Environmental Health Perspectives, 123, 57–63. 10.1289/ehp.1307621 [DOI] [PMC free article] [PubMed] [Google Scholar]
- Loveless SE, Hoban D, Sykes G, Frame SR and Everds NE, 2008. Evaluation of the immune system in rats and mice administered linear ammonium perfluorooctanoate. Toxicological Sciences, 105, 86–96. [DOI] [PubMed] [Google Scholar]
- Luebker DJ, Hansen KJ, Bass NM, Butenhoff JL and Seacat AM, 2002. Interactions of fluorochemicals with rat liver fatty acid‐binding protein. Toxicology, 176, 175–185. 10.1016/S0300-483X(02)00081-1 [DOI] [PubMed] [Google Scholar]
- Luebker DJ, Case MT, York RG, Moore JA, Hansen KJ and Butenhoff JL, 2005. Two‐generation reproduction and cross‐foster studies of perfluorooctanesulfonate (PFOS) in rats. Toxicology, 215, 126–148. [DOI] [PubMed] [Google Scholar]
- Lundin JI, Alexander BH, Olsen GW and Church TR, 2009. Ammonium perfluorooctanoate production and occupational mortality. Epidemiology, 20, 921–928. 10.1097/EDE.0b013e3181b5f395 [DOI] [PubMed] [Google Scholar]
- Luo Z, Shi X, Hu Q, Zhao B and Huang M, 2012. Structural evidence of perfluorooctane sulfonate transport by human serum albumin. Chemical Research in Toxicology, 25, 990–992. 10.1021/tx300112p [DOI] [PubMed] [Google Scholar]
- Luster MI, Portier C, Pait DG, Rosenthal GJ, Germolec DR, Corsini E, Blaylock BL, Pollock P, Kouchi Y, Craig W, White KL, Munson AE and Comment CE, 1993. Risk assessment in immunotoxicology. II. Relationships between immune and host resistance tests. Fundamental and Applied Toxicology, 21, 71–82. [DOI] [PubMed] [Google Scholar]
- Lv Q‐Y, Wan B, Guo L‐H, Yang Y, Ren X‐M and Zhang H, 2015. In vivo immunotoxicity of perfluorooctane sulfonate in BALB/c mice: Identification of T‐cell receptor and calcium‐mediated signaling pathway disruption through gene expression profiling of the spleen. Chemico‐Biological Interactions, 240, 84–93. 10.1016/j.cbi.2015.07.015 [DOI] [PubMed] [Google Scholar]
- Lyngsø J, Ramlau‐Hansen CH, Høyer BB, Støvring H, Bonde JP, Jönsson BA, Lindh CH, Pedersen HS, Ludwicki JK, Zviezdai V and Toft G, 2014. Menstrual cycle characteristics in fertile women from Greenland, Poland and Ukraine exposed to perfluorinated chemicals: a cross‐sectional study. Human Reproduction, 29, 359–367. 10.1093/humrep/det390 [DOI] [PubMed] [Google Scholar]
- Lyu X‐J, Li W‐W, Lam PKS and Yu H‐Q, 2015. Boiling significantly promotes photodegradation of perfluorooctane sulfonate. Chemosphere, 138, 324–327. [DOI] [PubMed] [Google Scholar]
- Macey R, Oster G and Zahnley T, 2000. Berkeley‐Madonna. University of California, Department of Cellular and Molecular Biology, Berkeley, CA. [Google Scholar]
- MacNeil J, Steenland NK, Shankar A and Ducatman A, 2009. A cross‐sectional analysis of type II diabetes in a community with exposure to perfluorooctanoic acid (PFOA). Environmental Research, 109, 997–1003. [DOI] [PubMed] [Google Scholar]
- Macon MB, Villanueva LR, Tatum‐Gibbs K, Zehr RD, Strynar MJ, Stanko JP, White SS, Helfant L and Fenton SE, 2011. Prenatal perfluorooctanoic acid exposure in CD‐1 mice: Low‐dose developmental effects and internal dosimetry. Toxicological Sciences, 122, 134–145. [DOI] [PMC free article] [PubMed] [Google Scholar]
- Maestri L, Negri S, Ferrari M, Ghittori S, Fabris F, Danesino P and Imbriani M, 2006. Determination of perfluorooctanoic acid and perfluorooctanesulfonate in human tissues by liquid chromatography/single quadrupole mass spectrometry. Rapid Communications in Mass Spectrometry, 20, 2728–2734. 10.1002/rcm.2661 [DOI] [PubMed] [Google Scholar]
- Maisonet M, Terrell ML, McGeehin MA, Christensen KY, Holmes A, Calafat AM and Marcus M, 2012. Maternal concentrations of polyfluoroalkyl compounds during pregnancy and fetal and postnatal growth in British girls. Environmental Health Perspectives, 120, 1432–1437. [DOI] [PMC free article] [PubMed] [Google Scholar]
- Maisonet M, Näyhä S, Lawlor DA and Marcus M, 2015. Prenatal exposure to perfluoroalkyl acids and serum lipids at ages 7 and 15 in females. Environment International, 82, 49–60. [DOI] [PubMed] [Google Scholar]
- Mallet CR, Lu Z and Mazzeo JR, 2004. A study of ion suppression effects in electrospray ionization from mobile phase additives and solid‐phase extracts. Rapid Communications in Mass Spectrometry, 18, 49–58. 10.1002/rcm.1276 [DOI] [PubMed] [Google Scholar]
- Manzano‐Salgado CB, Casas M, Lopez‐Espinosa MJ, Ballester F, Basterrechea M, Grimalt JO, Jiménez AM, Kraus T, Schettgen T, Sunyer J and Vrijheid M, 2015. Transfer of perfluoroalkyl substances from mother to fetus in a Spanish birth cohort. Environmental Research, 142, 471–478. 10.1016/j.envres.2015.07.020 [DOI] [PubMed] [Google Scholar]
- Martin JW, Mabury SA, Solomon KR and Muir DCG, 2003a. Dietary Accumulation of Perfluorinated Acids in Juvenile Rainbow Trout (Oncorhynchus Mykiss). Environmental Toxicology and Chemistry, 22, 189–195. [PubMed] [Google Scholar]
- Martin JW, Mabury SA, Solomon KR and Muir DCG, 2003b. Bioconcentration and Tissue Distribution of Perfluorinated Acids in Rainbow Trout (Oncorhynchus Mykiss). Environmental Toxicology and Chemistry, 22, 196–204. [PubMed] [Google Scholar]
- Martin JW, Kannan K, Berger U, de Voogt P, Field J, Franklin J, Giesy JP, Harner T, Muir DC, Scott B, Kaiser M, Jarnberg U, Jones KC, Mabury SA, Schroeder H, Simcik M, Sottani C, van Bavel B, Karrman A, Lindstrom G and van Leeuwen S, 2004. Analytical challenges hamper perfluoroalkyl research. Environmental Science and Technology, 38, 248a–255a. [DOI] [PubMed] [Google Scholar]
- Martin JW, Asher BJ, Beesoon S, Benskin JP and Ross MS, 2010. PFOS or PreFOS? Are perfluorooctane sulfonate precursors (PreFOS) important determinants of human and environmental perfluorooctane sulfonate (PFOS) exposure? Journal of Environmental Monitoring, 12, 1979–2004. 10.1039/c0em00295j [DOI] [PubMed] [Google Scholar]
- Martinson HA, Lyons TR, Giles ED, Borges VF and Schedin P, 2013. Developmental windows of breast cancer risk provide opportunities for targeted chemoprevention. Experimental Cell Research, 319, 1671–1678. 10.1016/j.yexcr.2013.04.018 [DOI] [PMC free article] [PubMed] [Google Scholar]
- Mashayekhi V, Tehrani KH, Hashemzaei M, Tabrizian K, Shahraki J and Hosseini MJ, 2015. Mechanistic approach for the toxic effects of perfluorooctanoic acid on isolated rat liver and brain mitochondria. Human and Experimental Toxicology, 34, 985–996. 10.1177/0960327114565492 [DOI] [PubMed] [Google Scholar]
- Mattsson K, Rignell‐Hydbom A, Holmberg S, Thelin A, Jönsson BA, Lindh CH, Sehlstedt A and Rylander L, 2015. Levels of perfluoroalkyl substances and risk of coronary heart disease: Findings from a population‐based longitudinal study. Environmental Research, 142, 148–154. 10.1016/j.envres.2015.06.033 [DOI] [PubMed] [Google Scholar]
- MDH (Minnesota Department of Health), 2012. Perfluorochemical contamination in southern Washington county, northern Dakota county, and southeastern Ramsey county, Minnesota. US DHHS ATSDR, Atlanta: Available online: http://www.health.state.mn.us/divs/eh/hazardous/topics/pfcs/pha/woodbury/pha3m0112.pdf [Google Scholar]
- Melzer D, Rice N, Depledge MH, Henley WE and Galloway TS, 2010. Association between serum perfluorooctanoic acid (PFOA) and thyroid disease in the U.S. National Health and Nutrition Examination Survey. Environmental Health Perspectives, 118, 686–692. 10.1289/ehp.0901584 [DOI] [PMC free article] [PubMed] [Google Scholar]
- Merten C, Ferrari P, Bakker M, Boss A, Hearty A, Leclercq C, Lindtner O, Tlustos C, Verger P, Volatier JL and Arcella D, 2011. Methodological characteristics of the national dietary surveys carried out in the European Union as included in the European Food Safety Authority (EFSA) Comprehensive European Food Consumption Database. Food Additives and Contaminants. Part A, 28, 975–995. 10.1080/19440049.2011.576440 [DOI] [PubMed] [Google Scholar]
- Midgett K, Peden‐Adams MM, Gilkeson GS and Kamen DL, 2015. In vitro evaluation of the effects of perfluorooctane sulfonic acid (PFOS) and perfluorooctanoic acid (PFOA) on IL‐2 production in human T‐cells. Journal of Applied Toxicology, 35, 459–465. [DOI] [PMC free article] [PubMed] [Google Scholar]
- Mihaylova B, Emberson J, Blackwell L, Keech A, Simes J, Barnes EH, Voysey M, Gray A, Collins R and Baigent C and Cholesterol Treatment Trialists’ (CTT) Collaborators , 2012. The effects of lowering LDL cholesterol with statin therapy in people at low risk of vascular disease: meta‐analysis of individual data from 27 randomised trials. Lancet, 380, 581–590. 10.1016/s0140-6736(12)60367-5 [DOI] [PMC free article] [PubMed] [Google Scholar]
- Min JY, Lee KJ, Park JB and Min KB, 2012. Perfluorooctanoic acid exposure is associated with elevated homocysteine and hypertension in US adults. Occupational and Environmental Medicine, 69, 658–662. 10.1136/oemed-2011-100288 [DOI] [PMC free article] [PubMed] [Google Scholar]
- Minata M, Harada KH, Karrman A, Hitomi T, Hirosawa M, Murata M, Gonzalez FJ and Koizumi A, 2010. Role of peroxisome proliferator‐activated receptor‐alpha in hepatobiliary injury induced by ammonium perfluorooctanoate in mouse liver. Industrial Health, 48, 96–107. [DOI] [PMC free article] [PubMed] [Google Scholar]
- Miralles‐Marco A and Harrad S, 2015. Perfluorooctane sulfonate: a review of human exposure, biomonitoring and the environmental forensics utility of its chirality and isomer distribution. Environment International, 77, 148–159. 10.1016/j.envint.2015.02.002 [DOI] [PubMed] [Google Scholar]
- Mollenhauer MAM, Bradshaw SG, Fair PA, McGuinn WD and Peden‐Adams MM, 2011. Effects of perfluorooctane sulfonate (PFOS) exposure on markers of inflammation in female B6C3F1 mice. Journal of Environmental Science and Health Part A‐Toxic/Hazardous Substances & Environmental Engineering, 46, 97–108. [DOI] [PubMed] [Google Scholar]
- Möller A, Ahrens L, Sum R, Westerveld J, Van der Wielen F, Ebinghaus R and de Voogt P, 2010. Distribution and sources of polyfluoroalkyl substances (PFAS) in the River Rhine watershed. Environmental Pollution, 158, 3243–3250. [DOI] [PubMed] [Google Scholar]
- Mondal D, Weldon RH, Armstrong BG, Gibson LJ, Lopez‐Espinosa MJ, Shin HM and Fletcher T, 2014. Breastfeeding: a potential excretion route for mothers and implications for infant exposure to perfluoroalkyl acids. Environmental Health Perspectives, 122, 187–192. 10.1289/ehp.1306613 [DOI] [PMC free article] [PubMed] [Google Scholar]
- Mora AM, Oken E, Rifas‐Shiman SL, Webster TF, Gillman MW, Calafat AM, Ye X and Sagiv SK, 2017. Prenatal exposure to perfluoroalkyl substances and adiposity in early and mid‐childhood. Environmental Health Perspectives, 125, 467–473. 10.1289/EHP246 [DOI] [PMC free article] [PubMed] [Google Scholar]
- Mørck TA, Nielsen F, Nielsen JKS, Siersma VD, Grandjean P and Knudsen LE, 2015. PFAS concentrations in plasma samples from Danish school children and their mothers. Chemosphere, 129, 203–209. 10.1016/j.chemosphere.2014.07.018 [DOI] [PubMed] [Google Scholar]
- Morimura K, Cheung C, Ward JM, Reddy JK and Gonzalez FJ, 2006. Differential susceptibility of mice humanized for peroxisome proliferator‐activated receptor alpha to Wy‐14,643‐induced liver tumorigenesis. Carcinogenesis, 27, 1074–1080. 10.1093/carcin/bgi329 [DOI] [PMC free article] [PubMed] [Google Scholar]
- Morken NH, Travlos GS, Wilson RE, Eggesbø M and Longnecker MP, 2014. Maternal glomerular filtration rate in pregnancy and fetal size. PLoS ONE, 9, e101897 10.1371/journal.pone.0101897 [DOI] [PMC free article] [PubMed] [Google Scholar]
- Mortensen AS, Letcher RJ, Cangialosi MV, Chu S and Arukwe A, 2011. Tissue bioaccumulation patterns, xenobiotic biotransformation and steroid hormone levels in Atlantic salmon (Salmo salar) fed a diet containing perfluoroactane sulfonic or perfluorooctane carboxylic acids. Chemosphere, 83, 1035–1044. 10.1016/j.chemosphere.2011.01.067 [DOI] [PubMed] [Google Scholar]
- Müeller CE, De Silva AO, Small J, Williamson M, Wang X, Morris A, Katz S, Gamberg M and Muir DCG, 2011. Biomagnification of Perfluorinated Compounds in a Remote Terrestrial Food Chain: Lichen‐Caribou‐Wolf. Environmental Science and Technology, 45, 8665–8673. [DOI] [PubMed] [Google Scholar]
- Naile JE, Wiseman S, Bachtold K, Jones PD and Giesy JP, 2012. Transcriptional effects of perfluorinated compounds in rat hepatoma cells. Chemosphere, 86, 270–277. 10.1016/j.chemosphere.2011.09.044 [DOI] [PubMed] [Google Scholar]
- Nakagawa H, Hirata T, Terada T, Jutabha P, Miura D, Harada KH, Inoue K, Anzai N, Endou H, Inui K, Kanai Y and Koizumi A, 2008. Roles of organic anion transporters in the renal excretion of perfluorooctanoic acid. Basic and Clinical Pharmacology and Toxicology, 103, 1–8. 10.1111/j.1742-7843.2007.00155.x [DOI] [PubMed] [Google Scholar]
- Nakagawa H, Terada T, Harada KH, Hitomi T, Inoue K, Inui K and Koizumi A, 2009. Human organic anion transporter hOAT4 is a transporter of perfluorooctanoic acid. Basic and Clinical Pharmacology and Toxicology, 105, 136–138. 10.1111/j.1742-7843.2009.00409.x [DOI] [PubMed] [Google Scholar]
- Nakagawa T, Ramdhan DH, Tanaka N, Naito H, Tamada H, Ito Y, Li Y, Hayashi Y, Yamagishi N, Yanagiba Y, Aoyama T, Gonzalez FJ and Nakajima T, 2012. Modulation of ammonium perfluorooctanoate‐induced hepatic damage by genetically different PPARα in mice. Archives of Toxicology, 86, 63–74. 10.1007/s00204-011-0704-3 [DOI] [PMC free article] [PubMed] [Google Scholar]
- Nakamura T, Ito Y, Yanagiba Y, Ramdhan DH, Kono Y, Naito H, Hayashi Y, Li Y, Aoyama T, Gonzalez FJ and Nakajima T, 2009. Microgram‐order ammonium perfluorooctanoate may activate mouse peroxisome proliferator‐activated receptor alpha, but not human PPARalpha. Toxicology, 265, 27–33. 10.1016/j.tox.2009.09.004 [DOI] [PMC free article] [PubMed] [Google Scholar]
- Nania V, Pellegrini GE, Fabrizi L, Sesta G, De Sanctis P, Lucchetti D, Di Pasquale M and Coni E, 2009. Monitoring of perfluorinated compounds in edible fish from the Mediterranean Sea. Food Chemistry, 115, 951–957. [Google Scholar]
- Negri E, Metruccio F, Guercio V, Tosti L, Benfenati E, Bonzi R, La Vecchia C and Moretto A, 2017. Exposure to PFOA and PFOS and fetal growth: a critical merging of toxicological and epidemiological data. Critical Reviews in Toxicology, 47, 489–515. [DOI] [PubMed] [Google Scholar]
- Nelson JW, Hatch EE and Webster TF, 2010. Exposure to polyfluoroalkyl chemicals and cholesterol, body weight, and insulin resistance in the general U.S. population. Environmental Health Perspectives, 118, 197–202. 10.1289/ehp.0901165 [DOI] [PMC free article] [PubMed] [Google Scholar]
- Nelson JW, Scammell MK, Hatch EE and Webster TF, 2012. Social disparities in exposures to bisphenol A and polyfluoroalkyl chemicals: a cross‐sectional study within NHANES 2003‐2006. Environmental Health, 11, 10 10.1186/1476-069x-11-10 [DOI] [PMC free article] [PubMed] [Google Scholar]
- Ngo HT, Hetland RB, Sabaredzovic A, Haug LS and Steffensen IL, 2014. In utero exposure to perfluorooctanoate (PFOA) or perfluorooctane sulfonate (PFOS) did not increase body weight or intestinal tumorigenesis in multiple intestinal neoplasia (Min/+) mice. Environmental Research, 132, 251–263. [DOI] [PubMed] [Google Scholar]
- Nilsson H, Kärrman A, Rotander A, van Bavel B, Lindström G and Westberg H, 2010. Inhalation exposure to fluorotelomer alcohols yield perfluorocarboxylates in human blood? Environmental Science and Technology, 44, 7717–7722. 10.1021/es101951t [DOI] [PubMed] [Google Scholar]
- Noker PE and Gorman GS. 2003. A pharmacokinetic study of potassium perfluorooctanesulfonate in the Cynomolgus monkey. St. Paul, MN: 3M Corporation.
- Nolan LA, Nolan JM, Shofer FS, Rodway NV and Emmett EA, 2009. The relationship between birth weight, gestational age and perfluorooctanoic acid (PFOA)‐contaminated public drinking water. Reproductive Toxicology, 27, 231–238. 10.1016/j.reprotox.2008.11.001 [DOI] [PMC free article] [PubMed] [Google Scholar]
- Nolan LA, Nolan JM, Shofer FS, Rodway NV and Emmett EA, 2010. Congenital anomalies, labor delivery complications, maternal risk factors and their relationship with perfluorooctanoic acid (PFOA)‐contaminated public drinking water. Reproductive Toxicology, 29, 147–155. 10.1016/j.reprotox.2009.10.012 [DOI] [PMC free article] [PubMed] [Google Scholar]
- Noorlander CW, van Leeuwen SPJ, te Biesebeek JD, Mengelers MJB and Zeilmaker MJ, 2011. Levels of Perfluorinated Compounds in Food and Dietary Intake of PFOS and PFOA in The Netherlands. Journal of Agriculture and Food Chemistry, 59, 7496–7505. [DOI] [PubMed] [Google Scholar]
- Nøst TH, Vestergren R, Berg V, Nieboer E, Odland JØ and Sandanger TM, 2014. Repeated measurements of per‐ and polyfluoroalkyl substances (PFASs) from 1979 to 2007 in males from Northern Norway: Assessing time trends, compound correlations and relations to age/birth cohort. Environment International, 67, 43–53. 10.1016/j.envint.2014.02.011 [DOI] [PubMed] [Google Scholar]
- NTP (National Toxicology Program), 2016. NTP Monograph. Immunotoxicity Associated with Exposure to Perfluorooctanoic Acid or Perfluorooctane Sulfonate. September 2016. 147 pp.
- Numata J, Kowalczyk J, Adolphs J, Ehlers S, Schafft H, Fuerst P, Müller‐Graf C, Lahrssen‐Wiederholt M and Greiner M, 2014. Toxicokinetics of seven perfluoroalkyl sulfonic and carboxylic acids in pigs fed a contaminated diet. Journal of Agricultural and Food Chemistry, 62, 6861–6870. 10.1021/jf405827u [DOI] [PubMed] [Google Scholar]
- Obourn JD, Frame SR, Bell RHJr, Longnecker DS, Elliott GS and Cook JC, 1997. Mechanisms for the pancreatic oncogenic effects of the peroxisome proliferator Wyeth‐14,643. Toxicology and Applied Pharmacology, 145, 425–436. 10.1006/taap.1997.8210 [DOI] [PubMed] [Google Scholar]
- Ode A, Rylander L, Lindh CH, Kallen K, Jonsson BA, Gustafsson P, Olofsson P, Ivarsson SA and Rignell‐Hydbom A, 2013. Determinants of maternal and fetal exposure and temporal trends of perfluorinated compounds. Environmental Science and Pollution Research International, 20, 7970–7978. 10.1007/s11356-013-1573-5 [DOI] [PubMed] [Google Scholar]
- Ode A, Kallen K, Gustafsson P, Rylander L, Jonsson BA, Olofsson P, Ivarsson SA, Lindh CH and Rignell‐Hydbom A, 2014. Fetal exposure to perfluorinated compounds and attention deficit hyperactivity disorder in childhood. PLoS ONE, 9, e95891 10.1371/journal.pone.0095891 [DOI] [PMC free article] [PubMed] [Google Scholar]
- OECD (Organisation for Economic Co‐operation and Development), 2002. Hazard assessment of perfluorooctane sulfonate (PFOS) and its salts. ENV/JM/RD(2002)17/FINAL. Joint Meeting of the Chemicals Committee and the Working Party on Chemicals, Pesticides, and Biotechnology, Environment Directorate, Organisation for Economic Co‐operation and Development (Paris). Available at URL http://www.oecd.org/dataoecd/23/18/2382880.pdf
- OECD (Organisation for Economic Co‐operation and Development), 2004. Results of survey on production and use of PFOS, PFAS AND PFOA, related substances and products/mixtures containing these substances. Joint meeting of the chemicals committee and the working party on chemicals committee and the working party on chemicals, pesticides and Biotechnology. Available at the URL: http://www.olis.oecd.org/olis/2005doc.nsf/LinkTo/NT0000097A/FILE/JT00176885.PDF
- OECD (Organisation for Economic Co‐operation and Development), 2006. Lists of PFOS, PFAS, PFOA, PFCA, Related Compounds and Chemicals that may degrade to PFCA (as revised in 2007), OECD Environment, Health and Safety Publications, Series on Risk Management No. 21. ENV/JM/MONO(2006)15.
- OECD (Organisation for Economic Co‐Operation and Development), 2011. PFCs: Outcome of the 2009 survey. Survey on the production, use and release of PFOS, PFAS, PFOA PFCA, their related substances and products/mixtures containing these substances. OECD Environment, Health and Safety Publications, ENV/JM/MONO(2011)1. Series on Risk Management No 24, Paris 2011. 61 pp. Available online: http://www.oecd.org/officialdocuments/publicdisplaydocumentpdf/?cote=env/jm/mono(2011)1&doclanguage=en
- Okada E, Sasaki S, Saijo Y, Washino N, Miyashita C, Kobayashi S, Konishi K, Ito YM, Ito R, Nakata A, Iwasaki Y, Saito K, Nakazawa H and Kishi R, 2012. Prenatal exposure to perfluorinated chemicals and relationship with allergies and infectious diseases in infants. Environmental Research, 112, 118–125. 10.1016/j.envres.2011.10.003 [DOI] [PubMed] [Google Scholar]
- Okada E, Sasaki S, Kashino I, Matsuura H, Miyashita C, Kobayashi S, Itoh K, Ikeno T, Tamakoshi A and Kishi R, 2014. Prenatal exposure to perfluoroalkyl acids and allergic diseases in early childhood. Environmental International, 65, 127–134. 10.1016/j.envint.2014.01.007 [DOI] [PubMed] [Google Scholar]
- Olsen GW and Zobel LR, 2007. Assessment of lipid, hepatic, and thyroid parameters with serum perfluorooctanoate (PFOA) concentrations in fluorochemical production workers. International Archives of Occupational and Environmental Health, 81, 231–246. [DOI] [PubMed] [Google Scholar]
- Olsen GW, Burris JM, Mandel JH and Zobel LR, 1999. Serum perfluorooctane sulfonate and hepatic and lipid clinical chemistry tests in fluorochemical production employees. Journal of Occupational and Environmental Medicine, 41, 799–806. [DOI] [PubMed] [Google Scholar]
- Olsen GW, Burris JM, Burlew MM and Mandel JH, 2000. Plasma cholecystokinin and hepatic enzymes, cholesterol and lipoproteins in ammonium perfluorooctanoate production workers. Drug and Chemical Toxicology, 23, 603–620. [DOI] [PubMed] [Google Scholar]
- Olsen GW, Hansen KJ, Stevenson LA, Burris JM and Mandel JH, 2003a. Human donor liver and serum concentrations of perfluorooctanesulfonate and other perfluorochemicals. Environmental Science & Technology, 37, 888–891. [DOI] [PubMed] [Google Scholar]
- Olsen GW, Burris JM, Burlew MM and Mandel JH, 2003b. Epidemiologic assessment of worker serum perfluoroctanesulfonate (PFOS) and perfluorooctanoate (PFOA) concentrations and medical surveillance examinations. Journal of Occupational and Environmental Medicine, 45, 260–270. [DOI] [PubMed] [Google Scholar]
- Olsen GW, Burris JM, Ehresman DJ, Froehlich JW, Seacat AM, Butenhoff JL and Zobel LR, 2007. Half‐life of serum elimination of perfluorooctanesulfonate, perfluorohexanesulfonate, and perfluorooctanoate in retired fluorochemical production workers. Environmental Health Perspectives, 115, 1298–1305. 10.1289/ehp.10009 [DOI] [PMC free article] [PubMed] [Google Scholar]
- Olsen GW, Mair DC, Church TR, Ellefson ME, Reagen WK, Boyd TM, Herron RM, Medhdizadehkashi Z, Nobiletti JB, Rios JA, Butenhoff JL and Zobel LR, 2008. Decline in perfluorooctanesulfonate and other polyfluoroalkyl chemicals in American Red Cross adult blood donors, 2000‐2006. Environmental Science and Technology, 42, 4989–4995. [DOI] [PubMed] [Google Scholar]
- Olsen GW, 2015. PFAS biomonitoring in higher exposed populations In: De Wit CA. (ed.). Toxicological Effects of Perfluoroalkyl and Polyfluoralkyl Substances. Series: Molecular and Integrative Toxicology, Springer International Publishing, Switzerland: 77–125 [Google Scholar]
- Onishchenko N, Fischer C, Ibrahim WNW, Negri S, Spulber S, Cottica D and Ceccatelli S, 2011. Prenatal Exposure to PFOS or PFOA Alters Motor Function in Mice in a Sex‐Related Manner. Neurotoxicity Research, 19, 452–461. [DOI] [PubMed] [Google Scholar]
- Ostertag SK, Chan HM, Moisey J, Dabeka R and Tittlemier SA, 2009. Historic dietary exposure to perfluorooctane sulfonate, perfluorinated carboxylates, and fluorotelomer unsaturated carboxylates from the consumption of store‐bought and restaurant foods for the Canadian population. Journal of Agricultural and Food Chemistry, 57, 8534–8544. 10.1021/jf9014125 [DOI] [PubMed] [Google Scholar]
- Osuna CE, Grandjean P, Weihe P and El‐Fawal HA, 2014. Autoantibodies associated with prenatal and childhood exposure to environmental chemicals in Faroese children. Toxicological Sciences, 142, 158–166. 10.1093/toxsci/kfu163 [DOI] [PMC free article] [PubMed] [Google Scholar]
- Oulhote Y, Steuerwald U, Debes F, Weihe P and Grandjean P, 2016. Behavioral difficulties in 7‐year old children in relation to developmental exposure to perfluorinated alkyl substances. Environment International, 97, 237–245. 10.1016/j.envint.2016.09.015 [DOI] [PMC free article] [PubMed] [Google Scholar]
- Papadopoulou E, Sabaredzovic A, Namork E, Nygaard UC, Granum B and Haug LS, 2016. Exposure of Norwegian toddlers to perfluoroalkyl substances (PFAS): the association with breastfeeding and maternal PFAS concentrations. Environment International, 94, 687–694. 10.1016/j.envint.2016.07.006 [DOI] [PubMed] [Google Scholar]
- Parolini M, Colombo G, Valsecchi S, Mazzoni M, Possenti CD, Caprioli M, Dalle‐Donne I, Milzani A, Saino N and Rubolini D, 2016. Potential toxicity of environmentally relevant perfluorooctane sulfonate (PFOS) concentrations to yellow‐legged gull Larus michahellis embryos. Environmental Science and Pollution Research, 23, 426–437. 10.1007/s11356-015-5248-2 [DOI] [PubMed] [Google Scholar]
- Paul AG, Jones KC and Sweetman AJ, 2009. A first global production, emission, and environmental inventory for perfluorooctane sulfonate. Environmental Science and Technology, 43, 386–392. [DOI] [PubMed] [Google Scholar]
- Peden‐Adams MM, Keller JM, Eudaly JG, Berger J, Gilkeson GS and Keil DE, 2008. Suppression of humoral immunity in mice following exposure to perfluorooctane sulfonate. Toxicological Sciences, 104, 144–154. [DOI] [PubMed] [Google Scholar]
- Peng H, Zhang S, Sun J, Zhang Z, Giesy JP and Hu J, 2014. Isomer‐Specific Accumulation of Perfluorooctanesulfonate from (N‐Ethyl perfluorooctanesulfonamido) ethanol‐based Phosphate Diester in Japanese Medaka (Oryzias latipes). Environmental Science and Technology, 48, 1058–1066. [DOI] [PubMed] [Google Scholar]
- Pennings JL, Jennen DG, Nygaard UC, Namork E, Haug LS, vanLoveren H and Granum B, 2016. Cord blood gene expression supports that prenatal exposure to perfluoroalkyl substances causes depressed immune functionality in early childhood. Journal of Immunotoxicology, 13, 173–180. [DOI] [PubMed] [Google Scholar]
- Pérez F, Nadal M, Navarro‐Ortega A, Fàbrega F, Domingo JL, Barceló D and Farré M, 2013. Accumulation of perfluoroalkyl substances in human tissues. Environment International, 59, 354–362. 10.1016/j.envint.2013.06.004 [DOI] [PubMed] [Google Scholar]
- Perkins RG, Butenhoff JL, Kennedy GL Jr and Palazzolo MJ, 2004. 13‐Week dietary toxicity study of ammonium perfluorooctanoate (APFO) in male rats. Drug and Chemical Toxicology, 27(4), 361–378. [DOI] [PubMed] [Google Scholar]
- Piepoli MF, Hoes AW, Agewall S, Albus C, Brotons C, Catapano AL, Cooney MT, Corrà U, Cosyns B, Deaton C, Graham I, Hall MS, Hobbs FDR, Løchen ML, Löllgen H, Marques‐Vidal P, Perk J, Prescott E, Redon J, Richter DJ, Sattar N, Smulders Y, Tiberi M, dervan Worp HB , vanDis I , Verschuren WMM and Binno S and ESC Scientific Document Group , 2016. 2016 European Guidelines on cardiovascular disease prevention in clinical practice: The Sixth Joint Task Force of the European Society of Cardiology and Other Societies on Cardiovascular Disease Prevention in Clinical Practice (constituted by representatives of 10 societies and by invited experts). Developed with the special contribution of the European Association for Cardiovascular Prevention & Rehabilitation (EACPR). European Heart Journal, 37, 2315–2381. 10.1093/eurheartj/ehw106. [DOI] [PMC free article] [PubMed] [Google Scholar]
- Porpora MG, Lucchini R, Abballe A, Ingelido AM, Valentini S, Fuggetta E, Cardi V, Ticino A, Marra V, Fulgenzi AR and De Felip E, 2013. Placental transfer of persistent organic pollutants: a preliminary study on mother‐newborn pairs. International Journal of Environmental Research and Public Health, 10, 699–711. 10.3390/ijerph10020699 [DOI] [PMC free article] [PubMed] [Google Scholar]
- Post GB, Cohn PD and Cooper KR, 2012. Perfluorooctanoic acid (PFOA), an emerging drinking water contaminant: A critical review of recent literature. Environmental Research, 116, 93–117. 10.1016/j.envres.2012.03.007 [DOI] [PubMed] [Google Scholar]
- Power MC, Webster TF, Baccarelli AA and Weisskopf MG, 2013. Cross‐sectional association between polyfluoroalkyl chemicals and cognitive limitation in the National Health and Nutrition Examination Survey. Neuroepidemiology, 40, 125–132. 10.1159/000342310 [DOI] [PMC free article] [PubMed] [Google Scholar]
- Powley CR, George SW, Ryan TW and Buck RC, 2005. Matrix effect‐free analytical methods for determination of perfluorinated carboxylic acids in environmental matrixes. Analytical Chemistry, 77, 6353–6358. 10.1021/ac0508090 [DOI] [PubMed] [Google Scholar]
- Powley CR, George SW, Russell MH, Hoke RA and Buck RC, 2008. Polyfluorinated chemicals in a spatially and temporally integrated food web in the Western Arctic. Chemosphere, 70, 664–672. [DOI] [PubMed] [Google Scholar]
- Predieri B, Iughetti L, Guerranti C, Bruzzi P, Perra G and Focardi SE, 2015. High levels of perfluorooctane sulfonate in children at the onset of diabetes. International Journal of Endocrinology, 2015, 7 10.1155/2015/234358 [DOI] [PMC free article] [PubMed] [Google Scholar]
- Prevedouros K, Cousins IT, Buck RC and Korzeniowski SH, 2006. Sources, fate and transport of perfluorocarboxylates. Environmental Science and Technology, 40, 32–44. [DOI] [PubMed] [Google Scholar]
- Qazi MR, Xia Z, Bogdanska J, Chang SC, Ehresman DJ, Butenhoff JL, Nelson BD, DePierre JW and Abedi‐Valugerdi M, 2009a. The atrophy and changes in the cellular compositions of the thymus and spleen observed in mice subjected to short‐term exposure to perfluorooctanesulfonate are high dose phenomena mediated in part by peroxisome proliferator‐activated receptor‐alpha (PPARα). Toxicology, 260, 68–76. [DOI] [PubMed] [Google Scholar]
- Qazi MR, Bogdanska J, Butenhoff JL, Nelson BD, DePierre JW and Abedi‐Valugerdi M, 2009b. High‐dose, short‐term exposure of mice to perfluorooctanesulfonate (PFOS) or perfluorooctanoate (PFOA) affects the number of circulating neutrophils differently, but enhances the inflammatory responses of macrophages to lipopolysaccharide (LPS) in a similar fashion. Toxicology, 262, 207–214. [DOI] [PubMed] [Google Scholar]
- Qazi MR, Nelson BD, DePierre JW and Abedi‐Valugerdi M, 2010. 28‐Day dietary exposure of mice to a low total dose (7 mg/kg) of perfluorooctanesulfonate (PFOS) alters neither the cellular compositions of the thymus and spleen nor humoral immune responses: Does the route of administration play a pivotal role in PFOS‐induced immunotoxicity? Toxicology, 267, 132–139. [DOI] [PubMed] [Google Scholar]
- Qazi MR, Dean Nelson B, DePierre JW and Abedi‐Valugerdi M, 2012. High‐dose dietary exposure of mice to perfluorooctanoate or perfluorooctane sulfonate exerts toxic effects on myeloid and B‐lymphoid cells in the bone marrow and these effects are partially dependent on reduced food consumption. Food and Chemical Toxicology, 50, 2955–2963. [DOI] [PubMed] [Google Scholar]
- Qin XD, Qian Z, Vaughn MG, Huang J, Ward P, Zeng XW, Zhou Y, Zhu Y, Yuan P, Li M, Bai Z, Paul G, Hao YT, Chen W, Chen PC, Dong GH and Lee YL, 2016. Positive associations of serum perfluoroalkyl substances with uric acid and hyperuricemia in children from Taiwan. Environmental Pollution, 212, 519–524. 10.1016/j.envpol.2016.02.050 [DOI] [PubMed] [Google Scholar]
- Quaak I, deCock M , deBoer M , Lamoree M, Leonards P and devan Bor M , 2016. Prenatal exposure to perfluoroalkyl substances and behavioral development in children. International Journal of Environmental Research and Public Health, 13, pii: E511. 10.3390/ijerph13050511 [DOI] [PMC free article] [PubMed]
- Quinones O and Snyder SA, 2009. Occurrence of Perfluoroalkyl Carboxylates and Sulfonates in Drinking Water Utilities and Related Waters from the United States. Environmental Science and Technology, 43, 9089–9095. [DOI] [PubMed] [Google Scholar]
- Quist EM, Filgo AJ, Cummings CA, Kissling GE, Hoenerhoff MJ and Fenton SE, 2015. Hepatic mitochondrial alteration in CD‐1 mice associated with prenatal exposures to low doses of perfluorooctanoic acid (PFOA). Toxicologic Pathology, 43, 546–557. 10.1177/0192623314551841 [DOI] [PMC free article] [PubMed] [Google Scholar]
- Raleigh KK, Alexander BH, Olsen GW, Ramachandran G, Morey SZ, Church TR, Logan PW, Scott LL and Allen EM, 2014. Mortality and cancer incidence in ammonium perfluorooctanoate production workers. Occupational and Environmental Medicine, 71, 500–506. 10.1136/oemed-2014-102109 [DOI] [PMC free article] [PubMed] [Google Scholar]
- Rantakokko P, Männistö V, Airasinen R, Koponen J, Viluksela M, Kiviranta H and Pihlajamäki J, 2015. Persistent organic pollutants and non‐alcoholic fatty liver disease in morbidly obese patients: a cohort study. Environmental Health, 14, 79 10.1186/s12940-015-0066-z [DOI] [PMC free article] [PubMed] [Google Scholar]
- Rasoulpour RJ, Terry C, LeBaron MJ, Stebbins K, Ellis‐Hutchings RG and Billington R, 2014. Mode‐of‐action and human relevance framework analysis for rat Leydig cell tumors associated with sulfoxaflor. Critical Reviews in Toxicology, 44(Suppl 2), 25–44. 10.3109/10408444.2014.910750 [DOI] [PubMed] [Google Scholar]
- Raymer JH, Michael LC, Studabaker WB, Olsen GW, Sloan CS, Wilcosky T and Walmer DK, 2012. Concentrations of perfluorooctane sulfonate (PFOS) and perfluorooctanoate (PFOA) and their associations with human semen quality measurements. Reproductive Toxicology, 33, 419–427. 10.1016/j.reprotox.2011.05.024 [DOI] [PMC free article] [PubMed] [Google Scholar]
- Rayne S and Forest K, 2009. Congener‐specific organic carbon‐normalized soiland sediment‐water partitioning coefficients for the C1 through C8 perfluoroalkyl carboxylic and sulfonic acids. Journal of Environmental Science and Health Part A, 44, 1374–1387. [DOI] [PubMed] [Google Scholar]
- Rebholz S, Jones T, Herrick RL, Xie C, Calafat AM, Pinney SM and Woollett LA, 2016. Hypercholesterolemia with consumption of PFOA‐laced Western diets is dependent on strain and sex of mice. Toxicology Reports, 3, 46–54. 10.1016/j.toxrep.2015.11.004 [DOI] [PMC free article] [PubMed] [Google Scholar]
- Ren H, Vallanat B, Nelson DM, Yeung LWY, Guruge KS, Lam PKS, Lehman‐McKeeman LD and Corton JC, 2009. Evidence for the involvement of xenobiotic‐responsive nuclear receptors in transcriptional effects upon perfluoroalkyl acid exposure in diverse species. Reproductive Toxicology, 27, 266–277. 10.1016/j.reprotox.2008.12.011 [DOI] [PubMed] [Google Scholar]
- Riddell N, Arsenault G, Benskin JP, Chittim B, Martin JW, McAlees A and McCrindle R, 2009. Branched perfluorooctane sulfonate isomer quantification and characterization in blood serum samples by HPLC/ESI‐MS(/MS). Environmental Science and Technology, 43, 7902–7908. 10.1021/es901261v [DOI] [PubMed] [Google Scholar]
- Rigden M, Pelletier G, Poon R, Zhu J, Auray‐Blais C, Gagnon R, Kubwabo C, Kosarac I, Lalonde K, Cakmak S, Xiao B, Leingartner K, Ku KL, Bose R and Jiao J, 2015. Assessment of urinary metabolite excretion after rat acute exposure to perfluorooctanoic acid and other peroxisomal proliferators. Archives of Environmental Contamination and Toxicology, 68, 148–158. 10.1007/s00244-014-0058-y [DOI] [PubMed] [Google Scholar]
- Rivière G, Sirot V, Tard A, Jean J, Marchand P, Veyrand B, Le Bizec B and Leblanc JC, 2014. Food risk assessment for perfluoroalkyl acids and brominated flame retardants in the French population: Results from the second French total diet study. Science of the Total Environment, 491–492, 176–183. [DOI] [PubMed] [Google Scholar]
- RIVM (National Institute for Public Health and the Environment), 2016. Risk assessment of PFOA emissions for the local population. The Netherlands. 72 pp.
- Robledo CA, Yeung E, Mendola P, Sundaram R, Maisog J, Sweeney AM, Barr DB and Louis GM, 2015. Preconception maternal and paternal exposure to persistent organic pollutants and birth size: the LIFE study. Environmental Health Perspectives, 123, 88–94. 10.1289/ehp.1308016 [DOI] [PMC free article] [PubMed] [Google Scholar]
- Rogers JM, Ellis‐Hutchings RG, Grey BE, Zucker RM, Norwood J Jr, Grace CE, Gordon CJ and Lau C, 2014. Elevated blood pressure in offspring of rats exposed to diverse chemicals during pregnancy. Toxicological Sciences, 137, 436–446. 10.1093/toxsci/kft248 [DOI] [PubMed] [Google Scholar]
- Romano ME, Xu Y, Calafat AM, Yolton K, Chen A, Webster GM, Eliot MN, Howard CR, Lanphear BP and Braun JM, 2016. Maternal serum perfluoroalkyl substances during pregnancy and duration of breastfeeding. Environmental Research, 149, 239–246. 10.1016/j.envres.2016.04.034 [DOI] [PMC free article] [PubMed] [Google Scholar]
- Roos A, Berger U, Jarnberg U, van Dijk J and Bignert A, 2013. Increasing Concentrations of Perfluoroalkyl Acids in Scandinavian Otters (Lutra lutra) between 1972 and 2011: A New Threat to the Otter Population? Environmental Science and Technology, 2013(47), 11757–11765. [DOI] [PubMed] [Google Scholar]
- Rosen MB, Lee JS, Ren H, Vallanat B, Liu J, Waalkes MP, Abbott BD, Lau C and Corton JC, 2008. Toxicogenomic dissection of the perfluorooctanoic acid transcript profile in mouse liver: evidence for the involvement of nuclear receptors PPAR alpha and CAR. Toxicological Sciences, 103, 46–56. 10.1093/toxsci/kfn025 [DOI] [PubMed] [Google Scholar]
- Rotander A, Toms LM, Aylward L, Kay M and Mueller JF, 2015. Elevated levels of PFOS and PFHxS in firefighters exposed to aqueous film forming foam (AFFF). Environment International, 82, 28–34. 10.1016/j.envint.2015.05.005 [DOI] [PubMed] [Google Scholar]
- Ruark CD, Song G, Yoon M, Verner MA, Andersen ME, Clewell HJ 3rd and Longnecker MP, 2016. Quantitative bias analysis for epidemiological associations of perfluoroalkyl substance serum concentrations and early onset of menopause. Environment International, 99, 245–254. 10.1016/j.envint.2016.11.030 [DOI] [PubMed] [Google Scholar]
- Russo J and Russo IH, 1996. Experimentally induced mammary tumors in rats. Breast Cancer Research and Treatment, 39, 7–20 [DOI] [PubMed] [Google Scholar]
- Rylander C, Phi DT, Odland JØ and Sandanger TM, 2009. Perfluorinated compounds in delivering women from south central Vietnam. Journal of Environmental Monitoring, 11, 2002–2008. 10.1039/b908551c [DOI] [PubMed] [Google Scholar]
- Ryu MH, Jha A, Ojo OO, Mahood TH, Basu S, Detillieux KA, Nikoobakht N, Wong CS, Loewen M, Becker AB and Halayko AJ, 2014. Chronic exposure to perfluorinated compounds: Impact on airway hyperresponsiveness and inflammation. American Journal of Physiology‐Lung Cellular and Molecular Physiology, 307, L765–L774. 10.1152/ajplung.00100.2014 [DOI] [PMC free article] [PubMed] [Google Scholar]
- Sagiv SK, Rifas‐Shiman SL, Webster TF, Mora AM, Harris MH, Calafat AM, Ye X, Gillman MW and Oken E, 2015. Sociodemographic and perinatal predictors of early pregnancy per‐ and polyfluoroalkyl substance (PFAS) concentrations. Environmental Science and Technology, 49, 11849–11858. 10.1021/acs.est.5b02489 [DOI] [PMC free article] [PubMed] [Google Scholar]
- Saito N, Harada K, Inoue K, Sasaki K, Yoshinaga T and Koizumi A, 2004. Perfluorooctanoate and perfluorooctane sulfonate concentrations in surface water in Japan. Journal of Occupational Health, 46, 49–59. [DOI] [PubMed] [Google Scholar]
- Sakr CJ, KreckmannKH Green JW, Gillies PJ, Reynolds JL and Leonard RC, 2007a. Cross‐sectional study of lipids and liver enzymes related to a serum biomarker of exposure (ammonium perfluorooctanoate or APFO) as part of a general health survey in a cohort of occupationally exposed workers. Journal of Occupational and Environmental Medicine, 49, 1086–1096. [DOI] [PubMed] [Google Scholar]
- Sakr CJ, Leonard RC, Kreckmann KH, Slade MD and Cullen MR, 2007b. Longitudinal study of serum lipids and liver enzymes in workers with occupational exposure to ammonium perfluorooctanoate. Journal of Occupational and Environmental Medicine, 49, 872–879. [DOI] [PubMed] [Google Scholar]
- Sakr CJ, Symons JM, Kreckmann KH and Leonard RC, 2009. Ischaemic heart disease mortality study among workers with occupational exposure to ammonium perfluorooctanoate. Occupational and Environmental Medicine, 66, 699–703. 10.1136/oem.2008.041582 [DOI] [PubMed] [Google Scholar]
- Salgado R, Pereiro N, López‐Doval S and Lafuente A, 2015. Initial study on the possible mechanisms involved in the effects of high doses of perfluorooctane sulfonate (PFOS) on prolactin secretion. Food and Chemical Toxicology, 83, 10–16. 10.1016/j.fct.2015.05.013 [DOI] [PubMed] [Google Scholar]
- Salgado R, López‐Doval S, Pereiro N and Lafuente A, 2016. Perfluorooctane sulfonate (PFOS) exposure could modify the dopaminergic system in several limbic brain regions. Toxicology Letters, 240, 226–235. 10.1016/j.toxlet.2015.10.023 [DOI] [PubMed] [Google Scholar]
- Salihovic S, Nilsson H, Hagberg J and Lindström G, 2013a. Trends in the analysis of persistent organic pollutants (POPs) in human blood. TrAC Trends in Analytical Chemistry, 46, 129–138. 10.1016/j.trac.2012.06.009 [DOI] [Google Scholar]
- Salihovic S, Karrman A, Lindstrom G, Lind PM, Lind L and van Bavel B, 2013b. A rapid method for the determination of perfluoroalkyl substances including structural isomers of perfluorooctane sulfonic acid in human serum using 96‐well plates and column‐switching ultra‐high‐performance liquid chromatography tandem mass spectrometry. Journal of Chromatography. A, 1305, 164–170. 10.1016/j.chroma.2013.07.026 [DOI] [PubMed] [Google Scholar]
- Sato I, Kawamoto K, Nishikawa Y, Tsuda S, Yoshida M, Yaegashi K, Saito N, Liu W and Jin Y, 2009. Neurotoxicity of perfluorooctane sulfonate (PFOS) in rats and mice after single oral exposure. Journal of Toxicological Sciences, 34, 569–574. [DOI] [PubMed] [Google Scholar]
- Savitz DA, 2007. Guest Editorial: Biomarkers of Perfluorinated Chemicals and Birth Weight. Environmental Health Perspectives, 115, A528–A529. 10.1289/ehp.10923 [DOI] [PMC free article] [PubMed] [Google Scholar]
- Savitz DA, Stein CR, Bartell SM, Elston B, Gong J, Shin HM and Wellenius GA, 2012a. Perfluorooctanoic acid exposure and pregnancy outcome in a highly exposed community. Epidemiology (Cambridge, Mass.), 23, 386–392. [DOI] [PMC free article] [PubMed] [Google Scholar]
- Savitz DA, Stein CR, Elston B, Wellenius GA, Bartell SM, Shin HM, Vieira VM and Fletcher T, 2012b. Relationship of perfluorooctanoic acid exposure to pregnancy outcome based on birth records in the mid‐Ohio Valley. Environmental Health Perspectives, 120, 1201–1207. [DOI] [PMC free article] [PubMed] [Google Scholar]
- Schecter A, Colacino J, Haffner D, Patel K, Opel M, Päpke O and Birnbaum Linda, 2010. Perfluorinated Compounds, Polychlorinated Biphenyls, and Organochlorine Pesticide Contamination in Composite Food Samples from Dallas, Texas, USA. Environmental Health Perspectives, 118, 796–802. [DOI] [PMC free article] [PubMed] [Google Scholar]
- Schröter‐Kermani C, Müller J, Jürling H, Conrad A and Schulte C, 2013. Retrospective monitoring of perfluorocarboxylates and perfluorosulfonates in human plasma archived by the German Environmental Specimen Bank. International Journal of Hygiene and Environmental Health, 216, 633–640. 10.1016/j.ijheh.2012.08.004 [DOI] [PubMed] [Google Scholar]
- Seacat AM, Thomford PJ, Hansen KJ, Olsen GW, Case MT and Butenhoff JL, 2002. Subchronic toxicity studies on perfluorooctanesulfonate potassium salt in Cynomolgus monkeys. Toxicological Sciences, 68, 249–264. [DOI] [PubMed] [Google Scholar]
- Shabalina IG, Kramarova TV, Mattsson CL, Petrovic N, Rahman Qazi M, Csikasz RI, Chang SC, Butenhoff J, DePierre JW, Cannon B and Nedergaard J, 2015. The environmental pollutants perfluorooctane sulfonate and perfluorooctanoic acid upregulate uncoupling protein 1 (UCP1) in brown‐fat mitochondria through a UCP1‐dependent reduction in food intake. Toxicological Sciences, 146, 334–343. 10.1093/toxsci/kfv098 [DOI] [PubMed] [Google Scholar]
- Shah‐Kulkarni S, Kim BM, Hong YC, Kim HS, Kwon EJ, Park H, Kim YJ and Ha EH, 2016. Prenatal exposure to perfluorinated compounds affects thyroid hormone levels in newborn girls. Environment International, 94, 607–613. 10.1016/j.envint.2016.06.024 [DOI] [PubMed] [Google Scholar]
- Shankar A, Xiao J and Ducatman A, 2011a. Perfluoroalkyl chemicals and elevated serum uric acid in US adults. Clinical Epidemiology, 3, 251–258. 10.2147/CLEP.S21677 [DOI] [PMC free article] [PubMed] [Google Scholar]
- Shankar A, Xiao J and Ducatman A, 2011b. Perfluoroalkyl Chemicals and Chronic Kidney Disease in US Adults. American Journal of Epidemiology, 174, 893–900. 10.1093/aje/kwr171 [DOI] [PMC free article] [PubMed] [Google Scholar]
- Shankar A, Xiao J and Ducatman A, 2012. Perfluorooctanoic acid and cardiovascular disease in US adults. Archives of Internal Medicine, 172, 1397–1403. [DOI] [PubMed] [Google Scholar]
- Shapiro GD, Dodds L, Arbuckle TE, Ashley‐Martin J, Ettinger AS, Fisher M, Taback S, Bouchard MF, Monnier P, Dallaire R, Morisset AS and Fraser W, 2016. Exposure to organophosphorus and organochlorine pesticides, perfluoroalkyl substances, and polychlorinated biphenyls in pregnancy and the association with impaired glucose tolerance and gestational diabetes mellitus: The MIREC Study. Environmental Research, 147, 71–81. [DOI] [PubMed] [Google Scholar]
- Shaw SD, Berger ML, Harris JH, Yun SH, Wu Q, Liao C, Blum A, Stefani A and Kannan K, 2013. Persistent organic pollutants including polychlorinated and polybrominated dibenzo‐p‐dioxins and dibenzofurans in firefighters from Northern California. Chemosphere, 91, 1386–1394. 10.1016/j.chemosphere.2012.12.070 [DOI] [PubMed] [Google Scholar]
- Shi Y, Yang L, Li J, Lai J, Wang Y, Zhao Y and Wu Y, 2017. Occurrence of perfluoroalkyl substances in cord serum and association with growth indicators in newborns from Beijing. Chemosphere, 169, 396–402. 10.1016/j.chemosphere.2016.11.050 [DOI] [PubMed] [Google Scholar]
- Shima JE, Komori T, Taylor TR, Stryke D, Kawamoto M, Johns SJ, Carlson EJ, Ferrin TE and Giacomini KM, 2010. Genetic variants of human organic anion transporter 4 demonstrate altered transport of endogenous substrates. American Journal of Physiology. Renal Physiology, 299, F767–F775. 10.1152/ajprenal.00312.2010 [DOI] [PMC free article] [PubMed] [Google Scholar]
- Shin HM, Vieira VM, Ryan PB, Steenland K and Bartell SM, 2011a. Retrospective exposure estimation and predicted versus observed serum perfluorooctanoic acid concentrations for participants in the C8 Health project. Environmental health Perspectives, 119, 1760–1765. [DOI] [PMC free article] [PubMed] [Google Scholar]
- Shin HM, Vieira VM, Ryan PB, Detwiler R, Sanders B, Steenland K and Bartell SM, 2011b. Environmental Fate and Transport Modeling for Perfluorooctanoic Acid Emitted from the Washington Works Facility in West Virginia. Environmental Science & Technology, 45, 1435–1442. [DOI] [PubMed] [Google Scholar]
- Shrestha S, Bloom MS, Yucel R, Seegal RF, Wu Q, Kannan K, Rej R and Fitzgerald EF, 2015. Perfluoroalkyl substances and thyroid function in older adults. Environment International, 75, 206–214. 10.1016/j.envint.2014.11.018. [DOI] [PMC free article] [PubMed] [Google Scholar]
- Sibinski LJ, 1987. Final report of a two‐year oral (diet) toxicity and carcinogenicity study of fluorochemical FC‐143 (perfluorooctanane ammonium carboxylate) in rats. Vol. 1–4, 3M Company/RIKER, Exp. No. 0281CR0012; 8 EHQ‐1087‐0394, October 16, 1987.
- Simpson C, Winquist A, Lally C and Steenland K, 2013. Relation between perfluorooctanoic acid exposure and strokes in a large cohort living near a chemical plant. Environmental Research, 127, 22–28. 10.1016/j.envres.2013.10.002 [DOI] [PubMed] [Google Scholar]
- Sinclair E, Kim SK, Akinleye HB and Kannan K, 2007. Quantitation of gas‐phase perfluoroalkyl surfactants and fluorotelomer alcohols released from nonstick cookware and microwave popcorn bags. Environmental Science and Technology, 41, 1180–1185. [DOI] [PubMed] [Google Scholar]
- Singh TS, Lee S, Kim HH, Choi JK and Kim SH, 2012. Perfluorooctanoic acid induces mast cell‐mediated allergic inflammation by the release of histamine and inflammatory mediators. Toxicology Letters, 210, 64–70. [DOI] [PubMed] [Google Scholar]
- Skuladottir M, Ramel A, Rytter D, Haug LS, Sabaredzovic Bech BH, Henriksen TB, Olsen SF and Halldorsson TI, 2015. Examining confounding by diet in the association between perfluoroalkyl acids and serum cholesterol in pregnancy. Environmental Research, 143, 33–38. [DOI] [PubMed] [Google Scholar]
- Skutlarek D, Exner M and Farber H, 2006. Perfluorinated surfactants in surface and drinking waters. Environmental Science and Pollution Research International, 13, 299–307. [DOI] [PubMed] [Google Scholar]
- Slob W, 2002. Dose‐response modeling of continuous endpoints. Toxicological Sciences, 66, 298–312. [DOI] [PubMed] [Google Scholar]
- Sobolewski M, Conrad K, Allen JL, Weston H, Martin K, Lawrence BP and Cory‐Slechta DA, 2014. Sex‐specific enhanced behavioral toxicity induced by maternal exposure to a mixture of low dose endocrine‐disrupting chemicals. Neurotoxicology, 45, 121–130. 10.1016/j.neuro.2014.09.008 [DOI] [PMC free article] [PubMed] [Google Scholar]
- Sochorová L, Hanzlíková L, Černá M, Drgáčová A, Fialová A, Švarcová A, Gramblička T and Pulkrabová J, 2016. Perfluorinated alkylated substances and brominated flame retardants in serum of the Czech adult population. International Journal of Hygiene and Environmental Health, 220, 235–243. 10.1016/j.ijheh.2016.09.003 [DOI] [PubMed] [Google Scholar]
- Son HY, Kim SH, Shin HI, Bae HI and Yang JH, 2008. Perfluorooctanoic acid‐induced hepatic toxicity following 21‐day oral exposure in mice. Archives of Toxicology, 82, 239–246. [DOI] [PubMed] [Google Scholar]
- Son HY, Lee S, Tak EN, Cho HS, Shin HI, Kim SH and Yang JH, 2009. Perfluorooctanoic acid alters T lymphocyte phenotypes and cytokine expression in mice. Environmental Toxicology, 24, 580–588. [DOI] [PubMed] [Google Scholar]
- Spachmo B and Arukwe A, 2012. Endocrine and developmental effects in Atlantic salmon (Salmo salar) exposed to perfluorooctane sulfonic or perfluorooctane carboxylic acids. Aquatic Toxicology, 108, 112–124. 10.1016/j.aquatox.2011.07.018 [DOI] [PubMed] [Google Scholar]
- Specht IO, Hougaard KS, Spano M, Bizzaro D, Manicardi GC, Lindh CH, Toft G, Jonsson BAG, Giwercman A and Bonde JPE, 2012. Sperm DNA integrity in relation to exposure to environmental perfluoroalkyl substances‐A study of spouses of pregnant women in three geographical regions. Reproductive Toxicology, 33, 577–583. [DOI] [PubMed] [Google Scholar]
- Stahl T, Heyn J, Thiele H, Hϋther J, Failing K, Georgii S and Brunn H, 2009. Carryover of Perfluorooctanoic Acid (PFOA) and Perfluorooctane Sulfonate (PFOS) from Soil to Plants. Archives of Environmental Contamination and Toxicology, 57, 289–298. [DOI] [PubMed] [Google Scholar]
- Stahl T, Falk S, Failing K, Berger J, Georgii S and Brunn H, 2012. Perfluorooctanoic Acid and Perfluorooctane Sulfonate in Liver and Muscle Tissue from Wild Boar in Hesse, Germany. Archives of Environmental Contamination and Toxicology, 62, 696–703. [DOI] [PubMed] [Google Scholar]
- Starling AP, Engel SM, Whitworth KW, Richardson DB, Stuebe AM, Daniels JL, Haug LS, EggesbØ M, Becher G, Sabaredzovic A, Thomsen C, Wilson RE, Travlos G, Hoppin JA, Baird DD and Longnecker MP, 2014. Perfluoroalkyl substances and lipid concentrations in plasma during pregnancy among women in the Norwegian Mother and Child Cohort study. Environmental International, 62, 104–112. [DOI] [PMC free article] [PubMed] [Google Scholar]
- Steenland K, Tinker S, Shankar A and Ducatman A, 2010. Association of perfluorooctanoic acid (PFOA) and perfluorooctane sulfonate (PFOS) with uric acid among adults with elevated community exposure to PFOA. Environmental Health Perspectives, 118, 229–233. 10.1289/ehp.0900940 [DOI] [PMC free article] [PubMed] [Google Scholar]
- Steenland K and Woskie S, 2012. Cohort mortality study of workers exposed to perfluorooctanoic acid. American Journal of Epidemiology, 176, 909–917. 10.1093/aje/kws171 [DOI] [PubMed] [Google Scholar]
- Steenland K, Tinker S, Frisbee S, Ducatman A and Vaccarino V, 2009. Association of perfluorooctanoic acid and perfluorooctane sulfonate with serum lipids among adults living near a chemical plant. American Journal of Epidemiology, 170, 1268–1278. 10.1093/aje/kwp279 [DOI] [PubMed] [Google Scholar]
- Steenland K, Zhao L, Winquist A and Parks C, 2013. Ulcerative colitis and perfluorooctanoic acid (PFOA) in a highly exposed population of community residents and workers in the mid‐Ohio valley. Environmental Health Perspectives, 121, 900–905. 10.1289/ehp.1206449 [DOI] [PMC free article] [PubMed] [Google Scholar]
- Steenland K, Zhao L and Winquist A, 2015. A cohort incidence study of workers exposed to perfluorooctanoic acid (PFOA). Occupational and Environmental Medicine, 72, 373–380. 10.1136/oemed-2014-102364 [DOI] [PubMed] [Google Scholar]
- Stein CR, Savitz DA and Dougan M, 2009. Serum Levels of Perfluorooctanoic Acid and Perfluorooctane Sulfonate and Pregnancy Outcome. American Journal of Epidemiology, 170, 837–846. [DOI] [PubMed] [Google Scholar]
- Stein CR and Savitz DA, 2011. Serum perfluorinated compound concentration and attention deficit/hyperactivity disorder in children 5–18 years of age. Environmental Health Perspectives, 119, 1466–1471. 10.1289/ehp.1003538 [DOI] [PMC free article] [PubMed] [Google Scholar]
- Stein CR, Wolff MS, Calafat AM, Kato K and Engel SM, 2012. Comparison of polyfluoroalkyl compound concentrations in maternal serum and amniotic fluid: a pilot study. Reproductive Toxicology, 34, 312–316. 10.1016/j.reprotox.2012.05.039 [DOI] [PMC free article] [PubMed] [Google Scholar]
- Stein CR, Savitz DA and Bellinger DC, 2013. Perfluorooctanoate and neuropsychological outcomes in children. Epidemiology, 24, 590–599. 10.1097/EDE.0b013e3182944432 [DOI] [PMC free article] [PubMed] [Google Scholar]
- Stein CR, Savitz DA, Elston B, Thorpe PG and Gilboa SM, 2014a. Perfluorooctanoate exposure and major birth defects. Reproductive Toxicology, 47, 15–20. [DOI] [PMC free article] [PubMed] [Google Scholar]
- Stein CR, Savitz DA and Bellinger DC, 2014b. Perfluorooctanoate exposure in a highly exposed community and parent and teacher reports of behaviour in 6–12‐year‐old children. Paediatric and Perinatal Epidemiology, 28, 146–156. 10.1111/ppe.12097 [DOI] [PMC free article] [PubMed] [Google Scholar]
- Stein CR, McGovern KJ, Pajak AM, Maglione PJ and Wolff M, 2016a. Perfluoroalkyl and polyfluoroalkyl substances and indicators of immune function in children aged 12–19 y: national health and nutrition examination survey. Pediatric Research, 79, 348–357. [DOI] [PMC free article] [PubMed] [Google Scholar]
- Stein CR, Ge Y, Wolff MS, Ye X, Calafat AM, Kraus T and Moran TM, 2016b. Perfluoroalkyl substance serum concentrations and immune response to FluMist vaccination among healthy adults. Environmental Research, 149, 171–178. [DOI] [PMC free article] [PubMed] [Google Scholar]
- Still M, Schlummer M, Gruber L, Dominik F and Wolz G, 2013. Impact of Industrial Production and Packaging Processes on them Concentration of Per‐ and Polyfluorinated Compounds in Milk and Dairy Products. Journal of Agricultural and Food Chemistry, 61, 9052–9062. [DOI] [PubMed] [Google Scholar]
- Stock NL, Muir DCG and Mabury SA, 2010. Perfluoroalkyl compounds In: Harrad S. (ed.). Persistent organic pollutants. Wiley, Chichester, UK: pp. 25–70. [Google Scholar]
- Strøm M, Hansen S, Olsen SF, Haug LS, Rantakokko P, Kiviranta H and Halldorsson TI, 2014. Persistent organic pollutants measured in maternal serum and offspring neurodevelopmental outcomes — A prospective study with long‐term follow‐up. Environment International, 68, 41–48. 10.1016/j.envint.2014.03.002 [DOI] [PubMed] [Google Scholar]
- Stubleski J, Salihovic S, Lind L, Lind PM, van Bavel B and Kärrman A, 2016. Changes in serum levels of perfluoroalkyl substances during a 10‐year follow‐up period in a large population‐based cohort. Environment International, 95, 86–92. 10.1016/j.envint.2016.08.002 [DOI] [PubMed] [Google Scholar]
- Su TC, Kuo CC, Hwang JJ, Lien GW, Chen MF and Chen PC, 2016. Serum perfluorinated chemicals, glucose homeostasis and the risk of diabetes in working‐aged Taiwanese adults. Environmental International, 88, 15–22. [DOI] [PubMed] [Google Scholar]
- Sundström M, Ehresman DJ, Bignert A, Butenhoff JL, Olsen GW, Chang S‐C and Bergman Å, 2011. A temporal trend study (1972–2008) of perfluorooctanesulfonate, perfluorohexanesulfonate, and perfluorooctanoate in pooled human milk samples from Stockholm, Sweden. Environment International, 37, 178–183. 10.1016/j.envint.2010.08.014 [DOI] [PubMed] [Google Scholar]
- Swedish EPA (Swedish Environmental Protection Agency), 2012. Environmental and Health Risk Assessment of Perfluoroalkylated and Polyfluoroalkylated Substances (PFASs) in Sweden. Report 6513, September 2012, 139 pp.
- Symonds ME, Pope M and Budge H, 2015. The ontogeny of brown adipose tissue. Annual Review of Nutrition, 35, 295–320. 10.1146/annurev-nutr-071813-105330 [DOI] [PubMed] [Google Scholar]
- Tan Y, Clewell HJ and Andersen ME, 2008. Time dependencies in perfluorooctylacids disposition in rat and monkeys: A kinetic analysis. Toxicology Letters, 177, 38–47. [DOI] [PubMed] [Google Scholar]
- Tan X, Xie G, Sun X, Li Q, Zhong W, Qiao P, Sun X, Jia W and Zhou Z, 2013. High fat diet feeding exaggerates perfluorooctanoic acid‐induced liver injury in mice via modulating multiple metabolic pathways. PLoS ONE, 8, e61409 10.1371/journal.pone.0061409 [DOI] [PMC free article] [PubMed] [Google Scholar]
- Taniyasu S, Kannan K, So MK, Gulkowska A, Sinclair E, Okazawa T and Yamashita N, 2005. Analysis of fluorotelomer alcohols, fluorotelomer acids, and short‐ and long‐chain perfluorinated acids in water and biota. Journal of Chromatography A, 1093, 89–97. [DOI] [PubMed] [Google Scholar]
- Tao L, Kannan K, Aldous KM, Mauer MP and Eadon GA, 2008. Biomonitoring of perfluorochemicals in plasma of New York State personnel responding to the World Trade Center disaster. Environmental Science and Technology, 42, 3472–3478. [DOI] [PubMed] [Google Scholar]
- Tarazona JV, Rodríguez C, Alonso E, Sáez M, González F, San Andrés MD, Jiménez B and San Andrés MI, 2016. Toxicokinetics of perfluorooctane sulfonate in rabbits under environmentally realistic exposure conditions and comparative assessment between mammals and birds. Toxicology Letters, 241, 200–206. 10.1016/j.toxlet.2015.11.002 [DOI] [PubMed] [Google Scholar]
- Taylor KW, Hoffman K, Thayer KA and Daniels JL, 2014. Polyfluoroalkyl chemicals and menopause among women 20‐65 years of age (NHANES). Environmental Health Perspectives, 122, 145–150. 10.1289/ehp.1306707 [DOI] [PMC free article] [PubMed] [Google Scholar]
- Thomford PJ, 2002. 104‐week dietary chronic toxicity and carcinogenicity study with perfluorooctane sulfonic acid potassium salt (PFOS; T‐6295) in rats. 6329‐183. Covance Laboratories Inc.
- Timmermann CAG, Rossing LI, GrØntved A, Ried‐Larsen M, Dålgard C, Andersen LB, Grandjean P, Nielsen F, Svendsen KD, Scheike T and Jensen TK, 2014. Adiposity and glycemic control in children exposed to perfluorinated compounds. Journal of clinical endocrinology and metabolism, 99, E608–E614. [DOI] [PubMed] [Google Scholar]
- Timmermann CAG, Budtz‐Jørgensen E, Petersen MS, Weihe P, Steuerwald U, Nielsen F, Jensen TK and Grandjean P, 2017. Shorter duration of breastfeeding at elevated exposures to perfluoroalkyl substances. Reproductive Toxicology, 68, 164–170. 10.1016/j.reprotox.2016.07.010 [DOI] [PMC free article] [PubMed] [Google Scholar]
- Tittlemier SA, Pepper K and Edwards L, 2006. Concentrations of perfluorooctanesulfonamides in Canadian total diet study composite food samples collected between 1992 and 2004. Journal of Agricultural and Food Chemistry, 54, 8385–8389. 10.1021/jf061713p [DOI] [PubMed] [Google Scholar]
- Tittlemier SA, Pepper K, Seymour C, Moisey J, Bronson R, Cao XL and Dabeka RW, 2007. Dietary exposure of Canadians to perfluorinated carboxylates and perfluorooctane sulfonate via consumption of meat, fish, fast foods, and food items prepared in their packaging. Journal of Agricultural and Food Chemistry, 55, 3203–3210. [DOI] [PubMed] [Google Scholar]
- Toft G, Jonsson BA, Lindh CH, Giwercman A, Spano M, Heederik D, Lenters V, Vermeulen R, Rylander L, Pedersen HS, Ludwicki JK, Zviezdai V and Bonde JP, 2012. Exposure to perfluorinated compounds and human semen quality in Arctic and European populations. Human Reproduction, 27, 2532–2540. 10.1093/humrep/des185 [DOI] [PubMed] [Google Scholar]
- Trier X, Granby K and Christensen JH, 2011. Polyfluorinated surfactants (PFS) in paper and board coatings for food packaging. Environmental Science and Pollution Research International, 18, 1108–1120. 10.1007/s11356-010-0439-3 [DOI] [PubMed] [Google Scholar]
- Trudel D, Horowitz L, Wormuth M, Scheringer M, Cousins IT and Hungerbühler K, 2008. Estimating consumer exposure to PFOS and PFOA. Risk Analysis, 28, 251–269. 10.1111/j.1539-6924.2008.01017.x [DOI] [PubMed] [Google Scholar]
- Tucker DK, Macon MB, Strynar MJ, Dagnino S, Andersen E and Fenton SE, 2015. The mammary gland is a sensitive pubertal target in CD‐1 and C57Bl/6 mice following perinatal perfluorooctanoic acid (PFOA) exposure. Reproductive Toxicology, 54, 26–36. 10.1016/j.reprotox.2014.12.002 [DOI] [PMC free article] [PubMed] [Google Scholar]
- Ubel FA, Sorenson SD and Roach DE, 1980. Health status of plant workers exposed to fluorochemicals – a preliminary report. American Industrial Hygiene Association Journal, 41(584), 589. [DOI] [PubMed] [Google Scholar]
- Uhl SA, James‐Todd T and Bell ML, 2013. Association of Osteoarthritis with Perfluorooctanoate and Perfluorooctane Sulfonate in NHANES 2003‐2008. Environmental Health Perspectives, 121, 447–452. 10.1289/ehp.1205673 [DOI] [PMC free article] [PubMed] [Google Scholar]
- Uhl , 2016. unpublished report Um‐MuKi Bratislava‐Vienna study. Personal communication from Maria Uhl (Umweltbundesamt, Austria) to Line S. Haug. Email 30 August 2016.
- US EPA (United States Environmental Protection Agency), 2014. Health Effects Document for Perfluorooctanoic Acid (PFOA). 268 pp.
- US EPA (United States Environmental Protection Agency), 2016a. Health Effects Support Document for Perfluorooctane Sulfonate (PFOS), EPA, May 2016. Available on line: https://www.epa.gov/sites/production/files/2016-05/documents/pfos_hesd_final_508.pdf
- US EPA (United States Environmental Protection Agency), 2016b. Health Effects Support Document for Perfluorooctanoic Acid (PFOA), EPA, May 2016. Available on line: https://www.epa.gov/sites/production/files/2016-05/documents/pfoa_hesd_final-plain.pdf
- Vanden Heuvel JP, Kuslikis BI, Van Rafelghem MJ and Peterson RE, 1991. Tissue distribution, metabolism, and elimination of perfluorooctanoic acid in male and female rats. Journal of Biochemical Toxicology, 6, 83–92. [DOI] [PubMed] [Google Scholar]
- Van Der Veen I, Weiss J, Van Leeuwen SPJ, Cofino W and Crum S, 2012. 5th Interlaboratory study on perfluoroalkyl substances (PFAS) in food and environmental samples. Report W‐12/09 Institute of Environmental Studies (IVM), University of Amsterdam.
- Van Esterik JC, Bastos Sales L, Dollé ME, Håkansson H, Herlin M, Legler J and van der Ven LT, 2016. Programming of metabolic effects in C57BL/6JxFVB mice by in utero and lactational exposure to perfluorooctanoic acid. Archives of Toxicology, 90, 701–715. 10.1007/s00204-015-1488-7 [DOI] [PMC free article] [PubMed] [Google Scholar]
- Van Leeuwen SPJ, Kärrman A, Van Bavel B, De Boer J and Lindström G, 2006. Struggle for quality in determination of perfluorinated contaminants in environmental and human samples. Environmental Science and Technology, 40, 7854–7860. [DOI] [PubMed] [Google Scholar]
- Van Leeuwen SPJ, van Velzen MJM, Swart CP, van der Veen I, Traag WA and de Boer J, 2009. Halogenated contaminants in farmed salmon, trout, tilapia, pangasius, and shrimp. Environmental Science and Technology, 43, 4009–4015. 10.1021/es803558r [DOI] [PubMed] [Google Scholar]
- van Zelm R, Huijbregts MAJ, Russell MH, Jager T and van de Meent D, 2008. Modeling the environmental fate of perfluorooctanoate and its precursors from global fluorotelomer acrylate polymer use. Environmental Toxicology and Chemistry, 27, 2216–2223. [DOI] [PubMed] [Google Scholar]
- Vassiliadou I, Costopoulou D, Nkalogeropoulos N, Karavoltsos S, Sakellari A, Zafeiraki E, Dassenakis M and Leondiadis L, 2015. Levels of perfluorinated compounds in raw and cooked Mediterranean finfish and shellfish. Chemosphere, 127, 117–126. [DOI] [PubMed] [Google Scholar]
- Vélez MP, Arbuckle TE and Fraser WD, 2015. Maternal exposure to perfluorinated chemicals and reduced fecundity: the MIREC study. Human Reproduction, 30, 701–709. 10.1093/humrep/deu350 [DOI] [PMC free article] [PubMed] [Google Scholar]
- Verner MA, Loccisano AE, Morken NH, Yoon M, Wu H, McDougall R, Maisonet M, Marcus M, Kishi R, Miyashita C, Chen MH, Hsieh WS, Andersen ME, Clewell HJ 3rd and Longnecker MP, 2015. Associations of Perfluoroalkyl Substances (PFAS) with Lower Birth Weight: An Evaluation of Potential Confounding by Glomerular Filtration Rate Using a Physiologically Based Pharmacokinetic Model (PBPK). Environmental Health Perspectives, 123, 1317–1324. 10.1289/ehp.1408837 [DOI] [PMC free article] [PubMed] [Google Scholar]
- Verner MA, Ngueta G, Jensen ET, Fromme H, Volkel W, Nygaard UC, Granum B and Longnecker MP, 2016. A simple pharmacokinetic model of prenatal and postnatal exposure to perfluoroalkyl substances (PFASs). Environmental Science and Technology, 50, 978–986. 10.1021/acs.est.5b04399 [DOI] [PubMed] [Google Scholar]
- Vested A, Ramlau‐Hansen CH, Olsen SF, Bonde JP, Kristensen SL, Halldorsson TI, Becher G, Haug LS, Ernst EH and Toft G, 2013. Associations of in utero exposure to perfluorinated alkyl acids with human semen quality and reproductive hormones in adult men. Environmental Health Perspectives, 121, 453–458. 10.1289/ehp.1205118 [DOI] [PMC free article] [PubMed] [Google Scholar]
- Vestergaard S, Nielsen F, Andersson AM, Hjøllund NH, Grandjean P, Andersen HR and Jensen TK, 2012. Association between perfluorinated compounds and time to pregnancy in a prospective cohort of Danish couples attempting to conceive. Human Reproduction, 27, 873–880. 10.1093/humrep/der450 [DOI] [PubMed] [Google Scholar]
- Vestergren R and Cousins IT, 2009. Tracking the pathways of human exposure to perfluorocarboxylates. Environmental Science and Technology, 43, 5565–5575. [DOI] [PubMed] [Google Scholar]
- Vestergren R, Ullah S, Cousins IT and Berger U, 2012. A matrix effect‐free method for reliable quantification of perfluoroalkyl carboxylic acids and perfluoroalkane sulfonic acids at low parts per trillion levels in dietary samples. Journal of Chromatography A, 1237, 64–71. 10.1016/j.chroma.2012.03.023 [DOI] [PubMed] [Google Scholar]
- Vestergren R and Cousins IT, 2013. 12 ‐ Human dietary exposure to per‐ and poly‐fluoroalkyl substances (PFASs) In: Rose M, Fernandes A. (eds.). Persistent Organic Pollutants and Toxic Metals in Foods. Woodhead Publishing, Cambridge: 279–307. [Google Scholar]
- Vestergren R, Orata F, Berger U and Cousins IT, 2013. Bioaccumulation of perfluoroalkyl acids in dairy cows in a naturally contaminated environment. Environmental Science and Pollution Research, 20, 7959–7969. [DOI] [PubMed] [Google Scholar]
- Vetvicka V and Vetvickova J, 2013. Reversal of perfluorooctanesulfonate‐induced immunotoxicity by a glucan‐resveratrol‐vitamin C combination. Oriental Pharmacy and Experimental Medicine, 13, 77–84. [Google Scholar]
- Vieira VM, Hoffman K, Shin HM, Weinberg JM, Webster TF and Fletcher T, 2013. Perfluorooctanoic acid exposure and cancer outcomes in a contaminated community: a geographic analysis. Environmental Health Perspectives, 121, 318–323. 10.1289/ehp.1205829 [DOI] [PMC free article] [PubMed] [Google Scholar]
- Viswakarma N, Jia Y, Bai L, Vluggens A, Borensztajn J, Xu J and Reddy JK, 2010. Coactivators in PPAR‐Regulated Gene Expression. PPAR Research, 2010, Article ID 250126, 21 pp. 10.1155/2010/250126 [DOI] [PMC free article] [PubMed] [Google Scholar]
- de Voogt P, Berger U, deCoen W , deWolf W , Heimstad E, McLachlan M, vanLeeuwen S and vanRoon A , 2006. Perfluorinated organic compounds in the European environment (Perforce). Report to the EU, University of Amsterdam, Amsterdam, NL. pp1‐126.
- Vorkamp K, Nielsen F, Kyhl HB, Husby S, Nielsen LB, Barington T, Andersson AM and Jensen TK, 2014. Polybrominated diphenyl ethers and perfluoroalkyl substances in serum of pregnant women: levels, correlations, and potential health implications. Archives of Environmental Contamination and Toxicology, 67, 9–20. 10.1007/s00244-013-9988-z [DOI] [PubMed] [Google Scholar]
- Vuong AM, Yolton K, Webster GM, Sjödin A, Calafat AM, Braun JM, Dietrich KN, Lanphear BP and Chen A, 2016. Prenatal polybrominated diphenyl ether and perfluoroalkyl substance exposures and executive function in school‐age children. Environmental Research, 147, 556–564. 10.1016/j.envres.2016.01.008 [DOI] [PMC free article] [PubMed] [Google Scholar]
- Walters MW and Wallace KB, 2010. Urea cycle gene expression is suppressed by PFOA treatment in rats. Toxicology Letters, 197, 46–50. 10.1016/j.toxlet.2010.04.027 [DOI] [PubMed] [Google Scholar]
- Walters MW, Bjork JA and Wallace KB, 2009. Perfluorooctanoic acid stimulated mitochondrial biogenesis and gene transcription in rats. Toxicology, 264, 10–15. 10.1016/j.tox.2009.07.003 [DOI] [PubMed] [Google Scholar]
- Wan HT, Zhao YG, Wong MH, Lee KF, Yeung WS, Giesy JP and Wong CK, 2011. Testicular signaling is the potential target of perfluorooctanesulfonate‐mediated subfertility in male mice. Biology of Reproduction, 84, 1016–1023. 10.1095/biolreprod.110.089219 [DOI] [PubMed] [Google Scholar]
- Wan HT, Zhao YG, Wei X, Hui KY, Giesy JP and Wong CKC, 2012. PFOS‐induced hepatic steatosis, the mechanistic actions on β‐oxidation and lipid transport. Biochimica et Biophysica Acta (BBA) ‐ General Subjects, 1820, 1092–1101. 10.1016/j.bbagen.2012.03.010 [DOI] [PubMed] [Google Scholar]
- Wan HT, Leung PY, Zhao YG, Wei X, Wong MH and Wong CKC, 2013. Blood plasma concentrations of endocrine disrupting chemicals in Hong Kong populations. Journal of Hazardous Materials, 261, 763–769. 10.1016/j.jhazmat.2013.01.034 [DOI] [PubMed] [Google Scholar]
- Wan HT, Zhao YG, Leung PY and Wong CKC, 2014. Perinatal Exposure to Perfluorooctane Sulfonate Affects Glucose Metabolism in Adult Offspring. PLoS ONE, 9(1), e87137 10.1371/journal.pone.0087137 [DOI] [PMC free article] [PubMed] [Google Scholar]
- Wang F, Liu W, Jin Y, Dai J, Yu W, Liu X and Liu L, 2010. Transcriptional Effects of Prenatal and Neonatal Exposure to PFOS in Developing Rat Brain. Environmental Science and Technology, 44, 1847–1853. [DOI] [PubMed] [Google Scholar]
- Wang Y, Wang L, Liang Y, Qiu W, Zhang J, Zhou Q and Jiang G, 2011a. Modulation of dietary fat on the toxicological effects in thymus and spleen in BALB/c mice exposed to perfluorooctane sulfonate. Toxicology Letters, 204, 174–182. [DOI] [PubMed] [Google Scholar]
- Wang IJ, Hsieh WS, Chen CY, Fletcher T, Lien GW, Chiang HL, Chiang CF, Wu TN and Chen PC, 2011b. The effect of prenatal perfluorinated chemicals exposures on pediatric atopy. Environmental Research, 111, 785–791. [DOI] [PubMed] [Google Scholar]
- Wang J, Zhang Y, Zhang W, Jin Y and Dai J, 2012. Association of perfluorooctanoic acid with HDL cholesterol and circulation miR‐26b and miR‐199‐3p in workers of a fluorochemical plant and nearby residents. Environmental Science & Technology, 46, 9274–9281. [DOI] [PubMed] [Google Scholar]
- Wang L, Wang Y, Liang Y, Li J, Liu Y, Zhang J, Zhang A, Fu J and Jiang G, 2013a. Specific accumulation of lipid droplets in hepatocyte nuclei of PFOA‐exposed BALB/c mice. Scientific Reports, 3, 2174; 10.1038/srep02174 [DOI] [PMC free article] [PubMed] [Google Scholar]
- Wang Y, Starling AP, Haug LS, Eggesbo M, Becher G, Thomsen C, Travlos G, King D, Hoppin JA, Rogan WJ and Longnecker MP, 2013b. Association between Perfluoroalkyl substances and thyroid stimulating hormone among pregnant women: a cross‐sectional study. [DOI] [PMC free article] [PubMed]
- Wang L, Wang Y, Liang Y, Li J, Liu Y, Zhang J, Zhang A, Fu J and Jiang G, 2014a. PFOS induced lipid metabolism disturbances in BALB/c mice through inhibition of low density lipoproteins excretion. Scientific Reports, 4, 4582 10.1038/srep04582 [DOI] [PMC free article] [PubMed] [Google Scholar]
- Wang Y, Rogan WJ, Chen PC, Lien GW, Chen HY, Tseng YC, Longnecker MP and Wang SL, 2014b. Association between Maternal Serum Perfluoroalkyl Substances during.Pregnancy and Maternal and Cord Thyroid Hormones: Taiwan Maternal and Infant Cohort Study. Environmental Health Perpectives, 122, 529–534. [DOI] [PMC free article] [PubMed] [Google Scholar]
- Wang Y, Zhoa H, Zhang Q, Liu W and Quan X, 2015a. Perfluorooctane sulfonate induces apoptosis of hippocampal neurons in rat offspring associated with calcium overload. Toxicology Research, 4, 931–938. [Google Scholar]
- Wang Y, Zhang X, Wang M, Cao Y, Wang X, Liu Y, Wang J, Wang J, Wu L, Hei TK, Luan Y and Xu A, 2015b. Mutagenic effects of perfluorooctanesulfonic acid in GPT delta transgenic system are mediated by hydrogen peroxide. Environmental Science and Technology, 49, 6294–6303. [DOI] [PubMed] [Google Scholar]
- Wang Y, Rogan WJ, Chen HY, Chen PC, Su PH, Chen HY and Wang SL, 2015c. Prenatal exposure to perfluroalkyl substances and children's IQ: The Taiwan maternal and infant cohort study. International Journal of Hygiene and Environmental Health, 218, 639–644. [DOI] [PMC free article] [PubMed] [Google Scholar]
- Wang J, Yan S, Zhang W, Zhang H and Dai J, 2015d. Integrated proteomic and miRNA transcriptional analysis reveals the hepatotoxicity mechanism of PFNA exposure in mice. Journal of Proteome Research, 14, 330–341. 10.1021/pr500641b [DOI] [PubMed] [Google Scholar]
- Wang Y, Adgent M, Su PH, Chen HY, Chen PC, Hsiung CA and Wang SL, 2016. Prenatal exposure to perfluorocarboxylic acids (PFCAs) and fetal and postnatal growth in the Taiwan Maternal and Infant Cohort Study. Environmental Health Perspectives, 124, 1794–1800. 10.1289/ehp.1509998 [DOI] [PMC free article] [PubMed] [Google Scholar]
- Washburn ST, Bingman TS, Braithwaite SK, Buck RC, Buxton LW, Clewell HJ, Haroun LA, Kester JE, Rickard RW and Shipp AM, 2005. Exposure assessment and risk characterization for perfluorooctanoate in selected consumer articles. Environmental Science and Technology, 39, 3904–3910. [DOI] [PubMed] [Google Scholar]
- Washino N, Saijo Y, Sasaki S, Kato S, Ban S, Konishi K, Ito R, Nakata A, Iwasaki Y, Saito K, Nakazawa H and Kishi R, 2009. Correlations between prenatal exposure to perfluorinated chemicals and reduced fetal growth. Environmental Health Perspectives, 117, 660–667. 10.1289/ehp.11681 [DOI] [PMC free article] [PubMed] [Google Scholar]
- Watkins DJ, Josson J, Elston B, Bartell SM, Shin HM, Vieira VM, Savitz DA, Fletcher T and Wellenius GA, 2013. Exposure to perfluoroalkyl acids and markers of kidney function among children and adolescents living near a chemical plant. Environmental Health Perspectives, 121, 625–630. 10.1289/ehp.1205838 [DOI] [PMC free article] [PubMed] [Google Scholar]
- Watkins DJ, Wellenius GA, Butler RA, Bartell SM, Fletcher T and Kelsey KT, 2014. Associations between serum perfluoroalkyl acids and LINE‐1 DNA methylation. Environment International, 63, 71–76. 10.1016/j.envint.2013.10.018 [DOI] [PMC free article] [PubMed] [Google Scholar]
- Weaver YM, Ehresman DJ, Butenhoff JL and Hagenbuch B, 2010. Roles of rat renal organic anion transporters in transporting perfluorinated carboxylates with different chain lengths. Toxicological Sciences, 113, 305–314. 10.1093/toxsci/kfp275 [DOI] [PMC free article] [PubMed] [Google Scholar]
- Webster CM, Venners SA, Mattman A and Martin JW, 2014. Associations between perfluoroalkyl acids (PFASs) and maternal thyroid hormones in early pregnancy: a population‐based cohort study. Environmental Research, 133, 338–347. 10.1016/j.envres.2014.06.012 [DOI] [PubMed] [Google Scholar]
- Webster GM, Rauch SA, Marie NS, Mattman A, Lanphear BP and Venners SA, 2016. Cross‐sectional associations of serum perfluoroalkyl acids and thyroid hormones in U.S. adults: Variation according to TPOAb and iodine status (NHANES 2007–2008). Environmental Health Perspectives, 124, 935–942. 10.1289/ehp.1409589 [DOI] [PMC free article] [PubMed] [Google Scholar]
- Weiss JM, Andersson PL, Lamoree MH, Leonards PE, van Leeuwen SP and Hamers T, 2009. Competitive binding of poly‐ and perfluorinated compounds to the thyroid hormone transport protein transthyretin. Toxicological Sciences, 109, 206–216. 10.1093/toxsci/kfp055 [DOI] [PubMed] [Google Scholar]
- Wen LL, Lin LY, Su TC, Chen PC and Lin CY, 2013. Association between serum perfluorinated chemicals and thyroid function in U.S. adults: the National Health and Nutrition Examination Survey 2007‐2010. Journal of Clinical Endocrinology and Metabolism, 98, E1456–E1464. 10.1210/jc.2013-1282 [DOI] [PubMed] [Google Scholar]
- White SS, Calafat AM, Kuklenyik Z, Villanueva L, Zehr RD, Helfant L, Strynar MJ, Lindstrom AB, Thibodeaux JR, Wood C and Fenton SE, 2007. Gestational PFOA exposure of mice is associated with altered mammary gland development in dams and female offspring. Toxicological Sciences, 96, 133–144. [DOI] [PubMed] [Google Scholar]
- White SS, Kato K, Jia LT, Basden BJ, Calafat AM, Hines EP, Stanko JP, Wolf CJ, Abbott BD and Fenton SE, 2009. Effects of perfluorooctanoic acid on mouse mammary gland development and differentiation resulting from cross‐foster and restricted gestational exposures. Reproductive Toxicology, 27, 289–298. 10.1016/j.reprotox.2008.11.054 [DOI] [PMC free article] [PubMed] [Google Scholar]
- White SS, Stanko JP, Kato K, Calafat AM, Hines EP and Fenton SE, 2011. Gestational and chronic low‐dose PFOA exposures and mammary gland growth and differentiation in three generations of CD‐1 mice. Environmental Health Perspectives, 119, 1070–1076. 10.1289/ehp.1002741 [DOI] [PMC free article] [PubMed] [Google Scholar]
- Whitworth KW, Haug LS, Baird DD, Becher G, Hoppin JA, Skjaerven R, Thomsen C, Eggesbo M, Travlos G, Wilson R, Cupul‐Uicab LA, Brantsaeter AL and Longnecker MP, 2012a. Perfluorinated Compounds in Relation to Birth Weight in the Norwegian Mother and Child Cohort Study. American Journal of Epidemiology, 175, 1209–1216. 10.1093/aje/kwr459 [DOI] [PMC free article] [PubMed] [Google Scholar]
- Whitworth KW, Haug LS, Baird DD, Becher G, Hoppin JA, Skjaerven R, Thomsen C, Eggesbo M, Travlos G, Wilson R and Longnecker MP, 2012b. Perfluorinated compounds and subfecundity in pregnant women. Epidemiology, 23, 257–263. 10.1097/EDE.0b013e31823b5031 [DOI] [PMC free article] [PubMed] [Google Scholar]
- WHO/IPCS (World Health Organization/International Programme on Chemical Safety), 2009. Environmental Health Criteria 240. Principles and methods for the assessment of chemicals in food. Available online: http://www.who.int/foodsafety/publications/chemical-food/en/
- WHO/IPCS , 2010. Characterization and application of physiologically based pharmacokinetic models in risk assessment IPCS Harmonization Project Document No. 9, WHO/IPCS, Geneva, Switzerland
- Wielsøe M, Long M, Ghisari M and Bonefeld‐Jørgensen EC, 2015. Perfluoroalkylated substances (PFAS) affect oxidative stress biomarkers in vitro. Chemosphere, 129, 239–245. 10.1016/j.chemosphere.2014.10.014 [DOI] [PubMed] [Google Scholar]
- Wild S, McLagan D, Schlabach M, Bossi R, Hawker D, Cropp R, King CK, Stark JS, Mondon J and Nash SB, 2015. An Antarctic research station as a source of brominated and perfluorinated persistent organic pollutants to the local environment. Environmental Science and Technology, 49(1), 103–112. [DOI] [PubMed] [Google Scholar]
- Wilhelm M, Hölzer J, Dobler L, Rauchfuss K, Midasch O, Kraft M, Angerer J and Wiesmüller G, 2009. Preliminary observations on perfluorinated compounds in plasma samples (1977–2004) of young German adults from an area with perfluorooctanoate‐contaminated drinking water. International Journal of Hygiene and Environmental Health, 212, 142–145. 10.1016/j.ijheh.2008.04.008 [DOI] [PubMed] [Google Scholar]
- Wilhelm M, Wittsiepe J, Völkel W, Fromme H and Kasper‐Sonnenberg M, 2015. Perfluoroalkyl acids in children and their mothers: Association with drinking water and time trends of inner exposures—Results of the Duisburg birth cohort and Bochum cohort studies. International Journal of Hygiene and Environmental Health, 218, 645–655. 10.1016/j.ijheh.2015.07.001 [DOI] [PubMed] [Google Scholar]
- Winquist A and Steenland K, 2014a. Perfluorooctanoic acid exposure and thyroid disease in community and worker cohorts. Epidemiology, 25, 255–264. 10.1097/ede.0000000000000040 [DOI] [PubMed] [Google Scholar]
- Winquist A and Steenland K, 2014b. Modeled PFOA exposure and coronary artery disease, hypertension and high cholesterol in community and worker cohorts. Environmental Health Perspectives, 122, 1299–1305. [DOI] [PMC free article] [PubMed] [Google Scholar]
- Winquist A, Lally C, Shin HM and Steenland K, 2013. Design, methods and population for a study of PFOA health effects among highly exposed mid‐Ohio Valley community residents and workers. Environmental Health Perspectives, 121, 893–899. [DOI] [PMC free article] [PubMed] [Google Scholar]
- Wolf DC, Moore T, Abbott BD, Rosen MB, Das KP, Zehr RD, Lindstrom AB, Strynar MJ and Lau C, 2008a. Comparative hepatic effects of perfluorooctanoic acid and WY 14,643 in PPAR‐alpha knockout and wild‐type mice. Toxicologic Pathology, 36, 632–639. 10.1177/0192623308318216 [DOI] [PubMed] [Google Scholar]
- Wolf CJ, Takacs ML, Schmid JE, Lau C and Abbott BD, 2008b. Activation of mouse and human peroxisome proliferator‐activated receptor alpha by perfluoroalkyl acids of different functional groups and chain lengths. Toxicological Sciences, 106, 162–171. 10.1093/toxsci/kfn166 [DOI] [PubMed] [Google Scholar]
- Wolf CJ, Rider CV, Lau C and Abbott BD, 2014. Evaluating the additivity of perfluoroalkyl acids in binary combinations on peroxisome proliferator‐activated receptor‐α activation. Toxicology, 316, 43–54. 10.1016/j.tox.2013.12.002 [DOI] [PubMed] [Google Scholar]
- Wong F, MacLeod M, Mueller JF and Cousins IT, 2014. Enhanced elimination of perfluorooctane sulfonic acid by menstruating women: evidence from population‐based pharmacokinetic modeling. Environmental Science and Technology, 48, 8807–8814. 10.1021/es500796y [DOI] [PubMed] [Google Scholar]
- Woodcroft MW, Ellis DA, Rafferty SP, Burns DC, March RE, Stock NL, Trumpour KS, Yee J and Munro K, 2010. Experimental characterization of the mechanism of perfluorocarboxylic acids’ liver protein bioaccumulation: the key role of the neutral species. Environmental Toxicology and Chemistry, 29, 1669–1677. 10.1002/etc.199 [DOI] [PubMed] [Google Scholar]
- Worley RR, Yang X and Fisher J, 2017. Physiologically based pharmacokinetic modeling of human exposure to perfluorooctanoic acid suggests historical non drinking‐water exposures are important for predicting current serum concentrations. Toxicology and Applied Pharmacology, 330, 9–21. 10.1016/j.taap.2017.07.001 [DOI] [PMC free article] [PubMed] [Google Scholar]
- Woskie SR, Gore R and Steenland K, 2012. Retrospective exposure assessment of perfluorooctanoic acid serum concentrations at a fluoropolymer manufacturing plant. Annals of Occupational Hygiene, 56, 1025–1037. [DOI] [PubMed] [Google Scholar]
- Wu K, Xu X, Peng L, Liu J, Guo Y and Huo X, 2012. Association between maternal exposure to perfluorooctanoic acid (PFOA) from electronic waste recycling and neonatal health outcomes. Environment International, 48, 1–8. 10.1016/j.envint.2012.06.018 [DOI] [PubMed] [Google Scholar]
- Wu H, Yoon M, Verner MA, Xue J, Luo M, Andersen ME, Longnecker MP and Clewell HJ 3rd, 2015. Can the observed association between serum perfluoroalkyl substances and delayed menarche be explained on the basis of puberty‐related changes in physiology and pharmacokinetics? Environment International, 82, 61–68. 10.1016/j.envint.2015.05.006 [DOI] [PubMed] [Google Scholar]
- Xia W, Wan Y, Li YY, Zeng H, Lv Z, Li G, Wei Z and Xu SQ, 2011. PFOS prenatal exposure induce mitochondrial injury and gene expression change in hearts of weaned SD rats. Toxicology, 282, 23–29. [DOI] [PubMed] [Google Scholar]
- Xiao F, Simcik MF and Gulliver JS, 2012. Partitioning Characteristics of Perfluorooctane Sulfonate Between Water and Foods. Archives of Environmental Contamination and Toxicology, 62, 42–48. [DOI] [PubMed] [Google Scholar]
- Xie Y, Yang Q, Nelson BD and DePierre JW, 2002. Characterization of the adipose tissue atrophy induced by peroxisome proliferators in mice. Lipids, 37, 139–146. [DOI] [PubMed] [Google Scholar]
- Xie Y, Yang Q, Nelson BD and DePierre JW, 2003. The relationship between liver peroxisome proliferation and adipose tissue atrophy induced by peroxisome proliferator exposure and withdrawal in mice. Biochemical Pharmacology, 66, 749–756. 10.1016/s0006-2952(03)00386-1 [DOI] [PubMed] [Google Scholar]
- Xing J, Wang G, Zhao J, Wang E, Yin B, Fang D, Zhao J, Zhang H, Chen YQ and Chen W, 2016. Toxicity assessment of perfluorooctane sulfonate using acute and subchronic male C57BL/6J mouse models. Environmental Pollution, 210, 388–396. 10.1016/j.envpol.2015.12.008 [DOI] [PubMed] [Google Scholar]
- Xu D, Li C, Wen Y and Liu W, 2013. Antioxidant defense system responses and DNA damage of earthworms exposed to perfluorooctane sulfonate (PFOS). Environmental Pollution, 174, 121–127. [DOI] [PubMed] [Google Scholar]
- Yahia D, Tsukuba C, Yoshida M, Sato I and Tsuda S, 2008. Neonatal death of mice treated with perfluorooctane sulfonate. Journal of Toxicological Sciences, 33, 219–226. [DOI] [PubMed] [Google Scholar]
- Yahia D, El‐Nasser MA, Abedel‐Latif M, Tsukuba C, Yoshida M, Sato I and Tsuda S, 2010. Effects of perfluorooctanoic acid (PFOA) exposure to pregnant mice on reproduction. Journal of Toxicological Sciences, 35, 527–533. [DOI] [PubMed] [Google Scholar]
- Yahia D, Haruka I, Kagashi Y and Tsuda S, 2014. 8‐Hydroxy‐2’‐deoxyguanosine as a biomarker of oxidative DNA damage induced by perfluorinated compounds in TK6 cells. Environmental Toxicology, 31, 192–200. 10.1002/tox.22034 [DOI] [PubMed] [Google Scholar]
- Yan S, Wang J and Dai J, 2015. Activation of sterol regulatory element‑binding proteins in mice exposed to perfluorooctanoic acid for 28 days. Molecular Toxicology, 89, 1569–1578. 10.1007/s00204-014-1322-7 [DOI] [PubMed] [Google Scholar]
- Yang Q, Nagano T, Shah Y, Cheung C, Ito S and Gonzalez FJ, 2008. The PPAR alpha‐humanized mouse: a model to investigate species differences in liver toxicity mediated by PPAR alpha. Toxicological Sciences, 101, 132–139. 10.1093/toxsci/kfm206 [DOI] [PMC free article] [PubMed] [Google Scholar]
- Yang CH, Glover KP and Han X, 2009a. Organic anion transporting polypeptide (Oatp) 1a1‐mediated perfluorooctanoate transport and evidence for a renal reabsorption mechanism of Oatp1a1 in renal elimination of perfluorocarboxylates in rats. Toxicology Letter, 190, 163–171. [DOI] [PubMed] [Google Scholar]
- Yang C, Tan YS, Harkema JR and Haslam SZ, 2009b. Differential effects of peripubertal exposure to perfluorooctanoic acid on mammary gland development in C57Bl/6 and Balb/c mouse strains. Reproductive Toxicology, 27, 299–306. [DOI] [PMC free article] [PubMed] [Google Scholar]
- Yang X, Wang L, Sun W and Xue Z, 2009c. [Effects of perfluorooctane sulfonate on amino acid neurotransmitters and glutamine synthetase in rats] [Article in Chinese]. Journal of Hygiene Research ‐ Wei Sheng Yan Jiu, 38, 19–21. [PubMed] [Google Scholar]
- Yang CH, Glover KP and Han X, 2010. Characterization of cellular uptake of perfluorooctanoate via organic anion‐transporting polypeptide 1A2, organic anion transporter 4, and urate transporter 1 for their potential roles in mediating human renal reabsorption of perfluorocarboxylates. Toxicological Sciences, 117, 294–302. [DOI] [PubMed] [Google Scholar]
- Yang B, Zou W, Hu Z, Liu F, Zhou L, Yang S, Kuang H, Wu L, Wei J, Wang J, Zou T and Zhang D, 2014. Involvement of oxidative stress and inflammation in liver injury caused by perfluorooctanoic acid exposure in mice. BioMed Research International, 2014, 409837 10.1155/2014/409837 [DOI] [PMC free article] [PubMed] [Google Scholar]
- Yang L, Li J, Lai J, Luan H, Cai Z, Wang Y, Zhao Y and Wu Y, 2016. Placental transfer of perfluoroalkyl substances and associations with thyroid hormones: Beijing prenatal exposure study. Scientific Reports, 6:21699. 10.1038/srep21699 [DOI] [PMC free article] [PubMed] [Google Scholar]
- Yao X and Zhong L, 2005. Genotoxic risk and oxidative DNA damage in HepG2 cells exposed to perfluorooctanoic acid. Mutation Research, 587(1–2), 38–44. 10.1016/j.mrgentox.2005.07.010 PMID:16219484. [DOI] [PubMed] [Google Scholar]
- Yeung LWY, Guruge KS, Taniyasu S, Yamashita N, Angus PW and Herath CB, 2013a. Profiles of perfluoroalkyl substances in the liver and serum of patients with liver cancer and cirrhosis in Australia. Ecotoxicology and Environmental Safety, 96, 139–146. 10.1016/j.ecoenv.2013.06.006 [DOI] [PubMed] [Google Scholar]
- Yeung LW, Robinson SJ, Koschorreck J and Mabury SA, 2013b. Part I. A temporal study of PFCAs and their precursors in human plasma from two German cities 1982‐2009. Environmental Science and Technology, 47, 3865–3874. 10.1021/es303716k [DOI] [PubMed] [Google Scholar]
- Yeung LW, Robinson SJ, Koschorreck J and Mabury SA, 2013c. Part II. A temporal study of PFOS and its precursors in human plasma from two German cities in 1982‐2009. Environmental Science and Technology, 47, 3875–3882. 10.1021/es4004153 [DOI] [PubMed] [Google Scholar]
- Ylinen M, Hanhijärvi H, Peura P and Rämö O, 1985. Quantitative gas chromatographic determination of perfluorooctanoic acid as the benzyl ester in plasma and urine. Archives of Environmental Contamination and Toxicology, 14, 713–717. [DOI] [PubMed] [Google Scholar]
- Young CJ and Mabury SA, 2010. Atmospheric perfluorinated acid precursors: chemistry, occurrence, and impacts. Reviews of Environmental Contamination and Toxicology, 208, 1–109. 10.1007/978-1-4419-6880-7_1 [DOI] [PubMed] [Google Scholar]
- Yu WG, Liu W and Jin YH, 2009. Effects of perfluorooctane sulfonate on rat thyroid hormone biosynthesis and metabolism. Environmental Toxicology and Chemistry, 28, 990–996. 10.1897/08-345.1 [DOI] [PubMed] [Google Scholar]
- Yu WG, Liu W, Liu L and Jin YH, 2011. Perfluorooctane sulfonate increased hepatic expression of OAPT2 and MRP2 in rats. Archives of Toxicology, 85, 613–621. [DOI] [PubMed] [Google Scholar]
- Zeng HC, Li YY, Zhang L, Wang YJ, Chen J, Xia W, Lin Y, Wei J, Lv ZQ, Li M and Xu SQ, 2011a. Prenatal exposure to perfluorooctanesulfonate in rat resulted in long‐lasting changes of expression of synapsins and synaptophysin. Synapse (New York, N. Y.), 65, 225–233. 10.1002/syn.20840 [DOI] [PubMed] [Google Scholar]
- Zeng HC, Zhang L, Li YY, Wang YJ, Xia W, Lin Y, Wei J and Xu SQ, 2011b. Inflammation‐like glial response in rat brain induced by prenatal PFOS exposure. Neurotoxicology, 32, 130–139. 10.1016/j.neuro.2010.10.001 [DOI] [PubMed] [Google Scholar]
- Zeng XW, Qian Z, Emo B, Vaughn M, Bao J, Qin XD, Zhu Y, Li J, Lee YL and Dong GH, 2015. Association of polyfluoroalkyl chemical exposure with serum lipids in children. Science of Total Environment, 512–513, 364–370. [DOI] [PubMed] [Google Scholar]
- Zhang H, Shi Z, Liu Y, Wei Y and Dai J, 2008. Lipid homeostasis and oxidative stress in the liver of male rats exposed to perfluorododecanoic acid. Toxicology and Applied Pharmacology, 227, 16–25. [DOI] [PubMed] [Google Scholar]
- Zhang X, Chen L, Fei XC, Ma YS and Gao HW, 2009. Binding of PFOS to serum albumin and DNA: insight into the molecular toxicity of perfluorochemicals. BMC Molecular Biology, 10, 16 10.1186/1471-2199-10-16 [DOI] [PMC free article] [PubMed] [Google Scholar]
- Zhang L, Li YY, Zeng HC, Li M, Wan YJ, Schluesener HJ, Zhang ZY and Xu SQ, 2011. Perfluorooctane Sulfonate Induces Apoptosis in N9 Microglial Cell Line. International Journal of Toxicology, 30, 207–215. [DOI] [PubMed] [Google Scholar]
- Zhang L, Ren XM and Guo LH, 2013a. Structure‐Based Investigation on the Interaction of Perfluorinated Compounds with Human Liver Fatty Acid Binding Protein. Environmental Science & Technology, 47, 11293–11301. [DOI] [PubMed] [Google Scholar]
- Zhang T, Sun H, Lin Y, Qin X, Zhang Y, Geng X and Kannan K, 2013b. Distribution of poly‐ and perfluoroalkyl substances in matched samples from pregnant women and carbon chain length related maternal transfer. Environmental Science and Technology, 47, 7974–7981. 10.1021/es400937y [DOI] [PubMed] [Google Scholar]
- Zhang Y, Beesoon S, Zhu L and Martin JW, 2013c. Biomonitoring of perfluoroalkyl acids in human urine and estimates of biological half‐life. Environmental Science and Technology, 47, 10619–10627. 10.1021/es401905e [DOI] [PubMed] [Google Scholar]
- Zhang Y‐H, Wang J, Dong G‐H, Liu M‐M, Wang D, Zheng L and Jin Y‐H, 2013d. Mechanism of perfluorooctanesulfonate (PFOS)‐induced apoptosis in the immunocyte. Journal of Immunotoxicology, 10, 49–58. [DOI] [PubMed] [Google Scholar]
- Zhang T and Qin X, 2014. Assessment of fetal exposure and maternal elimination of perfluoroalkyl substances. Environmental Science. Processes and impacts, 16, 1878–1881. 10.1039/c4em00129j [DOI] [PubMed] [Google Scholar]
- Zhang Y, Jiang W, Fang S, Zhu L and Deng J, 2014a. Perfluoroalkyl acids and the isomers of perfluorooctanesulfonate and perfluorooctanoate in the sera of 50 new couples in Tianjin, China. Environmental International, 68, 185–191. [DOI] [PubMed] [Google Scholar]
- Zhang H, Lu Y, Luo B, Yan S, Guo X and Dai J, 2014b. Proteomic analysis of mouse testis reveals perfluorooctanoic acid‐induced reproductive dysfunction via direct disturbance of testicular steroidogenic machinery. Journal of Proteome Research, 13, 3370–3385. 10.1021/pr500228d [DOI] [PubMed] [Google Scholar]
- Zhang C, Sundaram R, Maisog J, Calafat AM, Barr DB and Buck Louis GM, 2015. A Prospective Study of Pre‐pregnancy Serum Concentrations of Perfluorochemicals and the Risk of Gestational Diabetes. Fertility and Sterility, 103, 184–189. 10.1016/j.fertnstert.2014.10.001 [DOI] [PMC free article] [PubMed] [Google Scholar]
- Zhang L, Krishnan P, Ehresman D, Smith P, Dutta M, Bagley BD, Chang S‐C, Butenhoff J, Patterson A and Peters JM, 2016a. Perfluorooctane sulfonate‐choline ion pair formation: a potential mechanism modulating hepatic steatosis and oxidative stress in mice. Toxicological Sciences, 153, 186–197. 10.1093/toxsci/kfw120 [DOI] [PubMed] [Google Scholar]
- Zhang Q, Zhao H, Liu W, Zhang Z, Qin H, Luo F and Leng S, 2016b. Developmental perfluorooctane sulfonate exposure results in tau hyperphosphorylation and b‐amyloid aggregation in adults rats: Incidence for link to Alzheimer's disease. Toxicology, 347–349, 40–46. [DOI] [PubMed] [Google Scholar]
- Zhao Y, Tan YS, Haslam SZ and Yang C, 2010a. Perfluorooctanoic acid effects on steroid hormone and growth factor levels mediate stimulation of peripubertal mammary gland development in C57BL/6 mice. Toxicological Sciences, 115, 214–224. 10.1093/toxsci/kfq030 [DOI] [PMC free article] [PubMed] [Google Scholar]
- Zhao G, Wang J, Wang X, Chen S, Zhao Y, Gu F, Xu A and Wu L, 2010b. Mutagenicity of PFOA in Mammalian Cells: Role of Mitochondria‐Dependent Reactive Oxygen Species. Environmental Science & Technology, 45, 1638–1644. [DOI] [PubMed] [Google Scholar]
- Zhao Y, Tan YS, Strynar MJ, Perez G, Haslam SZ and Yang C, 2012. Perfluorooctanoic acid effects on ovaries mediate its inhibition of peripubertal mammary gland development in Balb/c and C57Bl/6 mice. Reproductive Toxicology, 33, 563–576. 10.1016/j.reprotox.2012.02.004 [DOI] [PMC free article] [PubMed] [Google Scholar]
- Zhao B, Li L, Liu J, Li H, Zhang C, Han P, Zhang Y, Yuan X, Ge RS and Chu Y, 2014. Exposure to perfluorooctane sulfonate in utero reduces testosterone production in rat fetal Leydig cells. PLoS ONE, 9(1), e78888 10.1371/journal.pone.007888 [DOI] [PMC free article] [PubMed] [Google Scholar]
- Zheng L, Dong GH, Jin YH and He QC, 2009. Immunotoxic changes associated with a 7‐day oral exposure to perfluorooctanesulfonate (PFOS) in adult male C57BL/6 mice. Archives of Toxicology, 83, 679–689. [DOI] [PubMed] [Google Scholar]
- Zheng L, Dong GH, Zhang YH, Liang ZF, Jin YH and He QC, 2011. Type 1 and Type 2 cytokines imbalance in adult male C57BL/6 mice following a 7‐day oral exposure to perfluorooctanesulfonate (PFOS). Journal of Immunotoxicology, 8, 30–38. [DOI] [PubMed] [Google Scholar]
- Zhu Y, Qin XD, Zeng XW, Paul G, Morawska L, Su MW, Tsai CH, Wang SQ, Lee YL and Dong GH, 2016. Associations of serum perfluoroalkyl acid levels with T‐helper cell‐specific cytokines in children: By gender and asthma status. Science of the Total Environment, 559, 166–173. 10.1016/j.scitotenv.2016.03.187 [DOI] [PubMed] [Google Scholar]
Associated Data
This section collects any data citations, data availability statements, or supplementary materials included in this article.
Supplementary Materials
Occurrence in food, human consumption data and human dietary exposure