

Abstract
The EFSA ANS Panel was asked to provide a scientific opinion on the safety of green tea catechins from dietary sources including preparations such as food supplements and infusions. Green tea is produced from the leaves of Camellia sinensis (L.) Kuntze, without fermentation, which prevents the oxidation of polyphenolic components. Most of the polyphenols in green tea are catechins. The Panel considered the possible association between the consumption of (‐)‐epigallocatechin‐3‐gallate (EGCG), the most relevant catechin in green tea, and hepatotoxicity. This scientific opinion is based on published scientific literature, including interventional studies, monographs and reports by national and international authorities and data received following a public ‘Call for data’. The mean daily intake of EGCG resulting from the consumption of green tea infusions ranges from 90 to 300 mg/day while exposure by high‐level consumers is estimated to be up to 866 mg EGCG/day, in the adult population in the EU. Food supplements containing green tea catechins provide a daily dose of EGCG in the range of 5–1,000 mg/day, for adult population. The Panel concluded that catechins from green tea infusion, prepared in a traditional way, and reconstituted drinks with an equivalent composition to traditional green tea infusions, are in general considered to be safe according to the presumption of safety approach provided the intake corresponds to reported intakes in European Member States. However, rare cases of liver injury have been reported after consumption of green tea infusions, most probably due to an idiosyncratic reaction. Based on the available data on the potential adverse effects of green tea catechins on the liver, the Panel concluded that there is evidence from interventional clinical trials that intake of doses equal or above 800 mg EGCG/day taken as a food supplement has been shown to induce a statistically significant increase of serum transaminases in treated subjects compared to control.
Keywords: (‐)‐epigallocatechin‐3‐gallate, hepatotoxicity, infusion, food supplement, transaminases, alanine aminotransferase
Summary
Following a request from the European Commission to the European Food Safety Authority (EFSA), the Scientific Panel on Food Additives and Nutrient Sources added to Food (ANS) was asked to provide a scientific opinion on the safety of green tea catechins from dietary sources from all sources in foods including preparations such as food supplements and infusions.
Teas produced from the leaves of Camellia sinensis (L.) Kuntze are classified according to the processing used into four different subtypes: green tea, black tea, white tea and oolong tea. Green tea is produced without fermentation and thus oxidation of the polyphenolic components is prevented. White tea is produced with minimal fermentation from new buds and young leaves, which are harvested only once a year in early spring. Black tea manufacture is carried out by fermentation ensuring a high degree of enzymatically catalysed aerobic oxidation of the polyphenols followed by a series of chemical condensations. Oolong tea is a semi‐fermented tea, where polyphenols are partially oxidised.
Green tea as an infusion has been extensively consumed as a beverage in Asian countries for centuries. Green tea and its extracts are rich in polyphenolic compounds, most of which are flavanols, commonly known as catechins. The primary catechins in green tea are (–)‐epicatechin (EC), (–)‐epicatechin‐3‐gallate (ECG), (–)‐epigallocatechin (EGC) and (–)‐epigallocatechin‐3‐gallate (EGCG). Furthermore, (+)‐catechin (C), (+)‐gallocatechin (GC), (–)‐gallocatechin‐3‐gallate (GCG) and (+)‐catechin‐3‐gallate (CG).
Green tea has been associated with various health benefits, such as prevention of cancer, obesity, diabetes and neurodegenerative diseases.
Concerns have been raised concerning possible harmful effects associated with the use of green tea extracts and infusions, including reported cases of liver toxicity possibly associated with the intake of green tea catechins. This risk assessment of green tea catechins is carried out in the framework of the procedure under Article 8 (2) of Regulation (EC) No 1925/2006 on the addition of vitamins and minerals and of certain other substances to foods, initiated by the European Commission. Article 8 (2) of Regulation (EC) No 1925/2006 is referring to a possible prohibition, restriction or Community scrutiny of a substance or ingredient by placement in Annex III, Part A, B or C of this Regulation.
The Panel considered the possible association between the consumption of EGCG, the most relevant catechin in green tea, and hepatotoxicity. The Panel based this assessment on the content of EGCG in green tea extracts and infusions due to the fact that this is the major catechin found in green tea, it is present in plasma in the unconjugated form after oral intake, and it is the most cytotoxic catechin (compared to EGC and ECG) in primary rat hepatocytes. The Panel is aware that in the current risk assessment, a number of aspects have not been considered such as beneficial effects associated with the intake of green tea catechins, as these fall outside the remit of the Panel and the scope of the current mandate.
C. sinensis (L.) Kuntze (Thea sinensis L.) is included in the EFSA ‘Compendium of botanicals’ reported to contain naturally occurring substances of possible concern for human health when used in food and food supplements. Hepatotoxicity is the adverse effect listed in the compendium, which also states that the doses causing hepatotoxicity are not indicated in human case reports. The Panel noted that, according to the USDA Database, EGCG can be found in a number of other botanical species in addition to C. sinensis.
The Panel noted that there are no specifications for green tea preparations used as food including food supplements in EU Regulations or any monographs on green tea preparations in the current edition of the European Pharmacopeia.
The Panel noted that green tea may be contaminated by pyrrolizidine alkaloids (PA) and that 1,2‐unsaturated PA can be activated by CYP450 enzymes to form hepatotoxic metabolites. The Panel considered that the levels of PA present in green tea products is unlikely to induce non‐neoplastic hepatotoxicity alone, but could not exclude the possibility that contamination by PA in green tea products may be a contributory factor to the hepatotoxicity of green tea catechins.
Catechin supplements, green tea infusions or reconstituted tea drinks from green tea extracts can be prepared and consumed together with other foods, such as milk or eggs. Interactions between tea polyphenols and dietary proteins have been described. Tea catechins can bind to milk proteins and form a network of casein micelles. The non‐covalent interactions between polyphenols and proteins could affect the protein conformation, secondary structure, unfolding and precipitation. It has been reported that for EGCG, the galloyl functional group is responsible for this affinity between polyphenols and β‐lactoglobulin through the formation of hydrogen bonds and hydrophobic interactions. The Panel noted that the free catechins that could be absorbed in vivo from green tea infusions could be influenced by the interactions with milk proteins.
Dried green tea extracts are used as food, including beverages and food supplements and as pharmaceuticals. With respect to food supplements, the exposure to green tea components may vary considerably depending on the composition of the actual product and the daily dose recommended by the food supplement manufacturers/providers.
The Panel estimated chronic exposure to EGCG from green tea infusions for the following population groups: infants; toddlers, children, adolescents, adults and the elderly. Exposure to EGCG was calculated by multiplying EGCG concentrations (mg/g) for the consumption amount expressed as g/day for each individual in the Comprehensive Database (consumers only).
The concentration of EGCG used for the calculation of exposure has been extracted from the ‘USDA database for flavonoid content of selected foods’ (USDA, 2014 version 3.1). Exposure to EGCG was assessed by using the EGCG mean level reported for 100 brewed green tea samples (from 12 references) that was equal to 0.7 mg EGCG/g of brewed green tea.
The mean exposure EGCG from brewed green tea ranged from 5 mg/day in toddlers to 321 mg/day in adults. The high level exposure to EGCG (95th percentile) ranged from 238 mg/day in adolescents to 866 mg/day in adults.
In response to a public ‘Call for data’ launched by EFSA, no data were received from interest parties on the levels of catechins in green tea extracts used for the manufacturing of food supplement.
For the purpose of this Scientific Opinion, the Mintel Global New Products Database (GNPD) was used for checking the labelling of products containing green tea within the EU countries’ food products as the Mintel GNPD shows the compulsory ingredient information presented in the labelling of products. The daily consumption in terms of EGCG for each product was calculated multiplying the dose unit of EGCG for the daily number of recommended doses of the product. The daily intake of EGCG for these products ranged from 5 to 1,000 mg/day, for the adult population. In particular, among the 23 products retrieved with Mintel GNPD, there were six products with a recommended daily dose of EGCG below 100 mg; eight products with recommended daily dose ranging from 100 to 300 mg; three products with daily recommended dose above 800 mg. The maximum daily dose was reported for one product at 1,000 mg per day.
In humans, plasma contained intact EGCG and ECG and several catechin metabolites in the form of O‐methylated, sulfated and glucuronide conjugates of EC and EGC. The intestinal microbiota is responsible for the high degree of metabolism to polyhydroxyphenyl‐γ‐valerolactones which are the main urinary catabolites, averaging 10 times greater concentrations than catechin conjugates. Human data show that administration of green tea extract under fasting conditions, and as a bolus, leads to a significant increase in the area under the plasma concentration–time curve of EGCG compared to administration with food and in split doses.
Green tea extracts have been associated with cases of hepatotoxicity, especially when used for weight control. A large number of clinical trials have been performed to investigate purported beneficial effects of green tea catechins. Serum levels of the enzymes alanine aminotransferase (ALT) and in some of the studies also aspartate aminotransferase (AST) have been investigated routinely in many of the trials as biomarkers of liver toxicity. In total 49 Intervention studies with green tea products stating to include data on liver parameters were retrieved from the literature.
The Panel considered that the intervention studies varied widely in dose, composition of the administered green tea catechins, duration of treatment, number and health status of treated subjects as well as in the outcome on liver parameters. These limitations combined give an uncertainty in the identification of a maximum dose of EGCG that will not cause an increase of serum liver enzyme level or a minimum dose causing a significant (biological) effect. However, after reviewing the evidence from the 38 intervention studies, which included data on effects of green tea extracts and infusions on serum transaminases, the Panel considered that exposure to green tea extracts at doses at or above 800 mg EGCG/day for 4 months or longer are associated with elevations of ALT and AST in a small percentage (usually less than 10%) of the population.
Moderate or more severe abnormalities in any liver function were observed in 5.1% of the treated subjects in a study with more than 500 subjects treated with 843 mg EGCG/day for one year. Statistically significant odds ratios were 7.0 (95% CI = 2.4–20.3; p = 0.0002) (Dostal et al., 2015; Yu et al., 2017). Various contributing risk factors to hepatotoxicity were studied in this study and the previously suggested risk factors, such as COMT genotype, use of non‐steroidal anti‐inflammatory drug, paracetamol, statins or weekly alcohol consumption did not increase the liver effect of green tea catechins. However, the Panel noted that in this study the liver effects were more pronounced in subjects with high body mass index (BMI), which is an important finding as green tea extracts are used in food supplements for weight control.
A large number of subjects were treated with green tea extracts in intervention studies at or below 316 mg EGCG/day and did not show elevated serum levels of transaminases. The Panel also noted that during the intervention studies serum transaminases were continuously monitored, and cases with serious effects were excluded from further exposure, thus preventing liver injuries. Furthermore, elevated transaminases returned to normal after dechallenge and increased again after one or more rechallenges, which strongly suggests a causality between exposure to green tea extracts and liver effects.
The Panel considered the sparse data on green tea exposure from traditional green tea infusions and noted that there was no evidence of elevated ALT levels at a consumption of green tea infusion of ≥ 5 cups per day or containing 700 mg EGCG/day.
None of the intervention studies addressed pregnant women, breast‐fed infants or children.
Case reports of hepatotoxicity induced by the exclusive use of green tea products were evaluated and 22 cases were found where green tea was claimed to be the only causative agent leading to an almost exclusive hepatocellular pattern of liver injury (1 out of 22 cases was mixed). Eight of the cases were reported to occur after consumption of green tea infusion, whereas most cases were associated with green tea supplements. In seven of the cases, subjects were exposed to Exolise®. Most cases were reported in middle‐aged females, which could be associated with this subpopulation's use of green tea extracts for body weight control. In most of the cases, hepatotoxicity is induced after the ingestion of green tea extracts for a period of at least several weeks up to 8 months although some cases were reported after a shorter period of regular intake (5 days). No fatal cases were associated solely with the use of green tea products and the majority of cases resolved following green tea preparation discontinuation. Although the quality and precision of causality assessment procedures vary from one case to another, temporal relationship and the exclusion of other potential causes of liver injury were appropriately satisfied in the majority of the cases. In addition, positive rechallenge in many cases further supports the role of green tea preparations in liver injury. Based on the current literature review on case reports, it is difficult to draw conclusions concerning the minimal dose of EGCG present in green tea products capable of inducing liver injury. There was a great variability in the ingested daily dose of green tea products with cases of hepatotoxicity being induced at doses exceeding three cups of green tea infusion to cases with exposure up to 1,800 mg green tea extract/day (content of EGCG not stated in these case reports). The Panel considered that the liver injury in many of the case reports is likely due to idiosyncratic reactions.
Idiosyncratic drug‐induced liver injury (IDILI) is a term used to define those adverse reactions to medications and other xenobiotic substances, including herbal and dietary supplements, which are not clearly related to dose, route or duration of drug administration. Although not dose‐related in a strict sense, these reactions largely occur after exposure to drugs and may require either repeated exposure or exceedance of a threshold dose which is highly variable between individuals. The pathogenesis of IDILI is complex and not yet fully understood.
Overall, the Panel noted that the number of human cases with hepatotoxicity associated with consumption of green tea infusions is extremely low compared to the large number of consumers of green tea infusions. However, in the case reports, both from exposure to green tea extracts and to green tea infusions, more severe hepatotoxicity is reported compared to hepatotoxicity reported in the clinical trials, where mild liver effects are discovered early in the clinical monitoring and exposure is discontinued preventing more severe liver injury.
Data from animal experiments demonstrate that liver is a target tissue for green tea catechin toxicity. At high oral bolus doses or parenteral administration, when higher tissue levels can be expected, ALT elevation and liver toxicity occurs with a higher incidence and with more severe effects, than from exposure via peroral administration or via feed. Thus, oral bolus doses of 750 mg EGCG/kg body weight (bw) (2 daily doses) caused hepatotoxicity in mice. A single intraperitoneal administration of EGCG at 100 mg/kg bw was sufficient to generate an hepatic injury in mice. Fasting is also demonstrated to increase the toxicity of green tea catechins in experimental animals, probably due, in part, to a higher bioavailability of green tea catechins, which may be due to less binding of catechins to dietary proteins, and reduced hepatic glycogen levels.
When EGCG or green tea extracts were administered orally to experimental animals, liver toxicity was observed in some, but not all studies. In subchronic studies where liver toxicity was observed, the lowest no observed adverse effect level (NOAEL) for this effect was 242 mg EGCG/kg bw per day in rats administered a green tea extract via oral gavage. Severe toxicity, mainly in the gastro‐intestinal tract but also the liver, was demonstrated in fasted dogs, administered green tea extracts in capsules at doses, which were non‐toxic to fed dogs. The NOAEL in fasted dogs was 40 mg EGCG/kg bw per day, which was 10 times lower than the NOAEL identified in fed dogs.
The Panel considered that there was no evidence of carcinogenic activity of green tea extract in rats or mice. Based on histopathological effects in the liver in male and female rats, the Panel considered that a NOAEL could be identified of 145 mg EGCG/kg bw per day (administered by gavage, 5 days/week). Based on only the liver effects in male mice, the NOAEL identified would be 48.4 mg EGCG/kg bw per day. No clinical chemistry was performed in this study. When a green tea catechin mixture was added to the diet, no liver effects were reported in rats with doses up to 838 mg/kg bw per day, the highest dose tested.
Overall, the Panel considered that there were a number of uncertainties regarding green tea catechin exposures, biological and toxicological effects:
The chemical composition of green tea varies widely due to plant variety, growing environment, season, age of leaves and manufacturing conditions with EGCG content ranging from 1,600 to 20,320 mg/100 g dried leaves (13‐fold). With regard to green tea infusions, EGCG content varied over a greater than 88‐fold range (2.3–203 mg/100 g infusion).
Given that EGCG/catechins concentrations in green tea infusions decrease during storage and preparation (at tea‐brewing temperatures), there is uncertainty regarding actual EGCG exposures from green tea infusions based on content in dried leaves.
There remain uncertainties regarding the presence of hepatotoxic contaminants such as PA in green tea preparations.
There remain uncertainties regarding the extent to which manufacturing procedures influence extraction yield and the composition of extracted catechins and other substances used to prepare green tea extracts.
There are additional uncertainties surrounding the proportion of EGCG/catechins that can be absorbed after oral exposure to green tea infusions due to precipitation of EGCG/catechins in infusions during cooling.
Uncertainties persist regarding the effects of dietary proteins on the absorption of EGCG/catechins from both infusions and supplements. Even if EGCG is considered the primary causative hepatotoxic agent in green tea, there are uncertainties to what extent other catechins present would also be causative hepatotoxic agents and/or modulate EGCG hepatotoxicity.
Due to limited dose–response data after daily EGCG exposures up to 800 mg/day, there is uncertainty regarding the starting point for the derivation of a health‐based guidance value for EGCG for the general population.
There is an uncertainty whether more serious liver effects may develop after long‐term use of green tea extracts.
There are uncertainties around the mechanism(s) leading to both the dose‐dependent hepatotoxicity of EGCG and the mechanism(s) leading to idiosyncratic hepatotoxicity to EGCG.
On the basis of the information available, the Panel concluded that catechins from green tea infusion, prepared in a traditional way, and reconstituted drinks with an equivalent composition to traditional green tea infusions, are in general considered safe according to the presumption of safety approach, provided the intake corresponds to reported intakes in European Member States. However, rare cases of liver injury have been reported after consumption of green tea infusions, most probably due to an idiosyncratic reaction.
Based on the available data on the potential adverse effects of green tea catechins on the liver, the Panel further concluded that there is evidence from interventional clinical trials that intake of doses equal or above 800 mg EGCG/day taken as a food supplement statistically significant increase serum transaminases in treated subjects compared to control.
Catechins in green tea extracts, either consumed as a beverage or in liquid or dry form as dietary supplements, may be more concentrated, may differ in composition and pattern of consumption compared to catechins from traditional green tea infusions and cannot be regarded as safe according to the presumption of safety approach, as exposure to green tea extracts at and above 800 mg EGCG/day in intervention studies causes elevated serum transaminases which is indicative of liver injury.
The Panel concluded that it was not possible to identify an EGCG dose from green tea extracts that could be considered safe. From the clinical studies reviewed there is no evidence of hepatotoxicity below 800 mg EGCG/day up to 12 months. However, hepatotoxicity was reported for one specific product containing 80% ethanolic extract at a daily dose corresponding to 375 mg EGCG.
The Panel noted that the level of 800 mg EGCG/day is outside the range of the mean daily intake of EGCG (90–300 mg/day) resulting from the consumption of green tea infusions in the EU, however this level of exposure falls within the upper range (300–866 mg/day) of exposure by high‐level consumers of green tea infusions in the EU in the adult population. The Panel recognised that it is plausible that the kinetics, as well as the toxicity of green tea catechins, could be modified by the matrix in which they are present.
The Panel recommended that studies should be performed to determine a dose–response of hepatotoxicity of green tea catechins and examine inter and intra species variability.
Maximum limits for pyrrolizidine alkaloids in green tea preparations, including food supplements should be established, since they may contribute to hepatotoxicity.
Labels of green tea products (with particular reference to food supplements) should include content of catechins and the proportion of EGCG.
1. Introduction
Following a request from the European Commission to the European Food Safety Authority (EFSA), the Scientific Panel on Food Additives and Nutrient Sources added to Food (ANS) was asked to provide a scientific opinion on the safety of green tea catechins from dietary sources from all sources in foods including preparations such as food supplements and infusions.
Teas produced from the leaves of Camellia sinensis (L.) Kuntze are classified according to the processing used into four different subtypes: green tea, black tea, white tea and oolong tea. Green tea is produced without fermentation and thus oxidation of the polyphenolic components is prevented. White tea is produced with minimal fermentation from new buds and young leaves, which are harvested only once a year in early spring (Zhang et al., 2017). Black tea manufacture is carried out by fermentation ensuring a high degree of enzymatically catalysed aerobic oxidation of the polyphenols followed by a series of chemical condensations. Oolong tea is a semi‐fermented tea, where polyphenols are partially oxidised (ESCO, 2009; Zhang et al., 2017).
Green tea as an infusion has been extensively consumed as a beverage in Asian countries for centuries. Green tea and its extracts are rich in polyphenolic compounds, most of which are flavanols, commonly known as catechins (e.g. (–)‐epigallocatechin‐3‐gallate (EGCG)). Green tea has been associated with various health benefits, such as prevention of cancer, obesity, diabetes and neurodegenerative diseases (Cao et al., 2016).
Concerns have been raised concerning possible harmful effects associated with the use of green tea extracts and infusions, including reported cases of liver toxicity possibly associated with the intake of green tea catechins (‘Documentation provided to EFSA’ n. 1 and 2).
This risk assessment of green tea catechins is carried out in the framework of the procedure under Article 8 (2) of Regulation (EC) No 1925/20061 on the addition of vitamins and minerals and of certain other substances to foods, initiated by the European Commission. Article 8 (2) of Regulation (EC) No 1925/2006 is referring to a possible prohibition, restriction or Community scrutiny of a substance or ingredient by placement in Annex III, Part A, B or C of this Regulation.
1.1. Background and Terms of Reference as provided by the European Commission
1.1.1. Background
The National Food Administrations of Norway, Sweden and Denmark requested the Commission to initiate the procedure under Article 8 of Regulation (EC) No 1925/2006 on the addition of vitamins and minerals and of certain other substances to food for the intake of catechins, and in particular EGCG in green tea extracts used in the manufacture of food supplements and in green tea infusions, because of safety concerns on the potential risk to consumers associated with the intake of these substances. These concerns – cases of liver toxicity possibly associated with the intake of green tea catechins – are outlined in the scientific opinion on green tea extracts and green tea infusions carried out by the National Food Institute of the Technical University of Denmark and in the safety assessment on levels of EGCG in green tea extracts used in food supplements carried out by the Norwegian Institute of Public Health.2
Consequently, the Commission has initiated the procedure under Article 8 (2) of Regulation (EC) No 1925/2006 on the addition of vitamins and minerals and of certain other substances to foods, for the intake of green tea catechins from all dietary sources.
1.1.2. Terms of Reference
In accordance with Article 29(1)(a) of Regulation (EC) No 178/20023, the European Commission asks EFSA to:
Review the existing scientific data on the possible link between the intake of green tea catechins from dietary sources (e.g. green tea extracts use in food supplements and green tea infusions) and harmful effects on health.
Provide advice on a dietary intake of green tea catechins that does not give rise to concerns about harmful effects to health, for the general population, and as appropriate, for vulnerable subgroups of the population.
1.1.3. Interpretation of the Terms of Reference
With respect to the approach to be followed for the assessment of green tea catechins, the Panel was of the view that previous assessments, when relevant to the safety issues that triggered the Article 8 procedures, should be used as starting points for this scientific opinion. Since these procedures are triggered by safety concerns of either the European Commission or the Member States, in addressing the mandate received, it is the interpretation of the Panel that the issue of concern – green tea catechins and liver toxicity – should be addressed in the first instance and that a full evaluation of the safety of these substances would not be undertaken.
1.1.4. Definition and safety concern of green tea catechins
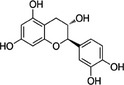
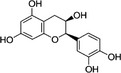
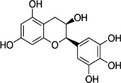
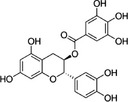
In the context of this opinion, the term ‘catechins’, unless otherwise specified, indicates the subclass of flavonoids, flavan‐3‐ols, which are the most common polyphenols present in green tea from C. sinensis. The primary catechins in green tea are (–)‐epicatechin (EC), (–)‐epicatechin‐3‐gallate (ECG), (–)‐epigallocatechin (EGC) and (–)‐epigallocatechin‐3‐gallate (EGCG). Furthermore, (+)‐catechin (C), (+)‐gallocatechin (GC), (–)‐gallocatechin‐3‐gallate (GCG) and (+)‐catechin‐3‐gallate (CG) occur in green tea. Green tea catechins are described in Table 1.
Table 1.
Main Camellia sinensis leaf catechins and related chemical details
| Common name | Acronym | CAS number | IUPAC name Other main synonym | Molecular formula/molecular weight (g/mol) | Structural formula |
|---|---|---|---|---|---|
| Catechin | C | 154‐23‐4 |
(2R,3S)‐2‐(3,4‐dihydroxyphenyl)‐3,4‐dihydro‐2H‐chromene‐3,5,7‐triol (+)‐3,3′,4′,5,7‐pentahydroxyflavan |
C15H14O6 290.27 |
|
| Epicatechin | EC | 490‐46‐0 |
(2R,3R)‐2‐(3,4‐dihydroxyphenyl)‐3,4‐dihydro‐2H‐chromene‐3,5,7‐triol (–)‐(2R:3R)‐5,7,3′,4′‐tetrahydroxyflavan‐3‐ol |
C15H14O6 290.27 |
|
| Epigallocatechin | EGC | 970‐74‐1 |
(2R,3R)‐2‐(3,4,5‐trihydroxyphenyl)‐3,4‐dihydro‐2H‐chromene‐3,5,7‐triol 1‐epi‐3′,4′,5,5′,7‐pentahydroxy‐3‐flavan |
C15H14O7 306.27 |
|
| Catechin‐3‐gallate | CG | 130405‐40‐2 |
[(2S,3R)‐2‐(3,4‐dihydroxyphenyl)‐5,7‐dihydroxy‐3,4‐dihydro‐2H‐chromen‐3‐yl] 3,4,5‐trihydroxybenzoate (2S,3R)‐2‐(3,4‐dihydroxyphenyl)‐5,7‐dihydroxychroman‐3‐yl 3,4,5‐trihydroxybenzoate |
C22H18O10 442.38 |
|
| Epicatechin‐3‐gallate | ECG | 1257‐08‐5 |
[(2R,3R)‐2‐(3,4‐dihydroxyphenyl)‐5,7‐dihydroxy‐3,4‐dihydro‐2H‐chromen‐3‐yl] 3,4,5‐trihydroxybenzoate 3,4,5‐trihydroxy‐benzoic acid (2R,3R)‐2‐(3,4‐dihydroxy‐phenyl)‐5,7‐dihydroxy‐chroman‐3‐yl ester |
C22H18O10 442.38 |
|
| Gallocatechin‐3‐gallate | GCG | 4233‐96‐9 |
[(2S,3R)‐5,7‐dihydroxy‐2‐(3,4,5‐trihydroxyphenyl)‐3,4‐dihydro‐2H‐chromen‐3‐yl] 3,4,5‐trihydroxy‐benzoate (2S,3R)‐2‐(3,4,5‐trihydroxyphenyl)‐3,4‐dihydro‐1(2H)‐benzopyran‐3,5,7‐triol 3‐(3,4,5‐trihydroxybenzoate) |
C22H18O11 458.38 |
|
| Epigallocatechin‐3‐gallate | EGCG | 989‐51‐5 |
[(2R,3R)‐5,7‐dihydroxy‐2‐(3,4,5‐trihydroxyphenyl)‐3,4‐dihydro‐2H‐chromen‐3‐yl] 3,4,5‐trihydroxy‐benzoate l‐epigallocatechin gallate |
C22H18O11 458.38 |
|
CAS: Chemical Abstracts Service; IUPAC: International Union of Pure and Applied Chemistry.
As expressed in the two Nordic reports, used as a background for this opinion (‘Documentation provided to EFSA’ n. 1 and 2), the issue of safety concern is liver injury potentially associated with consumption of green tea catechins. Thus, the objective of this opinion is focussed on the assessment of possible harmful effects on liver associated with the intake of green tea catechins as a food supplement or infusion.
The Panel based this assessment on the content of EGCG in green tea extracts and infusions due to the fact that this is the major catechin found in green tea, it is present in plasma in the unconjugated form (Chow et al. (2003) after oral intake, and it is the most cytotoxic catechin (compared to EGC and ECG) in primary rat hepatocytes (Schmidt et al., 2005; Galati et al., 2006). The Panel is aware that in the current risk assessment, a number of aspects have not been considered such as beneficial effects associated with the intake of green tea catechins, as these fall outside the remit of the Panel and the scope of the current mandate.
2. Data and methodologies
2.1. Data
The evaluation is based on the published scientific literature available up to January 2018, monographs and risk assessment reports by national and international authorities and the data available following the launch of a public ‘Call for data’.4
2.2. Methodologies
The assessment was conducted in line with the principles described in the EFSA Guidance on transparency in the scientific aspects of risk assessment (EFSA Scientific Committee, 2009a) and following the relevant existing guidance documents from the EFSA Scientific Committee.
The risk assessment was performed according to the EFSA Guidance on safety assessment of botanicals and botanical preparations intended for use as ingredients in food supplements (EFSA Scientific Committee, 2009b).
2.3. Information on existing assessments
Green tea preparations have been evaluated by a number of committees or international organisations for its potential beneficial effects and/or for its potential adverse effects as food or as a medicinal product.
2.3.1. Evaluations performed by EFSA
Camellia sinensis (L.) Kuntze (Thea sinensis L.) is included in the EFSA ‘Compendium of botanicals’ reported to contain naturally occurring substances of possible concern for human health when used in food and food supplements.5 Hepatotoxicity is the adverse effect listed in the compendium, which also states that the doses causing hepatotoxicity are not reported in human case reports. According to the information reported in the EFSA database, levels of 5–12% of EGCG are found in the leaves of the C. sinensis (L.) Kuntze plant. Caffeine and theophylline are also present. No other botanical sources of EGCG are listed in the compendium. However, the Panel noted that, according to the USDA Database, EGCG can be found in a number of other botanical species than C. sinensis (Appendix A).
The EFSA Scientific Cooperation (ESCO) Working Group on Botanicals and Botanical Preparations used an assessment of ‘Dried green tea extracts’ (ESCO, 2009) as a case study for testing the proposed tiered approach for the safety assessment of botanicals and botanical preparations, later included in the EFSA Guidance on safety assessment of botanicals and botanicals preparations intended for use as ingredients in food supplements. The document was not intended to provide a formal safety assessment of the botanical or botanical preparation. However, the Panel noted that in its conclusions, the ESCO Working Group noted case reports of liver toxicity associated with the use of food supplements containing dried green tea extracts and related products, including aqueous green tea extracts.
In its assessment, the ESCO Working Group identified no observed adverse effect levels (NOAELs) ranging from 40 to 50 mg EGCG/kg body weight (bw) per day derived from the 13‐week studies of McCormick et al. (1999) and Johnson et al. (1999) in rats and a study in fasting dogs (Isbrucker et al., 2006).
The EFSA Panel on Dietetic Products, Nutrition and Allergies (NDA) has conducted a number of assessments on the substantiation of health claims related to the catechins (especially EGCG) in green tea. The outcome of these evaluations is that no cause and effect relationship has been established (EFSA NDA Panel, 2010a,b, 2011).
2.3.2. Other evaluations
2.3.2.1. Opinions from other EU bodies
French Agency for Food, Environmental and Occupational Health & Safety (ANSES)
In 2012, ANSES published three opinions on green tea (ANSES, 2012a,b,c).
In the first opinion (ANSES, 2012a,b,c), ANSES described 17 cases of hepatotoxicity reported to their national program of nutrivigilance during the period May 2009 to May 2011. In this survey, only one case was concluded to be very likely due to a high green tea exposure. ANSES considered that the number of case reports was low in regard to the high consumption of green tea.
The second opinion (ANSES, 2012b) referred to the safety of use of green tea in food supplements. ANSES noted the uncertainties in pharmacokinetic and toxicological data on catechins, the variability in chemical composition of green tea preparations, particularly in the level of EGCG. In consequence, ANSES could not conclude on the safety of use of green tea in food supplements.
The last opinion (ANSES, 2012c) was related to the safety of use of green tea preparations in general. ANSES considered the limited number of case reports and the uncertainties regarding the concentrations of EGCG in the various green tea preparations. Based on the margin of safety (MOS) calculated by ESCO (2009) for EGCG, ANSES concluded that there was a need for additional toxicological and exposure data.
The European Medicines Agency (EMA)
The European Medicines Agency (EMA) has published a Community herbal monograph on green tea leaves (EMA, 2013b) based on an assessment report with an associated reference list (EMA, 2013a). EMA acknowledges the traditional use of the whole dried leaf and the herbal preparations: comminuted herbal substance and powdered herbal substance. Contraindications are hypersensitivity to the active substance(s), gastric and duodenal ulcers, cardiovascular disorders such as hypertension and arrhythmia and hyperthyroidism. Overdose (quantities corresponding to more than 300 mg caffeine or 5 cups of tea as a beverage) can lead to restlessness, tremor and elevated reflex excitability. The first signs of poisoning are vomiting and abdominal spasm. It is stated that adequate tests on reproductive toxicity and carcinogenicity have not been performed. Interactions mentioned are that caffeine‐containing preparations reduce actions of sedative substances and increase side effects caused by sympathomimetic drugs (EMA, 2013b).
2.3.2.2. Opinions from other international bodies, organisations or scientific publications
International Agency for Research on Cancer
The International Agency for Research on Cancer (IARC) evaluated the aqueous infusion prepared from the dried leaves of C. sinensis. The evaluation does not distinguish between green tea and fermented (i.e. black) tea. It was concluded that there is inadequate evidence for carcinogenicity in humans for tea drinking and inadequate evidence for carcinogenicity for tea in experimental animals of tea (IARC, 1991).
United States Pharmacopeia (USP)
In 2007, the USP Dietary Supplement Information Expert Committee reviewed the safety profile for powdered decaffeinated green tea extract following reports of liver damage upon consumption of concentrated green tea extracts (Sarma et al., 2008; US Pharmacopoeia, 2009). The Committee assigned a warning statement to such food supplements stating ‘Caution: Must take with a meal. In rare cases extracts from green tea have been reported to adversely affect the liver. Discontinue use and consult a healthcare practitioner if you have a liver disorder or develop symptoms of liver trouble, such as abdominal pain, dark urine, or jaundice’ (US Pharmacopeia, 2007). The proposal to add a cautionary labelling statement in the USP monograph was presented for public comments in November 2007. After reviewing additional information, several stakeholder comments and an updated safety review, the committee reclassified green tea extract so it does not require the caution/warning statement. The Committee indicated that it remained concerned about safety issues concerning some green tea extracts and continues to monitor clinical case reports and other information relating to the safety of dietary supplements (US Pharmacopeia, 2008).
At the moment of writing of this opinion, the Panel is aware that an update of the USP monograph is ongoing.
United States Food and Drug Administration (US FDA)
In 2006, the US FDA temporarily suspended all human trials of EGCG given orally to allow an additional review of animal toxicity data. Later, FDA allowed trials but mandated all US trials to administer the drug with food (Shanafelt et al., 2009).
Health Canada
As a result of a recent Health Canada safety review (Health Canada, 2017a), Health Canada's monograph on green tea extracts in natural health products has been updated (Health Canada, 2017b). Instructions and warnings comprise the following: (i) ‘take with food’, (ii) ‘If you have a liver disorder, consult a health care practitioner prior to use. Stop use if you develop symptoms of liver trouble such as yellowing of the skin/eyes (jaundice), stomach pain, dark urine, sweating, nausea, unusual tiredness and/or loss of appetite and consult a health care practitioner’, (iii) ‘If you are pregnant or breastfeeding, consult a health care practitioner prior to use)’, (iv) ‘If you have an iron deficiency, consult a health care practitioner prior to use’. Furthermore, the following statement on known adverse effects is introduced: ‘Rare, unpredictable cases of liver injury associated with green tea extract‐containing products have been reported (in Canada and internationally)’.
In its safety review, Health Canada reports on 11 Canadian cases (between 2006 and 2016) of suspected liver injury associated with the use of products containing green tea extracts from which only 2 had enough information to be fully assessed (Health Canada, 2017a). In addition, by a search in the World Health Organization Adverse Drug Reaction Database, 89 international reports of liver injury associated with the use of green tea‐containing products were identified; however, none of them had sufficient information to serve as a basis for risk assessment. Furthermore, the Health Canada safety review mentions 34 reports of liver injury involving green tea extract products included in the USP 2008 safety review of green tea extract and another 19 published international case reports of liver injury regarding the use of green tea extract‐containing products, which have been published since 2008.
Peer‐reviewed publications
A tolerable upper intake level of EGCG, based on animal and human data, has been proposed by Yates et al. (2017). The authors’ emphasised the need for establishing tolerable upper intake levels for bioactive nutrients and used EGCG as one example of an approach on how to assess the safety of bioactive dietary components. They proposed a tolerable upper intake level of 300 mg/day of EGCG, based on human data in healthy adults in a fed state, and an acceptable daily intake (ADI) of 4.6 mg/kg per day, derived from animal toxicity data.
In a safety assessment of green tea supplements, Dekant et al. (2017) (‘Documentation provided to EFSA’ n. 3) proposed a tolerable upper intake of 300 mg EGCG/person and day, based on clinical trials that did not report liver effects (using a twofold safety margin), and NOAELs from animal studies with dietary administration of green tea catechins (using a safety factor of 100).
2.3.2.3. Regulatory status and maximum intake recommendations in some European countries
A weight‐loss phytotherapeutical drug, Exolise®, containing an 80% ethanolic dry extract of green tea, standardised at 25% catechins expressed as EGCG, was suspected to cause elevated liver enzymes in 13 subjects in France and Spain (Gloro et al., 2005; Sarma et al., 2008). The product's market authorisation was suspended by French and Spanish authorities in April 2003 (ESCO, 2009).
Safety concerns relating to green tea supplements have led to the proposition of daily EGCG intake limits by some European authorities. In Belgium, food supplements containing C. sinensis (L.) Kuntze leafs are allowed, if the recommended daily intake, as expressed on the label or by advertising, results in an ingested amount of tannins, expressed as EGCG, of less than 1,600 mg (Arrete royale, 1997). In France, food supplements containing C. sinensis should contain recommendations: not to exceed a daily intake of 300 mg EGCG, not to take the supplements without a meal and not for consumption by children, adolescents, pregnant and breastfeeding women (Legifrance, 2014). In Italy, the list of maximum daily intake of substances permitted for use in food supplements include 300 mg EGCG for adults and 120 mg EGCG for pregnant and breastfeeding women (MINSAL, 2016).
3. Assessment
3.1. Technical data
3.1.1. Identity and nature of the source material
Green tea catechins from dietary sources originate from young unfermented leaves and leave buds from C. sinensis (L.) Kuntze (common name: tea plant), comprising the varieties C. sinensis (L.) Kuntze var. assamica (Mast.) Kitam (common name: Assam tea) and C. sinensis (L.) Kuntze var. sinensis (common name: China tea) (Hanelt, 2001; Blaschek et al., 2006; Erhardt, 2008; USDA ARS, online).
| Scientific (Latin) name: | Family: Theaceae |
| Tribe: Theeae | |
| Species: Camellia sinensis (L.) Kuntze | |
| Synonyms: Thea sinensis L., Thea viridis L., Theaphylla laxa Raf., Theaphylla viridis Raf. | |
| Varieties: Camellia sinensis (L.) Kuntze, var. assamica (J.W.Mast.) Kitam., C. sinensis (L.) Kuntze var. sinensis | |
| (Hanelt, 2001; Blaschek et al., 2006; Erhardt, 2008; USDA ARS online) | |
| Part used: | Young leaves, leave buds (Dongowski, 2005; Blaschek et al., 2006) |
| Geographical origin: | Cultivated in many mountain areas of tropical and subtropical regions. Main producer countries are India, China and Sri Lanka, former USSR, Indonesia, Turkey and Japan (Hanelt, 2001) |
| Growth and harvesting conditions: | Cultivated in plantations, harvest at the earliest in the third year of cultivation by manual or mechanical process (Blaschek et al., 2006) |
3.1.2. Manufacturing process
3.1.2.1. Traditional green tea infusions
To preserve the catechins after harvesting the leaves, an enzyme deactivation is performed by rapid steaming (Japanese green tea) or pan firing/roasting (Chinese green tea) before rolling and high temperature air drying (Graham, 1992). Depending on the quality of green tea the recommendations for preparing traditional green tea infusions vary in amounts of green tea and water used (usually 0.75–1.5 g green tea/100 mL), temperature of water (50–100°C, usually sub‐boiling), brewing time (30 s–3 min) and the possibility of a repeated extraction (e.g. recommendation to discard the first and consume the second extraction) (Scholz and Bertram, 1995; Astill et al., 2001). To prepare one cup of green tea, usually between 1.8 and 3 g of tea is used per cup (Kaegi, 1998; Blumenthal, 2003; Henning et al., 2003; Gruenwald et al., 2004). In Japan and China, 2–3 g loose tea leaves or tea bags are typically used for tea brewing in 100–150 mL water, sometimes repeatedly, while American tea drinkers typically use 2.25 g (1 tea bag) in 180–240 mL (one cup) of water (‘Documentation provided to EFSA’ n.4).
A variant used in the traditional Japanese tea ceremony is the consumption of Matcha which is becoming popular also in Europe. Matcha is a special finely ground green tea powder which is consumed after mixing with hot water (Weiss and Anderton, 2003).
In addition, white tea, produced with a low degree of fermentation from new growth buds and young leaves, contains similar amounts of catechins as green tea (Unachukwu et al., 2010; Zhang et al., 2017).
3.1.2.2. Green tea extracts for reconstituted tea drinks
Extracts from tea – black or green – are defined as aqueous extracts from which water is removed to a greater or lesser extent (THIE, 2016). Extracts from tea are available in liquid and powdered forms. For extracts in powdered form there is an internationally agreed specification (ISO, 2011). Ready‐to‐drink beverages from tea extracts which are denominated as tea drinks contain at least 0.12 g dry mass of extracts from tea in 100 mL. In case the drink has to be prepared by the consumer, the minimum amount of tea extract refers to the drink made according to the preparation instructions (‘Documentation provided to EFSA’ n.5).
3.1.2.3. Concentrated green tea extracts for supplements
Commercial preparations use various extraction techniques (supercritical fluids, microwaves or ultrasonication) and manufacturing procedures which have different influences on the extraction yield and the composition of extracted substances (Pasrija and Anandharamakrishnan, 2015). They may differ from the traditional green tea infusion not only in the deprivation of water but also, e.g. in the solvent being different from water, in the source (e.g. fresh instead of dried green tea leaves), in extraction conditions (e.g. degree of comminution, concentration ratios, temperature, duration and stirring) and in fractionation procedures concentrating active compounds. Some tea extract powders or dry extracts are made by spray drying strong infusions obtained by soaking tea leaves in ethanol/water mixtures after they have been concentrated to 40–50% solids (Liebert et al., 1999; Wang et al., 2000; Lin et al., 2003).
While the green tea extracts for reconstituted tea drinks are aqueous extracts from which water is removed to a greater or lesser extent, the concentrated green tea extracts for supplements are prepared using various extraction techniques, solvents and manufacturing procedures which have different influence on the extraction yield and the composition of extracted substances.
3.1.3. Chemical composition
The chemical composition of green tea varies widely (Table 1). Plant variety, growing environment, season, age of leaves and manufacturing conditions of the traditional green tea have a pronounced impact on composition. Traditional green tea leaves contain a diversity of polyphenolic compounds, which account for up to 30% of the dry weight of the leaves. An overview of the concentrations of major catechins in the leaves and in the infusion is listed in Table 2 (USDA, 2007, 2014).6 Values for green tea brewed are standardised to 1 g tea leaves per 100 mL boiling water (USDA, 2014).
Table 2.
Mean with range and number of samples (in brackets) of catechins content in green tea leaves (USDA, 2007) and green tea infusion (USDA, 2014)
| Constituents | Green tea leaves, dry (mg/100 g; number of samples) | Green tea brewed (mg/100 g; number of samples) |
|---|---|---|
| (–)‐Epigallocatechin‐3‐gallate (EGCG) | 7,116 (1,600–20,320; 68) | 70.2 (2.3–203; 100) |
| (–)‐Epigallocatechin (EGC) | 2,058 (100–5,477; 68) | 29.2 (1.0–90.4; 100) |
| (–)‐Epicatechin‐3‐gallate (ECG) | 1,491 (340–4,630; 68) | 17.9 (2.8–140; 100) |
| (–)‐Epicatechin (EC) | 812 (190–2,000; 68) | 8.3 (1.9–26.0; 94) |
| (+)‐Catechin‐3‐gallate (CG) | 7.1 (0–14.1; 6) | Not reported |
| (+)‐Gallocatechin (GC) | 258 (69.5–447; 6) | 1.5 (no range reported; 3) |
| (+)‐Catechin (C) | 57.1 (0–253; 38) | 4.5 (0–44.4; 66) |
The Panel noted that the content of catechins varied widely in both green tea leaves and in green tea infusions and that for example, EGCG content ranged from 1,600 to 20,320 mg/100 g dried leaves (13‐fold) and from 2.3 to 203 mg/100 g infusion (88‐fold), respectively.
Of other chemical compounds in green tea leaves, the main purine alkaloid is caffeine (2.9–4.2%). Small amounts of the purine alkaloids theobromine (0.15–0.2%) and theophylline (0.02–0.04%) are also present. The total amino acids content in green tea leaves amounts to 4%, including the tea characteristic l‐theanine as a major component (2% of green tea) (Liebert et al., 1999; Wang et al., 2000; Lin et al., 2003).
Apart from differences due to botanical sources, the concentration of components in traditional green tea infusion is dependent on how the infusion is prepared by the consumer (amount of tea and water, brewing temperature and time and agitation). Furthermore, the content is affected by the grade of comminution of the tea leaves and if they are contained in a tea bag. Data from USDA (2014) on the composition of catechins in brewed green tea are presented in Table 1. Yang et al. (2007) studied the effect of the temperature and the number of infusions on the extraction of various catechins from a teabag, containing 3 g of ground green tea leaves, with 150 mL of water. The highest extraction was from the first or second infusion, depending on the temperature. After eight repeated 30 s extractions the total accumulated concentrations of catechins were 75.5, 103.5 and 118.3 mg/g dry tea leaf, with 70, 85 and 100°C water, respectively. After 5 min infusion of green tea samples in water at 90°C, El‐Shahawi et al. (2012) found average concentrations of caffeine, and the catechins C, EC, EGC, ECG, EGCG in the ranges 0.086–2.23, 0.113–2.94, 0.58–10.22, 0.19–24.9, 0.22–13.9 and 1.01–43.3 mg/g dry green tea in 29 commercially available green tea samples. Murugesh et al. (2017) studied the impact of water quality on the extraction of catechins from green tea, with the purpose to get optimal conditions for preparing ready‐to‐drinks. Green tea infusion was prepared by brewing 1 g tea in 200 mL of water at 95–100°C for 2 min. EGCG and EGC were extracted to the highest extent of the catechins, 62–77% of the total catechins, with a higher extractability in reverse osmosis water, packaged drinking water and ultrapure water, than in tap water and soft water.
A brown‐white turbidity and precipitation occur when hot tea beverages cool down (Ishizu et al., 2014, 2016). This phenomenon is called ‘creaming’ or ‘creaming down’ and the sticky precipitate consists of a caffeine‐catechin complex. Ishizu et al. (2016) dissolved equimolar amounts of caffeine and catechins in water at 90°C and left them at room temperature for a day. The content of the various catechins and caffeine was determined in the sticky precipitate and the supernatant. Most of the EGCG, ECG and caffeine (approximately 83% of each) was recovered in the sticky precipitate, while lower percentages (46–65%) were found of EGC, EC, GC and C. Consequently, the supernatant contained a lower proportion of EGCG and ECG (17.2% and 13.4%, respectively) compared to EGC, EC, GC and C (54.1%, 45.5%, 44.2% and 35.3%, respectively). Yang et al. (2007) reported a statistically significant decrease in EGCG (11–16%) in green tea infusions after storage at 25°C for more than 36 h but not after 12 h. The cream formation in green tea is influenced by different factors. Liang and Xu (2003) reported an increase in the number of tea cream particles at extraction temperatures above 60°C. The impact of pH was studied by Colon and Nerin (2014), who found that caffeine and catechins were released from the complexes at low pH. Xu et al. (2017) investigated the influence of saccharides on the amount of tea sediment in green tea concentrates (instant green tea powder dissolved in distilled water) used for tea production, and found that addition of fructose or sucrose to the concentrate led to a decrease in the amount of sediment and in the concentration of polyphenols and caffeine. The addition of 30 g/mL of sucrose and fructose to the green tea concentrates resulted in a decrease in the concentration of caffeine in the sediment from 8.22% to 2.70% and 2.30%, respectively, and in total catechins from 16.42% to 1.51% and 1.10% respectively.
The concentrations of components in dried green tea extracts vary widely, depending on the source material and the extraction procedure (e.g. extraction solvent). EGCG is a polar substance, and it is soluble both in water and in ethanol‐water mixtures. Commercial preparations that contain enriched quantities of polyphenols (60–80% or more of dry weight), with EGCG particularly prominent in the mixture, are available (Mitscher et al., 1997).
A comparison between the chemical composition in green tea‐based dietary supplements (N = 20, of which 10 were as capsules, 2 as tablets and 8 as liquids) and green tea leaves (N = 8) was performed by Sun et al. (2011) using an high‐performance liquid chromatography/mass spectrometry (HPLC/MS) fingerprinting technique coupled with chemometric analyses. The variability in chemical composition across liquid samples was high. The chemical differences were mainly in the flavonoid and theaflavin contents. The components most responsible for the differences between the two groups were ECG, strictinin, trigalloylglucose, quercetin‐3‐O‐glycosylrhamnoglucoside and kaempferol‐3‐o‐galactosyl‐rhamnosylglucoside. Flavonol aglycone concentrations were higher in dietary supplements than in tea leaves, indicating that flavonol glucosides are degraded during the manufacturing or storage processes.
Overall, the Panel noted that while the green tea extracts for reconstituted tea drinks are aqueous extracts from which water is removed, the concentrated green tea extracts for supplements are prepared using various extraction techniques, solvents and manufacturing procedures which have different influences on the extraction yield and the composition of extracted substances. Several factors, independent of the botanical source of the green tea, determine the concentration and composition of catechins in green tea infusions, such as the temperature, water quality, extraction time and storage time. In addition, the impact of creaming on the concentration of catechins in green tea preparation and on the free catechins that could be absorbed needs to be further studied.
3.1.4. Specifications
There are no specifications for green tea preparations used as food including food supplements in EU Regulations or any monographs on green tea preparations in the current edition of the European Pharmacopeia.
Specifications, however, are available from the United States Pharmacopeia for ‘Powdered Decaffeinated Green tea Extract’ as recommended for food supplements and are included in Table 3.
Table 3.
Parameters included in the specification for Powdered Decaffeinated Green Tea according to the United States Pharmacopeia 40 (US Pharmacopeia, 2017)
| The United States Pharmacopeia 40 (US Pharmacopeia, 2017) | |
|---|---|
| Definition | Prepared from the young, unfermented leaf and leaf buds of Camellia sinensis (L.) Kuntze (Fam. Theaceae), also known as Thea sinensis L., using suitable solvents such as alcohol, methanol, acetone, or water or mixtures of these solvents; the caffeine has been removed. The ratio of the starting crude plant material to Powdered Extract is 6:1–10:1. It contains not less than (NLT) 60.0% of polyphenols, calculated as EGCG, NLT 40.0% of EGCG, and not more than (NMT) 0.1% of caffeine, calculated on the anhydrous basis |
| Identification | EGCG, EGC, ECG, and EC, respectively, by thin‐layer chromatography and of ECG, C, EC, EGCG, (–)‐gallocatechin‐3‐O‐gallate, (–)‐epigallocatechin‐3‐0‐(3′‐O‐methyl)‐gallate and (–)‐epicatechin‐3‐O‐gallate by HPLC |
| Composition | The acceptance criteria being NLT 40.0% of EGCG and NLT 60.0% of polyphenols, calculated as EGCG on the anhydrous basis |
| Contaminants | Tests for pesticide residues, total aerobic microbial count, total combined yeasts and moulds count, absence of Salmonella species and Escherichia coli |
| Specific test | Limits for gallic acid and caffeine, water determination, residue on ignition, test for residual solvents and general pharmacopeial requirements |
EGCG: (–)‐epigallocatechin‐3‐gallate; EGC: (–)‐epigallocatechin; ECG: (–)‐epigallocatechin‐3‐gallate; EC: (–)‐epicatechin; C: (+)‐catechin; HPLC: high‐performance liquid chromatography.
According to ISO (2011), for green tea the content of water‐extractable substances, total polyphenols and total catechins should be at least 32%, 11% and 7%, respectively. Caffeine content in green tea is not less than 1.5% of dry matter (THIE, 2016). For decaffeinated green tea and decaffeinated green tea extracts, there is no harmonised legislation in place limiting the maximum level of caffeine remaining in decaffeinated products. However, without prejudice to national legal limits, maximum levels in the dry matter are 0.4% for decaffeinated green tea and 1.2% for decaffeinated green tea extracts.
According to interested parties (THIE, 2016), tea contains a natural level of microorganisms but as it has a low water activity (as a general rule, 8% should not be exceeded), these present negligible hazard providing the tea is kept dry.
The Scientific Committee on Food reviewed the microbiological risks associated with tea in 1997 and concluded that ‘Tea has a long history of safe use and the Committee is unaware of any safety problems related to moisture in tea. This may be attributed to its low moisture content (i.e. low water activity) and the high content of antimicrobial substances. Moisture levels up to 10% seem to give an acceptable safety margin for the storage of tea’ (SCF, 1997).
According to a ‘Recommended microbiological guideline for tea (Camellia sinensis)’ by interested parties (THIE, 2016), which applies also to green tea, the following criteria should be fulfilled: total plate count ≤ 107/g, yeasts ≤ 104/g, moulds ≤ 105/g, E. coli ≤ 102/g, Salmonella absent in 125 g. The Panel noted that green tea preparations should comply with the requirements of EC Regulations concerning the maximum residue levels of pesticides; the maximum levels for certain contaminants in foodstuffs in or on food and the extraction solvents used (European Commission, 2005, 2006, 2009).7 , 8 , 9
The Panel noted that maximum permitted levels in food supplements of lead, cadmium and mercury of 3.0, 1.0 and 0.1 mg/kg wet weight, respectively, are established in EU regulation 1881/2006.7 Essential and toxic elements were monitored in green tea, which was found to be a rich source of manganese (Brzezicha‐Cirocka et al., 2016). The contribution of green tea to the exposure of lead and cadmium was low.
Maximum levels of 10.0 μg/kg for benzo(a)pyrene and 50.0 μg/kg for the sum of benzo(a)‐pyrene, benz(a)anthracene, benzo(b)fluoranthene and chrysene are established for food supplements containing botanicals and their preparations in EU regulation 1881/2006.7 Contamination of green tea preparations with polycyclic aromatic hydrocarbons (PAH) has been reported, which may be due to heating processes in the manufacture of green tea preparations (Martena et al., 2011; Schulz et al., 2014). For example, in a study of benzo[a]pyrene in food supplements, those with green tea preparations showed the highest mean and median benzo[a]pyrene concentrations analysed between 2003 and 2007. According to the authors, a green tea supplement with the highest benzo[a]pyrene level found in this period (145 μg/kg) would provide 225 ng of benzo[a]pyrene per day when used at the maximum recommended use level (Martena et al., 2011). Furthermore, multiple pesticide residues have been detected in green tea preparations (Jia et al., 2015; Martínez‐Domínguez et al., 2016).
The Panel noted that there are no limits for pyrrolizidine alkaloids (PA) in green tea preparations. There is evidence that green tea – as well as other herbs – may be contaminated with PA, from PA‐producing plants being co‐harvested with the herb. PAs are secondary plant metabolites and known to be hepatotoxic, as well as genotoxic and carcinogenic (EFSA, 2011, 2016, 2017; Bodi et al., 2014; Mädge et al., 2015; Mulder et al., 2015; Shimshoni et al., 2015; Merz and Schrenk, 2016). From analytical data in the EFSA Chemical Occurrence database, the mean and 95th total concentration of 28 PA in 310 samples of green tea infusion were 3.8 and 6.1 μg/L, respectively (values below limit of detection (LOD) were replaced by LOD and values below limit of quantification (LOQ) were replaced by LOQ (EFSA, 2016). Corresponding PA levels expressed as μg/kg dry product were 287 and 460 respectively (EFSA, 2016). Bodi et al. (2014) determined the concentration of 17 PA in 23 samples of green tea and reported median and maximum concentrations of 15.0 and 697.5 μg/kg, respectively. In 10 samples of green tea obtained from the Israeli market, six contained detectable levels of 1,2‐unsaturated PA with a mean of 81 μg/kg (range 60–116 μg/kg) (Shimshoni et al., 2015). The three reports also reported data on PA in teas of different origins, in addition to green tea. Compared to green tea, higher levels of PA were reported in black tea and herbal infusions, such as from rooibos leaves (Bodi et al., 2014; Shimshoni et al., 2015; EFSA, 2016).
Overall, the Panel noted the lack of maximum limits for pyrrolizidine alkaloids in green tea preparations, including food supplements.
3.1.5. Stability of the botanical or botanical preparation used as ingredients in food supplement
The stability of green tea catechins is dependent on pH, temperature, concentration, storage time and solvent (Chen et al., 2001; Li et al., 2012). Fan et al. (2016) studied the behaviour of different catechins in individual aqueous solutions (500 μM) under heat treatment (30, 60 and 90°C for 8 h). Different chemical conversions of catechins were demonstrated, such as epimerisation, hydrolysis, oxidation/condensation and oligomerisation. The oligomeric products of EC, C, EGC, EGCG and ECG were also relevant regarding colour and flavour. Green tea catechins were stable in distilled water at 37°C for 7 h, while there was a 20% decrease at 98°C after 7 h. When pure EGCG was autoclaved at 120°C for 20 min, epimerisation of EGCG to (–)‐gallocatechin gallate (GCG) was observed. EGCG, ECG EGC and EC were most stable at pH 4–5 with decreasing stability at lower and higher pH. At higher pH, the epimerisation into GCG and CG increases. The relatively high amounts of GCG found in some drinks are thought most likely due to epimerisation of EGCG. Chen et al. (2001) found that addition of commercially available soft drinks to green tea catechins, which is common in production of tea drinks, decreases the stability of green tea catechins and suggested that the degradation of green tea catechins during production, storage and transport should be considered. A progressive decrease in total levels of catechins was reported during storage of green tea bags at 20°C for 6 months (Friedman et al., 2009). Most of the decrease was due to losses in the most abundant catechins. Thus, EGCG decreased by 28% and ECG by 51%. In their study on the influence of water quality on catechin levels, Murugesh et al. (2017) found that the concentrations of EGCG and EGC decreased drastically (76–87%) within 1 h of storage in tap water and soft water infusions at pH 7–8 and ambient temperature, while EC and ECG reduced only by 30–35%. The authors suggested that the reduction in catechins is due to autooxidation, which increased with pH. The precipitation of catechins, called creaming, which occurs when hot green tea infusions cool down, (see Section 3.1.3 Chemical composition) may result in lower concentrations of certain catechins (EGCG and ECG) in the green tea infusion supernatant.
Catechin supplements, green tea infusions or reconstituted tea drinks from green tea extracts can be prepared and consumed together with other foods, such as milk or eggs. Interactions between tea polyphenols and dietary proteins have been described (Rashidinejad et al., 2017). Tea catechins can bind to milk proteins and form a network of casein micelles (Haratifar and Corredig, 2014). The non‐covalent interactions between polyphenols and proteins could affect the protein conformation, secondary structure, unfolding and precipitation (Papadopoulou and Frazier, 2004; Kanakis et al., 2011). Kanakis et al. (2011) reported that for EGCG, the galloyl functional group is responsible for this affinity between polyphenols and β‐lactoglobulin through the formation of hydrogen bonds and hydrophobic interactions. The Panel noted that the free EGCG that could be absorbed and its bioactivity in vivo, could be influenced by the interactions with milk proteins.
According to Al‐Hanish et al. (2016), the non‐covalent interactions between EGCG and α‐lactalbumin induced structural changes in the protein, impairing the uptake of the protein by monocytes. Shen et al. (2014) studied the binding affinity between tea polyphenols and egg white proteins (ovalbumin and lysozyme). The authors reported that the protein structural changes induced by tea polyphenols at different pHs had an impact on the digestion of the protein. In addition, they reported a higher affinity to both proteins at pH 7.5 than at lower pH, which resulted in a more compact secondary α‐helix structure of the proteins. He et al. (2007) suggested that the antinutritional properties of tea polyphenols may be due to their inhibitory effect on digestive enzymes α‐amylase, pepsin, trypsin and lipase, thus reducing food digestibility. This effect was attributed to the binding of tea polyphenols to enzymes. The biological activity of polyphenols can be modified not only by proteins present in the food matrix but also by those in the digestive environment and bloodstream (Papadopoulou and Frazier, 2004).
Overall, the Panel noted that EGCG concentrations in green tea infusions decrease during preparation and storage, due to partially degradation and/or epimerisation with time, at high temperatures, at pH below 3 and above 5 and due to precipitation during cooling of green tea infusions. Furthermore, green tea catechins can bind to dietary proteins with impact on bioavailability of both the catechins and proteins.
3.2. Use and use levels
Dried green tea extracts are used as food, including beverages and food supplements and as pharmaceuticals. With respect to food supplements, the exposure to green tea components may vary considerably depending on the composition of the actual product and the daily dose recommended by the food supplement manufacturers/providers (ESCO, 2009).
3.2.1. Use as food
The leaves are used to produce a stimulant drink (due to the content of caffeine) in form of infusions, ready‐to‐drink beverages based on dried green tea extract or beverages prepared by the consumer from instant green tea powder, or as green tea extracts for supplements. Green tea may be decaffeinated to make a non‐stimulant beverage (ESCO, 2009).
Traditional green tea infusions
The concentration of EGCG in Japanese green tea samples have been evaluated by Khokhar et al. (1997) and by Khokhar and Magnusdottir (2002). According to the authors, the concentration of EGCG in green tea was 408 mg/L (Khokhar et al., 1997) and 28.8 mg/g dry matter (Khokhar and Magnusdottir, 2002).
The concentrations of catechins as measured in 100 samples from several publications are reported also in the USDA database in brewed green tea and summarised in Table 1 (USDA, 2014).
The Panel considered that the EGCG concentration data as reported in the USDA database are suitable for the calculation exposure.
Green tea extracts for reconstituted tea drinks
Specific request for information on the concentration of EGCG in tea infusion samples was included in the ‘Call for data’ launched. Data was received on the concentrations of green tea catechins and EGCG in green tea extracts to be used for preparing ready‐to‐drink beverages analysed on 473 samples (‘Documentation provided to EFSA’ n. 5).
According to the provided information, ready‐to‐drink beverages contain at least 0.12 g dry mass of green tea extracts in 100 mL. Based on the median concentration of 7.56 g EGCG/100 g green tea extract and the minimum dry mass content, the ready‐to drink beverage would contain 9.18 mg EGCG/100 mL.
Concentrated green tea extracts for supplements
Exposure to green tea components from food supplements may vary considerably depending on the composition of the actual product and the daily doses recommended by the food supplement manufacturers/providers. Recommended daily doses of 150 mg caffeine, 115–270 mg EGCG, and 375 mg catechins were found for green tea containing food supplements submitted to EFSA for the substantiation of health claims (EFSA NDA Panel, 2010a,b).
Green tea extract beverages are marketed in Japan, for example ‘Healthya green tea’ and ‘Healthya water’, containing 540 mg of total catechins (140–209 mg EGCG) per serving, which is the recommended daily consumption by the producer (Dekant et al., 2017) (‘Documentation provided to EFSA’ n.3).
Navarro et al. (2013) analysed the content of catechins in 97 dietary supplements, obtained from subjects in the drug‐induced liver injury network (DILIN). Fifty per cent of the products contained at least one catechin. However, for 40% of the products containing catechins, the presence was not indicated on the label. The concentration and composition of catechins varied widely. In dietary supplement with green tea extract in the label the catechin concentration ranged from non‐detectable to 486 mg/g; median 28 mg/g, and in the supplements not labelled with green tea or catechins the concentration varied from 3 μg/g to 6 mg/g; median 20 μg/g.
3.2.2. Medicinal products
The dried green tea leaf has also been traditionally used as a medicinal product. Traditional herbal medicinal product is used for relief of fatigue and sensation of weakness and in the specified indication exclusively based upon long‐standing use (EMA, 2013b).
Infusion: For adults or elderly, the recommended daily dose as herbal infusion (tea) is 1.8–2.2 g of whole or comminuted herbal substance in 100–150 mg boiling water, 3–5 times daily.
The powdered herbal substance for oral use: For adults or elderly, the recommended single dose is 390 mg, 3 times daily (up to 5 times if necessary).
The use in children and adolescents under 18 years of age is not recommended due to lack of adequate data. Use during pregnancy and lactation is not recommended due to absence of sufficient data on safety (EMA, 2013b).
A green tea extract is authorised in the EU and the US, as an ointment for the treatment of genital and perianal warts. To date, no use of an orally administered product of green tea extract has been approved as a drug.
3.3. Exposure: extend and duration
3.3.1. Green tea infusion
3.3.1.1. EFSA Comprehensive European Food Consumption Database
Since 2010, the EFSA Comprehensive European Food Consumption Database (Comprehensive Database) has been populated with national data on food consumption at a detailed level. Competent authorities in the European countries provide EFSA with data on the level of food consumption by their individual consumer from the most recent national dietary survey in their country (cf. Guidance of EFSA on the ‘Use of the EFSA Comprehensive European Food Consumption Database in Exposure Assessment’ (EFSA, 2011aa). New consumption surveys added in the Comprehensive database were also taken into account in this assessment. The food consumption data gathered by EFSA were collected by different methodologies and thus direct country‐to‐country comparisons should be interpreted with caution. Depending on the food category and the level of detail used for exposure calculations, uncertainties could be introduced owing to possible subjects’ underreporting and/or misreporting of the consumption amounts. Nevertheless, the EFSA Comprehensive Database represents the best available source of food consumption data across Europe at present. Food consumption data from the following population groups: infants, toddlers, children, adolescents, adults and the elderly were used for the exposure assessment. For the present assessment, food consumption data were available from 33 different dietary surveys carried out in 19 European countries (Table 4).
Table 4.
Population groups considered for the exposure estimates of green tea infusion
| Population | Age range | Countries with food consumption surveys covering more than 1 day |
|---|---|---|
| Infants | From more than 12 weeks up to and including 11 months of age | Bulgaria, Denmark, Finland, Germany, Italy, UK |
| Toddlers | From 12 months up to and including 35 months of age | Belgium, Bulgaria, Denmark, Finland, Germany, Italy, Netherlands, Spain, UK |
| Childrena | From 36 months up to and including 9 years of age | Austria, Belgium, Bulgaria, Czech Republic, Denmark, Finland, France, Germany, Greece, Italy, Latvia, Netherlands, Spain, Sweden, UK |
| Adolescents | From 10 years up to and including 17 years of age | Austria, Belgium, Cyprus, Czech Republic, Denmark, Finland, France, Germany, Italy, Latvia, Spain, Sweden, UK |
| Adults | From 18 years up to and including 64 years of age | Austria, Belgium, Czech Republic, Denmark, Finland, France, Germany, Hungary, Ireland, Italy, Latvia, Netherlands, Romania, Spain, Sweden, UK |
| The elderlya | From 65 years of age and older | Austria, Belgium, Denmark, Finland, France, Germany, Hungary, Ireland, Italy, Romania, Sweden, UK |
The terms ‘children’ and ‘the elderly’ correspond, respectively, to ‘other children’ and the merge of ‘elderly’ and ‘very elderly’ in the Guidance of EFSA on the ‘Use of the EFSA Comprehensive European Food Consumption Database in Exposure Assessment’ (EFSA, 2011aa).
Consumption records were codified according to the FoodEx classification system (EFSA, 2011bb). Nomenclature from the FoodEx classification system has been linked to the food categorisation system (FCS) as presented in Annex II of Regulation (EC) No 1333/2008, part D, to perform exposure estimates. In practice, the FoodEx food codes were matched to the FCS food categories.
The food category in which the use of green tea was considered was selected from the nomenclature of the EFSA Comprehensive Database (FoodEx classification system), at the most detailed level possible (up to FoodEx Level 3, ‘Green tea, infusion’) (EFSA, 2011).
The consumption of green tea infusion in consumers only for the various age groups according to the EFSA Comprehensive Database in described in Table 5. The Panel noted that two different population categories exist for ‘elderly’ (from 65 to 74 years old) and ‘very elderly’ (from 75 years old and older). The Panel considered to include the two population categories in one single category named ‘elderly’.
Table 5.
Consumers only consumption of green tea infusion for the various age populations according to the EFSA Comprehensive Database (g/day) and percentage of consumers for each population categories
| EGCG | Infants | Toddlers | Children | Adolescents | Adults | Elderly |
|---|---|---|---|---|---|---|
| Mean consumption (min–max) | 16.50 (0.6%) | 7.31 (0.6%)–23.75 (0.5%) | 16.67 (0.1%)–125.65 (12.3%) | 97.38 (3.3%)–331.47 (1.7%) | 122.83 (2.1%)–458.87 (6%) | 82.14 (2.4)–429.71 (9.4%) |
| 95th percentile of consumption (min–max) | – | – | – | 340 (17.4%) | 440 (21.2%)–1,237.5 (10.3%) | 1000 (9.4%) |
Information on the consumption of green tea infusions were also retrieved from literature.
In a prospective cohort study conducted in Japan, consumption of green tea was reported (Tomata et al., 2012). Of the 13,988 Japanese subjects, aged ≥ 65, 32% had ≥ 5 cups per day and 28% had 3–4 cups per day (in this study, the average cup size was 100 mL). The 95th percentile for green tea consumption in Japan and China, both countries with high tea consumption, was reported to be 4.6 cups/day (RKI, 1998). Other sources reported that the average green tea consumption among tea drinkers was up to three cups of tea per day (Kaegi, 1998; Khokhar and Magnusdottir, 2002; Hakim et al., 2003). In some countries, consumption could be greater than 10 cups per day (Muramatsu, 1991). Therefore, the typical green tea consumption ranges between 3 and 10 cups/day. In the US, according to the USDA 1994–1996 and 1998 Continuous Survey of Food Intakes by Individuals (CSFII) data, the 90th percentile for green tea consumption was 708 mL/day for the total population; 826 mL/day for men, age 20+; and 708 mL/day for women, age 20+; or approximately 3 cups, 3.5 cups and 3 cups, respectively (using a conversion of 240 mL for each 8 ounce cup) (USDA, 1994–1996 & 1998) (‘Documentation provided to EFSA’ N. 4).
3.3.1.2. Exposure to EGCG from green tea infusion
The Panel estimated chronic exposure to EGCG from green tea infusions for the following population groups: infants; toddlers, children, adolescents, adults and the elderly. Exposure to EGCG was calculated by multiplying EGCG concentrations (mg/g) for the consumption amount per kilogram of body weight for each individual in the Comprehensive Database (consumers only).
The concentration of EGCG used for the calculation of exposure has been extracted from the ‘USDA database for flavonoid content of selected foods’ (USDA, 2014 version 3.1). Exposure to EGCG was assessed by using the EGCG mean level reported for 100 brewed green tea samples (from 12 references) that was equal to 0.7 mg EGCG/g of brewed green tea.
The exposure estimate is reported in Table 6. The mean exposure EGCG from brewed green tea ranged from 5 mg/day in toddlers to 321 mg/day in adults. The high level exposure (95th percentile) to EGCG ranged from 238 mg/day in adolescents to 866 mg/day in adults.
Table 6.
Summary of dietary exposure to EGCG in consumers only in six population groups (minimum‐maximum across the dietary surveys in mg/day)
| EGCG | Infants | Toddlers | Children | Adolescents | Adults | Elderly |
|---|---|---|---|---|---|---|
|
Mean min–max |
11.55 | 5.12–16.63 | 11.66–87.96 | 68.16–232.03 | 85.98–321.21 | 57.5–300.8 |
| High level min–max | – | – | – | 238 | 308–866.25 | 700 |
The Panel noted that for population category ‘Infants’ for mean exposure and for population categories ‘Adolescents’ and ‘Elderly’ for the high level exposure, results on only one survey were available.
The Panel further noted that for the population categories ‘Infants’, ‘Toddlers’ and ‘Children’ results on surveys with number of participants greater that 60 were not available for high exposure. The Panel considered that for the high level exposure only surveys with a number of participants greater than 60 should be used for the calculation.
3.3.2. Food supplements
In response to a public call for data issued by EFSA, no data were received from interest parties on the use levels of catechins in green tea extracts used for the manufacturing of food supplement.
The daily consumption of green tea extracts from food supplements may vary considerably. Proposed levels of green tea preparations in food supplements offered for weight reduction purposes, may give rise to a daily intake of 150 mg caffeine, 375 mg catechins and 115–270 mg EGCG or higher (ESCO, 2009).
According to data from the food authorities in the Nordic countries the daily doses recommended by food supplement manufacturers/providers may be up to 1,944 mg for green tea extracts and up to 980 mg for the major catechin, EGCG.
3.3.2.1. Summarised data extracted from the Mintel GNPD
For the purpose of this Scientific Opinion, the Mintel Global New Products Database (GNPD) was used for checking the labelling of products containing green tea within the EU countries’ food products as the Mintel GNPD shows the compulsory ingredient information presented in the labelling of products.
The Mintel GNPD is an online database which monitors product introductions in consumer packaged goods markets worldwide. It contains information of over 2 million food and beverage products of which more than 800,000 are or have been available on the food market of the Member States. Mintel started covering the EU countries’ food markets in 1996, currently having 20 out of its 28 member countries presented in the Mintel GNPD. For the purpose of this Scientific Opinion, the Mintel GNPD was used for checking the labelling of products containing green tea within the EU countries’ food products as the Mintel GNPD shows the compulsory ingredient information presented in the labelling of products. According to Mintel GNPD, green tea is labelled on 203 products between January 2012 and February 2017. The food categories considered were: ‘Digestive & Detoxifying Treatments’, ‘Vitamins & Dietary Supplements’. The concentration of EGCG was also retrieved from this database, when available. Considering only those products where the content of EGCG were clearly stated, the information available were related to only 23 products.
The daily consumption in terms of EGCG for each product was calculated multiplying the dose unit of EGCG for the daily number of recommended doses of the product. The daily intake of EGCG for these products ranged from 5 to 1,000 mg/day, for adult population.
Among the 23 products retrieved with the Mintel GNPD, there were six products with a recommended daily dose below 100 mg; eight products with recommended daily dose ranging from 100 to 300 mg; three products with daily recommended dose above 800 mg. The maximum daily dose was reported for one product at 1,000 mg/day.
3.4. Biological and toxicological data
Biological and toxicological data on green tea extracts and substances have previously been evaluated by ESCO (2009) and EMA (2013a,b). The present opinion briefly reports the major conclusions from these reports. Additional information has been identified from the literature. In the toxicity studies, the doses are generally given as green tea preparations, with a highly varying content of catechins. To enable comparison between studies, the Panel considered only the content of EGCG in the administered dose of green tea catechins. The rationale for this is that EGCG (1) is the major catechin in green tea, (2) is present in plasma in the unconjugated form (Chow et al. (2003) and (3) the most cytotoxic catechin, compared to EGC and ECG in primary rat hepatocytes (Schmidt et al., 2005; Galati et al., 2006) and (4) in some studies it is the only catechin for which content is quantified and reported.
3.4.1. Absorption, distribution, metabolism and excretion (ADME)
The toxicokinetic studies of catechins from green tea in humans and in animals including in vitro data was reviewed in the Annex B of the ESCO advice on the EFSA guidance for the safety assessment of botanicals (EFSA Scientific Committee, 2009a,b), focusing on ‘Dried Green Tea Extracts’. An extensive overview on the metabolism of green tea catechins has been presented by Feng (2006). More recently, EMA (2013a,b) presented an assessment report on ‘Camellia sinensis (L.) Kuntze, non fermentatum folium’. This report contained overviews of available pharmacokinetic data regarding the herbal substance(s), herbal preparation(s) and relevant constituents thereof, in animals and humans.
Human data on toxicokinetic and safety on dried green tea extracts and products based thereon were summarised in the ESCO report (2009): ‘administration of concentrated green tea extracts under fasting conditions and as a bolus lead to a significant increase of plasma concentrations and bioavailability of EGCG compared to administration with food or in split doses respectively. The Working Group noted that the design of the studies (e.g. small number of persons per group, short exposure period) did not allow for the detection of any adverse effects other than those that are very common. The Panel also noted that although these clinical trials with dose levels up to 800–1,600 mg EGCG/day did not reveal serious adverse effects the studies were not designed to investigate the safety of EGCG’.
In its safety assessment on levels of EGCG in green tea extracts used in food supplements, the Norwegian Institute for Public Health considered toxicokinetic data in animal and humans included in these two previous evaluations (‘Documentation provided to EFSA’ n. 2), which was summarised as follows:
‘The metabolism of catechins follows the same pathway in mice, rats and humans. The provided literature did not refer to any data on absorption after oral exposure in humans. However, absorption of approximately 20% was demonstrated in beagle dogs after an oral, single dose of 250 mg/kg body weight of radio‐labelled EGCG (information if fasted or pre‐fed was not reported). In rats, absorption has been reported to be 1.6% ‐ 14%. It has also been observed that the excretion of EGCG in rats and mice predominantly occurs via faeces. Data on tissue distribution and excretion is not available for humans. However, bio‐distribution data from mice demonstrated that EGCG is widely distributed to various organs, and the liver is one of the target organs. Comparison of plasma concentrations of free EGCG in humans demonstrated a dose‐dependent linear increase in systemic availability for all tested doses at day 1 of treatment. After repeated treatment (10 days or 4 weeks), however, a steeper increase in systematic [sic] availability was demonstrated at the higher concentrations, thus indicating an increased bioavailability at higher doses. The human data also show that administration of green tea extract under fasting conditions, and as a bolus, leads to a significant increase in plasma concentration and bioavailability of EGCG compared to administration with food and in split doses, respectively. This effect is supported by studies in beagle dogs showing a ten‐fold increase in plasma concentration of EGCG after administration of EGCG to fasting dogs compared to pre‐fed dogs’. The Panel noted that there appeared to be increased systemic exposure following prolonged administration at high doses although neither the mechanism for this nor its consequences were understood.
On the basis of these reports, the Panel considered studies not previously evaluated or published after these evaluations. These studies generally involve pharmacokinetic studies in human volunteers and include data on levels of free, protein‐bound and conjugated forms of the major metabolites of green tea catechins in plasma and or excreted via urine. Other studies in humans or experimental animals, reported the biological fate of pure green tea catechins (GTCs), including EGCG, EGC, ECG and EC or as Polyphenon E, a decaffeinated green tea catechin mixture. Other studies are more particularly devoted to elucidate the hepatic and the intestinal metabolism of catechins and interaction with proteins with implications on the kinetics of catechins.
3.4.1.1. Administration of green tea preparations in humans
Tea infusion
Human subjects (5 volunteers) with an ileostomy received a green tea infusion (300 mL) prepared from 3 g of Indonesian green tea leaves and containing a total of 634 μmol catechins including 109 mg EGCG, 58 mg EGC, 28 mg ECG, 15 mg GC and 5 mg EC (Stalmach et al., 2010). Ileal fluid, plasma and urine collected 0–24 h after ingestion were analysed by HPLC/MS. The ileal fluid contained 70% of the ingested catechins in the form of unchanged compounds (33%) and 23 metabolites (37%). In the lumen of the small intestine, sulfates of EC and EGC were the main metabolites measured. Plasma contained 16 metabolites, principally methylated, sulfated and glucuronidated conjugates of EC and EGC, exhibiting peak plasma concentration at 0.8–2.2 h after administration. According to the authors, plasma pharmacokinetic profiles were similar to those obtained in other studies with healthy subjects, indicating that the absorption of catechins would occur in the small intestine. However, ileostomists had earlier peak plasma concentration times than subjects with a normal intestinal tract, including colonic passage. Urine contained 18 metabolites of EC and EGC in amounts corresponding to 6.8% of total catechins intake whereas excretion of EC metabolites was equivalent to 27% of the ingested EC and C.
The impact of the colonic microflora on the fate of the catechins entering the large intestine was investigated by Roowi et al. (2009). EC, EGC and EGCG were incubated in vitro with faecal slurries and the production of phenolic acid catabolites was determined by gas chromatography–mass spectrometry (GC–MS. In addition, excretion of urinary catabolites was investigated over a 24‐h period after ingestion of either green tea infusion (300 mL of boiled distilled water to 3 g of Indonesian green tea leaves) or water by healthy volunteers with a functioning colon. The infusion contained a total of 634 μmol catechins, including 109 mg EGCG, 58 mg EGC, 28 mg ECG, 15 mg GC and 5 mg EC. The green tea was also fed to ileostomists, and urinary excretion (0–24 h) of phenolic acid catabolites was monitored. From these in vitro and in vivo data, the authors proposed metabolic pathways involved in the colonic catabolism and urinary excretion of green tea catechins. Quantities corresponding to approximately 40% of catechins intake would be degraded in the colon and further metabolised into phenolic compounds passing into the blood from the large intestine, prior to urinary excretion. This would be higher than the approximate 8% of methylated, sulfated, and glucuronidated catechins conjugates absorbed in the small intestine. According to the authors, these data show the importance of the colonic microflora metabolic activity in the overall ‘bioavailability’ of dietary flavonoids.
Fung et al. (2013) performed a placebo‐controlled intervention study with 16 healthy volunteers and determined changes in total and free catechins after a single dose or after 1 week of twice‐daily green tea administered in the form of infusions of a tea bag containing 1.5 g of Longjing green tea leaves. The daily dose was 426 μmol of catechins including 98 mg EGCG, 34 mg EGC, 20 mg ECG, 13 mg EC and 2.3 mg C. Fasting samples were collected before and after (60 and 120 min for blood; 90 and 180 min for urine) drinking 200 mL of 1.5% (w/v) green tea or water, and again collected after 150 mL of 1% (w/v) supplemental green tea or water twice daily for 7 days. Subjects were crossed over onto the other treatment and procedures repeated. One hour post‐ingestion, EGCG level (141 ng/L in free form) was higher than EGC (58 ng/L; 30% free) and ECG (59 ng/L; 75% free). After 7 days of daily intake, plasma levels were higher than in controls: EGCG (36 vs 7 ng/L at baseline) and ECG (53 vs 18 ng/L), with more than 90% of both in their conjugated forms whereas total EGC was less than 3 ng/L. EGC and EC were rapidly excreted in urine as conjugates but urinary excretion of EGCG and ECG were negligible. According to the authors, plasma concentrations reflected the contents of catechins in the green tea consumed: EGCG > EGC > ECG. Moreover, after chronic consumption there was almost no EGC found in fasting plasma, some EGCG was present and a rather high level of ECG was observed.
Ready‐to‐drink tea
Del Rio et al. (2010a) investigated the plasma pharmacokinetics and the urinary excretion of catechins in 20 healthy human volunteers given 400 mL of a ready‐to‐drink green tea containing approximately 400 μmol of catechins (corresponding to 75 mg EGCG, 11 mg EC, 22 mg ECG, 6 mg GC, 3 mg C and 7 mg GCG). Urine and plasma were collected for 24 and 4 h, respectively. Thirty‐nine catechin catabolites were identified in biological fluids. In plasma, EGCG was the only unchanged reaching a C(max) of 36 ng/L at 1.4 h) when compared with EGC and EC conjugates plasma concentrations. The authors expressed the ‘bioavailability’ as the ratio between total metabolite urinary excretion and the total intake of catechins, it was equal to 39%. In urine, the main urinary catabolites were colonic microflora‐derived polyhydroxyphenyl‐γ‐valerolactones with concentrations 10 times greater than catechin conjugates. A great variability in urinary excretion of colonic metabolites was observed among participants, probably related to differences in their colonic microflora. The Panel noted the high ‘bioavailability’ of catechins when colonic ring fission metabolites were taken into account.
In another study, Del Rio et al. (2010b) reported the urinary excretion of catechins after the ingestion of 500 mL of a commercial ready‐to‐drink tea containing low levels of catechins (87 μmol catechins, including 12 mg EGCG, 11 mg ECG, 7 mg EGC and 4 mg EC) by 20 human volunteers. In this feeding study, urine samples were collected for 24 h after tea ingestion. Catechin‐derived molecules were identified and quantified in urine samples by HPLC/MS detection. Eight relevant metabolites were identified in urine as modified catechins. The urinary excretion of the identified catechins was equal to 7.2% of the intake. According to the authors, the ‘bioavailabilities’ observed were in agreement with previous reports, although the dosage of catechins ingested in this study was significantly lower.
Calani et al. (2012) investigated absorption, metabolism and urinary excretion of catechins were in 20 healthy volunteers drinking 500 mL (containing 728 μmol catechins including 91 mg EGCG, 58 mg ECG, 57 mg EGC, 14 mg EC and 11 mg GC) of a ready‐to‐drink green tea industrially made from Sri Lankan tea leaves. Tea and urine sampled up to 48 h post‐administration were analysed by HPLC/MS. A total of 41 metabolites were identified in urine, all present in conjugated forms as glucuronides, monosulfates or disulfates. Among these, six colonic metabolites of green tea catechins were identified for the first time after green tea consumption in humans. Calculated as the ratio between the total metabolite excretion (catechins and microbial metabolites) and the total intake of catechins, the average 48 h ‘bioavailability’ was 62%, the major contributors being microbial metabolites. The urinary excretion varied among the volunteers from 30% to 100% of the ingested dose.
Butler et al. (2015) conducted a nested case‐control study among 211 cases of hepatocellular carcinoma (HCC) and 1,067 matched controls to study the association between urinary catechins (e.g. EC, EGC) and HCC (described in Section Liver cancer). Subjects with positive HBsAg and low retinol levels (< 45.8 μ/dL) and detectable levels of EGC had a further increased risk of HCC. In this population, green tea drinkers consuming > 10 cups per day had a 3‐fold increase in urinary EGC in comparison to non‐drinkers (p < 0.001).
Green tea extracts
A randomised, placebo‐controlled study, where 40 healthy volunteers (≥ 18 years of age with Fitzpatrick skin type II or III) received 800 mg EGCG once daily, 400 mg EGCG twice daily or a decaffeinated extract of green tea (Polyphenon E® capsules, each containing 200 mg EGCG, 37 mg EGC, 31 mg EC) as a single daily dose of 800 mg EGCG or as 400 mg EGCG twice daily (Chow et al., 2003). Treatments were taken with food and continued for 4 weeks (8 persons/group). Placebo capsules contained the pharmaceutical excipients. EGCG was present in plasma mostly in the free (unconjugated) form (> 92%), while levels of free EGC and EC were below the limit of detection. On average, the area under the curve (AUC) of free EGCG increased by more than 60% after 4 weeks of tea polyphenol treatment at a dosing schedule of 800 mg once daily (pure EGCG or Polyphenon E). By contrast, a dosing schedule of 400 mg twice daily did not result in significant changes in the AUC of free EGCG. The authors suggested the increased systemic exposure to be due to inhibition of presystemic elimination, such as inhibition of non‐enzymatic degradation, intestinal flora metabolism, and/or intestinal efflux of EGCG. The Panel noted that non‐fasted bolus doses of EGCG of 800 mg/day for 4 weeks resulted in approximately 50% increased daily systemic exposure of unconjugated EGCG. The Panel considered that a high daily bolus EGCG exposure may lead to a higher internal exposure due to reduced presystemic elimination.
Auger et al. (2008) investigated the absorption of catechins in the small intestine. Human volunteers with an ileostomy ingested a capsule of 200 mg Polyphenon E®, a green tea extract containing 142 mg EGCG, 21 mg EC, 14 mg ECG and 9 mg EGC. Ileal fluid and urine, collected over a 24‐h period, were analyzed by HPLC/MS. Approximately 40% of catechins intake was recovered in ileal fluid. Moreover, 14 urinary metabolites, comprising sulfates, glucuronides and methylated metabolites, were quantified. All were metabolites of EC and EGC, representing 47% and 26%, respectively, of the ingested parent compound. According to the authors, these high recoveries would indicate that these catechins absorbed in the small intestine would be much more bioavailable than most dietary flavonoids. Increasing the intake of Polyphenon E, by feeding doses of 200, 500, and 1,500 mg, led to increased urinary excretion of EC metabolites but not metabolites of EGC. When 200 mg of Polyphenon E was co‐ingested with bread, cheese or glucose, the absorption, metabolism and excretion of catechins were not significantly modified.
From 10 healthy human subjects consuming 500 mL of Choladi green tea preparation, containing 648 μmol of catechins (corresponding to 78 mg EGC, 105 mg EGCG, 17 mg EC, 22 mg ECG, 11 mg GC, 3 mg C and 4 mg GCG), plasma and urine samples were collected over a 24‐h period and analysed by HPLC/MS (Stalmach et al., 2009). Plasma contained unchanged EGCG and ECG with respective C(max) values of 25.2 and 11.0 ng/L. Plasma also contained ten metabolites, in the form of O‐methylated, sulfated and glucuronide conjugates of EC and EGC, with 8–56 ng/L peak plasma concentrations occurring 1.6–2.3 h after ingestion. EGCG and ECG were not detected in urine excreted 0–24 h after consumption of green tea while 15 metabolites of EC and EGC were detected. Total catechin metabolite urinary excretion averaged 8.1% of the total oral intake, whereas urinary EGC and EC metabolites corresponded to 11.4% and 28.5% of EGC and EC intakes, respectively. According to the authors, these findings are indicative that epicatechins are highly bioavailable, being absorbed in the small intestine and excreted to a much greater extent than most other flavonoids. Moreover, AUC and C(max) values would not provide an accurate quantitative assessment of uptake for the gastrointestinal tract, due to their rapid turnover in the circulatory system.
Effects of dietary proteins on plasma kinetics of catechins were investigated in a randomised, cross‐over design with 1 week interval between treatments (Egert et al., 2013). The 24 participating women consumed 1.75 g decaffeinated green tea extract, containing 445 mg total catechin, 260.1 mg EGCG, 112.6 mg ECG, 42.5 mg EGC, 24.8 mg EC and 5.3 mg C, dissolved in 300 mL water or dissolved in water containing 2.17 g of either skimmed milk, caseinate or soy protein. Plasma levels of total (unconjugated and glucuronidated/sulfated metabolites) catechins, EGCG, ECG, EGC, EC and GC were determined before and at different intervals from 30 to 270 min after ingestion of the test beverage. Compared to controls, bolus consumption of green tea with milk, caseinate or soy protein statistically significantly reduced the AUC of total catechins, EGCG and ECG, while there was no statistically significant effect on the kinetics of the non‐galloylated catechins, EGC and EC. The dietary proteins had similar effects on the kinetics and the AUC values of total catechins, EGCG and ECG were between 63% and 88% of the controls. The authors suggested that the reduced bioavailability was due to reduced absorption after non‐covalent binding of the galloylated catechins to proteins.
3.4.1.2. Administration of isolated green tea catechins or catechin mixtures in humans
Ullmann et al. (2003) reported a randomised, double‐blind, placebo‐controlled study in which 10 fasting healthy male volunteers received single doses of 50, 100, 200, 400, 800 and 1,600 mg EGCG (94% pure). No adverse events occurred within the observational period of 26 h and no effects on cardiovascular variables or clinical chemistry (not specified) were observed. In each group, the kinetic profile revealed rapid absorption followed by a biphasic decrease consisting of distribution and elimination phases. According to the doses, AUC of total EGCG varied between 442 and 10,368 ng.h/mL C(max) values ranged from 130 to 3,392 ng/mL and were observed after 1.3–2.2 h. Elimination half‐life values were seen between 1.9 and 4.6 h. Total and free EGCG levels in plasma increased with dose. The authors noted that C(max) and AUC values were considerably higher than for corresponding doses in the study by Chow et al. (2003, described above) where EGCG was taken with food.
In another placebo‐controlled study, Ullmann et al. (2004) assessed the safety, tolerability, and plasma pharmacokinetics of 94% pure crystalline EGCG after repeated dosing in 36 healthy male volunteers for 10 days. Each treatment group consisted of 12 fasting subjects receiving oral EGCG in one dose of 200, 400 or 800 mg daily (n = 9), or a placebo (n = 3). Blood samples were taken on day 1 and day 10. For each dosage group, kinetic parameters and accumulation factor (R, ratio of AUC day 10/AUC day 1) were determined and compared between day 1 and day 10. Ten days repeated administration of oral doses of EGCG of up to 800 mg/day were found to be safe and well tolerated. After the first dosing, EGCG was rapidly absorbed and a dose linearity was established. After 10 repeated dosings, dose linearity was applied between the 200 and 400 mg group. The highest dose (800 mg/day) was more than dose‐proportional in rate and extent, and statistically different from the 200 and 400 mg group. According to the authors, an increase in elimination half‐life and in the accumulation factor (R) in the 800 mg dosage group would indicate dose‐dependent saturation of capacity‐limited excretion routes or an increase of enterohepatic circulation.
The aim of the study of Weise et al. (2015) was to describe the metabolic fate of EC in a randomised cross‐over study in humans (n = 6). After the ingestion of a single dose of EC (1 mg EC/kg bw), free and conjugated EC were determined in blood plasma. The peak plasma concentration of free EC was very low and accounted for a maximum of 5 ng/L. Following, enzymatic treatment, EC and its 3‐ and 4‐O‐methylated metabolites were detected in samples taken within the first 8 h after administration. The plasma concentrations followed a typical pharmacokinetic course with a maximum plasma concentration observed 2–4 h following EC ingestion. Twenty‐seven per cent of the total amount of all metabolites was methylated in 3‐O position and 11% in 4‐O position. In urine, free and conjugated EC were detected. The concentration of free EC was very low, accounting for 0.4% of all EC metabolites. After enzymatic cleavage, an increased level of EC as well as 3‐O‐MeEC and 4‐O‐MeEC was detected in urine samples collected 0–24 h after ingestion. In addition to these conjugated urinary metabolites, 5‐(3′,4′‐dihydroxyphenyl)‐valerolactone represented an important in vivo metabolite of EC produced by the gut microbiota.
Overall, in humans receiving tea infusion, ready‐to‐drink tea or tea extracts, plasma contains unchanged EGCG and ECG and several catechin metabolites in the form of O‐methylated, sulfated and glucuronide conjugates of EC and EGC. The urinary excretion of such catechin metabolites accounted for 7% of the catechins intake whereas approximately 40% of this intake would be degraded in the colon and further metabolised into phenolic compounds passing into the blood from the large intestine, prior to urinary excretion. Large bolus doses of tea extracts could result in increased daily systemic exposure to unconjugated EGCG due to reduced presystemic elimination. Non‐fasted bolus doses of 800 mg EGCG/day for 10 days or longer resulted in increased systemic EGCG exposure, which was not as evident when the dose was split into two daily doses of 400 mg EGCG/day. Dietary proteins significantly decrease systemic exposure to galloylcatechins (EGCG and ECG) but not to non‐galloylated catechins.
3.4.1.3. Administration of green tea extract and catechins in animals
A considerable amount of literature described the metabolism of green tea catechins in animal models. Detailed review on the data available on the biotransformation of the tea catechins have been published by Feng (2006) and by Lambert et al. (2007). According to Lambert et al. (2007), ‘recent studies have demonstrated that green tea catechins undergo methylation, glucuronidation and sulfation in in vitro systems and in animals; it has been also found that efflux transporters Pgp, MRP1 and MRP2 play roles in the absorption and excretion of green tea catechins. Several processes including intestinal metabolism, microbial metabolism, hepatic metabolism and chemical degradation have been found to be involved in the fate of green tea, and to be responsible for its low availability in animals, and most likely also in humans’.
In vitro and in situ studies
Kuhnle et al. (2000) compared the absorption and metabolism of catechin and EC in the small intestine by measuring their transfer across the jejunum and ileum. Perfusion of rat isolated jejunum with the catechins resulted in glucuronidation (approximately 45%), 3′‐O‐ and 4′‐O‐methylation (approximately 30%), and O‐methyl‐glucuronidation (approximately 20% of total metabolites identified) during transfer across the enterocytes from apical to serosal side. According to the authors, this would demonstrate the activity of catechol‐O‐methyl transferases in the metabolism of catechins, suggesting that these metabolites and conjugates are likely to enter the portal vein. In contrast, in case of ileum, the majority of the catechins appeared on the serosal side unmetabolised and the total percentage of catechins transferred was fivefold higher than that in the jejunum. So, differences in the extent and total amount of transfer of catechins were demonstrated between the jejunum and the ileum, the latter showing greater transfer predominantly due to a greater amount of unmetabolised catechins.
Crespy et al. (2004) investigated the glucuronidation of ECG and EGCG (315 μM) by rat liver, jejunal and ileal microsomes. Using rat liver microsomes, ECG and EGCG were respectively glucuronidated by 12.2% and 7.5% after 3 h of incubation. Intestinal microsomes were also able to glucuronidate ECG and EGCG, exhibiting higher activity on the galloyl group than on the flavonoid ring of ECG and EGCG, jejunal activity was generally higher than ileal one. In contrast, hepatic glucuronidation was higher on the flavonoid ring of EGCG and ECG compared to the galloyl groups. According to the authors, the low glucuronidation rates could partially explain why these catechins are present in plasma as unconjugated forms.
The objective of the study of Chan et al. (2007) was to investigate the kinetics of the intestinal efflux transport of the four major green tea catechins in Caco‐2 cell lines and to provide comparison on the efflux transport between the four studied catechins. The Caco‐2 cell monolayer model was used to measure the basal‐to‐apical transport of each catechin at concentrations ranging from 15 to 265 μM. Transported amount of GTC was measured by HPLC with electrochemical detection. The extent of basal‐to‐apical transport was, in descending order, EC > EGC > ECG = EGCG. Kinetic studies indicated that active and saturable efflux transport of EC took place in Caco‐2 cells whereas no saturation was observed for the efflux transport of EGC, ECG and EGCG even at high concentrations (200 μM). According to the authors, the extent of efflux transport of catechins in Caco‐2 cells may reflect the order of elimination occurring in the intestine. Moreover, this study would demonstrate the importance of efflux transporters in basal‐to‐apical transport of EC and would suggest their role in the limited oral bioavailability of EC.
Takagaki and Nanjo (2009) investigated the in vitro anaerobic metabolism of EGCG by rat intestinal bacteria, the degradation products being identified by HPLC or liquid chromatography–mass spectrometry (LC–MS) analyses. Intestinal bacteria capable of hydrolyzing EGCG to EGC and gallic acid were screened with 169 strains of enteric bacteria. Enterobacter aerogenes, Raoultella planticola, Klebsiella pneumoniae and Bifidobacterium longum subsp. infantis were found to metabolise EGCG. Subsequent steps of EGCG metabolism are degradation of EGC by intestinal microbiota. When EGC was incubated with rat intestinal microbiota, EGC was converted by reductive cleavage and subsequently converted to 1‐(3′,5′‐dihydroxyphenyl)‐3‐(2″,4″,6″‐trihydroxyphenyl)propan‐2‐ol followed by the conversion to 5‐(3,5‐dihydroxyphenyl)‐4‐hydroxyvaleric acid. This degradation pathway was considered to be the major route of EGCG metabolism in the in vitro study. In addition to the in vitro experiments, such metabolites were detected after direct injection of EGC into rat caecum. All these metabolites were found in the feces when EGCG was administered orally to the rats. Among the metabolites detected, 5‐(3,5‐dihydroxyphenyl)‐4‐hydroxyvaleric acid was dominant both in the caecal contents and faeces of these animals. According to the authors, these data suggested that the metabolic pathway of EGCG found in the in vitro study may be regarded as reflecting its metabolism in vivo.
In vivo studies
Following oral administration of 200 mg of EGCG to rats, the presence of EGCG was examined in the portal blood 45 min post‐administration (Okushio et al., 1995). EGCG was identified in the blood by HPLC/MS analysis. The results clearly demonstrated that EGCG is absorbed, at least in part, into the portal blood via intestinal tract in the rat.
After oral administration of 500 mg EGCG/kg bw to bile duct cannulated rats, its biliary metabolites were identified by Kida et al. (2000). The free forms of the biliary metabolites were isolated by beta‐glucuronidase/sulfatase treatment and were purified by HPLC. Six compounds purified were subjected to MS and NMR analyses and were identified as EGCG, 3′‐O‐methyl‐EGCG, 4′‐O‐methyl‐EGCG, 3″‐O‐methyl‐EGCG, 4″‐O‐methyl‐EGCG and 4’,4″‐di‐O‐methyl‐EGCG. The six EGCG metabolites and their conjugates excreted during a 4‐h period amounted to roughly 0.1% and 3.3% of the administered dose of EGCG, respectively. 4″‐O‐methyl‐EGCG and 4’,4″‐di‐O‐methyl‐EGCG were estimated to exist only in the sulfate form whereas the other four metabolites existed in both glucuronide and sulfate forms.
El Mohsen et al. (2002) investigated the ability of ingested epicatechin to cross the blood–brain barrier and target the brain. Rats were orally administered 100 mg EC/kg bw per day for 1, 5, and 10 days. Plasma and brain extracts were analyzed by HPLC with photodiode array detection and liquid chromatography with tandem mass spectrometry (LC–MS/MS). In the plasma, the main metabolite detected was the epicatechin‐O‐β‐d‐glucuronide, reaching a concentration of 47 μM. Although the 3′‐O‐methyl epicatechin glucuronide was found at high concentrations of approximately 18 μM, the results point also to the presence of low levels of the 4′‐O‐methyl epicatechin conjugates, epicatechin and 3′‐O‐methyl epicatechin. Using whole brain tissue, epicatechin glucuronide and 3′‐O‐methyl epicatechin glucuronide were detected by HPLC and proven by MS/MS fragmentation; however, the levels found were too low for an accurate quantification.
Lin et al. (2008) investigated the pharmacokinetics of EGCG in conscious and freely moving rats by an automated blood sampling device associated to HPLC/MS. The protein binding of EGCG in rat plasma was 92.4%. Following intravenous administration (10 mg/kg bw) to rats, the disposition of EGCG in the rat blood was fitted by a two‐compartmental open pharmacokinetic model. The elimination half‐lives of EGCG were 62 and 48 min following intravenous (10 mg/kg) and oral (100 mg/kg) administration, respectively. By using pharmacokinetic data, the oral bioavailability of EGCG in a conscious and freely moving rat was estimated as 4.95%. As determined 15 min after an intravenous administration of 50 mg EGCG/kg bw, the brain distribution data indicated that EGCG penetrates various brain regions like cortex (6.23 ng/g), brain stem (3.76 ng/g; lower than LLOQ), hippocampus (4.18 ng/g), striatum (4.72 ng/g), cerebellum (7.13 ng/g), and the rest of the brain (1.31 ng/g; lower than LOD).
Mata‐Bilbao et al. (2008) determined the kinetics of green tea catechins and their metabolites in plasma and urine in 10 Beagles dogs. The animals were administered with capsules of a green tea extract containing 173 mg (12.3 mg/kg bw) of catechins (corresponding to 124 mg EGCG, 9 mg EGC, 21 mg EC, 19 mg ECG and 4 mg C)., Blood and urine samples were collected 24 h after administration. Two catechins with a galloyl moiety and three conjugated metabolites were detected in plasma. Most of the detected forms in plasma reached their maximum plasma concentration (Cmax) at around 1 h. The following median pharmacokinetic parameters were determined: Cmax of 0.3, 0.1, 0.8, 0.2 and 1 μM; AUC (0–24 h) of 71, 14, 427, 40 and 112 μg.h/L × h; Mean Residence Time (MRT) (0–24 h) 5, 2, 10, 3, 2.4 h for EGCG, ECG, EGC‐glucuronide, EC‐glucuronide and EC‐sulfate, respectively. The catechins detected in urine were present as conjugated forms suggesting that EGCG and ECG are excreted with the bile. According to the authors, EGC‐glucuronide is the metabolic form remaining in the organism for a longer period of time, suggesting the occurrence of an enterohepatic circulation of this metabolite.
Dube et al. (2011) determined the plasma concentrations of EGCG in mice following administration of a dose reflecting typical consumption of one standard green tea beverage. Swiss Outbred mice were orally administered with 0.76 mg/kg bw EGCG. As determined by using a validated HPLC method, the Cmax of free and total EGCG were 14.1 and 15.5 ng/mL, respectively. The AUC for free and total EGCG were 50 and 52 ng.h/L, respectively. According to the authors, this study demonstrated that plasma concentrations of EGCG are in the low nM concentration range following the oral administration to mice of a dose reflecting the consumption of a standard green tea beverage.
The pharmacokinetics of EGCG and of its O‐methyl derivatives (–)‐epigallocatechin‐3‐O‐(3‐O‐methyl)gallate and (–)‐epigallocatechin‐3‐O‐(4‐O‐methyl)gallate present in tea cultivars, were compared in rats (Oritani et al., 2013). Oral (100 mg/kg bw) and intravenous (10 mg/kg bw) administrations were investigated for each compounds. AUCs for EGCG, EGCG3″Me, and EGCG4″Me following oral administration were 39.6, 317.2, and 51.9 μg.h/L, respectively. After intravenous administration, AUCs were 2,772, 8,209 and 2,465 μg.h/L for EGCG, EGCG3″Me and EGCG4″Me, respectively. The bioavailability of EGCG3″Me (0.38%) was higher than those of EGCG4″Me (0.21%) and EGCG (0.14%). The distribution volume of EGCG3″Me (0.26 L/kg) was the lowest (EGCG: 0.94 L/kg and EGCG4″Me: 0.93 L/kg). According to the authors, these results would suggest that the higher AUC of EGCG3″Me after oral administration was related to its higher bioavailability and lower distribution volume. Moreover, these findings would support the stronger bioactivity of EGCG3″Me in vivo.
Ascorbic acid and sucrose can influence the bioavailability of green tea catechins. Peters et al. (2010), tested the bioavailability and the free catechins that could be absorbed in Sprague–Dawley rats and showed that the absorption of epigallocatechin and epigallocatechin gallate was enhanced in the green tea extracts formulated with sucrose and ascorbic acid, by enhancing the free portion that could be absorbed and intestinal uptake from tea.
Overall, in animals receiving green tea extract or purified catechins, free EGCG and conjugated forms of EC, ECG and EGC were detected in plasma. Jejunum and liver tissues are able to metabolise EC and EGCG to their respective conjugated or methylated metabolites. The intestinal microbiota is responsible for the high degree of metabolism to polyhydroxyphenyl‐γ‐valerolactones which are the main urinary catabolites, averaging 10 times greater concentrations than catechin conjugates. Because of the major presence of free EGCG in plasma and several similarities in circulating, hepatic and intestinal metabolites, the metabolism of catechins seems to follow the same pathways in mice, rats and humans.,
3.4.1.4. Conclusion on ADME
Intestinal microbiota are responsible for significant presystemic metabolism to polyhydroxyphenyl‐γ‐valerolactones which are the main urinary catabolites, averaging 10 times greater concentrations than catechins conjugates.
The plasma concentration of unchanged EGCG, EGC, ECG and EC is influenced by extensive presystemic and microbial metabolism, in both animals and humans administered infusions, green tea extracts or pure catechins.
As demonstrated in animal studies, jejunum and liver tissues are able to metabolise EC and EGCG to their respective conjugated or methylated metabolites.
In humans, plasma contained intact EGCG and ECG and several catechin metabolites in the form of O‐methylated, sulfated and glucuronide conjugates of EC and EGC.
Human data show that administration of green tea extract under fasting conditions, and as a bolus, leads to a significant increase in the area under the plasma concentration time curve of EGCG compared to administration with food and in split doses
Bolus doses of 800 mg EGCG/day for 10 days or longer administered under non‐fasting conditions, resulted in increased systemic EGCG exposure, which was not as evident when the dose was split into two daily doses of 400 mg EGCG/day, although the mechanism(s) for this was not understood.
Green tea catechins are known to bind to dietary components like proteins leading to a possible decrease in bioavailability of both catechins and dietary components.
In general, the metabolism of catechins follows the same pathway in mice, rats and humans; consequently, animal models are generally predictive of catechin toxicokinetics in humans.
3.4.2. Toxicological data
3.4.2.1. Human data on liver toxicity
Background
Green tea extracts have been associated with cases of hepatotoxicity, especially when used for weight control (Sarma et al., 2008; Mazzanti et al., 2009, 2015; Navarro et al., 2017). A green tea preparation, Exolise® marketed for weight loss, was withdrawn in 2003 after 13 cases of hepatotoxicity. One capsule of the drug contained 375 mg of a patented hydroalcoholic green tea extract, which was obtained using 80% ethanol as the extraction agent and which was standardised to 25% EGCG. Furthermore, the extract contained 5–10% caffeine. The drug was reported to be used at a recommended dose of two capsules twice a day (daily dose corresponding to 375 mg EGCG) (ESCO, 2009). Liver toxicity was estimated to occur in one case per 100,000 sold boxes and appeared on average after 50 days of use (Sarma et al., 2008).
After the first case reports on association between green tea extracts and liver injury, much attention has been given to the possible hepatotoxic effects of green tea. Thus, Hydroxycut®, a multi‐ingredient herbal food supplement also containing green tea, was recalled in 2009 from the market in the US after, based on cases of hepatotoxicity associated with the supplement reported to the FDA (Fong et al., 2010). Many green tea based supplements are marketed today and new reports on hepatotoxicity associated with green tea‐containing food supplements are published. For example, SLIMQUICK® weight loss products, many of which contain green tea extract, have been associated with six cases of acute liver injury (Zheng et al., 2016). In a recent review on liver toxicity related to herbs and dietary supplements, green tea extract was listed as the fourth of the herbs with the most number of reported publications (Brown, 2017). Moreover, 40% of 73 herbal and dietary supplements involved in hepatotoxicity, that did not identify green tea extracts or any of its component catechins on their label, contained catechins (Navarro et al., 2013). Data on subclinical liver effects are available from many clinical trials studying beneficial effects of green tea extracts, most of them including frequent measurements on liver parameters.
Intervention studies
A large number of clinical trials have been performed to investigate purported beneficial effects of green tea catechins. Serum levels of the enzymes alanine aminotransferase (ALT) and aspartate aminotransferase (AST) have been investigated routinely in many of the trials as biomarkers of liver toxicity (Giannini et al., 2005).
For the classification of liver toxicity, National Cancer Institute Common Terminology Criteria for Adverse Events (NCI CTCAE)10 are often applied (Table 7).
Table 7.
National Cancer Institute Common Terminology Criteria for Adverse Events (NCI CTCAE) used for the classification of liver toxicity
| Adverse event | Grade 1 | Grade 2 | Grade 3 | Grade 4 | Grade 5 |
|---|---|---|---|---|---|
| Alkaline phosphatase increased | > ULN–2.5 × ULN | > 2.5–5 × ULN | > 5–20 × ULN | > 20 × ULN | – |
| Total bilirubin increased | > ULN–1.5 × ULN | > 1.5–3 × ULN | > 3–10 × ULN | > 10 × ULN | – |
| GGT increased | > ULN–2.5 × ULN | > 2.5–5 × ULN | > 5–20 × ULN | > 20 × ULN | – |
| Aspartate aminotransferase increased | > ULN–3 × ULN | > 3–5 × ULN | > 5–20 × ULN | > 20 × ULN | – |
| Alanine aminotransferases increased | > ULN–3 × ULN | > 3–5 × ULN | > 5–20 × ULN | > 20 × ULN | – |
ULN: upper limits of normal; GGT: gamma‐glutamyl transferase.
Even if the exposed number of subjects is low in most of the studies, which results in a low statistical power, in the intervention studies, in contrast to the human case reports, the dose is mostly well characterised and expressed as EGCG thus allowing a comparison across the studies. However, generalisability of trial findings to the general population may be limited as most trials enrolled subjects with medical conditions. Polyphenon E (Mitsui Norin, Ltd; Shizuoka, Japan), which has been used in several studies, is made from 100% green tea leaves, extracted with hot water and spray‐dried into a fine powder.
In total, 52 publications on intervention studies on green tea preparations were selected for evaluation, 48 based on the compilation by Dekant et al. (2017), stated to include data on liver effects, and 4 from other literature searches. Three of the intervention studies were each reported as two separate publications (Basu et al., 2010, 2011; Shen et al., 2010, 2012; Dostal et al., 2015; Yu et al., 2017), thus the total number of intervention studies evaluated was 49. The studies will be described according to the outline in Figure 1. Only 4 intervention studies were performed with green tea infusions (presented in Table 11) and the remaining studies were performed with green tea extracts.
Figure 1.
Overview of intervention studies on green tea preparations used for evaluation in the present opinion
Table 11.
Intervention studies with green tea infusions. No effects were observed on serum transaminases
| Author, year | Dose EGCG (mg/day) | Duration | Treatment | Subjects treated/placebo | Liver parameters studied | Liver effects |
|---|---|---|---|---|---|---|
| Kim et al. (2006) | 256 | 2 weeks | 1 L tea | 20 (before and after GT) | AST, ALT | No effects |
| Basu et al. (2011) | 440 (green tea bags)–460 (green tea extract) | 8 weeks | BID, 2 × 2 cups or 1 capsule | 13 tea, 10 GTE/12 | AST, ALT, BUN, albumin | No effects |
| Wang et al. (2010) | 458/468/886 mg total catechins | 3 months | BID, as tea with food | 47 low, 49 medium, 43 high dose/43 | ALT, AST, LDH, ALP, GGT | No treatment related effects |
BID: twice per day (bis in die); ALT: alanine aminotransferase; AST: aspartate aminotransferase; BUN: blood urea nitrogen; GGT: gamma‐glutamyl transferase; LDH: lactate dehydrogenase; ALP: alkaline phosphatase.
Of the 38 studies, 9 reported elevated serum transaminases, classified as Grade 1 or higher (Table 8). One additional study, Shen et al. (2010), reported one case with elevated serum transaminases in the treated group. However, this case was associated with drug treatment (elevation of serum transaminases disappeared after discontinuation of drug treatment) and not considered by the authors to be due to green tea catechins. In one of the nine studies, elevated serum transaminases were as frequent in the placebo group as in the treated group (Joe et al., 2015) and in another study the only case of abnormal liver parameters was in the placebo group (Meshitsuka et al., 2017). Two of the nine studies did not include a control group (Shanafelt et al., 2009, 2013).
Table 8.
Intervention studies with green tea preparations (extracts) showing effects on liver parameters (transaminases)
| Author, year | Dose EGCG (mg/day) | Duration | Treatment | Subjects treated/placebo | Liver effects (transaminases) | Odds ratio |
|---|---|---|---|---|---|---|
| Garcia et al. (2014) | 800 | 4 months | PolyE, SID with food | 50/48 | 5 treated (Gr1 and 2) and 1 placebo (Gr3) | – |
| Lovera et al. (2015) | 800 | Phase I: 6 months, Phase II: 12 months | PolyE, BID with food | Ph1: 10/0; PhII: 7/5 | PhI: 1 (Gr3); PhII; 4 in treated (2 Gr1; 1 Gr2; 1 Gr4) and 1 placebo (Gr1) | – |
| Dostal et al. (2015), Yu et al. (2017) | 843 | 12 months | GTE, BID with food | 513/508 | 36 in treated (22 Gr1, 7 Gr2, 6 Gr3 and 1 Gr4) and 4 placebo (Gr 1) | 9.6 95% CI 3.4‐27.0, p < 0.0001 (Dostal et al.); Grade 2 or and above 7.0 95% CI = 2.4–20.3, p = 0.0002 (Yu et al.) |
| Joe et al. (2015) | Poly E: 400, 800, 1,200; EGCG 50–75% | 6 months | BID | 6, 7 and 20 received 400, 800 and 1,200, resp./11 | 3 in treated (Gr1) and 3 placebo (Gr1) | – |
| Ullmann et al. (2004) | 200, 400 and 800 pure EGCG | 10 days | SID, fasting | 9 for each dose/9 | 1 in high dose (Gr1) | – |
| Crew et al. (2012) | 800, 1200, 1,600 | 6 months | PolyE, BID with food | 16, 11 and 3 received 800, 1,200 and 1,600, resp./10 | 1 in highest dose (Gr3); 2 in treated groups (Gr1) | – |
| Meshitsuka et al. (2017) | 1,890 | 6 months | TID with food | 36/21 | 1 in placebo (Gr3–4) | – |
| Shanafelt et al. (2009) | 8 doses; 800–4,000 | Up to 6 months; Phase I | PolyE, BID, with food | 36; 3–6/dose; 30 at or above 800/0 | 11 in treated (Gr1) | – |
| Shanafelt et al. (2013) | 4,000 | 6 months; Phase II | PolyE, BID with food | 42/0 | 13 (Gr1); 6 (Gr2); 1 (Gr3) | – |
The dose of EGCG in the seven studies with higher incidence of abnormal liver parameters in the group treated with green tea extracts was 800 mg or above. The duration of studies varied between 4 and 12 months, except one study with duration 10 days (Ullmann et al., 2004). The treatment with green tea extracts was in two studies once a day and in the other studies two times a day. Green tea extracts were taken with food in all studies, except in Ullmann et al. (2004), where the subjects were fasting at treatment. In five of the studies, Polyphenon E was the source of green tea extract, containing 56–72% EGCG, while in the study by Dostal et al. (2015), Yu et al. (2017) green tea catechin extract complex, containing 64% EGCG, was administered and in the study by Ullmann et al. (2004) pure EGCG was used. The number of treated participants at or above 800 mg EGCG/day in the studies was 724.
Three studies were performed in patients with non‐alcoholic fatty liver disease (NAFLD or non‐alcoholic steatohepatitis (NASH)) (Sakata et al., 2013; Fukuzawa et al., 2014; Pezeshki et al., 2016) (Table 9) with elevated serum AST and ALT. The serum transaminases decreased after treatment, or did not increase as much as in the controls, not receiving green tea preparations. The doses of EGCG were 157–315 mg/day, or in one case given as total catechins, 1,080 mg. The duration of treatment was from 12 weeks to 6 months.
Table 9.
Intervention studies with green tea extracts in subjects with non‐alcoholic fatty liver disease, showing effects on serum transaminases
| Author, year | Dose EGCG (mg/day) | Duration | Treatment | Subjects number, intervention/placebo | Liver effects (transaminases) |
|---|---|---|---|---|---|
| Pezeshki et al. (2016) | 157 | 12 weeks | SID 30 min after lunch | 35/36 fatty liver disease (NAFLD) | GTE: reduced ALT, AST and ALP; Contr: reduced ALT and ALP |
| Fukuzawa et al. (2014) | 316 | 6 months | TID after meal | 26 treated/12 placebo | ALT/AST remained at baseline; Increase of AST, ALT and GGT in the placebo group |
| Sakata et al. (2013) | Catechins: 200 or 1,080 | 12 weeks | 700 mL with food (so BID or TID) | 5 low dose; 7 high dose/5 | Serum ALT decreased 42% in high dose |
SID: once per day (singular in die); NAFLD: non‐alcoholic fatty liver disease; GTE: green tea extract; ALT: alanine aminotransferase; AST: aspartate aminotransferase; ALP: alkaline phosphatase; GGT: gamma‐glutamyl transferase; TID: three times per day (tris in die).
Of the 38 studies, 26 reported that there were no effects on liver parameters, of which 22 were studies with green tea extracts (Table 10) and 4 with traditional green tea infusion (Table 11). One study (Basu et al., 2010, 2011) used both green tea infusion and green tea extract. The doses of EGCG varied from 100 to 857 mg/day, and the duration of studies were from 10 days to 12 months. In the studies with green tea extracts, the dose was at or below 316 mg EGCG/day in 14 of the studies (756 treated subjects) and between 377 and 800 mg EGCG in four of the studies (124 subjects). Of the 26 studies, the green tea extracts were administered as beverages in 15 studies (including the 4 studies with green tea infusion), as Polyphenon E in 2 studies, as Teavigo in one study and as other green tea extracts in capsules in 6 studies. There were 5 studies with green tea extracts at doses at or above 800 mg EGCG/day, lasting from 6 weeks to 12 months and with 26–43 treated participants per study, without any effects on serum transaminases.
Table 10.
Intervention studies with green tea preparations (extracts and beverages other than green tea infusions), not demonstrating effects on liver parameters
| Author, year | Dose EGCG (mg/day) | Duration | Treatment | Subjects treated/placebo | Liver parameters studied | Liver effects |
|---|---|---|---|---|---|---|
| Nagao et al. (2007) | 100 | 12 weeks | SID, 340 mL with food | 123/117 | ALT, AST, GGT, LDH, ALP | No effects |
| Matsuyama et al. (2008) | 102 | 24 weeks | SID 340 mL | 20/19 controls | ALP, LDH, gamma GTP, AST, ALT, total protein, albumin | No effects |
| Otsuka et al. (2002) | 106 | 8 weeks | 340 mL beverage | 19/21 | AST, ALT, ALP, total protein, albumin, GTP, LDH | No abnormalities |
| Tsuchida and Itakura (2002) | 115 | 12 weeks | 340 mL | 39/41 | AST, ALT, ALP, GGT | No differences between the groups |
| Yoneda et al. (2009) | 126 | Average 1 year (11–17 months) | SID 340 mL | 77/57 | AST, ALT, GGT, ALP | No effects |
| Takeshita et al. (2008) | 133 | 12 weeks | 500 mL | 40/41 | AST, ALT, GTP, ALP, LDH, total protein, albumin | No differences |
| Nagao et al. (2005) | 136 | 12 weeks | SID, GT beverage, with food | 19/18 | AST, ALT | No effects |
| Frank et al. (2008) | 150 | 3 weeks | TID, capsules with water before meal | 17/16 | Total bilirubin, AST, ALT, GGT, albumin | No effects |
| Matsui et al. (2016) | 186 | 12 weeks | BID beverage | 67/69 | Total protein, albumin, total bilirubin, AST, ALT, LDH, ALP, GGT | Small, but stat sign changes. All values normal |
| Ukawa et al. (2013) | 200 | 10 days | TID, 340 mL × 3 | 15 cross‐over | Total protein, albumin, total bilirubin, AST, ALT, ALP, LDH, GGT | All values within reference range |
| Kozuma et al. (2005) | 201 | 12 weeks | SID, 500 mL | 113/113 | AST, ALT, GGTP, ALP, LDH, total protein, albumin | No effects |
| Shen et al. (2010, 2012) | 233 | 24 weeks | Capsules | 47/44 | AST, ALT, ALP, bilirubin | No effects. One treated had elevated ALT and AST, probably due to other medications. Normal after discont |
| Mielgo‐Ayuso et al. (2014) | 300 | 12 weeks | Teavigo, > 97% EGCG, TID with food | 39/39 | AST, ALT, ALP, GGT, bilirubin | Small, but stat sign decrease in AST and GGT in both groups |
| Kataoka et al. (2004) | Low 106; medium 218; high 316 | 12 weeks | 500 mL beverage | 25 low, 71 medium, 25 high/71 placebo | ALT, ALP, GGT, total protein | No treatment related effects |
| Hsu et al. (2008) | 377 | 12 weeks | TID capsules 30 min after meal | 41/37 | ALT, AST | No effects |
| Basu et al. (2011) | 440 (green tea bags)–460 (green tea extract) | 8 weeks | BID, 2 × 2 cups or 1 capsule | 13 tea, 10 GTE/12 | AST, ALT, BUN, albumin | No effects |
| Suzuki et al. (2005) | 499 | 4 weeks | TID, 6 × 250 mL/day, with food | 23/22 | AST, ALT, ALP, GGT bilirubin | ‘No significant differences’ |
| De la Torre et al. (2014) | 600 or 800 depending on bw | 12 months | PolyE, 3 or 4 capsules per day | 43/41 | AST, ALT | No stat sign differences |
| Wu et al. (2012) | 400 and 800 | 2 months | BID with food | 37 low dose, 34 high dose/32 | ALT, AST, ALP | ALT stat sign elevated in high dose, but within reference range |
| McLarty et al. (2009) | 800 | Average 6 weeks the interval between prostate biopsy and radical prostatectomy | PolyE, SID with a meal | 26 (before and after) | ALT, AST, ALP, bilirubin, GGT, total protein, albumin | Total protein and albumin decreased significantly. All values within normal limits |
| Liu et al. (2014) | 857 | 16 weeks | TID, capsules, 30 min after meals | 39/38 | ALT | No effects |
| Hsu et al. (2011) | 857 | 16 weeks | TID 30 min after meal | 35/33 | ALT | No effect |
SID: once per day (singular in die); BID: twice per day (bis in die); ALT: alanine aminotransferase; AST: aspartate aminotransferase; GGT: gamma‐glutamyl transferase; LDH: lactate dehydrogenase; ALP: alkaline phosphatase; GTP: glutamyl transpeptidase.
Traditional green tea infusion was only used in four studies (Table 11). In the study by Basu et al. (2010, 2011), the participants, 10–13/group, were either administered placebo, 440 mg EGCG as green tea infusion or 460 mg EGCG as green tea extracts in capsules for 8 weeks. There were no effects on serum transaminases. There was a slightly higher plasma level of EGCG in the group administered green tea infusion. In the study by Wang et al. (2010), one group of 49 moderately overweight persons were given green tea infusion with 468 mg total catechins (EGCG content not specified) daily, divided into two doses per day with meals for 3 months. There were no treatment related effects on serum transaminases. In the study by Toolsee et al. (2013), individuals at risk of diabetes consumed 3 cups of green tea infusion per day (total daily dose of 704 mg EGCG, plus 615 mg EGC, 85 mg ECG and 73 mg EC) before meals for 14 weeks. The controls consumed an equal amount of hot water. No elevation of serum transaminases was observed.
Of the 49 studies, 11 studies did not present data on liver parameters (Table 12). Most of the studies mentioned which tests had been used and reported the results as ‘no effects’ or ‘no significant differences between groups’. These studies were not further considered in the evaluation. One of the studies reported two cases with abnormal liver parameters, one in the placebo and one in the treated groups (Maki et al., 2008). Doses at or above 800 mg EGCG/day were reported in 4 of the studies, lasting from 1 to 4 weeks.
Table 12.
Intervention studies with green tea preparations, reported as having performed, but not presenting numerical data on liver parameters
| Author, year | Dose EGCG (mg/day) | Duration | Treatment | Subjects treated/placebo | Liver parameters tested | Liver effects |
|---|---|---|---|---|---|---|
| Maki et al. (2008) | 214 | 12 weeks | 500 mL consumed within 30 min, with or without food | 56/51 | Not specified | 1 case of elevated liver enzymes in each of the groups ‘no evidence of liver toxicity’ |
| Hill et al. (2007) | 300 | 12 weeks | Teavigo, SID | 19/19 | ‘Liver function’ | No effects |
| Widlansky et al. (2007) | 300 | 5 weeks | Teavigo, BID | 42 crossover | AST, ALT, GGT, ALP, total bilirubin | No effect on liver function |
| Roshdy et al. (2013) | 360 | 4 months | After meals | 22 treated/11 placebo | Not specified | No abnormalities |
| Jatuworapruk et al. (2014) | 125, 250, 375 | 2 weeks | BID | 11, 11, 8, no controls | AST, ALT | ‘No significant changes’ |
| Kumar et al. (2015) | 400 | 12 months | BID with food | 49/48 | CTCEA v4.0 parameters not specified | Gr 1–2 liver toxicity was not different between the groups |
| Wang et al. (2008) | 252 or 504 | 3 months | BID with food | 42 low dose, 41 high dose/41 | ALT, AST | ‘Indicated no severe adverse effects’ |
| Nagao et al. (2009) | 583 total catechins | 12 weeks | Not reported | 23/20 | ALP, LDH, AST, ALT, γ‐GTP, total protein, albumin, urea nitrogen (UN) | Stat sign elevated lactate dehydrogenase total protein, and albumin in treated persons. Other parameter no effects |
| Chow et al. (2003) | 800, as SID or BID and as EGCG or PolyE | 4 weeks | SID or BID | 8 per group | ‘A panel of blood chemistry’ | No effects |
| Nguyen et al. (2012) | 800 | 3–6 weeks | SID | 24/24 | ‘Serum biomarkers’ | 1 treated had mild ALT elevation |
| Yoshikawa et al. (2012) | 810 | 1 week | TID not with food | 20/20 | AST, ALT, GGT, LDH, total bilirubin | ‘No significant differences’ |
SID: once per day (singular in die); BID: twice per day (bis in die); ALT: alanine aminotransferase; AST: aspartate aminotransferase; GGT: gamma‐glutamyl transferase; LDH: lactate dehydrogenase; ALP: alkaline phosphatase; γ‐GTP: γ‐glutamyl transpeptidase.
A further evaluation was performed in the studies where the participants were exposed to EGCG at or above 800 mg/day (Tables 8 and 10). In the eight studies with abnormal liver effects in treated participants, a total number of 724 persons was exposed at or above 800 mg EGCG/day and 84 treated subjects were reported with elevated serum levels of transaminases (compared to 11 in the control/placebo groups), while in the five studies with no liver effects the number of persons exposed to doses at or above 800 mg EGCG/day were 156. Among the studies reporting abnormal liver effects is the study by Dostal et al. (2015; Yu et al., 2017) with 513 treated participants. The studies with abnormal liver effects lasted for 6 months or longer except one study of 4 months and one of 10 days in fasted subjects, while the studies with no effects on liver were shorter (1.5, 2, 4, 4 and 12 months). In most studies with elevated serum transaminases, green tea extracts were administered two times per day with food while the three studies with administration three times per day did not report liver effects. The studies with abnormal liver effects in treated participants were performed in females with HPV infection and low‐grade cervical neoplasia (Garcia et al., 2014), MS patients of both gender (Lovera et al., 2015), post‐menopausal women at risk of breast cancer (Dostal et al., 2015; Yu et al., 2017), women with hormone receptor negative breast cancer (Crew et al., 2012) and patients with chronic lymphocytic leukaemia, 70% males (Shanafelt et al., 2009, 2013). The negative studies were performed in persons with Down's syndrome, 56% males (De la Torre et al., 2014), healthy post‐menopausal women (Wu et al., 2012), patients with prostate cancer (McLarty et al., 2009) and in patients with type 2 diabetes, 60% and 34% males, respectively (Hsu et al., 2011; Liu et al., 2014).
In summary, 38 intervention studies of green tea extracts presenting results on liver parameters were found in the literature and evaluated. However most intervention trials were underpowered to detect differences in the percentage range and may lead to false negative results. Abnormal liver effects were only observed at doses at or above 800 mg EGCG/day. No cases with abnormal liver function were reported after doses below 800 mg EGCG/day. A total number of 880 subjects were treated with green tea extracts at or above 800 mg EGCG/day and 84 cases elevated serum transaminases were reported in the treated subjects. A total number of 756 subjects were treated with green tea extracts at or below 316 mg EGCG/day and no cases were reported. Fewer subjects were treated in the range 377–800 mg EGCG/day, 159 persons. Only 4 studies were available using traditional green tea infusion. The doses were in the range 256–704 mg EGCG/day, a total of 237 subjects were exposed, and no effects on serum transaminases were reported. The study by Dostal et al. (2015), Yu et al. (2017) with more than 500 persons in each group and exposure to 843 mg EGCG as a green tea extract for 1 year is the only one reporting a statistical significant different in the occurrence of adverse hepatic events in treated subjects compared to placebo. Dostal et al. (2015) conducted a randomised double‐blind, placebo‐controlled trial (Minnesota Green Tea Trial) on the safety of green tea extract supplementation in post‐menopausal women aged 50–70 years at increased risk of breast cancer (> 50% fibroglandular tissue), recruited on the basis of their annual screening mammogram from 2009 to 2013 at eight clinical centres in the Minneapolis‐St. Paul metropolitan area. Among the exclusion criteria for participation in the study were: tested positive for hepatitis B surface antigen or antibodies to hepatitis C virus; ALT higher than 1.5 times upper limits of normal (ULN) (defined in this study as 60 U/L); regular consumption of 7 or more alcoholic beverages per week; regular consumption of 1 or more cups of green tea per week. The green tea extract (GTE) was prepared from dried green tea leaves by extraction with water and ethyl acetate, was decaffeinated and then spray‐dried and encapsulated. Each GTE capsule contained 328.8 ± 28.9 mg total catechin, including 210.7 ± 11.0 mg EGCG (64% of total catechins), 26.7 ± 29.7 mg EGC, 50.6 ± 18.5 mg ECG and 26.8 ± 5.9 mg EC. Of 1,075 randomised women, 538 were assigned to receive four oral GTE capsules containing 1,315 mg ± 116 mg total catechins per day, corresponding to 843 ± 44 mg EGCG/day and 537 were randomised to receive placebo for 12 months. Each capsule contained less than 4% caffeine. Placebo capsules were identical in appearance to GTE and contained 50% (816 mg) maltodextrin, 49.5% (808 mg) cellulose, and 0.5% (8 mg). The participants were instructed to take two capsules, twice daily with morning and evening meals. Plasma ALT concentration was measured monthly during the first 6 months and at 9 and 12 months. Catechol‐O‐methyltransferase (COMT) genotyping was performed and the participants with high, low and intermediate enzyme activities were equally distributed within the groups. Nine hundred thirty and seven women (87.2%) completed the study. A total of 72 subjects withdrew from trial because of adverse events. There was no significant difference in the percentage of women with adverse events between the GTE and placebo group. The adverse events regarding serum transaminases are reported below.
All together 40 participants experienced a total of 57 serum ALT elevation events, classified using NCI CTCAE as liver effects. Out of the 40 participants, 36 were in the GTE group and 4 in the placebo group. A statistically significant difference in the number of events of ALT elevation was found between the GTE group and the placebo group.
Of the 57 ALT elevation events, 53 (6.7%) were recorded in the GTE group and 4 (0.7) in the placebo group. All elevations in the placebo group and 39 of the events in the GTE group were classified as grade 1. Of the rest, 7 ALT elevation events were classified as grade 2, 6 as grade 3 and 1 as grade 4. The case with grade 4 elevation (highest ALT 2055 U/L) occurred after 7 months of treatment, before which the ALT levels were normal. The person reported increased alcohol consumption (amount undetermined) 1 day before blood was taken for the 7 month test. All seven cases with grade 3 ALT elevations had specific additional factors, which may have contributed to the elevation: history of liver abnormalities, simultaneous infection and use of paracetamol, new use of statin or other medication. In the events of grade 3 or 4, the participants were permanently taken off the treatment but asked to continue in the study. Of the 36 participants in the GTE group experiencing ALT elevations, 26 had been taking GTE for 4 months or less. In all except one case, the elevation disappeared when GTE consumption was discontinued. Average length to resolution for all ALT elevations was 30.2 days. A positive rechallenge occurred in 12 cases. Three of the GTE participants had 3 or more ALT elevations, while all elevations in the placebo group were single events. COMT genotype did not influence the incidence of ALT elevation. Of the 36 participants in the GTE group, who experienced ALT elevation, 10, 15 and 11 were categorised as low, intermediate and high activity COMT genotypes, respectively. The authors concluded ‘that daily consumption of GTE containing 843 mg EGCG is generally well tolerated by a group of predominantly Caucasian post‐menopausal women. However, 6.7% of GTE consumers experienced ALT elevations, with 1.3% experiencing ALT‐related serious adverse effects’. The author also stated that GTE could not be determined as the single cause, as there were other possible contributing factors reported in the cases with ALT elevation of grade 3 and 4. The Panel agreed with the authors’ conclusion, but also considered the rise‐fall pattern following challenge–rechallenge and the significantly lower incidence of abnormal liver tests in the controls – expected to have been exposed to the contributing factors to a similar extent as the treated subjects – as evidence that GTE was at least in part the cause of the increase in incidence of ALT elevations in the participants treated with GTE.
The effects on serum liver enzyme elevation, including effects on serum levels of AST, alkaline phosphatase (ALP), albumin, total proteins, albumin/globulin ratio, and direct and total bilirubin, was further analysed by Yu et al. (2017) in subjects from this study. They used the liver injury grading system developed by the Acquired Immune Deficiency Syndrome Clinical Trials Group, which differed somewhat from the NCI CTCAE v4.0. Grade 0 or no abnormal liver function was defined as ALT, AST and ALP < 1.25 × ULN and total bilirubin ≤ 1 × ULN, grade 1 abnormal liver function if any liver enzyme was 1.25–2.5 × ULN or total bilirubin > 1–1.5 × ULN, grade 2 (mild) abnormal liver function if any liver enzyme was > 2.5–5.0 × ULN or total bilirubin > 1.5–2.5 × ULN, grade 3 (moderate) abnormal liver function if any liver enzyme was > 5–10 × ULN or total bilirubin > 2.5–5 × ULN or grade 4 (severe) abnormal liver function if any liver enzyme was > 10 × ULN or total bilirubin > 5 × ULN. ALT and AST increased significantly in the treated group compared to controls, p < 0.001. In GTE exposed women ALT increased by 5.4 U/L (from 17.6 U/L) (95% CI = 3.6–7.1) and AST increased by 3.8 U/L (from 20.0 U/L) (95% CI = 2.5–5.1). In the GTE group 26 (5.1%) women developed moderate or more severe abnormalities in any liver parameter, resulting in an odds ratio of 7 (95% CI = 2.4–20.3) for developing liver abnormalities compared with controls. The number of individuals with grade 2 or above in GTE and placebo groups were, for ALT 17 and 0, for AST 26 and 1, for ALP 0 and 0 and for total bilirubin 1 and 3. ALT increased above 90 U/L for 36 women in the GTE group and in 4 women in the placebo group, which was the level requiring change of treatment. The median time interval for onset of elevated ALT (≥ 90 U/L) was 106 days (range 56–365). ALT returned to normal after dechallenge and increased again after one or more rechallenges with GTE. The ALT returned to normal after a mean of 32 days (13–92). The effect of GTE on ALT and AST was more pronounced in obese women (BMI ≥ 30 kg/m2) but less in weekly (less than 7 drinks per week) alcohol drinkers than in individuals reporting no alcohol consumption. Women consuming 7 or more drinks of alcoholic beverages per week were excluded and the BMI range was limited to 19–40 kg/m2 in the study to avoid potential adverse effect of obesity and alcohol intake on liver enzyme. The ALT increase was less in current users of non‐aspirin non‐steroidal anti‐inflammatory drugs (NSAIDs) than in non‐users. Use of aspirin, paracetamol and statins did not influence changes in ALT or AST and serum concentrations of triglycerides or cholesterol did not affect the changes in ALT or AST.
Overall, the Panel considered that the intervention studies varied widely in dose, composition of the administered green tea catechins, duration of treatment, number and health status of treated subjects as well as in the outcome on liver parameters. These limitations combined give an uncertainty in the identification of a maximum dose of EGCG that will not cause an increase of serum liver enzyme level or a minimum dose causing a significant (biological) effect. However, after reviewing the evidence from the 38 intervention studies, which included data on effects on liver parameters of green tea extracts and infusions, the Panel considered that exposure to green tea extracts at doses at or above 800 mg EGCG/day for 4 months or longer are associated with elevations of ALT and AST in a small percentage (usually less than 10%) of the population. A large number of subjects were treated with green tea extracts at or below 316 mg EGCG/day and did not show elevated serum levels of transaminases. Statistically significant odds ratios were reported in one of the studies (Yu et al., 2017), based on elevation in any liver parameter at or above Grade 2, with OR = 7.0 (95% CI = 2.4–20.3; p = 0.0002). The Panel also noted that during the intervention studies liver parameters were continuously monitored, and cases with serious effects were excluded from further treatment, thus preventing liver injuries. Furthermore, elevated transaminases returned to normal after dechallenge and increased again after one or more rechallenges, which strongly suggests a causality between exposure to green tea extracts and liver effects. The Panel considered the sparse data on green tea exposure from traditional green tea infusions and noted that there was no evidence of elevated ALT levels at a consumption of green tea infusion of ≥ 5 cups per day or containing 700 mg EGCG/day. Furthermore, the Panel noted that in patients with elevated serum levels of ALT and AST due to non‐alcoholic fatty liver disease, treatment with EGCG resulted in a decrease in the enzyme levels.
None of the intervention studies addressed pregnant, breast‐fed infants or children.
Cohort studies and meta‐analysis
Inoue et al. (2009) reported serum ALT levels in 18,815 subjects in relation to green tea infusion consumption in a study on the risk of liver cancer from consumption of coffee and green tea. The study is described in Section Liver cancer. The green tea consumption was < 3 cups per day in 37.7% of the subjects, 3–4 cups per day in 32.6%, and ≥ 5 cups per day in 29.7% of the subjects. There was a statistically significantly decreasing trend in ALT levels with increasing consumption of green tea (ptrend < 0.001) among all the subjects, but the differences were minor: mean levels of 20.8, 19.7 and 19.5 IU/L in the group consuming < 3, 3–4 and ≥ 5 cups per day. ALT levels in relation to green tea consumption was also evaluated in the specific population groups with hepatitis B or C infection (1,499 subjects). Mean ALT levels were higher in these groups compared to the total subjects. Among the subjects with hepatitis C, mean ALT levels decreased with increasing consumption of green tea, although ptrend was not statistically significant (35.8, 31.7 and 30.6 IU/L, in subjects consuming < 3, 3–4 and ≥ 5 cups per day). The Panel noted that only mean ALT levels were reported and whether there was an increase in ALT levels in a small subgroup of the population that was not analyzed.
Alferink et al. (2017) evaluated whether coffee and tea consumption are associated with liver stiffness, as a proxy for liver fibrosis, in a population of 2,424 individuals. The investigation was a part of the Rotterdam Study, a prospective population‐based cohort study. Measurements of steatosis and serum ALT were also included in the study. Cases with Hepatitis B and C were excluded. Green tea infusion was consumed over the last month by 26.1% of the participants. The incidence of clinically relevant liver fibrosis, defined as liver stiffness measurement (LSM) ≥ 8 kPa, was 5.2% and the incidence of clinically relevant cirrhosis, defined as LSM ≥ 13 kPa was 0.5%. There was no association between green tea consumption and liver stiffness or steatosis. In contrast, frequent coffee and herbal tea consumption were inversely related to liver stiffness but not steatosis. ALT levels were not reported, but abnormal ALT levels were excluded in the analysis of results to ‘ensure results are generalizable for the general population without known liver disease’.
Isomura et al. (2016) conducted a systematic review (covering studies until December 2013) to examine the safety of green tea, using data on liver‐related adverse effects reported in 34 intervention trials. Out of the 34 intervention trials, 28 were designed with focus on efficacy (treatment assessment trials) and six were designed with focus on safety (safety treatment assessment trials). The study populations included in the intervention trials were as follows: healthy subjects (10 trials), obese subjects (7 trials), cancer patients (5 trials) and other (12 trials). The trials durations ranged from 3 days to 2 years at the longest (excluding one trial with one single‐administration). According to the authors, only four out of the 34 trials, reported liver‐related adverse events (Ullmann et al., 2004; Shen et al., 2010, 2012; Crew et al., 2012; Nguyen et al., 2012) and were included to estimate a summary risk. The four studies covered exposure durations of 10 days, 24 weeks, 6 months and 6 weeks, respectively and total daily doses up of 800 mg EGCG, 500 mg green tea polyphenol, 800–1,600 mg EGCG and 800 mg EGCG, respectively. Elevated ALT or AST levels were found in seven subjects of the totally treated 129 subjects in the four studies and in one control, of totally 88 control subjects. The results of a meta‐analysis suggested an increased risk of abnormal liver parameters for subjects using green tea extracts in comparison with subjects taking a placebo (OR: 2.1; 95% CI, 0.5–9.8). The results of the meta‐analysis was limited by the low number of studies included, small sample size of trials, short duration of exposure and the use of heterogeneous study populations (healthy males; males with prostate cancer; post‐menopausal women; women with a history of breast cancer). The Panel noted, that some of the studies evaluated in this opinion and published after December 2013, were not considered in the review (Garcia et al., 2014; Dostal et al., 2015; Lovera et al., 2015).
Case reports
Green tea has been implicated as the main single herbal product involved in hepatotoxicity in prospective Registries. Herbal and dietary supplements (excluding anabolic steroids) induced liver injury accounted for 10% (85 cases) of the 839 drug‐induced liver injury (DILI) cases in the United States according to the DILIN. The major implicated agents were green tea extract, and multi‐ingredient nutritional supplements. The majority of agents implicated were complex mixtures sold under commercial names. In 24 instances, including 15 attributed to a multi‐ingredient nutritional supplements, green tea was listed as a component and was believed to be the causative agent (Navarro et al., 2014).
Herbal and dietary supplement products were responsible for 4% (32 cases) of the 856 DILI cases in the Spanish DILI Registry. Twelve (37%) of the cases were induced by single ingredient products and 20 (63%) by multi‐ingredient products. The single most common herbal products causing liver injury was C. sinensis (tea and pills) in eight cases (Medina‐Caliz et al., 2018).
The food administrations in Norway, Sweden and Denmark have over the past years received 12 case reports of liver toxicity after consumption of food supplements containing green tea extracts and 2 cases associated with consumption of green tea infusion. In 2014 alone, the Regional Medicines Information and Pharmacovigilance Center in Norway (RELIS) received four case reports linking the consumption of food supplements containing green tea extracts to hepatitis (‘Documentation provided to EFSA’ n.1 and 2). The 14 cases from the Nordic countries, of which 13 are unpublished, are described in Appendix J.
Several case reports and reviews on case reports of hepatotoxicity attributed to be induced by green tea are available in the literature. The 21 cases, where green tea was claimed by the authors to be the exclusive causative agent, are summarised in Appendix B. Appendix C lists 35 cases with hepatotoxicity associated with the use of green tea products combined with other ingredients.
The cases with green tea preparations claimed to be the exclusive causative agent were mostly female (20/21) with a median age of 42.5 years (range: 16–81). In seven of the cases, exposure was from green tea infusion and in the rest of the cases exposure was from capsules or tablets with green tea extract. Only one case was asymptomatic with hepatotoxicity being discovered via routine clinical chemistry analysis (Federico et al., 2007). The symptoms varied and included jaundice, pruritus, abdominal pain, dark urine and discolouration of faeces, arthralgia, fever, nausea and vomiting. The daily intake of green tea preparations, varied between 725 and 1,800 mg, mainly consisting of EGCG; nevertheless, the exact dose was not provided in several studies (Javaid and Bonkovsky, 2006; Jimenez‐Saenz and del Carmen Martinez‐Sanchez, 2006; Federico et al., 2007; García‐Cortés et al., 2008; Amariles et al., 2009; Arzenton et al., 2012; Almorós et al., 2015; Lugg et al., 2015).
Duration of exposure to green tea preparations ranged between 10 days and 5 years. In the latter case, the authors claimed that throughout those 5 years of exposure to green tea, the patient had a persistent elevation of liver parameters (Federico et al., 2007). Duration of therapy was unknown in four cases (Pedrós et al., 2003). Time to onset ranged between 10 and 240 days after initiation of green tea intake. Eight cases did not receive any concomitant therapy (Pedrós et al., 2003; Abu el Wafa et al., 2005; Jimenez‐Saenz and del Carmen Martinez‐Sanchez, 2006; Amariles et al., 2009; Almorós et al., 2015; Arzenton et al., 2012), whereas no details were provided on concomitant medications in four of the cases (Javaid and Bonkovsky, 2006; García‐Cortés et al., 2008). In two cases, patients received antibiotic therapy before the onset of hepatotoxicity; in the first case, the patient received moxifloxacin 400 mg/day 15 days before the onset of the episode (Pedrós et al., 2003) and in the second case the patient received two doses of amoxicillin for suspected urinary tract infection (Lugg et al., 2015). Alcoholism was not assessed in 12 cases (Seddik et al., 2001; Pedrós et al., 2003; Javaid and Bonkovsky, 2006; Jimenez‐Saenz and del Carmen Martinez‐Sanchez, 2006; Amariles et al., 2009; Mazzanti et al., 2009; Gallo et al., 2013); whereas in the remaining nine cases patients denied alcohol intake.
All of the cases satisfied criteria for DILI diagnosis (Aithal et al., 2011) except one of the cases in the case‐series presented by Pedrós et al. (2003) in which no data were reported concerning liver parameters. Cholestatic and mixed pattern of liver injury were identified in two cases (De Paula et al., 2008; Almorós et al., 2015), whereas the rest were of hepatocellular pattern.
Serological testing excluded hepatitis A, B, C, cytomegalous and Epstein‐Barr viruses in three cases (Vial et al., 2003; Pillukat et al., 2014; Almorós et al., 2015). Herpes simplex virus in addition to the afore mentioned viruses were excluded in four cases (Seddik et al., 2001; Abu El Wafa et al., 2005; De Paula et al., 2008; Gallo et al., 2013). Lugg et al. (2015) excluded hepatitis A, B, C, cytomegalous and parvovirus B19. In the case‐series of García‐Cortés et al. (2008) and the case report of Jimenez‐Saenz and del Carmen Martinez‐Sanchez (2006), only hepatitis A, B, C viruses were excluded, whereas Amariles et al. (2009) and Arzenton et al. (2012) only excluded hepatitis B and C viruses. The remaining cases have either reported negative findings without providing details on which viruses were tested (Pedrós et al., 2003) or failed to exclude viral hepatitis (Pedrós et al., 2003; Federico et al., 2007; Mazzanti et al., 2009).
Autoantibodies (antismooth muscle antibodies (ASMA) and antinuclear antibodies (ANA)) were excluded in nine cases (Abu El Wafa et al., 2005; Jimenez‐Saenz and del Carmen Martinez‐Sanchez, 2006; De Paula et al., 2008; García‐Cortés et al., 2008; Amariles et al., 2009; Arzenton et al., 2012; Gallo et al., 2013; Pillukat et al., 2014; Almorós et al., 2015). Positive findings for at least one autoantibody were reported in five cases (Seddik et al., 2001; Vial et al., 2003; García‐Cortés et al., 2008; Gallo et al., 2013; Lugg et al., 2015). In the case‐series of Javaid and Bonkovsky (2006), autoimmune hepatitis was excluded in only one of the four cases without providing details on which autoantibodies were excluded. Three additional case reports failed to exclude autoimmune hepatitis (Javaid and Bonkovsky, 2006; Federico et al., 2007; Mazzanti et al., 2009). Imaging tests were conducted in 14 out of the 21 cases. Except for one case of cholelithiasis (Vial et al., 2003) and another one of mild hepatic steatosis (Almorós et al., 2015), normal findings were observed on abdominal ultrasound.
Causality assessment evaluation using the Council for International Organizations of Medical Sciences (CIOMS/RUCAM) was performed in nine of the cases listed in Appendix B; three cases were defined as highly probable (Jimenez‐Saenz and del Carmen Martinez‐Sanchez, 2006; García‐Cortés et al., 2008), five cases were defined as probable (De Paula et al., 2008; García‐Cortés et al., 2008; Pillukat et al., 2014; Almorós et al., 2015; Lugg et al., 2015), and one case was defined as possible (Mazzanti et al., 2009). In the remaining cases, no causality assessment using a clinical scale was performed. Resolution was achieved in all the 22 cases except for one of the cases reported by García‐Cortés et al. (2008) where chronic liver injury was documented. Time to resolution ranged from 16 to 120 days (with the majority of the cases resolving within 2 months period). Positive rechallenge to green tea was documented in seven cases (Vial et al., 2003; Federico et al., 2007; García‐Cortés et al., 2008).
Other data and reviews on cases with hepatotoxicity associated with green tea
Navarro et al. (2013) analysed the content of catechins in 97 herbal dietary supplements (see Section 3.1.2.3), which had been consumed by 47 patients with hepatotoxicity, registered within the US DILIN. Analysis of associations between catechin consumption and hepatotoxicity was performed in 19 patients, who had confirmed herbal‐induced liver injury and sufficient information to quantify the daily dose of catechins. No correlation was found between daily or total dose of catechin and causality score, peak liver enzyme values or disease severity. However, the daily doses of catechin were low: apart from one case with an estimated daily catechin consumption of with 2,900 mg, and two cases with 200 and 420 mg/day, the remaining cases had an estimated intake below 28 mg catechin/day.
Based on candidate susceptibility genes identified in an outbred mouse strain with high variation in sensitivity to hepatotoxicity induced by EGCG, Church et al. (2015) performed genotyping of 15 human cases registered in the DILIN with liver injury suspected to be due to green tea exposure (see Section Acute toxicity, oral and parental administration). A total of 428 single nucleotide polymorphisms (SNPs) located within 46 candidate genes were analysed in the 15 human subjects and compared to gene frequencies in 4,432 control individuals. Associations were observed between genotype and EGCG hepatotoxicity within three SNPs, representing the genes: mitofusin 2, period circadian clock 3 and vacuolar protein sorting 13 days. Mitofusin 2 is a mitochondrial membrane protein, participating in regulation and maintenance of the mitochondrial network and shown to promote apoptosis by activating the intrinsic mitochondrial pathway.
There are several reviews on case reports on hepatotoxicity in association with consumption of green tea preparations. The same cases are included in many of the reviews as well as in the section ‘Case reports retrieved from the literature’ above.
The safety of green tea extracts was evaluated by Sarma et al. (2008), who reviewed clinical case reports from the period January 1966 to June 2007. They identified 34 reports on hepatotoxicity associated with green tea products. Of the cases, 7 (20%) were categorised as probable and 27 (79%) as possible causality cases by the Naranjo causality algorithm scale. The 34 cases included 13 cases of liver hepatotoxicity associated with the use of Exolise® (see Section Background). In 12 of these cases, indicators of hepatotoxicity (mostly mixed cytolytic and cholestatic) resolved after discontinuation of treatment while in the remaining patient, who had co‐administration of other drugs and regular alcohol intake, liver failure led to transplantation (Gloro et al., 2005). The recommended daily dose corresponded to 375 mg EGCG and the time required for onset of hepatotoxicity ranged from 9 days to 5 months after starting treatment with Exolise®. Two of the Exolise cases were scored with probable causality by the Navarro algorithm. Sarma et al. (2008) also reviewed four cases that involved Tealine®, which contains an aqueous extract of green tea, white tea and red tea (Aspalathus linearis) with 40–50% catechins. One case was scored with possible causality and three cases with probable causality.
Mazzanti et al. (2009) reviewed the literature between 1999 and October 2008 on case reports on hepatotoxicity associated with consumption of green tea preparations and retrieved 34 cases from the literature. In addition, they reported two new cases. In 17 of the 36 cases, exposure were from herbal preparations containing only green tea (9 of the persons took Exolise®). All the supplements were used as weight loss products. The liver injury was classified as hepatocellular (62%), cholestatic (19%) or mixed (19%). A positive rechallenge was reported in 31 cases.
The literature review was followed‐up to cover case reports during the period November 2008 to March 2015 (Mazzanti et al., 2015). They identified 19 cases of hepatotoxicity related to the consumption of herbal products containing green tea. Of the 19 cases, 15 reported to use the green tea product for weight loss purposes. Cases on Hydroxycut®, published during this period, were not included, due to the withdrawal of the product from the market in July 2009 (Fong et al., 2010). In 7 of the cases, the subjects were exposed to green tea alone (4 as infusion or dried leaves and 3 as powder of water extract). In 12 cases, exposure was from green tea extracts mixed with other components. ALT levels were from 3.6 to 96 times ULN, AST from 4.9 to 99 times ULN and ALP from normal to 5.5 times ULN. The latency time for induction of liver injury (mean ± SE) was generally longer in subjects taking preparations containing only green tea (179 ± 59 days) and the resolution time shorter (65 ± 18 days), than in subjects taking multicomponent preparations (45 ± 14 and 119 ± 39, respectively). Four of the cases involved liver transplantation. The causality assessment between consumption of herbal preparation and hepatotoxicity (CIOMS/RUCAM) resulted in 8 cases as probable (42%) and 11 cases as possible (58%).
Navarro et al. (2017) summarised a research symposium on Liver Injury from Herbal and Dietary Supplements (HDS) supported by the NIH. The main conclusion of this workshop was that 20% of cases of hepatotoxicity in USA are currently induced by HDS and that green tea extracts ranked 2nd in the list of HDS responsible for liver injury. HDS are often consumed as multi‐ingredient supplements, precluding an unambiguous identification of the component(s) responsible for the liver injury. The authors concluded that the mechanism of the liver injury due to green tea extracts is not known. Further, they noted that ‘In most reports of GTE hepatotoxicity, the human dose of EGCG (generally < 12 mg/kg daily) did not appear to be excessive or in the range that might have direct toxicity (estimated for humans to be 30–90 mg/kg). These findings suggest that the liver injury from GTE is an idiosyncratic reaction, typical of conventional DILI’.
Overall, the Panel considered all the case reports described above and noted that reports of hepatotoxicity induced by the exclusive use of green tea products are well documented in the literature. Few cases have been reported after consumption of green tea infusion whereas most cases are associated with green tea supplements. Most cases are reported in middle‐aged females, which could be associated with this subpopulation's use of green tea extracts for body weight control and it mainly leads to a hepatocellular pattern of liver injury. In most of the cases, hepatotoxicity is induced after the ingestion of green tea extracts for a period of at least several weeks up to 8 months although some cases were reported after a shorter period of regular intake (5 days). No fatal cases were associated solely with the use of green tea products and the majority of cases resolved following green tea preparation discontinuation. Although the quality and precision of causality assessment procedures vary from one case to another, temporal relationship and the exclusion of other potential causes of liver injury were appropriately satisfied in the majority of the cases. In addition, positive rechallenge in many cases further supports the role of green tea preparations in liver injury. Based on the current literature review on case reports, it is difficult to draw conclusions concerning the minimal dose of EGCG present in green tea products capable of inducing liver injury. There was a great variability in the ingested daily dose of green tea products with cases of hepatotoxicity being induced at doses exceeding three cups of green tea infusion (Lugg et al., 2015) to cases with exposure up to 1,800 mg green tea extract per day (De Paula et al., 2008) (content of EGCG not stated in these case reports). The Panel considered that the liver injury in many of the case reports is likely due to idiosyncratic reactions.
Liver cancer
The role of green tea infusion on liver cancer is not yet clear. There is some evidence for an inverse association between green tea infusion consumption and liver cancer. However, all epidemiological studies conducted so far, except for two cohort studies (Inoue et al., 2009; Butler et al., 2015), did not adjust for potential confounding due to hepatitis virus status.
Ni et al. (2017) conducted a meta‐analysis to assess the association between green tea consumption and the risk of liver cancer. The meta‐analysis included six cohort studies and four case‐control studies conducted in China and Japan (Ni et al., 2017). Quality assessment of the studies was conducted by using the Newcastle‐Ottawa scale. Cohort studies with a score of six of more and case–controls with a score of five or more were included in the analysis.). The summary RR for the consumption of green tea on liver cancer incidence was 0.65 (95% CI: 0.48–0.88) with a high heterogeneity (I2 = 73.9%, p = 0.005). The summary RR for the highest consumption (5 cups or more daily) of green tea on liver cancer in comparison to non‐drinkers was 0.62 (95% CI: 0.49–0.79). Out of the 10 epidemiological studies included in the meta‐analysis, 7 studies were eligible for the dose–response analysis (RR for an increase of one cup of green tea daily was 0.96, 95% CI = 0.92–0.99. When the analysis was stratified by type of study design, no protective effect was found in the cohort studies. In the Japanese studies, no protective effect was found.
The epidemiological studies with a good control for confounding factors are described below.
Inoue et al. (2009) conducted a cohort study on 18,815 individuals in six public health centre areas in Japan (the Japan Public Health Center‐Based Prospective study) to investigate the relation between coffee and green tea consumption and liver cancer. Blood samples were collected and information on smoking status, alcohol consumption, body mass index, history of diabetes and coffee and green tea consumption was obtained for all subjects. Subjects were followed from 1993 to 2006 and 110 cases of liver cancer were identified in the follow‐up. After controlling for possible confounders such as sex, age, area of residence, smoking status, alcohol, BMI, history of diabetes, coffee consumption, serum ALT levels, hepatitis virus infection status B (HBsAg) and C (HCV), moderate (3–4 cups daily vs less than 3 cups; HR: 1.62; 95% CI: 0.97–2.69) and high consumption of green tea (5 cups or more daily; HR: 1.44; 95% CI: 0.84–2.45, ptrend = 0.108) was associated with an increased risk for liver cancer, although it did not reach statistical significance. In the stratified analysis by sex, a statistically significant increased risk was found for women consuming 3–4 cups daily (HR: 2.58; 95% CI: 1.01–6.59) and for men consuming 5 cups or more daily with positive HCV and/or HBsAg (HR: 1.70; 95% CI: 0.85–3.41 ptrend = 0.062) in comparison to men consuming less than 3 cups daily with positive HCV and/or HBsAg. The main limitation of the study was the low number of liver cancer cases.
Butler et al. (2015), within the Shanghai Cohort study (n = 18,244; age range 45–64 years old), conducted a nested case‐control study among 211 cases of HCC and 1,067 matched controls (sex, age, residence and date of urinary sample collection 45–64 years) to study the association between urinary catechins (e.g. EC, EGC) and HCC. Medical history and information on smoking, alcohol, weight and height and urinary samples were obtained at baseline for all patients. Cases were identified using the Shanghai Cancer Registry and the Shanghai Municipal Vital statistics Office. After controlling for smoking, alcohol, HBsAg status and liver cirrhosis, no association was found between urinary catechins and HCC. However, among men with positive HBsAg an increased risk was found with increasing levels of urinary catechins (ptrend = 0.002). Subjects with positive HBsAg and with > 17 μmol/g Cr of EGC in urine specimens had a two‐fold increased risk of HCC (OR: 2.44; 95% CI: 1.04–5.71) in comparison to subjects with undetectable levels and positive HBsAg. In a further stratified analysis, subjects with positive HBsAg and low retinol levels (< 45.8 μg/dL) and detectable levels of EGC had a further increased risk of HCC (OR: 2.62; 95% CI: 1.25–5.51). In the same study population, they showed that green tea drinkers consuming ≥ 10 cups per day had a 3‐fold increase in urinary EGC in comparison to non‐drinkers (p < 0.001).
The Panel considered results from epidemiological studies investigating a possible association between intake of green tea infusions and liver cancer to be inconclusive.
3.4.2.2. Animal data on liver toxicity
In the following section data is described according to the administered catechin compound or green tea product and animal species. No data was available on green tea infusion.
Acute toxicity, oral and parental administration
EGCG
Mice
Galati et al. (2006) studied the hepatotoxicity of EGCG after intraperitoneal administration of single dose of 100, 150 and 300 mg/kg bw to CD‐1 male mice at 6 weeks of age. All animals in the two higher dose groups died within 22 h. Increased ALT (3.5‐fold) was observed in the lowest dose group 24 h after treatment.
Lambert et al. (2010) studied the hepatotoxicity of EGCG in fasted CF‐1 mice. A single intragastric dose – after overnight fasting – of 1,500 mg/kg bw increased plasma ALT by 138‐fold and reduced survival by 85% (number of animals/group is not stated). After two once‐daily intragastric doses of 750 mg/kg bw (prior to each dosing, the mice were fasted from 9 am to 3 pm with food returned following dosing) plasma ALT was increased 184‐fold. Moderate‐to‐severe hepatic necrosis was observed in 75% of mice given a single dose of 1,500 mg/kg bw of EGCG and in 60% of mice given two once‐daily doses of 750 mg/kg bw (number of animals/group is not stated). Pretreatment of CF‐1 mice with EGCG (3.2 mg/g diet, corresponding to 380 mg/kg bw per day) for 2 weeks mitigated the hepatotoxicity (measured as ALT elevation) induced by 750 mg/kg bw EGCG, administered intragastrically once daily for 3 days, as demonstrated by James et al. (2015). They found a 75% decrease in ALT elevation in the pretreated mice and statistically significantly lower exposure of EGCG, measured as AUC, in the pretreated mice. The authors interpreted this as EGCG being able to modulate its own bioavailability and that dietary pretreatment may reduce the toxic potential of acute high oral bolus doses of EGCG.
Church et al. (2015) studied the hepatotoxicity of EGCG in a genetically heterogeneous mouse population (Diversity Outbread). A daily intraperitoneal injection to 272 mice of 50 mg/kg bw of EGCG for three days was found to be tolerated in the majority of mice, while a small fraction, 15%, of the animals exhibited severe hepatotoxicity. Mean serum ALT was significantly elevated 22‐fold in those mice deemed to have exhibited hepatotoxicity, but with a high degree of variability between individuals. The results demonstrated a significant phenotypic variation in response to EGCG exposure, with serum ALT elevations from baseline (determined before treatment) ranging from 0.15‐ to 495‐fold. Serum ALT fold changes correlated with the severity of liver necrosis (r = 0.70; P < 0.05).
Rats
Oral LD50 of a green tea preparation (containing 93.4% of EGCG) was determined in Wistar rats to be between 200 and 2,000 mg/kg bw (186.8 and 1,868 mg EGCG/kg bw) (Isbrucker et al., 2006). Thus, a dose of 2,000 mg green tea preparation/kg bw was lethal to rats, while a dose of 200 mg/kg bw induced no toxicity.
Green tea extracts
Rats
Hepatotoxicity was studied in an acute study in 6 and 18 weeks old 33 males and 42 female rats, administered a single intraperitoneal injection of 200 mg/kg bw of green tea extract (THEA‐FLAN 90S, a commercial decaffeinated product from Japan; approximately 54% EGCG) (Emoto et al., 2014). Of the rats exposed at 6 weeks of age 12% of males and 50% of females died within 72 h, while lethality was 88% in the 18‐week‐old female rats. Serum levels of AST and ALT were increased (determined from 3 to 6 surviving rats of each sex). The AST levels peaked at 72 h in male rats with a 15‐fold increase compared to controls and at 48 hrs in females with a 23‐fold increase compared to controls. The corresponding increase in ALT was 23‐fold in males and 45‐fold in females. Hepatocellular apoptosis was demonstrated as well as lipid peroxidation in liver. EGCG levels in exposed rats reached 0.388 μg/mL serum (0.880 μM) in males and 0.276 μg/mL (0.602 μM) in females. Levels in the livers were 0.107 and 0.084 μg/g tissue in males and females, respectively.
The Panel considered that oral bolus doses of 750 mg/kg bw (2 daily doses) EGCG cause hepatotoxicity in mice. A single intraperitoneal administration of EGCG at 100 mg/kg bw is sufficient to generate an hepatic injury in mice. There is evidence in the mouse that a subpopulation may have enhanced sensitivity to EGCG after intraperitoneal injection of 50 mg/kg bw daily for 3 days. Assuming that the hepatotoxicity of green tea extracts is associated entirely with EGCG, the oral LD50 value of EGCG in rats is in the range of 190–1900 mg/kg bw of EGCG. A single intraperitoneal injection of green tea extract equivalent to 108 mg EGCG/kg bw resulted in serum EGCG levels of 0.880 μM in males and 0.602 μM in females and significant hepatotoxicity and death in rats.
Short‐term and subchronic toxicity
EGCG
Isbrucker et al. (2006) studied toxicity of an EGCG preparation of C. sinensis leaves (similar purification method as for Teavigo® (a preparation comprising greater than 90% EGCG) in rats and dogs. A 13‐week study in rats was performed according to OECD guideline number 408 (OECD, 1998).
Rats
Sprague–Dawley rats were fed an EGCG preparation (77% EGCG) mixed with regular feed to deliver doses of 50, 150 and 500 mg EGCG/kg bw per day. No toxicity was observed in the rats. The authors suggested a NOAEL of 500 mg of EGCG/kg bw per day, the highest dose tested (Isbrucker et al., 2006).
Dogs
In a 13‐week toxicity study in Beagle dogs (4 dogs/sex in each dose group), EGCG preparation (80% EGCG) was given in capsules at doses of 0, 50, 150 and 500 mg/kg bw per day (corresponding to 0, 40, 120 or 400 mg EGCG/kg bw per day) (Isbrucker et al. (2006a). The study was performed according to the OECD guideline number 409. The capsules were administered after a minimum of 15 h fasting and 3–4 h before feeding the animals. The highest dose resulted in occasional vomiting and frequent diarrhoea 150 mg/kg bw per day had similar but less severe symptoms. Death and sacrifice due to moribund conditions were reported for the two higher dose groups, while all dogs survived in the low‐dose group. In all dogs receiving the high dose, serum bilirubin levels were elevated at day 9. Increased plasma levels of AST, ALT and GGT were reported in one of the males in the high‐dose group and increased ALT was reported in another male dog and in three female dogs in the high‐dose groups. At the end of the study, two of the high‐dose male dogs had greatly elevated AST levels. One male and one female in the middle‐dose groups had elevated bilirubin, which in the female was accompanied by a large elevation in AST and ALT.
Isbrucker et al. (2006) also performed a 13 week study in non‐fasted Beagle dogs administered an EGCG preparation (91.8% EGCG) approximately 1 h after feeding. The study was performed according to the OECD guideline number 409. The dogs, 6 per sex and dose, were administered oral doses of 0, 50, 300 and 500 mg/kg bw per day divided into twice daily administrations. No adverse effects were reported.
According to the authors, the NOAEL in fasted dogs was 50 mg/kg bw per day (equivalent to 40 mg/kg bw per day of EGCG) and in fed dogs 500 mg/kg bw per day (459 mg/kg bw per day of EGCG, the highest dose tested). AUC and Cmax for EGCG increased with dose and time and were higher in the fasted dogs. According to the authors, only a few of the fasted dogs showed hepatic necrosis, which occurred in association with emesis and general loss of condition. Thus, the authors suggested that toxicity occurs predominantly in cases where very high systemic concentration of EGCG is obtained. In a commentary to this publication Wu et al. (2011) pointed out that the estimated AUC was lower at the NOAEL in fasted dogs (9.2 and 12.1 μg h/mL in female and male, respectively) than at the NOAEL in fed dogs (39.9 and 88.3 μg h/mL in female and male, respectively). In their commentary, they pointed out, that if the biological exposure is the primary factor for toxicity, the NOAEL exposure levels should be similar to one another when studies are conducted in the same species. Based on this argument, they speculated that fasting had increased the susceptibility of target organ systems to the effects of green tea extract. The Panel considered that an additional component contributing to increased susceptibility to EGCG in fasted dogs could be due to reduced hepatic glycogen.
Green tea extracts
Mice
Toxicity of Polyphenon E, a standardised green tea catechin mixture, containing approximately 50% EGCG, was studied in B6C3F1 transgenic mice (7 males and 7 females/group) at doses of 500, 1,000 and 2,000 mg/kg bw via bolus oral gavage for 28 days (Chang et al., 2003). All mice in the high‐dose group died early or were sacrificed due to moribund condition. The main histopathological findings in these animals were cardiac myofibre degeneration, hepatic fatty change and hepatic centrilobular necrosis. No changes were observed at 500 and 1000 mg/kg bw per day. The Panel considered 1,000 mg/kg bw per day of Polyphenon E (equivalent to 500 mg/kg bw per day of EGCG) when administered as a bolus as a NOAEL in this study.
As a part of the NTP study (2016), a 14‐week toxicity study of green tea extract (ethanol:water extraction of green tea leaves) (48.4% EGCG, 12.8% ECG, 2.26% EGC, 2.83% EC, 0.52% GC, 0.51% C and 4.6% GCG) was performed B6C3F1 mice (10 males and 10 females per group) at doses of 0, 62.5, 125, 250, 500 and 1,000 mg/kg bw (Chan et al., 2010). GTE was administered in deionised water by oral gavage 5 days per week. Detailed results on selected endpoints are presented in Appendix E. Body weights at termination and body weight gains were statistically significantly lower compared to controls from 250 mg/kg bw and in female mice from 125 mg/kg bw. Hepatic toxicity was observed, which was likely the cause of the early mortality in the highest dose group. Liver necrosis was reported in the high‐dose groups of both males and females, characterised by a centrilobular to panlobular necrosis and haemorrhage. Glycogen depletion above control levels was noted in 250 and 500 mg/kg bw dose groups in male mice and in 500 and 1,000 mg/kg bw in females. Accumulation of golden brown pigment in Kupffer cells was present in a few high‐dose male and female mice. Treatment‐related effects were observed in the nose, such as olfactory nerve atrophy, olfactory epithelium atrophy and metaplasia. According to the authors, this may be associated with the lesions in the nose causing changes in smell and taste and a subsequent decreased ability to acquire food. The NOAEL for the liver effects was determined by the authors to be 500 mg green tea extract/kg bw per day (equivalent to 242 mg/kg bw per day per day of EGCG) when administered as a bolus. The authors suggested that the susceptibility of the liver and nose to GTE may be due to the high metabolic activity in these tissues and a role for GTE metabolites in toxicity.
Rats
In order to investigate whether extraction solvents could lead to some toxic components being present in green tea extracts, three different extracts were produced by extraction with either methylene chloride, water or 80% ethanol (Exolise®) and administered to rats by intragastric gavage (Bun et al., 2006). No effects on ALT, AST or alkaline phosphatase were observed after 6 weeks treatment with the methylene chloride extract, or after 12 weeks treatment with the aqueous and ethanol extracts. Total bilirubin was statistically significantly decreased in the group treated with the aqueous extract and increased in the group treated with the ethanol extract. The authors considered the effects on total bilirubin not to be of toxicological relevance. The Panel noted the lack of the extraction solvent controls and was therefore unable to conclude whether the effects observed were due to the solvent as such or to the extract.
Two investigations studied the toxicity of heat‐sterilised (heat treatment at 121°C under aqueous conditions for 90 min) green tea catechin preparations (Chengelis et al., 2008; Morita et al., 2009). During heat sterilisation about half of the tea catechins are epimerised, for example EGCG is epimerised into GCG (Morita et al., 2009). In a 28‐day gavage study, rats were administered doses of 500, 1,000 and 2,000 mg/kg bw of green tea preparations by oral gavage 7 days per week, either heat‐sterilised (6.9% EGCG, 6.9% GCG, 6.8% GC, 4.9% EGC, 2.4% ECG, 1.8% C, 1.8% EC and 1.6% CG) or not heat‐sterilised (25.1% EGCG, 1.3% GCG, 4.8% GC, 18.0% EGC, 7.1% ECG, 1.9% C, 4.9% EC and 0.6% CG) (Chengelis et al., 2008). Lower body weights and food consumption were observed in males in the two higher dose groups given heat‐sterilised green tea preparation. No effects on body weight were noted in the other groups. No increase in plasma ALT or AST was observed. The authors considered 2,000 mg/kg bw, the highest dose tested, as a NOAEL for both green tea preparations. This dose was equivalent to 138 mg/kg bw per day of EGCG of the heat‐sterilised green tea preparation and 502 mg/kg bw per day of EGCG of the non heat‐sterilised green tea preparation.
In a 6‐month study, rats (10/group per sex) were administered heat‐sterilised green tea extracts by gavage at doses of 0, 120, 400 and 1200 mg/kg bw per day (Morita et al., 2009). The green tea preparations were produced in a similar way as in the 28‐days study, described above (Chengelis et al., 2008). The composition of catechins in the heat‐sterilised green tea preparation was 5.9% EGCG, 6.5% GCG, 6.1% GC, 4.7% EGC, 2.2% ECG, 1.8% C, 1.9% EC and 1.6% CG and in the not heat‐sterilised preparation: 15.4% EGCG, 0.8% GCG, 2.8% GC, 11.7% EGC, 4.8% ECG, 1.0% C, 3.2% EC and 0.4% CG). Compared to controls, female rats had lower body weights without any decrease in food consumption in the highest dose group. The effects on body weight were used as the basis for deriving a NOAEL by the authors. No increase in plasma ALT or AST were observed. The NOAELs were 1200 and 400 mg/kg bw per day for heat‐sterilised green tea catechin preparation for males and females, respectively. The NOAEL was the highest dose tested in males. These NOAELs are equivalent to 83 and 28 mg/kg bw per day of EGCG.
A 90‐day dietary study in rats (10 males and 10 females/group) was performed with a green tea extract (Sunphenon 100STM), composed of a polyphenol fraction (80.8%), consisting of 29.4% EGCG, 12.7% EGC, 9.9% ECG, 7.3% EC, 5.3% GC, 2.1% GCG, and 1.8% C (Takami et al., 2008). The green tea preparation was mixed with the regular feed and the final average daily intakes of green tea preparation were 180, 764 and 3,525 mg/kg bw for males and 189, 820 and 3,542 mg/kg bw in females. Body weights were reduced compared to controls in the males in the highest dose group. Relative liver weights were statistically significantly increased in the highest dose group and serum levels of ALT were statistically significantly increased 1.4‐fold in the highest dose group in males and females as well as AST 1.3‐fold in the females. No treatment‐related histopathological changes were reported. The NOAEL was estimated by the authors to be 764 mg/kg bw per day (equivalent to 180 mg/kg bw per day of EGCG) in males and 820 mg/kg bw per day (equivalent to 195 mg/kg bw per day of EGCG) in females.
As a part of the NTP study (2016), a 14‐week toxicity study of green tea extract (ethanol:water extraction of green tea leaves) (48.4% EGCG, 12.8% ECG, 2.26% EGC, 2.83% EC, 0.52% GC, 0.51% C and 4.6% GCG) was performed in F3444/NTac rats (10 males and 10 females per group) at doses of 0, 62.5, 125, 250, 500 and 1,000 mg/kg bw (Chan et al., 2010). GTE was administered in deionised water by oral gavage 5 days per week. Detailed results on selected endpoints are presented in Appendix D. Findings in the liver was limited to 3 out of 10 females at 1,000 mg/kg bw. A single case of moderate centrilobular necrosis was reported. Additional changes in the three rats were suggestive of regeneration, and included minimal bile duct hyperplasia, oval cell hyperplasia and mitosis. In addition, accumulation of golden brown pigment in Kupffer cells was recorded. Treatment‐related effects were observed in the nose. The most frequent lesions were chronic inflammation, olfactory nerve atrophy, olfactory epithelium atrophy and metaplasia. According to the authors this may be associated with the lesions in the nose causing changes in smell and taste and a subsequent decreased ability to acquire food. The NOAEL for the liver effects was determined by the authors to be 500 mg green tea extract/kg bw per day (equivalent to 242 mg/kg bw per day per day of EGCG) when administered as a bolus in both species. The authors suggested that the susceptibility of the liver and nose to GTE may be due to the high metabolic activity in these tissues and a role for GTE metabolites in toxicity.
Dogs
Kapetanovic et al. (2009) studied the toxicity of Polyphenon E (63.3–64.8% EGCG, 3.0–3.7% EGC, 6.0–8.0% ECG and 7.6–12.3% EC) in fasted and non‐fasted Beagle dogs. The dogs were dosed with 0, 200, 500 and 1,000 mg/kg bw per day in gelatine capsules on an empty stomach. The doses corresponded to approximately 0, 128, 320 and 640 mg/kg bw per day. The study was intended to last for 9 months, but was terminated at 6.5 months due to extensive morbidity and mortality in all treated groups. Unscheduled mortality occurred in 16 out of 24 treated animals with dose‐related incidence. The most prevalent clinical effects were diarrhoea, emesis and excessive salivation. Hepatic centrilobular necrosis and chronic active inflammation with infiltration of neutrophils and mononuclear cells were reported in the liver together with brown intracytoplasmic pigment in Kupffer cells (not described in relation to dose). A 13‐week follow‐up study was initiated with one dose, 200 mg/kg bw per day of Polyphenon E, corresponding to 128 mg EGCG/kg bw per day, given either on an empty stomach (9 dogs) or to fed dogs (3 dogs). There was no mortality and the observed toxicity was lower than in the previous study. In fasted dogs, there was evidence of digestive system disturbances (vomiting, mild diarrhoea and/or red material in the faeces), mild liver damage (haematopoiesis and presence of pigmented macrophages), anaemia and mild disturbances of haematopoiesis in the spleen and bone marrow. Increased levels of ALT were observed in one dog and increased levels of AST as well as increased bilirubin were observed in another of the fasted dogs. No signs of gastrointestinal disturbances or effects on liver parameters were observed in the fed dogs. Free (unconjugated) and total (unconjugated plus conjugated) EGCG AUC were considerably lower in fed dogs than in fasted at the end of the 13 week exposure (14.8 and 32.2 μg h/mL in fed dogs and 29.2 and 123.6 μg h/mL in fasted dogs).
Dosing in a fed state resulted in considerably lower and less variable exposure than found under fasted conditions. No signs of hepatotoxicity were observed in two rat studies aimed at investigating the impact of the extraction solvent on the hepatotoxicity of green tea extracts (Bun et al., 2006). The studies included the green tea hydro‐alcoholic (80% ethanol) extract, Exolise®, which has been associated with human cases of hepatic failures. In one of the studies, rats (9 animals/group) were orally (intragastric gavage) administered 2,500 mg/kg bw per day of a methylene chloride extract of green tea leaves, where non‐polar compounds would be extracted (0.6% EGCG) daily for 6 weeks. The other study compared an aqueous extract of green tea leaves (10.6% EGCG) at a dose of 1,400 mg/kg bw per day (10 animals/group) with a hydro‐alcoholic (80% ethanol) extract ((14.7% EGCG) at 2000 mg/kg bw per day, both orally (intragastric gavage) administered for 12 weeks. Control groups were administered the vehicle. Markers of hepatotoxicity, ALT, AST and lactate dehydrogenase were slightly, but not statistically significantly increased after exposure to the extracts of methylene chloride, corresponding to 15 mg EGCG/kg bw, and ethanol, corresponding to 294 mg EGCG/kg bw.
The Panel considered that liver toxicity was observed in some animal studies, but not all animal studies with EGCG or green tea extracts. In studies where liver toxicity was observed, the lowest NOAEL for this effect was 242 mg/kg bw per day of EGCG in rats administered a green tea extract via oral gavage. Severe toxicity, not only in the gastrointestinal tract but also the liver, was demonstrated in fasted dogs at doses, which were non‐toxic to fed dogs. The NOAEL in fasted dogs was 40 mg/kg bw per day of EGCG, which was 10 times lower than the NOAEL in fed dogs.
Chronic toxicity and carcinogenicity
EGCG
No studies were available.
Green tea extracts
Mice
Groups of B6C3F1/N mice (10/sex per group, age 5–6 weeks old) were given by gavage 0, 30, 100, or 300 mg green tea extract (with the same catechin composition as in the rat study) in water (dosing volume 10 mL/kg bw), 5 days per week for 105 weeks (NTP, 2016). The vehicle control received deionised water only. The doses correspond to 0, 14.5, 48.4 and 145.2 mg EGCG/kg bw per day. Results on selected endpoints are presented in Appendix G. Survival was comparable among all the groups. Mean body weights of males in 100 and 300 mg/kg groups were at least 10% less than those in the controls after week 89 and 65, respectively. The mean body weights of females were at least 10% lower than those in the controls after week 25 and 17, respectively. According to the authors, there were no clinical findings related to green tea extract administration.
Microscopic examination revealed several non‐neoplastic or neoplastic changes in different organs and tissues. In the treated male groups the non‐neoplastic changes with incidences statistically significantly increased as compared to controls were as follows: (1) in the liver haematopoietic cell proliferation and inflammation (both at 300 mg/kg bw); (2) in the nose: the foreign body, suppurative inflammation and lumen pigmentation, nerve atrophy, olfactory epithelium atrophy, olfactory epithelium metaplasia, respiratory epithelium metaplasia, respiratory epithelium necrosis (at all doses); hyperostosis, septum perforation, turbinate atrophy, olfactory epithelium fibrosis (at 100 and 300 mg/kg bw); (3) in the lungs inflammation (at 100 and 300 mg/kg bw); (4) in mandibular lymph node: lymphoid hyperplasia and plasma cell infiltration (at 100 and 300 mg/kg bw); (5) in bone marrow hyperplasia (at all doses).
In the treated female groups, the non‐neoplastic changes with incidences statistically significantly increased as compared to controls were as follows: (1) in the nose: suppurative inflammation, nerve atrophy, olfactory epithelium atrophy, olfactory epithelium squamous metaplasia, respiratory epithelium squamous metaplasia (at all doses); the foreign body, hyperostosis, septum perforation, turbinate atrophy, olfactory epithelium fibrosis, respiratory epithelium hyperplasia and necrosis (at 100 and 300 mg/kg bw), and lumen pigmentation (at 30 and 300 mg/kg bw); (2) in mandibular lymph node: lymphoid hyperplasia and plasma cell infiltration (at 100 and 300 mg/kg bw); (5) in bone marrow hyperplasia (at 100 and 300 mg/kg bw). In addition, inflammation in the lungs was recorded in 1/49 and 2/50 females from 30 and 300 mg/kg bw groups, respectively.
The Panel considered that there was no evidence of carcinogenic activity of green tea extract in mice. Based on only the liver effects in male mice, the NOAEL would be 48.4 mg EGCG/kg bw per day.
Rats
Yoshida et al. (2011) studied chronic toxicity and carcinogenicity of a catechin mixture in Wistar Hannover GALAS rats. The mixture (43.6% EGCG, 13.4% ECG, 11.7% EGC, 2.9% EC, 1.8% C, 1.7% GCG, 1.1% GC and 0.2% CG) was administered in the diet at concentrations of 0%, 0.02%, 0.3%, 1% or 3% for 12 months (chronic study; 10 males and 10 females per group) and 24 months (carcinogenicity study; 50 males and 50 females per group). In the 12‐month study, the dietary concentrations corresponded to 4.2, 63.7, 225.7 and 838.4 mg EGCG/kg bw per day in males and 6.2, 94.0, 333.8 and 1101,2 mg EGCG/kg bw per day in females. In the 24‐month carcinogenicity study the dietary concentrations corresponded to 3.7, 53.5, 181.5 and 551.9 mg EGCG/kg bw per day in males and 4.4, 64.7, 216.8 and 671.4 mg EGCG/kg bw per day in females. Males in the highest dose group had statistically significantly increased (14%) relative liver weight in the chronic study and centrilobular hypertrophy of hepatocytes (8/10 and 18/50 rats in the chronic and carcinogenicity study, respectively). No effects were seen in the chronic study on the serum liver enzyme levels ALT, AST, ALP and γ‐GTP. Tumour incidences were similar between treated and control groups. Expression of CYP3A2 was found in the hypertrophied hepatocytes in male rat at 3% in the chronic study, as determined by immunohistochemistry. It was not clear whether expression of CYP3A2 was investigated also in the other dose groups. As there were no signs indicative of hepatotoxicity on serum biochemical parameters or histopathological examination, the authors suggested that the changes observed in the liver resulted from adaptation and were not considered as adverse effects. The Panel agreed with the authors and considered the NOAEL of 838.4 mg/kg bw per day, when added at the diet, the highest dose tested in this study.
Wistar Han [Crl:WI(Han)] rats 6–7 weeks old were given by gavage 0, 100, 300 or 1,000 mg green tea extract (containing 48.4% EGCG, 12.8% ECG, 2.26% EGC, 2.83% EC, 0.52% GC, 0.51% C and 4.6% GCG))/kg bw in water (dosing volume 5 mL/kg bw), 5 days per week for 105 weeks (NTP, 2016) The vehicle control received water only. The doses corresponded to 0, 48.4, 145.2 and 484.0 mg/kg bw EGCG day. The number of animals in the control and the highest dose group was 60/sex) and 50/sex in the low and middle dose groups. Ten rats/sex from the control and the high‐dose groups were terminated at 3 months to compare the results to the 3‐month study in F344/NTac rats. Complete necropsies were carried out on all mice and all major tissues were sampled for microscopic examination. Results on selected endpoints are presented in Appendix F. Survival was statistically significantly lower compared to the controls at 1,000 mg/kg bw (591 days vs. 687 in the control). Mean body weights of males in 300 and 1,000 mg/kg groups were at least 10% less than those in the controls after week 41 and 9, respectively. Mean body weights of all treated females were at least 10% lower than those in the controls after week 65 (at 100 mg/kg), 61 (at 300 mg/kg) and 57 (at 1,000 mg/kg). No difference to the controls was recorded for treated males and females at sacrifice at 3 months.
Microscopic examination revealed several non‐neoplastic changes in different organs and tissues. In the treated male groups the non‐neoplastic changes with incidences statistically significantly increased as compared to controls were as follows: (1) in the liver necrosis (at 1,000 mg/kg bw); (2) in the glandular stomach necrosis of the mucosa (at 1,000 mg/kg); (3) in the small intestine necrosis (at 1000 mg/kg, dose related); (4) in the nose: lamina propria mineralisation, nerve trophy, olfactory epithelium metaplasia, olfactory epithelium pigmentation, turbinate deformity and hyperostosis (at all doses), lamina propria pigmentation, olfactory epithelium metaplasia of basal cells, respiratory epithelium atrophy (at 300 and 1,000 mg/kg bw), suppurative and acute inflammation, nasopharyngeal duct epithelium hyperplasia, olfactory epithelium necrosis and squamous metaplasia, respiratory epithelium atrophy, degeneration, squamous metaplasia and necrosis (at 1,000 mg/kg bw); (5) in the lungs: suppurative inflammation (at 1,000 mg/kg bw); (6) in the heart inflammation in the epicardium (at 10,00 mg/kg bw); and (7) in the spleen lymphoid depletion (at 1,000 mg/kg bw).
In the treated female groups, the non‐neoplastic changes with incidences statistically significantly increased as compared to controls were as follows: (1) in the liver necrosis and oval cell hyperplasia (at 1,000 mg/kg bw); (2) in the glandular stomach necrosis of the mucosa (at 300 and 1,000 mg/kg); (3) in the small intestine necrosis (at 1,000 mg/kg, dose related); (4) in the nose: lamina propria mineralisation, nerve atrophy, olfactory epithelium atrophy, olfactory epithelium hyperplasia of basal cells, olfactory epithelium metaplasia, olfactory epithelium pigmentation, respiratory epithelium atrophy and turbinate hyperostosis (at all doses), nasopharyngeal duct suppurative inflammation, olfactory epithelium basal cell hyperplasia and olfactory epithelium pigmentation (at 300 and 1,000 mg/kg bw), degeneration, necrosis and regeneration of epithelium of nasopharyngeal duct, and respiratory epithelium squamous metaplasia (at 1000 mg/kg bw); (5) in lungs suppurative inflammation (at 1,000 mg/kg); (6) in the heart inflammation in the epicardium (at 1,000 mg/kg bw); and (7) in the spleen lymphoid depletion (at 1,000 mg/kg bw). Based on the liver effects in male and female rats, the Panel considered that a NOAEL could be identified of 145 mg EGCG/kg bw per day.
Overall, the Panel considered that there was no evidence of carcinogenic activity of green tea extract in rats or mice. Based on histopathological effects in the liver in male and female rats, the Panel considered that a NOAEL could be identified of 145 mg EGCG/kg bw per day (administered by gavage, 5 days/week). Based on only the liver effects in male mice, the NOAEL would be 48.4 mg EGCG/kg bw per day. No clinical chemistry was performed in this study. When a green tea catechin mixture was added to the diet to rats, no liver effects were reported with doses up to 838 mg/kg bw per day, the highest dose tested.
3.4.2.3. Pyrrolizidine alkaloids – known hepatotoxicant in green tea
Contamination of green tea by pyrrolizidine alkaloids (PA) has been suggested as a cause or a contributing factor to the hepatotoxicity of green tea (Kristanc and Kreft, 2016). Most likely the contamination originates from PA‐producing plants, which are co‐harvested with the tea. More than 600 different PA have been identified in plants and the toxic compounds have a 1,2‐double bond of the necine base moiety. These 1,2‐unsaturated PA can be activated by cytochrome P450 enzymes, mainly CYP3A4, to form reactive products, some of which may act as genotoxic carcinogens in humans (EFSA, 2011, 2016, 2017; Stegelmeier et al., 2016, Robertson and Stevens, 2017).
Pyrrolizidine‐induced acute liver toxicity is well known from livestock, wildlife and humans after ingestion of pyrrolizidine‐producing plants. Liver failure, including anorexia, depression, icterus, visceral oedema and ascites are acute symptoms in PA‐intoxicated animals. High elevations of serum AST, ALP and GGT as well as bilirubin and bile acids are reported in acutely intoxicated animals. In humans the acute hepatic injury includes zone 3 hepatic necrosis and fibrosis affecting the hepatic sinusoids inducing hepatic veno‐occlusive disease (HVOD). If exposure continues and without medical treatment HVOD can develop into liver fibrosis, cirrhosis, necrosis and lethality. The lowest dose of PA associated with acute/short‐term effects in human poisoning cases is 1–3 mg/kg bw per day, reported to cause HVOD in a child after 2 weeks exposure and lethality in a 2‐month infant after 4 days exposure. Fetuses and neonates are more susceptible than adults and there are examples of transplacental and transmammary exposure to fetuses and breast‐fed neonates respectively causing fatal hepatic disease, while the pregnant or breastfeeding mother was unaffected (EFSA, 2011; Neuman et al., 2015; Stegelmeier et al., 2016).
Less is known about effects after low dose and chronic exposure to PA, which may be expected after exposure to PA from contaminated food, such as green tea. Chronic poisoning may not be immediately apparent clinically as the elevations of serum enzymes may be transient, which has been demonstrated in acutely intoxicated livestock (Stegelmeier et al., 2016). It has been suggested that the hepatocellular damage may be progressive and lead to focal hepatocyte necrosis and inflammation, necrosis and ultimately cirrhosis.
The EFSA Chemical Occurrence data base report mean and 95%‐ile total concentration of 28 PAs in 310 samples of green tea infusion of 3.8 and 6.1 μg/L, respectively (values below LOD were replaced by LOD and values below LOQ were replaced by LOQ (EFSA, 2016). Corresponding levels in the dry product were 287 and 460 μg/kg, respectively (EFSA, 2016). The estimated mean and 95%‐ile exposure to PA from green tea infusion in the adult population were 4.8–30.7 and 30.7–83.5 (upper bounds) ng/kg bw per day, respectively. In the young population, the estimated mean (the 95%‐ile was not presented) exposure was 2.4–23.0 (upper bound) ng/kg bw per day.
Recently, the CONTAM Panel established a new Reference Point, based on the increase in incidence of liver haemangiosarcoma in female rats, of 237 μg/kg body weight per day establishing a benchmark dose lower confidence limit for 10% (BMDL10) to assess the carcinogenic risks of PA and concluded that there is a possible concern for human health related to the exposure to PA, in particular for frequent and high consumers of tea and herbal infusions. Specifically for green tea, exposure levels calculated from various data sets compared to the Reference Point of 237 μg/kg body weight per day resulted in Margin of Exposure (MOE) values varying from 98,750 to 2,838 in adult consumers. Furthermore, the CONTAM Panel noted that consumption of food supplements based on PA‐producing plants could result in exposure levels causing acute/short‐term toxicity (EFSA, 2017).
The Panel noted that green tea may be contaminated by PA and that 1,2‐unsaturated PA can be activated by CYP450 enzymes to form hepatotoxic metabolites. The Panel considered that the levels of PA present in green tea products is unlikely to induce non‐neoplastic hepatotoxicity alone, but could not exclude the possibility that contamination by PA in green tea products may be a contributory factor to the hepatotoxicity of green tea catechins.
4. Discussion
Green tea is produced from the leaves of C. sinensis (L.) Kuntze without fermentation, which prevents oxidation of the polyphenolic components. Most of the polyphenols in green tea are flavan‐3‐ols, commonly known as catechins. The main catechins in green tea are EGCG, ECG, EGC and EC. Green tea catechins have been associated with beneficial as well as adverse health effects. In recent years, there has been a number of reports on cases of hepatotoxicity in persons consuming green tea food supplements and in a few cases in persons consuming green tea infusions. In addition to the case reports, there is a large number of clinical trials on green tea extracts/catechins, with the main purpose to study beneficial health effects, but often also including measurements of liver parameters as an adverse outcome. Furthermore, studies on liver toxicity in experimental animals are available and have been evaluated in the present opinion. To enable comparison between studies, the Panel considered only the content of EGCG in the administered dose of green tea catechins and the rationale for this was that EGCG (1) is the major catechin in green tea, (2) is present in plasma in the unconjugated form (Chow et al. (2003), (3) the most cytotoxic catechin, compared to EGC and ECG in primary rat hepatocytes (Schmidt et al., 2005; Galati et al., 2006) and (4) in some cases, it is the only catechin for which content is quantified and reported.
Green tea catechins can be consumed as traditional green tea infusion, reconstituted tea drinks (ready‐to‐drink) or as food supplements containing concentrated green tea extracts. The Panel noted that the content of catechins varied widely in both green tea leaves and in green tea infusions and that for example, EGCG concentration ranged from 1,600 to 20,320 mg/100 g dried leaves (13‐fold) and from 2.3 to 203 mg/100 g infusion (88‐fold), respectively. Several factors independent of botanical source of the green tea, determine the concentration and composition of catechins in green tea infusions, such as the temperature and the quality of the water used for the infusion, extraction time and storage time. The Panel noted that EGCG concentrations in green tea infusions decrease during preparation and storage, due to partially degradation with time, at high temperatures and at pH below 3 and above 5. Furthermore, the precipitation of catechins, a phenomenon called creaming, which occurs when hot green tea infusions cool down, may result in lower concentrations of certain catechins (EGCG and ECG) in the green tea infusion supernatant.
While the green tea extracts for reconstituted tea drinks are aqueous extracts from which water is removed to a greater or lesser extent, the concentrated green tea extracts for supplements are prepared using various extraction techniques, solvents and manufacturing procedures which have different influences on the extraction yield and the composition of extracted substances.
Green tea infusions, reconstituted tea drinks and supplements containing green tea extracts can be prepared and consumed together with other food components, such as milk or eggs. Tea catechins can bind to milk proteins and form a network of casein micelles. The galloyl functional group is responsible for the affinity between EGCG and β‐lactoglobulin through the formation of hydrogen bonds and hydrophobic interactions. The Panel noted, that the free EGCG that could be absorbed and its bioactivity in vivo, could be influenced by the interactions with dietary proteins.
In humans, plasma contained intact EGCG and ECG and several catechin metabolites in the form of O‐methylated, sulfated and glucuronide conjugates of EC and EGC. The intestinal microbiota is responsible for the high degree of metabolism to polyhydroxyphenyl‐γ‐valerolactones which are the main urinary catabolites, averaging 10 times greater concentrations than catechin conjugates. Human data show that administration of green tea extract under fasting conditions, and as a bolus, leads to a significant increase in the area under the plasma concentration–time curve of EGCG compared to administration with food and in split doses.
Non‐fasted bolus doses of 800 mg EGCG/day for 10 days or longer resulted in increased systemic EGCG exposure, which was not as evident when the dose was split into two daily doses of 400 mg EGCG/day.
In total, 49 intervention studies with green tea products stated to include data on liver parameters were retrieved from the literature. The main parameters studied were serum transaminases. The elevation of serum transaminases is indicative of liver injury. The studies varied widely in dose, composition in the administered green tea catechins, duration of treatment, number and health status of treated subjects as well as in the outcome on liver parameters. The majority of the studies did not report any elevation of serum transaminases (26 studies) or did not present data on liver parameters (11 studies). Three of the studies were performed in patients with elevated serum AST and ALT levels due to NAFLD or NASH. In these subjects, treatment with green tea catechins resulted in a decrease in ALT/AST levels or a lower increase than in non‐treated subjects.
Nine of the studies reported elevated serum transaminases and in seven of the studies the incidence was higher in the treated subjects than in the controls. The total number of treated participants in the studies was 724, varying from 7 to 513 per study, and the total number of cases with elevated serum transaminases in the treated subjects was 84. Two of the nine studies did not include a control group.
The daily dose of EGCG in the seven studies with higher incidence of elevated serum transaminases in the group treated with green tea catechins compared to controls was 800 mg or above. Except in one study with 10 days duration of subjects in fasted condition, the duration of studies varied between 4 and 12 months and the treatment was taken with food and usually divided in two daily doses. One of the studies (Dostal et al., 2015; Yu et al., 2017) with more than 500 persons in each group and exposure to 843 mg EGCG/day as a green tea extract for one year, is of highest quality and by far the most informative of the studies.
In the 26 studies with no elevation of serum transaminases, the doses of EGCG varied from 100 to 857 mg/day, and the duration of studies from 10 days to 12 months.
Traditional green tea infusion was used in four intervention studies. The daily doses were 256 mg EGCG for 2 weeks, 440 mg EGCG for 8 weeks, 468 mg EGCG for 3 months and 704 mg EGCG for 14 weeks, respectively. No elevation of serum transaminases was reported. In a Japanese cohort study including more than 18,000 subjects, no increase in ALT levels were reported even in the group consuming more than 5 cups of green tea per day. The Panel noted the lack of effects on liver parameters even after a high consumption (more than 5 cups per day) of green tea infusion, estimated by the Panel to correspond to a mean intake of > 440 mg EGCG/day (125 mL/cup with a mean concentration of 70 mg EGCG/100 g brewed green tea; Table 4), and considered the uncertainties to which extent certain catechins such as EGCG, originally existing in green tea, persist in the final beverage consumed. Precipitation of the catechins under certain conditions including cooling and binding to dietary proteins as well as exposure to ‘diluted’ EGCG over an extended period of time (in contrast to a bolus dose) may reduce the free catechins that could be absorbed from green tea infusions and may partly explain the low incidence of liver effects reported after consumption of green tea beverages.
The Panel noted the limited data on dose–response relationships between doses of EGCG and abnormal liver parameters in man. These limitations combined imply an uncertainty in the assessment of a dose of EGCG that will not cause an effect on liver parameters. However, after reviewing the evidence from the 38 intervention studies on liver effects of green tea catechins, the Panel considered that exposure to green tea extracts at doses at or above 800 mg EGCG/day for 4 months or longer are associated with elevations of serum levels of ALT and AST in treated subjects). Moderate or more severe abnormalities in any liver function (Grade 2 and above) were observed in 5.1% of the treated subjects in a study with more than 500 subjects treated with 843 mg EGCG/day for 1 year. The Panel also noted that no cases with abnormal liver parameters were reported at doses below 800 mg EGCG/day. Several studies did not report any cases of elevated serum transaminases in subjects treated with green tea extracts at or below 316 mg EGCG/day. Furthermore, the Panel noted that during the intervention studies liver parameters were continuously monitored, and cases with serious effects were excluded from further treatment, thus preventing liver injuries. During regular use of green tea extracts, such monitoring would not occur and more serious liver effects may develop. Furthermore, elevated transaminases returned to normal after discontinuing treatment and increased again after one or more rechallenges, which strongly suggests the causality between exposure to green tea extracts and liver effects. The Panel considered the sparse data on green tea exposure from traditional green tea infusions but noted that there was no evidence of elevated ALT levels at consumption of green tea infusions at > 5 cups per day or with a daily intake of 700 mg EGCG/day from green tea infusion. None of the intervention studies addressed pregnant, breast‐fed infants or children.
Case reports of hepatotoxicity induced by the exclusive use of green tea products were evaluated and 22 cases were found where green tea was claimed to be the only causative agent leading to an almost exclusive hepatocellular pattern of liver injury (1 out of 22 cases was mixed). Eight of the cases were reported to occur after consumption of green tea infusion, whereas most cases were associated with green tea supplements. In seven of the cases, subjects were exposed to Exolise®. Most cases were reported in middle‐aged females, which could be associated with this subpopulation's use of green tea extracts for body weight control. In most of the cases, hepatotoxicity is induced after the ingestion of green tea extracts for a period of at least several weeks up to 8 months although some cases were reported after a shorter period of regular intake (5 days). No fatal cases were associated solely with the use of green tea products and the majority of cases resolved following green tea preparation discontinuation. Although different causality assessment procedures have been applied, temporal relationship and the exclusion of other potential causes of liver injury were appropriately satisfied in the majority of the cases. In addition, positive rechallenge in many cases further supports the role of green tea in liver injury. Based on the current literature review on case reports, it is difficult to draw conclusions concerning the minimal dose of EGCG present in green tea products capable of inducing liver injury. There was a great variability in the ingested daily dose of green tea products with cases of hepatotoxicity being induced at doses exceeding three cups of green tea infusion (Lugg et al., 2015) to cases with exposure up to 1,800 mg green tea extract per day (De Paula et al., 2008) (content of EGCG not stated in these case reports). In 2003, weight loss product Exolise® was withdrawn from the market following a cluster of thirteen cases reporting hepatotoxicity in Spain and France, the recommended daily dose for this product corresponded to 375 mg EGCG. No adverse effects on the liver were observed in rats administered with a dose of Exolise® greatly exceeding the recommended human dose.
The Panel noted that the number of human cases with hepatotoxicity associated with consumption of green tea infusions is extremely low compared to the large number of consumers of green tea infusions. However, in the case reports, both from exposure to green tea extracts and to green tea infusions, more severe hepatotoxicity is reported compared to in the clinical trials, where mild liver effects are discovered early in the clinical monitoring and exposure is discontinued preventing more severe liver injury.
The differences in results between intervention studies with the same doses (> 800 mg EGCG/day) and the low proportion of events of hepatotoxicity after exposure to green tea catechins in humans suggest a difference in susceptibility between individuals and influence of contributing factors. Various contributing risk factors to hepatotoxicity were studied in one randomised double blind, placebo‐controlled trial, including 538 women receiving 843 mg EGCG/day and 537 women receiving placebo for 12 months (Dostal et al., 2015; Yu et al., 2017). The previously suggested risk factors, such as COMT genotype, use of NSAIDs, paracetamol, statins or weekly alcohol consumption did not increase the liver effect of green tea catechins. However, the Panel noted that in this study the liver effects were more pronounced in subjects with high BMI, which is an important finding as green tea extracts are used in food supplements for weight control.
A high interindividual difference in response to green tea catechins was also found in an outbred strain of mice, with 15% of the animals exhibiting severe hepatotoxicity after intraperitoneal injections of EGCG, while the same dose was well tolerated in the rest of the animals (Church et al., 2015). Also, in fasted dogs, only a few of the EGCG‐exposed animals showed serious hepatic toxicity as well as non‐specific toxicity (Isbrucker et al., 2006).
Thus, genetic variability may have a considerable influence on the susceptibility for catechin‐induced hepatotoxicity in both humans and animals. The reasons for individual differences in susceptibility are not known and the Panel considered the liver injury induced by green tea preparations could be in part an idiosyncratic reaction, as has been suggested by Navarro et al. (2017). IDILI is a term used to define those adverse reactions to medications and other xenobiotic substances, including herbal and dietary supplements, which are not clearly related to dose, route, or duration of drug administration. Although not dose related in a strict sense, these reactions largely occur after exposure to drugs and may require either repeated exposure or exceedance of a threshold dose which is highly variable between individuals. The pathogenesis of IDILI is complex and not yet fully understood.
Data from animal experiments demonstrate that liver is a target tissue for green tea catechin toxicity. At high oral bolus doses or parenteral administration, when higher tissue levels can be expected, ALT elevation and liver toxicity occurs with a higher incidence and with more severe effects, than from exposure via peroral administration or via feed. Thus, oral bolus doses of 750 mg EGCG/kg bw (2 daily doses) caused hepatotoxicity in mice. A single intraperitoneal administration of EGCG at 100 mg/kg bw was sufficient to generate an hepatic injury in mice. Fasting is also demonstrated to increase the toxicity of green tea catechins in experimental animals, probably due in part to a higher bioavailability of green tea catechins, which may be due to less binding of catechins to dietary proteins, and reduced hepatic glycogen levels.
When EGCG or green tea extracts were administered orally to experimental animals, liver toxicity was observed in some, but not all studies. In subchronic studies where liver toxicity was observed, the lowest NOAEL for this effect was 242 mg EGCG/kg bw per day in rats administered a green tea extract via oral gavage. Severe toxicity, not only in the gastrointestinal tract but also the liver, was demonstrated in fasted dogs, administered green tea extracts in capsules at doses, which were non‐toxic to fed dogs. The NOAEL in fasted dogs was 40 mg EGCG/kg bw per day, which was 10 times lower than the NOAEL in fed dogs. Based on the liver effects in male and female rats in a chronic study, where a green tea extract was administered by gavage, 5 days/week, a NOAEL of 145 mg EGCG/kg bw per day could be identified (NTP, 2016). In mice, a NOAEL of 48.4 mg EGCG/kg bw per day could be identified based on liver effects in male mice. In contrast, when a green tea catechin mixture was added to the diet to rats, no liver effects were reported with doses up to 838 mg/kg bw per day, the highest dose tested.
The Panel considered results from epidemiological studies investigating a possible association between intake of green tea infusions and liver cancer to be inconclusive. No evidence of carcinogenic activity of green tea extract was found in rats or mice.
Various mechanisms have been proposed mediating the dose‐dependent liver toxicity by green tea catechins. Loss of mitochondrial membrane potential, increased production of reactive oxygen species (ROS) and reduced GSH contents have been demonstrated in rat hepatocytes treated with EGCG (De Oliveira et al., 2016). Catechins can act as both pro‐oxidants and antioxidants depending on the dose (Braicu et al., 2013; Cao et al., 2016). Murakami (2014) suggested that hepatotoxicity of high doses of green tea catechins are due to pro‐oxidative properties at high doses and mediated via formation of EGCG o‐quinone, which reacts with protein thiols to give a product with stress‐generating properties. Furthermore, hepatic toxicity may be induced by high doses of green tea catechins by attenuating expressions of heat shock proteins and anti‐oxidant enzymes, such as superoxide dismutase and heme oxygenase.
Thus, the Panel considered that green tea catechins may cause a dose‐dependent hepatotoxicity, when the concentration is high enough in the target tissue. In rare cases, certain individuals may show a non‐dose related idiosyncratic reaction resulting in liver injury.
The composition of catechin compounds in green tea extracts and infusions has been suggested to influence the hepatotoxicity. However, there are no data available demonstrating an interaction between green tea catechins or an effect of extraction methods on hepatotoxicity of green tea catechins. The Panel noted that different extracts with various compositions of catechins as well as pure EGCG have been used in the clinical trials and in the animal toxicity studies, which makes it difficult to compare effect doses between studies. Even if the EGCG doses can be calculated and used for comparison, other catechins and other components in the green tea preparations may have an impact on the toxicity.
Another factor which has been discussed in connection with the hepatotoxicity of green tea is contamination by PA. The 1,2‐unsaturated PA can be activated by cytochrome P450 enzymes, mainly CYP3A4, to form reactive products, which may act as genotoxic carcinogens in humans. The Panel considered it unlikely that the levels of PA present in green tea could induce non‐neoplastic hepatotoxicity by itself, but it cannot be excluded that contamination by PA in green tea may contribute to the hepatotoxicity of green tea catechins.
In summary, on the basis of the evidence reviewed:
The Panel noted the low number of human cases with hepatotoxicity associated with consumption of green tea infusions and lack of effects on serum transaminases even after a high consumption (more than 5 cups per day) (Inoue et al., 2009).
Non‐fasted bolus doses of 800 mg EGCG/day for 10 days or longer resulted in increased systemic EGCG exposure, which was not as evident when the dose was split into two daily doses of 400 mg EGCG/day.
The Panel considered that exposure to green tea extracts at doses at or above 800 mg EGCG/day for 4 months or longer is associated with elevations of ALT and AST in some subjects (in interventional studies) which may be indicative of liver injury.
From the published case reports, no accurate dose causing hepatotoxicity could be established. However, for a specific product derived from a 80% ethanolic extract (Exolise®) a dose as low as 375 mg EGCG/day was associated with severe liver injury. The Panel considered this was likely due to idiosyncratic reactions
In the intervention studies, no cases of elevated serum transaminases have been reported with green tea extract doses below 800 mg EGCG/day from 2 weeks to 12 months. Although studies using a dose of EGCG below 800 mg/day do not have enough power to detect effects in the percentage range.
The exposure assessment has been carried out for EGCG in green tea infusion and food supplements. For the exposure calculation of EGCG in green tea infusion, data present in the USDA database have been used in association with consumption data for green tea infusion retrieved from the Consumption EFSA Comprehensive European Food Consumption Database. The mean exposure EGCG from brewed green tea ranged from 5.12 mg/day in toddlers to 321 mg/day in adults. The high level exposure (95th percentile) to EGCG ranged from 238 mg/day in adolescents to 866 mg/day in adults.
For the calculation of EGCG in food supplements, the data present in the Mintel database has been considered. According to the Mintel GNPD, green tea is labelled on 203 products between January 2012 and February 2017. The food categories considered were: ‘Digestive & Detoxifying Treatments’, ‘Vitamins & Dietary Supplements’. The concentration of EGCG was also retrieved from this database, when available. Considering only those products where the content of EGCG were clearly stated, the information available were related to only 23 products. The daily consumption in terms of EGCG for each product was calculated multiplying the dose unit of EGCG for the daily number of recommended doses of the product. The daily intake of EGCG for these products ranged from 5 to 1,000 mg/day for adult population. The number of products with daily recommended doses of EGCG below 100 mg was 8, from 100 to 300 mg was 6, from 300 to 800 mg was 6 and above 800 was 3 (one only with 1,000 mg).
The current safety assessment of green tea catechins follows the Guidance on Safety assessment of botanicals and botanical preparations (EFSA Scientific Committee, 2009a,b). According to the guidance, a two‐tiered approach should be followed. Level A is a safety assessment of existing knowledge, which can result in three conclusions: safety concern, no safety concern or need for further data. In the latter case, the safety assessment continues to level B, including a more extensive safety assessment, with a need on additional data to be provided. According to the Guidance, there are circumstances under which no additional data are judged necessary for the safety evaluation and a ‘presumption of safety’ can be made. This could be applied when exposure to the botanical has occurred in large populations for many years without reported adverse effects, provided that the intakes due to intended levels of use are within the range of intake derived from the European Member States′ average diets or from studies on specific sub‐groups (EFSA Scientific Committee, 2009a,b). Green tea has a long term history of food use in Asia and no elevation of mean ALT was recorded among a large group of high consumers of green tea infusion in Japan (Inoue et al. (2009)). The Panel considered that green tea infusions, prepared in a traditional way, would belong to this category of food and thus presumed to be safe. In addition, dried green tea extracts, manufactured using water by the traditional infusion procedure, for the preparation of reconstituted drinks with an equivalent composition to traditional green tea infusions are considered to be safe as well. A few cases of hepatotoxicity have been reported in association with consumption of green tea infusions. The reason for this high sensitivity in a very small proportion of the exposed population is not known, but may be due to an idiosyncratic reaction.
The Panel presumed that different patterns of exposure for the catechins from green tea extracts, either consumed as a beverage or in liquid or dry form as dietary supplements, compared to the intake of traditional green tea infusions. In these food products, the green tea catechins may be more concentrated, and may have a different composition compared to the green tea infusions prepared in a traditional way. Furthermore, the catechins may be taken as a bolus, under fasting or special health conditions, such as overweight, associated with a higher risk for green tea induced hepatotoxicity. Thus, exposure to catechins from these green tea extracts cannot be regarded as safe according to the presumption of safety approach and data from intervention studies show that exposure above 800 mg EGCG/day cause elevated serum transaminases.
As described above, the exposure to EGCG from green tea infusions in the European Member States is approximately 300 mg/day on average and 866 mg/day at the high level exposure and from green tea supplements between 5 and 1,000 mg EGCG/day. The reason for the apparent difference in hepatotoxicity of green tea catechins between green tea infusion and green tea extracts is not known. Possible explanations are differences in concentration and exposure regimen (low concentration extended intake vs high concentrated bolus dose), differences in catechin composition and chemical–physical differences (e.g. lower stability and precipitation of catechins in green tea infusions).
The Panel considered that there were a number of uncertainties regarding green tea catechin exposures, biological and toxicological effects.
The chemical composition of green tea varies widely due to plant variety, growing environment, season, age of leaves and manufacturing conditions with EGCG content ranging from 1,600 to 20,320 mg/100 g dried leaves (13‐fold). With regard to green tea infusions, EGCG content varied over a greater than 88‐fold range (2.3–203 mg/100 g infusion).
Given that EGCG/catechins concentrations in green tea infusions decrease during storage and preparation (at tea‐brewing temperatures), there is uncertainty regarding actual EGCG exposures from green tea infusions based on content in dried leaves.
There remain uncertainties regarding the presence of hepatotoxic contaminants such as PA in green tea preparations.
There remain uncertainties regarding the extent to which manufacturing procedures influence extraction yield and the composition of extracted catechins and other substances used to prepare green tea extracts.
There are additional uncertainties surrounding the proportion of EGCG/catechins that can be absorbed after oral exposure to green tea infusions due to precipitation of EGCG/catechins in infusions during cooling.
Uncertainties persist regarding the effects of dietary proteins on the absorption of EGCG/catechins from both infusions and supplements. Even if EGCG is considered the primary causative hepatotoxic agent in green tea, there are uncertainties to what extent other catechins present would also be causative hepatotoxic agents and/or modulate EGCG hepatotoxicity.
Due to limited dose–response data after daily EGCG exposures up to 800 mg/day there is uncertainty regarding the starting point for the derivation of a health‐based guidance value for EGCG for the general population.
There is an uncertainty whether more serious liver effects may develop after long‐term use of green tea extracts.
There are uncertainties around the mechanism(s) leading to both the dose‐dependent hepatotoxicity of EGCG and the mechanism(s) leading to idiosyncratic hepatotoxicity to EGCG.
5. Conclusion
Catechins from green tea infusion, prepared in a traditional way, and reconstituted drinks with an equivalent composition to traditional green tea infusions, are in general considered to be safe according to the presumption of safety approach (EFSA Scientific Committee, 2009a,b), provided the intake corresponds to reported intakes in European Member States. However, rare cases of liver injury have been reported after consumption of green tea infusions, most probably due to an idiosyncratic reaction.
Based on the available data on the potential adverse effects of green tea catechins on the liver, the Panel concluded that there is evidence from interventional clinical trials that intake of doses equal or above 800 mg EGCG/day taken as a food supplement has been shown to induce a statistically significant increase of serum transaminases in treated subjects compared to control.
Catechins in green tea extracts, either consumed as a beverage or in liquid or dry form as dietary supplements, may be more concentrated, may differ in composition and pattern of consumption compared to catechins from traditional green tea infusions and cannot be regarded as safe according to the presumption of safety approach, as exposure to green tea extracts at and above 800 mg EGCG/day in intervention studies causes elevated serum transaminases which is indicative of liver injury.
The Panel concluded that it was not possible to identify an EGCG dose from green tea extracts that could be considered safe. From the clinical studies reviewed there is no evidence of hepatotoxicity below 800 mg EGCG/day up to 12 months. However, hepatotoxicity was reported for one specific product containing 80% ethanolic extract at a daily dose corresponding to 375 mg EGCG.
The Panel noted that the level of 800 mg EGCG/day is outside the range of the mean daily intake of EGCG (90–300 mg/day) resulting from the consumption of green tea infusions in the EU, however this level of exposure falls within the upper range (300–866 mg/day) of exposure by high‐level consumers of green tea infusions in the EU in the adult population. The Panel recognised that it is plausible that the kinetics as well as the toxicity of green tea catechins could be modified by the matrix in which they are present.
6. Recommendations
The Panel recommended that studies should be performed to determine a dose–response of hepatotoxicity of green tea catechins and examine inter and intra species variability.
Maximum limits for pyrrolizidine alkaloids in green tea preparations, including food supplements should be established, since they may contribute to hepatotoxicity.
Labels of green tea products (with particular reference to food supplements) should include content of catechins and the proportion of EGCG.
Documentation provided to EFSA
Opinion on green tea extracts and green tea infusion. April 2015. Submitted by Technical University of Denmark (DTU).
Safety assessment on levels of (‐)‐epigallocatechin‐3‐gallate (EGCG) in green tea extracts used in food supplements. November 2015. Submitted by the Norwegian Institute of Public Health.
Institut fur Toxicologie, Universitat Wurzburg, June 2017. Response to EFSA request for scientific information as regards the use of green tea catechins.
FSE (Food Supplements Europe), June 2017. Response to EFSA request for scientific information as regards the use of green tea catechins.
THIE (Tea and Herbal Infusions Europe), June 2017. Response to EFSA request for scientific information as regards the use of green tea catechins.
Abbreviations
- ADI
acceptable daily intake
- ADME
Absorption, distribution, metabolism and excretion
- ALP
alkaline phosphatase
- ALT
alanine aminotransferase
- AND
antinuclear antibodies
- ANSES
French Agency for Food, Environment and Occupation Health and Safety
- ASMA
antismooth muscle antibodies
- ASP
aspartate aminotransferase
- AST
aspartate aminotransferase
- AUC
area under the curve
- BID
twice per day (bis in die)
- BMDL10
dose lower confidence limit for 10%
- BMI
body mass index
- BUN
blood urea nitrogen
- bw
body weight
- C
(+)‐catechin
- CAS
Chemical Abstracts Service
- CG
(+)‐catechin‐3‐gallate
- CI
confidence interval
- COMT
catechol‐O‐methyltransferase
- CSFII
Continuous Survey of Food Intakes by Individuals
- DILI
drug‐induced liver injury
- EC
(–)‐epicatechin
- ECG
(‐)‐epicatechin‐3‐gallate
- EFSA ANS Panel
Panel on Food Additives and Nutrient Sources Added to Food
- EFSA NDA Panel
Panel on Dietetic Products, Nutrition and Allergies
- EGC
(–)‐epigallocatechin
- EGCG
(–)‐epigallocatechin‐3‐gallate
- EMA
European Medicines Agency
- ESCO
EFSA Scientific Cooperation
- FCS
food categorisation system
- GC
(+)‐gallocatechin
- GCG
(–)‐gallocatechin‐3‐gallate
- GC–MS
gas chromatography–mass spectrometry
- GGT
gamma‐glutamyl transferase
- GNPD
Global New Products Database
- GTC
green tea catechin
- GTE
green tea extract
- GTP
glutamyl transpeptidase
- HCC
hepatocellular carcinoma
- HPLC/MS
high performance liquid chromatography/mass spectrometry
- HPV
Human papillomavirus
- HR
hazard ratio
- HVOD
hepatic veno‐occlusive disease
- IARC
International Agency for Research on Cancer
- IDILI
idiosyncratic drug‐induced liver injury
- ISO
International Organization for Standardization
- IUPAC
International Union of Pure and Applied Chemistry
- LC–MS/MS
liquid chromatography with tandem mass spectrometry
- LC–MS
liquid chromatography–mass spectrometry
- LD50
lethal dose, median
- LLOQ
lower limit of quantification
- LOD
limit of detection
- LOQ
limit of quantification
- LSM
liver stiffness measurement
- MOE
margin of exposure
- MOS
margin of safety
- MRT
Mean Residence Time
- NAFLD
non‐alcoholic fatty liver disease
- NASH
non‐alcoholic steatohepatitis
- NCI CTCAE
National Cancer Institute Common Terminology Criteria for Adverse Events
- NIH
National Institutes of Health
- NOAEL
no observed adverse effect level
- NSAIDs
non‐steroidal anti‐inflammatory drug
- OECD
Organisation for Economic Co‐operation and Development
- OR
odds ratio
- PAH
polycyclic aromatic hydrocarbon
- PA
pyrrolizidine alkaloids
- RELIS
Regional Medicines Information and Pharmacovigilance Center in Norway
- ROS
reactive oxygen species
- SID
once per day (singular in die)
- SNP
single nucleotide polymorphism
- TID
three times per day (tris in die)
- ULN
upper limits of normal
- US FDA
United States Food and Drug Administration
- USDA
United States Department of Agriculture
- USP
United States Pharmacopeia
Appendix A – EGCG content of selected foods (mg/100 g edible portion) (USDA, 2014)
1.
| Food | Mean mg/100 g (number of samples) | Standard error | Range | |
|---|---|---|---|---|
| Min | Max | |||
| Carob flour (Ceratonia siliqua) | 109.46 (3) | 109.46 | 109.46 | |
| Tea, green, brewed | 70.20 (100) | 4.08 | 2.31 | 203.20 |
| Tea, green, large leaf, Quingmao, brewed | 68.20 (2) | 3.00 | 65.20 | 71.20 |
| Tea, white, brewed | 42.45 (6) | 15.47 | 38.90 | 46.00 |
| Tea, oolong, brewed | 34.48 (16) | 4.76 | 7.36 | 71.10 |
| Tea, green, brewed, decaffeinated | 26.05 (2) | 0.69 | 25.36 | 26.73 |
| Tea, green, brewed, flavoured | 19.97 (5) | 3.05 | 12.77 | 29.78 |
| Pears, raw (Pyrus communis) | 10.17 (28) | 0.12 | 0.00 | 2.52 |
| Tea, black, brewed, prepared with tap water | 9.36 (94) | 0.46 | 0.68 | 40.66 |
| Tea, fruit flavoured, brewed | 4.15 (6) | 0.42 | 3.30 | 6.10 |
| Tea, green, ready‐to‐drink | 3.96 (2) | 0.40 | 3.56 | 4.35 |
| Nuts, pecans (Carya illinoinensis) | 2.30 (7) | 0.46 | 0.00 | 3.46 |
| Apples, Fuji, raw, with skin | 1.93 (4) | 1.45 | 0.08 | 6.26 |
| Nuts, hazelnuts or filberts (Corylus spp.) | 1.06 (5) | 0.46 | 0.00 | 2.26 |
| Tea, black, brewed, prepared with tap water, decaffeinated | 1.01 (4) | 0.48 | 0.49 | 2.45 |
| Cranberries, raw (Vaccinium macrocarpon) | 0.97 (8) | 0.48 | 0.00 | 2.86 |
| Tea, instant, unsweetened, powder, prepared | 0.86 (3) | 0.80 | 0.00 | 2.46 |
| Blackberries, raw (Rubus spp.) | 0.68 (11) | 0.68 | 0.00 | 7.44 |
| Tea, instant, sweetened with sugar, plain and flavoured, prepared | 0.55 (8) | 0.14 | 0.00 | 1.10 |
| Raspberries, raw (Rubus spp.) | 0.54 (10) | 0.54 | 0.00 | 5.35 |
| Tea, black, ready‐to‐drink, plain and flavoured | 0.51 (17) | 0.19 | 0.00 | 3.11 |
| Tea, instant, decaffeinated, prepared | 0.49 (4) | 0.49 | 0.00 | 1.98 |
| Plums, black diamond, with peel, raw | 0.48 (2) | 0.48 | 0.00 | 0.97 |
| Apples, Red Delicious, raw, without skin | 0.46 (2) | 0.02 | 0.43 | 0.48 |
| Plums, raw (Prunus spp.) | 0.40 (14) | 0.21 | 0.00 | 2.47 |
| Nuts, pistachio nuts, raw (Pistacia vera) | 0.40 (7) | 0.40 | 0.00 | 2.83 |
| Peaches, raw (Prunus persica) | 0.30 (14) | 0.16 | 0.00 | 2.01 |
| Apples, Granny Smith, raw, with skin | 0.24 (7) | 0.09 | 0.00 | 0.52 |
| Apples, raw, with skin (Malus domestica) | 0.19 (59) | 0.11 | 0.00 | 6.26 |
| Apples, Golden Delicious, raw, with skin | 0.19 (4) | 0.11 | 0.00 | 0.40 |
| Avocados, raw, all commercial varieties (Persea americana) | 0.15 (14) | 0.10 | 0.00 | 1.10 |
| Apples, Red Delicious, raw, with skin | 0.13 (7) | 0.09 | 0.00 | 0.65 |
| Tea, black, ready‐to‐drink, diet, plain and flavoured | 0.12 (6) | 0.11 | 0.00 | 0.68 |
| Strawberries, raw (Fragaria X ananassa) | 0.11 (13) | 0.07 | 0.00 | 0.73 |
| Apples, Gala, raw, with skin | 0.11 (3) | 0.11 | 0.00 | 0.33 |
| Kiwifruit, green, raw (Actinidia deliciosa) | 0.09 (12) | 0.09 | 0.00 | 1.11 |
| Onions, sweet, raw (Allium cepa) | 0.08 (5) | 0.08 | 0.00 | 0.41 |
| Apples, raw, without skin (Malus domestica) | 0.03 (31) | 0.02 | 0.00 | 0.48 |
Appendix B – Summary of the case reports and case‐series in which green tea preparation was the exclusive causative agent (as claimed by the authors)
1.
| Year | Author | No. of cases | Gender | Age | Presenting symptoms | Daily green tea dose | Duration of treatment/time to onset | Co‐medications | Alcoholism | Liver enzymes at onset | Pattern of Injury | Abdominal echography | Serology | Autoimmune Hep | Recovery/time to recovery | Re‐exposure | DILI causality assessment scales |
|---|---|---|---|---|---|---|---|---|---|---|---|---|---|---|---|---|---|
| 2001 | Seddik et al. | 1 | Female | 50 | Jaundice, headache, abdominal pain and nausea | 4 capsules (Exolise) | 41 days/41 days | Baclofen and tetrazepam started 1 day after appearance of symptoms | NA | ALT‐N: 40; AST‐N: 31; GGT‐N: 5,8; ALP‐N: 1,5; TB: 7,54 mg/dL | HC | Normal | HAV, HBV, HCV, CMV, EBV, HSV negative | ANA: 1/40; ASMA and AMA negative | Yes/60 days | No | No |
| 2003 | Vial et al. | 1 | Female | 46 | Jaundice, pruritus, dark urine, discoloured stools and asthenia | 4 capsules (Exolise) | 11 weeks/11 weeks | ‐ Levothyroxine, benfluorex and chromocarbe diéthylamine started many years ago ‐ Two years of haemeopathic treatment with Phapax. ‐ Bioptimum Stress (Mg and Multivitamins) | No | ALT‐N: 75; AST‐N: 61; GGT‐N: 8,5; ALP‐N: 2; TB: 29.7 mg/dL | HC | Normal | HAV IgM, HBsAg, Anti‐HCV, RNA HCV, EBV IgM, CMV IgM ‐ Negative | ANA: 1/80; ASMA: 1/80; AMA: 1/40 | Yes/60 days | Yes | No |
| 2003 | Pedros et al. | 4 | Female | 35 | NA | 750 mg (Exolise) | NA/35 days | None | NA | ALT: 1558; AST: 976; ALP: 340; GGT: 162; TB: 18.9 | HC | NA | Negative (no details provided) | Negative (no details provided) | Yes/NA | No | No |
| Female | 34 | Jaundice | NA (Exolise) | NA/several weeks | Moxifloxacine 400 mg/day (no dates provided) | NA | NA | HC | NA | NA | NA | NA | No | No | |||
| Female | 69 | NA | 750 mg (Exolise) | NA/35 days | None | NA | ALT‐N: 4; AST‐N: 3; GGT‐N: 10; ALP‐N: 10 | HC | Biliary lithiasis | Negative (no details provided) | NA | Yes/NA | No | No | |||
| Female | 29 | NA | 1,500 mg (Exolise) | NA/45 days | None | NA | ALT: 1674; AST: 1023; GGT: 65; ALP: 260; TB: 18 | HC | NA | Negative (no details provided) | NA | Yes/NA | No | No | |||
| 2005 | Abu el Wafa et al. | 1 | Female | 35 | Jaundice and asthenia | 1,500 mg (Exolise) | 10 days/10 days | None | No | ALT: 2885; AST: 1191; ALP: 182; TB: 19,47 | HC | Normal | HAV, HBV, HCV, CMV, EBV, HSV negative | ANA; ASMA and anti‐LKM negative | Yes/60 days | No | No |
| 2008 | Prieto de Paula et al. | 1 | Female | 55 | Jaundice, choluria and hypocholia | 1,800 mg | 45/45 days | Simvastatin since 4 years | NA | ALT: 2130; AST: 1970; ALP: 403; GGT: 563; TB: 13,3 | Mixed | Normal | Hep A, B, C; HIV; CMV; EBV; HSV 1, 2 negative | ANA, ASMA, anti‐LKM negative | Yes/45 days | No | CIOMS (highly probable) |
| 2009 | Mazzanti et al. | 1 | Female | 81 | Jaundice, asthenia, pale feces, dark urine, nausea and vomiting | 1 tablet of Epinerve | 1 month/1 month | Simvastatin, butizide and potassium canrenoate for several years | NA | ALT: 2368, AST: 1996; TB: 21.8 | HC | Normal | NA | NA | Yes/120 days | No | CIOMS (Possible) |
| 2013 | Gallo et al. | 1 | Female | 42 | Jaundice | 1,000 mg (powder) | 10 days/10 days | ‐ irbesartan since several years ‐ gestodene and 18‐alpha‐ethinyl estradiol since several years | NA | ALT: 1618; AST: 1447; ALP: 115; GGT: 158; TB: 31 | HC | NA | HAV, HBV, HCV, CMV, EBV, HSV, HIV negative | ANA: 1/160; AMA, ASMA, anti‐LKM, anti‐Sp100, anti‐gp210, anti‐LC1, anti‐SLA) negative | Yes/60 days | No | No |
| 2014 | Pillukat et al. | 1 | Female | 63 | Jaundice, pruritus, discolouration of stool and urine | 725 mg (1 capsule) | 44 days/49 days | ‐ Anastrazole since 2006, ramipril since 2008, oxybutynin since 15 years, vitamin D3 since 2010 | No | ALT: 2101; AST: 1779; ALP: 209; GGT: 150; TB: 14,4 | HC | Normal | HAV, HBV, HCV, HDV, HEV CMV, EBV negative | ANA, ASMA, AMA negative | Resolution/around 60 days – no exact date | No | CIOMS (Probable)Naranjo (Possible) |
ALP: alkaline phosphatase; ALT: alanine transaminase; AST: aspartate transaminase; GGT: γ‐glutamyl transferase; TB: total bilirubin; HAV: hepatitis A virus; HBV: hepatitis B virus; HC: hepatocellular; HCV: hepatitis C virus; CMV: Cytomegalovirus; EBV: Epstein‐Barr virus; HSV: herpes simplex virus; AMA: antimitochondrial antibodies; ANA: antinuclear antibodies; ASMA: antismooth muscle antibodies; IgM: immunoglobulin M; anti‐LKM: anti‐liver kidney microsomal antibodies; anti‐gp210: anti‐glycoprotein‐210 antibodies; anti‐LC1: antibody to liver cytosol; anti‐SLA: antisoluble liver antigen; HDV: hepatitis D virus; HEV: hepatitis E virus; NA: not available.
Appendix C – Summary of the case reports and case‐series in which hepatotoxicity was claimed to be induced by green tea combined with other ingredients
1.
| Year | Author | No. of cases | Exposure |
|---|---|---|---|
| 2002 | Thiolet et al. | 1 | Green tea, Oolong tea, C. angustifolia |
| 2003 | Bajaj et al. | 1 | Green tea extracts, caffeine, A. vulgaris, O. europaea, C. cyminum, V. myrtillus |
| 2003 | Kanda et al. | 1 | Green tea, Gynostemma pentaphyllum, Nelumbo sp. and Be‐petite |
| 2003 | Kanda et al. | 1 | Green tea, Gynostemmma pentaphyllum, barbaloin, polyphenol, saponin (Ohnshidou‐genbikounou) |
| 2004 | Lau et al. | 1 | Green tea, Aloe sp., Gynostemma pentaphyllum, Crataegu ssp., Rhaphanus sativus, N‐nitroso‐fenfluramine |
| 2004 | Peyrin‐Biroulet et al. | 1 | Green tea hydroalcoholic extract, Cassia sp |
| 2004 | Garcia‐Moran | 1 | Camellia sinensis and Orthosiphon stamineus |
| 2005 | Mathieu et al. | 1 | Green tea, C. aurantium, C. paradisi, Cynara scolymus, Petrosileum sativum |
| 2005 | Stevens et al. | 2 | Green tea extracts, caffeine, A. vulgaris, O. europaea, C. cyminum, V. myrtillus |
| 2005 | Porcel et al. | 1 | GT leaves, Ananas sativus maltodextrin, magnesium stearate, silicium dioxide, citric acid |
| 2005 | Gloro et al. | 1 | Red fruit juice, fructose, inulin, acerola, Camillia sinensis, anhydrous colloidal silica, magnesium stearic acid, hypromellosa, titanium dioxide and yellow iron oxide, beta‐carotene, lemon extract rich in bioflavonoids, vitamins C and E, pantothenic acid, sorbic acid and potassium benzoic acid, prednisolone, nicergoline and piribedil |
| 2006 | Bonkovsky et al. | 1 | Green tea extract, Magnolia officinalis, Epimedium koreanum, Lagerstroemia speciosa, calcium, chromium, l‐Theanine, b‐sistosterol, vanadium |
| 2006 | Martinez‐Sierra | 1 | Green tea, Menta piperita infusion |
| 2006 | Molinari et al. | 1 | Green tea extracts, vitamin E, wheat germ oil, soy oil, beeswax, glycerolesters of fatty esters |
| 2007 | Bjornsson and Olsson | 5 | Camellia sinensis, Betula alba, Ilex paraguariensis |
| 2009 | Shim and Saab | 1 | Green tea extracts, caffeine, A. vulgaris, O. europaea, C. cyminum, V. myrtillus |
| 2009 | Bergman and Schjott | 1 | Lotus arabicus, Citrus aurentium, Camellia sinensis, Fraxinus excelsior, Betula pendula and chrome |
| 2009 | Verhelst et al. | 1 | Green Tea and Grape Seed Polyphenols, Taurine, Zinc |
| 2009 | McDonnell et al. | 1 | Green tea extracts, Garcinia cambogia, Gymnema sylvestre, chromium chelate, chitosan, calcium, l‐carnitine fumarate, magnesium chelate, white kidney bean, conjugated linoleic acid |
| 2010 | Sharma et al. | 1 | Green tea extracts, caffeine, A. vulgaris, O. europaea, C. cyminum, V. myrtillus |
| 2010 | Chen et al. | 1 | Green tea extracts, caffeine, A. vulgaris, O. europaea, C. cyminum, V. myrtillus |
| 2010 | Kessenich et al. | 1 | Green tea, multivitamins, Vitamin C and Vitamin D |
| 2011 | Radha Krishna et al. | 1 | Green tea extract Vitamin E, propionyl‐l‐carnitine, usnic acid, guggulsterones Z and E, c‐AMP |
| 2012 | Jimenez‐Encarnacion et al. | 1 | Green tea, acai berry, mangosteen, Aloe vera, resveratrol, curcumin, black seed (Nigella sativa), blueberry, pomegranate, noni (Morinda citrifolia), goji berry |
| 2012 | Weinstein et al. | 1 | Green tea extracts, Rhodiola rosea, Vitex agnus castus, Juniperus communis, Glycine max, Panax ginseng, Polygonum cuspidatum, Fucus vesiculosus, Taraxacum officinale, Ilex paraguaiensis, Arctostaphylos uva‐ursi, l‐theanine, caffeine, vitamins D, K, B6 and B12, folate, calcium |
| 2013 | Patel et al. | 1 | Green tea, caffeine, eleuthero, holy basil, mate, schisandra, ginseng, bilberry, Vaccinium angustifolium, european elder, grape skin, pomegranate |
| 2014 | Fernandez et al. | 3 | Green tea extracts, grape seeds cathechins, taurine, zinc gluconate |
| 2014 | Dela Cruz et al. | 1 | Green tea extracts, caffeine, geranium flower, cocoa powder, chromium, spirulina, Vitamin B6 |
| 2014 | Whitsett | 1 | Green tea extract, Rhodiola rosea, Vitex agnus castus, Juniperus communis, Glycine max, Panax ginseng, Polygonum cuspidatum, Fucus vesiculosus, Taraxacum officinale, Ilex paraguaiensis, Arctostaphylos uva‐ursi, l‐theanine, caffeine, vitamins D, K, B6 and B12, folate, calcium |
Summary of the case reports and case‐series in which green tea infusion was the exclusive causative agent (as claimed by the authors)
| Year | Author | No. of cases | Gender | Age | Presenting symptoms | Daily green tea dose | Duration of treatment/time to onset | Co‐medications | Alcoholism | Liver enzymes at onset | Pattern of Injury | Abdominal echography | Serology | Autoimmune hep | Recovery/Time to recovery | Re‐exposure | DILI causality assessment Scales |
|---|---|---|---|---|---|---|---|---|---|---|---|---|---|---|---|---|---|
| 2006 | Jimenez‐Saenz and Martinez Sanchez | 1 | Male | 45 | Jaundice and asthenia | 6 cups | Slightly more than 4 months/4 months | None | NA | ALT: 1613; AST: 1033; ALP: 310; GGT: 384; TB: 6,96 | HC | Normal | HAV IgM, anti‐HBc IgM, HbsAg, Anti‐HCV were negative | ANA; ASMA; AMA and anti‐LKM negative | Yes/60 days | No | CIOMS (highly probable) |
| 2007 | Federico et al. | 1 | Female | 51 | Asymptomatic | NA | 5 years during which LFTs were persistently elevated | Oestrogen and Progesterone 4 years ago. Stopped and no improvement | NA | Aminotransferases (four‐ to fivefold); ALP: 200 | HC | NA | NA | NA | Yes/60 days | Yes | No |
| 2009 | Amariles et al. | 1 | Female | 43 | Abdominal pain, nausea, vomiting, fever and urine discolouration | NA | 8 months/8 months | None | NA | ALT: 891; AST: 1098; ALP: 100; GGT: 938; TB: 2,09 | HC | NA | Hep B and C negative | ANA, ASMA, anti‐LKM negative | Improved but no details about time to recovery | No | No |
| 2011 | Rohde et al. | 1 | Female | 55 | Asthenia | 4‐6 cups | 6 months/6 months | Levothyroxine | No | ALT: 941; AST: 671; ALP: 186; LDH: 503; Ferritin: 1409; | HC | NA | ANA, ASMA negative | 2 weeks | No | No | |
| 2014 | Lorenzo‐Almoros et al. | 1 | Female | 39 | Epigastric pain, arthralgia, fever, constipation, and nausea | 3 L (dose unknown) | 20 days/30 days | None | No | ALT: 195; AST: 166; ALP: 492; GGT: 658; TB: 3,8 | Cholestatic | Mild hepatic steatosis | HAV, HBV, HCV, CMV, HEV, CMV, EBV, and HIV negative | ANA, ASMA, AMA, anti‐LKM negative | Yes/16 days | No | CIOMS (Probable) |
| 2014 | Arzenton | 1 | Female | 62 | Abdominal pain and nausea | Cup or two (dose unknown) | 270 days/210 days | None | No | ALT: 621; ALP: 114; GGT: 110 | HC | Normal | HBV and HCV negative | ANA, ENA, ASMA, AMA, LKM negative | Yes/120 days | No | No |
| 2015 | Lugg et al. | 1 | Female | 16 | Nausea, arthralgia, jaundice and abdominal pain | Over 3 cups (dose unknown) | 90 days/NA | Amoxicillin for a suspected UTI (two doses were taken) | No | ALT: 4371; ALP: 84; TB: 11,58 | HC | Normal | HAV, HBV, HCV, CMV and parvovirus negative | ANA, AMA, and anti‐LKM negative, ASMA 1/40 | Yes/60 days | No | CIOMS (Probable) |
Summary of the case reports and case‐series in which Green tea was the exclusive causative agent (as claimed by the authors) (information about preparation was not available)
| Year | Author | No. of cases | Gender | Age | Presenting symptoms | Daily green tea dose | Duration of treatment/time to onset | Co‐medications | Alcoholism | Liver enzymes at onset | Pattern of Injury | Abdominal Echography | Serology | Autoimmune Hep | Recovery/Time to recovery | Re‐exposure | DILI Causality assessment Scales |
|---|---|---|---|---|---|---|---|---|---|---|---|---|---|---|---|---|---|
| 2006 | Javaid and Bonkovsky | 1 | Female | 46 | Jaundice | NA | 7 months/7 months | NA | NA | ALT: 1100; AST: 1188; ALP: 194; TB: 12.3 | HC | NA | NA | NA | NA | No | No |
| 2008 | Garcia Cortes et al. | 3 | Female | 23 | Jaundice | NA | 21/19 days | NA | No | ALT‐N: 56,9; GGT‐N: 0,9; ALP‐N: 0,88; TB: 11,5 | HC | Normal | HAV, HBV and HCV | ANA; ASMA; AMA and anti‐LKM negative | Yes/120 days | Yes | CIOMS (highly probable) |
| Female | 27 | Jaundice | NA | 17/5 days | NA | No | ALT‐N: 83,5; GGT‐N: 4,5; ALP‐N: 1,67; TB: 11,4 | HC | Normal | HAV, HBV and HCV | ANA; ASMA; AMA and anti‐LKM negative | Yes/45 days | No | CIOMS (highly probable) | |||
| Female | 26 | Jaundice | NA | 121/121 days | NA | No | ALT‐N: 46,4; GGT‐N: 2,8; ALP‐N: 1,1; TB: 16,6 | HC | Normal | HAV, HBV and HCV | ANA: 1/40 | Chronic | Yes | CIOMS (highly probable) |
ALP: alkaline phosphatase; ALT: alanine transaminase; AMA: antimitochondrial antibodies; ANA: antinuclear antibodies; anti‐gp210: anti‐glycoprotein‐210 antibodies; anti‐LC1: antibody to liver cytosol; anti‐LKM: anti‐liver kidney microsomal antibodies; anti‐SLA: anti‐soluble liver antigen; ASMA: anti‐smooth muscle antibodies; AST: aspartate transaminase; CMV: Cytomegalovirus; EBV: Epstein‐Barr virus; ENA: extractable nuclear antigens; GGT: γ‐glutamyl transferase; HAV: hepatitis A virus; HBV: hepatitis B virus; HC: hepatocellular; HCV: hepatitis C virus; HDV: hepatitis D virus; HEV: hepatitis E virus; HIV: human immunodeficiency virus; HSV: herpes Simplex virus; mg: milligrams; NA: Not available; TB: total bilirubin.
Appendix D – NTP 90‐day subchronic studies in rats (F344/NTac) – selected endpoints
1.
Groups of 10 male and 10 female rats were administered 0, 62.5, 125, 250, 500 or 1,000 mg green tea extract/kg bw per day in by oral gavage in deionised water 5 days per week, for 14 weeks. Control animals received deionised water (5 mL/kg bw for rats; 10 mL/kg bw for mice).
Blood sampling was made on day 4, day 23 and at termination.
Clinical chemistry and haematology has been completed for the rat study.
| Dose | Survival | Final body weight | % rel to control | Non‐neoplastic lesions of the liver incidence(a) | Liver organ weight | Liver weight (rel to bw) | Liver depletion of glycogen | Liver karyomegaly | Liver mitosis | Liver pigmentation | Liver centrilobular necrosis | Serum ALT (@week 14) | Serum ALP (@week 14) | Serum bile salts (@week 14) | Serum urea nitrogen |
|---|---|---|---|---|---|---|---|---|---|---|---|---|---|---|---|
| Male | X | X | X | X | X | X see also g2 | X | X | X | X | X | X | X | X | |
| 0 | 10/10 | 340 ± 4 | – | Nd | 12.61 ± 0.30 | 37.128 ± 0.659 | Nd | Nd | Nd | Nd | Nd | 70 ± 4 | 243 ± 4 | 8.7 ± 1.9 | 15.1 ± 0.7 |
| 62.5 | 10/10 | 330 ± 4 | 97 | Nd | 12.13 ± 0.025 | 36.761 ± 0.500 | Nd | Nd | Nd | Nd | Nd | 81 ± 7 | 245 ± 6 | 7.8 ± 1.2 | 15.2 ± 0.6 |
| 125 | 10/10 | 330 ± 4 | 97 | Nd | 12.141 ± 0.23 | 36.865 ± 0.682 | Nd | Nd | Nd | Nd | Nd | 73 ± 5 | 236 ± 5 | 8.6 ± 1.1 | 15.2 ± 0.6 |
| 250 | 10/10 | 318 ± 4** | 94 | Nd | 11.251 ± 0.23** | 35.369 ± 0.489 | Nd | Nd | Nd | Nd | Nd | 62 ± 1 | 230 ± 4 | 13.6 ± 1.8** | 13.2 ± 0.6 |
| 500 | 10/10 | 302 ± 5** | 89 | Nd | 10.681 ± 0.30** | 35.365 ± 0.609 | Nd | Nd | Nd | Nd | Nd | 59 ± 2 | 202 ± 5** | 14.3 ± 1.7* | 15.2 ± 0.7 |
| 1,000 | 10/10 | 293 ± 4** | 86 | Nd | 11.061 ± 0.27** | 37.751 ± 0.771 | Nd | Nd | Nd | Nd | Nd | 75 ± 2 | 215 ± 11** | 44.3 ± 6.6** | 15.1 ± 0.9 |
| Female | |||||||||||||||
| 0 | 10/10 | 188 ± 2 | – | 0/10 | 6.57 ± 0.014 | 34.930 ± 0.604 | Nd | Nd | Nd | Nd | Nd | 54 ± 3 | 209 ± 3 | 9.4 ± 1.3 | 13.6 ± 0.5 |
| 62.5 | 10/10 | 184 ± 3 | 98 | 0/10 | 6.30 ± 0.015 | 34.257 ± 0.557 | Nd | Nd | Nd | Nd | Nd | 58 ± 3 | 217 ± 8 | 10.2 ± 1.7 | 14.9 ± 0.6 |
| 125 | 9/10 | 184 ± 3 | 98 | 0/10 | 6.37 ± 0.013 | 34.665 ± 0.618 | Nd | Nd | Nd | Nd | Nd | 49 ± 3 | 196 ± 3 | 9.7 ± 0.8 | 14.6 ± 0.3 |
| 250 | 10/10 | 176 ± 2* | 93 | 0/10 | 5.95 ± 0.015* | 33.786 ± 0.758 | Nd | Nd | Nd | Nd | Nd | 56 ± 3 | 202 ± 6 | 14.8 ± 2.7 | 13.8 ± 0.6 |
| 500 | 10/10 | 179 ± 4* | 95 | 0/10 | 6.26 ± 0.016 | 35.041 ± 0.629 | Nd | Nd | Nd | Nd | Nd | 53 ± 3 | 199 ± 3 | 17.9 ± 3.2* | 11.1 ± 0.8 |
| 1,000 | 10/10 | 176 ± 3** | 93 | 1‐3/10 | 6.53 ± 0.014 | 37.232 ± 0.554* | Nd | Nd | Nd | Nd | Nd | 837 ± 772 | 228 ± 9 | 46.3 ± 26.2** | 14.2 ± 1.2 |
* p ≤ 0.05; **: p ≤ 0.01.
Chronic inflammation, mitosis, bile duct hyperplasia, hepatocyte necrosis, oval cell hyperplasia, periportal hypertrophy.
Appendix E – NTP 90‐day subchronic studies in mice (B6C3F1/N) – selected endpoints
1.
Groups of 10 male and 10 female mice were administered 0, 62.5, 125, 250, 500 or 1,000 mg green tea extract/kg bw per day in by oral gavage in deionised water 5 days per week, for 14 weeks. Control animals received deionised water (5 mL/kg bw for rats; 10 mL/kg bw for mice).
Blood sampling was made on day 4, day 23 and at termination.
Clinical chemistry and haematology has been completed for the rat study.
| Dose | Survival | Final body weight | % rel to control | Non‐neoplastic lesions of the liver incidence(a) | Liver organ weight | Liver weight (rel to bw) | Liver depletion of glycogen | Liver karyomegaly | Liver mitosis | Liver pigmentation | Liver centrilobular necrosis | Serum ALT (@week 14) | Serum ALP (@week 14) | Serum bile salts (@week 14) | Serum urea nitrogen |
|---|---|---|---|---|---|---|---|---|---|---|---|---|---|---|---|
| Male | X | X | X | X | X | X | X | X | X | X | X | X | X | X | |
| 0 | 10/10 | 40.7 ± 1.0 | – | 1.79 ± 0.06 | 43.913 ± 0.537 | 2 | 0 | 0 | 0 | 0 | |||||
| 62.5 | 10/10 | 38.5 ± 1.1 | 95 | 1.74 ± 0.06 | 45.215 ± 0.723 | 0 | 0 | 0 | 0 | 0 | |||||
| 125 | 10/10 | 39.4 ± 1.0 | 97 | 1.66 ± 0.07 | 42.085 ± .909 | 2 | 0 | 0 | 0 | 2 | |||||
| 250 | 10/10 | 35.4 ± 0.9** | 87 | 1.46 ± 0.05** | 41.215 ± 0.536 | 8* | 0 | 0 | 0 | 0 | |||||
| 500 | 10/10 | 34.1 ± 0.9** | 84 | 1.49 ± 0.05** | 43.595 ± 0.757 | 10** | 0 | 0 | 0 | 0 | |||||
| 1,000 | 4/10 | 30.8 ± 0.9** | 76 | 1.51 ± 0.09** | 48.868 ± 1.938** | 4 | 2 | 3 | 2 | 8** | |||||
| Female | |||||||||||||||
| 0 | 10/10 | 30.4 ± 0.6 | – | 1.23 ± 0.03 | 40.493 ± 0.710 | 0 | 0 | 0 | 0 | 0 | |||||
| 62.5 | 10/10 | 32.9 ± 1.1 | 92 | 1.39 ± 0.04** | 42.256 ± 0.415 | 0 | 0 | 0 | 0 | 0 | |||||
| 125 | 10/10 | 26.6 ± 0.7** | 88 | 1.15 ± 0.04 | 43.110 ± 0.447 | 0 | 0 | 0 | 0 | 0 | |||||
| 250 | 10/10 | 26.8 ± 0.7** | 88 | 1.09 ± 0.03* | 40.712 ± 0.973 | 1 | 0 | 0 | 0 | 0 | |||||
| 500 | 10/10 | 24.3 ± 0.4** | 80 | 1.04 ± 0.03** | 42.658 ± 0.753* | 4* | 0 | 0 | 0 | 0 | |||||
| 1,000 | 6/10 | 26.2 ± 0.3** | 86 | 1.36 ± .03 | 52.036 ± 1.236** | 7** | 5* | 2 | 2 | 7** | |||||
* p ≤ 0.05; **: p ≤ 0.01.
Chronic inflammation, mitosis, bile duct hyperplasia, hepatocyte necrosis, oval cell hyperplasia, periportal hypertrophy.
Appendix F – NTP 2 year studies in Wistar Han Rats – selected endpoints
1.
Groups of 60 male and 60 female rats were administered 0 or 1,000 mg green tea extract/kg bw per day and 50 male and 50 female rats were administered 100 or 300 mg green tea extract/kg bw per day by oral gavage in deionised water 5 days per week, for up to 105 weeks. Control animals received deionised water (5 mL/kg bw for rats; 10 mL/kg bw for mice). Note 10 animals from control and 1,000 mg/kg bw per day groups were randomly selected for analyses at 3 months.
| Dose | Survival (summary table p10) | Body weight changes (summary table p10) | Non‐neoplastic lesions of the liver incidence(a) (Table A3/B3) |
|---|---|---|---|
| Male | |||
| 0 | 33/50 | – | 1/50 |
| 100 | 37/50 | – | 2/50 |
| 300 | 43/50 | At least 10% less by wk 41 | 2/50 |
| 1,000 | 24/50 | At least 10% less by wk 9 | 13/50 |
| Female | |||
| 0 | 26/50 | – | 3/50 |
| 100 | 28/50 | At least 10% less by wk 65 | 2/48 |
| 300 | 23/50 | At least 10% less by wk 61 | 5/49 |
| 1,000 | 4/50 | At least 10% less by wk 57 | 24/46 |
Necrosis.
Appendix G – NTP2 year study in mice (B6C3F1/N) – selected endpoints
1.
Groups of 50 male and 50 female mice were administered 0, 30, 100 or 300 mg green tea extract/kg bw per day in by oral gavage in deionised water 5 days per week, for 105 weeks. Control animals received deionised water (5 mL/kg bw for rats; 10 mL/kg bw for mice).
| Dose | Survival (summary table p10) | Body weight changes (summary table p10) | Incidence of non‐neoplastic lesions of the liver(a) (Table C3/D3) |
|---|---|---|---|
| Male | |||
| 0 | 33/50 | – | 4/50 |
| 30 | 36/50 | – | 1/50 |
| 100 | 33/50 | At least 10% less by wk 89 | 5/50 |
| 300 | 37/50 | At least 10% less by wk 65 | 12/50 |
| Female | |||
| 0 | 34/50 | – | 6/50 |
| 30 | 33/50 | – | 3/50 |
| 100 | 44/50 | At least 10% less by wk 25 | 6/50 |
| 300 | 39/50 | At least 10% less by wk 17 | 5/50 |
Inflammation.
Appendix H – Hy's Law
1.
Hy's Law is a rule for severe hepatotoxicity prediction used in clinical trials with medications and it is essentially a translation of Zimmerman's observation that pure hepatocellular injury sufficient to cause hyperbilirubinemia is an ominous indicator of the potential for a drug to cause serious liver injury with 10–50% mortality from acute liver failure (Zimmerman, 1978, 1999). Thus, a finding of ALT elevation, usually substantial, seen concurrently with bilirubin > 2 × ULN, identifies a drug likely to cause severe DILI (fatal or requiring transplant) at a rate roughly 1/10 the rate of Hy's Law cases. The rational for Hy's law is that the liver has a large excess of bilirubin‐excreting capacity. Hence, injury to hepatocytes enough to cause jaundice or even mild hyperbilirubinemia (i.e. a bilirubin > 2 × ULN) represents an extent of liver injury so important that recovery may not be possible in some patients. To fulfil the Hy's law, the rise in bilirubin must not antedate the ALT and it typically peaks later on the course than does ALT; by convention a delay of up to 2 weeks in bilirubin peak is allowed. It is critical to rule out other causes of injury (e.g. other drugs or viral hepatitis) and to rule out an obstructive basis for the elevated bilirubin. In all cases to date, the small number of Hy's Law cases has arisen on a background of an increased incidence of more modest signs of hepatocellular injury (e.g. greater incidence of 3 × ULN elevations in AT than seen in a control group). Finding one Hy's Law case in the clinical trial database is worrisome; finding two is considered highly predictive that the drug has the potential to cause severe DILI when given to a larger population (FDA guidance, 2009). The predictive potential for acute liver failure of Hy's law was also recently confirmed in large studies of DILI in Spain (Andrade et al., 2005) and in Sweden (Björnsson and Olsson, 2005).
Appendix I – Idiosyncratic reaction definition
1.
‘Idiosyncratic’ drug‐induced liver injury (DILI) is a term used to define those adverse reactions to medications and other xenobiotic, including herbal and dietary supplements that are not clearly related to the dose, route or duration of drug administration. Although not dose related in a strict sense, these reactions largely occur in drugs given at daily doses of greater than 50–100 mg suggesting a threshold exposure is required for either cumulative damage or eliciting an immune response. The pathogenesis of idiosyncratic DILI is complex and not yet fully understood. One major hypothesis is the generation of a reactive metabolite or parent drug protein complex that can directly or indirectly mediate damage to intracellular proteins and/or organelles, resulting in the initiation of ‘danger’ signals. Actually, one of the characteristic features of IDILI is that mild injury (e.g. ALT < 3 upper limit of normal) occurs far more frequently than severe and that in most instances mild injury subsides despite continuation of the drug. While a failure in detoxification pathways that would normally rescue damaged hepatocytes can occur in uniquely susceptible individuals, in the hapten hypothesis, which is supported by genome wide association studies identifying HLA specific susceptibility alleles, the drug‐protein or metabolite‐protein adduct leads to inadvertent activation of the adaptive immune system. When subjects with susceptible HLA, haplotypes are exposed to these antigenic peptides some immediately become tolerant and others develop mild injury, which can resolve with continued exposure to the drug, a phenomenon known as adaptation. In rare instances due to defective adaptation, mild liver injury can progress to severe idiosyncratic DILI and acute liver failure (Dara, et al. 2016). Alternatively, in non‐immune mechanisms, damage‐associated molecular pathway proteins such as HMGB‐1, heat shock proteins or cellular DNA released from necrotic cells lead to the recruitment of localised tissue injury and macrophage activation through cytokines, chemokines and costimulatory molecules, which in turn would lead to magnification of the damage associated molecular pattern response possibly via its impact on drug‐metabolising enzyme activity, the density of HLA molecules on antigen‐presenting cells, the ability of the presented antigens to activate T cells, and the ability of activated T cells to cause hepatocyte death (Fontana, 2014).
Appendix J – Unpublished case reports associated with the use of food supplements containing green tea (Nordic reports)
1.
Cases associated with green tea supplements. A 61‐year‐old woman reported nausea and deterioration of her general condition following the intake of 2 tablets/day, containing 800 mg of an aqueous extract from dried, heat‐treated green tree leaves (260 mg total catechins), corresponding to a total dose 140 mg EGCG/day for 10 months. Liver biochemistry revealed abnormal elevation in ALT, LDH, and total bilirubin. The patient did not receive any other medication except for paracetamol 1 g/week from months 7–9 after starting the food supplement.
In another case report, a woman developed fatigue, fever, shivering and elevated liver test parameters following a 14‐day course of a green‐tea containing supplement (called Supplement B, described as extracts from leaves of Camellia sinensis L., in this version containing 1,944 mg green tea extract with 30% EGCG) with a daily dose of 583.2 mg EGCG. When hospitalised, the patient improved. However, deterioration was seen when the patient was re‐exposed to the supplement after discharge from the hospital.
A case‐series of six women aged between 32 and 66 years old and one 65‐year‐old man were reported to suffer from toxic hepatitis after the intake of 145.8–291.6 mg/day of EGCG for 3 weeks to 6 months. They had all taken the same food supplement (Supplement B), in two different versions, described as extracts from leaves of Camellia sinensis L., containing 972 and 600 mg green tea extract, respectively, with 30% EGCG. Other ingredients were dill, ginger, Capsicum annuum L, peppermint, vitamins and minerals. Causality assessment by RUCAM/CIOMS revealed probable causal relationship in four cases and possible causal relationship in one of the cases. In addition, two cases of toxic hepatitis were reported after the causality assessment.
A 50‐year‐old woman reported stomach pain and significant elevation of liver enzymes following a 9‐week course of 1,400 mg green tea extract/day, corresponding to 980 mg EGCG/day. Liver biopsy revealed chronic active hepatitis. The patient had been on a low‐carbohydrate diet and additional food supplements (300 mg calcium, 150 mg magnesium, 5 μg vitamin D and 330 mg diatomaceous earth/diatomite). The authors did not come to a conclusion whether the liver injury was induced by the food supplement or by viral hepatitis.
A 24‐year‐old man developed hepatotoxicity 1 week following the discontinuation of four food supplements bought over the internet. Three food supplements included a mixture of amino acids and vitamin D, whey proteins and multivitamins and the fourth included Acacia rigidula, Camellia sinensis, white willow bark, grape seed extract, cactus extract, guarana, Capsicum annuum, ginseng root and Cissus quadrangularis. According to the authors of the report, green tea was the only plant material linked with hepatotoxicity from a literature search.
A woman who developed fatigue, nausea, pruritus and jaundice was hospitalised, having significant elevation in serum liver enzyme levels. The patient had been taking food supplements (bought over the internet) over a period of 5 weeks. The product consisted of an extensive mixture of various plants and plant extracts, including green tea extract. The patient slowly recovered after discontinuation, however, according to the Authors, it was difficult to link the effect to a single ingredient in the product.
Cases associated with green tea infusions. Two hepatotoxicity cases suspected to be induced by green tea infusion were reported to the food authorities in Nordic countries. In the first case, a woman ‘had daily drunk litres of ice tea made from green tea infusion during summer’. The patient was hospitalised due to elevated serum liver enzyme levels (and infection due to a Group B streptococcus infection). Two months after hospitalisation, the patient profile normalised apart from γ‐glutamyl transferase. In the second case, described in the publication by Rohde et al. (2011), hepatotoxicity was suspected to be induced by daily consumption of 4–6 cups of green tea infusion for 6 months. Liver transaminases were normal 2 weeks after discontinuation of the green tea infusion.
Suggested citation: EFSA ANS Panel (EFSA Panel on Food Additives and Nutrient Sources added to Food) , Younes M, Aggett P, Aguilar F, Crebelli R, Dusemund B, Filipič M, Frutos MJ, Galtier P, Gott D, Gundert‐Remy U, Lambré C, Leblanc J‐C, Lillegaard IT, Moldeus P, Mortensen A, Oskarsson A, Stankovic I, Waalkens‐Berendsen I, Woutersen RA, Andrade RJ, Fortes C, Mosesso P, Restani P, Arcella D, Pizzo F, Smeraldi C and Wright M, 2018. Scientific Opinion on the safety of green tea catechins. EFSA Journal 2018;16(4):5239, 89 pp. 10.2903/j.efsa.2018.5239
Requestor: European Commission
Question number: EFSA‐Q‐2016‐00627
Panel members: Peter Aggett, Fernando Aguilar, Riccardo Crebelli, Birgit Dusemund, Metka Filipič, Maria Jose Frutos, Pierre Galtier, David Gott, Ursula Gundert‐Remy, Gunter Georg Kuhnle, Claude Lambré, Jean‐Charles Leblanc, Inger Therese Lillegaard, Peter Moldeus, Alicja Mortensen, Agneta Oskarsson, Ivan Stankovic, Ine Waalkens‐Berendsen, Rudolf Antonius Woutersen, Matthew Wright and Maged Younes.
Competing interests: In line with EFSA's policy on declarations of interest, Panel member Gunter Georg Kuhnle did not participate in the development and adoption of this scientific output.
Acknowledgements: The Panel wishes to thank the following for the support provided to this scientific output: EFSA staff members: Eleonora Alquati, Adamantia Papaioannou and Rita Sousa. The Panel wishes to acknowledge all European competent institutions, Member State bodies and other organisations that provided data for this scientific output.
Adopted: 14 March 2018
Notes
OJ L 404, 30.12.2006, p. 26.
OJ. L 031, 01.02.2002. p. 1–24.
Available at: https://ndb.nal.usda.gov/
COMMISSION REGULATION (EC) No 1881/2006 of 19 December 2006 setting maximum levels for certain contaminants in foodstuffs. OJ L 70, 16.03.2005, p. 16.
DIRECTIVE 2009/32/EC OF THE EUROPEAN PARLIAMENT AND OF THE COUNCIL of 23 April 2009 on the approximation of the laws of the Member States on extraction solvents used in the production of foodstuffs and food ingredients. OJ L 143, 06.06.2009, p. 9.
REGULATION (EC) NO 396/2005 OF THE EUROPEAN PARLIAMENT AND OF THE COUNCIL of 23 February 2005 on maximum residue levels of pesticides in or on food and feed of plant and animal origin and amending Council Directive 91/414/EEC. OJ L 70, 16.03.2005, p. 16.
Available at: https://s0www.utdlab.com/contents/image?imageKey=ONC/77533
References
- Abu El Wafa Y, Benavente AF, Talavera AF, Pérez MR and Ramos‐Clemente JI, 2005. Acute hepatitis induced by Camellia sinensis (green tea). Anales de medicina interna, 22, 298. [DOI] [PubMed]
- Aithal GP, Watkins PB, Andrade RJ, Larrey D, Molokhia M, Takikawa H, Hunt CM, Wilke RA, Avigan M, Kaplowitz N, Bjornsson E and Daly AK, 2011. Case definition and phenotype standardization in drug‐induced liver injury. Clinical Pharmacology and Therapeutics, 89, 806–815. [DOI] [PubMed] [Google Scholar]
- Alferink LJ, Fittipaldi J, Kiefte‐de Jong JC, Taimr P, Hansen BE, Metselaar HJ and Murad SD, 2017. Coffee and herbal tea consumption is associated with lower liver stiffness in the general population: the Rotterdam study. Journal of Hepatology, 67, 339–348. [DOI] [PubMed] [Google Scholar]
- Al‐Hanish A, Stanic‐Vucinic D, Mihailovic J, Prodic I, Minic S, Stojadinovic M and Velickovic TC, 2016. Noncovalent interactions of bovine α‐lactalbumin with green tea polyphenol, epigalocatechin‐3‐gallate. Food Hydrocolloids, 61, 241–250. [Google Scholar]
- Almorós AL, Sabau JP, Dorado MDPB and Ruggiero M, 2015. Hepatitis aguda por extracto de té verde. Gastroenterología y hepatología, 38, 44–45. [DOI] [PubMed] [Google Scholar]
- Amariles P, Angulo N, Agudelo‐Agudelo J and Gaviria G, 2009. Hepatitis asociada a infusiones acuosas de té verde: a propósito de un caso. [DOI] [PubMed]
- Andrade RJ, Lucena MI, Fernández MC, Pelaez G, Pachkoria K, García‐Ruiz E, García‐Muñoz B, González‐Grande R, Pizarro A, Durán JA and Jiménez M; on behalf of the Spanish group for the study of drug‐induced liver disease , 2005. Drug‐induced liver injury: an analysis of 461 incidences submitted to the Spanish registry over a 10‐year period. Gastroenterology, 129, 512–521. [DOI] [PubMed] [Google Scholar]
- ANSES (French Agency for Food, Environmental and Occupational Health & Safety), 2012a. Avis de l'Agence nationale de sécurité sanitaire de l'alimentation, de l'environnement et du travail relatif au risque d'hépatotoxicité lié à la consommation de denrées alimentaires contenant notamment du thé vert.
- ANSES (French Agency for Food, Environmental and Occupational Health & Safety), 2012b. Avis de l'Agence nationale de sécurité sanitaire de l'alimentation, de l'environnement et du travail relatif à la sécurité d'emploi de la poudre de thé vert dans les complements alimentaires.
- ANSES (French Agency for Food, Environmental and Occupational Health & Safety), 2012c. Avis de l'Agence nationale de sécurité sanitaire de l'alimentation, de l'environnement et du travail relatif à la sécurité d'emploi des préparations de thé vert.
- Arrete Royale , 1997. Arrete Royale du 29 Aout 1997 relatif à la fabrication et au commerce de denrées alimentaires composées ou contenant des plantes ou préparations de plantes (MB 21.XI.1997) et modifications Available online: http://www.health.belgium.be/fr/version-consolidee-arrete-royal-du-29-aout-1997
- Arzenton E, Paon V, Leone R, Apostoli P, Conforti A, Capra F and Velo GP, 2012. Acute hepatitis caused by green tea infusion: a case report. Drug Safety, 35, 944. [Google Scholar]
- Astill C, Birch MR, Dacombe C, Humphrey PG and Martin PT, 2001. Factors affecting the caffeine and polyphenol contents of black and green tea infusions. Journal of Agricultural and Food Chemistry, 49, 5340–5347. [DOI] [PubMed] [Google Scholar]
- Auger C, Mullen W, Hara Y and Crozier A, 2008. Bioavailability of polyphenon E flavan‐3‐ols in humans with an ileostomy. The Journal of Nutrition, 138, 1535S–1542S. [DOI] [PubMed] [Google Scholar]
- Basu A, Sanchez K, Leyva MJ, Wu M, Betts NM, Aston CE and Lyons TJ, 2010. Green tea supplementation affects body weight, lipids, and lipid peroxidation in obese subjects with metabolic syndrome. Journal of the American College of Nutrition, 29, 31–40. [DOI] [PubMed] [Google Scholar]
- Basu A, Du M, Sanchez K, Leyva MJ, Betts NM, Blevins S, Mingyuan W, Aston CE and Lyons TJ, 2011. Green tea minimally affects biomarkers of inflammation in obese subjects with metabolic syndrome. Nutrition, 27, 206–213. [DOI] [PMC free article] [PubMed] [Google Scholar]
- Bjornsson E and Olsson R, 2007. Serious adverse liver reactions associated with herbal weight‐loss supplements. Journal of Hepatology, 47, 295–297, author reply 7–8. [DOI] [PubMed] [Google Scholar]
- Blaschek W, Ebel S, Hackenthal E, Holzgrabe U, Keller K, Reichling J and Schulz V, 2006. HagerROM 2006. Hagers Handbuch der Drogen und Arzneistoffe. CD‐Realisierung: Informatik II, Universität Würzburg, [Programmversion 6.1].
- Blumenthal M, 2003. The ABC clinical guide to herbs. American Botanical Council.
- Bodi D, Ronczka S, Gottschalk C, Behr N, Skibba A, Wagner M, Lahrssen‐Wiederholt M, Preiss‐Weigert A and These A, 2014. Determination of pyrrolizidine alkaloids in tea, herbal drugs and honey. Food Additives and Contaminants: Part A, 31, 1886–1895. [DOI] [PubMed] [Google Scholar]
- Braicu C, Gherman CD, Irimie A and Berindan‐Neagoe I, 2013. Epigallocatechin‐3‐Gallate (EGCG) inhibits cell proliferation and migratory behaviour of triple negative breast cancer cells. Journal of Nanoscience and Nanotechnology, 13, 632–637. [DOI] [PubMed] [Google Scholar]
- Brown AC, 2017. Liver toxicity related to herbs and dietary supplements: online table of case reports. Part 2 of 5 series. Food and Chemical Toxicology, 107, 472–501. [DOI] [PubMed] [Google Scholar]
- Brzezicha‐Cirocka J, Grembecka M and Szefer P, 2016. Monitoring of essential and heavy metals in green tea from different geographical origins. Environmental Monitoring and Assessment, 188, 183. [DOI] [PMC free article] [PubMed] [Google Scholar]
- Bun SS, Bun H, Guédon D, Rosier C and Ollivier E, 2006. Effect of green tea extracts on liver functions in Wistar rats. Food and Chemical Toxicology, 44, 1108–1113. [DOI] [PubMed] [Google Scholar]
- Butler LM, Huang JY, Wang R, Lee MJ, Yang CS, Gao YT and Yuan JM, 2015. Urinary biomarkers of catechins and risk of hepatocellular carcinoma in the Shanghai Cohort Study. American Journal of Epidemiology, 181, 397–405. [DOI] [PMC free article] [PubMed] [Google Scholar]
- Calani L, Del Rio D, Luisa Callegari M, Morelli L and Brighenti F, 2012. Updated bioavailability and 48 h excretion profile of flavan‐3‐ols from green tea in humans. International Journal of Food Sciences and Nutrition, 63, 513–521. [DOI] [PubMed] [Google Scholar]
- Cao Y, True AD, Chen J and Xiong YL, 2016. Dual role (anti‐and pro‐oxidant) of gallic acid in mediating myofibrillar protein gelation and gel in vitro digestion. Journal of Agricultural and Food Chemistry, 64, 3054–3061. [DOI] [PubMed] [Google Scholar]
- Chan KY, Zhang L and Zuo Z, 2007. Intestinal efflux transport kinetics of green tea catechins in Caco‐2 monolayer model. Journal of Pharmacy and Pharmacology, 59, 395–400. [DOI] [PubMed] [Google Scholar]
- Chan PC, Ramot Y, Malarkey DE, Blackshear P, Kissling GE, Travlos G and Nyska A, 2010. Fourteen‐week toxicity study of green tea extract in rats and mice. Toxicologic Pathology, 38, 1070–1084. [DOI] [PMC free article] [PubMed] [Google Scholar]
- Chang PY, Mirsalis J, Riccio ES, Bakke JP, Lee PS, Shimon J, Phillips S, Fairchild D, Hara Y and Crowell JA, 2003. Genotoxicity and toxicity of the potential cancer‐preventive agent polyphenon E. Environmental and Molecular Mutagenesis, 41, 43–54. [DOI] [PubMed] [Google Scholar]
- Chen ZY, Zhu QY, Tsang D and Huang Y, 2001. Degradation of green tea catechins in tea drinks. Journal of Agricultural and Food Chemistry, 49, 477–482. [DOI] [PubMed] [Google Scholar]
- Chengelis CP, Kirkpatrick JB, Regan KS, Radovsky AE, Beck MJ, Morita O and Suzuki H, 2008. 28‐Day oral (gavage) toxicity studies of green tea catechins prepared for beverages in rats. Food and Chemical Toxicology, 46, 978–989. [DOI] [PubMed] [Google Scholar]
- Chow HS, Cai Y, Hakim IA, Crowell JA, Shahi F, Brooks CA, Dorr RT, Hara Y and Alberts DS, 2003. Pharmacokinetics and safety of green tea polyphenols after multiple‐dose administration of epigallocatechin gallate and polyphenon E in healthy individuals. Clinical Cancer Research, 9, 3312–3319. [PubMed] [Google Scholar]
- Church RJ, Gatti DM, Urban TJ, Long N, Yang X, Shi Q, Eaddy JS, Mosedale M, Ballard S, Churchill GA, Navarro V, Watkins PB, Threadgill DW and Harrill AH, 2015. Sensitivity to hepatotoxicity due to epigallocatechin gallate is affected by genetic background in diversity outbred mice. Food and Chemical Toxicology, 76, 19–26. [DOI] [PMC free article] [PubMed] [Google Scholar]
- Colon M and Nerin C, 2014. Molecular interactions between caffeine and catechins in green tea. Journal of Agricultural and Food Chemistry, 62, 6777–6783. [DOI] [PubMed] [Google Scholar]
- Crespy V, Nancoz N, Oliveira M, Hau J, Courtet‐compondu MC and Williamson G, 2004. Glucuronidation of the green tea catechins,(‐)‐epigallocatechin‐3‐gallate and (‐)‐epicatechin‐3‐gallate, by rat hepatic and intestinal microsomes. Free Radical Research, 38, 1025–1031. [DOI] [PubMed] [Google Scholar]
- Crew KD, Brown P, Greenlee H, Bevers TB, Arun BK, Hudis CA, McArthur HL, Chang J, Rimawi M, Vornik L, Cornelison TL, Wang A, Hibshoosh H, Ahmed A, Terry MB, Santella MB, Lippman SM and Hershman DL, 2012. Phase IB randomized, double‐blinded, placebo‐controlled, dose escalation study of polyphenon E in women with hormone receptor‐negative breast cancer. Cancer Prevention Research, 5, 1144–1154. [DOI] [PMC free article] [PubMed] [Google Scholar]
- Dara L, Liu ZX and Kaplowitz N, 2016. Mechanisms of adaptation and progression in idiosyncratic drug induced liver injury, clinical implications. Liver International, 36, 158–165. 10.1111/liv.12988 [DOI] [PMC free article] [PubMed] [Google Scholar]
- De la Torre R, Sola S, Pons M, Duchon A, Lagran MM, Farré M and Pujadas M, 2014. Epigallocatechin‐3‐gallate, a DYRK1A inhibitor, rescues cognitive deficits in Down syndrome mouse models and in humans. Molecular Nutrition and Food Research, 58, 278–288. [DOI] [PubMed] [Google Scholar]
- De Oliveira MR, Nabavi SF, Daglia M, Rastrelli L and Nabavi SM, 2016. Epigallocatechin gallate and mitochondria—a story of life and death. Pharmacological Research, 104, 70–85. [DOI] [PubMed] [Google Scholar]
- De Paula JMP, Barquero JG and Hidalgo SF, 2008. Hepatitis tóxica por Camellia sinensis. Gastroenterologia y hepatologia, 31, 402. [DOI] [PubMed] [Google Scholar]
- Dekant W, Scialli AR, Plotzke K and Klaunig JE, 2017. Biological relevance of effects following chronic administration of octamethylcyclotetrasiloxane (D4) in Fischer 344 rats. Toxicology Letters, 279, 42–53. [DOI] [PubMed] [Google Scholar]
- Del Rio D, Calani L, Cordero C, Salvatore S, Pellegrini N and Brighenti F, 2010a. Bioavailability and catabolism of green tea flavan‐3‐ols in humans. Nutrition, 26, 1110–1116. [DOI] [PubMed] [Google Scholar]
- Del Rio D, Calani L, Scazzina F, Jechiu L, Cordero C and Brighenti F, 2010b. Bioavailability of catechins from ready‐to‐drink tea. Nutrition, 26, 528–533. [DOI] [PubMed] [Google Scholar]
- Dongowski G, 2005. Lexikon der Lebensmittel und der, Lebensmittelchemie. In: Waldemar Ternes. Wiss (ed.). Verlag‐Gesellschaft, Stuttgart, Germany. [Google Scholar]
- Dostal AM, Samavat H, Bedell S, Torkelson C, Wang R, Swenson K, Le C, Wu AH, Ursin G, Yuan JM and Kurzer MS, 2015. The safety of green tea extract supplementation in postmenopausal women at risk for breast cancer: results of the Minnesota Green Tea Trial. Food and Chemical Toxicology, 83, 26–35. [DOI] [PMC free article] [PubMed] [Google Scholar]
- Dube A, Nicolazzo JA and Larson I, 2011. Assessment of plasma concentrations of (−)‐epigallocatechin gallate in mice following administration of a dose reflecting consumption of a standard green tea beverage. Food Chemistry, 128, 7–13. [DOI] [PubMed] [Google Scholar]
- EFSA (European Food Safety Authority), 2009. EFSA Scientific Cooperation (ESCO) Report ‘Advice on the EFSA guidance document for the safety assessment of botanicals and botanical preparations intended for use as food supplements, based on real case studies’ ESCO WORKING GROUP ON BOTANICALS AND BOTANICAL PREPARATIONS. EFSA Journal 2009;7(9):280. [Google Scholar]
- EFSA (European Food Safety Authority), 2011. Compendium of Botanicals reported to contain naturally occurring substances of possible concern for human health when used in food and food supplements. EFSA Journal 2011;10(5):2663, 60 pp. 10.2903/j.efsa.2012.2663 [DOI] [Google Scholar]
- EFSA (European Food Safety Authority), 2011a. Use of the EFSA Comprehensive European Food Consumption Database in Exposure Assessment. EFSA Journal 2011;9(3):2097, 34 pp. 10.2903/j.efsa.2011.2097 [DOI] [Google Scholar]
- EFSA (European Food Safety Authority), 2011b. Evaluation of the FoodEx, the food classification system applied to the development of the EFSA Comprehensive European Food Consumption Database. EFSA Journal 2011;9(3):1970, 27 pp. 10.2903/j.efsa.2011.1970 [DOI] [Google Scholar]
- EFSA (European Food Safety Authority), 2016. Dietary exposure assessment to pyrrolizidine alkaloids in the European population. EFSA Journal 2016;14(8):4572, 50 pp. 10.2903/j.efsa.2016.4572 [DOI] [Google Scholar]
- EFSA (European Food Safety Authority), 2017. Compendium of Botanicals reported to contain naturally occurring substances of possible concern for human health when used in food and food supplements. EFSA Journal 2017;10(5):2663, 60 pp. 10.2903/j.efsa.2012.2663 [DOI] [Google Scholar]
- EFSA NDA Panel (EFSA Panel on Dietetic Products, Nutrition and Allergies), 2010a. Scientific Opinion on the substantiation of health claims related to Camellia sinensis (L.) Kuntze (tea), including catechins in green tea and tannins in black tea, and protection of DNA, proteins and lipids from oxidative damage (ID 1103, 1276, 1311, 1708, 2664), reduction of acid production in dental plaque (ID 1105, 1111), maintenance of bone (ID 1109), decreasing potentially pathogenic intestinal microorganisms (ID 1116), maintenance of vision (ID 1280), maintenance of normal blood pressure (ID 1546) and maintenance of normal blood cholesterol concentrations (ID 1113, 1114) pursuant to Article 13(1) of Regulation (EC) No 1924/2006. EFSA Journal 2010;8(2):1463, 29 pp. 10.2903/j.efsa.2010.1463 [DOI] [Google Scholar]
- EFSA NDA Panel (EFSA Panel on Dietetic Products, Nutrition and Allergies), 2010b. Scientific Opinion on the substantiation of health claims related to Camellia sinensis (L.) Kuntze (tea), including catechins from green tea, and contribution to the maintenance or achievement of a normal body weight (ID 1107, 1112, 1544, 2716), increased beta‐oxidation of fatty acids leading to a reduction in body fat mass (ID 1123, 1124, 3698), and maintenance of normal blood glucose concentrations (ID 1115, 1545) pursuant to Article 13(1) of Regulation (EC) No 1924/2006. EFSA Journal 2010;8(10):1791, 22 pp. 10.2903/j.efsa.2010.1791 [DOI] [Google Scholar]
- EFSA NDA Panel (EFSA Panel on Dietetic Products, Nutrition and Allergies), 2011. Scientific Opinion on the substantiation of health claims related to Camellia sinensis (L.) Kuntze (tea), including catechins in green tea, and improvement of endothelium‐dependent vasodilation (ID 1106, 1310), maintenance of normal blood pressure (ID 1310, 2657), maintenance of normal blood glucose concentrations (ID 1108), maintenance of normal blood LDL cholesterol concentrations (ID 2640), protection of the skin from UV‐induced (including photo‐oxidative) damage (ID 1110, 1119), protection of DNA from oxidative damage (ID 1120, 1121), protection of lipids from oxidative damage (ID 1275), contribution to normal cognitive function (ID 1117, 2812), “cardiovascular system” (ID 2814), “invigoration of the body” (ID 1274, 3280), decreasing potentially pathogenic gastro‐intestinal microorganisms (ID 1118), “immune health” (ID 1273) and “mouth” (ID 2813) pursuant to Article 13(1) of Regulation (EC) No 1924/2006. EFSA Journal 2011;9(4):2055, 29 pp. 10.2903/j.efsa.2011.2055 [DOI] [Google Scholar]
- EFSA Scientific Committee , 2009a. Guidance of the Scientific Committee on transparency in the scientific aspects of risk assessments carried out by EFSA. Part 2: general principles. EFSA Journal 2009;7(7):1051, 22 pp. 10.2903/j.efsa.2009.1051 [DOI] [Google Scholar]
- EFSA Scientific Committee , 2009b. Guidance on safety assessment of botanicals and botanical preparations intended for use as ingredients in food supplements, on request of EFSA. EFSA Journal 2009;7(9):1249, 19 pp. 10.2903/j.efsa.2009.1249 [DOI] [Google Scholar]
- Egert S, Tereszczuk J, Wein S, Müller MJ, Frank J, Rimbach G and Wolffram S, 2013. Simultaneous ingestion of dietary proteins reduces the bioavailability of galloylated catechins from green tea in humans. European Journal of Nutrition, 52, 281–288. [DOI] [PubMed] [Google Scholar]
- El Mohsen MMA, Kuhnle G, Rechner AR, Schroeter H, Rose S, Jenner P and Rice‐Evans CA, 2002. Uptake and metabolism of epicatechin and its access to the brain after oral ingestion. Free Radical Biology and Medicine, 33, 1693–1702. [DOI] [PubMed] [Google Scholar]
- El‐Shahawi MS, Hamza A, Bahaffi SO, Al‐Sibaai AA and Abduljabbar TN, 2012. Analysis of some selected catechins and caffeine in green tea by high performance liquid chromatography. Food Chemistry, 134, 2268–2275. [DOI] [PubMed] [Google Scholar]
- EMA (European Medicines Agency), 2013a. Committee on Herbal Medicinal Products. Assessment report on Camellia sinensis (L.) Kuntze, non fermentatum folium. Available online: http://www.ema.europa.eu/docs/en_GB/document_library/Herbal_-_HMPC_assessment_report/2013/04/WC500142248.pdf
- EMA (European Medicines Agency), 2013b. Committee on Herbal Medicinal Products. Community herbal monograph on Camellia sinensis (L.) Kuntze, non fermentatum folium. Available online: http://www.ema.europa.eu/docs/en_GB/document_library/Herbal_-_Community_herbal_monograph/2013/04/WC500142250.pdf
- Emoto Y, Yoshizawa K, Kinoshita Y, Yuki M, Yuri T, Yoshikawa Y, Sayama K and Tsubura A, 2014. Green tea extract‐induced acute hepatotoxicity in rats. Journal of Toxicologic Pathology, 27, 163–174. [DOI] [PMC free article] [PubMed] [Google Scholar]
- Erhardt W, 2008. “Der große Zander. Enzyklopädie der Pflanzennamen. Band 2. Arten und Sorten.” Stuttgart. Verlag Eugen Ulmer KG, Germany.
- ESCO (EFSA Scientific Cooperation), 2009. The EFSA Scientific Cooperation Working Group on Botanicals and Botanical Preparations. Available online: https://www.efsa.europa.eu/en/supporting/pub/rn-280
- Fan FY, Shi M, Nie Y, Zhao Y, Ye JH and Liang YR, 2016. Differential behaviors of tea catechins under thermal processing: formation of non‐enzymatic oligomers. Food Chemistry, 196, 347–354. [DOI] [PubMed] [Google Scholar]
- Guidance for Industry Drug‐Induced Liver Injury: Premarketing Clinical Evaluation. U.S. Department of Health and Human Services Food and Drug Administration Center for Drug Evaluation and Research (CDER) Center for Biologics Evaluation and Research (CBER). July 2009. Drug Safety. Available online: https://www.fda.gov/downloads/Guidances/UCM174090.pdf
- Federico A, Tiso A and Loguercio C, 2007. A case of hepatotoxicity caused by green tea. Free Radical Biology and Medicine, 43, 474. [DOI] [PubMed] [Google Scholar]
- Feng WY, 2006. Metabolism of green tea catechins: an overview. Current Drug Metabolism, 7, 755–809. [DOI] [PubMed] [Google Scholar]
- Fong TL, Klontz KC, Canas‐Coto A, Casper SJ, Durazo FA, Davern TJ II and Seeff LB, 2010. Hepatotoxicity due to hydroxycut: a case series. The American Journal of Gastroenterology, 105, 1561. [DOI] [PMC free article] [PubMed] [Google Scholar]
- Fontana RJ, 2014. Pathogenesis of idiosyncratic drug‐induced liver injury and clinical perspectives. Gastroenterology, 146, 914–928. 10.1053/j.gastro.2013.12.032 [DOI] [PMC free article] [PubMed] [Google Scholar]
- Frank J, George TW, Lodge JK, Rodriguez‐Mateos AM, Spencer JP, Minihane AM and Rimbach G, 2008. Daily consumption of an aqueous green tea extract supplement does not impair liver function or alter cardiovascular disease risk biomarkers in healthy men. The Journal of Nutrition, 139, 58–62. [DOI] [PubMed] [Google Scholar]
- Friedman M, Levin CE, Lee SU and Kozukue N, 2009. Stability of green tea catechins in commercial tea leaves during storage for 6 months. Journal of Food Science, 74, H47‐51. [DOI] [PubMed] [Google Scholar]
- Fukuzawa Y, Kapoor MP, Yamasaki K, Okubo T, Hotta Y and Juneja LR, 2014. Effects of green tea catechins on nonalcoholic steatohepatitis (NASH) patients. Journal of Functional Foods, 9, 48–59. [Google Scholar]
- Fung ST, Ho CK, Choi SW, Chung WY and Benzie IF, 2013. Comparison of catechin profiles in human plasma and urine after single dosing and regular intake of green tea (Camellia sinensis). British Journal of Nutrition, 109, 2199–2207. [DOI] [PubMed] [Google Scholar]
- Galati G, Lin A, Sultan AM and O'brien PJ, 2006. Cellular and in vivo hepatotoxicity caused by green tea phenolic acids and catechins. Free Radical Biology and Medicine, 40, 570–580. [DOI] [PubMed] [Google Scholar]
- Gallo E, Maggini V, Berardi M, Pugi A, Notaro R, Talini G, Vannozzi G, Bagnoli S, Forte P, Mugelli A, Annese V, Firenzuoli F and Vannacci A, 2013. Is green tea a potential trigger for autoimmune hepatitis? Phytomedicine, 20, 1186–1189. [DOI] [PubMed] [Google Scholar]
- Garcia FA, Cornelison T, Nuño T, Greenspan DL, Byron JW, Hsu CH, Alberts DS and Chow HHS, 2014. Results of a phase II randomized, double‐blind, placebo‐controlled trial of Polyphenon E in women with persistent high‐risk HPV infection and low‐grade cervical intraepithelial neoplasia. Gynecologic Oncology, 132, 377–382. [DOI] [PMC free article] [PubMed] [Google Scholar]
- García‐Cortés M, Borraz Y, Lucena MI, Peláez G, Salmerón J, Diago M and Bruguera M, 2008. Liver injury induced by” natural remedies”: an analysis of cases submitted to the Spanish Liver Toxicity Registry. Revista Espanola de Enfermedades Digestivas, 100, 688. [DOI] [PubMed] [Google Scholar]
- Giannini EG, Testa R and Savarino V, 2005. Liver enzyme alteration: a guide for clinicians. Canadian Medical Association Journal, 172, 367–379. [DOI] [PMC free article] [PubMed] [Google Scholar]
- Gloro R, Hourmand‐Ollivier I, Mosquet B, Mosquet L, Rousselot P, Salamé E, Piquet MA and Dao T, 2005. Fulminant hepatitis during self‐medication with hydroalcoholic extract of green tea. European Journal of Gastroenterology and Hepatology, 17, 1135–1137. [DOI] [PubMed] [Google Scholar]
- Graham HN, 1992. Green tea composition, consumption, and polyphenol chemistry. Preventive Medicine, 21, 334–350. [DOI] [PubMed] [Google Scholar]
- Gruenwald J, Brendler T and Jaenike C, 2004. PDR for Herbal Medicines, 2nd Edition Medical Economics Company Inc, Montvale, NJ: pp. 408–414. [Google Scholar]
- Hakim IA, Harris RB, Brown S, Chow HS, Wiseman S, Agarwal S and Talbot W, 2003. Effect of increased tea consumption on oxidative DNA damage among smokers: a randomized controlled study. The Journal of Nutrition, 133, 3303S–3309S. [DOI] [PubMed] [Google Scholar]
- Hanelt P, 2001. Mansfeld's encyclopedia of agricultural and horticultural crops (except ornamentals). Springer Verlag, Heidelberg, Germany. [Google Scholar]
- Haratifar S and Corredig M, 2014. Interactions between tea catechins and casein micelles and their impact on renneting functionality. Food Chemistry, 143, 27–32. [DOI] [PubMed] [Google Scholar]
- He Q, Lv Y and Yao K, 2007. Effects of tea polyphenols on the activities of α‐amylase, pepsin, trypsin and lipase. Food Chemistry, 101, 1178–1182. [Google Scholar]
- Health Canada , 2017a. Summary Safety Review ‐ green tea extract‐containing natural health products ‐ Assessing the potential risk of liver injury (hepatotoxicity). November 15, 2017, update: December 12, 2017 Available online: https://www.canada.ca/en/health-canada/services/drugs-health-products/medeffect-canada/safety-reviews/green-tea-extract-containing-natural-health-products-assessing-potential-risk-liver-injury.html
- Health Canada , 2017b. Natural health products ‐ green tea extracts. Available online: http://webprod.hc-sc.gc.ca/nhpid-bdipsn/atReq.do?atid=greentea_thevert&lang=eng [Accessed November 15, 2017]
- Henning SM, Fajardo‐Lira C, Lee HW, Youssefian AA, Go VL and Heber D, 2003. Catechin content of 18 teas and a green tea extract supplement correlates with the antioxidant capacity. Nutrition and Cancer, 45, 226–235. [DOI] [PubMed] [Google Scholar]
- Hill AM, Coates AM, Buckley JD, Ross R, Thielecke F and Howe PR, 2007. Can EGCG reduce abdominal fat in obese subjects? Journal of the American College of Nutrition, 26, 396S–402S. [DOI] [PubMed] [Google Scholar]
- Hsu CH, Tsai TH, Kao YH, Hwang KC, Tseng TY and Chou P, 2008. Effect of green tea extract on obese women: a randomized, double‐blind, placebo‐controlled clinical trial. Clinical Nutrition, 27, 363–370. [DOI] [PubMed] [Google Scholar]
- Hsu CH, LiaoYL Lin SC, Tsai TH, Huang CJ and Chou P, 2011. Does supplementation with green tea extract improve insulin resistance in obese type 2 diabetics? A randomized, double‐blind, and placebocontrolled clinical trial. Alternative Medicine Review, 16, 157–163. [PubMed] [Google Scholar]
- IARC (Working Group on the Evaluation of Carcinogenic Risks to Humans, & International Agency for Research on Cancer), 1991. Coffee, tea, mate, methylxanthines and methylglyoxal(Vol. 51). World Health Organization. [PMC free article] [PubMed]
- Inoue M, Kurahashi N, Iwasaki M, Shimazu T, Tanaka Y, Mizokami M and Tsugane S, 2009. Effect of coffee and green tea consumption on the risk of liver cancer: cohort analysis by hepatitis virus infection status. Cancer Epidemiology and Prevention Biomarkers, 18, 1746–1753. [DOI] [PubMed] [Google Scholar]
- Isbrucker RA, Bausch J, Edwards JA and Wolz E, 2006. Safety studies on epigallocatechin gallate (EGCG) preparations. Part 1: genotoxicity. Food and Chemical Toxicology, 44, 626–635. [DOI] [PubMed] [Google Scholar]
- Ishizu T, Tsutsumi H, Kinoshita Y, Mukaida H, Sato T and Kajitani S, 2014. Properties of precipitate of creaming down by (−)‐epigallocatechin‐3‐O‐gallate and caffeine. Chemical and Pharmaceutical Bulletin, 62, 552–558. [DOI] [PubMed] [Google Scholar]
- Ishizu T, Tsutsumi H and Sato T, 2016. Mechanism of creaming down based on chemical characterization of a complex of caffeine and tea catechins. Chemical and Pharmaceutical Bulletin, 64, 676–686. [DOI] [PubMed] [Google Scholar]
- ISO , INTERNATIONAL STANDARD 11287, 2011. Green tea ‐ Definition and basic requirements. Thé vert ‐ Définition et caractéristiques de base.
- Isomura T, Suzuki S, Origasa H, Hosono A, Suzuki M, Sawada T, Terao S, Muto Y and Koga T, 2016. Liver‐related safety assessment of green tea extracts in humans: a systematic review of randomized controlled trials. European journal of clinical nutrition, 70, 1221. [DOI] [PMC free article] [PubMed] [Google Scholar]
- James KD, Forester SC and Lambert JD, 2015. Dietary pretreatment with green tea polyphenol,(−)‐epigallocatechin‐3‐gallate reduces the bioavailability and hepatotoxicity of subsequent oral bolus doses of (−)‐epigallocatechin‐3‐gallate. Food and Chemical Toxicology, 76, 103–108. [DOI] [PMC free article] [PubMed] [Google Scholar]
- Jatuworapruk K, Srichairatanakool S, Ounjaijean S, Kasitanon N, Wangkaew S and Louthrenoo W, 2014. Effects of green tea extract on serum uric acid and urate clearance in healthy individuals. JCR: Journal of Clinical Rheumatology, 20, 310–313. [DOI] [PubMed] [Google Scholar]
- Javaid A and Bonkovsky HL, 2006. Hepatotoxicity due to extracts of Chinese green tea (Camellia sinensis): a growing concern. Journal of Hepatology, 45, 334–335. [DOI] [PubMed] [Google Scholar]
- Jia W, Chu X and Zhang F, 2015. Multiresidue pesticide analysis in nutraceuticals from green tea extracts by comprehensive two‐dimensional gas chromatography with time‐of‐flight mass spectrometry. Journal of Chromatography A, 1395, 160–166. [DOI] [PubMed] [Google Scholar]
- Jimenez‐Saenz M and del Carmen Martinez‐Sanchez M, 2006. Acute hepatitis associated with the use of green tea infusions. Journal of Hepatology, 44, 616–617. [DOI] [PubMed] [Google Scholar]
- Joe AK, Schnoll‐Sussman F, Bresalier RS, Abrams JA, Hibshoosh H, Cheung K, Friedman RA, Yang CS, Milne GL, Liu DD, Lee JJ, Abdul K, Bigg M, Foreman J, Su T, Wang X, Ahmed A, Neugut AI, Akpa E, Lippman S, Perloff M, Brown PH and Lightdale CJ, 2015. Phase Ib randomized, double‐blinded, placebo‐controlled, dose escalation study of polyphenon E in patients with Barrett's esophagus. Cancer Prevention Research, 8, 1131–1137. [DOI] [PMC free article] [PubMed] [Google Scholar]
- Johnson WD, Morrissey RL, Crowell JA and McCormick DL, 1999. Subchronic oral toxicity of green tea polyphenols in rats and dogs. Toxicological Sciences, 48, 57–58. [Google Scholar]
- Kaegi E, 1998. Unconventional therapies for cancer: 1. Essiac. Canadian Medical Association Journal, 158, 897–902. [PMC free article] [PubMed] [Google Scholar]
- Kanakis CD, Hasni I, Bourassa P, Tarantilis PA, Polissiou MG and Tajmir‐Riahi HA, 2011. Milk β‐lactoglobulin complexes with tea polyphenols. Food Chemistry, 127, 1046–1055. [DOI] [PubMed] [Google Scholar]
- Kapetanovic IM, Crowell JA, Krishnaraj R, Zakharov A, Lindeblad M and Lyubimov A, 2009. Exposure and toxicity of green tea polyphenols in fasted and non‐fasted dogs. Toxicology, 260, 28–36. [DOI] [PMC free article] [PubMed] [Google Scholar]
- Kataoka K, Takashima S, Shibata E and Hoshino E, 2004. Body fat reduction by the long term intake of catechins and the effects of physical activity. Progress in Medicine, 24, 3358–3370. [Google Scholar]
- Khokhar S and Magnusdottir SGM, 2002. Total phenol, catechin, and caffeine contents of teas commonly consumed in the United Kingdom. Journal of Agricultural and Food Chemistry, 50, 565–570. [DOI] [PubMed] [Google Scholar]
- Khokhar S, Venema D, Hollman PC, Dekker M and Jongen W, 1997. A RP‐HPLC method for the determination of tea catechins. Cancer Letters, 114, 171–172. [DOI] [PubMed] [Google Scholar]
- Kida K, Suzuki M, Matsumoto N, Nanjo F and Hara Y, 2000. Identification of biliary metabolites of (−)‐epigallocatechin gallate in rats. Journal of Agricultural and Food Chemistry, 48, 4151–4155. [DOI] [PubMed] [Google Scholar]
- Kim W, Jeong MH, Cho SH, Yun JH, Chae HJ, Ahn YK, Lee MC, Cheng X, Kondo T, Murohara T and Kang JC, 2006. Effect of green tea consumption on endothelial function and circulating endothelial progenitor cells in chronic smokers. Circulation Journal, 70, 1052–1057. [DOI] [PubMed] [Google Scholar]
- Kozuma K, Chikama A, Hishino E, Kataoka K, Mori K, Hase T, Katsuragi Y, Tokimitsu I and Nakamura H, 2005Effect of intake of a beverage containing 540 mg catechins on the body composition of obese women and men. Progress in Medicine, 25, 1945–1957. Original paper in Japanese. Translation to English provided by interested parties (‘Documentation provided to EFSA’ n. 3). [Google Scholar]
- Kristanc L and Kreft S, 2016. European medicinal and edible plants associated with subacute and chronic toxicity part I: plants with carcinogenic, teratogenic and endocrine‐disrupting effects. Food and Chemical Toxicology, 92, 150–164. [DOI] [PubMed] [Google Scholar]
- Kuhnle G, Spencer JP, Schroeter H, Shenoy B, Debnam ES, Srai SKS, Rice‐Evans C and Hahn U, 2000. Epicatechin and catechin are O‐methylated and glucuronidated in the small intestine. Biochemical and Biophysical Research Communications, 277, 507–512. [DOI] [PubMed] [Google Scholar]
- Kumar NB, Pow‐Sang J, Egan KM, Spiess PE, Dickinson S, Salup R, Helal M, McLarty J, Williams CR, Schreiber F, Parnes HL, Sebti S, Kazi A, Kang L, Quinn G, Smith T, Yue B, Diaz K, Chornokur G, Crocker T and Schell MJ, 2015. Randomized, placebo‐controlled trial of green tea catechins for prostate cancer prevention. Cancer Prevention Research, 8, 879–887. [DOI] [PMC free article] [PubMed] [Google Scholar]
- Lambert JD, Sang S and Yang CS, 2007. Biotransformation of green tea polyphenols and the biological activities of those metabolites. Molecular Pharmaceutics, 4, 819–825. [DOI] [PubMed] [Google Scholar]
- Lambert JD, Kennett MJ, Sang S, Reuhl KR, Ju J and Yang CS, 2010. Hepatotoxicity of high oral dose (−)‐epigallocatechin‐3‐gallate in mice. Food and Chemical Toxicology, 48, 409–416. [DOI] [PMC free article] [PubMed] [Google Scholar]
- Legifrance , 2014. . Arrêté du 24 Juin 2014 établissant la liste des plantes, autre que les champignons, autorisées dans les compléments alimentaires et les conditions de leur emploi. Consolidée au 15 Janvier 2015. Available online: https://www.legifrance.gouv.fr/eli/arrete/2014/6/24/ERNC1406332A/jo/texte
- Li N, Taylor LS, Ferruzzi MG and Mauer LJ, 2012. Kinetic study of catechin stability: effects of pH, concentration, and temperature. Journal of Agricultural and Food Chemistry, 60, 12531–12539. [DOI] [PubMed] [Google Scholar]
- Liang Y and Xu Y, 2003. Effect of extraction temperature on cream and extractability of black tea [Camellia sinensis (L.) O. Kuntze]. International Journal of Food Science and Technology, 38, 37–45. [Google Scholar]
- Liebert M, Licht U, Böhm V and Bitsch R, 1999. Antioxidant properties and total phenolics content of green and black tea under different brewing conditions. Zeitschrift für Lebensmitteluntersuchung und‐Forschung A, 208, 217–220. [Google Scholar]
- Lin YS, Tsai YJ, Tsay JS and Lin JK, 2003. Factors affecting the levels of tea polyphenols and caffeine in tea leaves. Journal of Agricultural and Food Chemistry, 51, 1864–1873. [DOI] [PubMed] [Google Scholar]
- Lin Y, Kikuchi S, Tamakoshi A, Yagyu K, Obata Y, Kurosawa M, Inaba Y, Kawamura T, Motohashi Y and Ishibashi T and JACC Study Group , 2008. Green tea consumption and the risk of pancreatic cancer in Japanese adults. Pancreas, 37, 25–30. [DOI] [PubMed] [Google Scholar]
- Liu CY, Huang CJ, Huang LH, Chen IJ, Chiu JP and Hsu CH, 2014. Effects of green tea extract on insulin resistance and glucagon‐like peptide 1 in patients with type 2 diabetes and lipid abnormalities: a randomized, double‐blinded, and placebo‐controlled trial. PLoS ONE, 9, e91163. [DOI] [PMC free article] [PubMed] [Google Scholar]
- Lovera J, Ramos A, Devier D, Garrison V, Kovner B, Reza T, Koop D, Rooney W, Foundas A and Bourdette D, 2015. Polyphenon E, non‐futile at neuroprotection in multiple sclerosis but unpredictably hepatotoxic: phase I single group and phase II randomized placebo‐controlled studies. Journal of The Neurological Sciences, 358, 46–52. [DOI] [PMC free article] [PubMed] [Google Scholar]
- Lugg ST, Menezes DB and Gompertz S, 2015. Chinese green tea and acute hepatitis: a rare yet recurring theme. BMJ Case Reports, pii: bcr2014208534. [DOI] [PMC free article] [PubMed] [Google Scholar]
- Mädge I, Cramer L, Rahaus I, Jerz G, Winterhalter P and Beuerle T, 2015. Pyrrolizidine alkaloids in herbal teas for infants, pregnant or lactating women. Food Chemistry, 187, 491–498. [DOI] [PubMed] [Google Scholar]
- Maki KC, Reeves MS, Farmer M, Yasunaga K, Matsuo N, Katsuragi Y, Komikado M, Tokimitsu I, Wilder D, Jones F, Blumberg JB and Cartwright Y, 2008. Green tea catechin consumption enhances exercise‐induced abdominal fat loss in overweight and obese adults. The Journal of nutrition, 139, 264–270. [DOI] [PubMed] [Google Scholar]
- Martena MJ, Grutters MM, De Groot HN, Konings EJM and Rietjens IM, 2011. Monitoring of polycyclic aromatic hydrocarbons (PAH) in food supplements containing botanicals and other ingredients on the Dutch market. Food Additives and Contaminants: Part A, 28, 925–942. [DOI] [PubMed] [Google Scholar]
- Martínez‐Domínguez G, Romero‐González R and Frenich AG, 2016. Multi‐class methodology to determine pesticides and mycotoxins in green tea and royal jelly supplements by liquid chromatography coupled to Orbitrap high resolution mass spectrometry. Food Chemistry, 197, 907–915. [DOI] [PubMed] [Google Scholar]
- Mata‐Bilbao ML, Andrés‐Lacueva C, Roura E, Jáuregui O, Escribano E, Torre C and Lamuela‐Raventós RM, 2008. Absorption and pharmacokinetics of green tea catechins in beagles. British Journal of Nutrition, 100, 496–502. [DOI] [PubMed] [Google Scholar]
- Matsui Y, Fukuhara I, Takeshita M, Osaki N and Hibi N, 2016. Efficacy and Safety of Powdered Beverage Containing Green Tea Catechins on Body Fat in Obese Adults –A Randomized, Placebo‐controlled, Double‐blind Parallel Study–. Jpn Pharmacol Ther vol. 44, no. 7. Original paper in Japanese. Translation to English provided by interested parties (‘Documentation provided to EFSA’ n. 3).
- Matsuyama T, Tanaka Y, Kamimaki I, Nagao T and Tokimitsu I, 2008. Catechin safely improved higher levels of fatness, blood pressure, and cholesterol in children. Obesity, 16, 1338–1348. [DOI] [PubMed] [Google Scholar]
- Mazzanti G, Menniti‐Ippolito F, Moro PA, Cassetti F, Raschetti R, Santuccio C and Mastrangelo S, 2009. Hepatotoxicity from green tea: a review of the literature and two unpublished cases. European Journal of Clinical Pharmacology, 65, 331–341. [DOI] [PubMed] [Google Scholar]
- Mazzanti G, Di Sotto A and Vitalone A, 2015. Hepatotoxicity of green tea: an update. Archives of Toxicology, 89, 1175–1191. [DOI] [PubMed] [Google Scholar]
- McCormick DL, Johnson WD, Morrissey RL and Crowell JA, 1999. Subchronic oral toxicity of epigallocatechin gallate (EGCG) in rats and dogs. Toxicological Sciences, 48, 57. [Google Scholar]
- McLarty J, Bigelow RL, Smith M, Elmajian D, Ankem M and Cardelli JA, 2009. Tea polyphenols decrease serum levels of prostate‐specific antigen, hepatocyte growth factor, and vascular endothelial growth factor in prostate cancer patients and inhibit production of hepatocyte growth factor and vascular endothelial growth factor in vitro. Cancer Prevention Research, 2, 673–682. [DOI] [PubMed] [Google Scholar]
- Medina‐Caliz I, Garcia‐Cortes M, Gonzalez‐Jimenez A, Cabello MR, Robles‐Diaz M, Sanabria‐Cabrera J and Jimenez‐Perez M, 2018. Herbal and dietary supplement‐induced Liver Injuries in the Spanish DILI Registry. Clinical Gastroenterology and Hepatology, pii: S1542‐3565(18)30010‐7. [DOI] [PubMed] [Google Scholar]
- Merz KH and Schrenk D, 2016. Interim relative potency factors for the toxicological risk assessment of pyrrolizidine alkaloids in food and herbal medicines. Toxicology Letters, 263, 44–57. [DOI] [PubMed] [Google Scholar]
- Meshitsuka S, Shingaki S, Hotta M, Goto M, Kobayashi M, Ukawa Y, Sagesaka YM, Wada Y, Nojima M and Suzuki K, 2017. Phase 2 trial of daily, oral epigallocatechin gallate in patients with light‐chain amyloidosis. International Journal of Hematology, 105, 295–308. [DOI] [PubMed] [Google Scholar]
- Mielgo‐Ayuso J, Barrenechea L, Alcorta P, Larrarte E, Margareto J and Labayen I, 2014. Effects of dietary supplementation with epigallocatechin‐3‐gallate on weight loss, energy homeostasis, cardiometabolic risk factors and liver function in obese women: randomised, double‐blind, placebo‐controlled clinical trial. British Journal of Nutrition, 111, 1263–1271. [DOI] [PubMed] [Google Scholar]
- MINSAL (Ministero della Salute Italia) , 2016. Available online: http://www.salute.gov.it/imgs/C_17_pagineAree_1268_listaFile_itemName_4_file.pdf
- Mitscher LA, Jung M, Shankel D, Dou JH, Steele L and Pillai SP, 1997. Chemoprotection: a review of the potential therapeutic antioxidant properties of green tea (Camellia sinensis) and certain of its constituents. Medicinal Research Reviews, 17, 327–365. [DOI] [PubMed] [Google Scholar]
- Morita O, Kirkpatrick JB, Tamaki Y, Chengelis CP, Beck MJ and Bruner RH, 2009. Safety assessment of heat‐sterilized green tea catechin preparation: a 6‐month repeat‐dose study in rats. Food and Chemical Toxicology, 47, 1760–1770. [DOI] [PubMed] [Google Scholar]
- Mulder PP, Sánchez PL, These A, Preiss‐Weigert A and Castellari M, 2015. Occurrence of Pyrrolizidine alkaloids in food. EFSA Supporting Publication 2015:EN‐859, 1–114 pp.
- Murakami A, 2014. Dose‐dependent functionality and toxicity of green tea polyphenols in experimental rodents. Archives of Biochemistry and Biophysics, 557, 3–10. [DOI] [PubMed] [Google Scholar]
- Muramatsu K, 1991. Science of Tea. Asasou Press, Japan: (in Japanese). [Google Scholar]
- Murugesh CS, Manoj JB, Haware DJ, Ravi R and Subramanian R, 2017. Influence of water quality on nutritional and sensory characteristics of green tea infusion. Journal of Food Process Engineering, 40. [Google Scholar]
- Nagao T, Komine Y, Soga S, Meguro S, Hase T, Tanaka Y and Tokimitsu I, 2005. Ingestion of a tea rich in catechins leads to a reduction in body fat and malondialdehyde‐modified LDL in men–. The American Journal of Clinical Nutrition, 81, 122–129. [DOI] [PubMed] [Google Scholar]
- Nagao T, Hase T and Tokimitsu I, 2007. A green tea extract high in catechins reduces body fat and cardiovascular risks in humans. Obesity, 15, 1473–1483. [DOI] [PubMed] [Google Scholar]
- Nagao T, Meguro S, Hase T, Otsuka K, Komikado M, Tokimitsu I, Yamamoto T and Yamamoto K, 2009. A catechin‐rich beverage improves obesity and blood glucose control in patients with type 2 diabetes. Obesity, 17, 310–317. [DOI] [PubMed] [Google Scholar]
- Navarro VJ, Bonkovsky HL, Hwang SI, Vega M, Barnhart H and Serrano J, 2013. Catechins in dietary supplements and hepatotoxicity. Digestive Diseases and Sciences, 58, 2682–2690. [DOI] [PMC free article] [PubMed] [Google Scholar]
- Navarro VJ, Barnhart H, Bonkovsky HL, Davern T, Fontana RJ and Grant L, 2014. Liver injury from herbals and dietary supplements in the U.S. Drug‐Induced Liver Injury Network. Hepatology, 60, 399–1408. [DOI] [PMC free article] [PubMed] [Google Scholar]
- Navarro VJ, Khan I, Björnsson E, Seeff LB, Serrano J and Hoofnagle JH, 2017. Liver injury from herbal and dietary supplements. Hepatology, 65, 363–373. [DOI] [PMC free article] [PubMed] [Google Scholar]
- Neuman MG, Cohen L, Opris M, Nanau RM and Jeong H, 2015. Hepatotoxicity of pyrrolizidine alkaloids. Journal of Pharmacy and Pharmaceutical Sciences, 18, 825–843. [DOI] [PubMed] [Google Scholar]
- Nguyen MM, Ahmann FR, Nagle RB, Hsu CH, Tangrea JA, Parnes HL, Sokoloff MH, Gretzer MB and Chow HS, 2012. Randomized, double‐blind, placebo‐controlled trial of polyphenon E in prostate cancer patients before prostatectomy: evaluation of potential chemopreventive activities. Cancer Prevention Research, 5, 290–298. [DOI] [PMC free article] [PubMed] [Google Scholar]
- Ni CX, Gong H, Liu Y, Qi Y, Jiang CL and Zhang JP, 2017. Green tea consumption and the risk of liver cancer: a meta‐analysis. Nutrition and Cancer, 69, 211–220. [DOI] [PubMed] [Google Scholar]
- NTP (National Toxicology Program), 2016. Toxicology Studies of Green Tea Extract in F344/NTac Rats and B6C3F1/N Mice and Toxicology and Carcinogenesis Studies of Green Tea Extract in Wistar Han[Crl:WI(Han)] Rats and B6c3f1/N Mice (Gavage Studies). [DOI] [PMC free article] [PubMed]
- OECD (Organization for Economic Cooperation and Development), 1998. OECD guideline for testing of chemicals, 408. Repeated dose 90‐day oral toxicity study in rodents.
- Okushio K, Matsumoto N, Suzuki M, Nanjo F and Hara Y, 1995. Absorption of (‐)‐epigallocatechin gallate into rat portal vein. Biological and Pharmaceutical Bulletin, 18, 190–191. [DOI] [PubMed] [Google Scholar]
- Oritani Y, Setoguchi Y, Ito R, Maruki‐Uchida H, Ichiyanagi T and Ito T, 2013. Comparison of (−)‐epigallocatechin‐3‐O‐gallate (EGCG) and O‐methyl EGCG bioavailability in rats. Biological and Pharmaceutical Bulletin, 36, 1577–1582. [DOI] [PubMed] [Google Scholar]
- Otsuka K, Uchida H, Yuzawa M, Fumoto S, Tomonobu K, Chikama A, Hase T, Watanabe H, Tokimitsu I and Itakura H, 2002. Effects of tea catechins on body fat metabolism in women. Japanese Journal of Nutrition Assess, 19, 365–376. Original paper in Japanese. Translation to English provided by interested parties (‘Documentation provided to EFSA’ n. 3). [Google Scholar]
- Papadopoulou A and Frazier RA, 2004. Characterization of protein–polyphenol interactions. Trends in Food Science and Technology, 15, 186–190. [Google Scholar]
- Pasrija D and Anandharamakrishnan C, 2015. Techniques for extraction of green tea polyphenols: a review. Food and Bioprocess Technology, 8, 935–950. [Google Scholar]
- Pedrós C, Cereza G, García N and Laporte JR, 2003. Hepatotoxicidad por extracto etanólico seco de Camellia sinensis. Medicina Clínica, 121, 598–599. [DOI] [PubMed] [Google Scholar]
- Peters CM, Green RJ, Janle EM and Ferruzzi MG, 2010. Formulation with ascorbic acid and sucrose modulates catechin bioavailability from green tea. Food Research International, 43, 95–102. [DOI] [PMC free article] [PubMed] [Google Scholar]
- Pezeshki A, Safi S, Feizi A, Askari G and Karami F, 2016. The effect of green tea extract supplementation on liver enzymes in patients with nonalcoholic fatty liver disease. International Journal of Preventive Medicine, 7, 28. [DOI] [PMC free article] [PubMed] [Google Scholar]
- Pillukat MH, Bester C, Hensel A, Lechtenberg M, Petereit F, Beckebaum S, Müller KM and Schmidt HH, 2014. Concentrated green tea extract induces severe acute hepatitis in a 63‐year‐old woman–a case report with pharmaceutical analysis. Journal of Ethnopharmacology, 155, 165–170. [DOI] [PubMed] [Google Scholar]
- Rashidinejad A, Birch EJ, Sun‐Waterhouse D and Everett DW, 2017. Addition of milk to tea infusions: helpful or harmful? Evidence from in vitro and in vivo studies on antioxidant properties. Critical Reviews in Food Science and Nutrition, 57, 3188–3196. [DOI] [PubMed] [Google Scholar]
- RKI (Robert Koch Institute), 1998. Verzehr von grünem tee. Bundes‐Gesundheitssurvey Available online: https://www.rki.de/DE/Home/homepage_node.html [Accessed: 19 March 2018]
- Robertson J and Stevens K, 2017. Pyrrolizidine alkaloids: occurrence, biology, and chemical synthesis. Natural Product Reports, 34, 62–89. [DOI] [PubMed] [Google Scholar]
- Rohde J, Jacobsen C and Kromann‐Andersen H, 2011. Toksisk hepatitis udløst af grøn te. Ugeskr Læger, 173, 205–206. [PubMed] [Google Scholar]
- Roowi S, Stalmach A, Mullen W, Lean ME, Edwards CA and Crozier A, 2009. Green tea flavan‐3‐ols: colonic degradation and urinary excretion of catabolites by humans. Journal of agricultural and food chemistry, 58(2), 1296–1304. [DOI] [PubMed] [Google Scholar]
- Roshdy E, Rajaratnam V, Maitra S, Sabry M, Allah ASA and Al‐Hendy A, 2013. Treatment of symptomatic uterine fibroids with green tea extract: a pilot randomized controlled clinical study. International Journal of Women's Health, 5, 477. [DOI] [PMC free article] [PubMed] [Google Scholar]
- Sakata R, Nakamura T, Torimura T, Ueno T and Sata M, 2013. Green tea with high‐density catechins improves liver function and fat infiltration in non‐alcoholic fatty liver disease (NAFLD) patients: a double‐blind placebo‐controlled study. International Journal of Molecular Medicine, 32, 989–994. [DOI] [PubMed] [Google Scholar]
- Sarma DN, Barrett ML, Chavez ML, Gardiner P, Ko R, Mahady GB, Marles RJ, Pellicore LS, Giancaspro GI and Dog TL, 2008. Safety of green tea extracts. Drug Safety, 31, 469–484. [DOI] [PubMed] [Google Scholar]
- SCF (Scientific Committee on Foods), European Union 1997. Opinion on the potential microbiological risk arising from the presence of moisture in tea (expressed on 19th September 1997).
- Schmidt M, Schmitz HJ, Baumgart A, Guedon D, Netsch MI, Kreuter MH, Schmidlin CB and Schrenk D, 2005. Toxicity of green tea extracts and their constituents in rat hepatocytes in primary culture. Food and Chemical Toxicology, 43, 307–314. [DOI] [PubMed] [Google Scholar]
- Scholz E and Bertram B, 1995. Camellia sinensis (L.) O. Kuntze. Der Teestrauch. Zeitschrift für Phytotherapie, 17, 235–250. [Google Scholar]
- Schulz CM, Fritz H and Ruthenschrör A, 2014. Occurrence of 15+ 1 EU priority polycyclic aromatic hydrocarbons (PAH) in various types of tea (Camellia sinensis) and herbal infusions. Food Additives and Contaminants: Part A, 31, 1723–1735. [DOI] [PubMed] [Google Scholar]
- Seddik M, Lucidarme D, Creusy C and Filoche B, 2001. Is exolise hepatotoxic? Gastroenterologie Clinique et Biologique, 25, 834–835. [PubMed] [Google Scholar]
- Shanafelt TD, Call TG, Zent CS, LaPlant B, Bowen DA, Roos M, Secreto CR, Ghosh AK, Kabat BF, Lee MJ, Yang CS, Jelinek DF, Erlichman C and Kay NE, 2009. Phase I trial of daily oral Polyphenon E in patients with asymptomatic Rai stage 0 to II chronic lymphocytic leukemia. Journal of Clinical Oncology, 27, 3808–3814. [DOI] [PMC free article] [PubMed] [Google Scholar]
- Shanafelt TD, Call TG, Zent CS, Leis JF, LaPlant B, Bowen DA, Roos M, Laumann K, Ghosh AK, Lesnick C, Lee MJ, Yang CS, Jelinek DF, Erlichman C and Kay NE, 2013. Phase 2 trial of daily, oral Polyphenon E in patients with asymptomatic, Rai stage 0 to II chronic lymphocytic leukemia. Cancer, 119, 363–370. [DOI] [PMC free article] [PubMed] [Google Scholar]
- Shen CL, Chyu MC, Pence BC, Yeh JK, Zhang Y, Felton CK, Doctolero S and Wang JS, 2010. Green tea polyphenols supplementation and Tai Chi exercise for postmenopausal osteopenic women: safety and quality of life report. BMC Complementary and Alternative Medicine, 10, 76. [DOI] [PMC free article] [PubMed] [Google Scholar]
- Shen CL, Chyu MC, Yeh JK, Zhang Y, Pence BC, Felton CK, Brismée JM, Arjmandi BH, Doctolero S and Wang JS, 2012. Effect of green tea and Tai Chi on bone health in postmenopausal osteopenic women: a 6‐month randomized placebo‐controlled trial. Osteoporosis International, 23, 1541–1552. [DOI] [PMC free article] [PubMed] [Google Scholar]
- Shen F, Niu F, Li J, Su Y, Liu Y and Yang Y, 2014. Interactions between tea polyphenol and two kinds of typical egg white proteins‐ovalbumin and lysozyme: Effect on the gastrointestinal digestion of both proteins in vitro. Food Research International, 59, 100–107. [Google Scholar]
- Shimshoni JA, Duebecke A, Mulder PP, Cuneah O and Barel S, 2015. Pyrrolizidine and tropane alkaloids in teas and the herbal teas peppermint, rooibos and chamomile in the Israeli market. Food Additives and Contaminants: Part A, 32, 2058–2067. [DOI] [PubMed] [Google Scholar]
- Stalmach A, Troufflard S, Serafini M and Crozier A, 2009. Absorption, metabolism and excretion of Choladi green tea flavan‐3‐ols by humans. Molecular Nutrition and Food Research, 53, S44‐53. [DOI] [PubMed] [Google Scholar]
- Stalmach A, Mullen W, Steiling H, Williamson G, Lean ME and Crozier A, 2010. Absorption, metabolism, and excretion of green tea flavan‐3‐ols in humans with an ileostomy. Molecular Nutrition and Food Research, 54, 323–334. [DOI] [PubMed] [Google Scholar]
- Stegelmeier BL, Colegate SM and Brown AW, 2016. Dehydropyrrolizidine alkaloid toxicity, cytotoxicity, and carcinogenicity. Toxins, 8, 356. [DOI] [PMC free article] [PubMed] [Google Scholar]
- Sun J, Chen P, Lin LZ and Harnly JM, 2011. A non‐targeted approach to chemical discrimination between green tea dietary supplements and green tea leaves by HPLC/MS. Journal of AOAC International, 94, 487–497. [PMC free article] [PubMed] [Google Scholar]
- Suzuki, Kajimoto O, Nozawa A, Nagata K, Unno T, Sagesaka YM, Kakuda T, Iida T and Kajimoto Y, 2005. Safety of excessive ingestion of a beverage containing green tea catechins. Journal of Nutritional Food, 8, 1–12. [Google Scholar]
- Takagaki A and Nanjo F, 2009. Metabolism of (−)‐epigallocatechin gallate by rat intestinal flora. Journal of agricultural and food chemistry, 58(2), 1313–1321. [DOI] [PubMed] [Google Scholar]
- Takami S, Imai T, Hasumura M, Cho YM, Onose J and Hirose M, 2008. Evaluation of toxicity of green tea catechins with 90‐day dietary administration to F344 rats. Food and Chemical Toxicology, 46, 2224–2229. [DOI] [PubMed] [Google Scholar]
- Takeshita M, Takashima S, Harada U, Shibata E, Hosoya N, Takase H, Otsuka K, Meguro S, Komikado M and Tokimitsu I, 2008. Effects of long‐term consumption of tea catechins‐enriched beverage with no caffeine on body composition in humans. Japanese Pharmacology Ther, 36, 767–776. Original paper in Japanese. Translation to English provided by interested parties (‘Documentation provided to EFSA’ n. 3). [Google Scholar]
- THIE (Tea and Herbal Infusions Europe), 2016. Available online: http://www.thie-online.eu/fileadmin/inhalte/Publications/Tea/2016-05-19_ISSUE_4_Compendium_of_Guidelines_for_Tea.pdf
- Tomata Y, Kakizaki M, Nakaya N, Tsuboya T, Sone T, Kuriyama S and Tsuji I, 2012. Green tea consumption and the risk of incident functional disability in elderly Japanese: the Ohsaki Cohort 2006 Study–. The American Journal of Clinical Nutrition, 95, 732–739. [DOI] [PMC free article] [PubMed] [Google Scholar]
- Toolsee NA, Aruoma OI, Gunness TK, Kowlessur S, Dambala V, Murad F and Bourdon E, 2013. Effectiveness of green tea in a randomized human cohort: relevance to diabetes and its complications. BioMed Research International. [DOI] [PMC free article] [PubMed] [Google Scholar]
- Tsuchida T and Itakura H, 2002. Reduction of body fat in humans by long‐term ingestion of catechins. Progress in Medicine. September: Reprint, 9(22). Original paper in Japanese. Translation to English provided by interested parties (‘Documentation provided to EFSA’ n. 3).
- Ukawa Y, Hatakeyama Y, Noro A, Fukuhara I and Sagesaka YM, 2013. Effect of consumption of tea beverage containing catechins with a galloyl moiety on lipid excretion into feces, Jpn. Pharmacol. Ther, 41, 919‐927. Original paper in Japanese. Translation to English provided by interested parties (‘Documentation provided to EFSA’ n. 3).
- Ullmann U, Haller J, Decourt JP, Girault N, Girault J, Richard‐Caudron AS, Pineau B and Weber P, 2003. A single ascending dose study of epigallocatechin gallate in healthy volunteers. Journal of International Medical Research, 31, 88–101. [DOI] [PubMed] [Google Scholar]
- Ullmann U, Haller J, Decourt JP, Girault N, Spitzer V and Weber P, 2004. Plasma‐kinetic characteristics of purified and isolated green tea catechin epigallocatechin gallate (EGCG) after 10 days repeated dosing in healthy volunteers. International Journal for Vitamin and Nutrition Research, 74, 269–278. [DOI] [PubMed] [Google Scholar]
- Unachukwu UJ, Ahmed S, Kavalier A, Lyles JT and Kennelly EJ, 2010. White and green teas (Camellia sinensis var. sinensis): variation in phenolic, methylxanthine, and antioxidant profiles. Journal of Food Science, 75, C541–C548. [DOI] [PubMed] [Google Scholar]
- US Pharmacopeia , 2007. National Formulary 25. US Pharmacopeial Convention, Rockville, MD. 1654 pp. [Google Scholar]
- US Pharmacopeia , 2008. 2 supplement. ISSN: 1930‐2908. ISSN online: 1930‐2916. 12601 Twinbrook Parkway, Rockville, MD 20852.
- US Pharmacopeia , 2017. Volume 4, USP 40, NF 35. The Unites States Pharmacopeial Convention 12601 Twinbook Parkway, Rockville, MD 20852.
- USDA ARS (United States Department of Agriculture, Agricultural Research Service), online. National Genetic Resources Program. Germplasm Resources Information Network (GRIN). National Germplasm Resources Laboratory, Beltsville, Maryland. Available online: http://www.ars-grin.gov/cgi-bin/npgs/html/tax_search.pl
- USP Pharmacists Pharmacopeia , 2008. 2 supplement. ISSN: 1930‐2908. ISSN online: 1930‐2916. 12601 Twinbrook Parkway, Rockville, MD 20852.
- Vial T, Bernard G, Lewden B, Dumortier J and Descotes J, 2003. Acute hepatitis due to Exolise, a Camellia sinensis‐derived drug. Gastroenterologie Clinique et Biologique, 27, 1166–1167. [PubMed] [Google Scholar]
- Wang H, Provan GJ and Helliwell K, 2000. Tea flavonoids: their functions, utilisation and analysis. Trends in Food Science and Technology, 11, 152–160. [Google Scholar]
- Wang JS, Luo H, Wang P, Tang L, Yu J, Huang T, Cox S and Gao W, 2008. Validation of green tea polyphenol biomarkers in a phase II human intervention trial. Food and Chemical Toxicology, 46, 232–240. [DOI] [PMC free article] [PubMed] [Google Scholar]
- Wang H, Wen Y, Du Y, Yan X, Guo H, Rycroft JA, Boon N, Kovacs EMR and Mela DJ, 2010. Effects of catechin enriched green tea on body composition. Obesity, 18, 773–779. [DOI] [PubMed] [Google Scholar]
- Weise S, Esatbeyoglu T, Winterhalter P, Kruse HP, Winkler S, Bub A and Kulling SE, 2015. Comparative biokinetics and metabolism of pure monomeric, dimeric, and polymeric flavan‐3‐ols: a randomized cross‐over study in humans. Molecular Nutrition and Food Research, 59, 610–621. [DOI] [PubMed] [Google Scholar]
- Weiss DJ and Anderton CR, 2003. Determination of catechins in matcha green tea by micellar electrokinetic chromatography. Journal of Chromatography A, 1011, 173–180. [DOI] [PubMed] [Google Scholar]
- Widlansky ME, Hamburg NM, Anter E, Holbrook M, Kahn DF, Elliott JG, Keaney JF and Vita JA, 2007. Acute EGCG supplementation reverses endothelial dysfunction in patients with coronary artery disease. Journal of the American College of Nutrition, 26, 95–102. [DOI] [PMC free article] [PubMed] [Google Scholar]
- Wu KM, Yao J and Boring D, 2011. Green tea extract‐induced lethal toxicity in fasted but not in nonfasted dogs. International Journal of Toxicology, 30, 19–20. [DOI] [PubMed] [Google Scholar]
- Wu AH, Spicer D, Stanczyk FZ, Tseng C, Yang CS and Pike MC, 2012. Effect of 2‐month controlled green tea intervention on lipoprotein cholesterol, glucose, and hormonal levels in healthy postmenopausal women. Cancer Prevention Research, 5, 393–402. [DOI] [PMC free article] [PubMed] [Google Scholar]
- Xu YQ, Hu XF, Zou C, Shi J, Du QZ, Teng BT and Yin JF, 2017. Effect of saccharides on sediment formation in green tea concentrate. LWT‐Food Science and Technology, 78, 352–360. [Google Scholar]
- Yang DJ, Hwang LS and Lin JT, 2007. Effects of different steeping methods and storage on caffeine, catechins and gallic acid in bag tea infusions. Journal of Chromatography A, 1156, 312–320. [DOI] [PubMed] [Google Scholar]
- Yates AA, Erdman JW Jr, Shao A, Dolan LC and Griffiths JC, 2017. Bioactive nutrients‐time for tolerable upper intake levels to address safety. Regulatory Toxicology and Pharmacology, 84, 94–101. [DOI] [PubMed] [Google Scholar]
- Yoneda T, Shoji K, Takase H, Hibi M, Hase T, Meguro S, Tokimitsu I and Kambe H, 2009. Effectiveness and safety of 1‐year ad libitum consumption of a high‐catechin beverage under nutritional guidance. Metabolic Syndrome and Related Disorders, 7, 349–356. [DOI] [PubMed] [Google Scholar]
- Yoshida M, Takahashi M, Inoue K, Nakae D and Nishikawa A, 2011. Lack of chronic toxicity and carcinogenicity of dietary administrated catechin mixture in Wistar Hannover GALAS rats. The Journal of Toxicological Sciences, 36, 297–311. [DOI] [PubMed] [Google Scholar]
- Yoshikawa T, Yamada H, Matsuda K, Niino H, Sagesaka YM, Kakuda T, Toyoizumi K, Matsumoto K, Kosuge K, Uchida S, Onoue S, Yamada S and Umegaki K, 2012. Effects of short‐term consumption of a large amount of tea catechins on chromosomal damage, oxidative stress markers, serum lipid, folic acid, and total homocysteine levels: a randomized, double‐blind, controlled study. Rinsho Yakuri/Japanese Journal of Clinical Pharmacology and Therapeutics, 43, 9–16. [Google Scholar]
- Yu Z, Samavat H, Dostal A, Wang R, Torkelson CJ, Yang CS, Butler LM, Kensler TW, Wu AH, Kurzer MS and Yuan JM, 2017. Effect of green tea supplements on liver enzyme elevation: results from a randomized intervention study in the United States. Cancer Prevention Research, , 10, 571–579. [DOI] [PMC free article] [PubMed] [Google Scholar]
- Zhang H, Li Y, Lv Y, Jiang Y, Pan J, Duan Y, Zhu Y and Zhang S, 2017. Influence of brewing conditions on taste components in fuding white tea infusions. Journal of The Science of Food and Agriculture, 97, 2826–2833. [DOI] [PubMed] [Google Scholar]
- Zheng EX, Rossi S, Fontana RJ, Vuppalanchi R, Hoofnagle JH, Khan I and Navarro VJ, 2016. Risk of liver injury associated with green tea extract in SLIMQUICK® weight loss products: results from the DILIN prospective study. Drug Safety, 39, 749–754. [DOI] [PMC free article] [PubMed] [Google Scholar]
- Zimmerman HJ, 1978. Drug‐induced liver disease In: Hepatotoxicity, The Adverse Effects of Drugs and Other Chemicals on the Liver, 1st Edition Appleton‐Century‐Crofts, New York: pp. 351–353. [Google Scholar]
- Zimmerman HJ, 1999. Drug‐induced liver disease In: Hepatotoxicity, The Adverse Effects of Drugs and Other Chemicals on the Liver, 2nd Edition Lippincott Williams & Wilkins, Philadelphia: pp. 428–433. [Google Scholar]