Abstract
This report provides an insight into the official control activities carried out by EU Member States, Iceland and Norway in 2016. Based on the analytical results provided by the reporting countries, a detailed data analysis was performed regarding pesticide occurrence in the most important food products consumed and the dietary risk related to the exposure of European consumers to pesticide residues. Overall, 96.2% of the 84,657 samples analysed fell within the legal limits (81,482 samples). In total, 50.7% of the tested samples were free of quantifiable residues (residue levels below the limit of quantification (LOQ)), while 45.5% of the samples analysed contained quantified residues not exceeding the maximum residue levels (MRLs). The findings on pesticide residues are described for the following categories: products of plant origin, products of animal origin, imported food, organic products and baby food. The acute and chronic dietary risk assessment indicated that the probability of European citizens being exposed to pesticide residue levels that could lead to negative health outcomes was low. Based on the analysis of the 2016 pesticide monitoring results, EFSA derived a number of recommendations to increase the efficiency of the European control systems to ensure a high level of consumer protection.
Keywords: pesticide residues, food control, monitoring, maximum residue levels, consumer risk assessment, Regulation (EC) No 396/2005
Short abstract
This publication is linked to the following EFSA Supporting Publications article: http://onlinelibrary.wiley.com/doi/10.2903/sp.efsa.2018.EN-1454/full
Summary
This report provides an overview of the 2016 official control activities carried out in the European Union (EU) Member States, Iceland and Norway. It summarises the results of both the 2016 EU‐coordinated control programme (EUCP) and the results of national control programmes (NP). While the national control programmes are mostly risk based – focussing on pesticides or products originating from countries where an increased number of violations have been observed in the past – the EUCP aims to present a statistically representative snapshot of the situation of pesticide residues in food products that are the most widely consumed in the EU. The report includes the outcome of a dietary risk assessment based on the results of the 2016 control programme.
The comprehensive analysis of the results of all reporting countries provides risk managers with a scientifically sound basis for designing future monitoring programmes, in particular for taking decisions on which pesticides and food products should be targeted in risk‐based national programmes.
EU‐coordinated control programme (EUCP)
In the framework of the EUCP, 12,168 samples were analysed covering 165 pesticides in 11 food products.
Overall, 98.3% of the samples analysed in the 2016 EUCP fell within the legal limits (11,965 samples); 6,367 samples (52.3%) were free of quantifiable residues (residues below the limit of quantification (LOQ)). The number of samples with quantified residues, but within the legally permitted level (at or above the LOQ but below the maximum residue level (MRL)) was 5,598 (46.0%). In 1.7% of the samples analysed the MRL was exceeded (203 samples). In total, 0.9% of the samples (107 samples) were considered to be not compliant with the legal limits taking into account the measurement uncertainty.
Compared with 2013, when the same commodities were analysed, the MRL exceedance rate in 2016 is higher (1.7% in 2016 compared to 0.9% in 2013). This significant increase was mainly driven by the high number of exceedances regarding residues of chlorpyrifos, an active substance for which the MRLs were lowered for many crops during 2016 (59 exceedances were reported out of the 10,212 samples analysed for this pesticide). In addition, a number of MRL exceedances were reported by France for dimethoate in tomatoes produced in the Mayotte oversea territory (32 exceedances in 9,618 samples reported). These samples have been taken by France following a more focussed control programme and are therefore not fully representative for tomatoes available to European consumers.
Of the 165 pesticides analysed in the EUCP regulation, 157 were sought in food of plant origin and 22 in food of animal origin.
Among the 157 pesticides analysed in plant products, 28 pesticides were not found in quantifiable concentrations in any of the samples analysed; residues exceeding the legal limits were related to 56 pesticides.
Among the unprocessed plant products analysed, the lowest MRL exceedance rate was recorded for rye, followed by head cabbage, strawberries, peaches, leek, lettuce, tomatoes and apples. A low MRL exceedance rate was found in wine.
Regarding food products of animal origin (cow's milk and swine fat), 11 of the 22 pesticides covered by the EUCP were not found in quantifiable concentrations in any of the samples tested. The remaining 11 pesticides were detected in quantifiable concentrations. The most frequently quantified pesticides were dichlorodiphenyltrichloroethane (DDT), hexachlorobenzene and chlordane, i.e. persistent organic pollutants (POPs) and non‐approved pesticides present in the food chain due to their persistence. No MRL exceedance was identified in cow's milk and a low MRL exceedance rate was found in swine fat.
EU‐coordinated and national programmes (EUCP + NP)
In 2016, the reporting countries analysed 84,657 samples for 791 different pesticides. On average, 230 pesticides were analysed per sample. The majority of the samples (56,749, 67% of the total) originated from the reporting countries (EU, Iceland and Norway); 22,345 samples (26.4%) concerned products imported from third countries. For 5,563 samples (6.6%), the origin of the products was unknown.
Overall, 96.2% of the samples analysed in 2016 (EUCP and national programmes) fell within the legal limits (81,482 samples), i.e. the measured levels did not exceed the MRLs permitted in EU legislation; more specifically, 50.7% of the samples tested were free of quantifiable residues (residue levels below the LOQ), while 45.5% contained quantified residues below the MRLs. In 3.8% of the samples, the residue levels exceeded the MRLs (3,175 samples).1 Taking into account the analytical measurement uncertainty, 2.2% of the samples (1,833 samples) clearly exceeded these legal limits (non‐compliance) triggering legal or administrative actions by competent authorities.
In the previous reporting year (2015), 97.2% of the samples fell within the legal limits and 53.3% were free of quantifiable residues. The difference in the MRL exceedance rate between 2015 and 2016 is mainly attributed to the finding of chlorate residues, a compound that was included for the first time in the pesticide data collection.
MRLs were exceeded in 7.2% of the samples from third countries; for 4.7% of the samples, the legal limit was clearly exceeded taking into account the measurement uncertainty (non‐compliance). Products from reporting countries (EU, Iceland and Norway) had lower rates of MRL exceedance and non‐compliance: 2.4% of the samples contained residues that exceeded the MRL, while 1.2% of the samples were non‐compliant.
In 2016, 65,010 consignments of products covered by Regulation (EC) No 669/2009 on an increased level of official controls on imports of certain feed and food of non‐animal origin were imported to the European Union. For laboratory analyses, 8,092 of these consignments were selected. A total of 343 (4.3%) were considered as non‐compliant with EU legislation on pesticide residues MRLs, taking into account the measurement uncertainty.
In 2016, 1,676 samples of food intended for infants and young children were analysed. In 89.8% of the samples, no quantifiable residues were found (residues below the LOQ), whereas 171 samples (10.2%) contained quantifiable residues at or above the LOQ. Of these samples, 32 (1.9% of the baby food samples) exceeded the MRL of 0.01 mg/kg applicable for baby food.2 The top three most frequently measured residues were copper, chlorates and fosetyl‐Al.
In 2016, 5,495 samples of organic food (not including baby food samples) were taken; 4,568 samples (83.1%) were free of quantifiable residues. The percentage of organic samples containing residues in concentrations within the legal limits was 15.6% (856 samples); a significant portion of these samples contained only residues of substances that do not necessarily come from the use of pesticides (e.g. naturally occurring substances and persistent organic pollutants). The MRLs were exceeded in 1.3% of the organic samples analysed (71 samples) of which 0.7% (41 samples) were non‐compliant after measurement uncertainty was taken into account.
In unprocessed food products, 50.1% of the samples were free of quantifiable residues, 46.9% of the samples contained quantified residues within legal limits and 3.9% exceeded the MRL. By comparison, processed products had a higher rate of samples without quantified residues (63.8%) and a lower occurrence of quantified residues (33.4%) as well as lower MRL exceedances rate (2.8%).
In total, 8,351 samples of products of animal origin were analysed. The majority of these samples was free of quantifiable residues (6,906 samples, 83%), while the MRL exceedance rate amounted to 1.9% of the samples. The MRL exceedances were mainly due to chlorate residues in milk. Chlorate is a substance that is formed as by‐product of the use of chlorine disinfectants; thus, it is not necessarily related to the use as plant protection product. In 2016, chlorate was reported for the first time in the framework of the national pesticide monitoring programme.
Residues of more than one pesticide (multiple residues) were found in 30.1% of the samples. The frequency of multiple residues in unprocessed products (32.5%) is higher than in processed products (13.4%). In the unprocessed products, the highest frequency of multiple residues was found in gooseberries (85.7% of the total samples analysed), hops (81.8%), grapefruits (73.1%), currants (72%), blackberries (68.4%), table grapes (68.1%), raspberries (66.9%) and strawberries (65.4%).
Short‐term dietary exposure assessment
The European Food Safety Authority (EFSA) performed the acute (short‐term) dietary risk assessment for the pesticide/food product combinations covered by the EUCP. Overall, 122 pesticides were assessed. For 89 of those pesticides, the exposure was below the acute reference dose (ARfD). For the other 33 pesticides, the exposure assessment exceeded the ARfD in 209 samples (1.0% of the samples tested). The products with the highest number of exceedances of the ARfD were apples (76 samples), lettuce (46), peaches (39) and tomatoes (29). The pesticides which most frequently exceeded the ARfD were chlorpyrifos, iprodione and lambda‐cyhalothrin. Considering these findings, EFSA concluded that the probability of being exposed to pesticide residues exceeding concentrations that may lead to negative health effects is low.
Long‐term dietary exposure assessment
The long‐term (chronic) exposure was calculated for all pesticides covered by the EUCP. For the first time, the calculations took into account results for all types of food products which are covered by the dietary intake model used for consumer risk assessment. Two scenarios were calculated, i.e. the adjusted upper‐bound and the lower‐bound scenario. The adjusted upper‐bound exposure assessment methodology is a conservative screening, which is likely to overestimate the real risk as for samples without quantifiable residues it was assumed that residues were present at the numerical level of the LOQ. The lower‐bound approach is based on assumptions that may underestimate the exposure to a certain extent, since it postulates that samples with residues reported as below the LOQ are completely free of the related pesticide.
According to the adjusted upper‐bound scenario, the exposure amounted to less than 100% of the ADI for all pesticides except for dieldrin, dichlorvos, dimethoate (omethoate scenario) and the dithiocarbamates (ziram scenario, ziram being the dithiocarbamate with the highest chronic toxicity). For 142 pesticides out of the 165 covered by the EUCP, the estimated long‐term exposure was less than 10% of the ADI; for 73 of these, exposure was lower than 1% of the ADI. In the lower‐bound scenario, a wide safety margin to the ADI was observed for all pesticides assessed. The estimated exposure was significantly lower in the lower‐bound scenario compared to the upper‐bound approach. It is to be noted that the high proportion of samples with pesticide residues below the LOQ results in a significant difference in the total exposure calculated between the lower‐bound and upper‐bound scenarios. EFSA concluded that according to the current scientific knowledge, the long‐term dietary exposure to pesticides covered by the 2016 EUCP was unlikely to pose a health risk to consumers.
1. Background
1.1. Legal Basis
Pesticide residues resulting from the use of plant protection products on crops or food products that are used for food or feed production may pose a risk for public health. For this reason, a comprehensive legislative framework has been established in the European Union (EU), which defines rules for the approval of active substances used in plant protection products,3 the use of plant protection products and for pesticide residues in food. In order to ensure a high level of consumer protection, legal limits, so called ‘maximum residue levels’ or briefly ‘MRLs’, are established in Regulation (EC) No 396/2005. EU‐harmonised MRLs are set for more than 500 pesticides covering 370 food products/food groups. A default MRL of 0.01 mg/kg is applicable for pesticides not explicitly mentioned in the MRL legislation. Regulation (EC) No 396/2005 imposes on Member States the obligation to carry out controls to ensure that food placed on the market is compliant with the legal limits. This regulation establishes both EU and national control programmes:
EU‐coordinated control programme: this programme defines the food products and pesticides that should be monitored by all Member States. The EU‐coordinated programme (EUCP) relevant for the calendar year 2016 was set up in Commission Implementing Regulation (EU) No 2015/5954 hereafter referred to as ‘2016 monitoring regulation’;
National control programmes: Member States usually define the scope of national control programmes focussing on certain products, which are expected to contain residues in concentrations exceeding the legal limits, or on products that are more likely to pose risks for consumer safety (Article 30 of Regulation (EC) No 396/2005).
According to Article 31 of Regulation (EC) No 396/2005, Member States are requested to share the results of the official controls and other relevant information with the European Commission, the European Food Safety Authority (EFSA) and other Member States. EFSA is responsible for preparing an Annual Report on pesticide residues, analysing the data in view of the MRL compliance of food available in the EU and the exposure of European consumers to pesticide residues. In addition, based on the findings, EFSA should derive recommendations for future monitoring programmes.
Specific MRLs are set in Directives 2006/125/EC5 and 2006/141/EC6 for food intended for infants and young children. Following the precautionary principle, the legal limit for this type of food products was set at a very low level (limit of quantification); in general, a default MRL of 0.01 mg/kg is applicable unless lower legal limits for the residue levels are defined in these Directives. Regulation (EU) No 609/20137 repeals the aforementioned Directives; however, the pesticide MRLs of Directive 2006/125/EC and 2006/141/EC were still applicable in 2016. In the framework of the 2016 EUCP, each Member State had to take at least 10 samples of processed cereal‐based baby food, according to the 2016 monitoring regulation.
It is noted that some of the active substances for which legal limits are set under Regulation (EC) No 396/2005 are also covered by Commission Regulation (EU) No 37/2010 on pharmacologically active substances.8 For these so‐called dual use substances, Member States perform controls in accordance with Council Directive 96/23/EC9 for veterinary medicinal products; results of the controls for dual use substances10 are also reported in the framework of this report.
It should be highlighted that for organic products no specific MRLs are established. Thus, the MRLs set in Regulation (EC) No 396/2005 apply equally to organic food and to conventional food. However, Article 5 of Regulation (EC) No 889/200811 on organic production of agricultural products defines the restriction of using plant protection products.
Regulation (EC) No 669/200912 lays down rules concerning the increased level of official controls to be carried out on a list of food and feed of non‐animal origin which, based on known or emerging risks, requires an increased level of controls prior to their introduction into the EU. The food products, the country of origin of the products, the frequency of checks to be performed at the point of entry into the EU territories and the hazards (e.g. pesticides residues, not approved food additives, mycotoxins) are specified in Annex I to this regulation which is regularly updated; for the calendar year 2016, three updated versions are relevant.13 , 14 , 15
1.2. Terms of Reference
In accordance with Article 32 of Regulation (EC) No 396/2005, EFSA shall prepare an annual report on pesticide residues concerning the official control activities for food and feed carried out in 2016.
The annual report shall include at least the following information:
an analysis of the results of the controls on pesticide residues provided by EU Member States;
a statement of the possible reasons why the MRLs were exceeded, together with any appropriate observations regarding risk management options;
an analysis of chronic and acute risks to the health of consumers from pesticide residues;
an assessment of consumer exposure to pesticide residues based on the information provided by Member States and any other relevant information available, including reports submitted under Directive 96/23/EC.16
In addition, the report may include an opinion on the pesticides that should be included in future programmes.
2. Introduction
This report provides a detailed insight in the control activities at the European level and the most relevant results on the official control activities performed by the EU Member States, including Iceland and Norway that are members of the European Free Trade Association (EFTA) and of the European Economic Area (EEA). The main purpose of the data analysis presented in this report is to give risk managers the necessary information to decide on risk management policy issues. At the same time, the report should also inform citizens who have an interest in food safety on the situation regarding pesticide residue in food. In particular, the following questions should be addressed:
What actions were taken by the national competent authorities responsible for food control to ensure that pesticide residues in food comply with the European food standards?
How frequently were pesticide residues found in food?
Which food products frequently contained pesticide residues?
Which pesticides were found?
Compared with previous years, are there any trends?
In which products were violations of the legal limits identified by the Member States?
Did the residues in food pose a risk to consumer health?
This report, by its use of graphics aims to convey the answers to these questions in a way that can be understood without detailed knowledge of the subject.
Together with this report, EFSA has published an Excel file as a supplement, where detailed results on the determinations/samples exceeding the legal limit can be found. Some of the results presented in this document can also be visualised in an interactive on‐line EFSA Pesticides Dashboard.
The following terminology is used throughout the report to describe the results for the analysed samples:
Samples free of quantifiable residues: the term is used to describe results where the analytes were not present in concentrations at or exceeding the limit of quantification (LOQ). The LOQ is the smallest concentration of an analyte that can be quantified. It is commonly defined as the minimum concentration of the analyte in the test sample that can be determined with acceptable precision and accuracy;
Samples with quantified residues within the legal limits (below or at the MRL): these samples contained quantified residues of one or several pesticides in concentrations below or at the MRL;
Samples with quantified residues exceeding the legal limit (above the MRL) for one or several pesticides, as reported by the Member States;
Non‐compliant samples: Samples containing residue concentrations clearly exceeding the legal limits, taking into account the measurement uncertainty. The concept of measurement uncertainties and the impact on the decision of non‐compliance is described in Figure 1 of the 2014 guidance document on reporting data on pesticide residues (EFSA, 2015a). It is required in official controls that the uncertainty of the analytical measurement is taken into account before legal or administrative sanctions are imposed on food business operators for infringement of the MRL legislation (Codex, 2006; Ellison and Williams, 2012; European Commission, 2018).
Figure 1.
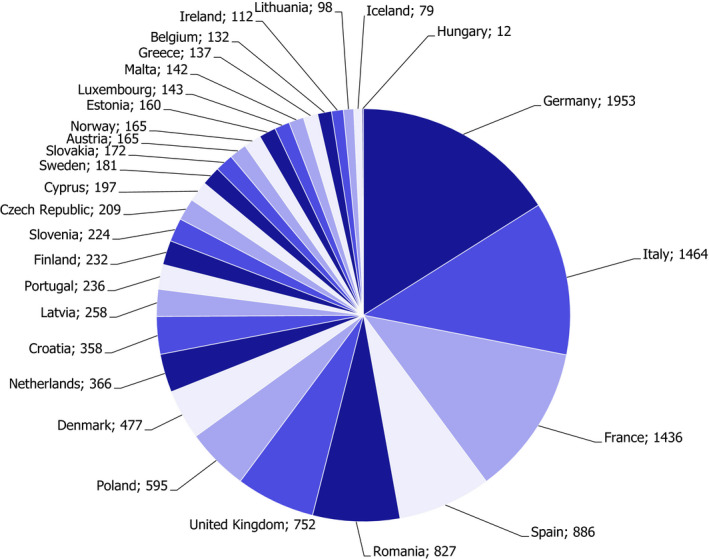
Number of samples taken by reporting country under the EUCP (excluding food for infants and young children)
It is noted that a separate analysis of samples with residues below the limit of detection (LOD),17 thus, samples free of any detectable residues, could not be performed, since this information is not reported consistently by the reporting countries. The possibility of accredited laboratories reporting the LOD depends on the need of having this parameter validated. EFSA recommends including this parameter under the validation criteria in the Guidance on Method Validation and Quality Control Procedures for Pesticide Residues Analysis in Food and Feed (European Commission, 2018). Alternatively, the LOD could be reported as an external parameter from the accredited scope. In each EU Member State and EFTA country, two control programmes are in place: an EU‐coordinated control programme (EUCP) and a national control programme (NP). The results of the 2016 EU‐coordinated programme, as defined in Commission Implementing Regulation (EU) No 2015/595 are summarised in Section 3 of this report. The purpose of this programme is to generate indicator data that are statistically representative of the MRL exceedance rate for food of plant and animal origin placed on the European common market, and which can be used to estimate the actual long‐term consumer exposure of the European population.
In contrast to the EUCP, the national control programmes are mainly risk based and are complementary to the randomised/non‐targeted controls performed in the context of the EU‐coordinated programme; the design and results of the national control programmes are reported in Section 4. The results of samples taken in the framework of import control required under Regulation (EC) No 669/2009, as well as results for baby food and for organic products, are also reported in this Section 4. Major focus was put on samples that exceeded the legal limit in place.
The results of the dietary exposure assessments for individual pesticides are described in Section 5. This section is intended to characterise the risks to consumers related to pesticide residues in food.
Additional information and more detailed results related to the 2016 monitoring activities can be found on the websites of the national competent authorities (see Appendix A). In addition, EFSA compiled a technical report (EFSA, 2018a) containing the national summary reports submitted by the reporting countries, where further details on the pesticide monitoring activities at the national level are provided.
3. EU‐coordinated control programme
3.1. Design of the EU‐coordinated control programme (EUCP)
According to the 2016 EU monitoring Regulation (EU) No 2015/595, reporting countries in accordance with Annex I, were requested to analyse in total 11 different food products: apples, head cabbage, leek, lettuce, peaches, strawberries, tomatoes, rye, wine, cow's milk and swine fat, and in accordance with Annex II, were requested to analyse a certain number of samples depending on their population that varied from 12 to 93 samples per food product.
In total, 12,168 samples (excluding the samples of processed cereal‐based baby foods) were analysed in the framework of the 2016 EUCP. The breakdown of the number of samples taken by each country is reported in Figure 1. It is noted that not all the Member States submitted results for the number of samples as defined in the 2016 monitoring Regulation (Hungary and Bulgaria). Further clarification should be provided by these reporting countries.
The regulation defined a total of 165 pesticides to be analysed; 157 of these in food of plant origin and 22 in food of animal origin. The list of pesticides covered by the 2016 EUCP, including further details on the pesticides that had to be analysed in food of plant or animal origin, is presented in Appendix B, Table B.1. The pesticide list of the 2016 EUCP was reduced (n = 165) compared to the 2013 EUCP list (n = 209): thus, 45 substances18 were no longer requested to be analysed as part of the 2016 EUCP.19 Compared to 2013, one new substance (fenpropidin) was included in the 2016 EUCP. For the common 164 pesticides and food products, EFSA performed a comparative assessment of results reported in 2016 and 2013.
Table B.1.
Description of the 2016 EU‐coordinated control programme
| Pesticided | Type of food analyseda | Residue definition according to Regulation (EC) No 396/2005 on EU MRLsb | Analysis mandatory for the following food productsc |
|---|---|---|---|
| 2‐phenylphenol | P | Ap, Hc, Le, Lt, Pe, Ry, St, To, Wg | |
| Abamectin (RD) | P |
Abamectin (sum of avermectin B1a, avermectin B1b and delta‐8,9 isomer of avermectin B1a) Abamectin (sum of avermectin B1a, avermectin B1b and delta‐8,9 isomer of avermectin B1a, expressed as avermectin B1a) |
Ap, Hc, Le, Lt, Pe, Ry, St, To, Wg |
| Acephate | P | Ap, Hc, Le, Lt, Pe, Ry, St, To, Wg | |
| Acetamiprid (RD) | P | Acetamiprid | Ap, Hc, Le, Lt, Pe, Ry, St, To, Wg |
| Acrinathrin | P | Ap, Hc, Le, Lt, Pe, Ry, St, To, Wg | |
| Aldicarb (RD) | P | Aldicarb (sum of aldicarb, its sulfoxide and its sulfone, expressed as aldicarb) | Ap, Hc, Le, Lt, Pe, Ry, St, To, Wg |
| Azinphos‐methyl | P | Ap, Hc, Le, Lt, Pe, Ry, St, To, Wg | |
| Azoxystrobin | P | Ap, Hc, Le, Lt, Pe, Ry, St, To, Wg | |
| Bifenthrin | PA | Ap, Hc, Le, Lt, Mc, Pe, Ry, St, Sf, To, Wg | |
| Biphenyl | P | Ap, Hc, Le, Lt, Pe, Ry, St, To, Wg | |
| Bitertanol | P | Ap, Hc, Le, Lt, Pe, Ry, St, To, Wg | |
| Boscalid (RD) | P | Ap, Hc, Le, Lt, Pe, Ry, St, To, Wg | |
| Bromide ion | P | Lt, To | |
| Bromopropylate | P | Ap, Hc, Le, Lt, Pe, Ry, St, To, Wg | |
| Bupirimate | P | Ap, Hc, Le, Lt, Pe, Ry, St, To, Wg | |
| Buprofezin | P | Ap, Hc, Le, Lt, Pe, Ry, St, To, Wg | |
| Captan (RD) | P |
Captan Captan/Folpet (sum) for apples, strawberries and tomatoes Sum of captan and THPI, expressed as captan |
Ap, Hc, Le, Lt, Pe, Ry, St, To, Wg |
| Carbaryl | P | Ap, Hc, Le, Lt, Pe, Ry, St, To, Wg | |
| Carbendazim (RD) | P | Carbendazim and benomyl (sum of benomyl and carbendazim expressed as carbendazim) | Ap, Hc, Le, Lt, Pe, Ry, St, To, Wg |
| Carbofuran (RD) | P | Carbofuran (sum of carbofuran (including any carbofuran generated from carbosulfan, benfuracarb or furathiocarb) and 3‐OH carbofuran expressed as carbofuran) | Ap, Hc, Le, Lt, Pe, Ry, St, To, Wg |
| Chlorantraniliprole | P | Chlorantraniliprole (DPX E‐2Y45) | Ap, Hc, Le, Lt, Pe, Ry, St, To, Wg |
| Chlordane (RD) | A | Chlordane (sum of cis‐ and trans‐isomers and oxychlordane expressed as chlordane) | Mc, Sf |
| Chlorfenapyr | P | Ap, Hc, Le, Lt, Pe, Ry, St, To, Wg | |
| Chlormequat | P | Ry, To, Wg | |
| Chlorothalonil (RD) | P | Chlorothalonil | Ap, Hc, Le, Lt, Pe, Ry, St, To, Wg |
| Chlorpropham (RD) | P | Chlorpropham | Ap, Hc, Le, Lt, Pe, Ry, St, To, Wg |
| Chlorpyrifos | PA | Ap, Hc, Le, Lt, Mc, Pe, Ry, St, Sf, To, Wg | |
| Chlorpyrifos‐methyl | PA | Ap, Hc, Le, Lt, Mc, Pe, Ry, St, Sf, To, Wg | |
| Clofentezine (RD) | P | Clofentezine | Ap, Hc, Le, Lt, Pe, St, To, Wg |
| Clothianidin | P | Ap, Hc, Le, Lt, Pe, Ry, St, To, Wg | |
| Cyfluthrin | P | Cyfluthrin (cyfluthrin including other mixtures of constituent isomers (sum of isomers)) | Ap, Hc, Le, Lt, Pe, Ry, St, To, Wg |
| Cymoxanil | P | Ap, Hc, Le, Lt, Pe, Ry, St, To, Wg | |
| Cypermethrin | PA | Cypermethrin (cypermethrin including other mixtures of constituent isomers (sum of isomers)) | Ap, Hc, Le, Lt, Mc, Pe, Ry, St, Sf, To, Wg |
| Cyproconazole | P | Ap, Hc, Le, Lt, Pe, Ry, St, To, Wg | |
| Cyprodinil (RD) | P | Cyprodinil | Ap, Hc, Le, Lt, Pe, Ry, St, To, Wg |
| DDT (RD) | A | DDT (sum of p,p’‐DDT, o,p’‐DDT, p,p’‐DDE and p,p’‐TDE (DDD) expressed as DDT) | Mc, Sf |
| Deltamethrin | PA | Deltamethrin (cis‐deltamethrin) | Ap, Hc, Le, Lt, Mc, Pe, Ry, St, Sf, To, Wg |
| Diazinon | PA | Ap, Hc, Le, Lt, Mc, Pe, Ry, St, Sf, To, Wg | |
| Dichlorvos | P | Ap, Hc, Le, Lt, Pe, Ry, St, To, Wg | |
| Dicloran | P | Ap, Hc, Le, Lt, Pe, Ry, St, To, Wg | |
| Dicofol (RD) | P | Dicofol (sum of p,p’ and o,p’ isomers) | Ap, Hc, Le, Lt, Pe, St, To, Wg |
| Dieldrin (RD) | PA | Aldrin and Dieldrin (Aldrin and dieldrin combined expressed as dieldrin) | Ap, Hc, Le, Lt, Mc, Pe, Ry, St, Sf, To, Wg |
| Diethofencarb | P | Ap, Hc, Le, Lt, Pe, Ry, St, To, Wg | |
| Difenoconazole | P | Ap, Hc, Le, Lt, Pe, Ry, St, To, Wg | |
| Diflubenzuron (RD) | P | Diflubenzuron | Ap, Hc, Le, Lt, Pe, Ry, St, To, Wg |
| Dimethoate (RD) | P | Dimethoate (sum of dimethoate and omethoate expressed as dimethoate) | Ap, Hc, Le, Lt, Pe, Ry, St, To, Wg |
| Dimethomorph | P | Ap, Hc, Le, Lt, Pe, St, To, Wg | |
| Diniconazole | P | Diniconazole (sum of isomers) | Ap, Hc, Le, Lt, Pe, Ry, St, To, Wg |
| Diphenylamine | P | Ap, Hc, Le, Lt, Pe, Ry, St, To, Wg | |
| Dithianon | P | Ap, Pe | |
| Dithiocarbamates (RD) | P | Dithiocarbamates (dithiocarbamates expressed as CS2, including maneb, mancozeb, metiram, propineb, thiram and ziram) | Ap, Le, Lt, Pe, Ry, St, To, Wg |
| Dodine | P | Ap, Hc, Le, Lt, Pe, Ry, St, To, Wg | |
| Endosulfan (RD) | PA | Endosulfan (sum of alpha‐ and beta‐isomers and endosulfan‐sulfate expresses as endosulfan) | Ap, Hc, Le, Lt, Mc, Pe, Ry, St, Sf, To, Wg |
| EPN | P | Ap, Hc, Le, Lt, Pe, Ry, St, To, Wg | |
| Epoxiconazole | P | Ap, Hc, Le, Lt, Pe, Ry, St, To, Wg | |
| Ethephon | P | Ap, Ry, To, Wg | |
| Ethion | P | Ap, Hc, Le, Lt, Pe, Ry, St, To, Wg | |
| Ethirimol | P | Ap, Hc, Le, Lt, Pe, St, To, Wg | |
| Etofenprox | P | Ap, Hc, Le, Lt, Pe, Ry, St, To, Wg | |
| Famoxadone | PA | Ap, Hc, Le, Lt, Mc, Pe, Ry, St, Sf, To, Wg | |
| Fenamidone | P | Ap, Hc, Le, Lt, Pe, Ry, St, To, Wg | |
| Fenamiphos (RD) | P | Fenamiphos (sum of fenamiphos and its sulfoxide and sulfone expressed as fenamiphos) | Ap, Hc, Le, Lt, Pe, Ry, St, To, Wg |
| Fenarimol | P | Ap, Hc, Le, Lt, Pe, St, To, Wg | |
| Fenazaquin | P | Ap, Hc, Le, Lt, Pe, St, To, Wg | |
| Fenbuconazole | P | Ap, Hc, Le, Lt, Pe, Ry, St, To, Wg | |
| Fenbutatin oxide | P | Ap, To, Wg | |
| Fenhexamid | P | Ap, Hc, Le, Lt, Pe, Ry, St, To, Wg | |
| Fenitrothion | P | Ap, Hc, Le, Lt, Pe, Ry, St, To, Wg | |
| Fenoxycarb | P | Ap, Hc, Le, Lt, Pe, Ry, St, To, Wg | |
| Fenpropathrin | P | Ap, Hc, Le, Lt, Pe, Ry, St, To, Wg | |
| Fenpropidin (RD) | P | Fenpropidin (sum of fenpropidin and its salts, expressed as fenpropidin) | Ap, Hc, Le, Lt, Pe, Ry, St, To, Wg |
| Fenpropimorph (RD) | P | Fenpropimorph | Ap, Hc, Le, Lt, Pe, Ry, St, To, Wg |
| Fenpyroximate | P | Ap, Hc, Le, Lt, Pe, Ry, St, To, Wg | |
| Fenthion (RD) | P | Fenthion (fenthion and its oxygen analogue, their sulfoxides and sulfone expressed as parent) | Ap, Hc, Le, Lt, Pe, Ry, St, To, Wg |
| Fenvalerate (RD) | PA | Fenvalerate (any ratio of constituent isomers (RR, SS, RS & SR) including esfenvalerate) | Ap, Hc, Le, Lt, Mc, Pe, Ry, St, Sf, To, Wg |
| Fipronil (RD) | P | Fipronil (sum fipronil and sulfone metabolite (MB46136) expressed as fipronil) | Ap, Hc, Le, Lt, Pe, Ry, St, To, Wg |
| Fludioxonil (RD) | P | Fludioxonil | Ap, Hc, Le, Lt, Pe, Ry, St, To, Wg |
| Flufenoxuron | P | Ap, Hc, Le, Lt, Pe, Ry, St, To, Wg | |
| Fluopyram (RD) | P | Fluopyram | Ap, Hc, Le, Lt, Pe, Ry, St, To, Wg |
| Fluquinconazole | P | Ap, Hc, Le, Lt, Pe, Ry, St, To, Wg | |
| Flusilazole (RD) | P | Flusilazole | Ap, Hc, Le, Lt, Pe, Ry, St, To, Wg |
| Flutriafol | P | Ap, Hc, Le, Lt, Pe, Ry, St, To, Wg | |
| Folpet (RD) | P |
Folpet Captan/Folpet (sum) for apples, strawberries and tomatoes Sum of folpet and phthalimide, expressed as folpet |
Ap, Hc, Le, Lt, Pe, Ry, St, To, Wg |
| Formetanate | P | Formetanate: sum of formetanate and its salts expressed as formetanate(hydrochloride) | Ap, Hc, Le, Lt, Pe, Ry, St, To, Wg |
| Fosthiazate | P | Ap, Hc, Le, Lt, Pe, Ry, St, To, Wg | |
| Glyphosate | P | Ry | |
| Heptachlor (RD) | A | Heptachlor (sum of heptachlor and heptachlor epoxide expressed as heptachlor) | Mc, Sf |
| Hexachlorobenzene | A | Mc, Sf | |
| Hexachlorocyclohexane (alpha) | A | Hexachlorocyclohexane (HCH), alpha‐isomer | Mc, Sf |
| Hexachlorocyclohexane (beta) | A | Hexachlorocyclohexane (HCH), beta‐isomer | Mc, Sf |
| Hexaconazole | P | Ap, Hc, Le, Lt, Pe, Ry, St, To, Wg | |
| Hexythiazox | P | Ap, Hc, Le, Lt, Pe, St, To, Wg | |
| Imazalil | P | Ap, Hc, Le, Lt, Pe, Ry, St, To, Wg | |
| Imidacloprid | P | Ap, Hc, Le, Lt, Pe, Ry, St, To, Wg | |
| Indoxacarb | PA | Indoxacarb (sum of indoxacarb and its R enantiomer) | Ap, Hc, Le, Lt, Mc, Pe, Ry, St, To, Wg |
| Iprodione (RD) | P | Iprodione | Ap, Hc, Le, Lt, Pe, Ry, St, To, Wg |
| Iprovalicarb | P | Ap, Hc, Le, Lt, Pe, Ry, St, To, Wg | |
| Isocarbophos | P | Ap, Hc, Le, Lt, Pe, Ry, St, To, Wg | |
| Kresoxim‐methyl (RD) | P | Kresoxim‐methyl | Ap, Hc, Le, Lt, Pe, Ry, St, To, Wg |
| Lambda‐cyhalothrin (RD) | P | Lambda‐cyhalothrin | Ap, Hc, Le, Lt, Pe, Ry, St, To, Wg |
| Lindane | A | Lindane (Gamma‐isomer of hexachlorocyclohexane (HCH)) | Mc, Sf |
| Linuron | P | Ap, Hc, Le, Lt, Pe, Ry, St, To, Wg | |
| Lufenuron | P | Ap, Hc, Le, Lt, Pe, Ry, St, To, Wg | |
| Malathion (RD) | P | Malathion (sum of malathion and malaoxon expressed as malathion) | Ap, Hc, Le, Lt, Pe, Ry, St, To, Wg |
| Mandipropamid | P | Ap, Hc, Le, Lt, Pe, Ry, St, To, Wg | |
| Mepanipyrim | P | Ap, Hc, Le, Lt, Pe, Ry, St, To, Wg | |
| Mepiquat | P | Ry, To | |
| Metalaxyl | P | Metalaxyl and metalaxyl‐M (metalaxyl including other mixtures of constituent isomers including metalaxyl‐M (sum of isomers)) | Ap, Hc, Le, Lt, Pe, Ry, St, To, Wg |
| Methamidophos | P | Ap, Hc, Le, Lt, Pe, Ry, St, To, Wg | |
| Methidathion | P | Ap, Hc, Le, Lt, Pe, Ry, St, To, Wg | |
| Methiocarb (RD) | P | Methiocarb (sum of methiocarb and methiocarb sulfoxide and sulfone, expressed as methiocarb) | Ap, Hc, Le, Lt, Pe, Ry, St, To, Wg |
| Methomyl (RD) | P | Methomyl and Thiodicarb (sum of methomyl and thiodicarb expressed as methomyl) | Ap, Hc, Le, Lt, Pe, Ry, St, To, Wg |
| Methoxychlor | A | Mc, Sf | |
| Methoxyfenozide | P | Ap, Hc, Le, Lt, Pe, Ry, St, To, Wg | |
| Monocrotophos | P | Ap, Hc, Le, Lt, Pe, Ry, St, To, Wg | |
| Myclobutanil (RD) | P | Myclobutanil | Ap, Hc, Le, Lt, Pe, Ry, St, To, Wg |
| Oxadixyl | P | Ap, Hc, Le, Lt, Pe, Ry, St, To, Wg | |
| Oxamyl | P | Ap, Hc, Le, Lt, Pe, Ry, St, To, Wg | |
| Oxydemeton‐methyl (RD) | P | Oxydemeton‐methyl (sum of oxydemeton‐methyl and demeton‐S‐methylsulfone expressed as oxydemeton‐methyl) | Ap, Hc, Le, Lt, Pe, Ry, St, To, Wg |
| Paclobutrazol | P | Ap, Hc, Le, Lt, Pe, Ry, St, To, Wg | |
| Parathion | PA | Ap, Hc, Le, Lt, Mc, Pe, Ry, St, Sf, To, Wg | |
| Parathion‐methyl (RD) | P | Parathion‐methyl (sum of Parathion‐methyl and paraoxon‐methyl expressed as Parathion‐methyl) | Ap, Hc, Le, Lt, Pe, Ry, St, To, Wg |
| Penconazole | P | Ap, Hc, Le, Lt, Pe, Ry, St, To, Wg | |
| Pencycuron | P | Ap, Hc, Le, Lt, Pe, Ry, St, To, Wg | |
| Pendimethalin | P | Ap, Hc, Le, Lt, Pe, Ry, St, To, Wg | |
| Permethrin | PA | Permethrin (sum of isomers) | Ap, Hc, Le, Lt, Mc, Pe, Ry, St, Sf, To, Wg |
| Phosmet (RD) | P | Phosmet (phosmet and phosmet oxon expressed as phosmet) | Ap, Hc, Le, Lt, Pe, Ry, St, To, Wg |
| Pirimicarb (RD) | P |
Pirimicarb (sum of pirimicarb and desmethyl pirimicarb expressed as Pirimicarb) Pirimicarb |
Ap, Hc, Le, Lt, Pe, Ry, St, To, Wg |
| Pirimiphos‐methyl | PA | Ap, Hc, Le, Lt, Mc, Pe, Ry, St, Sf, To, Wg | |
| Procymidone (RD) | P | Ap, Hc, Le, Lt, Pe, Ry, St, To, Wg | |
| Profenofos | P | Ap, Hc, Le, Lt, Pe, Ry, St, To, Wg | |
| Propamocarb (RD) | P | Propamocarb (sum of propamocarb and its salt expressed as propamocarb) | Ap, Hc, Lt, To, Wg |
| Propargite | P | Ap, Hc, Le, Lt, Pe, Ry, St, To, Wg | |
| Propiconazole | P | Ap, Hc, Le, Lt, Pe, Ry, St, To, Wg | |
| Propyzamide (RD) | P | Propyzamide | Ap, Hc, Le, Lt, Pe, Ry, St, To, Wg |
| Pymetrozine (RD) | P | Pymetrozine | Hc, Lt, St, To |
| Pyraclostrobin | P | Ap, Hc, Le, Lt, Pe, Ry, St, To, Wg | |
| Pyridaben | P | Ap, Hc, Le, Lt, Pe, Ry, St, To, Wg | |
| Pyrimethanil (RD) | P | Pyrimethanil | Ap, Hc, Le, Lt, Pe, Ry, St, To, Wg |
| Pyriproxyfen | P | Ap, Hc, Le, Lt, Pe, Ry, St, To, Wg | |
| Quinoxyfen | P | Ap, Hc, Le, Lt, Pe, Ry, St, To, Wg | |
| Spinosad | P | Spinosad (sum of Spinosyn A and Spinosyn D, expressed as spinosad) | Ap, Hc, Le, Lt, Pe, Ry, St, To, Wg |
| Spirodiclofen | P | Ap, Hc, Le, Lt, Pe, Ry, St, To, Wg | |
| Spiromesifen | P | Ap, Hc, Le, Lt, Pe, Ry, St, To, Wg | |
| Spiroxamine (RD) | P | Spiroxamine | Ap, Hc, Le, Lt, Pe, Ry, St, To, Wg |
| tau‐Fluvalinate | P | Ap, Hc, Le, Lt, Pe, Ry, St, To, Wg | |
| Tebuconazole (RD) | P | Tebuconazole | Ap, Hc, Le, Lt, Pe, Ry, St, To, Wg |
| Tebufenozide | P | Ap, Hc, Le, Lt, Pe, Ry, St, To, Wg | |
| Tebufenpyrad | P | Ap, Hc, Le, Lt, Pe, St, To, Wg | |
| Teflubenzuron | P | Ap, Hc, Le, Lt, Pe, Ry, St, To, Wg | |
| Tefluthrin | P | Ap, Hc, Le, Lt, Pe, Ry, St, To, Wg | |
| Terbuthylazine | P | Ap, Hc, Le, Lt, Pe, Ry, St, To, Wg | |
| Tetraconazole | P | Ap, Hc, Le, Lt, Pe, Ry, St, To, Wg | |
| Tetradifon | P | Ap, Hc, Le, Lt, Pe, St, To, Wg | |
| Thiabendazole (RD) | P | Thiabendazole | Ap, Hc, Le, Lt, Pe, Ry, St, To, Wg |
| Thiacloprid | P | Ap, Hc, Le, Lt, Pe, Ry, St, To, Wg | |
| Thiamethoxam (RD) | P |
Thiamethoxam (sum of thiamethoxam and clothianidin expressed as thiamethoxam) Thiamethoxam |
Ap, Hc, Le, Lt, Pe, Ry, St, To, Wg |
| Thiophanate‐methyl (RD) | P | Thiophanate‐methyl | Ap, Hc, Le, Lt, Pe, Ry, St, To, Wg |
| Tolclofos‐methyl | P | Ap, Hc, Le, Lt, Pe, Ry, St, To, Wg | |
| Tolylfluanid (RD) | P | Tolylfluanid (sum of tolylfluanid and dimethylaminosulfotoluidide expressed as tolylfluanid) | Ap, Hc, Le, Lt, Pe, St, To, Wg |
| Triadimenol (RD) | P | Triadimefon and triadimenol (sum of triadimefon and triadimenol) | Ap, Hc, Le, Lt, Pe, Ry, St, To, Wg |
| Triazophos | P | Ap, Hc, Le, Lt, Pe, Ry, St, To, Wg | |
| Trifloxystrobin (RD) | P | Trifloxystrobin | Ap, Hc, Le, Lt, Pe, Ry, St, To, Wg |
| Triflumuron | P | Ap, Hc, Le, Lt, Pe, Ry, St, To, Wg | |
| Vinclozolin | P | Ap, Hc, Le, Lt, Pe, Ry, St, To, Wg |
MRL: maximum residue level.
P: to be analysed in plant products; A: to be analysed in animal products.
Legal residue definition applicable in 2016 for the relevant food products covered by the EUCP; if not specifically mentioned, the residue definition comprises the parent compound only.
Ap: Apples; Hc: Head cabbage; Le: Leek; Lt: Lettuce; Mc: Cow's milk; Pe: Peaches; Ry: Rye; Sf: Swine fat; St: Strawberries; To: Tomatoes; Wg: Wine (from grape).
The term ‘(RD)’ refers to residue definition of the active substance to which it follows. The residue definition to which it refers, could be the same or different if there was a change during the 2016.
In 2013,20 mostly the same food products were analysed as in 2016, with the exception of oats that was only analysed in 2013.
The EUCP requested each country to take at least one sample from organic production for each of the 11 food products in focus. For the 767 organic samples reported under the 2016 EUCP, EFSA pooled the results with the results of organic samples reported in the framework of national control plans. Readers interested in comparative results for conventional and organic products are referred to Section 4.2.7.
In addition to the food products mentioned above, each reporting country had to take at least 10 samples of baby foods for infants and young children other than infant formulae, follow‐on formulae and processed cereal‐based baby food. A comprehensive analysis of the results of these 423 samples is reported in Section 4.2.6 alongside with the results on other baby food products, such as infant formulae and follow‐on formulae.
3.2. Results by pesticide
Among the 157 pesticides to be analysed in plant products, the following 28 have not been found in quantifiable concentrations in any of the samples analysed (the number in brackets refer to the total number of samples analysed for the given pesticide): abamectin (1,259), acephate (9,101), aldicarb (8,671), biphenyl (7,396), bitertanol (9,338), carbofuran (6,791), diazinon (10,176), dicloran (9,684), dieldrin (8,499), diniconazole (8,906), EPN (9,253), ethion (9,961), fenarimol (9,548), fenbutatin oxide (1,741), fenitrothion (9,866), fenpropidin (6,660), fenthion (7,883), fluquinconazole (9,067), flusilazole (10,044), methamidophos (9,447), methidathion (10,018), monocrotophos (9,442), oxydemeton‐methyl (8,017), parathion‐methyl (8,511), tefluthrin (8,921), tetradifon (9,084), tolylfluanid (7,033) and triazophos (10,218).
In plant products, 129 different substances were found in quantifiable concentrations. Residues exceeding the legal limits were related to 56 different pesticides. Pesticides which were quantified in at least 1% of the samples of plant products, or for which an exceedance was identified in at least 0.05% of the samples analysed, are presented in Figure 2. In this figure, the pesticides’ findings are ordered alphabetically and the figures in brackets next to the name of the pesticide refer to the number of samples without quantified residues (residues below the LOQ), the number of samples with quantified residues within the MRL and the number of samples exceeding the MRLs, respectively.
Figure 2.
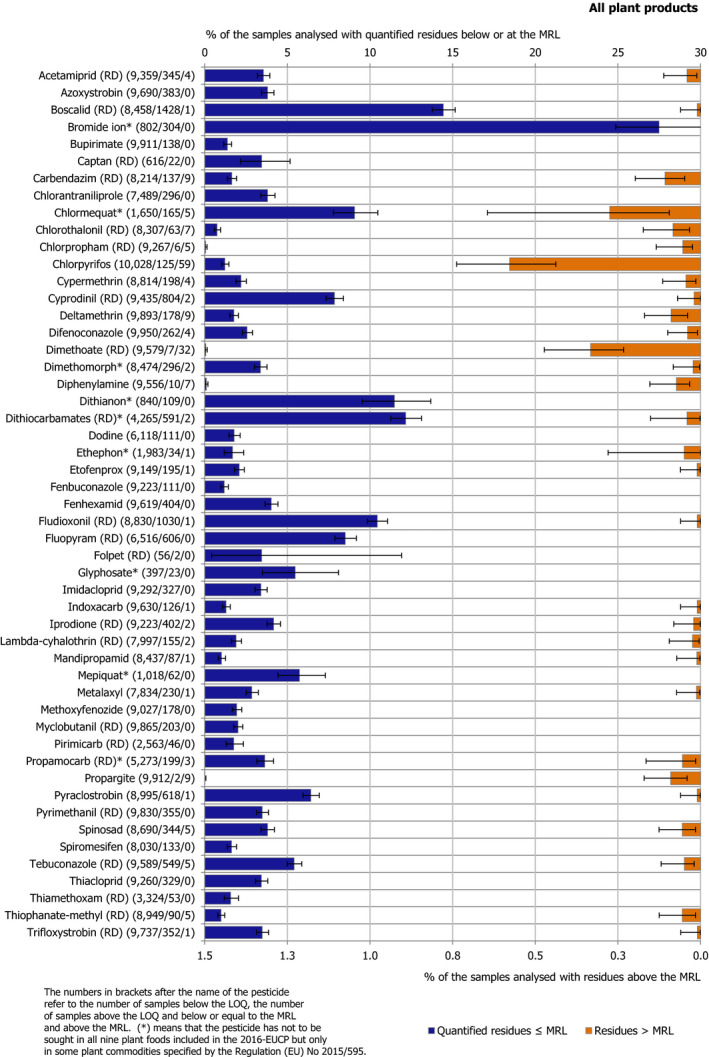
Pesticides quantified in plant products (quantification rate > 1% and/or MRL exceedance rate > 0.05%), sorted alphabetically
Bromide ion – to be analysed only in lettuce and tomatoes – was by far the pesticides most frequently quantified (detected in quantifiable concentration in 27.5% of the samples tested for it). Among the pesticides that had to be analysed in all plant products, the most frequently found pesticides quantified in more than 5% of the samples analysed were boscalid (14.5%), fludioxonil (10.5%), fluopyram (8.5%), cyprodinil (7.9%), pyraclostrobin (6.4%) and tebuconazole (5.5%). Among the pesticides that were requested to be assessed only in selected food products, the most frequently quantified substances besides bromide ion were dithiocarbamates (residue definition (RD)) (12.2%), dithianon (11.5%), chlormequat (9.3%), mepiquat (5.7%) and glyphosate (5.5%). Further details on the pesticides analysed under the EU‐coordinated control are reported in Appendix B and Section 3.3.
Regarding food products of animal origin (cow's milk and swine fat), the following 11 of the 22 pesticides covered by the EUCP were not found in quantifiable concentrations in any of the samples tested (the number in brackets refers to the total number of samples analysed): bifenthrin (1,230), chlorpyriphos (1,249), diazinon (1,341), endosulfan (1,188), famoxadone (435), fenvalerate (493), heptachlor (982), hexachlorocyclohexane‐beta (1,252), indoxacarb (237), methoxychlor (1,051) and parathion (1,205). The 11 other pesticides were found sporadically, dichlorodiphenyltrichloroethane (DDT), hexachlorobenzene and chlordane being the most frequently quantified compounds with respectively 2.8%, 1.8% and 1.0% of the samples of milk and swine fat analysed in the framework of the 2016 EUCP. The other pesticides were quantified in less than 0.4% of the samples, and they were mainly non‐approved pesticides present in the food chain due to their persistence (i.e. the persistent organic pollutants (POPs) such as dieldrin, HCH‐alpha and lindane), active substances authorised for use in livestock covered by Regulation (EC) No 37/2010 (cypermethrin and permethrin) and other approved compounds (chlorpyrifos‐methyl, deltamethrin and pirimiphos‐methyl).
3.3. Results by food products
In this section, detailed results concerning the 11 food products covered by the 2016 EUCP are reported. For each food product, the following analyses are presented:
Key figures to describe the results for the matrices analysed, such as the number of samples analysed, the percentage of samples free of quantifiable residues (samples with residues below the LOQ), percentage of samples with multiple residues, the number/percentage of samples exceeding the legal limit and number/percentage of samples found to be non‐compliant;
Key characteristics regarding the pesticides found (e.g. number of pesticides quantified, the most frequently found pesticides and the number of pesticides with MRL exceedance);
In a pie chart, the percentages of samples free of quantifiable residues (residues below the LOQ) and of samples with single and multiple residues (residues ≥ LOQ) are presented;21
Bar charts present the pesticides found, sorted according to the frequency of quantification in 2016. The percentages of samples with one or several residues at or above the LOQ but below or equal to the MRL are included on the left part of the chart (blue bars; upper x‐axis scale). In the same chart, the percentages of samples with one or several residues exceeding the MRLs are included on the right part of the chart (orange bars; lower x‐axis scale). The figures in brackets next to the name of the pesticide refer to the number of samples without quantifiable residues (samples with residues below the LOQ), the number of samples with quantified residues within the legally permitted concentrations (MRLs) and the number of samples exceeding the MRLs, respectively. The number and percentage of samples exceeding the legal limit are based on the judgement of the reporting country. The light bars refer to the results of 2013, while the bars in the darker shade refer to the results of 2016. A maximum of 45 pesticides are plotted for each food product. The pesticides not quantified in 2016, but with MRL exceedances observed in 2013, are plotted at the bottom of the bar chart. Pesticides in the scope of the 2016 monitoring programme and not in the 2013 programme are marked with an asterisk. As a major change this year, confidence intervals (CI) associated to frequency of quantification and frequency of MRL exceedances were added. CI for a proportion (e.g. % of quantified samples) were estimated using the Clopper–Pearson (exact) method that is a common method for calculating binomial confidence intervals (Clopper and Pearson, 1934; Abraham, 2013). This method was selected because is the most conservative for estimating the CI based on the binomial distribution (which is a discrete distribution, thus cumulative probabilities have discrete jumps) but guarantee that the coverage is at least one minus the nominal level specified. The estimation is based on the total number of samples analysed (as indicated in each specific section and figure) and the number of samples quantified (e.g. number of samples with at least one quantification).
Dot plot figures present the distribution of the measured residue levels, expressed as a percentage of the MRL applicable for the specific pesticide/crop combination. The figures in brackets next to the name of the pesticide refer to the number of samples without quantifiable residues, the number of samples with quantified residues within the legally permitted concentrations and the number of samples exceeding the MRLs, respectively.22 Each result at or above the LOQ is depicted as a dot in the respective figure. Results above 300% of the MRL are mentioned on the right side of the chart. The MRL in place at the beginning of the calendar year 2016 was used as a reference value to re‐calculate the reported residue concentration as percentage of the MRL or the one reported by the Member State in case of a change during the year.23 , 24
Further information on the pesticides most frequently found in the concerned food products (pesticides found in at least 5% of the samples, unless stated differently).
In a separate Excel file published as a supplement to this report, the full list of samples exceeding the MRLs can be found, including information on the measured residue concentrations and the origin of the samples.
3.3.1. Apples
In 2016, 1,680 samples of apples were analysed. In 614 samples (36.5%), no quantifiable pesticide residues were found, while 1,066 samples (63.5%) contained one or several pesticides in quantified concentrations. Multiple residues were reported in 702 samples (41.8%); up to 10 different pesticides were reported in an individual apples sample (Figure 3). The overall quantification rate recorded in 2016 was slightly lower than the one in 2013 (67% of the 2013 samples contained pesticide residues).
Figure 3.
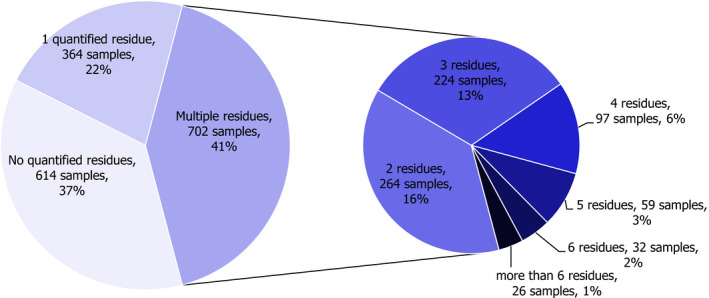
Number of quantified residues in individual apple samples
In 2.7% of the samples (46 samples), the residue concentrations exceeded the MRLs related to 11 pesticides; 1.7% of the samples (28 samples) were reported as non‐compliant with the MRL, taking into account the measurement uncertainty. The MRL exceedances were mainly related not only to EU‐produced apples (9 from Italy, 8 from Romania, 4 from Cyprus, 3 from Croatia, 3 from Poland, 2 from Spain, 2 from Greece, 1 from the Czech Republic, 1 from Malta, 1 from the Netherlands, 1 from Portugal, and 1 from Slovenia) but also to third countries (5 from Chile, 1 sample from Brazil, 1 from the Republic of Macedonia, 1 from Russia and 1 from the USA) and 1 sample with unknown origin.
In total, 79 different pesticides were quantified (residue levels equal to or greater than the LOQ). The most frequently quantified pesticides were captan (RD)25 (quantified in 25.0% of the tested samples), boscalid (21.0%) and dithianon (19.8%). The MRL was exceeded for 11 different pesticides, most frequently for chlorpyrifos (26 samples mostly from the EU, 1.6% of the samples analysed), diphenylamine (7 samples from Chile, Greece and USA), dimethoate (4 samples from Romania and Malta) and carbendazim (4 samples from Cyprus).
Figure 4 depicts the 2016 and 2013 results for all pesticides with MRL exceedances and for the most frequently quantified pesticides. Compared to 2013, the quantification rate was in the same range for most pesticides. For dithiocarbamates, pirimicarb, chlorpyrifos, thiabendazole, diphenylamine26 and propargite, a decreased quantification rate was observed in 2016. For fludioxonil and fluopyram, an increased quantification rate was observed in 2016.
Figure 4.
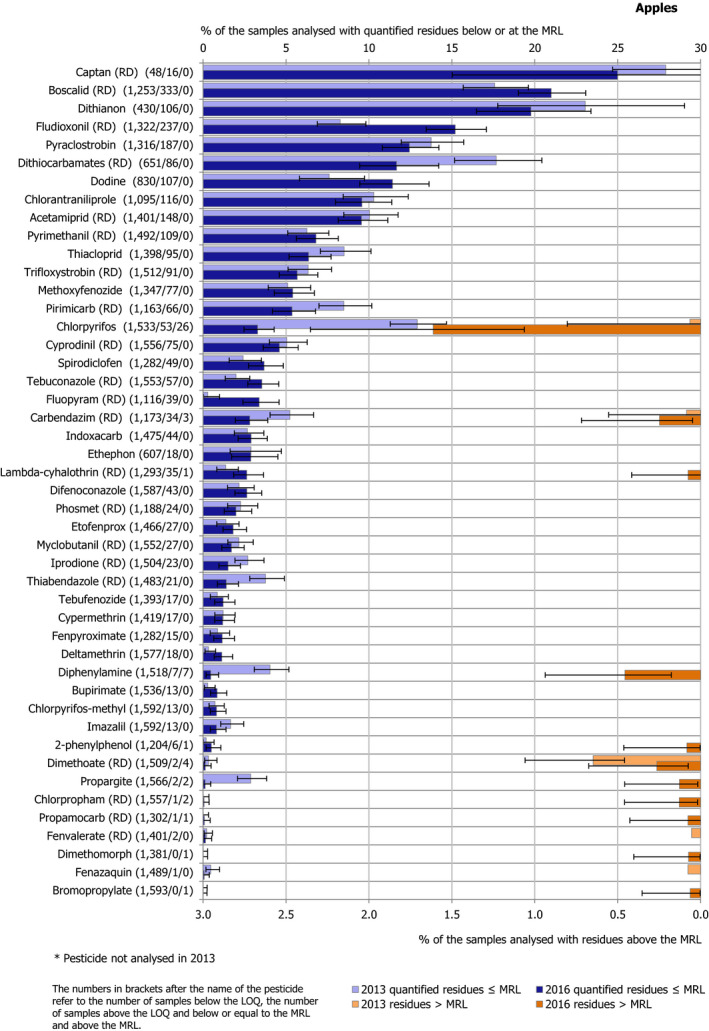
Percentage of apple samples with quantified residues below or equal to the MRL and with residues above the MRL
An increased number of distinct pesticides with MRL exceedances were noted in 2016 (11 pesticides versus nine pesticides in 2013). MRL exceedances for lambda‐cyhalothrin, diphenylamine, 2‐phenylphenol, propargite, chlorpropham, propamocarb, dimethomorph and bromopropylate were only identified in 2016. On the contrary, no MRL exceedance was reported in 2016 for pesticides that were found to exceed the legal limit in 2013, e.g. fenvalerate, fenazaquin, fenbutatin oxide, fenthion, flusilazole and methomyl. For pesticides with MRL exceedances in the both years (chlorpyrifos, carbendazim and dimethoate), a significant increase of MRL exceedance rate was observed in 2016 for chlorpyrifos. This higher rate is assumed to be related to the modification of the MRL value for chlorpyrifos in apples (from 0.5 to 0.01 mg/kg) in 2016.
The individual residue concentrations, expressed as a percentage of the respective MRL are plotted in Figure 5. Further information on the most frequently quantified pesticides found in apples in 2016 in at least 10% of the samples is compiled in Table 1.
Figure 5.
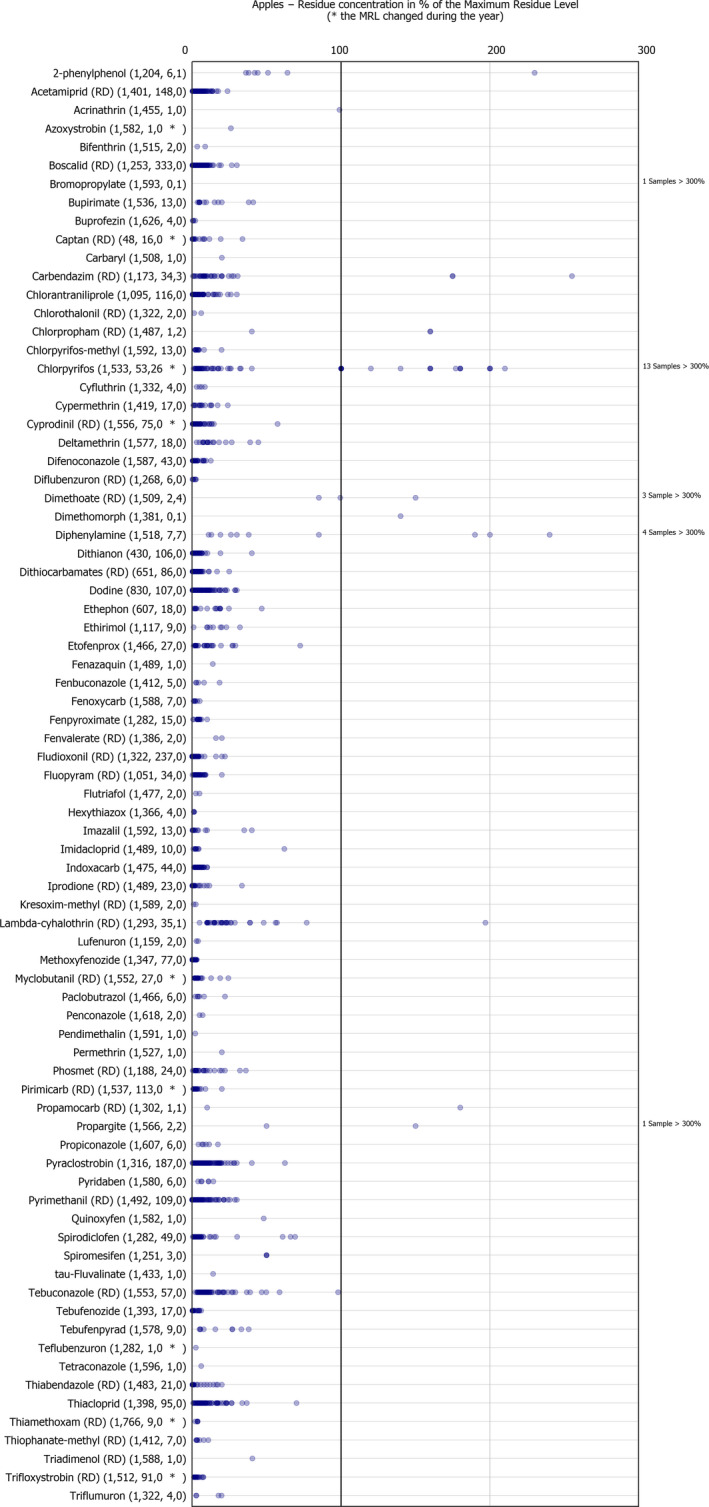
Residue concentrations measured in apples, expressed as a percentage of the MRL (only samples with residues ≥ LOQ)24,25
Table 1.
Pesticides most frequently quantified in apples in 2016
| Pesticide | % samples above LOQ | Approval status in 2016 (Reg. 1107/2009) |
|---|---|---|
| Captan (RD) | 25.0 | All pesticides listed under the Pesticide column are approved fungicides |
| Boscalid (RD) | 21.0 | |
| Dithianon | 19.8 | |
| Fludioxonil (RD) | 15.2 | |
| Pyraclostrobin | 12.4 | |
| Dithiocarbamates (RD) | 11.7 | |
| Dodine | 11.4 |
LOQ: limit of quantification; RD: residue definition.
3.3.2. Head cabbage
In 2016, 987 samples of head cabbages were analysed; in 837 samples (84.8%), no quantifiable pesticide residues were found, while 150 samples (15.2%) contained one or several pesticides in quantified concentrations. Multiple residues were reported in 63 samples (6.4%); up to 9 different pesticides were reported in an individual head cabbage sample (Figure 6). Compared to 2013, a decline of the overall quantification rate was observed in 2016 (in 2013, 23.5% of the samples contained pesticide residues).This decline can be justified by the fact that dithiocarbamates was not to be analysed during the 2016 EUCP.
Figure 6.
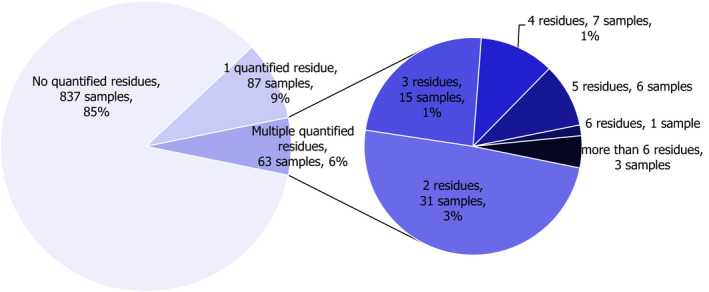
Number of quantified residues in individual head cabbage samples
In 1.1% of the samples (11 samples), the residue concentrations exceeded the MRLs; 5 samples were reported as non‐compliant, taking into account the measurement uncertainty. The MRL exceedances were all related to EU products (4 from Germany, 3 from Malta, 1 sample from Austria, 1 from France, 1 from Poland and 1 from Portugal).
In total, 35 different pesticides were quantified (residue levels equal to or greater than the LOQ). The most frequently found pesticides were difenoconazole (quantified in 3.8% of the tested samples), azoxystrobin (3.7%) and boscalid (3.5%). The MRL was exceeded for 6 different pesticides: chlorpyrifos in 6 samples from Malta (N=3), France, Portugal and Poland; difenoconazole (4 samples from Germany), propamocarb (one sample from Austria), indoxacarb (one sample from Germany), pyraclostrobin (one sample from Germany) and propyzamide (one sample from Austria).
Figure 7 presents the 2016 and 2013 rates of quantification and MRL exceedance. Compared to 2013, the quantification rate was in the same range for most of the pesticides, except for difenoconazole, azoxystrobin and thiacloprid, for which a significant increased quantification rate was observed in 2016. Some substances were only found in 2013 (bifenthrin, clothianidin, dimethomorph, diphenylamine, fenhexamid, linuron, lufenuron, malathion, methiocarb, pyrimethanil, thiabendazole, trifloxystrobin) with the following only found in 2016: fluopyram, chlorantraniliprole, myclobutanil, spinosad, etofenprox, acetamiprid, mandipropamid, bupirimate and propyzamide, pyridaben. A number of pesticides were found exceeding the MRL where no such event was noted in 2013 (e.g. propamocarb, indoxacarb, chlorpyrifos, pyraclostrobin, propyzamide). Conversely, MRL exceedances were noted only in 2013 for thiophanate‐methyl, chlorpropham, dimethoate, methiocarb and pyrimethanil.
Figure 7.
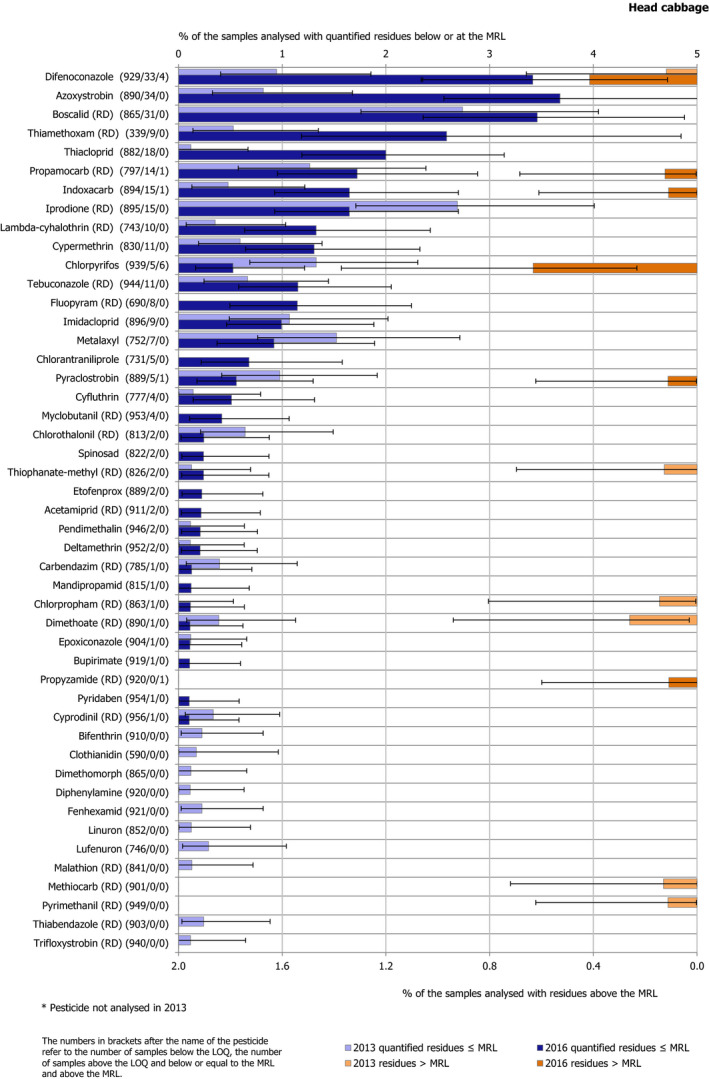
Percentage of head cabbage samples with quantified residues below or equal to the MRL and with residues above the MRL
The individual residue concentrations, expressed as a percentage of the respective MRL for the pesticide are plotted in Figure 8. Further information on the most frequently quantified pesticides found in head cabbages in 2016 in at least 2% of the samples is compiled in Table 2.
Figure 8.
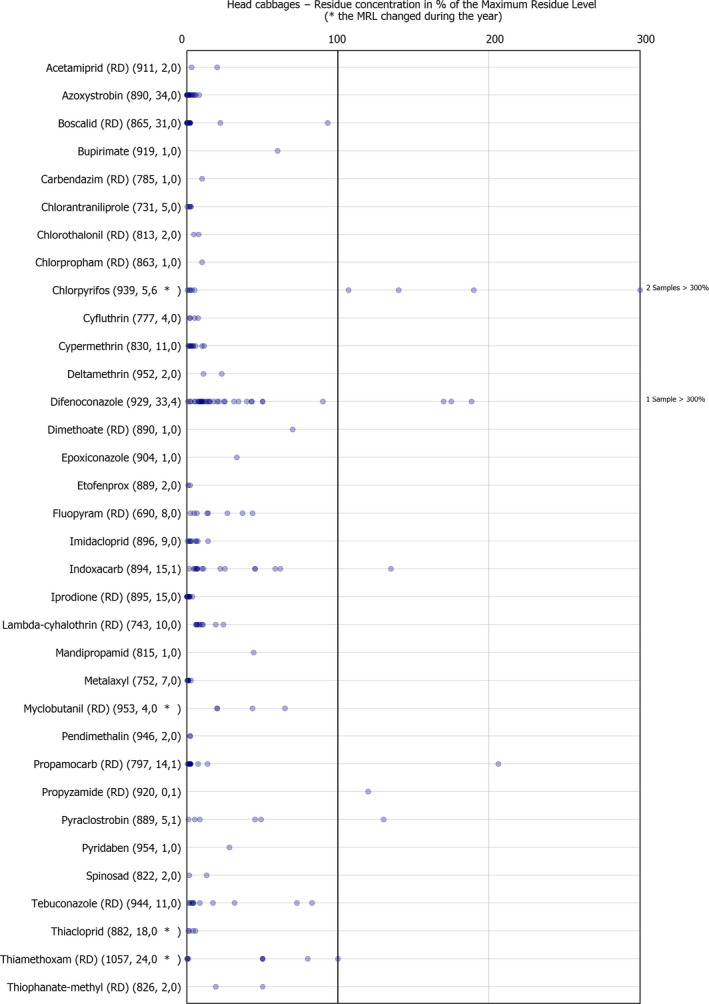
Residue concentrations measured in head cabbage, expressed as a percentage of the MRL (only samples with residues ≥ LOQ)24,25
Table 2.
Pesticides most frequently quantified in head cabbages in 2016
| Pesticide | % samples above LOQ | Approval status in 2016 (Reg. 1107/2009) |
|---|---|---|
| Difenoconazole | 3.8 | Approved fungicide |
| Azoxystrobin | 3.7 | Approved fungicide |
| Boscalid (RD) | 3.5 | Approved fungicide |
| Thiamethoxam (RD) | 2.6 | Approved insecticide |
| Thiacloprid | 2.0 | Approved insecticide |
LOQ: limit of quantification; RD: residue definition.
3.3.3. Leek
In 2016, 909 samples of leek were analysed. In 543 samples (59.7%), no quantifiable pesticide residues were found, while 366 samples (40.3%) contained one or several pesticides in quantified concentrations. Multiple residues were reported in 173 samples (19%); up to 9 different pesticides were reported in an individual leek sample (Figure 9). Compared to 2013, in 2016 the overall quantification rate went up (in 2013 33.1% of the samples contained pesticide residues).
Figure 9.
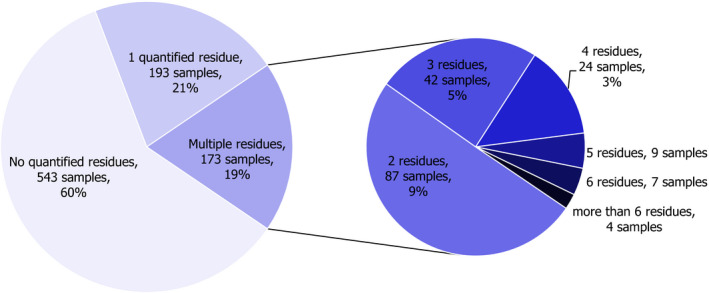
Number of quantified residues in individual leek samples
In 2.3% of the samples (21 samples), the residue concentrations exceeded the MRLs; 1.2% of the samples (11 samples) were reported as non‐compliant, taking into account the measurement uncertainty. The origin of the samples was all EU: 5 from Poland, 5 from Spain, 3 from France, 2 from Croatia, 2 from Germany, 2 from Romania, 1 from Belgium and 1 from the Netherlands.
In total, 37 different pesticides were found in concentrations equal to or greater than the LOQ. The most frequently found pesticides were dithiocarbamates (analysed as carbon disulfide, CS2) quantified in 27.2% of the tested samples, tebuconazole (11.1%) and boscalid (10.9%). The MRL was exceeded for 10 different pesticides, most frequently for chlorpyrifos (11 samples) and iprodione (2 samples); all the reported MRL breaches related to food originated from within the EU. It is noted that CS2 residues are not only related to the use of pesticides belonging to the group of dithiocarbamates but also are generated during analysis from naturally occurring sulfur compounds. This is particularly the case for Alliaceae‐like leeks that naturally contain CS2 precursor compounds.
Figure 10 presents the 2016 and 2013 rates of quantification and MRL exceedances. The overall quantification rates were in the same range than in 2013 for most of the pesticides, except for dithiocarbamates, difenoconazole and fluopyram for which the quantification rate increased significantly in 2016. In 2016, the MRL exceedance's rates increased for eight substances, mainly for chlorpyrifos. The MRL changed during August 2016 from 0.5 to 0.01 mg/kg. The dot plot graph was build taken the MRL in placed as reported by the Member State. Therefore, the lowering of the MRL should not be an excuse for the high exceedance rate. Growers should be informed at an earlier stage in the year of the upcoming change in the MRL so that the plant protection product is used accordingly.
Figure 10.
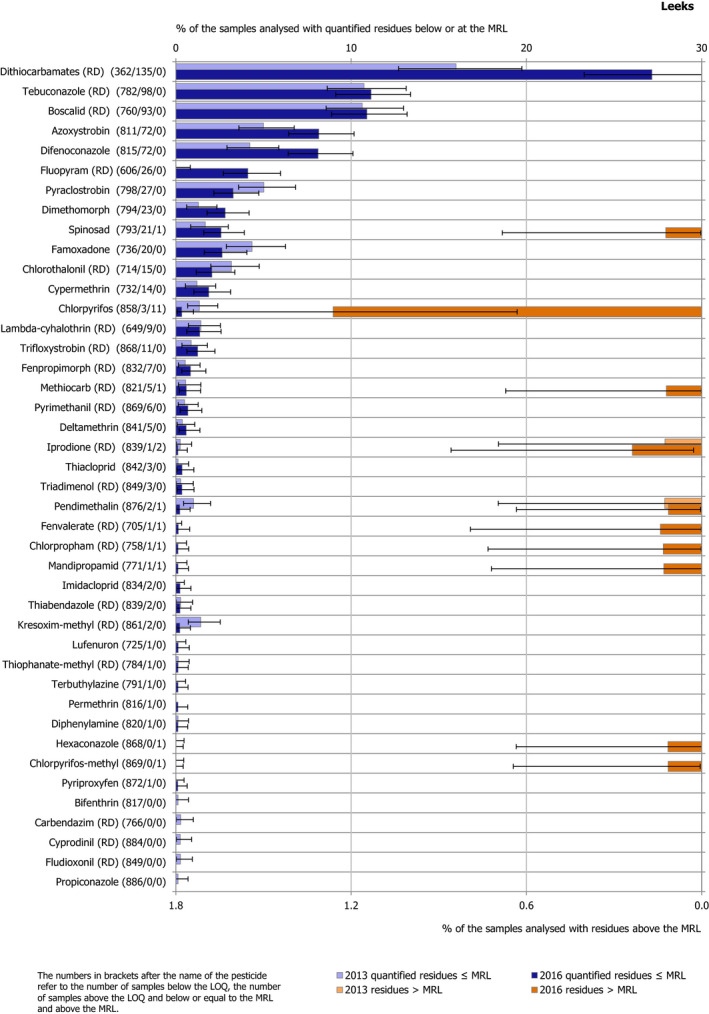
Percentage of leek samples with quantified residues below or equal to the MRL and with residues above the MRL
The individual residue concentrations, expressed as a percentage of the respective MRL for the pesticide are plotted in Figure 11. Further information on the most frequently quantified pesticides found in leek in 2016 in at least 5% of the samples is compiled in Table 3.
Figure 11.
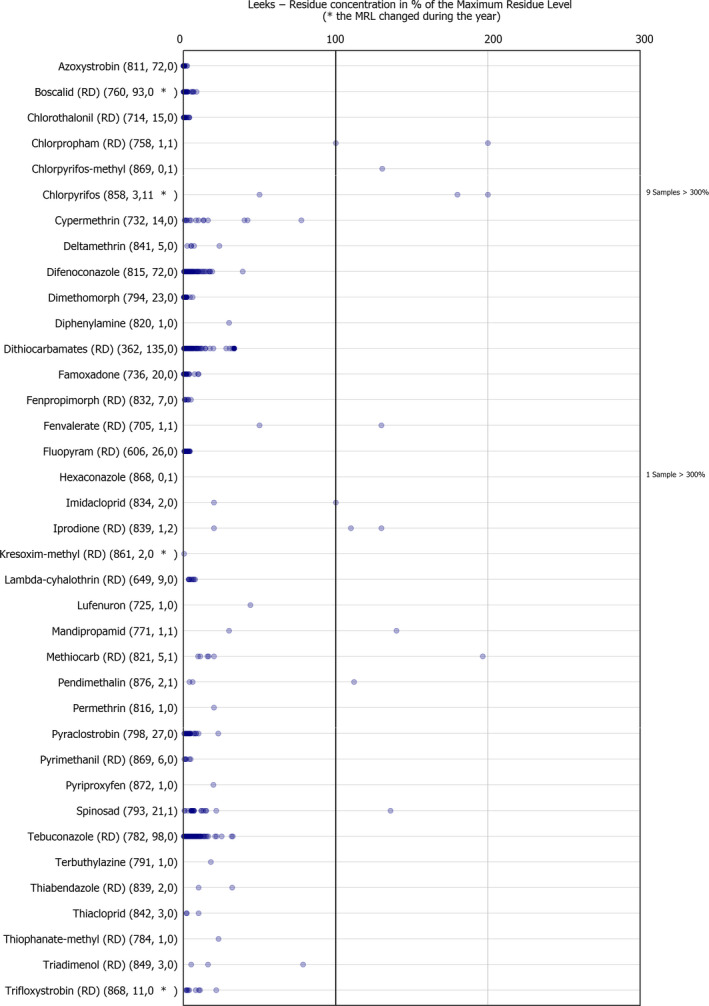
Residue concentrations measured in leek, expressed as a percentage of the MRL (only samples with residues ≥ LOQ)24,25
Table 3.
Pesticides most frequently quantified in leek in 2016
| Pesticide | % samples above LOQ | Approval status in 2016 (Reg. 1107/2009) and comments |
|---|---|---|
| Dithiocarbamates (RD) | 27.2 | Dithiocarbamates fungicides approved: maneb, mancozeb, metiram, propineb, thiram and ziram. Possibly, the detection of CS2 relates to false positive results due to the occurrence of naturally occurring substances in Alliaceae |
| Tebuconazole (RD) | 11.1 | Approved fungicide |
| Boscalid (RD) | 10.9 | Approved fungicide |
| Azoxystrobin | 8.1 | Approved fungicide |
| Difenoconazole | 8.1 | Approved fungicide |
LOQ: limit of quantification; RD: residue definition.
3.3.4. Lettuce
In 2016, 1,188 samples of lettuce were analysed; in 498 samples (41.9%), no quantifiable pesticide residues were found, while 690 samples (58.1%) contained one or several pesticides in quantified concentrations. Multiple residues were reported in 444 samples (37.4%); up to 12 different pesticides were reported in an individual lettuce sample. Compared to 2013, the overall quantification rate is similar (quantification rate in 2013 amounted to 57.9%).
Figure 12.
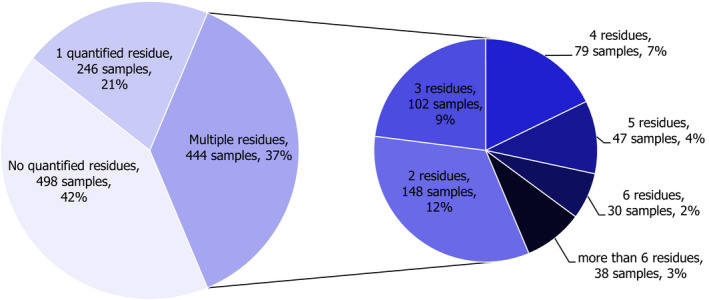
Number of quantified residues in individual lettuce samples
The residue concentrations exceeded the MRL for 28 samples (0.25%), and 12 samples (0.1%) were identified as non‐compliant taking into account the measurement uncertainty. In total, 19 pesticides were associated with MRL exceedances. The origin of the samples was: 13 from Romania, 3 from France, 3 from Italy, 2 from Cyprus, 2 from United Kingdom, 1 from Spain, 1 from Croatia, 1 from Poland, 1 from Portugal, and 1 with unknown origin.
In total, 66 different pesticides were found in concentrations equal to or greater than the LOQ. The most frequently found pesticides were bromide ion (quantified in 23.7% of the tested samples), boscalid (18.9%), imidacloprid (14.9%) and propamocarb (14.2%).
Figure 13 presents the results for all pesticides with MRL exceedances and the most frequently quantified pesticides. The same pesticides were quantified in these two years with a similar quantification rate; linuron, methiocarb, formetanate, chlorpyrifos‐methyl and vinclozolin were only quantified in 2016. The quantification rate of pyraclostrobin, fluopyram and chlorantraniliprole significantly increased in 2016, but it significantly decreased for tolclofos‐methyl.
Figure 13.
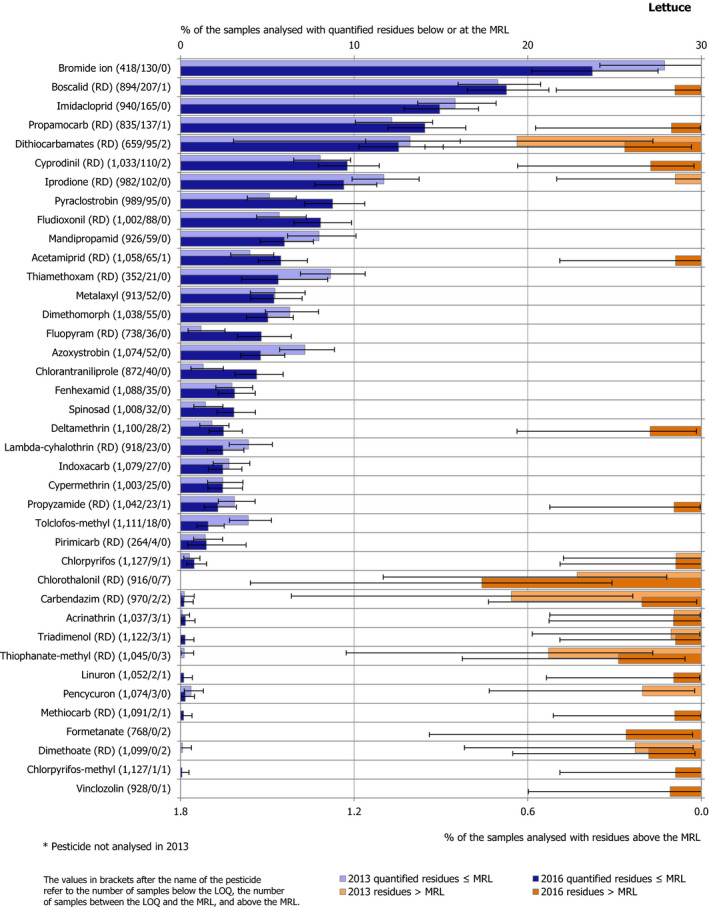
Percentage of lettuce samples with quantified residues below or equal to the MRL and with residues above the MRL
MRL were exceeded for 19 pesticides in 2016 and for 17 pesticides in 2013. Comparing the MRL exceedances in 2013 and 2016, comparable results were found for 8 pesticides: dithiocarbamates, chlorpyrifos, chlorothalonil, carbendazim, acrinathrin, triadimenol, thiophanate‐methyl and dimethoate. An increased MRL breach rate for chlorothalonil was observed in 2016 compared to 2013. MRL exceedances were identified only in 2016 for 11 other pesticides and only for iprodione and pencycuron in 2013.
The individual residue concentrations, expressed as a percentage of the respective MRL for the pesticide are plotted in Figure 14. Further information on the most frequently quantified pesticides found in lettuce in 2016 in at least 10% of the samples is compiled in Table 4.
Figure 14.
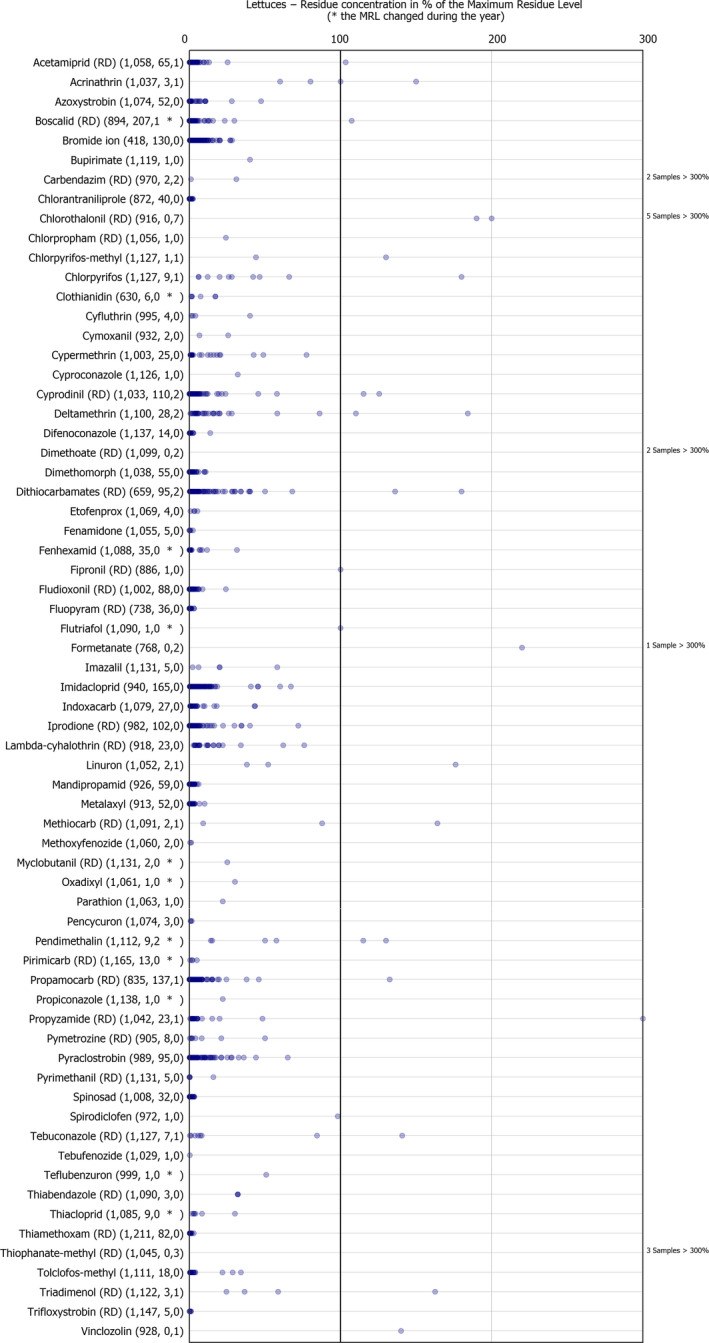
Residue concentrations measured in lettuce, expressed as a percentage of the MRL (only samples with residues ≥ LOQ)24,25
Table 4.
Pesticides most frequently quantified in lettuce in 2016
| Pesticide | % samples above LOQ | Approval status in 2016 (Reg. 1107/2009) |
|---|---|---|
| Bromide ion | 23.7 | Methyl bromide is a non‐approved fungicide/insecticide/nematicide/herbicide which would lead to residues of bromide ion. However, since bromide ion is also a naturally occurring substance, the source of residues of bromide ion findings cannot be identified unambiguously |
| Boscalid (RD) | 18.9 | Approved fungicide |
| Imidacloprid | 14.9 | Approved insecticide |
| Propamocarb (RD) | 14.2 | Approved fungicide |
| Dithiocarbamates (RD) | 12.8 | Fungicides approved: maneb, mancozeb, metiram, propineb, thiram and ziram |
LOQ: limit of quantification; RD: residue definition.
3.3.5. Peaches
In 2016, 1,178 samples of peaches were analysed. In 262 samples (22.2%), no quantifiable pesticide residues were found, while 916 samples (77.8%) contained one or several pesticides in quantified concentrations. Multiple residues were reported in 704 samples (59.8%); up to 13 different pesticides were reported in an individual peaches sample (Figure 15). Compared to 2013, the quantification rate slightly increased (2013 samples: 75.2% contained pesticide residues).
Figure 15.
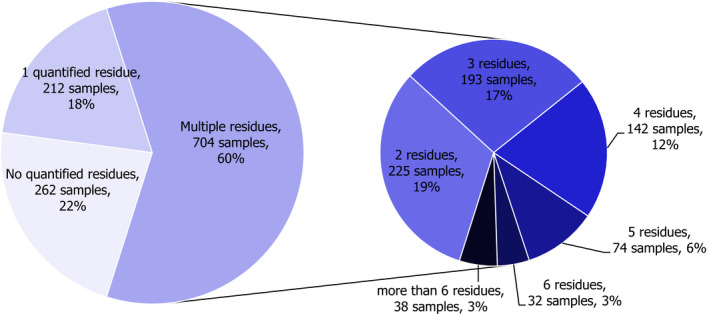
Number of quantified residues in individual peaches samples
MRLs were exceeded for 1.9% of the samples (23 samples) and 1.4% of the samples (16 samples) were reported as non‐compliant, taking into account the measurement uncertainty. These MRL exceedances were all related to EU products (10 samples from Malta, 4 samples from Italy, 3 samples from Spain, 2 samples from Cyprus, 2 samples from Greece, 1 from Romania and 1 more sample with unknown origin.
In total, 70 different pesticides were quantified. The most frequently quantified pesticides were tebuconazole (quantified in 26.8% of the samples), fludioxonil (23.4%) and dithiocarbamates (21.5%). The MRL was exceeded for 10 different pesticides: chlorpyrifos in 13 samples (8 samples from Malta, 3 from Spain and 2 from Italy), deltamethrin in 6 samples from Malta, dimethoate in 4 samples (Malta), propargite in 3 samples (Greece and Romania), chlorpropham in 2 samples (Italy), formetanate and dimethomorph together in 1 sample (Cyprus), etofenprox (1 sample from Malta), carbendazim (1 sample from Cyprus) and procymidone (unknown origin). To be highlighted that neither propargite, carbendazim or procymidone are approved substances at the EU level.
Figure 16 presents the results for all pesticides with MRL exceedances and for the most frequently quantified pesticides. Compared to 2013, the quantification rate was lower for iprodione, lambda‐cyhalothrin, chlorpyrifos, thiacloprid, carbendazim, whereas fludioxonil, boscalid, etofenprox, fluopyram, pyraclostrobin, deltamethrin and pyrimethanil were more frequently found. In terms of MRL exceedances, a similar rate is found for chlorpyrifos, carbendazim and dimethoate. MRL exceedances were identified only in 2016 for seven pesticides and only in 2013 for four others.
Figure 16.
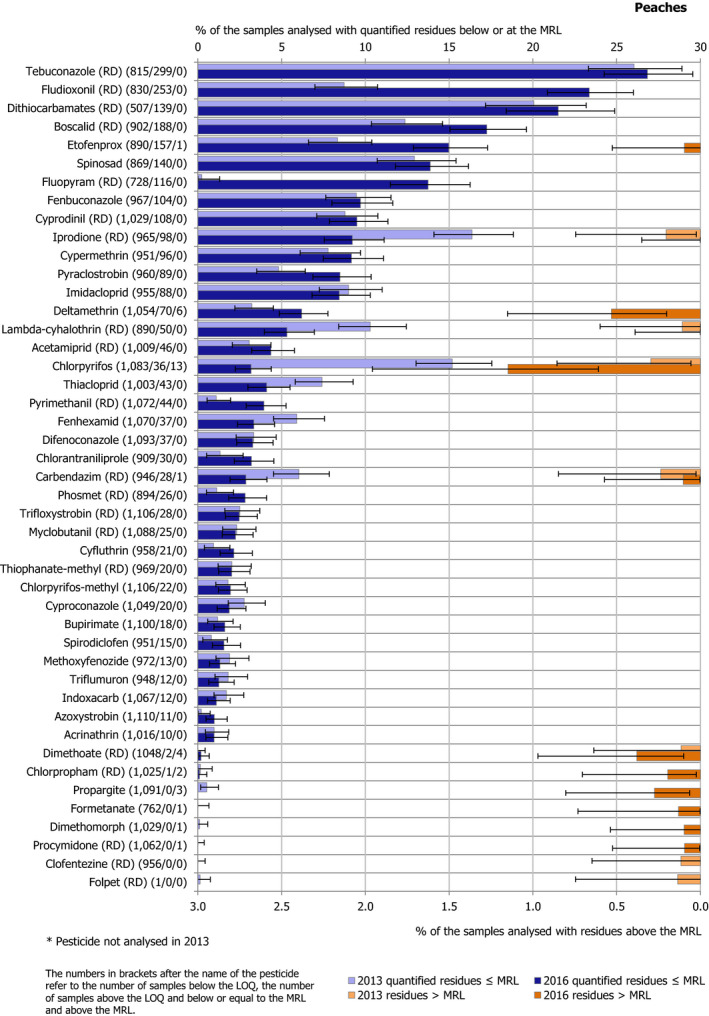
Percentage of peaches samples with quantified residues below or equal to the MRL and with residues above the MRL
The individual residue concentrations, expressed as a percentage of the respective MRL for the pesticide are plotted in Figure 17. Further information on the most frequently quantified pesticides found in peaches in 2016 in at least 10% of the samples is compiled in Table 5.
Figure 17.
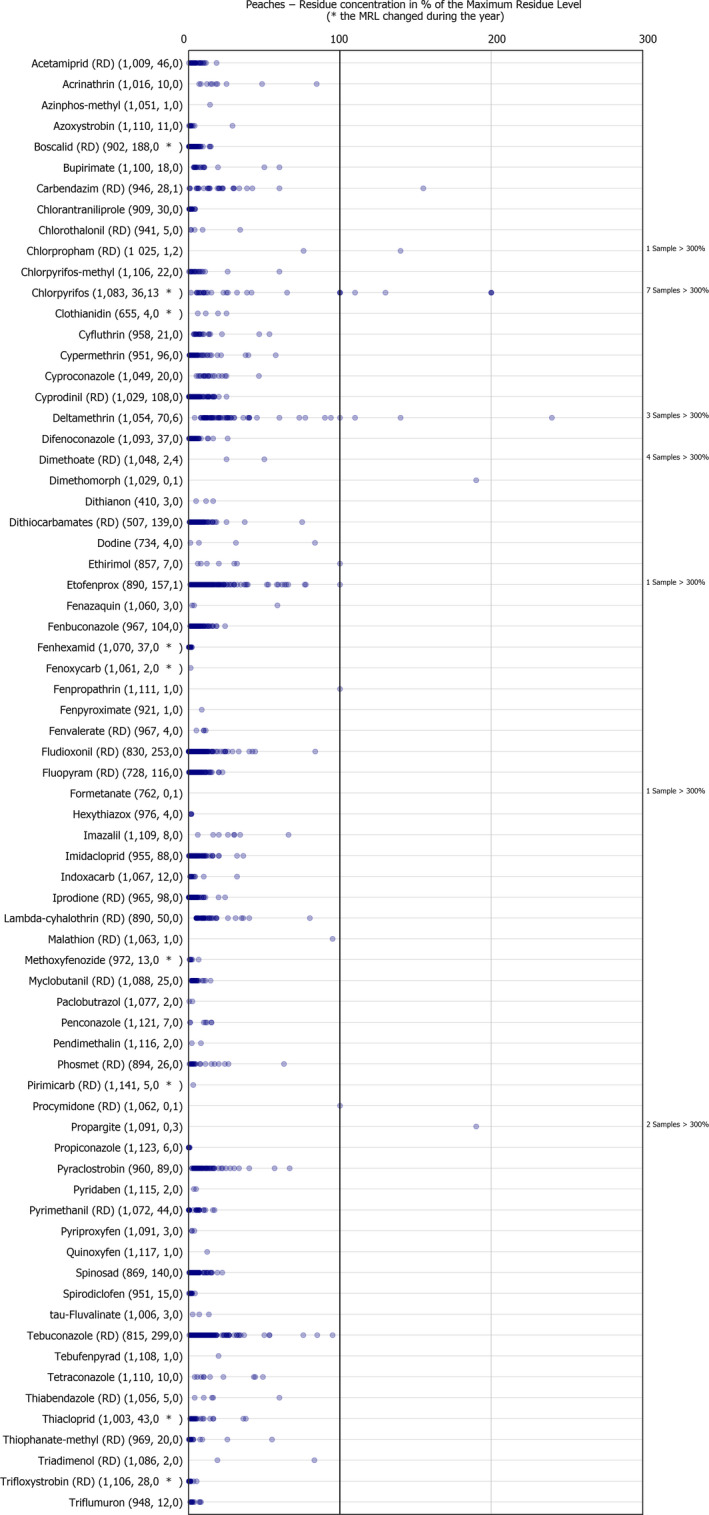
Residue concentrations measured in peaches, expressed as a percentage of the MRL (only samples with residues ≥ LOQ)24,25
Table 5.
Pesticides most frequently quantified in peaches in 2016
| Pesticide | % samples above LOQ | Approval status in 2016 (Reg. 1107/2009) |
|---|---|---|
| Tebuconazole (RD) | 26.8 | Approved fungicides |
| Fludioxonil (RD) | 23.4 | |
| Dithiocarbamates (RD) | 21.5 | |
| Boscalid (RD) | 17.2 | |
| Etofenprox | 15.1 | Approved insecticides |
| Spinosad | 13.8 | |
| Fluopyram (RD) | 13.7 | Approved fungicide |
LOQ: limit of quantification; RD: residue definition.
3.3.6. Strawberries
In 2016, 1,206 samples of strawberries were analysed; in 273 samples (22.6%), no quantifiable pesticide residues were found, while 933 samples (77.4%) contained one or several pesticides in quantified concentrations. Multiple residues were reported in 771 samples (63.9%); up to 16 different pesticides were reported in an individual sample of strawberries (Figure 18). The overall quantification rate is similar to the one reported in 2013, where 76.3% of the samples contained pesticide residues.
Figure 18.
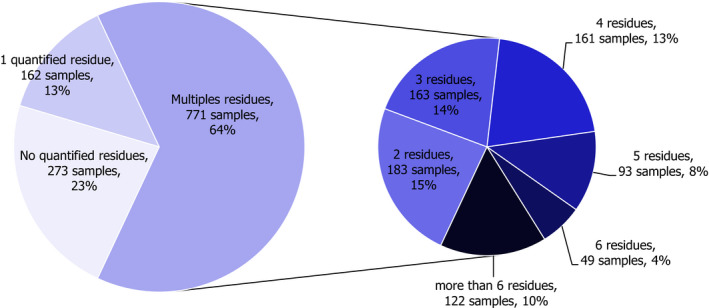
Number of quantified residues in individual strawberries samples
The residue levels exceeded the MRL for 1.8% of the samples (22 samples) and 0.7% of the samples (eight samples) were reported as non‐compliant, taking into account the measurement uncertainty. MRL exceedances were mainly related to products grown in the EU (5 from Romania, 5 samples from Italy, 2 samples from Cyprus, 2 from the Netherlands, 1 sample from Spain, 1 sample from Lithuania, 1 from Malta, 1 from Poland and 1 from France – La Réunion). In third countries, 2 samples from Egypt and 1 from China, and 2 with unknown origin had MRL exceedances.
In total, 76 different pesticides were quantified. The most frequently found pesticides were cyprodinil (quantified in 35.6% of the samples), fludioxonil (34.5%) and boscalid (30.3%). The MRL was exceeded for 15 different pesticides, most frequently for spinosad (4 samples from Italy, the Netherlands and Spain) and tebuconazole (4 samples from Romania and Cyprus), dimethoate (China, Egypt and Romania) and carbendazim (Lithuania and Malta).
Figure 19 presents the results for all pesticides with MRL exceedances and for the most frequently quantified pesticides. Compared to 2013, the quantification rate was in the same range for most pesticides. It was lower in 2016 for fenhexamid, pyraclostrobin and mepanipyrim, whereas fluopyram and trifloxystrobin were more frequently found. In terms of MRL exceedances, a similar rate is found for trifloxystrobin, spinosad, carbendazim, tebuconazole, dimethoate, propargite and procymidone.
Figure 19.
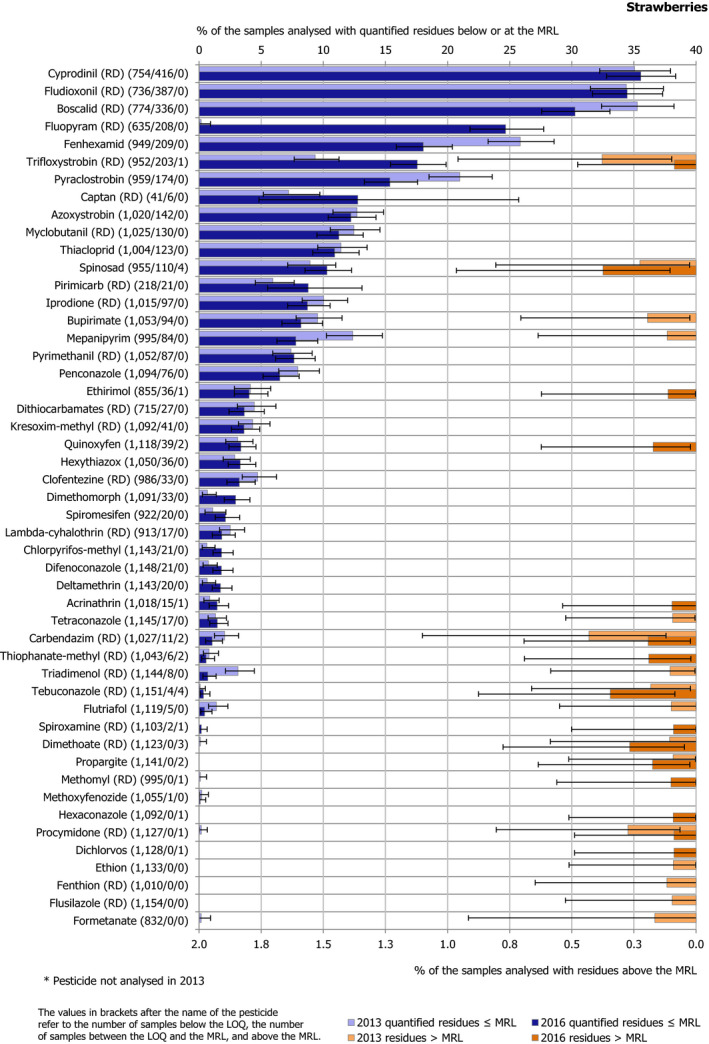
Percentage of strawberries samples with quantified residues below or equal to the MRL and with residues above the MRL
The individual residue concentrations, expressed as a percentage of the respective MRL for the pesticide are plotted in Figure 19. Further information on the most frequently quantified pesticides found in strawberries in 2016 in at least 5% of the samples is compiled in Table 6.
Table 6.
Pesticides most frequently quantified in strawberries in 2016
| Pesticide | % samples above LOQ | Approval status in 2016 (Reg. 1107/2009) and comments |
|---|---|---|
| Cyprodinil (RD) | 35.6 | Approved fungicide |
| Fludioxonil (RD) | 34.5 | |
| Boscalid (RD) | 30.3 | |
| Fluopyram (RD) | 24.7 | |
| Fenhexamid | 18.0 | |
| Trifloxystrobin (RD) | 17.6 | |
| Pyraclostrobin | 15.4 | |
| Captan (RD) | 12.8 | |
| Azoxystrobin | 12.2 | |
| Myclobutanil (RD) | 11.3 | |
| Thiacloprid | 10.9 | Approved insecticide |
| Spinosad | 10.7 |
LOQ: limit of quantification; RD: residue definition.
Figure 20.
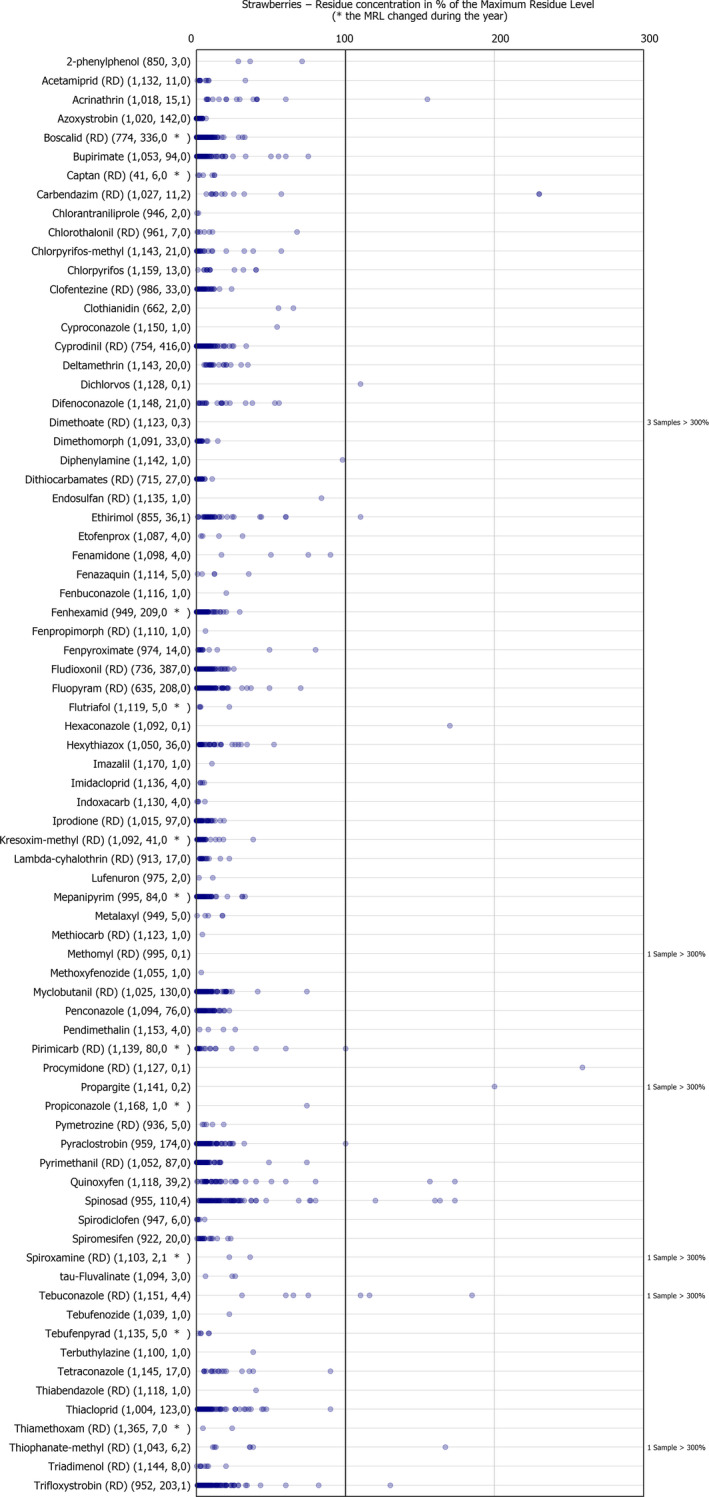
Residue concentrations measured in strawberries, expressed as a percentage of the MRL (only samples with residues ≥ LOQ)24,25
3.3.7. Tomatoes
In 2016, 1,594 samples of tomatoes27 were analysed; in 733 samples (46%), no quantifiable pesticide residues were found, while 861 samples (54%) contained one or several pesticides in quantified concentrations. Multiple residues were reported in 470 samples (29.5%); up to 12 different pesticides were reported in an individual tomato sample28 (Figure 21). The overall quantification rate was slightly higher than in 2013 (51% of the samples contained pesticide residues).
Figure 21.
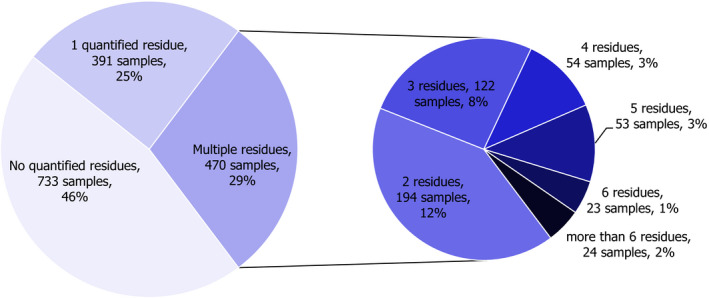
Number of quantified residues in individual tomatoes samples
The residue concentrations exceeded the MRLs in 2.6% of the samples (42 samples) and 1.6% of the samples (25 samples) were reported as non‐compliant, taking into account the measurement uncertainty. The MRL exceedances were mainly related to products grown not only in the EU (22 from France of which 20 were from Mayotte, 6 from Italy, 5 from Poland, 2 from Malta, 1 from Spain and 1 from Romania) but also from third countries (1 from Dominican Republic, 1 from Jordan and 1 from Morocco) and 2 samples with unknown origin.
In total, 91 different pesticides were quantified (concentrations at or above the LOQ). The most frequently quantified pesticides are bromide ion (quantified in 31.2% of the tested samples), fluopyram (14.2%) and dithiocarbamates (12.1%) (Table 7). The MRL was exceeded for 21 different pesticides, most frequently for dimethoate with 19 samples: 18 samples from Mayotte (France)29 and one from Italy.
Table 7.
Pesticides most frequently quantified in tomatoes in 2016
| Pesticide | % samples above LOQ | Approval status in 2016 (Reg. 1107/2009) |
|---|---|---|
| Bromide ion | 31.2 | Dithiocarbamates fungicides approved: maneb, mancozeb, metiram, propineb, thiram and ziram. Possibly, the detection of CS2 relates to false positive results due to the occurrence of naturally occurring substances in Alliaceae |
| Fluopyram (RD) | 14.2 | Approved fungicide |
| Dithiocarbamates (RD) | 12.1 | Approved fungicide |
| Spiromesifen | 9.7 | Approved acaricide and insecticide |
| Chlorantraniliprole | 8.9 | Approved insecticide |
| Boscalid (RD) | 7.4 | Approved fungicide |
| Acetamiprid (RD) | 5.2 | Approved insecticide |
LOQ: limit of quantification; RD: residue definition.
Figure 22 depicts the results for all pesticides with MRL exceedances and the most frequently quantified pesticides with residues below or at the MRL.
Figure 22.
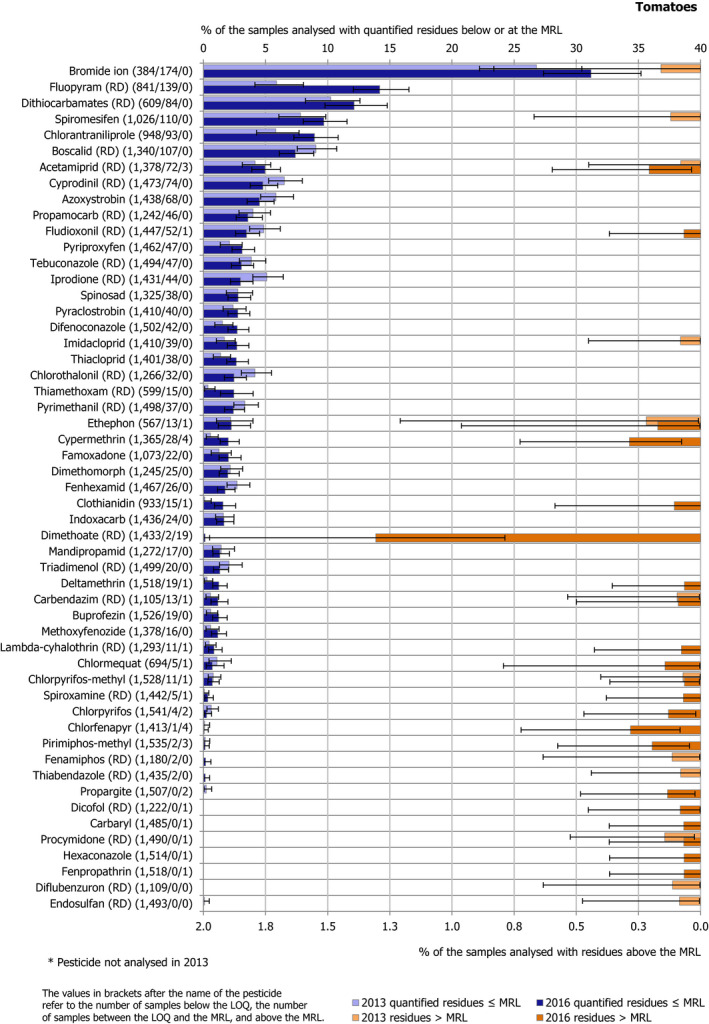
Percentage of tomatoes samples with quantified residues below or equal to the MRL and with residues above the MRL
Compared to 2013, the quantification rate was in the same range for most pesticides. It was significantly lower in 2016 for iprodione, while it was higher for fluopyram and thiamethoxam.
In terms of MRL exceedances, a similar rate is found for acetamiprid, ethephon, carbendazim, chlorpyrifos‐methyl and procymidone. MRL exceedances were identified only in 2016 for 16 pesticides and only in 2013 for 7 other pesticides. The highest difference in MRL exceedance rate in 2016 and 2013 was for dimethoate.
The individual residue concentrations, expressed as a percentage of the respective MRL for the pesticide are plotted in Figure 23. Further information on the most frequently quantified pesticides found in tomatoes in 2016 in at least 5% of the samples is compiled in Table 7.
Figure 23.
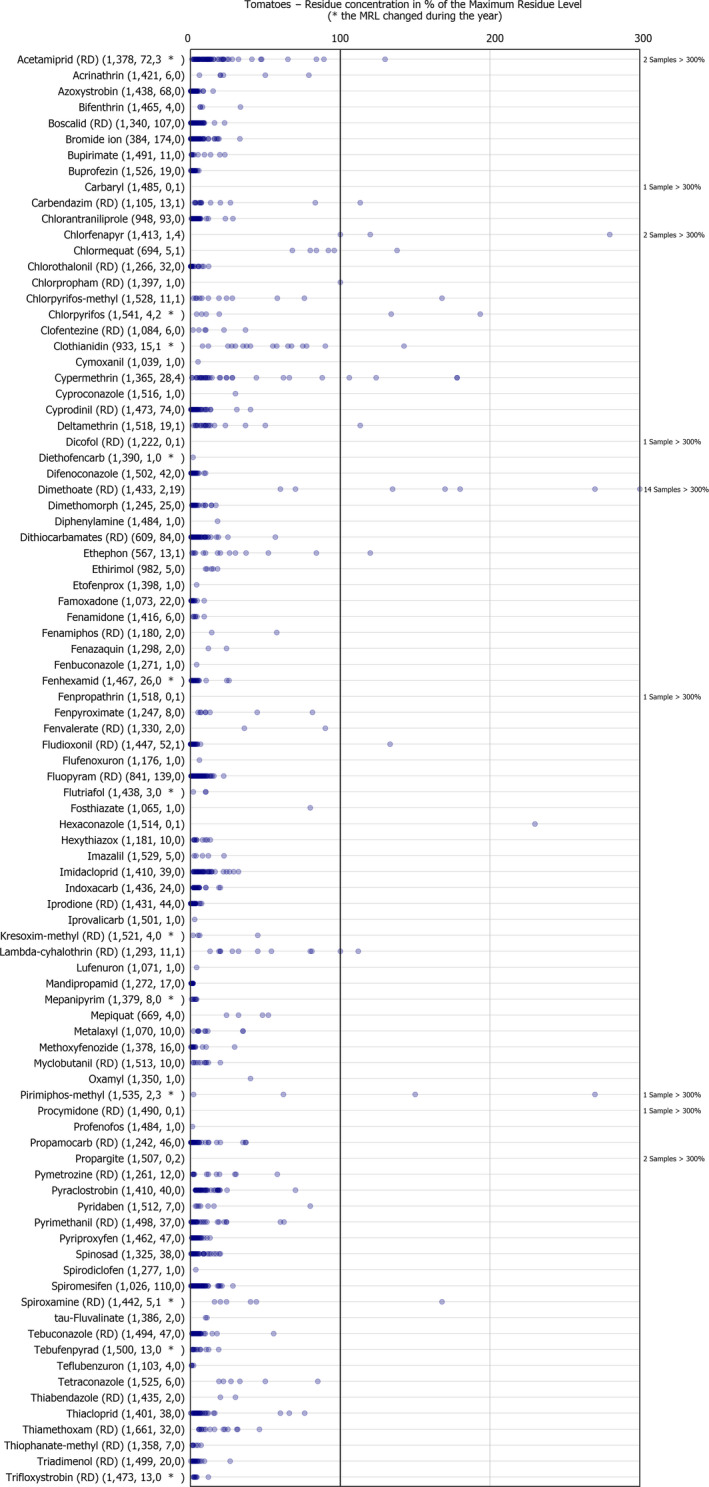
Residue concentrations measured in tomatoes, expressed as a percentage of the MRL (only samples with residues ≥ LOQ)24,25
3.3.8. Rye
In 2016, 608 samples of rye were analysed; in 396 samples (65.1%), no quantifiable pesticide residues were found, while 212 samples (34.9%) contained one or several pesticides in quantifiable concentrations. Multiple residues were reported in 88 samples (14.5%); up to 4 different pesticides were reported in an individual sample (Figure 24). The overall quantification rate was lower than in 2013 (41% of the samples with at least one residue).
Figure 24.
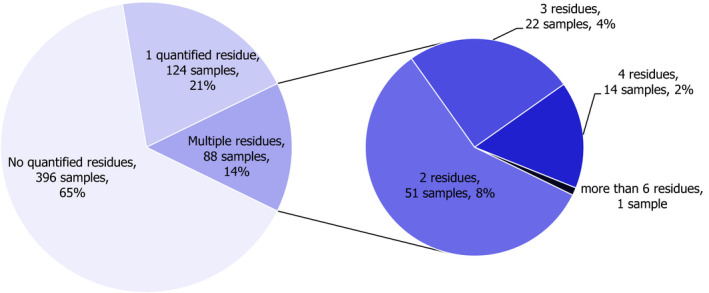
Number of quantified residues in individual samples of rye
The residue concentrations exceeded the MRLs in 0.7% of the samples (4 samples), including 1 sample reported as non‐compliant taking into account the measurement uncertainty. These MRL exceedances were related to products grown in the EU (1 sample from Germany, 1 sample from Romania, 1 sample from Italy and 1 unknown origin).
In total, 19 different pesticides were quantified. The most frequently found pesticides were chlormequat (quantified in 34.1% of the tested samples), mepiquat (14.2%) and pirimiphos‐methyl (8%). The MRL was exceeded for 4 pesticides: pirimiphos‐methyl in 1 sample from Italy, permethrin (1 sample from Germany), hexaconazole (1 sample from Romania) and dichlorvos (unknown origin).
Figure 25 presents the results for pesticides quantified below and above the MRL. Compared to 2013, the quantification rate was in the same range for most pesticides. However, for deltamethrin, this rate significantly increased in 2016. Cypermethrin was only quantified in 2016 and other pesticides were only quantified in 2013: 2‐phenylphenol, boscalid, malathion and triadimenol. No MRL exceedances were identified in 2013, whereas four pesticides exceeded MRLs in 2016.
Figure 25.
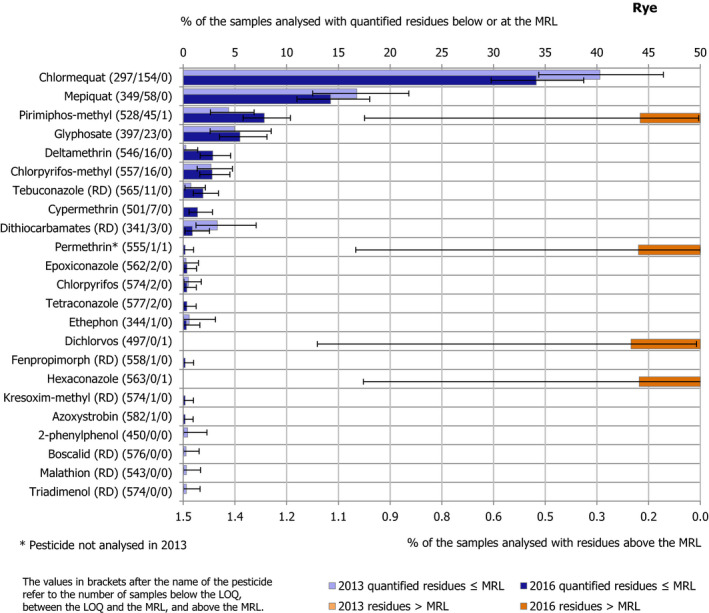
Percentage of samples of rye with quantified residues below or equal to the MRL and with residues above the MRL
The individual residue concentrations, expressed as a percentage of the respective MRL for the pesticide are plotted in Figure 26. Further information on the most frequently quantified pesticides found in rye in 2016 in at least 5% of the samples is compiled in Table 8.
Figure 26.
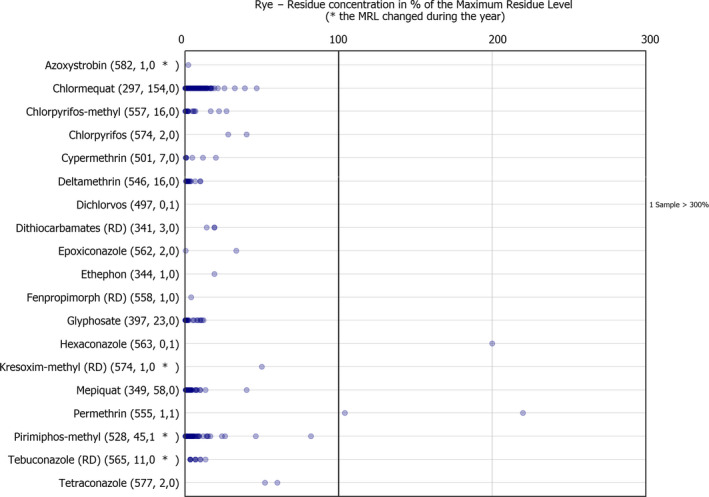
Residue concentrations measured in samples of rye, expressed as a percentage of the MRL (only samples with residues ≥ LOQ)24,25
Table 8.
Pesticides most frequently quantified in rye in 2016
| Pesticide | % samples above LOQ | Approval status in 2016 (Reg. 1107/2009) |
|---|---|---|
| Chlormequat | 34.1 | Approved plant growth regulator |
| Mepiquat | 14.2 | Approved plant growth regulator |
| Pirimiphos‐methyl | 8.0 | Approved insecticide |
| Glyphosate | 5.5 | Approved herbicide |
LOQ: limit of quantification; RD: residue definition.
3.3.9. Wine
In 2016, 1,317 samples of wine (red or white) made from grapes were analysed. In 768 samples (58.3%), no quantifiable pesticide residues were found, while 549 samples (41.7%) contained one or several pesticides in quantified concentrations. Multiple residues were reported in 263 samples (20%); up to 10 different pesticides were reported in an individual wine sample (Figure 27). The overall quantification rate is slightly lower than the 2013 quantification rate (45%).
Figure 27.
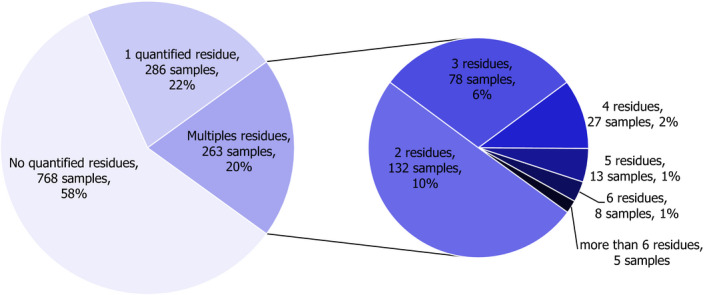
Number of quantified residues in individual wine samples
The residue concentrations exceeded the MRLs in 0.4% of the samples (in total 5 samples, 2 from Chile, 1 from Australia, 1 from Moldova and 1 from Spain); of those, the sample from Australia was reported as non‐compliant, after having taken the measurement uncertainty into account.
In total, 37 different pesticides were quantified, most frequently metalaxyl (quantified in 15.5% of the samples), dimethomorph (13.4%) and folpet (13.3%). The MRL were exceeded for metalaxyl in one sample from Spain, and for chlormequat in 2 samples from Chile, 1 sample from Australia and 1 sample from Moldova.
Figure 28 depicts the results for all pesticides with MRL exceedances and all quantified pesticides with residues below or at the MRL. Compared to 2013, the pesticide spectrum was comparable, with a quantification rate significantly higher for metalaxyl (+6.4%) and fluopyram (+3.9%) in 2016, and a lower quantification rate for fenhexamid (−5.7%) and iprodione (−3.1%). Except for carbendazim, in 2016 the reported MRL exceedances related to substances for which no legal limits were exceeded in 2013.
Figure 28.
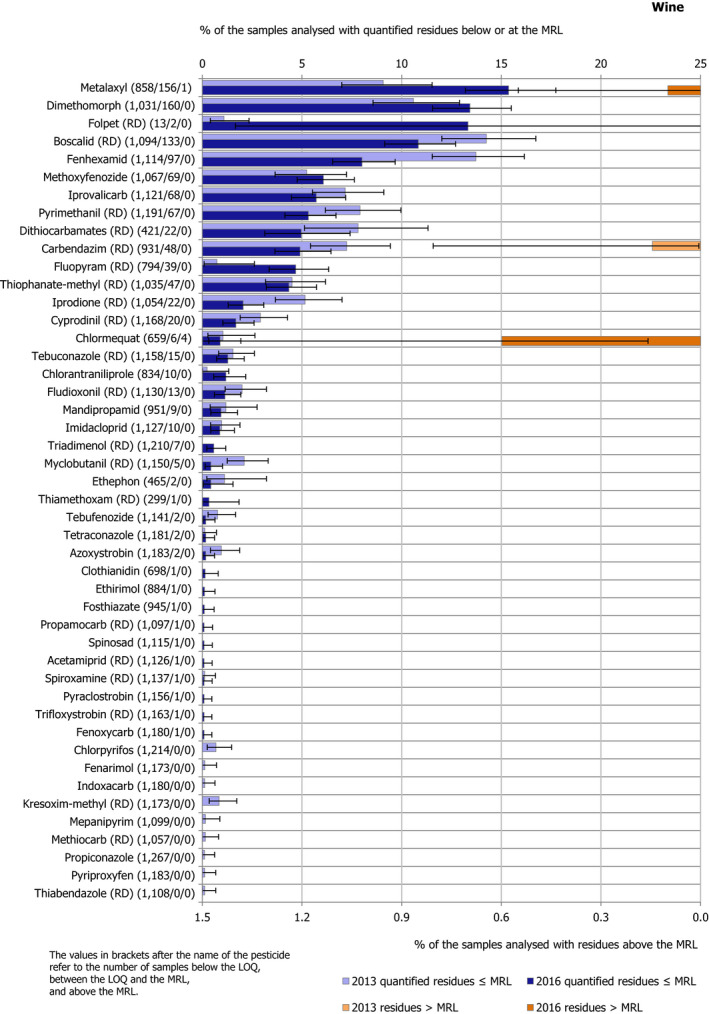
Percentage of wine samples with quantified residues below or equal to the MRL and with residues above the MRL set for wine grapes (default processing factor (PF) of 1 applied according to Regulation (EU) No 2015/595)
The individual residue concentrations, expressed as a percentage of the respective MRL for the pesticide are plotted in Figure 29. Further information on the most frequently quantified pesticides found in wine in 2016 in at least 5% of the samples is compiled in Table 9.
Figure 29.
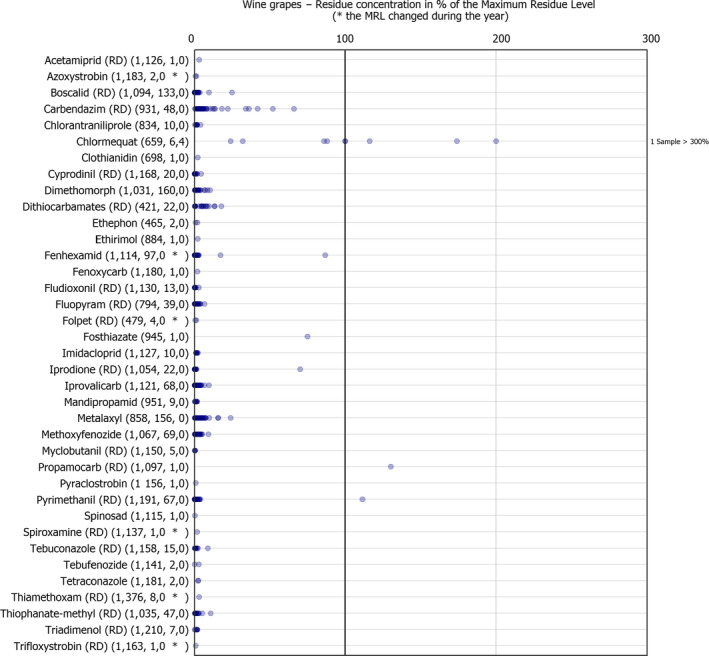
Residue concentrations measured in wine, expressed as a percentage of the MRL (only samples with residues ≥ LOQ)24,25
Table 9.
Pesticides most frequently quantified in wine in 2016
| Pesticide | % samples above LOQ | Approval status in 2016 (Reg. 1107/2009) |
|---|---|---|
| Metalaxyl | 15.5 | Approved fungicides |
| Dimethomorph | 13.4 | |
| Folpet (RD) | 13.3 | |
| Boscalid (RD) | 10.8 | |
| Fenhexamid | 8.0 | |
| Methoxyfenozide | 6.1 | Approved insecticide |
| Iprovalicarb | 5.7 | Approved fungicides |
| Pyrimethanil (RD) | 5.3 |
LOQ: limit of quantification; RD: residue definition.
3.3.10. Cow's milk
In 2016, 582 samples of cow's milk were analysed. In 545 samples (93.6%), no quantifiable pesticide residues were found, while 37 samples (6.4%) contained one or several pesticides in quantifiable concentrations. Multiple residues were reported in 14 samples (2.4%); up to 4 different pesticides were found in an individual milk samples (Figure 30). Compared to 2013, in 2016, the overall quantification rate slightly decreased (in 2013, 8% of the samples contained pesticide residues).
Figure 30.
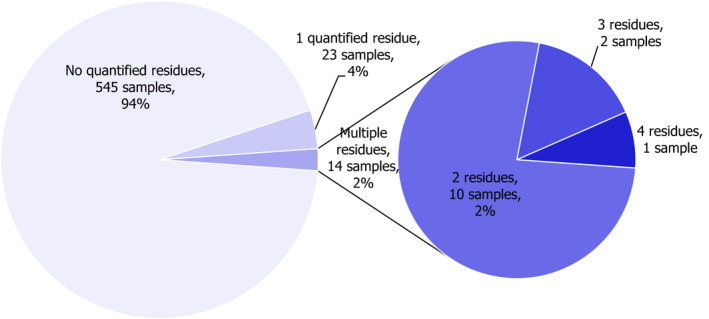
Number of quantified residues in individual cow's milk samples
No MRL exceedance has been identified for these samples.
In total, four different pesticides were quantified at levels at or lower than the MRL. Figure 31 depicts the results for all quantified pesticides. The most frequently quantified pesticides were hexachlorobenzene (quantified in 4.7% of the tested samples) and DDT (4.4%). The quantification rate is similar to the one in 2013. Chlordane and alpha‐HCH (hexachlorocyclohexane) were quantified only in 2016. Heptachlor, beta‐HCH and lindane (gamma‐HCH), found in 2013, were not quantified in 2016.
Figure 31.
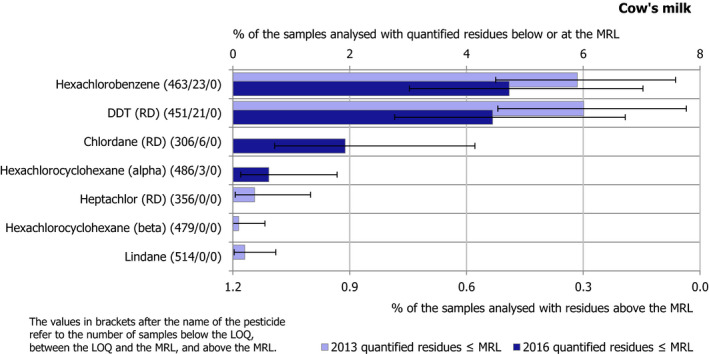
Percentage of milk samples with quantified residues below or equal to the MRL
The individual residue concentrations, expressed as a percentage of the respective MRL for the pesticide are plotted in Figure 32. Further information on the most frequently quantified pesticides found in butter in 2016 is compiled in Table 10.
Figure 32.
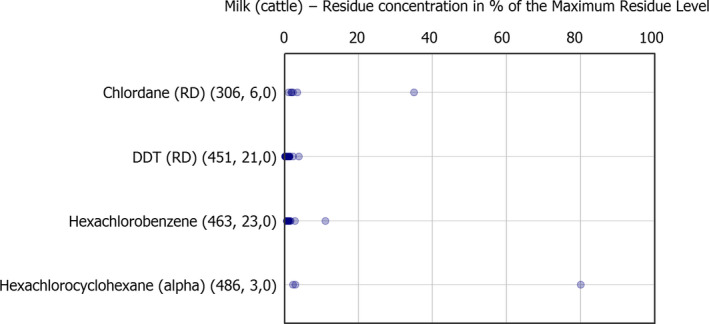
Residue concentrations measured in milk, expressed as a percentage of the MRL (only samples with residues ≥ LOQ)24,25
Table 10.
Pesticides most frequently quantified in cow's milk in 2016
| Pesticide | % samples above LOQ | Approval status and comments |
|---|---|---|
| Hexachlorobenzene | 4.7 | Persistent organic pollutants, banned at international level (Stockholm Convention, UNEP, 2001) and Regulation (EC) No 850/2004 |
| DDT (RD) | 4.4 | |
| Chlordane (RD) | 1.9 | |
| Alpha‐HCH (hexachlorocyclohexane) | 0.6 |
LOQ: limit of quantification; RD: residue definition.
3.3.11. Swine fat
In 2016, 919 samples of swine fat were analysed. In 893 samples (97.2%), no quantifiable pesticide residues were found, while 26 samples (2.8%) contained one or several pesticides in quantified concentrations. Four samples (0.4%) contained multiple residues; up to 3 different pesticides were reported in an individual swine fat sample (Figure 33). In 2013, swine fat was not analysed.
Figure 33.
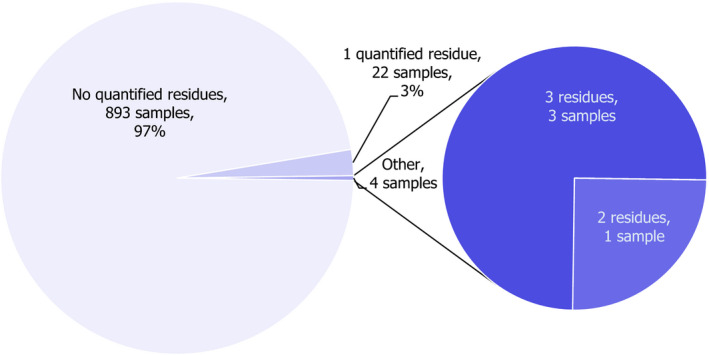
Number of quantified residues in individual swine fat samples
The residue concentrations exceeded the MRLs in one sample of unknown origin and only for one pesticide residue; the concerned residue was permethrin (MRL set at the LOQ of 0.05 mg/kg). This sample was nevertheless compliant with the MRL, when the analytical uncertainty was accounted for.
Figure 34 depicts the results for all pesticides with MRL exceedances and for quantified pesticides with residues below or at the MRL. Compared to 2013 (where only swine meat samples were analysed), the pesticide profile did not change significantly.
Figure 34.
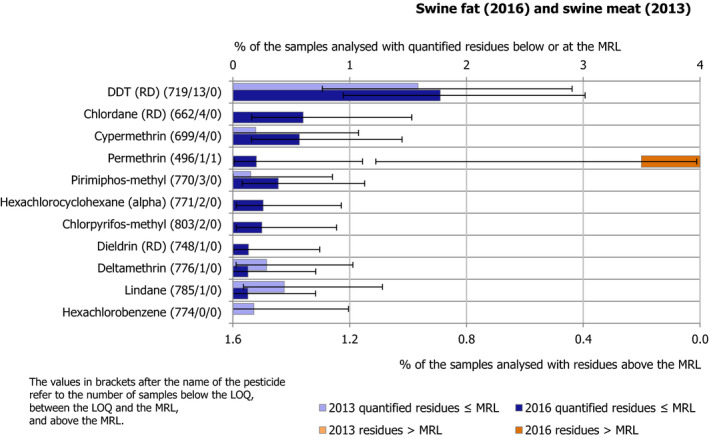
Percentage of swine fat samples with quantified residues below or equal to the MRL and with residues above the MRL
In total, 10 different pesticides were quantified in swine fat. The most frequently found pesticides were the POPs, such as DDT (1.8% of the tested samples) and chlordane (0.6%); in addition, cypermethrin (0.6%) and permethrin (0.4%) were found which are used not only as pesticides but also as veterinary medicinal products. POPs are prohibited at the international level under the Stockholm convention (UNEP, 2001), but are still present in the environment due to their persistence. Cypermethrin and permethrin are not only used as pesticides, but are also approved antiparasitic agents used against ectoparasites according to Regulation (EU) No 37/2010.
The individual residue concentrations, expressed as a percentage of the respective MRL for the pesticide are plotted in Figure 35. Further information on the pesticides found in swine fat in 2016 is compiled in Table 11.
Figure 35.
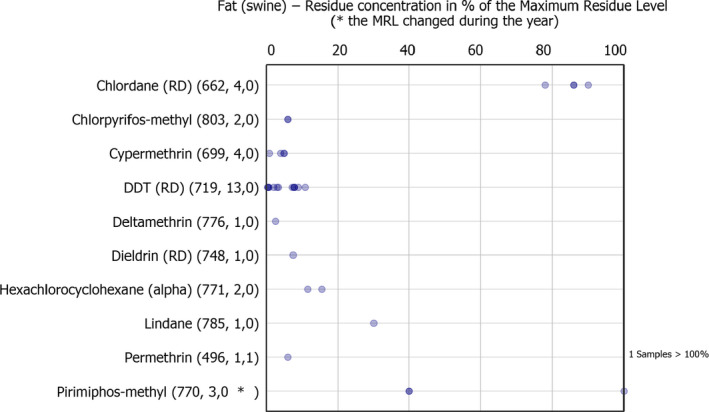
Residue concentrations measured in swine fat, expressed as a percentage of the MRL (only samples with residues ≥ LOQ)24,25
Table 11.
Pesticides most frequently quantified in swine fat in 2016
| Pesticide | % samples above LOQ | Approval status and comments |
|---|---|---|
| DDT (RD) | 1.8 | Persistent organic pollutants, banned at international level (Stockholm Convention (UNEP, 2001); Regulation (EC) No 850/2004). Fat‐soluble substances |
| Chlordane (RD) | 0.6 | |
| Cypermethrin | 0.6 | Approved insecticide according to Regulation (EC) 1107/2009. Fat‐soluble substance |
| Permethrin | 0.4 | Not approved insecticide according to Regulation (EC) 1107/2009. Fat‐soluble substance |
LOQ: limit of quantification; RD: residue definition.
3.4. Overall results of EU‐coordinated control programme
Overall, 1.7% of the 12,168 samples analysed in 2016 in the framework of EUCP exceeded the MRL (203 samples in total). In total, 0.9% of the samples (107 samples) were considered to be not compliant taking into account the measurement uncertainty. The number of samples with quantified residues, but within the legally permitted level (at or above the LOQ but below or at the MRL) was 5,598 (46.0%) (Figure 36). The number of samples with no quantifiable residues (residues below the LOQ) was 6,367 (52.3%). Compared to 2013 – the reference period where the same commodities as in 2016 were analysed – the MRL exceedance rate recorded in 2013 was significantly lower (0.9%). Reasons for the MRL exceedances in lettuces, peaches and head cabbage regarding chlorpyrifos residues were due to the lowering of the MRL during 2016, whereas in tomatoes the specific reason for dimethoate exceedances is likely to come from the intensified control France did in Mayotte oversea territory. Further, many non‐approved substances were quantified in EUCP samples. The percentage of samples with quantified residues within the legal limits is significantly lower than in 2013 (50.9% in 201330 vs 46% in 2016). Considering that in 2013 swine fat samples were not analysed (only swine meat) and that in 2016 oat was not sampled, swine and oat results were not considered to compare the quantification and MRL exceedance rates between 2013 and 2016.
Figure 36.
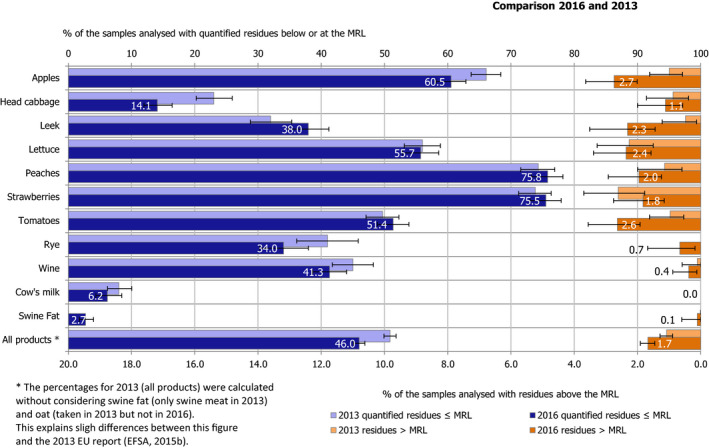
Overall proportion of EUCP samples with residues exceeding the MRL and samples with quantified residues below or at the MRL
Among the unprocessed plant products analysed in the 2016 EUCP, the lowest MRL exceedance rates were identified for rye, followed by head cabbage and strawberries. The ascending ranking of plant products exceeding the MRL is continued with peaches, leek, lettuce, tomatoes and apples. A low MRL exceedance rate was found in wine.
Except for one single quantification of permethrin in one sample of swine fat, no MRL exceedances were reported for samples of animal origin (swine fat and cow's milk); all the quantified residues in animal products were fat soluble and mainly due to obsolete, banned substances, which were used in the past as pesticides.
4. Overall monitoring programmes (EUCP and national programmes)
Compared with the EUCP, the national control programmes are rather risk based, focussing on products likely to contain pesticide residues or for which MRL infringements were identified in previous monitoring programmes. These programmes are not designed to provide statistically representative results for residues expected in food placed on the European market. The reporting countries define the priorities for their national control programmes taking into account the importance of food products in trade or in the national diets, the products with high residue prevalence or non‐compliance rates in previous years, the use pattern of pesticides and the laboratory capacities. The number of samples and/or the number of pesticides analysed by the participating countries is determined by the capacities of national control laboratories and the available budget resources. Considering the specific needs in the reporting countries and the particularities of national control programmes, the results of national control programmes are not directly comparable.
In the framework of the national control programmes, reporting countries also provided results of import controls performed under Regulation (EC) No 669/2009. These specific import controls are defined, inter alia based on previously observed high incidences of non‐compliant products imported from certain countries from outside the Union and/or notifications under the Rapid Alert System of the European Commission.
The first part of this chapter (Section 4.1) describes the design of the national programmes, highlighting the differences in the approaches chosen by reporting countries. In the second part of the chapter (Section 4.2), the results of the national control activities are analysed in more detail with regard to the main parameters describing the national programmes (food products/pesticides/countries of the food origin). In these analyses, EFSA put specific emphasis on MRL exceedances as these findings may give indications of agricultural practices not in line with the legal provisions or potential consumer risk. However, it should be stressed again that since the national control programmes are targeted sampling strategies, the identified cases of MRL exceedances should not be considered as being statistically representative of the food available to European consumers. The findings, in particular the MRL exceedances, should be used by risk managers for their considerations and/or to take decisions on designing the risk based national monitoring programmes, e.g. which pesticides should be covered by the analytical methods used to analyse food products, or which types of products should be included in the national control programmes in order to make the programmes more efficient. The information would be also a valuable source of information for food business operators to design the control programmes for pesticide residues.
4.1. Description of the overall monitoring programmes
In 2016, in total, 84,657 samples31 of food products covered by Regulation (EC) No 396/2005 were analysed for pesticide residues in the 30 EU reporting countries. Thus, the total number of samples analysed under the EUCP and the national control programmes increased slightly compared with the previous reporting year (+0.4%), where results for 84,341 samples were reported in 2015.
The majority of samples (80,484 samples, 95.1%) were classified as surveillance samples, meaning that the samples were taken without targeting specific growers/producers/importers or consignments likely to be non‐compliant. In 4.9% of the cases, a suspect sampling strategy was applied, enforcing provisions of EU legislation on an increased level of official controls on imported food (Regulation (EC) No 669/2009). This means that samples were taking after concrete indications that certain food may be of higher risk as regards non‐compliance or consumer safety (e.g. Rapid Alert notifications or follow‐up enforcement samples following MRL violations identified in a first analysis of the product in focus).
The number of samples per reporting country and the sampling frequency per 100,000 inhabitants of the reporting country are presented in Figures 37 and 38.
Figure 37.
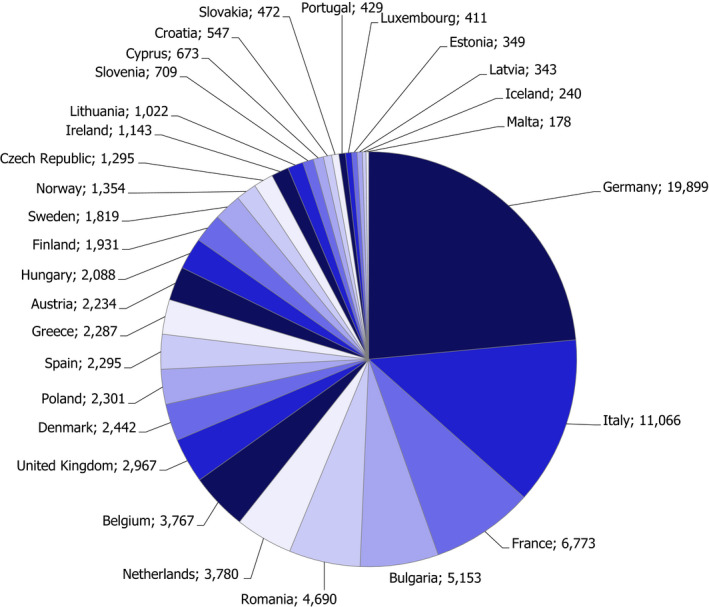
Number of samples analysed by each reporting country
Figure 38.
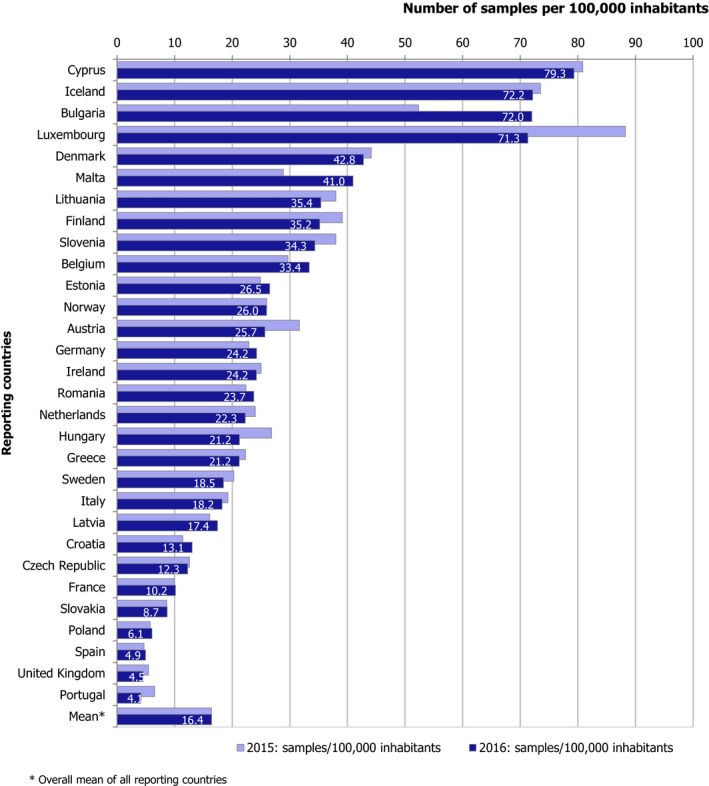
Number of samples normalised by number of inhabitants
No major changes were noticed between 2015 and 2016 as regards the ratio of samples from domestic production, other EU/EEA countries and third countries; the information on the sample origin for the 2016 programme is presented in Figure 39. The countries with the highest rates of samples of imported products from third countries were Bulgaria (95.7%), the Netherlands (61.7%) and Sweden (45.9%); Greece, Spain and Portugal focussed their national control programmes mainly on domestic products (more than 85% of the samples analysed).
Figure 39.
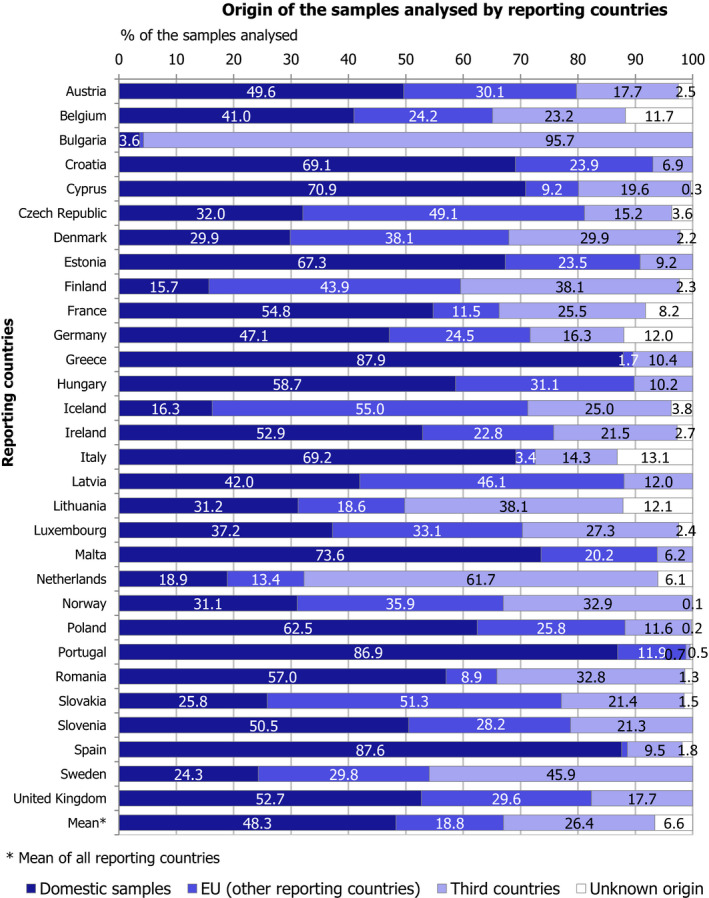
Origin of samples by reporting country
A more detailed analysis of the origin of the samples is presented in Figure 39.
Overall, 56,749 samples (67%) analysed originated from EU reporting countries (EU Member States, Norway and Iceland). In total, 22,345 samples (26.4%) were imported from third countries; for 5,563 samples (6.6%), the origin of the products was not reported (Figure 40).
Figure 40.
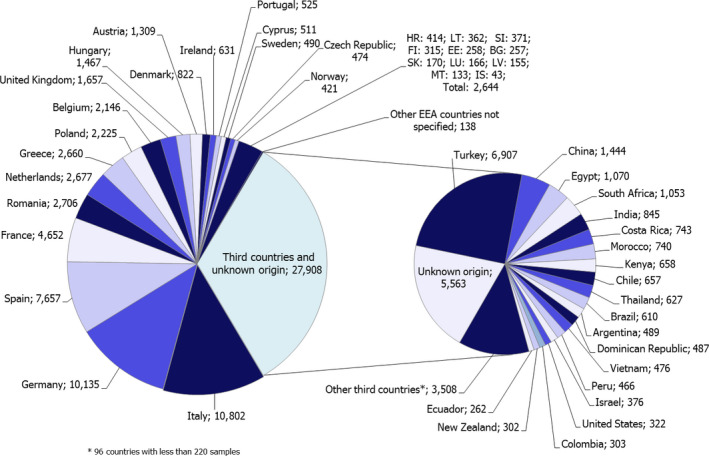
Origin of tested samples (reporting countries and third countries)
Similar to previous years, a wide scope of pesticides and of different food products was analysed. Considering all samples, the reporting countries analysed in total 791 different pesticides. The broadest analytical scopes at the country level was noted for Malta which reported in total 721 pesticides, followed by Germany (683 pesticides), Belgium (606 pesticides), Spain (571 pesticides), France (566 pesticides), Luxembourg (551 pesticides), Austria (519 pesticides), United Kingdom, Croatia, the Netherlands, Hungary, Sweden and Italy, all analysed at least 400 different pesticides. On average, 230 different pesticides were analysed per sample, which represents an increase of 4% compared to the previous year (Figure 41).
Figure 41.
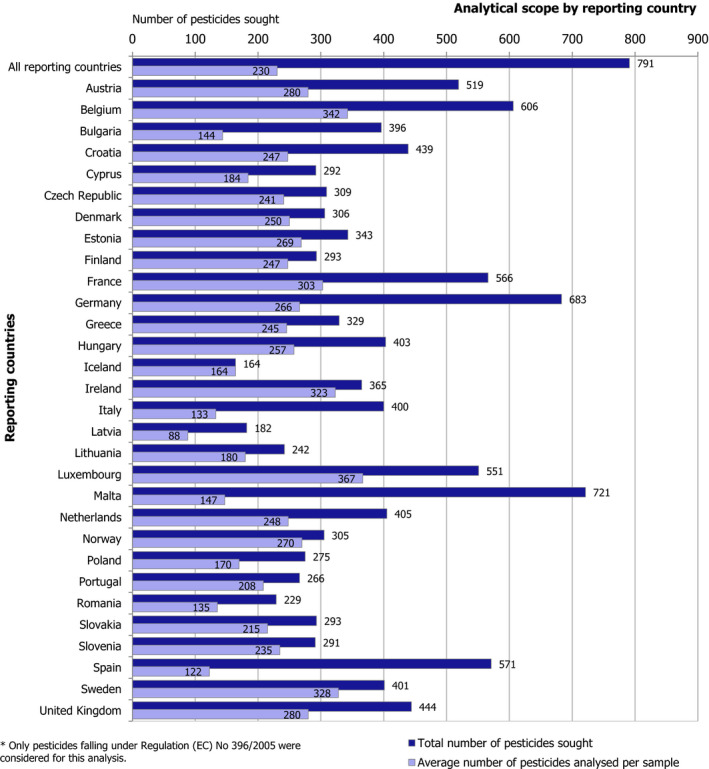
Number of pesticides analysed by reporting country
All reporting countries together covered a wide variety of unprocessed agricultural food products and processed products (e.g. cereal products such as flour, polished rice, wine, vegetable oils, fruit and vegetable juices, canned fruits and vegetables, milk products, dried fruits such as raisins, dried herbs, different types of baby food, etc.) which allows to get a comprehensive picture of the pesticide residue situation for food placed on the EU market.
A detailed analysis of the national control programmes reveals the different scopes of the national MRL enforcement strategies. Additional elements, such as the proportion of organic and conventional product samples or the types of food products sampled contribute to the overall variability of the national control programmes. The heterogeneity of national control programmes needs to be kept in mind when comparing results of different reporting countries. More information on the national control programmes can be found in the separate EFSA technical report that summarises the national results (EFSA, 2018a).
4.2. Results of the overall monitoring programmes
Overall, 96.2% of the 84,657 samples analysed in 2016 fell within the legal limits (81,482 samples); 42,935 of these samples (50.7% of the total number of samples tested) did not contain quantifiable residues (results below the LOQ for all pesticides analysed) while 45.5% of the samples analysed contained quantified residues not exceeding the legal limits (38,547 samples). MRLs were exceeded in 3.8% of the samples analysed in 2016 (3,175 samples; Figure 42). Taking into account the analytical measurement uncertainty, 2.2% of all samples analysed in 2016 (1,833 samples) clearly exceeded the legal limits, triggering legal sanctions or administrative actions; these samples are considered as non‐compliant with the legal limits.
Figure 42.
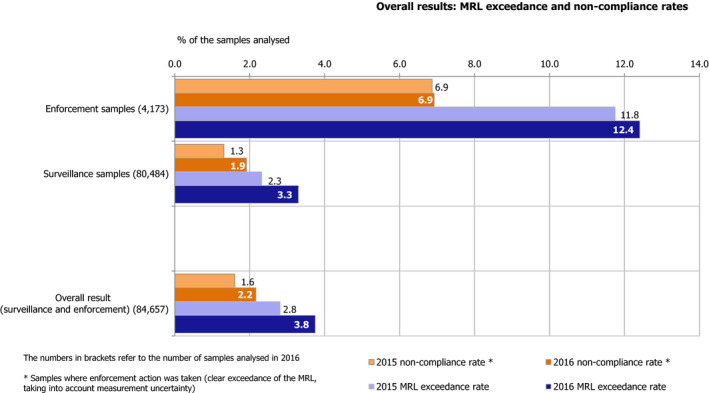
Percentage of samples compliant with the legal limit/exceeding the legal limit (MRL)
The overall MRL exceedance and non‐compliance rates slightly increased in 2016; thus, 3.8% of the samples exceeding the MRL in 2016 (2.8% in 2015) and 2.2% of the samples were considered as non‐compliant (1.6% in 2015) (Figure 42). Considering only surveillance samples (samples taken without targeting towards non‐compliances), 3.3% of the samples analysed in 2016 contained residues exceeding the MRL (2.3% in 2015). For enforcement samples (food items sampled targeting towards non‐compliances), the MRL exceedance rate was 12.4% in 2016 (11.8% in 2015).
The results presented in the following sections refer to the complete data set, comprising results of surveillance and enforcement samples as well as unprocessed and processed food products, unless specifically indicated that the analysis was restricted to a subset of the results.
4.2.1. Results by country of food origin
Overall, 53.8% of the samples originating from EU Member States, Iceland and Norway were free of quantifiable residues; 43.9% of the samples contained residues at or above the LOQ but below the MRL, while 2.4% of the samples exceeded the MRL and 1.2% of the samples were considered non‐compliant with the MRL taking the analytical measurement uncertainty into account.
Samples from third countries were found to have a higher MRL exceedance rate (7.2%) and a higher non‐compliance rate (4.7%) compared to food produced in the EU (Figure 43). The percentage of samples from third countries free of quantifiable residues (residues below the LOQ) amounted to 40.7% while 52.1% of the samples contained quantifiable residues within the legal limits.
Figure 43.
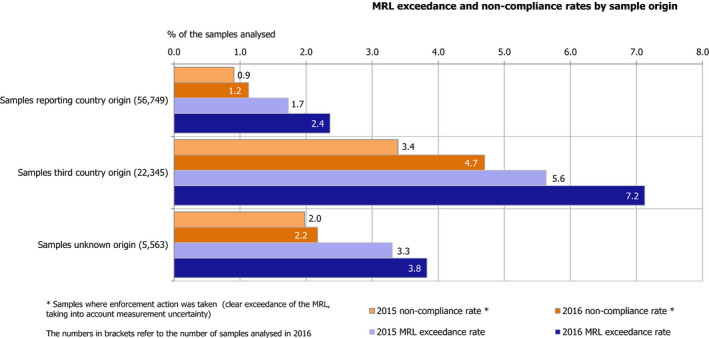
Percentage of samples exceeding the MRL and non‐compliant by origin
The detailed MRL exceedance rates and the percentage of samples containing residues within the MRL originating from reporting countries and from third countries are presented in Figures 44 and 45. To allow a tentative comparison with the results generated in the previous reporting year, these two charts contain also the results for 2015.
Figure 44.
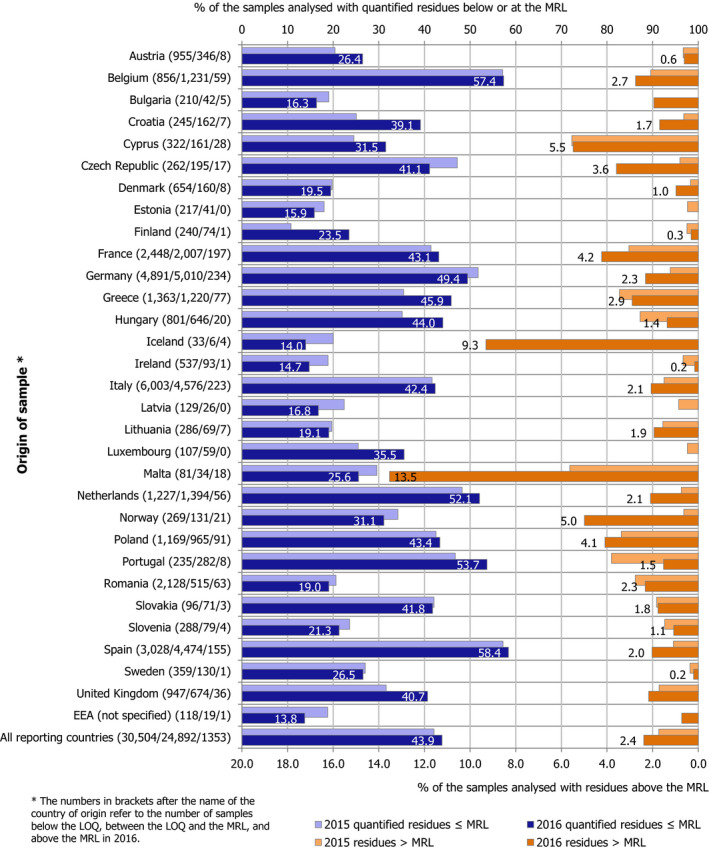
MRL exceedance and quantification rates by country of origin (reporting countries)
- FYROM: the Former Yugoslav Republic of Macedonia.
Figure 45.
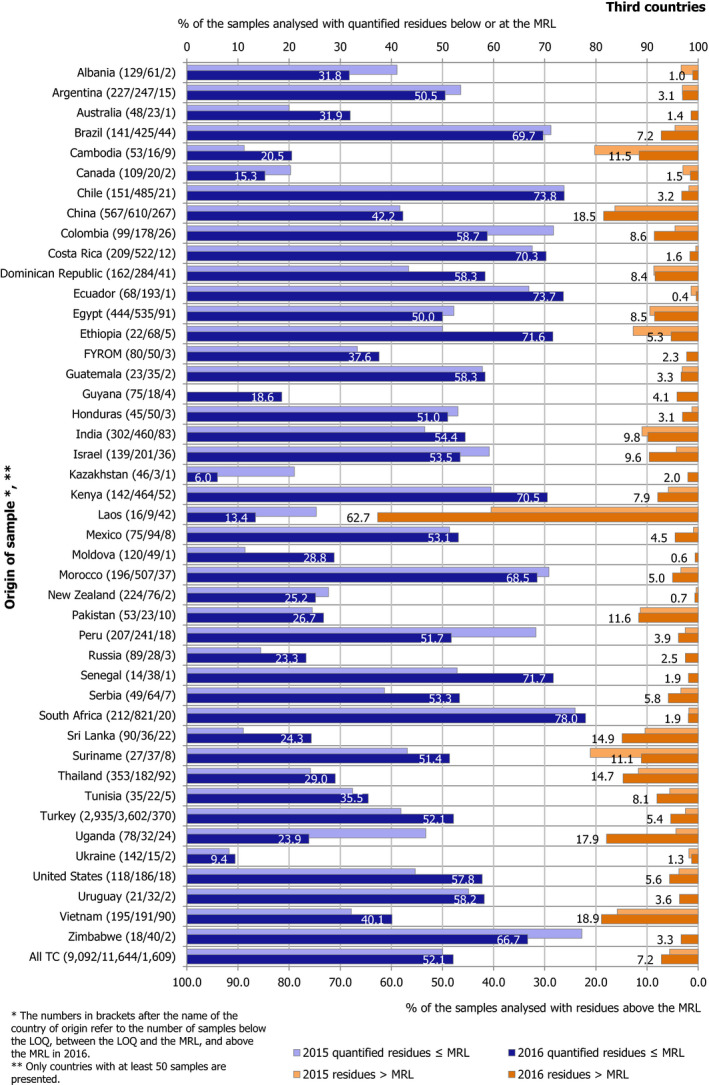
MRL exceedance and quantification rates by country of origin (third countries)
- FYROM: the Former Yugoslav Republic of Macedonia.
The highest MRL exceedance rates among the samples originating from the reporting countries (EU produces) were reported for products from Malta, Iceland, Cyprus, Norway, France and Poland (more than 4% of the samples exceeding the MRL). In particular, for Iceland32 and Malta it is observed an important increase of MRL breaches compared to the previous control year.
For samples produced in a third country (countries for which at least 50 samples were analysed), the highest MRL exceedance rates were noted for Laos, Vietnam, China, Uganda, Sri Lanka, Thailand, Pakistan, Cambodia and Suriname. Other third countries with a substantial number of samples (more than 50 samples taken) and MRL exceedances above the average (7.2% of the samples) were India, Israel, Colombia, Egypt, Dominican Republic, Tunisia, Kenya and Brazil.
4.2.2. Results by food products
Among unprocessed food products,33 the MRL exceedance rate amounted to 3.9% of the samples analysed in 2016 (3% in 2015), 47.9% of the samples contained quantified residues within the legal limits (46.9% in 2015) and 48.2% of the samples were free of quantifiable residues (50.1% in 2015) (Figure 46). Among the unprocessed products with at least 60 samples analysed, the highest MRL exceedance rates (greater than 10%) were identified for basil and edible flowers, water cresses, passion fruit, teas, liver (sheep and bovine), celery leaves, prickly pears, parsley, turnips, celeries, wild fungi, fresh herbs and edible flowers, pomegranates, okra and rucola. Some of the food products with MRL exceedance rates above the average are products, which were subject to increased import controls (e.g. tea, okra, basil, parsley, celery leaves) under Regulation (EC) No 669/2009. Thus, the results for these products are biased due to the targeted sampling in the framework of border inspections. More details on results for this specific sampling programme can be found in Section 4.2.4.
Figure 46.
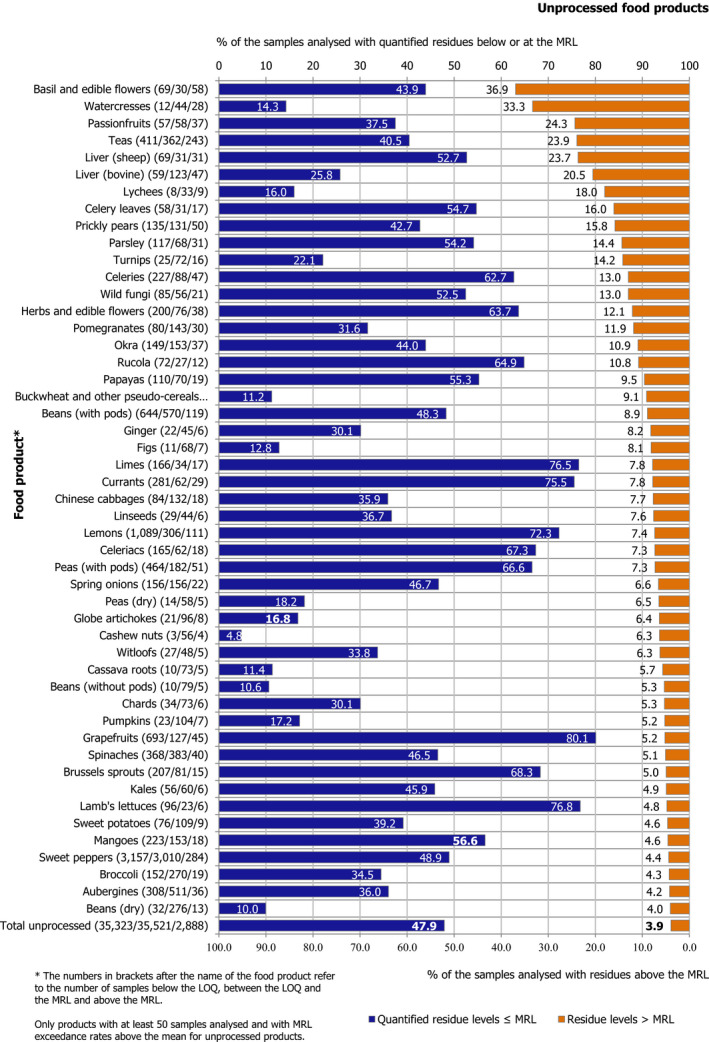
MRL exceedance rate and quantification rate for unprocessed food products in 2016, sorted by decreasing MRL exceedance rate
No MRL exceedance (products with at least 60 samples analysed) was reported for unprocessed coffee beans, rhubarbs, sweet corn and a number of products of animal origin, such as bovine and poultry (muscle and fat), sheep (fat) and milk.
For processed food products, the overall MRL exceedance rate was lower (2.8%) (Figure 47) than for unprocessed products (3.9%) (Figure 46). Similar to the results reported for 2015, processed grape leaves (and similar species), tomatoes, wild fungi, sweet peppers, rice, table grapes, sweet corn and table olives most frequently exceeded the MRLs. Teas, strawberries, pineapples, milk (goat) and muscle (swine) were also found to exceeded the MRLs frequently in 2016 (more than 2% of the samples). Therefore, it is suggested to continue monitoring the above‐listed food items in the national control plans, in particular for those food items not covered by the 3‐years EUCP rolling programme (e.g. grape leaves, tomatoes, raisins and wild fungi).
Figure 47.
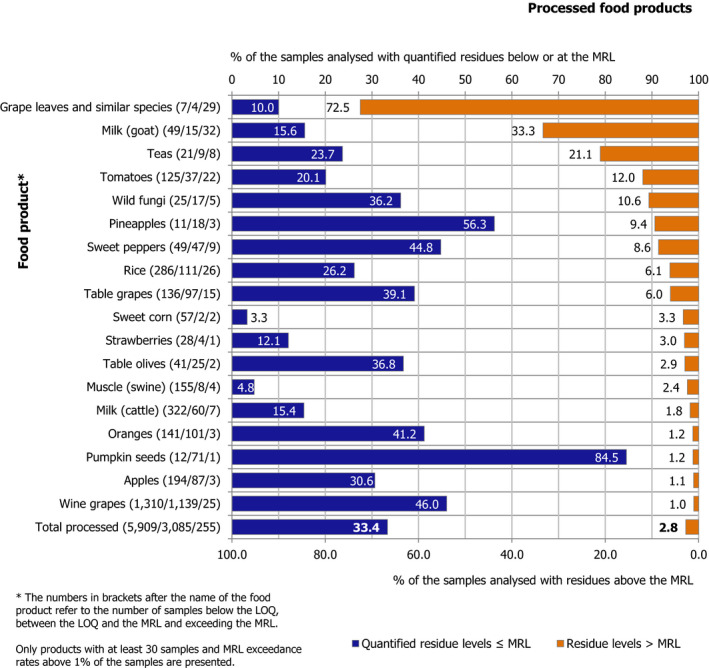
MRL exceedance rate and quantification rate for processed food products (excluding baby foods), sorted by decreasing MRL exceedance rate
4.2.3. Results by pesticides
Overall, in 2016, nearly 20 million analytical determinations (individual results) were submitted to and used by EFSA as basis for the data analysis presented in this report; the number of single determinations for which the residue levels were quantified at or above the LOQ amounted to 109,843 (0.56% of the total determinations; 0.55% in 2015) and related to a total of 41,722 samples (39,423 in 2015) and 350 different pesticides (349 in 2015).
The pesticides mostly quantified (in terms of absolute numbers of positive analysis at or above the LOQ) were boscalid (6,815 determinations), fludioxonil (4,255 determinations), imazalil (4,061 determinations), cyprodinil (3,721 determinations), acetamiprid (3,578 determinations), azoxystrobin (3,526 determinations) and chlorpyrifos (3,371 determinations) (Table C.1). However, the most frequently quantified pesticides (percentage of samples positively analysed for the given pesticide) were hydrogen cyanide (quantified in 95.7% of the samples), copper (quantified in 72.8% of the samples analysed for copper), carbon tetrachloride (56.6%), fosetyl‐Al (29.1%), hydrogen phosphide (22.4%), bromide ion (20.6%), chlorate (14.1%), dithiocarbamates (CS2) (13.9%), mercury (12%) and boscalid (9.5%). Except for carbon tetrachloride and hydrogen phosphide – which were sought in only 272 and 49 samples, respectively – all other pesticides with high quantification rates have been analysed in more than 3,000 samples (the highest number of analysis was reported for boscalid in 71,990 samples).
Table C.1.
Scope of the 2016 pesticide analyses in alphabetical order by pesticide name
| Pesticide | No of analyses | No of quantifications (levels > LOQ) | Quantification rate (%) | No of countries analysing | Pesticide covered by 2016 EUCP |
|---|---|---|---|---|---|
| 1,1‐Dichloro‐2,2‐bis(4‐ethylphenyl)ethane | 4,659 | 0 | 0.00 | 7 | |
| 1,2‐Dibromo‐3‐chloropropane | 2,748 | 0 | 0.00 | 6 | |
| 1,3‐Dichloropropene | 10 | 0 | 0.00 | 1 | |
| 1,4‐Dimethylnaphthalene | 171 | 0 | 0.00 | 2 | |
| 1‐Methylcyclopropene | 10 | 0 | 0.00 | 1 | |
| 1‐Naphthylacetamide | 17,810 | 24 | 0.13 | 12 | |
| 1‐Naphthylacetic acid | 4,150 | 10 | 0.24 | 4 | |
| 2,3,4,5‐TCNB (2,3,4,5‐Tetrachloronitrobenezene) | 1,502 | 0 | 0.00 | 1 | |
| 2,3,5‐Trimethacarb | 5,638 | 0 | 0.00 | 2 | |
| 2,4,5‐T (RD) | 4,718 | 0 | 0.00 | 10 | |
| 2,4‐D (RD) | 18,776 | 72 | 0.38 | 18 | |
| 2,4‐DB (RD) | 17,970 | 0 | 0.00 | 13 | |
| 2,4‐Dichlorobenzamide | 310 | 0 | 0.00 | 1 | |
| 2‐Naphthyloxyacetic acid | 5,986 | 0 | 0.00 | 5 | |
| 2‐Phenylphenol | 48,696 | 727 | 1.49 | 29 | Yes |
| 3,4,5‐Trimethacarb | 2,754 | 0 | 0.00 | 3 | |
| 4‐CPA | 12,312 | 6 | 0.05 | 9 | |
| 6‐Benzyladenine | 10,136 | 0 | 0.00 | 7 | |
| Abamectin (RD) | 46,046 | 94 | 0.20 | 26 | Yes |
| Acephate | 68,232 | 56 | 0.08 | 30 | Yes |
| Acequinocyl | 1,673 | 0 | 0.00 | 4 | |
| Acetamiprid (RD) | 67,541 | 3,578 | 5.30 | 30 | Yes |
| Acetochlor | 23,360 | 0 | 0.00 | 18 | |
| Acibenzolar‐S‐methyl (RD) | 19,052 | 0 | 0.00 | 10 | |
| Acifluorfen | 2,481 | 0 | 0.00 | 3 | |
| Aclonifen | 39,870 | 42 | 0.11 | 23 | |
| Acrinathrin | 66,941 | 118 | 0.18 | 30 | Yes |
| Alachlor | 32,608 | 0 | 0.00 | 19 | |
| Alanycarb | 5,219 | 0 | 0.00 | 4 | |
| Aldicarb (RD) | 60,654 | 0 | 0.00 | 28 | Yes |
| Aldimorph | 27 | 0 | 0.00 | 2 | |
| Allethrin | 9,994 | 2 | 0.02 | 12 | |
| Allidochlor | 2,308 | 0 | 0.00 | 2 | |
| Alloxydim | 260 | 0 | 0.00 | 2 | |
| Ametoctradin (RD) | 29,568 | 231 | 0.78 | 17 | |
| Ametryn | 24,474 | 1 | 0.00 | 15 | |
| Amidithion | 1,906 | 0 | 0.00 | 2 | |
| Amidosulfuron (RD) | 17,892 | 0 | 0.00 | 12 | |
| Aminocarb | 14,439 | 0 | 0.00 | 11 | |
| Aminopyralid | 4,656 | 0 | 0.00 | 4 | |
| Amisulbrom | 9,728 | 2 | 0.02 | 11 | |
| Amitraz (RD) | 31,954 | 29 | 0.09 | 25 | |
| Amitrole | 4,320 | 0 | 0.00 | 8 | |
| Ampropylfos | 10 | 0 | 0.00 | 1 | |
| Ancymidol | 8,181 | 0 | 0.00 | 4 | |
| Anilazine | 2,650 | 0 | 0.00 | 4 | |
| Anilofos | 5,280 | 0 | 0.00 | 5 | |
| Anthraquinone | 27,294 | 206 | 0.75 | 17 | |
| Aramite | 80 | 0 | 0.00 | 3 | |
| Aspon | 6,811 | 0 | 0.00 | 4 | |
| Asulam | 14,803 | 0 | 0.00 | 11 | |
| Atraton | 2,803 | 0 | 0.00 | 5 | |
| Atrazine | 48,677 | 6 | 0.01 | 25 | |
| Azaconazole | 22,161 | 0 | 0.00 | 16 | |
| Azadirachtin | 16,476 | 23 | 0.14 | 8 | |
| Azafenidin | 10 | 0 | 0.00 | 1 | |
| Azamethiphos | 11,957 | 0 | 0.00 | 13 | |
| Azimsulfuron | 7,951 | 0 | 0.00 | 9 | |
| Azinphos‐ethyl | 57,263 | 4 | 0.01 | 28 | |
| Azinphos‐methyl | 68,814 | 4 | 0.01 | 30 | Yes |
| Aziprotryne | 5,158 | 1 | 0.02 | 5 | |
| Azoxybenzene | 1,603 | 0 | 0.00 | 2 | |
| Azoxystrobin | 72,842 | 3,526 | 4.84 | 30 | Yes |
| BAC (RD) | 7,917 | 105 | 1.33 | 11 | |
| Barban | 2,270 | 0 | 0.00 | 3 | |
| Beflubutamid | 16,895 | 0 | 0.00 | 12 | |
| Benalaxyl | 46,138 | 14 | 0.03 | 23 | |
| Benazolin | 2,480 | 0 | 0.00 | 2 | |
| Benazolin‐Ethyl | 10 | 0 | 0.00 | 1 | |
| Bendiocarb | 28,105 | 0 | 0.00 | 18 | |
| Benfluralin | 30,297 | 5 | 0.02 | 14 | |
| Benfuresate | 2,509 | 0 | 0.00 | 3 | |
| Benodanil | 4,248 | 0 | 0.00 | 4 | |
| Bensulfuron | 30 | 0 | 0.00 | 2 | |
| Bensulfuron‐methyl | 9,066 | 0 | 0.00 | 9 | |
| Bensulide | 4,146 | 0 | 0.00 | 2 | |
| Bensultap | 2,480 | 0 | 0.00 | 2 | |
| Bentaluron | 10 | 0 | 0.00 | 1 | |
| Bentazone (RD) | 16,521 | 2 | 0.01 | 15 | |
| Benthiavalicarb | 8,064 | 1 | 0.01 | 8 | |
| Benzobicyclon | 1,844 | 0 | 0.00 | 2 | |
| Benzovindiflupyr | 187 | 0 | 0.00 | 1 | |
| Benzoximate | 5,176 | 0 | 0.00 | 8 | |
| Benzoylprop | 366 | 0 | 0.00 | 2 | |
| Benzoylprop‐Ethyl | 7,064 | 0 | 0.00 | 7 | |
| Benzthiazuron | 10 | 0 | 0.00 | 1 | |
| Bifenazate (RD) | 27,262 | 86 | 0.32 | 11 | |
| Bifenox | 24,663 | 0 | 0.00 | 15 | |
| Bifenthrin | 72,819 | 786 | 1.08 | 30 | Yes |
| Bioallethrin | 2,928 | 1 | 0.03 | 6 | |
| Bioresmethrin | 3,453 | 0 | 0.00 | 6 | |
| Biphenyl | 53,316 | 172 | 0.32 | 28 | Yes |
| Bis(tributyltin) oxide | 61 | 0 | 0.00 | 1 | |
| Bispyribac | 6,063 | 0 | 0.00 | 7 | |
| Bitertanol | 66,453 | 5 | 0.01 | 30 | Yes |
| Bixafen (RD) | 35,878 | 6 | 0.02 | 20 | |
| Blasticidin‐S | 10 | 0 | 0.00 | 1 | |
| Boscalid (RD) | 71,990 | 6,815 | 9.47 | 30 | Yes |
| Brodifacoum | 12 | 0 | 0.00 | 2 | |
| Bromacil | 26,466 | 1 | 0.00 | 15 | |
| Bromadiolone | 234 | 0 | 0.00 | 2 | |
| Bromethalin | 10 | 0 | 0.00 | 1 | |
| Bromfenvinfos | 2,709 | 0 | 0.00 | 6 | |
| Bromfenvinfos‐methyl | 102 | 0 | 0.00 | 3 | |
| Bromide ion | 4,514 | 928 | 20.56 | 23 | Yes |
| Bromobutide | 1,179 | 0 | 0.00 | 2 | |
| Bromocyclen | 6,264 | 1 | 0.02 | 5 | |
| Bromofenoxim | 11 | 0 | 0.00 | 2 | |
| Bromophos | 37,625 | 0 | 0.00 | 24 | |
| Bromophos‐ethyl | 50,501 | 1 | 0.00 | 25 | |
| Bromopropylate | 71,239 | 11 | 0.02 | 30 | Yes |
| Bromoxynil | 28,017 | 2 | 0.01 | 15 | |
| Brompyrazon | 10 | 0 | 0.00 | 1 | |
| Bromuconazole | 58,392 | 1 | 0.00 | 30 | |
| Bronopol | 10 | 0 | 0.00 | 1 | |
| Bufencarb | 10 | 0 | 0.00 | 1 | |
| Bupirimate | 71,564 | 260 | 0.36 | 30 | Yes |
| Buprofezin | 71,335 | 732 | 1.03 | 30 | Yes |
| Butachlor | 7,241 | 0 | 0.00 | 10 | |
| Butafenacil | 10,116 | 0 | 0.00 | 9 | |
| Butamifos | 5,245 | 0 | 0.00 | 3 | |
| Butocarboxim | 14,998 | 0 | 0.00 | 12 | |
| Butoxycarboxim | 12,719 | 0 | 0.00 | 11 | |
| Butralin | 18,894 | 0 | 0.00 | 13 | |
| Butroxydim | 10 | 0 | 0.00 | 1 | |
| Buturon | 4,358 | 0 | 0.00 | 8 | |
| Butylate | 10,971 | 0 | 0.00 | 10 | |
| Cadusafos | 56,458 | 0 | 0.00 | 28 | |
| Cafenstrole | 3,432 | 0 | 0.00 | 3 | |
| Camphechlor (RD) | 187 | 0 | 0.00 | 2 | |
| Captafol | 19,505 | 0 | 0.00 | 16 | |
| Captan (RD) | 25,043 | 287 | 1.15 | 22 | Yes |
| Carbanolate | 10 | 0 | 0.00 | 1 | |
| Carbaryl | 70,997 | 20 | 0.03 | 30 | Yes |
| Carbendazim (RD) | 60,877 | 1,798 | 2.95 | 27 | Yes |
| Carbetamide | 24,580 | 1 | 0.00 | 16 | |
| Carbofuran (RD) | 57,798 | 67 | 0.12 | 26 | Yes |
| Carbon tetrachloride | 272 | 154 | 56.62 | 2 | |
| Carbophenothion | 26,809 | 0 | 0.00 | 16 | |
| Carboxin | 48,240 | 4 | 0.01 | 28 | |
| Carfentrazone‐ethyl | 16,866 | 0 | 0.00 | 11 | |
| Carpropamid | 3,072 | 0 | 0.00 | 5 | |
| Cartap | 10 | 0 | 0.00 | 1 | |
| Carvone | 10 | 0 | 0.00 | 1 | |
| Chinomethionat | 32,823 | 0 | 0.00 | 20 | |
| Chlomethoxyfen | 10 | 0 | 0.00 | 1 | |
| Chloramben | 10 | 0 | 0.00 | 1 | |
| Chloraniformethan | 10 | 0 | 0.00 | 1 | |
| Chloranil | 10 | 0 | 0.00 | 1 | |
| Chlorantraniliprole | 57,561 | 1,644 | 2.86 | 27 | Yes |
| Chlorate | 5,273 | 744 | 14.11 | 7 | |
| Chlorbenside | 7,948 | 0 | 0.00 | 14 | |
| Chlorbromuron | 19,485 | 0 | 0.00 | 15 | |
| Chlorbufam | 19,023 | 0 | 0.00 | 16 | |
| Chlordane (RD) | 39,523 | 93 | 0.24 | 26 | Yes |
| Chlordecone | 1,747 | 30 | 1.72 | 5 | |
| Chlordimeform | 6,219 | 0 | 0.00 | 9 | |
| Chlorethoxyfos | 10 | 0 | 0.00 | 1 | |
| Chlorfenapyr | 65,852 | 292 | 0.44 | 29 | Yes |
| Chlorfenethol | 1,603 | 0 | 0.00 | 2 | |
| Chlorfenprop | 10 | 0 | 0.00 | 1 | |
| Chlorfenprop‐Methyl | 8,224 | 0 | 0.00 | 6 | |
| Chlorfenson | 26,604 | 1 | 0.00 | 21 | |
| Chlorfenvinphos | 64,850 | 3 | 0.00 | 30 | |
| Chlorfluazuron | 19,749 | 5 | 0.03 | 14 | |
| Chlorflurenol | 395 | 0 | 0.00 | 2 | |
| Chlorflurenol‐Methyl | 395 | 0 | 0.00 | 2 | |
| Chloridazon | 26,208 | 3 | 0.01 | 17 | |
| Chlormephos | 21,019 | 0 | 0.00 | 16 | |
| Chlormequat | 10,267 | 787 | 7.67 | 27 | Yes |
| Chlornitrofen | 1,846 | 0 | 0.00 | 2 | |
| Chlorobenzilate | 42,817 | 4 | 0.01 | 27 | |
| Chloroneb | 7,418 | 0 | 0.00 | 9 | |
| Chloropicrin | 10 | 0 | 0.00 | 1 | |
| Chloropropylate | 11,284 | 0 | 0.00 | 9 | |
| Chlorothalonil (RD) | 55,337 | 396 | 0.72 | 28 | Yes |
| Chlorotoluron | 28,856 | 1 | 0.00 | 18 | |
| Chloroxuron | 19,997 | 0 | 0.00 | 15 | |
| Chlorpropham (RD) | 64,606 | 630 | 0.98 | 29 | Yes |
| Chlorpyrifos | 76,228 | 3,371 | 4.42 | 30 | Yes |
| Chlorpyrifos‐methyl | 76,022 | 839 | 1.10 | 30 | Yes |
| Chlorsulfuron | 8,925 | 0 | 0.00 | 13 | |
| Chlorthal | 10 | 0 | 0.00 | 1 | |
| Chlorthal‐dimethyl | 38,604 | 3 | 0.01 | 20 | |
| Chlorthiamid | 4,146 | 0 | 0.00 | 7 | |
| Chlorthion | 1,404 | 0 | 0.00 | 5 | |
| Chlorthiophos | 14,352 | 0 | 0.00 | 11 | |
| Chlozolinate | 40,032 | 0 | 0.00 | 23 | |
| Chromafenozide | 13,167 | 0 | 0.00 | 5 | |
| Cinidon‐ethyl | 7,144 | 0 | 0.00 | 8 | |
| Cinmethylin | 10 | 0 | 0.00 | 1 | |
| Cinosulfuron | 10,111 | 0 | 0.00 | 7 | |
| Clethodim (RD) | 18,970 | 2 | 0.01 | 13 | |
| Climbazole | 1,722 | 0 | 0.00 | 2 | |
| Clodinafop | 6,567 | 0 | 0.00 | 7 | |
| Cloethocarb | 10 | 0 | 0.00 | 1 | |
| Clofencet | 10 | 0 | 0.00 | 1 | |
| Clofentezine (RD) | 58,367 | 92 | 0.16 | 28 | Yes |
| Clomazone | 45,584 | 17 | 0.04 | 25 | |
| Clopyralid | 21,682 | 9 | 0.04 | 14 | |
| Cloransulam‐Methyl | 10 | 0 | 0.00 | 1 | |
| Clothianidin | 40,594 | 223 | 0.55 | 27 | Yes |
| Copper | 3,103 | 2,258 | 72.77 | 3 | |
| Coumachlor | 4,075 | 0 | 0.00 | 2 | |
| Coumaphos | 35,164 | 3 | 0.01 | 24 | |
| Coumatetralyl | 4,853 | 0 | 0.00 | 2 | |
| Crimidine | 3,184 | 0 | 0.00 | 6 | |
| Crotoxyphos | 1,605 | 0 | 0.00 | 2 | |
| Crufomate | 1,672 | 0 | 0.00 | 3 | |
| Cyanamide | 187 | 0 | 0.00 | 1 | |
| Cyanazine | 29,703 | 0 | 0.00 | 18 | |
| Cyanofenphos | 13,044 | 0 | 0.00 | 16 | |
| Cyanophos | 12,880 | 0 | 0.00 | 11 | |
| Cyantraniliprole | 5,291 | 13 | 0.25 | 6 | |
| Cyazofamid | 47,067 | 118 | 0.25 | 24 | |
| Cybutryne | 366 | 0 | 0.00 | 2 | |
| Cyclanilide | 5,726 | 0 | 0.00 | 5 | |
| Cycloate | 12,031 | 0 | 0.00 | 13 | |
| Cycloprothrin | 10 | 0 | 0.00 | 1 | |
| Cyclosulfamuron | 10 | 0 | 0.00 | 1 | |
| Cycloxydim (RD) | 15,798 | 0 | 0.00 | 15 | |
| Cycluron | 7,916 | 0 | 0.00 | 6 | |
| Cyenopyrafen | 2,657 | 0 | 0.00 | 2 | |
| Cyflufenamid | 33,407 | 105 | 0.31 | 18 | |
| Cyflumetofen | 9,768 | 1 | 0.01 | 7 | |
| Cyfluthrin | 56,933 | 127 | 0.22 | 29 | Yes |
| Cyhalofop‐butyl (RD) | 6,156 | 0 | 0.00 | 8 | |
| Cyhalothrin | 1,562 | 9 | 0.58 | 7 | |
| Cyhalothrin, gamma‐ | 644 | 0 | 0.00 | 4 | |
| Cyhexatin (RD) | 1,755 | 0 | 0.00 | 4 | |
| Cymiazole | 6,297 | 0 | 0.00 | 13 | |
| Cymoxanil | 52,955 | 22 | 0.04 | 29 | Yes |
| Cypermethrin | 69,375 | 1,532 | 2.21 | 29 | Yes |
| Cyphenothrin | 3,874 | 1 | 0.03 | 5 | |
| Cyprazin | 4,146 | 0 | 0.00 | 2 | |
| Cyproconazole | 71,708 | 125 | 0.17 | 30 | Yes |
| Cyprodinil (RD) | 70,659 | 3,721 | 5.27 | 30 | Yes |
| Cyprofuram | 1,978 | 0 | 0.00 | 3 | |
| Cyromazine | 32,562 | 53 | 0.16 | 21 | |
| Cythioate | 1,341 | 0 | 0.00 | 2 | |
| DDAC | 8,012 | 69 | 0.86 | 10 | |
| DDT (RD) | 55,502 | 362 | 0.65 | 27 | Yes |
| DNOC | 3,551 | 0 | 0.00 | 6 | |
| Daimuron | 2,480 | 0 | 0.00 | 2 | |
| Dalapon | 2,480 | 0 | 0.00 | 2 | |
| Daminozide (RD) | 1,903 | 0 | 0.00 | 5 | |
| Dazomet (RD) | 409 | 0 | 0.00 | 5 | |
| Deltamethrin | 74,334 | 892 | 1.20 | 30 | Yes |
| Demephion‐O | 10 | 0 | 0.00 | 1 | |
| Demephion‐S | 10 | 0 | 0.00 | 1 | |
| Demeton | 61 | 0 | 0.00 | 2 | |
| Demeton‐S | 3,294 | 0 | 0.00 | 6 | |
| Demeton‐S‐Methyl | 34,340 | 0 | 0.00 | 26 | |
| Desmedipham | 24,174 | 0 | 0.00 | 19 | |
| Desmetryn | 16,713 | 0 | 0.00 | 14 | |
| Di‐allate | 4,913 | 0 | 0.00 | 8 | |
| Diafenthiuron | 28,293 | 15 | 0.05 | 19 | |
| Dialifos | 16,791 | 0 | 0.00 | 12 | |
| Diazinon | 75,523 | 91 | 0.12 | 30 | Yes |
| Dicamba | 19,523 | 2 | 0.01 | 15 | |
| Dichlobenil | 32,930 | 1 | 0.00 | 18 | |
| Dichlofenthion | 20,375 | 0 | 0.00 | 15 | |
| Dichlofluanid | 56,345 | 0 | 0.00 | 28 | |
| Dichlone | 14 | 0 | 0.00 | 2 | |
| Dichlorophen | 6,213 | 0 | 0.00 | 4 | |
| Dichlorprop (RD) | 15,996 | 3 | 0.02 | 15 | |
| Dichlorvos | 71,415 | 10 | 0.01 | 30 | Yes |
| Dichlozoline | 10 | 0 | 0.00 | 1 | |
| Diclobutrazol | 24,454 | 0 | 0.00 | 13 | |
| Diclofop (RD) | 13,611 | 0 | 0.00 | 9 | |
| Dicloran | 67,465 | 20 | 0.03 | 30 | Yes |
| Diclosulam | 29 | 0 | 0.00 | 2 | |
| Dicofol (RD) | 55,229 | 12 | 0.02 | 29 | Yes |
| Dicrotophos | 53,308 | 0 | 0.00 | 30 | |
| Dicyclanil | 52 | 0 | 0.00 | 2 | |
| Dieldrin (RD) | 62,912 | 95 | 0.15 | 29 | Yes |
| Dienochlor | 10 | 0 | 0.00 | 1 | |
| Diethatyl | 10 | 0 | 0.00 | 1 | |
| Diethofencarb | 65,411 | 7 | 0.01 | 30 | Yes |
| Difenacoum | 22 | 0 | 0.00 | 2 | |
| Difenoconazole | 71,558 | 2,266 | 3.17 | 30 | Yes |
| Difenoxuron | 2,934 | 0 | 0.00 | 6 | |
| Difenzoquat | 2,791 | 0 | 0.00 | 4 | |
| Diflubenzuron (RD) | 57,279 | 127 | 0.22 | 29 | Yes |
| Diflufenican | 45,091 | 5 | 0.01 | 21 | |
| Diflufenzopyr | 5,067 | 0 | 0.00 | 4 | |
| Dikegulac | 2,630 | 3 | 0.11 | 5 | |
| Dimefox | 4,246 | 0 | 0.00 | 9 | |
| Dimefuron | 13,215 | 0 | 0.00 | 7 | |
| Dimepiperate | 2,805 | 0 | 0.00 | 3 | |
| Dimethachlor | 16,602 | 0 | 0.00 | 13 | |
| Dimethametryn | 10 | 0 | 0.00 | 1 | |
| Dimethenamid–p | 14,894 | 0 | 0.00 | 13 | |
| Dimethipin | 987 | 0 | 0.00 | 2 | |
| Dimethirimol | 1,361 | 0 | 0.00 | 3 | |
| Dimethoate (RD) | 69,371 | 397 | 0.57 | 30 | Yes |
| Dimethomorph | 65,388 | 1,469 | 2.25 | 30 | Yes |
| Dimethylvinphos | 4,100 | 0 | 0.00 | 5 | |
| Dimetilan | 1,827 | 0 | 0.00 | 3 | |
| Dimexano | 10 | 0 | 0.00 | 1 | |
| Dimoxystrobin (RD) | 34,498 | 17 | 0.05 | 24 | |
| Diniconazole | 63,889 | 5 | 0.01 | 29 | Yes |
| Dinitramine | 4,625 | 0 | 0.00 | 8 | |
| Dinobuton | 2,209 | 0 | 0.00 | 4 | |
| Dinocap (RD) | 9,663 | 1 | 0.01 | 12 | |
| Dinoseb (RD) | 4,252 | 0 | 0.00 | 3 | |
| Dinotefuran | 33,822 | 25 | 0.07 | 20 | |
| Dinoterb (RD) | 3,457 | 0 | 0.00 | 3 | |
| Diofenolan | 10 | 0 | 0.00 | 1 | |
| Dioxabenzofos | 1,676 | 0 | 0.00 | 6 | |
| Dioxacarb | 12,727 | 0 | 0.00 | 9 | |
| Dioxathion | 11,100 | 0 | 0.00 | 12 | |
| Diphacinone | 10 | 0 | 0.00 | 1 | |
| Diphenamid | 14,947 | 0 | 0.00 | 13 | |
| Diphenylamine | 67,188 | 57 | 0.08 | 30 | Yes |
| Dipropetryn | 3,383 | 0 | 0.00 | 5 | |
| Diquat | 552 | 7 | 1.27 | 8 | |
| Disulfiram | 10 | 0 | 0.00 | 1 | |
| Disulfoton (RD) | 38,036 | 0 | 0.00 | 24 | |
| Ditalimfos | 21,584 | 0 | 0.00 | 18 | |
| Dithianon | 14,853 | 371 | 2.50 | 19 | Yes |
| Dithiocarbamates (RD) | 12,750 | 1,775 | 13.92 | 27 | Yes |
| Dithiopyr | 5,335 | 0 | 0.00 | 4 | |
| Diuron | 41,538 | 9 | 0.02 | 22 | |
| Dodemorph | 13,003 | 0 | 0.00 | 13 | |
| Dodine | 46,931 | 419 | 0.89 | 25 | Yes |
| Drazoxolon | 10 | 0 | 0.00 | 1 | |
| EPN | 65,826 | 0 | 0.00 | 30 | Yes |
| EPTC | 12,887 | 0 | 0.00 | 14 | |
| Edifenphos | 8,324 | 0 | 0.00 | 9 | |
| Emamectin | 18,254 | 10 | 0.05 | 13 | |
| Empenthrin | 661 | 0 | 0.00 | 4 | |
| Endosulfan (RD) | 72,176 | 54 | 0.07 | 29 | Yes |
| Endothal | 10 | 0 | 0.00 | 1 | |
| Endrin | 49,997 | 2 | 0.00 | 28 | |
| Epoxiconazole | 71,221 | 37 | 0.05 | 30 | Yes |
| Esprocarb | 5,564 | 0 | 0.00 | 5 | |
| Etaconazole | 12,627 | 0 | 0.00 | 10 | |
| Ethalfluralin | 7,648 | 0 | 0.00 | 9 | |
| Ethametsulfuron‐methyl | 3,712 | 0 | 0.00 | 7 | |
| Ethephon | 8,734 | 318 | 3.64 | 26 | Yes |
| Ethidimuron | 3,495 | 0 | 0.00 | 7 | |
| Ethiofencarb | 39,751 | 0 | 0.00 | 20 | |
| Ethion | 72,120 | 38 | 0.05 | 30 | Yes |
| Ethiprole | 8,307 | 0 | 0.00 | 9 | |
| Ethirimol | 56, 086 | 126 | 0.22 | 28 | Yes |
| Ethoate‐Methyl | 10 | 0 | 0.00 | 1 | |
| Ethofumesate (RD) | 24,206 | 8 | 0.03 | 17 | |
| Ethoprophos | 66,856 | 9 | 0.01 | 30 | |
| Ethoxyquin | 24,336 | 2 | 0.01 | 18 | |
| Ethoxysulfuron | 5,865 | 0 | 0.00 | 7 | |
| Ethylene oxide (RD) | 16 | 15 | 93.75 | 1 | |
| Etobenzanid | 29 | 0 | 0.00 | 2 | |
| Etofenprox | 68,701 | 804 | 1.17 | 30 | Yes |
| Etoxazole | 39,492 | 123 | 0.31 | 20 | |
| Etridiazole | 29,567 | 3 | 0.01 | 17 | |
| Etrimfos | 37,534 | 0 | 0.00 | 25 | |
| Famoxadone | 63,491 | 156 | 0.25 | 30 | Yes |
| Famphur | 7,870 | 0 | 0.00 | 7 | |
| Fenamidone | 66,638 | 64 | 0.10 | 30 | Yes |
| Fenaminosulf | 10 | 0 | 0.00 | 1 | |
| Fenamiphos (RD) | 58,301 | 20 | 0.03 | 28 | Yes |
| Fenarimol | 71,981 | 5 | 0.01 | 30 | Yes |
| Fenazaflor | 713 | 0 | 0.00 | 2 | |
| Fenazaquin | 66,478 | 57 | 0.09 | 30 | Yes |
| Fenbuconazole | 67,233 | 355 | 0.53 | 30 | Yes |
| Fenbutatin oxide | 18,498 | 59 | 0.32 | 23 | Yes |
| Fenchlorphos (RD) | 21,565 | 1 | 0.00 | 20 | |
| Fenfluthrin | 1,499 | 0 | 0.00 | 3 | |
| Fenfuram | 6,162 | 0 | 0.00 | 3 | |
| Fenhexamid | 70,955 | 1,873 | 2.64 | 30 | Yes |
| Fenitrothion | 71,493 | 10 | 0.01 | 30 | Yes |
| Fenobucarb | 16,617 | 11 | 0.07 | 14 | |
| Fenothiocarb | 11,065 | 0 | 0.00 | 9 | |
| Fenoxanil | 29 | 0 | 0.00 | 2 | |
| Fenoxaprop | 14,637 | 0 | 0.00 | 5 | |
| Fenoxaprop‐P | 5,685 | 0 | 0.00 | 9 | |
| Fenoxaprop‐P‐Ethyl | 7,351 | 0 | 0.00 | 11 | |
| Fenoxaprop‐ethyl | 1,734 | 0 | 0.00 | 4 | |
| Fenoxycarb | 69,338 | 100 | 0.14 | 29 | Yes |
| Fenpiclonil | 17,655 | 0 | 0.00 | 11 | |
| Fenpropathrin | 70,893 | 105 | 0.15 | 29 | Yes |
| Fenpropidin (RD) | 44,886 | 13 | 0.03 | 28 | Yes |
| Fenpropimorph (RD) | 68,193 | 95 | 0.14 | 30 | Yes |
| Fenpyrazamine | 15,308 | 68 | 0.44 | 13 | |
| Fenpyroximate | 63,598 | 230 | 0.36 | 29 | Yes |
| Fenridazon | 10 | 0 | 0.00 | 1 | |
| Fenson | 23,744 | 0 | 0.00 | 14 | |
| Fensulfothion | 30,077 | 0 | 0.00 | 24 | |
| Fenthion (RD) | 60,060 | 1 | 0.00 | 27 | Yes |
| Fentin | 1,374 | 0 | 0.00 | 10 | |
| Fentrazamide | 29 | 0 | 0.00 | 2 | |
| Fenuron | 11,011 | 0 | 0.00 | 12 | |
| Fenvalerate (RD) | 58,472 | 103 | 0.18 | 29 | Yes |
| Ferbam | 10 | 0 | 0.00 | 1 | |
| Fipronil (RD) | 51,430 | 57 | 0.11 | 28 | Yes |
| Flamprop | 1,201 | 0 | 0.00 | 3 | |
| Flamprop‐M‐Isopropyl | 410 | 0 | 0.00 | 4 | |
| Flamprop‐M‐Methyl | 29 | 0 | 0.00 | 2 | |
| Flamprop‐isopropyl | 2,807 | 0 | 0.00 | 5 | |
| Flamprop‐methyl | 5,032 | 0 | 0.00 | 6 | |
| Flazasulfuron | 15,275 | 0 | 0.00 | 13 | |
| Flocoumafen | 4,853 | 0 | 0.00 | 2 | |
| Flonicamid (RD) | 39,556 | 368 | 0.93 | 22 | |
| Florasulam | 17,661 | 0 | 0.00 | 18 | |
| Fluacrypyrim | 5,152 | 1 | 0.02 | 4 | |
| Fluazifop‐P‐butyl (RD) | 30,964 | 36 | 0.12 | 21 | |
| Fluazinam | 33,577 | 12 | 0.04 | 21 | |
| Fluazolate | 10 | 0 | 0.00 | 1 | |
| Fluazuron | 5,233 | 0 | 0.00 | 4 | |
| Flubendiamide | 31,394 | 47 | 0.15 | 25 | |
| Flubenzimine | 1,583 | 0 | 0.00 | 3 | |
| Fluchloralin | 6,527 | 0 | 0.00 | 6 | |
| Flucycloxuron | 6,626 | 0 | 0.00 | 5 | |
| Flucythrinate | 26,019 | 2 | 0.01 | 20 | |
| Fludioxonil (RD) | 67,202 | 4,255 | 6.33 | 30 | Yes |
| Flufenacet | 27,247 | 1 | 0.00 | 20 | |
| Flufenoxuron | 63,199 | 13 | 0.02 | 30 | Yes |
| Flufenprox | 10 | 0 | 0.00 | 1 | |
| Flufenzin | 857 | 0 | 0.00 | 5 | |
| Flumethrin | 1,685 | 0 | 0.00 | 5 | |
| Flumetralin | 14,022 | 0 | 0.00 | 11 | |
| Flumetsulam | 1,178 | 0 | 0.00 | 2 | |
| Flumiclorac | 10 | 0 | 0.00 | 1 | |
| Flumiclorac‐Pentyl | 29 | 0 | 0.00 | 2 | |
| Flumioxazine | 15,863 | 0 | 0.00 | 11 | |
| Fluometuron | 11,918 | 1 | 0.01 | 12 | |
| Fluopicolide | 59,504 | 417 | 0.70 | 27 | |
| Fluopyram (RD) | 48,917 | 2,181 | 4.46 | 27 | Yes |
| Fluoride ion | 10 | 0 | 0.00 | 1 | |
| Fluorodifen | 2,306 | 0 | 0.00 | 2 | |
| Fluoroglycofene | 29 | 0 | 0.00 | 2 | |
| Fluoroimide | 10 | 0 | 0.00 | 1 | |
| Fluotrimazole | 9,782 | 0 | 0.00 | 6 | |
| Fluoxastrobin | 31,604 | 3 | 0.01 | 16 | |
| Flupoxam | 10 | 0 | 0.00 | 1 | |
| Flupyradifurone | 2,143 | 0 | 0.00 | 3 | |
| Flupyrsulfuron | 10 | 0 | 0.00 | 1 | |
| Flupyrsulfuron‐methyl | 6,739 | 0 | 0.00 | 7 | |
| Fluquinconazole | 64,453 | 9 | 0.01 | 30 | Yes |
| Flurenol | 10 | 0 | 0.00 | 1 | |
| Flurenol‐butyl | 10 | 0 | 0.00 | 1 | |
| Fluridone | 3,168 | 0 | 0.00 | 5 | |
| Flurochloridone | 21,298 | 7 | 0.03 | 15 | |
| Fluroxypyr (RD) | 30,170 | 2 | 0.01 | 20 | |
| Flurprimidole | 8,232 | 1 | 0.01 | 7 | |
| Flurtamone | 23,416 | 0 | 0.00 | 12 | |
| Flusilazole (RD) | 70,529 | 23 | 0.03 | 30 | Yes |
| Flusulfamide | 3,382 | 0 | 0.00 | 3 | |
| Fluthiacet‐Methyl | 2,822 | 0 | 0.00 | 5 | |
| Flutolanil (RD) | 55,971 | 22 | 0.04 | 27 | |
| Flutriafol | 67,771 | 266 | 0.39 | 30 | Yes |
| Fluvalinate | 4,668 | 4 | 0.09 | 10 | |
| Fluxapyroxad | 35,670 | 12 | 0.03 | 21 | |
| Folpet (RD) | 30,801 | 981 | 3.18 | 23 | Yes |
| Fomesafen | 9,903 | 1 | 0.01 | 9 | |
| Fonofos | 33,903 | 0 | 0.00 | 22 | |
| Foramsulfuron | 8,931 | 0 | 0.00 | 12 | |
| Forchlorfenuron | 23,809 | 21 | 0.09 | 14 | |
| Formetanate | 48,530 | 43 | 0.09 | 27 | Yes |
| Formothion | 39,443 | 0 | 0.00 | 27 | |
| Fosamine | 10 | 0 | 0.00 | 1 | |
| Fosetyl‐Al (RD) | 4,895 | 1,422 | 29.05 | 4 | |
| Fosthiazate | 58,271 | 53 | 0.09 | 29 | Yes |
| Fosthietan | 10 | 0 | 0.00 | 1 | |
| Fuberidazole | 21,971 | 0 | 0.00 | 18 | |
| Furalaxyl | 22,226 | 0 | 0.00 | 13 | |
| Furconazole | 10 | 0 | 0.00 | 1 | |
| Furfural | 10 | 0 | 0.00 | 1 | |
| Furmecyclox | 3,854 | 0 | 0.00 | 5 | |
| Genite | 1,989 | 0 | 0.00 | 3 | |
| Gibberellic acid | 2,731 | 33 | 1.21 | 4 | |
| Glufosinate (RD) | 3,665 | 31 | 0.85 | 8 | |
| Glyphosate | 6,693 | 207 | 3.09 | 26 | Yes |
| Griseofulvin | 44 | 0 | 0.00 | 2 | |
| Halfenprox | 5,557 | 0 | 0.00 | 6 | |
| Halofenozide | 11,805 | 0 | 0.00 | 6 | |
| Halosulfuron | 400 | 0 | 0.00 | 2 | |
| Halosulfuron‐methyl | 7,256 | 0 | 0.00 | 5 | |
| Haloxyfop (RD) | 24,019 | 27 | 0.11 | 22 | |
| Heptachlor (RD) | 32,204 | 7 | 0.02 | 26 | Yes |
| Heptenophos | 39,860 | 0 | 0.00 | 26 | |
| Hexachlorobenzene | 52,426 | 267 | 0.51 | 29 | Yes |
| Hexachlorobutadiene | 185 | 0 | 0.00 | 3 | |
| Hexachlorocyclohexane (RD) | 40,775 | 1 | 0.00 | 23 | |
| Hexachlorocyclohexane (alpha) | 32,725 | 32 | 0.10 | 29 | Yes |
| Hexachlorocyclohexane (beta) | 32,213 | 57 | 0.18 | 29 | Yes |
| Hexaconazole | 70,314 | 71 | 0.10 | 30 | Yes |
| Hexaflumuron | 33,620 | 1 | 0.00 | 20 | |
| Hexazinone | 23,095 | 0 | 0.00 | 16 | |
| Hexythiazox | 64,908 | 483 | 0.74 | 30 | Yes |
| Hydramethylnon | 30 | 0 | 0.00 | 3 | |
| Hydrogen cyanide | 23 | 22 | 95.65 | 1 | |
| Hydrogen phosphide | 49 | 11 | 22.45 | 2 | |
| Hymexazol | 4,620 | 0 | 0.00 | 5 | |
| Imazalil | 70,661 | 4,061 | 5.75 | 30 | Yes |
| Imazamethabenz | 4,712 | 0 | 0.00 | 6 | |
| Imazamox | 14,421 | 6 | 0.04 | 11 | |
| Imazapic | 10 | 0 | 0.00 | 1 | |
| Imazapyr | 15,224 | 0 | 0.00 | 12 | |
| Imazaquin | 18,361 | 0 | 0.00 | 9 | |
| Imazethapyr | 10,511 | 1 | 0.01 | 10 | |
| Imazosulfuron | 7,897 | 0 | 0.00 | 7 | |
| Imibenconazole | 7,969 | 0 | 0.00 | 7 | |
| Imidacloprid | 69,361 | 2,861 | 4.12 | 30 | Yes |
| Iminoctadine | 10 | 0 | 0.00 | 1 | |
| Inabenfide | 2,733 | 0 | 0.00 | 4 | |
| Indoxacarb | 71,532 | 787 | 1.10 | 30 | Yes |
| Iodofenphos | 15,544 | 0 | 0.00 | 13 | |
| Iodosulfuron‐methyl | 13,328 | 0 | 0.00 | 12 | |
| Ioxynil (RD) | 11,242 | 0 | 0.00 | 18 | |
| Ipconazole | 15,290 | 0 | 0.00 | 12 | |
| Iprobenfos | 14,389 | 0 | 0.00 | 12 | |
| Iprodione (RD) | 66,132 | 1,759 | 2.66 | 30 | Yes |
| Iprovalicarb | 70,154 | 228 | 0.32 | 30 | Yes |
| Isazofos | 12,025 | 0 | 0.00 | 11 | |
| Isobenzan | 2,984 | 0 | 0.00 | 4 | |
| Isocarbamid | 1,603 | 0 | 0.00 | 2 | |
| Isocarbophos | 54,450 | 6 | 0.01 | 29 | Yes |
| Isodrin | 9,652 | 0 | 0.00 | 12 | |
| Isofenphos | 40,087 | 0 | 0.00 | 24 | |
| Isofenphos‐methyl | 58,320 | 1 | 0.00 | 28 | |
| Isolane | 10 | 0 | 0.00 | 1 | |
| Isomethiozin | 3,674 | 0 | 0.00 | 4 | |
| Isonoruron | 1,755 | 0 | 0.00 | 5 | |
| Isoprocarb | 49,642 | 3 | 0.01 | 28 | |
| Isopropalin | 8,234 | 0 | 0.00 | 9 | |
| Isoprothiolane | 55,964 | 66 | 0.12 | 29 | |
| Isoproturon | 45,068 | 3 | 0.01 | 27 | |
| Isopyrazam | 11,079 | 6 | 0.05 | 10 | |
| Isouron | 1,115 | 0 | 0.00 | 1 | |
| Isoxaben | 23,005 | 2 | 0.01 | 14 | |
| Isoxaflutole (RD) | 13,458 | 0 | 0.00 | 13 | |
| Isoxathion | 10,881 | 0 | 0.00 | 8 | |
| Ivermectin | 621 | 0 | 0.00 | 3 | |
| Kadethrin | 10 | 0 | 0.00 | 1 | |
| Karbutilate | 1,171 | 0 | 0.00 | 2 | |
| Karetazan | 10 | 0 | 0.00 | 1 | |
| Kasugamycin | 67 | 0 | 0.00 | 2 | |
| Kelevan | 10 | 0 | 0.00 | 1 | |
| Kresoxim‐methyl (RD) | 70,184 | 247 | 0.35 | 30 | Yes |
| Lactofen | 5,640 | 0 | 0.00 | 5 | |
| Lambda‐cyhalothrin (RD) | 56,016 | 1,317 | 2.35 | 30 | Yes |
| Lenacil | 30,841 | 13 | 0.04 | 17 | |
| Leptophos | 8,690 | 0 | 0.00 | 11 | |
| Lindane | 63,176 | 19 | 0.03 | 30 | Yes |
| Linuron | 66,681 | 423 | 0.63 | 30 | Yes |
| Lufenuron | 59,390 | 61 | 0.10 | 29 | Yes |
| MCPA (RD) | 27,645 | 24 | 0.09 | 16 | |
| Malathion (RD) | 67,509 | 105 | 0.16 | 29 | Yes |
| Maleic hydrazide (RD) | 4,625 | 77 | 1.66 | 8 | |
| Mandipropamid | 61,407 | 448 | 0.73 | 30 | Yes |
| Mecarbam | 50,855 | 1 | 0.00 | 28 | |
| Mecoprop | 15,596 | 0 | 0.00 | 15 | |
| Medinoterb | 10 | 0 | 0.00 | 1 | |
| Mefenacet | 7,755 | 0 | 0.00 | 8 | |
| Mefluidide | 4,376 | 0 | 0.00 | 3 | |
| Mepanipyrim | 66,824 | 187 | 0.28 | 29 | Yes |
| Mephosfolan | 10,343 | 0 | 0.00 | 9 | |
| Mepiquat | 9,841 | 229 | 2.33 | 26 | Yes |
| Mepronil | 34,943 | 0 | 0.00 | 21 | |
| Meptyldinocap (RD) | 10,054 | 12 | 0.12 | 9 | |
| Mercury | 1,635 | 197 | 12.05 | 1 | |
| Merphos | 10 | 0 | 0.00 | 1 | |
| Mesosulfuron | 11,487 | 0 | 0.00 | 11 | |
| Mesotrione (RD) | 6,895 | 0 | 0.00 | 10 | |
| Metaflumizone | 45,244 | 23 | 0.05 | 25 | |
| Metalaxyl | 55,359 | 1,129 | 2.04 | 28 | Yes |
| Metaldehyde | 9,402 | 12 | 0.13 | 5 | |
| Metamitron | 42,526 | 14 | 0.03 | 21 | |
| Metazachlor (RD) | 13,113 | 0 | 0.00 | 15 | |
| Metconazole | 58,372 | 8 | 0.01 | 29 | |
| Methabenzthiazuron | 26,675 | 2 | 0.01 | 14 | |
| Methacrifos | 41,333 | 3 | 0.01 | 27 | |
| Methamidophos | 67,216 | 37 | 0.06 | 30 | Yes |
| Methazole | 225 | 0 | 0.00 | 2 | |
| Methfuroxam | 10 | 0 | 0.00 | 1 | |
| Methidathion | 73,844 | 21 | 0.03 | 30 | Yes |
| Methiocarb (RD) | 66,617 | 67 | 0.10 | 30 | Yes |
| Methomyl (RD) | 60,192 | 65 | 0.11 | 29 | Yes |
| Methoprene | 3,141 | 0 | 0.00 | 9 | |
| Methoprotryne | 8,962 | 0 | 0.00 | 9 | |
| Methothrin | 10 | 0 | 0.00 | 1 | |
| Methoxychlor | 57,141 | 2 | 0.00 | 30 | Yes |
| Methoxyfenozide | 66,377 | 638 | 0.96 | 30 | Yes |
| Methyldymron | 10 | 0 | 0.00 | 1 | |
| Metobromuron | 49,719 | 5 | 0.01 | 27 | |
| Metolachlor | 17,645 | 0 | 0.00 | 16 | |
| Metolcarb | 13,267 | 0 | 0.00 | 10 | |
| Metominostrobin | 4,264 | 1 | 0.02 | 3 | |
| Metosulam | 18,653 | 0 | 0.00 | 13 | |
| Metoxuron | 22,692 | 0 | 0.00 | 18 | |
| Metrafenone | 51,500 | 548 | 1.06 | 26 | |
| Metribuzin | 57,532 | 14 | 0.02 | 29 | |
| Metsulfovax | 10 | 0 | 0.00 | 1 | |
| Metsulfuron | 10 | 0 | 0.00 | 1 | |
| Metsulfuron‐methyl | 22,665 | 0 | 0.00 | 16 | |
| Mevinphos (RD) | 55,629 | 0 | 0.00 | 27 | |
| Milbemectin (RD) | 7,380 | 0 | 0.00 | 4 | |
| Mirex | 14,858 | 0 | 0.00 | 14 | |
| Molinate | 24,497 | 0 | 0.00 | 16 | |
| Monalide | 6,583 | 0 | 0.00 | 4 | |
| Monocrotophos | 67,688 | 7 | 0.01 | 29 | Yes |
| Monolinuron | 28,630 | 0 | 0.00 | 19 | |
| Monuron | 13,835 | 0 | 0.00 | 10 | |
| Myclobutanil (RD) | 70,241 | 1,131 | 1.61 | 30 | Yes |
| Nabam | 10 | 0 | 0.00 | 1 | |
| Naled | 12,230 | 0 | 0.00 | 8 | |
| Naphthalene | 10 | 0 | 0.00 | 1 | |
| Napropamide | 36,382 | 8 | 0.02 | 19 | |
| Naptalam | 5,227 | 0 | 0.00 | 4 | |
| Neburon | 7,997 | 1 | 0.01 | 11 | |
| Niclosamide | 10 | 0 | 0.00 | 1 | |
| Nicosulfuron | 17,101 | 1 | 0.01 | 14 | |
| Nicotine | 2,015 | 38 | 1.89 | 4 | |
| Nitenpyram | 49,489 | 2 | 0.00 | 28 | |
| Nithiazine | 10 | 0 | 0.00 | 1 | |
| Nitralin | 5,796 | 0 | 0.00 | 8 | |
| Nitrapyrin | 5,454 | 0 | 0.00 | 4 | |
| Nitrofen | 42,372 | 1 | 0.00 | 28 | |
| Nitrothal‐Isopropyl | 15,869 | 0 | 0.00 | 12 | |
| Norflurazon | 6,184 | 0 | 0.00 | 10 | |
| Noruron | 10 | 0 | 0.00 | 1 | |
| Novaluron | 27,438 | 15 | 0.05 | 16 | |
| Noviflumuron | 2,480 | 0 | 0.00 | 2 | |
| Nuarimol | 36,133 | 0 | 0.00 | 21 | |
| Octhilinone | 28 | 0 | 0.00 | 2 | |
| Ofurace | 22,150 | 0 | 0.00 | 13 | |
| Orbencarb | 3,706 | 0 | 0.00 | 4 | |
| Orthosulfamuron | 713 | 0 | 0.00 | 2 | |
| Oryzalin | 7,774 | 0 | 0.00 | 4 | |
| Oxadiargyl | 14,502 | 0 | 0.00 | 10 | |
| Oxadiazon | 34,429 | 9 | 0.03 | 17 | |
| Oxadixyl | 67,169 | 6 | 0.01 | 30 | Yes |
| Oxamyl | 64,020 | 13 | 0.02 | 28 | Yes |
| Oxasulfuron | 7,984 | 0 | 0.00 | 8 | |
| Oxaziclomefone | 29 | 0 | 0.00 | 2 | |
| Oxycarboxin | 13,179 | 0 | 0.00 | 12 | |
| Oxydemeton‐methyl (RD) | 56,499 | 1 | 0.00 | 26 | Yes |
| Oxyfluorfen | 35,054 | 33 | 0.09 | 18 | |
| Paclobutrazol | 65,164 | 18 | 0.03 | 30 | Yes |
| Paraquat | 552 | 3 | 0.54 | 7 | |
| Parathion | 73,148 | 6 | 0.01 | 29 | Yes |
| Parathion‐methyl (RD) | 61,160 | 0 | 0.00 | 28 | Yes |
| Pebulate | 7,050 | 0 | 0.00 | 9 | |
| Penconazole | 72,196 | 516 | 0.71 | 30 | Yes |
| Pencycuron | 68,009 | 73 | 0.11 | 30 | Yes |
| Pendimethalin | 71,864 | 348 | 0.48 | 30 | Yes |
| Penflufen | 5,190 | 0 | 0.00 | 8 | |
| Penfluron | 4,146 | 0 | 0.00 | 2 | |
| Penoxsulam | 9,924 | 0 | 0.00 | 7 | |
| Pentachlorophenol | 7,123 | 2 | 0.03 | 7 | |
| Pentanochlor | 7,079 | 0 | 0.00 | 7 | |
| Penthiopyrad | 14,381 | 8 | 0.06 | 11 | |
| Perfluidone | 10 | 0 | 0.00 | 1 | |
| Permethrin | 69,936 | 105 | 0.15 | 30 | Yes |
| Pethoxamid | 17,420 | 0 | 0.00 | 14 | |
| Phenkapton | 4,417 | 0 | 0.00 | 5 | |
| Phenmedipham (RD) | 39,431 | 27 | 0.07 | 20 | |
| Phenothrin | 10,812 | 0 | 0.00 | 13 | |
| Phenthoate | 61,916 | 11 | 0.02 | 30 | |
| Phorate (RD) | 36,387 | 5 | 0.01 | 23 | |
| Phosalone | 70,379 | 8 | 0.01 | 30 | |
| Phosfolan | 3,833 | 0 | 0.00 | 6 | |
| Phosmet (RD) | 61,501 | 328 | 0.53 | 30 | Yes |
| Phosphamidon | 45,198 | 1 | 0.00 | 26 | |
| Phosphines and phosphides (RD) | 89 | 1 | 1.12 | 2 | |
| Phoxim | 54,246 | 3 | 0.01 | 29 | |
| Picloram | 5,824 | 0 | 0.00 | 11 | |
| Picolinafen | 26,720 | 0 | 0.00 | 18 | |
| Picoxystrobin | 45,378 | 14 | 0.03 | 23 | |
| Pinoxaden | 8,918 | 0 | 0.00 | 11 | |
| Piperalin | 10 | 0 | 0.00 | 1 | |
| Piperophos | 1,641 | 0 | 0.00 | 5 | |
| Pirimicarb (RD) | 72,227 | 768 | 1.06 | 29 | Yes |
| Pirimiphos‐ethyl | 39,382 | 0 | 0.00 | 24 | |
| Pirimiphos‐methyl | 75,446 | 669 | 0.89 | 30 | Yes |
| Prallethrin | 172 | 0 | 0.00 | 3 | |
| Pretilachlor | 5,237 | 0 | 0.00 | 8 | |
| Primisulfuron | 1,120 | 0 | 0.00 | 2 | |
| Primisulfuron‐Methyl | 4,039 | 0 | 0.00 | 6 | |
| Probenazole | 4,073 | 1 | 0.02 | 2 | |
| Prochloraz (RD) | 39,526 | 483 | 1.22 | 25 | |
| Procymidone (RD) | 68,014 | 31 | 0.05 | 30 | Yes |
| Profenofos | 72,761 | 104 | 0.14 | 30 | Yes |
| Profluralin | 13,779 | 0 | 0.00 | 10 | |
| Profoxydim | 6,540 | 0 | 0.00 | 5 | |
| Prohexadione | 3,816 | 3 | 0.08 | 3 | |
| Promecarb | 36,292 | 3 | 0.01 | 16 | |
| Prometon | 7,098 | 0 | 0.00 | 10 | |
| Prometryn | 42,647 | 3 | 0.01 | 24 | |
| Propachlor | 21,115 | 2 | 0.01 | 17 | |
| Propamocarb (RD) | 62,428 | 1,591 | 2.55 | 29 | Yes |
| Propanil | 22,925 | 1 | 0.00 | 16 | |
| Propaphos | 2,499 | 0 | 0.00 | 3 | |
| Propaquizafop | 30,111 | 0 | 0.00 | 20 | |
| Propargite | 70,444 | 173 | 0.25 | 30 | Yes |
| Propazine | 22,339 | 0 | 0.00 | 17 | |
| Propetamphos | 21,609 | 0 | 0.00 | 15 | |
| Propham | 41,920 | 0 | 0.00 | 26 | |
| Propiconazole | 71,957 | 838 | 1.16 | 30 | Yes |
| Propineb | 224 | 0 | 0.00 | 2 | |
| Propisochlor | 1,184 | 0 | 0.00 | 2 | |
| Propoxur | 56,224 | 14 | 0.02 | 29 | |
| Propoxycarbazone (RD) | 7,515 | 0 | 0.00 | 6 | |
| Propyl‐3‐t‐butylphenoxyacetate | 10 | 0 | 0.00 | 1 | |
| Propyzamide (RD) | 67,473 | 83 | 0.12 | 30 | Yes |
| Proquinazid | 45,827 | 56 | 0.12 | 23 | |
| Prosulfocarb | 44,147 | 136 | 0.31 | 23 | |
| Prosulfuron | 13,957 | 0 | 0.00 | 12 | |
| Prothiocarb | 1,332 | 0 | 0.00 | 1 | |
| Prothioconazole (RD) | 55,603 | 67 | 0.12 | 28 | |
| Prothiofos | 58,658 | 4 | 0.01 | 29 | |
| Prothoate | 4,075 | 0 | 0.00 | 2 | |
| Pymetrozine (RD) | 59,716 | 254 | 0.43 | 29 | Yes |
| Pyracarbolid | 1,194 | 0 | 0.00 | 4 | |
| Pyraclofos | 6,110 | 0 | 0.00 | 8 | |
| Pyraclostrobin | 69,180 | 3,024 | 4.37 | 30 | Yes |
| Pyraflufen‐ethyl (RD) | 5,059 | 0 | 0.00 | 7 | |
| Pyrasulfotole | 43 | 0 | 0.00 | 2 | |
| Pyrazophos | 59,145 | 1 | 0.00 | 28 | |
| Pyrazoxyfen | 418 | 0 | 0.00 | 3 | |
| Pyrethrins | 33,267 | 43 | 0.13 | 27 | |
| Pyributicarb | 5,335 | 0 | 0.00 | 4 | |
| Pyridaben | 70,467 | 518 | 0.74 | 30 | Yes |
| Pyridafol | 1,168 | 0 | 0.00 | 1 | |
| Pyridalyl | 20,261 | 31 | 0.15 | 12 | |
| Pyridaphenthion | 42,801 | 0 | 0.00 | 22 | |
| Pyridate (RD) | 14,191 | 1 | 0.01 | 13 | |
| Pyridinitril | 10 | 0 | 0.00 | 1 | |
| Pyrifenox | 42,524 | 0 | 0.00 | 21 | |
| Pyriftalid | 29 | 0 | 0.00 | 2 | |
| Pyrimethanil (RD) | 70,834 | 2,921 | 4.12 | 30 | Yes |
| Pyrimidifen | 9,737 | 0 | 0.00 | 7 | |
| Pyriminobac‐Methyl | 29 | 0 | 0.00 | 2 | |
| Pyriofenone | 1,499 | 0 | 0.00 | 5 | |
| Pyriproxyfen | 69,830 | 885 | 1.27 | 30 | Yes |
| Pyrithiobac | 10 | 0 | 0.00 | 1 | |
| Pyroquilon | 6,218 | 0 | 0.00 | 8 | |
| Pyroxsulam | 8,341 | 0 | 0.00 | 11 | |
| Quassia | 2,192 | 0 | 0.00 | 1 | |
| Quinalphos | 58,545 | 10 | 0.02 | 28 | |
| Quinclorac | 14,490 | 0 | 0.00 | 13 | |
| Quinmerac | 16,591 | 0 | 0.00 | 12 | |
| Quinoclamine | 12,386 | 0 | 0.00 | 10 | |
| Quinoxyfen | 70,135 | 261 | 0.37 | 30 | Yes |
| Quintozene (RD) | 46,030 | 5 | 0.01 | 24 | |
| Quizalofop | 12,474 | 8 | 0.06 | 13 | |
| Rabenzazole | 2,484 | 0 | 0.00 | 2 | |
| Resmethrin | 18,414 | 1 | 0.01 | 22 | |
| Rimsulfuron | 24,176 | 0 | 0.00 | 19 | |
| Rotenone | 44,493 | 3 | 0.01 | 27 | |
| Saflufenacil (RD) | 52 | 0 | 0.00 | 1 | |
| Schradan | 2,480 | 0 | 0.00 | 2 | |
| Sebuthylazine | 6,655 | 0 | 0.00 | 9 | |
| Secbumeton | 2,639 | 0 | 0.00 | 8 | |
| Sedaxane | 1,482 | 0 | 0.00 | 1 | |
| Siduron | 5,929 | 0 | 0.00 | 6 | |
| Silafluofen | 6,936 | 0 | 0.00 | 9 | |
| Silthiofam | 15,593 | 0 | 0.00 | 10 | |
| Simazine | 43,274 | 0 | 0.00 | 25 | |
| Simeconazole | 29 | 0 | 0.00 | 2 | |
| Simetryn | 3,406 | 0 | 0.00 | 7 | |
| Sodium tetrathiocarbonate | 10 | 0 | 0.00 | 1 | |
| Spinetoram | 18,374 | 47 | 0.26 | 9 | |
| Spinosad | 65,217 | 1,210 | 1.86 | 30 | Yes |
| Spirodiclofen | 63,005 | 242 | 0.38 | 29 | Yes |
| Spiromesifen | 57,819 | 464 | 0.80 | 30 | Yes |
| Spirotetramat (RD) | 30,624 | 555 | 1.81 | 15 | |
| Spiroxamine (RD) | 68,587 | 181 | 0.26 | 29 | Yes |
| Streptomycin | 179 | 0 | 0.00 | 2 | |
| Sulcotrione | 12,307 | 0 | 0.00 | 8 | |
| Sulfallate | 28 | 0 | 0.00 | 2 | |
| Sulfentrazone | 5,089 | 0 | 0.00 | 10 | |
| Sulfometuron‐Methyl | 29 | 0 | 0.00 | 2 | |
| Sulfosulfuron | 5,585 | 0 | 0.00 | 9 | |
| Sulfotep | 40,737 | 1 | 0.00 | 22 | |
| Sulfoxaflor | 3,101 | 1 | 0.03 | 5 | |
| Sulfuryl fluoride | 10 | 0 | 0.00 | 1 | |
| Sulfur | 425 | 0 | 0.00 | 3 | |
| Sulprofos | 9,452 | 0 | 0.00 | 12 | |
| Tau‐fluvalinate | 66,986 | 66 | 0.10 | 29 | Yes |
| TCMTB | 2,766 | 0 | 0.00 | 6 | |
| TEPP | 4,849 | 0 | 0.00 | 6 | |
| Tebuconazole (RD) | 71,309 | 3,147 | 4.41 | 30 | Yes |
| Tebufenozide | 66,424 | 124 | 0.19 | 30 | Yes |
| Tebufenpyrad | 70,298 | 266 | 0.38 | 30 | Yes |
| Tebupirimphos | 1,015 | 0 | 0.00 | 5 | |
| Tebutam | 3,745 | 0 | 0.00 | 6 | |
| Tebuthiuron | 4,290 | 0 | 0.00 | 6 | |
| Tecloftalam | 4,146 | 0 | 0.00 | 2 | |
| Tecnazene | 50,625 | 1 | 0.00 | 28 | |
| Teflubenzuron | 58,340 | 33 | 0.06 | 29 | Yes |
| Tefluthrin | 65,127 | 24 | 0.04 | 29 | Yes |
| Tembotrione (RD) | 14,350 | 0 | 0.00 | 6 | |
| Temephos | 2,193 | 0 | 0.00 | 6 | |
| Tepraloxydim | 25,487 | 4 | 0.02 | 11 | |
| Terbacil | 13,779 | 0 | 0.00 | 12 | |
| Terbucarb | 2,038 | 0 | 0.00 | 3 | |
| Terbufos | 37,727 | 0 | 0.00 | 24 | |
| Terbumeton | 12,249 | 0 | 0.00 | 12 | |
| Terbuthylazine | 66,307 | 33 | 0.05 | 30 | Yes |
| Terbutryn | 41,387 | 0 | 0.00 | 21 | |
| Tetrachlorvinphos | 29,174 | 0 | 0.00 | 20 | |
| Tetraconazole | 72,593 | 309 | 0.43 | 30 | Yes |
| Tetradifon | 67,719 | 7 | 0.01 | 30 | Yes |
| Tetramethrin | 48,847 | 9 | 0.02 | 27 | |
| Tetrasul | 11,075 | 0 | 0.00 | 8 | |
| Thenylchlor | 3,647 | 0 | 0.00 | 3 | |
| Thiabendazole (RD) | 67,387 | 2,423 | 3.60 | 29 | Yes |
| Thiacloprid | 70,614 | 1,706 | 2.42 | 30 | Yes |
| Thiamethoxam (RD) | 76,162 | 1,050 | 1.38 | 29 | Yes |
| Thiazafluron | 11 | 0 | 0.00 | 2 | |
| Thiazopyr | 2,491 | 0 | 0.00 | 3 | |
| Thidiazuron | 3,854 | 0 | 0.00 | 5 | |
| Thiencarbazone | 1,880 | 0 | 0.00 | 3 | |
| Thifensulfuron | 183 | 0 | 0.00 | 3 | |
| Thifensulfuron‐methyl | 20,284 | 0 | 0.00 | 14 | |
| Thifluzamide | 29 | 0 | 0.00 | 2 | |
| Thiobencarb | 17,855 | 1 | 0.01 | 11 | |
| Thiocyclam | 5,373 | 0 | 0.00 | 6 | |
| Thiofanox | 5,592 | 0 | 0.00 | 8 | |
| Thiometon | 24,013 | 0 | 0.00 | 17 | |
| Thionazin | 8,787 | 0 | 0.00 | 12 | |
| Thiophanate‐ethyl | 2,687 | 0 | 0.00 | 6 | |
| Thiophanate‐methyl (RD) | 61,564 | 487 | 0.79 | 30 | Yes |
| Thioquinox | 10 | 0 | 0.00 | 1 | |
| Thiosultap sodium | 2,470 | 0 | 0.00 | 1 | |
| Thiram | 423 | 0 | 0.00 | 3 | |
| Thymol | 10 | 0 | 0.00 | 1 | |
| Tiocarbazil | 4,722 | 0 | 0.00 | 6 | |
| Tolclofos‐methyl | 70,440 | 44 | 0.06 | 30 | Yes |
| Tolfenpyrad | 11,607 | 16 | 0.14 | 12 | |
| Tolylfluanid (RD) | 54,776 | 4 | 0.01 | 27 | Yes |
| Topramezone | 3,986 | 0 | 0.00 | 5 | |
| Tralkoxydim | 14,895 | 0 | 0.00 | 11 | |
| Tralomethrin | 2,712 | 0 | 0.00 | 6 | |
| Transfluthrin | 7,365 | 0 | 0.00 | 11 | |
| Tri‐allate | 31,191 | 4 | 0.01 | 19 | |
| Triadimenol (RD) | 68,714 | 722 | 1.05 | 30 | Yes |
| Triamiphos | 1,917 | 0 | 0.00 | 4 | |
| Triapenthenol | 1,398 | 0 | 0.00 | 2 | |
| Triasulfuron | 12,808 | 0 | 0.00 | 15 | |
| Triazamate | 12,597 | 1 | 0.01 | 10 | |
| Triazophos | 73,720 | 41 | 0.06 | 30 | Yes |
| Triazoxide | 4,757 | 0 | 0.00 | 4 | |
| Tribenuron | 10 | 0 | 0.00 | 1 | |
| Tribenuron‐methyl | 8,760 | 0 | 0.00 | 13 | |
| Tribufos | 2,375 | 0 | 0.00 | 3 | |
| Trichlamide | 2,480 | 0 | 0.00 | 2 | |
| Trichlorfon | 53,411 | 7 | 0.01 | 29 | |
| Trichloronat | 17,545 | 0 | 0.00 | 10 | |
| Triclopyr | 23,706 | 7 | 0.03 | 16 | |
| Tricyclazole | 50,047 | 173 | 0.35 | 28 | |
| Tridemorph | 6,897 | 0 | 0.00 | 8 | |
| Tridiphane | 1,603 | 0 | 0.00 | 2 | |
| Trietazine | 2,484 | 0 | 0.00 | 4 | |
| Trifloxystrobin (RD) | 71,033 | 1,423 | 2.00 | 30 | Yes |
| Trifloxysulfuron | 4,145 | 0 | 0.00 | 3 | |
| Triflumizole (RD) | 31,518 | 36 | 0.11 | 14 | |
| Triflumuron | 59,800 | 60 | 0.10 | 30 | Yes |
| Trifluralin | 62,594 | 9 | 0.01 | 30 | |
| Triflusulfuron | 1,652 | 0 | 0.00 | 3 | |
| Triflusulfuron‐Methyl | 10,698 | 1 | 0.01 | 7 | |
| Triforine | 31,513 | 0 | 0.00 | 21 | |
| Trimethacarb | 3,580 | 0 | 0.00 | 5 | |
| Trimethyl‐sulfonium cation | 3,332 | 61 | 1.83 | 4 | |
| Trinexapac | 8,936 | 32 | 0.36 | 8 | |
| Trinexapac‐Ethyl | 8,337 | 0 | 0.00 | 9 | |
| Triticonazole | 58,040 | 1 | 0.00 | 30 | |
| Tritosulfuron | 13,711 | 0 | 0.00 | 9 | |
| Uniconazole | 4,865 | 0 | 0.00 | 8 | |
| Validamycin | 10 | 0 | 0.00 | 1 | |
| Valifenalate | 13,259 | 3 | 0.02 | 9 | |
| Vamidothion | 30,517 | 0 | 0.00 | 25 | |
| Vernolate | 2,480 | 0 | 0.00 | 2 | |
| Vinclozolin | 56,861 | 6 | 0.01 | 28 | Yes |
| Warfarin | 385 | 0 | 0.00 | 2 | |
| XMC | 2,480 | 0 | 0.00 | 2 | |
| Ziram | 373 | 0 | 0.00 | 3 | |
| Zoxamide | 62,050 | 100 | 0.16 | 29 |
LOQ: limit of quantification; RD: residue definition.
The table providing the number of analyses/determinations, the number of positive quantifications per pesticide, the quantification rate and the number of food products analysed for the single pesticides can be found in Appendix C, Table C.1.
In total 4,173 analytical determinations34 were found exceeding the MRL. The pesticides most frequently found above the MRL are presented in Figure 48 (only pesticides with more than 0.05% of MRL exceedances and with at least 2,000 samples analysed). The two pesticides with the highest MRL exceedances’ rate were the chlorate (5.6% of the samples exceeding the MRL out of the 5,273 samples analysed) and copper (2.5%, 3,103 samples analysed); these results are not reported in Figure 48 because of their different potential sources or uses, i.e. not necessarily originating from pesticide uses (see also Section 4.3).
Figure 48.
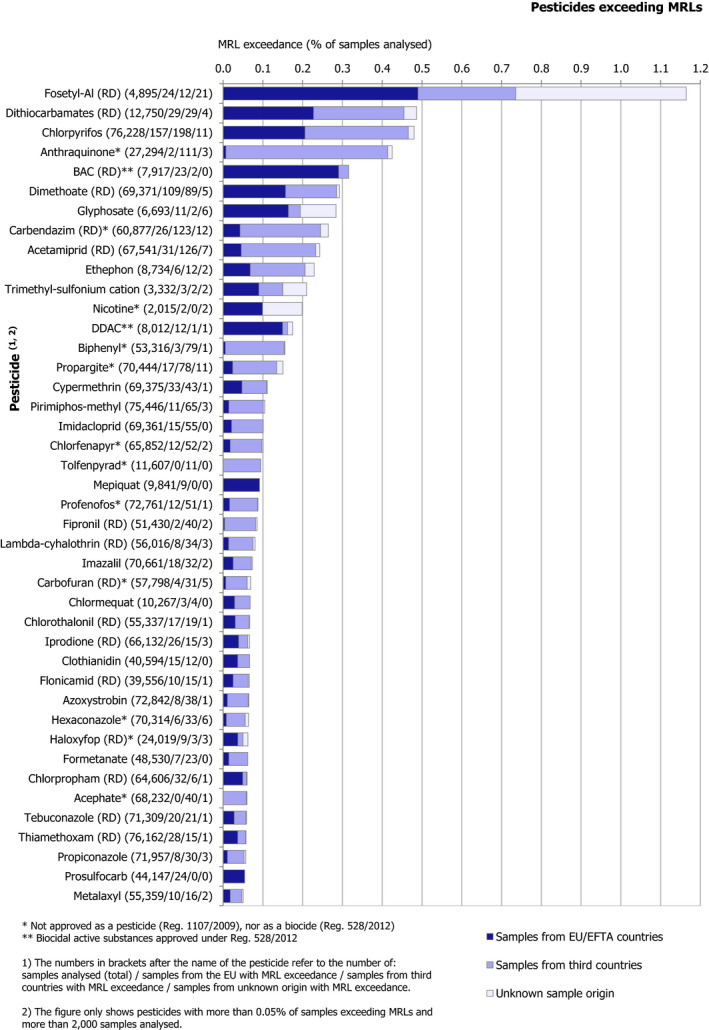
Frequency of MRL exceedances per pesticide and sample origin
4.2.4. Results on glyphosate residues in food
Glyphosate, an herbicide attracting a high level of public interest, was analysed in 2016 by 26 reporting countries. Overall, 6,761 samples of different food products (including processed products) were analysed for glyphosate residues; of these, 124 were baby food samples35 and 76 were food samples of animal origin.
Considering the individual food products analysed, glyphosate residues were mainly analysed in wheat and rye (813 and 542 samples, respectively), apples, tomatoes, wine grapes, honey and other apicultural products, strawberries, table grapes, sweet peppers, lettuces, asparagus, plums, leeks, potatoes, kiwi fruits, carrots, cherries and pineapples. For other food products, results for less than 100 samples were reported.
Compared with 2015, in 2016, the overall number of samples analysed for glyphosate increased by 27% (5,329 samples were analysed in 2015). In total, 77.3% of the samples tested originated from the EU, 12.7% from third countries and for 10% the sample origin was not identified (unknown origin).
The majority of the samples was analysed by Germany (60%), followed by the United Kingdom (7.5%) and Croatia (5.3%).
Overall, 3.6% of the samples analysed for glyphosate contained quantified residues of this active substance.
Considering the individual food products analysed, the highest quantification rate was observed for dry lentils (38% of the samples containing quantified levels of glyphosate, i.e. 16 samples of the 42 samples analysed), followed by linseeds (20% of the samples: 3 out of 15 samples), soya beans (16% of the samples: 6 out of 38 samples), dry peas (12% of the samples: 2 out of 17 samples) and tea (10% of the samples: 3 out of 29 samples). In cereals, glyphosate was mainly found in buckwheat and other pseudo‐cereals (24% of the samples: 15 out of 62 samples), followed by barley (19% of the samples: 6 out of 31 samples), millet (18% of the samples: 2 of the 11 tested samples), wheat (13% of the samples: 105 of the 813 samples) and rye (4% of the samples: 23 of the 542 samples). No detection of glyphosate residues was reported for rice samples.
Among the 6,761 samples analysed, 19 samples (0.28%) exceeded the MRL for glyphosate:
Five samples of honey and other apicultural products from Germany (MRL = 0.05* mg/kg);
Seven samples of buckwheat and other pseudo‐cereals, of which 5 were from Lithuania, one from China and one from Ukraine (MRL = 0.1* mg/kg);
One sample of poppy seeds from Slovakia (MRL = 0.1* mg/kg);
Six other samples (four of buckwheat and other pseudo‐cereals, one of millet and one of honey and other apicultural products) were reported with unknown origin.
Glyphosate residues were not quantified in baby food samples.36
The use of plant protection products containing glyphosate trimesium, a variant of glyphosate, may lead not only to residues of glyphosate, but also to residues of trimethyl‐sulfonium cation, a compound for which specific MRLs have been established. The following results for trimethyl‐sulfonium cation residues have been reported:
Four countries (Germany, Italy, the Netherlands and Cyprus) reported analysis in 3,332 samples of 108 different food products, mainly wine grapes, tomatoes, table grapes, strawberries, lettuce, apples, potatoes; other food products, were tested for trimethyl‐sulfonium cation, but for less than 100 samples. Trimethyl‐sulfonium cation was quantified in 1.8% of these samples, mostly in cultivated fungi (48% of the samples: 26 out of 54 samples analysed), citrus fruits (24% of the mandarins analysed (5 of the 21 samples), 9% of oranges (2 of the 22 samples), 6% of grapefruits (2 of the 34 samples), 4% of limes (1 of the 26 samples) and 4% of lemons (3 of the 83 samples), 14% of the papaya samples (1 of the 7 seven samples), and table grapes (5% of the samples: 8 of the 166 samples). In addition, some positive results were reported for teas, pumpkin seeds, pomegranates, celeriacs, lentils (dry), melons, sweet peppers, apricots, asparagus and plums. Trimethyl‐sulfonium cation was exceeded in seven samples (0.2% of the total samples tested): three samples on cultivated fungi (two originated from Germany and one from Poland), one sample of table grapes from Chile and three samples of tea (one sample originated from China and the other two were from unknown origin).
4.2.5. Results on import controls under Regulation (EC) No 669/2009
According to the provisions of Regulation (EC) No 669/200936 on import controls, in 2016, certain food products from Cambodia, China, the Dominican Republic, Egypt, Kenya, Thailand, Turkey and Vietnam were subject to an increased level of official controls for certain pesticides at the point of entrance into the EU territory. A description of the required controls (type of products, countries of origin and the type of hazard) relevant for the calendar year 2016 can be found in Appendix C, Table C.2.
Table C.2.
Food to be analysed in 2016 according to Regulation (EC) No 669/2009 on import controls
| Country of origin | Food | Food name (code) in food classification under Reg. 396/2005a |
|---|---|---|
| Cambodia | Aubergines | |
| Chinese celery (Apium graveolens) | Celery leaves (0256030) | |
| Yardlong beans (Vigna unguiculata subsp. sesquipedalis) | Beans with pods (0260010) | |
| China | Broccoli | |
| Tea leaves, whether or not flavoured | ||
| Dominican Republic | Aubergines | |
| Bitter melon (Mormodica charantia) | Courgettes (0232030) | |
| Peppers (Capsicum spp.) | ||
| Yardlong beans (Vigna unguiculata subsp. sesquipedalis) | Beans with pods (0260010) | |
| Egypt | Peppers (Capsicum spp.) | |
| Strawberries | ||
| Kenya | Peas with pods | |
| Thailand | Aubergines | |
| Peppers (Capsicum spp.) | ||
| Yardlong beans (Vigna unguiculata subsp. sesquipedalis) | Beans with pods (0260010) | |
| Turkey | Lemons | |
| Peppers (Capsicum spp.) | ||
| Vine leaves | ||
| Vietnam | Basil (holy, sweet) | |
| Coriander leaves | Celery leaves (0256030) | |
| Dragon fruit (Pitayas) | Prickly pears/cactus fruits (0162040) | |
| Mint | Basil (0256080) | |
| Okra | Okra/lady's finger | |
| Parsley | ||
| Peppers (Capsicum spp.) |
Corresponding name in the food classification under Regulation (EC) No 396/2005 (only if the food product to be analysed under Regulation 669/2005 is not listed in Annex I, Part A of Regulation 212/2013).
As for the last EU report on pesticide residues (2015 control year), the results presented in this paragraph are based on the 2016 results provided by the European Commission, i.e. summary statistics on the exceedance rate with no detailed information on the pesticides analysed and quantified.
In 2016, 65,010 consignments of products covered by the Regulation (EC) No 669/2009 on an increased level of official import controls on the imports of certain feed and food of non‐animal origin at the EU borders were imported to the EU. In total, 8,092 of these consignments were selected for laboratory analyses. A total of 343 consignments (4.3% of the total number of consignments submitted to analysis) were considered as non‐compliant with EU legislation on pesticide residues, taking into account the analytical measurement uncertainty.
Among food commodities for which at least 30 samples were analysed in 2016, the highest non‐compliance rates were reported for the following items: vine leaves from Turkey (41.9%), sweet peppers from Dominican Republic (12.6%) and from Egypt (10.5%), tea leaves from China (11.4%), lemons from Turkey (8.8%), chilli peppers from Thailand (8.1%), yardlong beans from Thailand (7.1%) and from Dominican Republic (7.6%), strawberries from Egypt (5.2%) and aubergines from the Dominican Republic (5.1%).
Figure 49 reports the percentages of non‐compliant food products analysed according to the provisions of Regulation (EC) No 669/2009 by sample origin and food item.
Figure 49.
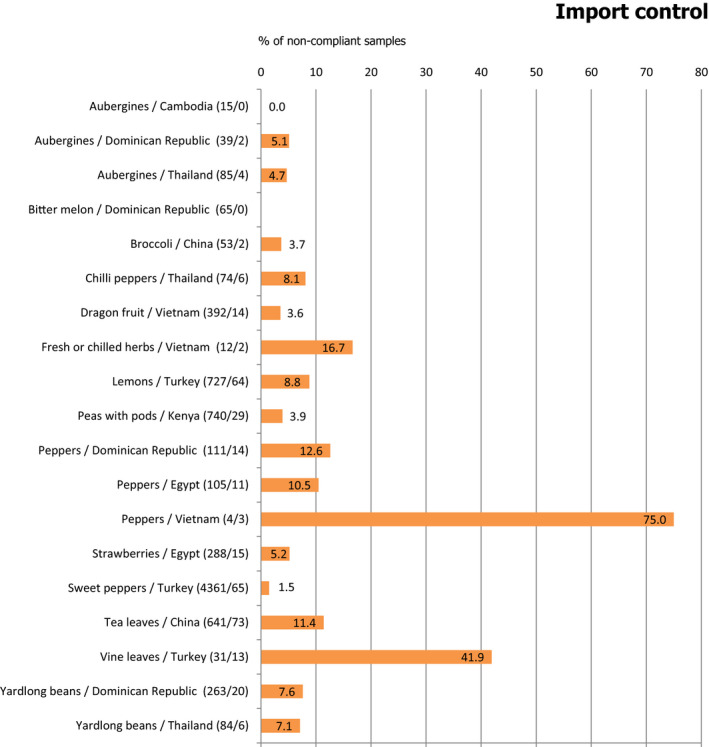
Frequency of non‐compliant samples analysed in the framework of the reinforced import controls under Regulation (EC) No 669/2009
- *: The number in brackets after the name of the country of origin/food product refer to the number of samples analysed for pesticide residues under Reg. 669/2009 and the number of non‐compliant samples.
4.2.6. Results on baby food
Reporting countries analysed 1,676 samples of baby foods (i.e. foods covered by Directives 2006/125/EC and 2006/141/EC), including 153 samples of infant formulae and 77 follow‐on formulae, 357 processed cereal‐based baby foods and 1,089 other baby foods including 423 samples taken in the framework of the EUCP.
Quantified residues (at or above the LOQ) were found in 171 samples (10.2%), while the majority of samples were free of quantifiable residues (89.8%). In 13 samples, more than one residue was quantified in the same sample (Figure 50). For 1.9% of the samples (32 samples), the residue concentrations were considered by the reporting countries exceeding the MRL37 (for more details, see below); 1.4% of the samples (24 samples) were considered non‐compliant with the legal limits, taking into account the analytical measurement uncertainty. Compared with the overall results for 2016, the quantification rate (percentage of samples with quantified residues) is significantly lower in baby food samples (10.2%) compared to the quantification rate recorded considering all food groups (49.3%). In 2015, the pesticide quantification rate in baby foods was slightly higher (11%).
Figure 50.
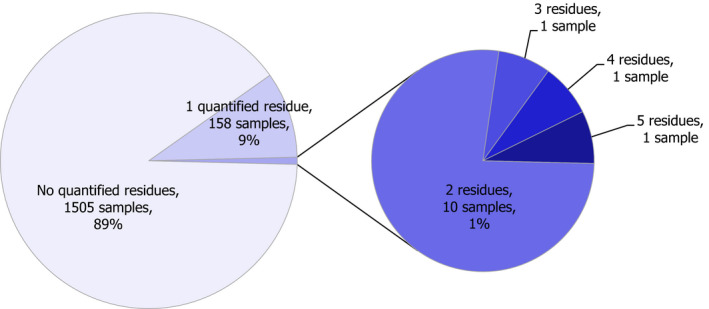
Number of quantified residues per individual baby food samples
Considering the samples of all baby food categories, 21 different pesticides were quantified in concentrations at or above the LOQ. Similar to the previous reporting years, the most frequently quantified compound in baby food was copper (quantified in 91 samples, mainly baby foods classified as ‘other than processed cereal‐based foods’), followed by chlorate (29 samples, all type of baby foods), fosetyl‐Al (23 samples, not quantified in infant and follow‐on formulae), BAC (8 samples, all type of baby food), hexachlorobenzene (8 samples), DDT (6 samples), pendimethalin (6 samples), didecyldimethylammonium chloride (DDAC) (3 samples), dieldrin (2 samples), dodine (2 samples) and tricyclazole (2 samples). Other pesticides that occurred in quantifiable concentrations in only one single sample were: acetamiprid, boscalid, chlordane, deltamethrin, difenoconazole, dithiocarbamates, imazalil, mercury, pymetrozine and pyrethrins. The frequent occurrences of copper are explained by the legal context: copper is a nutrient that is added to infant formula and follow‐on formula and can also be added to processed‐cereal‐based food and baby food. Copper compounds in baby food may also result from other sources (natural occurrence of copper in plant or animal products or the use of copper as feed additives). BAC and DDAC belong to the group of quaternary ammonium compounds that are widely used in biocides (disinfectants), but since they have been used as pesticides in the past, they fall under the remit of the pesticide MRL regulation. Chlorate is a substance that is formed as a by‐product from the use of chlorine disinfectants (chlorine, chlorine dioxide and chlorite), is used as processing aids to allow good hygiene practices in food processing and as a biocidal in the process of disinfecting drinking water. These uses are necessary to ensure a good hygiene of food products but also lead to detectable residues of chlorate in food in the food chain not necessarily linked to a use as a pesticide. Finally, some of the other quantified substances (i.e. hexachlorobenzene, DDT and dieldrin) can be considered as persistent environmental contaminants.
Overall, EFSA noted 34 analytical determinations in 32 samples (1.9% of the baby food samples) in which the residue concentrations exceeded the default MRL of 0.01 mg/kg,38 most frequently for fosetyl‐Al (20 samples vs 56 in 2015) and chlorate (6 samples). The overall MRL exceedance rate is lower in 2016 than in 2015 (4.8% of the samples), mainly because of lower MRL exceedances reported for fosetyl‐Al.
4.2.7. Results on organic food
In total, 5,495 samples of organic food (excluding baby foods)39 were taken (6.5% of the total number of samples tested in 2016 compared to 6.4% in 2015); the 767 samples of organic products taken in the framework of the EUCP are also included in this total number of samples.
Overall, 4,568 samples did not contain quantifiable residues (83.1% of the analysed samples in 2016 compared to 85.8% in 2015). In total, 927 samples contained quantified residues (16.9% in 2016 vs 14.2% in 2015); of those, 856 samples contained residues, whose measured levels were below or at the MRL (15.6% of the samples compared to 13.5% in 2015) and 71 samples with residue levels above the MRL (1.3% vs 0.7% in 2015). Of the 71 samples exceeding the MRLs, 41 samples were considered non‐compliant by the reporting country considering the uncertainty of the analytical measurement. Multiple MRL exceedances were found for three samples: one sample of tomatoes from China, one sample of lettuce from Bulgaria and one sample of fresh herbs from India.
Compared to conventionally produced food (non‐organic), the MRL exceedance and quantification rates were significantly lower in organic food. In 2016, the estimated MRL exceedance rate was 1.3% in organic food, while 4% for conventional food; the same rates’ pattern was observed for the quantification rates, which were 15.6%40 in organic food and 48.5% in conventional food. In Figure 51, the results for individual organic food groups are analysed separately, showing the major difference in the findings, in particular for fruits and nuts, vegetables and cereals.
Figure 51.
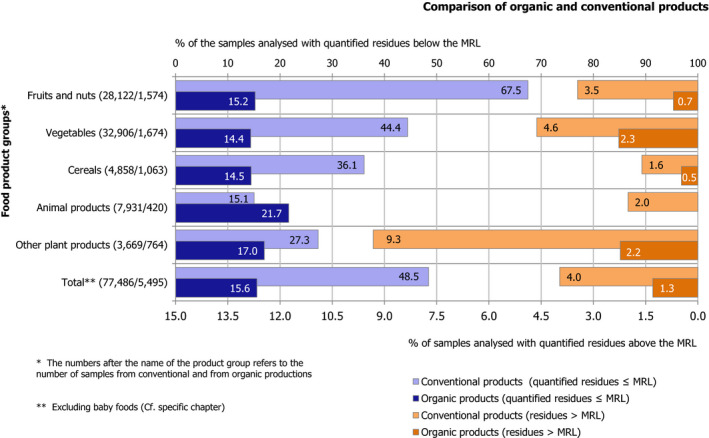
Comparison of organic and conventional foods: quantification and MRL exceedance rates for main food product groups (including all pesticides)
In total, 151 different pesticides were quantified in 2016 (compared to 140 in 2015) in concentrations at or above the LOQ. The pesticides measured most frequently (quantified in at least five samples) are presented in Figure 52. There, the pesticides permitted in organic farming, naturally occurring compounds and substances resulting from environmental contamination (persistent pesticides no longer used in the EU), are specifically labelled with an asterisk.
Figure 52.
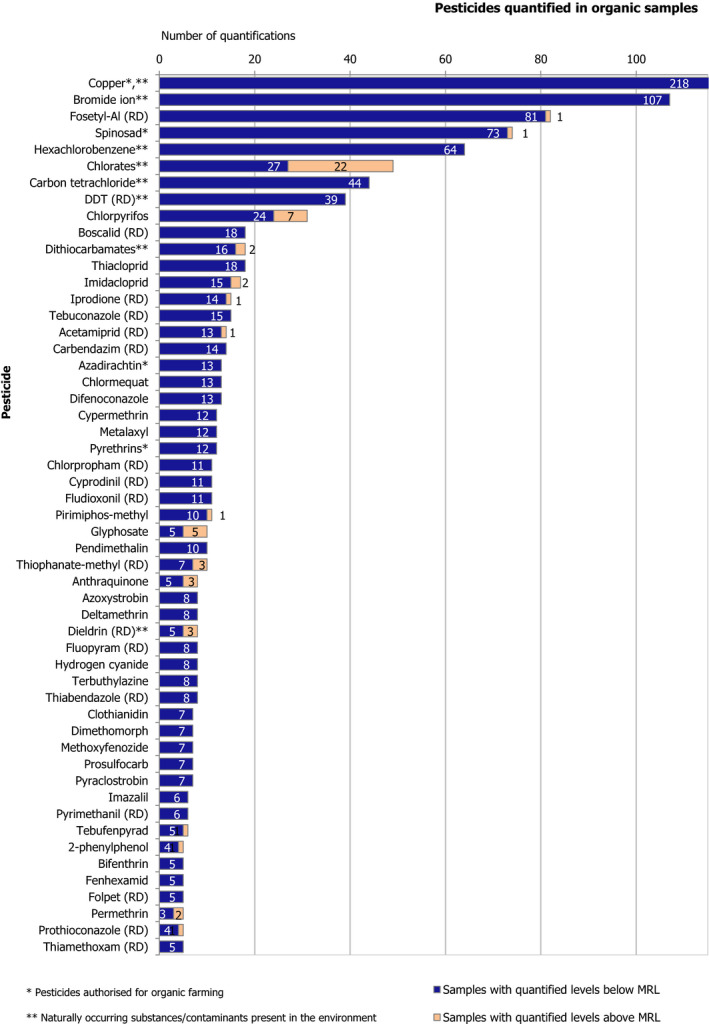
Pesticides most frequently quantified in organic samples (at least five positive quantifications reported)
Similar to the previous reporting years, the most frequently quantified residue in organic food was copper in 218 samples in 28 different food items, mostly in wine grapes, rice, rye and soya beans, followed by bromide ion in 107 samples (in 28 different food items, mostly in tomatoes), fosetyl‐Al in 82 samples (27 commodities, mostly in wine grapes), spinosad in 74 samples (23 commodities, mainly in tomatoes), hexachlorobenzene in 64 samples (eggs, milk and pumpkin seeds), chlorate in 49 samples (26 food items, mostly in carrots, lettuce and cucumbers), carbon tetrachloride in 44 samples (13 food commodities, mainly in oil plants), DDT in 39 samples (five food items, mostly eggs and milk), chlorpyrifos in 31 samples (18 commodities), boscalid in 18 samples (12 commodities), dithiocarbamates in 18 samples (10 commodities), thiacloprid in 18 samples (mainly in honey and other apicultural products), imidacloprid in 17 samples (11 different commodities). Other pesticides were found in less than 16 samples (Figure 52).
Copper, spinosad, azadirachtin and pyrethrins are allowed to be used in organic farming so far as the corresponding use is authorised in the general agricultural in the Member State concerned; thus, the presence of residues of these compounds is linked to agricultural practices permitted in organic farming in the Union; as a result, the positive measurements of these substances in organic food are not unexpected. Residues of hexachlorobenzene, DDT and dieldrin are resulting from environmental contaminations (mainly from the soil), due to the use of these persistent compounds as pesticides in the past. Quantifications of copper, bromide ion, chlorate, carbon tetrachloride and dithiocarbamates in certain commodities may result from other sources than pesticide uses, e.g. CS2 measured for dithiocarbamates (see Section 3.3.2. Head cabbage) are naturally found in some plants, particularly in Brassicaceae and Alliaceae.
Among the top three most frequently quantified residues in organic food, it is noted the occurrence of fosetyl‐Al residues. The current legal residue definition is ‘sum of fosetyl‐Al and phosphonic acid and their salts expressed as fosetyl’. Phosphonic acid is naturally present in the environment or can come from use of certain fertilisers, therefore these findings do not necessary indicate that there was a use of fosetyl‐aluminium. Food business operators have been made aware of this explicitly in 2014 by a Note on the DG SANTE webpage and through the relevant trade associations. The occurrence of other pesticides not authorised in organic farming can – as for conventional products – be the result of spray drift, environmental contaminations or contaminations during handling, packaging, storage or processing of organic products. This occurrence could also be linked to wrong labelling of conventionally produced food as organic food.
MRL exceedances41 in organic products were reported mainly for chlorate (22 samples) and additional 53 determinations for 29 other pesticides. The details on samples of organic products exceeding a legal limit can be also found from the Excel file published as a supplement to this report.
The overall results above are not directly comparable with the findings presented in the recently published EFSA technical report on pesticide residue measured in organic versus conventional food products (EFSA, 2018a, b, c, d). There, the data analysis and systematic comparison focussed on samples taken and analysed in the framework of the EUCP in the reference period 2013, 2014 and 2015 (for a total of 28,912 conventional and 1,940 organic food samples). Thus, the data analysis was limited to the food items mostly consumed by EU citizens, and did not addressed some ‘minor’ food, for which the likelihood of the detection of pesticide residues is higher. Furthermore, the analytical scope as limited to the EUCP requirements. In the above technical report, 44% of the conventional produced food samples contained one or more quantifiable residues, while in organic food the frequency of samples with measurable pesticide residues was lower (6.5% of the organic samples); instead, the MRL exceedance rate for conventional and organic food amounted to 1.2% and 0.2% of the samples tested, respectively, without considering the occurrence of the residue related to naturally occurring substances.
Therefore, if all the organic food items are considered and a larger analytical scope is accounted for without discriminations among national and EUCP control plans (which have different sampling strategies), the MRL exceedance rate estimated in 2016 (0.7%, in case the quantified residues related to residues that do not necessarily originate from the use of pesticides) is higher than the corresponding rate gathered from the EUCP results alone (0.2%). To conclude, EFSA recommends continuing monitoring pesticide residues in organically food items tested in the frame of both the national and EUCP programmes.
4.2.8. Results on animal products
In total, 8,351 samples of products of animal origin covered by Regulation (EC) No 396/2005 were analysed. In Figure 53, the total number of samples taken is broken‐down by food product/product group.
Figure 53.
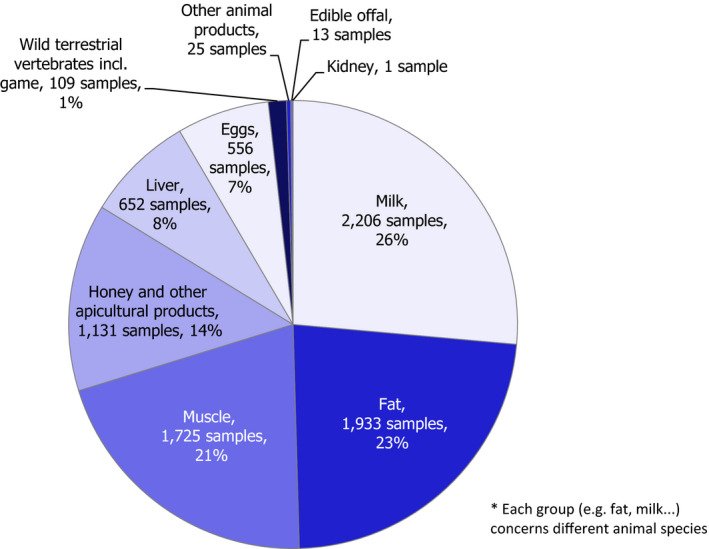
Number of samples of animal products tested, broken‐down by food group
The majority of these samples (83%, 6,906 samples) was free of quantifiable residues; in 317 samples (4%), more than one pesticide was reported (Figure 54). Compared with the overall results for other food products, the quantification rate was significantly lower for animal products (49.3% for all food groups compared to 17% for animal products).
Figure 54.
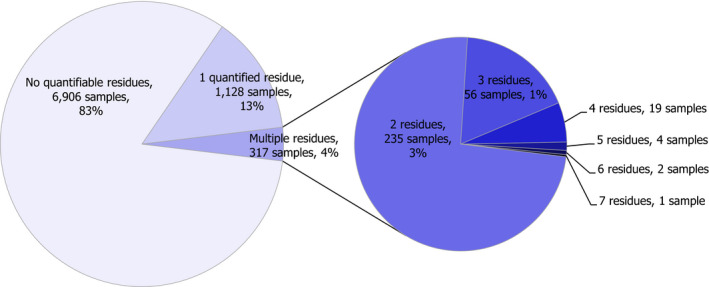
Number of quantified residues per individual sample of animal origin
For 159 samples (1.9%), an MRL exceedance was identified, particularly for honey (19 samples), liver (84 samples) and milk (50 samples). In 2015, 0.4% of the samples (33 samples) exceeded MRLs. Compared to the results on the 2015 control activities; in 2016 and increase of the MRL exceedance rate was observed (1.9% in 2016 compared to 0.4% in 2015) mainly due to the findings reported on chlorate in milk (out of 159 samples, 31 samples were of milk and 1 on honey, containing residues of chlorate above the MRL.
Among the 629 pesticides analysed in food of animal origin, 49 different pesticides were quantified (residue levels at or above the LOQ). The most frequently quantified substances were: copper, DDT, hexachlorobenzene, thiacloprid, chlordane, HCH‐beta, chlorate, BAC, DDAC, HCH‐alpha and dieldrin (Figure 55). Most of these compounds are banned or no longer used as pesticides in Europe, but they are still found in the food chain due to their persistence in the environment. It is noted that copper residues in animal products are not necessarily linked to the use of copper as a pesticide, but may result from the use of feed supplements, which contain copper compounds.
Figure 55.
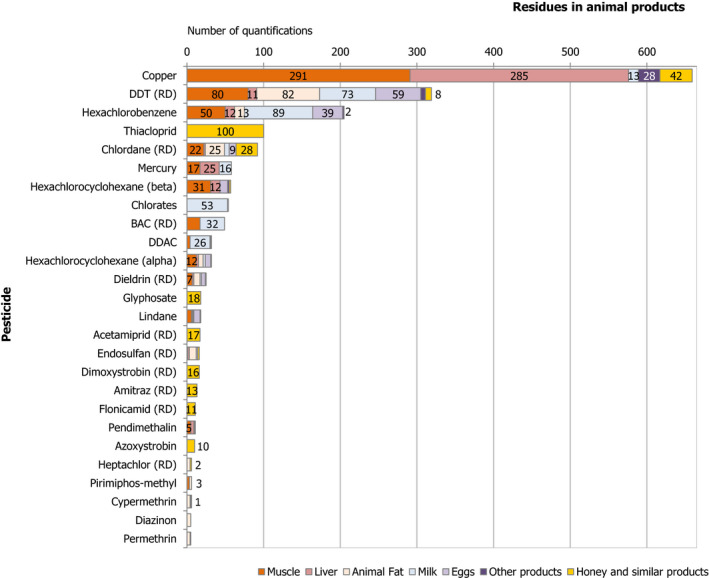
Pesticides most frequently quantified in animal products (in absolute numbers of detections at or above the LOQ)
Out of 1,131 samples of honey and other apicultural products analysed, 236 samples (20.1%) contained at least one pesticide residue; 19 samples numerically exceeded the MRL (1.7%) and nine samples were reported as MRL non‐compliant by the reporting countries (0.8%). The MRL was exceeded for the following substances: glyphosate, amitraz, fluvalinate and coumaphos.
Among the 619 different pesticides sought in honey and related products, 30 were quantified, mostly copper (quantified in 100% of the samples, i.e. in the 42 samples analysed), thiacloprid (quantified in 17% of the samples, 100 of the 588 samples tested), glyphosate (8.2%, 18 of the 220 samples analysed), chlordane (7.8%, 28 of the 358 samples analysed), dimoxystrobin (5%, 16 of the total of 319 samples analysed) and chlorate (5%, 1 of the 20 samples analysed). Other pesticides were also quantified in honey (in decreasing order of quantifications rate): flonicamid, acetamiprid, fluvalinate, amitraz, azoxystrobin, fosetyl‐Al, carbendazim, DDT, boscalid, isopyrazam, tebuconazole, heptachlor, tau‐fluvalinate, picoxystrobin, coumaphos, HCH‐beta, endosulfan, imidacloprid, propargite, dimethoate, endrin, HCH‐alpha, methoxychlor, chlorpyrifos. Some of these substances are environmental contaminants resulting from past uses as pesticides (e.g. chlordane, DDT, methoxychlor, heptachlor, HCH alpha and beta, lindane and dieldrin). Others, such as thiacloprid are due to the use of pesticides in crops that are foraged by bees. Thiacloprid was also frequently quantified in 2014 and 2015 (EFSA, 2016a–c, 2017a–d). Coumaphos (two quantifications) and amitraz (13 quantifications) residues in honey originate more likely from treatments of beehives with antiparasitic products authorised under Regulation (EU) No 37/2010 on veterinary medicinal products, rather than from pesticides uses; it is noted that both compounds are no longer approved as pesticides in Europe.
In the Excel file published as supplement to this report, further details on the pesticide/food combinations are reported, which were found to exceed the legal limits.
4.2.9. Multiple residues in the same sample
Multiple residues in one single sample may result from the application of different types of pesticides (e.g. application of herbicides, fungicides or insecticides against different pests or diseases) or use of different active substances avoiding the development of resistant pests or diseases. Besides these agricultural practices, multiple residues may also occur due to mixing or blending of lots with different treatment histories, contaminations during food processing, uptake of persistent residues via soil, or spray drift to fields adjacent to treated fields. According to the current EU legislation, the presence of multiple residues in a sample is not considered as non‐compliance, as long as each individual residue level does not exceed the corresponding MRL.
Different pesticides (multiple residues) were quantified in 30.1% of the 84,657 samples analysed (28% in 2015) (Figure 56). In unprocessed products, the frequency of multiple residues was slightly higher (32.5%) compared with processed products (13.4% of the samples analysed contained more than one pesticide in concentrations higher or equal to the LOQ). Notably, 589 samples contained 10 or more pesticides (71 samples of processed and 518 samples of unprocessed products, such as table grapes (81 samples), strawberries (58 samples), tea (56 samples), apples (32 samples), sweet peppers (32 samples), lettuces (26 samples) and pears (20 samples). Compared with the 2015 results on multiple residues in the same sample, in 2016, the number of samples with multiple residues increased; for example, the number of unprocessed wine grapes and strawberry samples with 10 or more residues increased from 42 in 2015 to 81 in 2016 and from 25 to 58, respectively, while the total number of samples tested remained almost unchanged. A potential, partial explanation for this fact is that in 2016 some EU countries faced a wet growing season for e.g. wine grape production.
Figure 56.
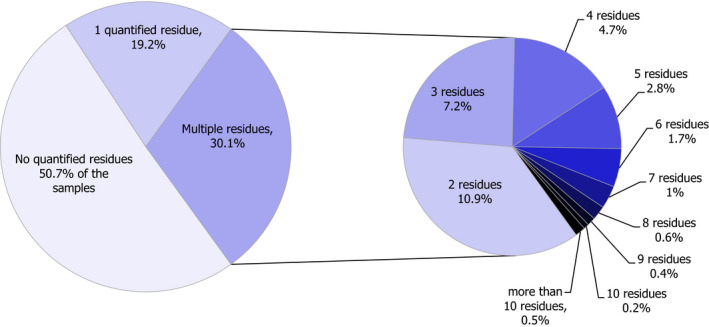
Percentage of samples with single and multiple quantified residues
Focussing on unprocessed food products with a substantial number of samples taken per food item (more than 30 samples analysed), the highest frequency of multiple residues was found in gooseberries (85.7% of the total samples analysed), hops (81.8%), grapefruits (73.1%), currants (72%), blackberries (68.4%), table grapes (68.1%), raspberries (66.9%) and strawberries (65.4%). These commodities were also identified in the 2015 monitoring programmes as unprocessed products with the highest frequency of multiple residues. In addition, lettuces, lemons, basil and edible flowers, limes, fresh herbs and edible flowers, cherries, rucola, peaches, bananas, oranges, mandarins, wine grapes, apricots, celeries, pears, celeriac, poppy seeds, chives, Brussels sprouts and peas (with pods) were found to contain multiple residues in more than 50% of the samples analysed. In Figure 57, the results for the top ranked food products with multiple residues are presented, broken down by the number of residues found in quantified concentrations; only food products with at least 30 samples analysed were included in the analysis.
Figure 57.
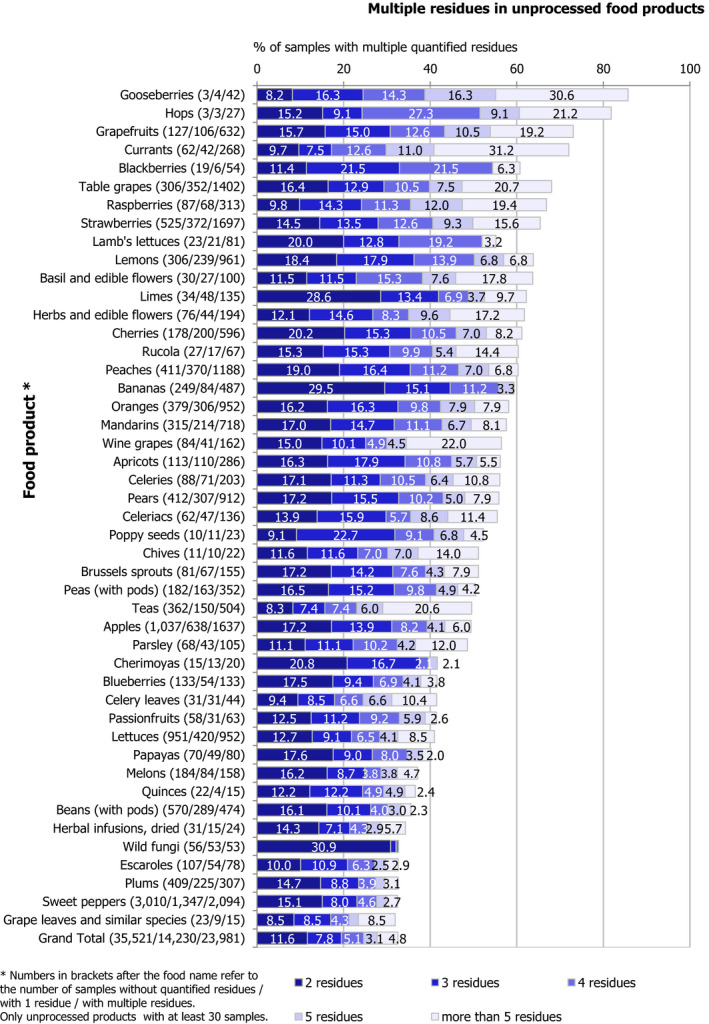
Unprocessed food products most frequently containing multiple quantified residues
A similar analysis was performed for processed food products (Figure 58). Among these products, the highest frequency of multiple residues was found for processed grape leaves and similar species, apricots, pineapples, pumpkin seeds, table grapes, teas, sweet peppers, oranges, wine grapes, tomatoes and wild fungi.
Figure 58.
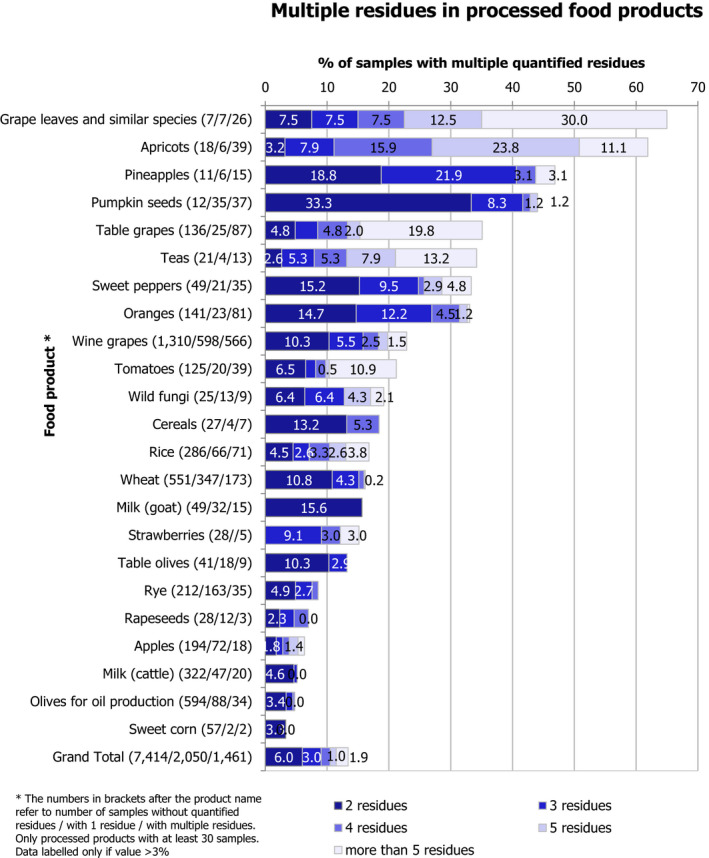
Processed food products most frequently containing multiple quantified residues
4.3. Reasons for MRL exceedances
The legal limits (MRLs) are established on the basis of the results of supervised residue trials that reflect the residue levels expected under field conditions. The MRL value is estimated using statistical methods and is usually established to cover at least the upper confidence interval of the 95th percentile of the expected residue distribution. Thus, a percentage of approximately 1% MRL exceedances are expected even if the approved Good Agricultural Practices (GAP) are fully respected. However, in such a case, the residue levels would be expected to exceed the MRLs only marginally.
In total, in 2016, 3,175 samples exceeded the MRL (3.8% of samples analysed). Multiple MRL exceedances per sample were reported for 525 samples (112 from EU/EEA origin, 387 from third countries, and 26 for samples of unknown origin). Overall, 4,173 individual determinations were reported to violate the EU legal limits in 2016. In comparison, 2.8% of the samples analysed and 3,170 determinations exceeded MRLs in 2015.
The possible reasons for MRL exceedances are below summarised:
-
For samples coming from third countries:
-
–
Use of pesticides that are not or no longer approved in the EU on crops for which no import tolerances have been requested by the importers, as foreseen in Article 6 of Regulation (EC) No 396/2005;
-
–
Use of pesticides that are approved in the EU, but on crops for which no import tolerances have been requested by the importers;
-
–
Contaminants with unclear origin in concentrations exceeding the legal limit (e.g. nicotine in cultivated and wild fungi and in tea, anthraquinone in tea, cardamom and wild fungi).
-
–
-
For samples originating from the reporting countries:
-
–
MRL exceedance due to natural background levels (e.g. dithiocarbamates in brassica vegetables, leeks and onions);
-
–
Presence of biocides that also fall under the pesticide legislation (Regulation (EU) No 528/201342) (e.g. BAC and DDAC in plant and animal products, including processed foods such as baby foods, as well as chlorate reported for the first time under the pesticide data collection – 202 MRL exceedances);
-
–
Changes in the toxicological reference values that lower the MRLs were the impact was not anticipated with time enough and the product was placed in the food chain. Further, if the lowering of the MRL were risk based with no transitional measures were granted and food pre‐treated could still be on the market (e.g. chlorpyrifos in different food items);
-
–
Use of approved pesticides but not in accordance with the Good Agricultural Practices, in particular, the use of plant protection products on crops for which no authorisation was granted or not respecting the application rate, the preharvest interval, the number of applications, or the method of application, e.g. dimethoate in various fruits and vegetables;
-
–
GAP not being respected (e.g. chlorpropham) or drift contamination;
-
–
Use of non approved pesticides (propargite – 17 exceedances);
-
–
Dual uses should be followed up in the case of fertiliser containing phosphonic acid so they are distinguished from the use of phosphonate/phosphite salts approved as a pesticide in the EU‐wide;
-
–
Environmental contamination: POPs included in the Stockholm Convention of prohibited substances (UNEP, 2001). These substances are no longer used as a pesticide but are very persistent in the environment and found in the food chain (e.g. dieldrin – 16 samples; heptachlor – 1 sample; DDT – 4 samples; chlordecone in roots and tuber vegetables from some French Antilles, due to soil contamination related to historical uses (chlordecone was banned in 1993 in the French Caribbean territories; mercury – 13 samples).
-
–
Out of 5,563 samples analysed in 2016 without any origin mentioned, the residue levels were exceeded for 213 samples (26 samples with multiple MRL exceedances).
More details on pesticide/crop combinations exceeding the legal limits are compiled in an Excel file published as supplement to this report (see ‘Supporting Information’).
5. Dietary exposure and dietary risk assessment
In the acute or short‐term exposure assessment, the uptake of pesticide residues via food consumed within a short period, usually within one meal or one day, is estimated. The chronic or long‐term exposure assessment aims to quantify the pesticide intake by consumers over a long period of time, predicting the lifetime exposure. A comparison of the estimated chronic and acute dietary exposure with the relevant toxicological reference values for long‐term and short‐term exposure (i.e. the acceptable daily intake (ADI) and the acute reference dose (ARfD)), gives an indication of whether consumers are exposed to pesticide residues that may pose a health risk. As long as the dietary exposure is lower than or equal to the toxicological reference values, based on current scientific knowledge, a consumer health risk can be excluded with a high probability. However, possible negative health outcomes cannot be fully excluded if the exposure exceeds the toxicological reference values.
EFSA calculated the short‐term exposure estimating the consumer health risks resulting from pesticide residues in and on food using a similar approach as in previous years (EFSA, 2013, 2014b, 2016c). For the long‐term dietary exposure, a more comprehensive approach was made, taking all food items for which consumption data was provided under PRIMo ver. 2 (see Section 5.2.1). For estimating the actual acute and chronic exposure to pesticide residues present in food that was analysed in monitoring programmes, EFSA used a deterministic risk assessment methodology. This method was originally developed for the risk assessment in the context of pesticide authorisations (EFSA PRIMo) (EFSA, 2007b). The model implements the principles of the WHO methodologies for short‐term and long‐term risk assessment (FAO, 2009), based on the food consumption of the European population. The calculations should be understood as a conservative risk assessment screening, meaning that the results are likely to overestimate the actual exposure.
The calculation tool (adapted version of EFSA PRIMo revision 2) used for the risk assessment screening is made available as a supplement to this report.
Results of cumulative risk assessments cannot yet be presented in the current report, as the scientific preparatory work is not yet completed (e.g. grouping of pesticides sharing a common target organ to derive cumulative assessment groups) (EFSA, 2013, 2016d). EFSA aims to finalise by the end of this year the description of the probabilistic exposure assessment methodology including practical implementation on two cumulative assessment groups (CAGs) at the EU level: on the thyroid (chronic methodology) and on the nervous system (acute methodology).43
5.1. Short‐term (acute) risk assessment – individual pesticides
5.1.1. Method
The methodology used to calculate the short‐term dietary exposure is described in detail in the 2010 European Union report on pesticide residues (EFSA, 2013a). The calculations were performed with assumptions which are likely to overestimate the actual exposure of European consumers (i.e. consumption of the concerned food products in high amounts without any industrial/household food processing that would reduce the residues level (e.g. cooking). Furthermore, it was assumed that the residue concentration in the consumed products was five to seven times higher than the residues measured in the samples analysed.44
The short‐term exposure assessments were performed for the food items addressed by the 2016 EU‐coordinated programme45 covering the 165 pesticides and the 11 food products: apples, head cabbage, leek, lettuce, peaches, strawberries, tomatoes, rye, wine, cow's milk and swine fat. The exposure was calculated considering 21,770 samples taken in the framework of the EUCP and national control programmes for the above‐mentioned food items. The food samples results accounted for both surveillance and more targeted sampling strategies. The highest residue level measured at or above the LOQ was identified for each single pesticide/crop combination and used in the acute exposure estimation.
For 33 pesticides of the 165 pesticides covered by the EUCP, the acute risk assessment was not relevant due to the toxicological properties of the active substance (i.e. pesticides for which a decision was taken that the setting of an ARfD was considered not necessary).
The short‐term (acute) consumer exposure was calculated using the following approach:
The short‐term exposure was calculated for all pesticide/crop combinations covered by the 2016 EU‐coordinated programme.46
For pesticide/crop combinations, where all reported results were below the LOQ, no acute exposure assessment was performed, assuming a no residue/no exposure situation.
The exposure calculation for the unprocessed plant products (apples, peaches, strawberries, tomatoes, head cabbage, lettuce, leek and rye) was based on the large portion food consumption implemented in the EFSA PRIMo (EFSA, 2007b).
For wine, the wine large portion of an adult consumption (instead of the children diet) was calculated from wine grapes to wine consumption by considering a wine yield factor of 0.7 (Robinson, 2006).47 In the case of wine, monitoring results from both red and white productions were combined. No clear trend on the residue levels measured in the two types of wine was observed.
In the 2016 EU‐coordinated programme, default PFs for rye flour and wine were specified to convert the measured residues back to rye grains and wine grapes, respectively. As the proposed PF for both food products was 1, no refinement using other processing factors was performed. The other 2016 EUCP crops were considered as been eaten raw and therefore no further refinement of the exposure was done.
The acute exposure was calculated using the highest concentration (HR) value reported to EFSA for each pesticide/crop combination. To retrieve the HR for rye, results from raw rye grains and rye flour48 were pooled. The HR was always identified for rye grains (unprocessed).
To pool all cows’ milk results, the residue levels reported on fat basis (mg/kg of milk fat) were recalculated to the whole milk basis (mg/kg of milk) assuming a 4% of fat content in the milk sample. The exposure was then calculated accounting for the large portion related to consumption of milk (cattle).
In the 2016 EUCP, the requested food product of animal origin to be monitored was swine fat. However, PRIMo rev. 2 has more robust consumption data on swine meat. Therefore, the monitoring concentration values reported on swine fat were recalculated to swine meat assuming a 20% of fat content on the meat. Then, the exposure was calculated accounting for the large portion related to consumption of swine meat.
The residue values reported according to the residue definition for enforcement (in accordance with the EU MRL legislation) were not recalculated to the residue definition for risk assessment, lacking a comprehensive list of conversion factors.
The estimated short‐term exposure for the pesticide/crop combination was compared with the toxicological reference value, usually the ARfD value. The recently established and modified ARfD/ADI values and ARfD values for active substances that were not covered by the previous EU‐coordinated programme are reported in Appendix D, Table D.1. The toxicological reference values for the remaining pesticides are unchanged and can be retrieved from Appendix D, Table D.1 of the 2013 EU report on pesticide residues (EFSA, 2015b), Appendix D, Table 20 of the 2014 EU report on pesticide residues (EFSA, 2016c) and Appendix D, Table D.1 of the 2015 EU report on pesticide residues (EFSA, 2017a).
Table D.1.
New toxicological reference values for compounds included in the 2016 EUCP, compared to the values reported in the 2015 EU report on pesticide residues in food (EFSA, 2017a–d)
| Pesticide | ADI (mg/kg bw per day) | Year | Source | ARfD (mg/kg bw) | Year | Source |
|---|---|---|---|---|---|---|
| Propargite | 0.03 | 2018 | EFSA | 0.06 | 2018 | EFSA |
| Iprodione | 0.02 | 2017 | EFSA | 0.06 | 2017 | EFSA |
| Mepanipyrim | 0.012 | 2017 | EFSA | 0.1 | 2017 | EFSA |
| Methoxyfenozide | 0.1 | 2017 | EFSA | 0.1 | 2017 | EFSA |
| Propiconazole | 0.04 | 2017 | EFSA | 0.1 | 2017 | EFSA |
| Trifloxystrobin | 0.1 | 2017 | EFSA | 0.5 | 2017 | EFSA |
ADI: acceptable daily intake; bw: body weight; ARfD: acute reference dose.
For six pesticides, the short‐term risk assessment has been performed using the ADI instead of the ARfD because these pesticides have not been evaluated with regard to the setting of the ARfD and/or the setting of the ARfD was not finalised. In four of these six active substances, quantified residues were reported at or above the LOQ (i.e. bromopropylate, chlordane, heptachlor and hexaconazole). The use of the ADI instead of the ARfD is an additional conservative element in the risk assessment.
It should be highlighted that some of the ARfD values were recently set, lowered or withdrawn and were not in place when the monitoring results were generated in 2016 (e.g. the ARfD for propargite,49 iprodione, mepanipyrim, methoxyfenozide, propiconazole and trifloxystrobin). Finally, in the case of further six pesticides, neither ARfD nor ADI has been derived and therefore no exposure assessment could be conducted (EPN, fenamidone,50 hexachlorobenzene, hexachlorocyclohexane (alpha), hexachlorocyclohexane (beta) and isocarbophos).
The legal residue definitions for fenvalerate, methomyl and triadimenol contained compounds with different toxicological profiles. To perform the acute risk assessment, it was assumed that the residue found consisted solely of the authorised active substance (i.e. esfenvalerate, methomyl and triadimenol).
The residue definition for dimethoate contains compounds with significantly different toxicological potencies (i.e. dimethoate and omethoate) (EFSA, 2006, 2010). In order to estimate the actual risk for consumers, the results that followed the legal residue definition (sum of dimethoate and omethoate, expressed as dimethoate) reported to EFSA were used to calculate two scenarios51:
Scenario 1 (‘optimistic dimethoate scenario’) where it is assumed that the determined residues are related only to the less toxic compound dimethoate; and
Scenario 2 (‘pessimistic omethoate scenario’), where the total residue concentration reported is assumed to refer only to the more toxic compound omethoate
Residues resulting from the use of dithiocarbamates are measured as CS2 by using a common moiety method for all the pesticides belonging to this group of chemicals. Some crops contain naturally occurring sulfur that mimic the presence of dithiocarbamates in the analytical method. Thus, the analytical methods used do not distinguish which active substances were originally applied on the crop or whether the residue is resulting from natural sources. Hence, an unambiguous risk assessment is not possible since pesticides falling in the class of dithiocarbamates have different toxicological properties. For dithiocarbamates, five scenarios were considered, assuming that the measured CS2 concentration refers exclusively to maneb, mancozeb, propineb, thiram or ziram.52
5.1.2. Results
In Figure 59, the results of the short‐term (acute) risk assessment are summarised. There:
Grey cells refer to pesticide/crop combinations not covered by the 2016 EUCP or to pesticides not relevant for acute risk assessment (setting of an ARfD was not necessary).
Empty, white cells in the grid refer to pesticide/crop combinations for which none of the samples analysed for the given food item contained quantified residues.
The cells marked with an asterisk refer to pesticide/crop combinations with quantified residues for which a risk assessment could not be performed lacking toxicological reference values.
For pesticide where an ARfD (or alternatively an ADI) was available and where at least one sample with quantified residues was reported, the exposure was calculated. The result reported in the graph refers to the sample containing the highest residue among all the samples analysed for the given pesticide/food combination. The calculated exposure is expressed as percentage of the ARfD (or ADI).
Pesticide/crop combinations where the calculated dietary exposure exceeded the ARfD are highlighted in red; more specifically, if the exposure was estimated at or between 100% and 1,000%, the cells are coloured in light red; if the exposure was estimated at or above 1,000%, the cells are filled with dark red; whereas for pesticide/crop combinations where the exposure was calculated to be below the toxicological reference values these are indicated in yellow.
Figure 59.
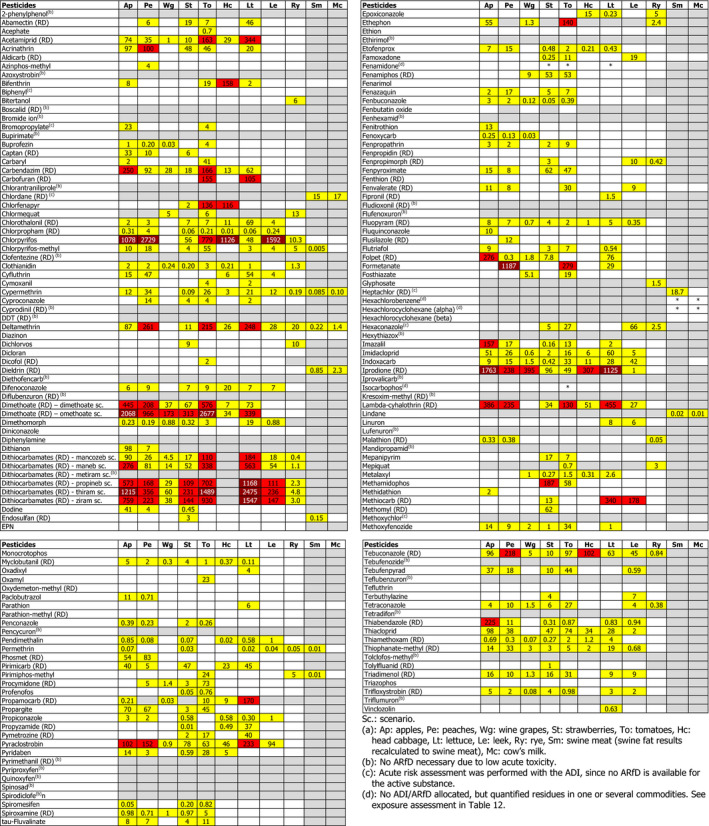
Results of short‐term (acute) dietary risk assessment (expressed as a percentage of the toxicological reference value)
Overall, 122 pesticides were assessed for acute exposure.
For 18 of the pesticides relevant for acute exposure assessments not a single quantified result at or above the LOQ was reported for any of the food products tested. Thus, for these pesticides the short‐term dietary exposure was considered to be of no concern for the food products covered by the EUCP: aldicarb, biphenyl, diazinon, dicloran, diniconazole, EPN, ethion, fenarimol, fenbutatin oxide, fenpropidin, fenthion, hexachlorocyclohexane (beta), methoxychlor, monocrotophos, oxydemeton‐methyl, parathion‐methyl, tefluthrin, triazophos.
For 89 pesticides, residues were quantified in one or several of the food products analysed, but the exposure was estimated to be below the toxicological reference values: abamectin, acephate, azinphos‐methyl, bitertanol, bromopropylate, buprofezin, captan, carbaryl, chlordane, chlormequat, chlorothalonil, chlorpropham, chlorpyrifos‐methyl, clothianidin, cyfluthrin, cymoxanil, cypermethrin, cyproconazole, dichlorvos, dicofol, dieldrin, difenoconazole, dimethomorph, dithianon, dodine, endosulfan, epoxiconazole, etofenprox, famoxadone, fenamiphos, fenazaquin, fenbuconazole, fenitrothion, fenoxycarb, fenpropathrin, fenpropimorph, fenpyroxiamte, fenvalerate, fipronil, fluopyram, fluquinconazole, flusilazole, flutriafol, fosthiazate, glyphosate, heptachlor, hexaconazole, imidacloprid, indoxacarb, lindane, linuron, malathion, mepanipyrim, mepiquat, metalaxyl, methidathion, methomyl, methoxyfenozide, myclobutanil, oxadixyl, oxamyl, paclobutrazol, parathion, penconazole, pendimethalin, permethrin, phosmet, pirimicarb, pirimiphos‐methyl, procymidone, profenofos, propargite, propiconazole, propyzamide, pymetrozine, pyridaben, spiromesifen, spiroxamine, tau‐fluvalinate, tebufenpyrad, terbuthylazine, tetraconazole, thiacloprid, thiamethoxam, thiophanate‐methyl, tolylfluanid, triadimenol, trifloxystrobin and vinclozolin.
For 33 pesticides, the screening for potential short‐term consumer risk was positive for at least one sample for one or several of the food products in focus, meaning that the estimated short‐term exposure exceeded the ARfD: acetamiprid, acrinathrin, bifenthrin, carbendazim, carbofuran, chlorfenapyr, chlorothalonil, chlorpyrifos, cyfluthrin, cypermethrin, deltamethrin, dithianon, ethephon, fenamiphos, fenpyroximate, folpet, formetanate, hexaconazole, imazalil, imidacloprid, indoxacarb, iprodione, lambda‐cyhalothrin, methamidophos, methiocarb, phosmet, pirimicarb, propamocarb, pyraclostrobin, tebuconazole, tebufenpyrad, thiabendazole and thiacloprid. In addition, the calculated exposure exceeded the toxicological reference values for one or several commodities in the five dithiocarbamates scenarios (mancozeb, maneb, propineb, thiram and ziram scenarios) as well as for both dimethoate scenarios.
For the remaining pesticides not above mentioned, no acute exposure was calculated, either because no ARfD was necessary due to its low acute toxicity or either no ARfD/ADI was allocated, even if quantified residues in one or several commodities were reported.
The detailed results of the short‐term dietary exposure assessment for the pesticide residues found in the 11 food products covered by the 2016 EU‐coordinated control programme are presented in Appendix D, Figures D.1–D.11. In these charts, the results for the samples containing residues at or above the LOQ are presented individually, expressing the exposure as percentage of the ARfD. The blue dots refer to results reported under the EU‐coordinated programme, whereas the orange dots refer to findings in samples that were analysed in the framework of the national control programmes. The figures in brackets next to the name of the pesticides represent the number of samples with residues below the LOQ, number of samples with quantified residues below or at the MRL, and the number of samples with residues above the MRL (the asterisk in the graphs’ labels indicates that the MRL changed during the 2016 monitoring year). The different dithiocarbamate scenarios have not been represented in Appendix D – neither omethoate scenario.52
Figure D.1.
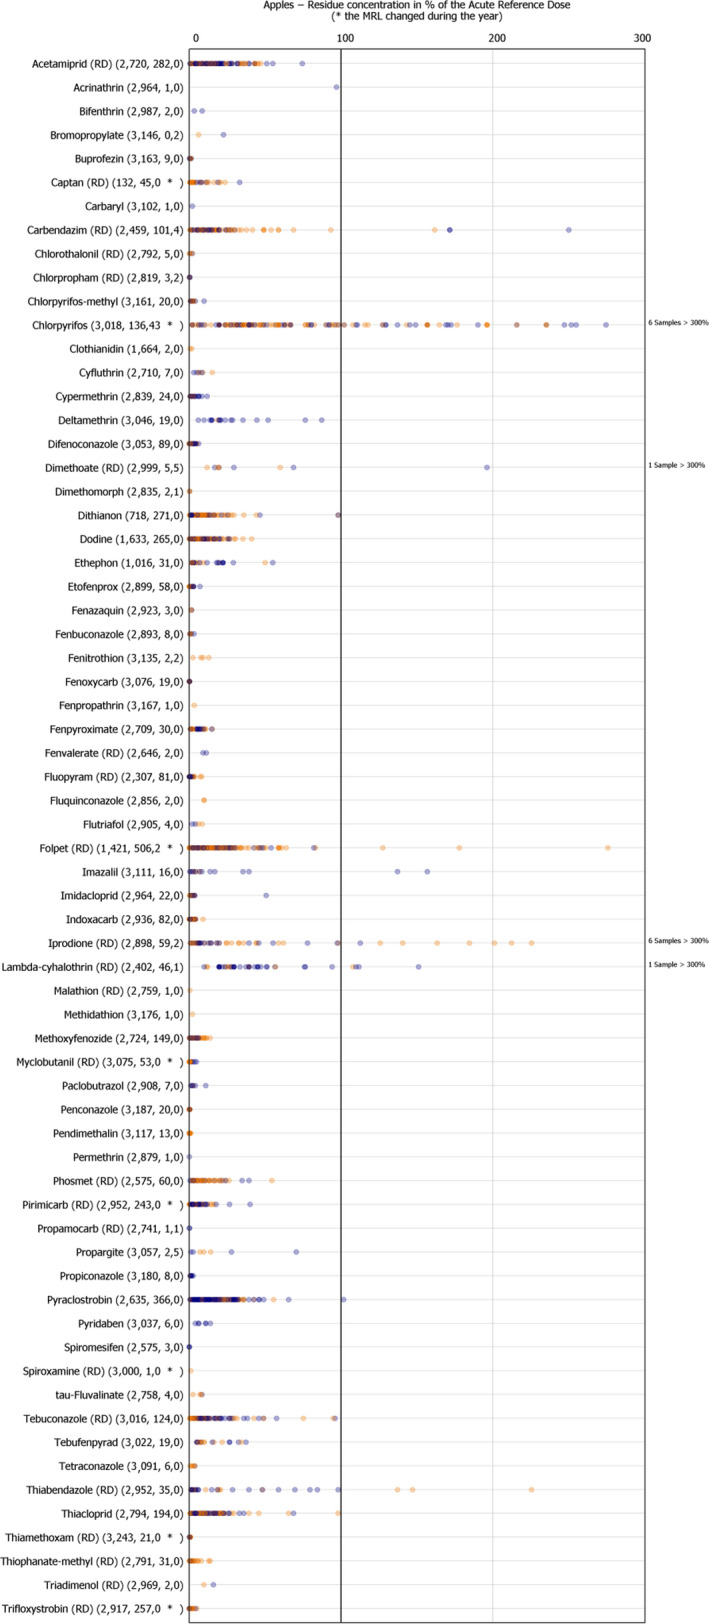
Short‐term dietary exposure assessment – apples
Figure D.11.
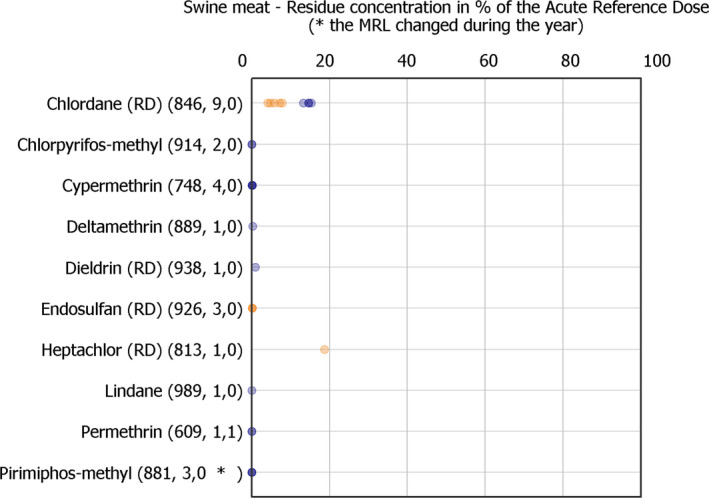
Short‐term dietary exposure assessment – swine fat (recalculated to swine meat)
Overall, 209 samples were calculated to exceed the ARfD in the exposure assessment screening for one or more quantified pesticide residues.53 Out of these, 82 samples were also found to exceed the MRL.
The highest number of cases with exceedances of the ARfD was identified for apples (76 samples), followed by lettuce (46 samples), peaches (39 samples) and tomatoes (29 samples), then, leeks (eight samples), strawberries (one sample54) and wine (one sample). For rye, swine meat and cow's milk no results exceeding the toxicological threshold were observed.
From the pesticide perspective, the highest number of exceedance of the ARfD was related to chlorpyrifos residues for a total of 68 samples (45 in apples, 11 in peaches, 7 in leeks, 3 in tomatoes and 2 in head cabbage). It should be highlighted that following the lowering of the ARfD for chlorpyrifos in 2014, the legal limits were lowered in 2016, which became applicable from August 2016.55
A substantial number of exceedances of the ARfD were also identified for iprodione for a total of 49 samples (in 25 samples of lettuce, 14 samples of apples, 8 samples of peaches, one sample of head cabbage and one sample of wine). It should be noted that recently a decision was taken at the EU level, not to renew the approval for iprodione.56 Furthermore, EFSA was requested to provide recommendation for the possible setting of transitional measures for lowering of the MRLs regarding iprodione in a Technical Report (EFSA, 2018b). The revision of the current MRLs is on‐going.
In 18 samples, the ARfD of lambda‐cyhalothrin was exceeded (5 apple samples, 5 peach samples, 5 tomato samples and 5 lettuce samples). The lowering of the existing MRLs is also on‐going after new toxicological reference values for gamma‐cyhalothrin were derived (EFSA, 2017c) and after the MRLs were revised (EFSA, 2015d).
In all the different dithiocarbamate scenarios, the estimated exposure exceeded the ARfD for more than one commodity. In the cases of propineb, thiram and ziram, six of the 2016 EUCP commodities exceeded the ARfD. As previously indicated, it is not possible to conclude which active substance was used on the crop. For leek, the occurrence of CS2 is most likely resulting from naturally occurring substances. In previous years, EFSA recommended to develop analytical methods that allow the differentiation of the dithiocarbamate really applied in the field and to derive the background levels of CS2 of the untreated food products. For this last point, activities have been started to build a database collecting data on background CS2 residue levels.
In the case of dimethoate – scenario dimethoate52 – 14 samples accounted for more than 100% of the ARfD (9 samples of tomatoes, 3 samples of peaches and 2 samples of apples). Additionally, a residue of dimethoate in a strawberry sample only exceeded the ARfD in the omethoate scenario.
Deltamethrin exceeded the ARfD in 12 samples (5 samples of peaches, 4 samples of lettuce and 3 samples of tomatoes).
For each of the remaining 15 active substances with exposure for acute exposure, less than 10 samples contained residues exceeding the ARfD: acetamiprid, pyraclostrobin, tebuconazole, carbendazim, methiocarb, thiabendazole, formetanate, imazalil, chlorfenapyr, ethephon, carbofuran, propamocarb, acrinathrin, bifenthrin and methamidophos.
It should be stressed again that the results of the acute exposure assessment reflect the outcome of a conservative screening for risks. Furthermore, the exposure calculations were performed without taking into account that the residues expected in the food consumed after peeling, processing or washing might be significantly lower. For many pesticides, usual consumer practices like washing are reducing the residue concentrations significantly. Other practices, like peeling (apples), removal of outer leaves (head cabbage, leeks) cooking and baking (tomatoes, head cabbage, leeks, rye) are further reducing the residue concentrations in the consumed food. Given the conservatism of the calculations and the frequency of exceedances of the ARfD, EFSA concludes that the probability of being exposed to pesticide residues exceeding concentrations that may lead to negative health effects was low.
For four pesticides (fenamidone,51 hexachlorobenzene, hexachlorocyclohexane (alpha) and isocarbophos), residues were present in quantified concentrations, but due to the absence of toxicological reference values no short‐term dietary exposure assessment could be carried out. None of these pesticides are authorised in the EU. The estimated short‐term exposure to these pesticides, using the food consumption data of EFSA PRIMo rev. 2 is presented in Table 12.
Table 12.
Estimated short‐term exposure to active substances without ARfD/ADI values
| Pesticide | Food product | Short‐term exposure (in μg/kg bw) |
|---|---|---|
| Fenamidone |
Strawberries Tomatoes Lettuce |
0.06 1.39 2.21 |
| Hexachlorobenzene |
Swine meat Cow's milk |
0.02 0.01 |
| Hexachlorocyclohexane (alpha) |
Swine meat Cow's milk |
0.03 0.04 |
| Isocarbophos | Tomatoes | 0.11 |
bw: body weight.
Considering the above results, EFSA recommends to continue monitoring the residues of chlorpyrifos, iprodione, lambda‐cyhalothrin and dimethoate/omethoate. In addition, it is recommended to investigate what data might be available to set toxicological reference values for fenamidone, hexachlorobenzene, hexachlorocyclohexane (alpha) and isocarbophos and to follow‐up on the CS2 issue.
5.2. Long‐term (chronic) risk assessment – individual pesticides
5.2.1. Method
The chronic or long‐term dietary exposure assessment estimates the expected exposure of an individual consumer over a long period, predicting the lifetime exposure to pesticide residues in the diet. The underlying model assumptions for the long‐term risk assessment are explained in detail in the 2010 and 2011 EU reports on pesticide residues (EFSA, 2013, 2014a,b).
A new approach for estimating the chronic exposure was used, including all food products in the exposure calculation. In the previous years, the long‐term exposure was calculated based on the residue concentrations found in the food commodities covered by the 3‐years’ cycle of the EU coordinated programmes (around 30 commodities). Thus, the 2016 exposure calculations are more comprehensive compared to the previous years.
On the basis of the 2016 pesticide monitoring results, EFSA calculated two long‐term risk assessment scenarios that are here referred to as adjusted upper‐bound and lower‐bound approaches.57 The adjusted upper‐bound exposure assessment methodology should be considered as a conservative screening, which is likely to overestimate the real risk as for samples without quantifiable residues it was assumed that residues were present at the numerical level of the LOQ. The lower‐bound approach is based on assumptions that may underestimate the exposure to a certain extent, since it postulates that samples with residues reported as below the LOQ are completely free of the pertinent pesticide. However, the lower‐bound calculations are useful to complement the upper‐bound exposure assessments in order to better understand the uncertainties of the exposure assessment resulting from the samples without quantified residues (residues below the LOQ).
To conduct the upper‐bound and lower‐bound scenarios, the residue levels used as input values for the chronic exposure were derived according to the following approaches:
For each pesticide/crop combination, an overall mean residue concentration was calculated.
In the adjusted upper‐bound approach, the calculation of the overall mean residue for a given pesticide/crop combination was performed assuming that the residue levels reported below the LOQ contained residues corresponding to the numerical value of the LOQ.58 If no positive findings were reported for any of the samples analysed for a given pesticide/crop combination (i.e. all results were reported as below the LOQ), the contribution of these crops to the total dietary intake was not considered, assuming a ‘no use/no residue’ situation.
In the lower‐bound scenario, the results below the LOQ were numerically replaced by zero values, assuming that the pesticide was not present in the sample.
Only results for unprocessed products were used for the exposure calculation.
The mean residue concentration was calculated for the pesticides in the 2016 EUCP and for all the food products covered by Annex 1 of Regulation (EC) No 396/2005 for which consumption data are inputted in the PRIMo tool.
For fat‐soluble pesticides reported in milk and eggs samples where the results were expressed on a fat basis, the residue levels have been recalculated to the whole product by assuming a default fat content of 4% in milk and a 10% in eggs. This approach has only been implemented in case of results reported at or above the LOQ (positive quantifications).
Results concerning samples analysed with analytical methods for which the LOQ was greater than the corresponding MRL were disregarded.
The residue values reported according to the residue definition for enforcement (in accordance with the EU MRL legislation) were not recalculated to the residue definition for risk assessment, lacking a comprehensive list of conversion factors.
The toxicological reference values (ADI) used for the risk assessment are reported in Appendix D – Table D.1, and in the respective Appendices of the 2013, 2014 and 2015 EU report on pesticide residues (EFSA, 2015b, 2016c, 2017).
The residue definitions for fenvalerate, methomyl and triadimenol contain compounds with different toxicities. To perform the chronic risk assessment, it was assumed that the residues found are related to the presence of the authorised substance only (esfenvalerate, methomyl and triadimenol, respectively).
For dimethoate, EFSA calculated two scenarios52: the optimistic dimethoate scenario where it was assumed that the calculated mean residue concentrations in each food item are related only to the less toxic component of the legal residue definition, i.e. dimethoate; in the pessimistic omethoate scenario the total residue concentration reported was assumed to refer only to the more toxic compound (i.e. omethoate).
For dithiocarbamates, six scenarios were calculated, assuming that the measured CS2 concentration referred exclusively to maneb, mancozeb, metiram, propineb, thiram or ziram.
5.2.2. Results
The results for the long‐term dietary exposure assessment for each pesticide (upper‐bound and lower‐bound scenarios) are reported in Table 13. The calculated exposure was expressed as percentage of the ADI.
Table 13.
Results of long‐term dietary risk assessment
| Pesticide | Long‐term exposure (in % of ADI) | |
|---|---|---|
| Ad. upper‐bound | Lower‐bound | |
| 2‐phenylphenol | 0.30 | 0.22 |
| Abamectin (RD) | 3.6 | 0.02 |
| Acephate | 0.22 | 0.01 |
| Acetamiprid (RD) | 1.2 | 0.31 |
| Acrinathrin | 2.6 | 0.17 |
| Aldicarb (RD) | n.r. | |
| Azinphos‐methyl | 0.15 | 0.00004 |
| Azoxystrobin | 0.23 | 0.06 |
| Bifenthrin | 1.8 | 0.11 |
| Biphenyl | 0.03 | 0.02 |
| Bitertanol | 1.7 | 0.05 |
| Boscalid (RD) | 1.7 | 0.98 |
| Bromide ion* | Quantified residues in one or several commodities | |
| Bromopropylate | 0.52 | 0.001 |
| Bupirimate | 0.40 | 0.02 |
| Buprofezin | 2.8 | 0.20 |
| Captan (RD) | 0.85 | 0.69 |
| Carbaryl | 2.7 | 0.005 |
| Carbendazim (RD) | 1.6 | 0.22 |
| Carbofuran (RD) | 27.5 | 1.1 |
| Chlorantraniliprole | 0.02 | 0.003 |
| Chlordane (RD) | 34.1 | 0.07 |
| Chlorfenapyr | 0.68 | 0.06 |
| Chlormequat | 2.4 | 2.0 |
| Chlorothalonil (RD) | 2.4 | 0.19 |
| Chlorpropham (RD) | 3.7 | 3.3 |
| Chlorpyrifos | 45.8 | 12.6 |
| Chlorpyrifos‐methyl | 3.6 | 0.77 |
| Clofentezine (RD) | 0.98 | 0.01 |
| Clothianidin | 0.27 | 0.002 |
| Cyfluthrin | 9.4 | 0.05 |
| Cymoxanil | 0.38 | 0.002 |
| Cypermethrin | 1.4 | 0.18 |
| Cyproconazole | 0.59 | 0.004 |
| Cyprodinil (RD) | 1.7 | 0.69 |
| DDT (RD) | 9.5 | 0.07 |
| Deltamethrin | 7.1 | 1.0 |
| Diazinon | 22.2 | 0.89 |
| Dichlorvos | 145 | 2.8 |
| Dicloran | 1.5 | 0.61 |
| Dicofol (RD) | 2.9 | 0.01 |
| Dieldrin (RD) | 518 | 1.6 |
| Diethofencarb | 0.01 | 0.00002 |
| Difenoconazole | 3.3 | 0.36 |
| Diflubenzuron (RD) | 0.18 | 0.0006 |
| Dimethoate (RD) – dimethoate sc. | 32.7 | 2.0 |
| Dimethoate (RD) – omethoate sc. | 101 | 6.1 |
| Dimethomorph | 0.66 | 0.16 |
| Diniconazole | 0.15 | 0.0003 |
| Diphenylamine | 0.29 | 0.04 |
| Dithianon | 4.7 | 2.6 |
| Dithiocarbamates (RD) – mancozeb sc. | 10.9 | 2.7 |
| Dithiocarbamates (RD) – maneb sc. | 10.5 | 2.6 |
| Dithiocarbamates (RD) – metiram sc. | 72.6 | 17.8 |
| Dithiocarbamates (RD) – propineb sc. | 76.1 | 18.6 |
| Dithiocarbamates (RD) – thiram sc. | 30.4 | 7.5 |
| Dithiocarbamates (RD) – ziram sc. | 101 | 24.9 |
| Dodine | 0.25 | 0.10 |
| Endosulfan (RD) | 0.90 | 0.01 |
| EPN* | n.r. | |
| Epoxiconazole | 1.3 | 0.02 |
| Ethephon | 3.0 | 0.58 |
| Ethion | 0.82 | 0.01 |
| Ethirimol | 0.46 | 0.01 |
| Etofenprox | 0.96 | 0.17 |
| Famoxadone | 1.5 | 0.05 |
| Fenamidone* | Quantified residues in one or several commodities | |
| Fenamiphos (RD) | 6.6 | 0.07 |
| Fenarimol | 0.48 | 0.0001 |
| Fenazaquin | 4.0 | 0.02 |
| Fenbuconazole | 3.8 | 0.08 |
| Fenbutatin oxide | 0.36 | 0.05 |
| Fenhexamid | 0.25 | 0.21 |
| Fenitrothion | 3.4 | 0.01 |
| Fenoxycarb | 0.33 | 0.004 |
| Fenpropathrin | 0.71 | 0.01 |
| Fenpropidin (RD) | 0.48 | 0.004 |
| Fenpropimorph (RD) | 3.0 | 0.10 |
| Fenpyroximate | 2.3 | 0.04 |
| Fenthion (RD) | 0.06 | 0.0001 |
| Fenvalerate (RD) | 1.4 | 0.01 |
| Fipronil (RD) | 44.9 | 0.23 |
| Fludioxonil (RD) | 0.35 | 0.30 |
| Flufenoxuron | 0.41 | 0.001 |
| Fluopyram (RD) | 2.1 | 0.64 |
| Fluquinconazole | 11.0 | 0.02 |
| Flusilazole (RD) | 1.6 | 0.01 |
| Flutriafol | 2.5 | 0.02 |
| Folpet (RD) | 0.95 | 0.69 |
| Formetanate | 1.4 | 0.04 |
| Fosthiazate | 3.8 | 0.04 |
| Glyphosate | 0.33 | 0.14 |
| Heptachlor (RD) | 8.5 | 0.02 |
| Hexachlorobenzene* | Quantified residues in one or several commodities | |
| Hexachlorocyclohexane (alpha)* | Quantified residues in one or several commodities | |
| Hexachlorocyclohexane (beta)* | Quantified residues in one or several commodities | |
| Hexaconazole | 1.8 | 0.04 |
| Hexythiazox | 0.85 | 0.02 |
| Imazalil | 17.4 | 16.3 |
| Imidacloprid | 0.65 | 0.06 |
| Indoxacarb | 4.2 | 0.26 |
| Iprodione (RD) | 3.5 | 1.5 |
| Iprovalicarb | 0.54 | 0.18 |
| Isocarbophos* | Quantified residues in one or several commodities | |
| Kresoxim‐methyl (RD) | 0.05 | 0.001 |
| Lambda‐cyhalothrin (RD) | 11.0 | 0.72 |
| Lindane | 4.4 | 0.003 |
| Linuron | 1.7 | 0.26 |
| Lufenuron | 1.4 | 0.005 |
| Malathion (RD) | 0.80 | 0.01 |
| Mandipropamid | 0.08 | 0.01 |
| Mepanipyrim | 0.32 | 0.04 |
| Mepiquat | 0.17 | 0.05 |
| Metalaxyl | 0.22 | 0.03 |
| Methamidophos | 4.9 | 0.09 |
| Methidathion | 18.6 | 0.07 |
| Methiocarb (RD) | 0.48 | 0.03 |
| Methomyl (RD) | 1.3 | 0.26 |
| Methoxychlor | 0.02 | 0.00002 |
| Methoxyfenozide | 0.23 | 0.03 |
| Monocrotophos | 1.7 | 0.03 |
| Myclobutanil (RD) | 1.4 | 0.13 |
| Oxadixyl | 0.07 | 0.0002 |
| Oxamyl | 4.3 | 0.40 |
| Oxydemeton‐methyl (RD) | 0.09 | 0.0001 |
| Paclobutrazol | 0.59 | 0.005 |
| Parathion | 1.7 | 0.002 |
| Parathion‐methyl (RD) | n.r. | |
| Penconazole | 0.63 | 0.02 |
| Pencycuron | 0.04 | 0.004 |
| Pendimethalin | 0.23 | 0.002 |
| Permethrin | 0.49 | 0.01 |
| Phosmet (RD) | 2.9 | 0.24 |
| Pirimicarb (RD) | 0.64 | 0.10 |
| Pirimiphos‐methyl | 17.3 | 12.7 |
| Procymidone (RD) | 3.4 | 0.02 |
| Profenofos | 0.25 | 0.04 |
| Propamocarb (RD) | 0.19 | 0.13 |
| Propargite | 0.84 | 0.02 |
| Propiconazole | 1.2 | 0.59 |
| Propyzamide (RD) | 0.04 | 0.002 |
| Pymetrozine (RD) | 0.25 | 0.02 |
| Pyraclostrobin | 1.0 | 0.31 |
| Pyridaben | 2.3 | 0.05 |
| Pyrimethanil (RD) | 1.1 | 0.92 |
| Pyriproxyfen | 0.23 | 0.01 |
| Quinoxyfen | 0.08 | 0.01 |
| Spinosad | 0.93 | 0.11 |
| Spirodiclofen | 1.4 | 0.14 |
| Spiromesifen | 0.64 | 0.05 |
| Spiroxamine (RD) | 0.68 | 0.04 |
| tau‐Fluvalinate | 5.1 | 0.04 |
| Tebuconazole (RD) | 1.4 | 0.23 |
| Tebufenozide | 1.2 | 0.07 |
| Tebufenpyrad | 2.7 | 0.07 |
| Teflubenzuron | 2.0 | 0.01 |
| Tefluthrin | 0.69 | 0.02 |
| Terbuthylazine | 2.5 | 0.01 |
| Tetraconazole | 6.7 | 0.14 |
| Tetradifon | 0.33 | 0.0001 |
| Thiabendazole (RD) | 1.9 | 1.8 |
| Thiacloprid | 2.6 | 0.40 |
| Thiamethoxam (RD) | 1.1 | 0.03 |
| Thiophanate‐methyl (RD) | 0.46 | 0.02 |
| Tolclofos‐methyl | 0.11 | 0.002 |
| Tolylfluanid (RD) | 0.01 | 0.0001 |
| Triadimenol (RD) | 0.66 | 0.07 |
| Triazophos | 2.3 | 0.34 |
| Trifloxystrobin (RD) | 0.28 | 0.05 |
| Triflumuron | 1.1 | 0.03 |
| Vinclozolin | 0.13 | 0.01 |
sc.: scenario; ADI: acceptable daily intake; RD: residue definition; n.r.: No quantified residues in any of the samples analysed.
* Active substance for which no ADI was established.
In the adjusted upper‐bound scenario of the exposure calculation, the long‐term exposure amounted to less than 100% of the ADI for all pesticides except for dieldrin, dichlorvos, dimethoate (omethoate scenario) and the dithiocarbamates (ziram scenario, being ziram the dithiocarbamate with the highest chronic toxicity). For the majority of pesticides considered, a wide safety margin to the toxicological reference value was observed; in fact, for 142 pesticides/scenarios the estimated long‐term exposure was less than 10% of the ADI, for 73 thereof the result was lower than 1% of the ADI. Therefore, EFSA could conclude that for these pesticides, according to the current scientific knowledge, no long‐term consumer health risk is expected.
In the lower‐bound scenario, for none of the substances, the estimated exposure exceeded ADI.
For dieldrin, the estimated long‐term exposure reached 518% of the ADI in the adjusted upper‐bound scenario. The major food contributor to the total long‐term exposure was milk. Potatoes, carrots, cucumbers and bovine meat also contributed to the total exposure, but to a minor extent. Dieldrin was analysed in 56,024 samples, of which quantifiable residues were reported in 79 samples (0.14% of the total samples). In the lower‐bound scenario, the result was significantly lower (i.e. only 1.6% of the ADI was exhausted), giving an indication that the result in the adjusted upper‐bound scenario was mainly driven by LOQ values used to calculate the mean residue concentrations in each food item tested for dieldrin; this substance is not approved in the EU, and the positive findings mostly come from the persistence of the substance in the environment and the following residues’ uptake of the animals through their diet.
For dichlorvos, the mean estimated long‐term exposure reached 145% of the ADI in the upper‐bound scenario. The major food contributors to the total long‐term exposure were identified in wheat and rye, and – to a minor extent – in strawberries. Among all the 63,677 samples considered for the long‐term exposure assessment that were analysed for dichlorvos residues, quantified residues of dichlorvos were found in only nine samples (0.01%). In the lower‐bound scenario, the estimated exposure was significantly lower (i.e. 2.8% of the ADI), giving an indication that the result in the adjusted upper bound scenario was mainly driven by LOQ values used to calculate the mean residue concentration.
For dimethoate – omethoate scenario, the mean estimated long‐term exposure reached 101% of the ADI in the upper‐bound scenario. The major food contributors to the total long‐term exposure were apples (39%), wheat (13.5%) and oranges (12.7%). In the lower‐bound scenario, the result was lower (i.e. 6.1% of the ADI); also in this case, the upper‐bound exposure scenario was mainly driven by LOQ values used to derive the mean residue level for each of the food item tested for dimethoate. However, it has to be considered that the residues for omethoate scenario were derived by converting the residue levels expressed as dimethoate into omethoate. Dimethoate (RD) was analysed in 61,811 samples. Thereof, 354 samples had quantifiable residues (0.57%).
For dithiocarbamate – ziram scenario, the mean estimated long‐term exposure reached 101% of the ADI in the adjusted upper‐bound scenario. The major contributors to the total long‐term exposure were apples (32%), oranges (18.7%) and wheat (16.7%). Excluding the food products that are likely to give false positive CS2 results (i.e. Brassicaceae and Alliaceae), the exposure in the ziram scenario was found to be below the ADI (99%). In the lower‐bound scenario, the result was significantly lower (i.e. 24.9% of the ADI), and presumably mainly driven by LOQ values reported and used to calculate the mean residue input value. A total number of 11,467 samples were analysed for dithiocarbamates; in 1,709 samples quantifiable results were reported (15%).
In general, the estimated exposure was significantly lower in the lower‐bound scenario compared to the upper‐bound approach, which gives an indication on the high conservatism of the risk assessment methodology used. For pesticides with a significant difference between the upper‐bound and lower‐bound scenarios, the calculated exposure in the upper‐bound scenario was mainly driven by results at the LOQ. For those substances for which the difference was not so significant (e.g. fenhexamid, fludioxonil, propamocarb and thiabendazole), the mean was derived from frequently positive findings above the LOQ and low LOQ values derived with sensitive analytical methods.
For three pesticides covered by the 2016 EUCP, no quantifiable residues were reported among all food items tested for this substance (aldicarb, EPN and parathion‐methyl).59
For six pesticides (bromide ion, fenamidone, hexachlorobenzene, hexachlorocyclohexane (alpha), hexachlorocyclohexane (beta) and isocarbophos), residues were quantified in food but no long‐term dietary risk assessment could be performed; in fact, for these substances no internationally agreed toxicological reference values are available. None of these pesticides is currently approved in Europe, but residues may be present in food due to either their presence and/or persistence in the environment or due to their use in third countries. The estimated exposure to these pesticides, using the food consumption data of EFSA PRIMo rev. 2, was low (see Table 14).
Table 14.
Results of long‐term exposure assessment for active substances without ADI values
| Pesticide | Long‐term exposure (in μg/kg bw per day) | |
|---|---|---|
| Upper‐bound approach | Lower‐bound approach | |
| Bromide ion | 8.7 | 1.1 |
| Fenamidone52 | 0.01 | 0.0002 |
| Hexachlorobenzene | 0.03 | 0.00003 |
| Hexachlorocyclohexane (alpha) | 0.03 | 0.00003 |
| Hexachlorocyclohexane (beta) | 0.002 | 0.00002 |
| Isocarbophos | 0.003 | 0.00003 |
bw: body weight.
Regarding this year assessment and taking into consideration all food items for which consumption data are provided in PRIMo, it is shown that those items covered by the 3‐years cycle of the EUCP are the higher contributors to the overall dietary exposure of the EU citizens.
Overall, EFSA concludes that based on the results of the 2016 pesticide monitoring programmes (EUCP and NP), the long‐term dietary exposure to the pesticides covered by the 2016 EUCP and for which toxicological data are available, was unlikely to pose a health risk to consumers.
6. Conclusions and recommendations
Compared to 2015, in 2016 the number of samples analysed by reporting countries for pesticide residues has slightly increased. As regards to overall MRL exceedance rate, EFSA noted an increase (in the frame of the EUCP the rate increased from 0.9% in 2013 to 1.7%, whereas in the national programme the increase was from 2.8% in 2015 to 3.8% in 2016). This has to be seen in an overall context and can be explained by some very specific issues arising in 2016 that have contributed to this result, demonstrating the importance and effect that targeted controls can have on detecting MRL exceedances, in particular also in connection with preceding legal changes towards lower MRLs (e.g. chlorpyrifos). At the same time, the percentage of samples with residues below the LOQ remained stable in the EUCP (from 52.8% in 2013 to 52.3% in 2016), demonstrating that the overall situation remained stable compared to previous years. In the EUCP, the increased number of MRL exceedances mainly concerns chlorpyrifos in samples of lettuces, peaches and head cabbage as well as dimethoate in tomatoes. As regards chlorpyrifos, MRLs were lowered to the limit of quantification for many commodities in 2016 following an EFSA reasoned opinion. The MRL exceedances may be the result of delayed responses from food business operators to this change of the legal situation. As regards the exceedances of dimethoate MRLs, the intensified controls in France of tomatoes produced in the Mayotte oversea territory is considered to be the main reason. In addition, a number of MRL exceedances were reported for non‐approved substances in domestically produced samples in the EU. Considering the results of the national control programmes, the increase in the MRL exceedance rate was mainly attributed to residues of chlorate, which have been reported to EFSA for the first time under the pesticide residue monitoring data collection following the start of discussions triggered by the European Commission on amended MRLs.
The results of the monitoring programmes are a valuable source of information to estimate the dietary exposure of EU consumers to pesticide residues. As in previous years, EFSA performed the acute (short‐term) dietary risk assessment for the pesticide/food product combinations covered by the EUCP. With the deterministic models currently used for this purpose, exceedances of the acute reference dose have been identified for a number of food/pesticide combinations. In the future, the use of probabilistic models for acute dietary exposure assessment along with the use of food processing factors would allow more realistic exposure estimates. Overall, 122 pesticides were assessed for acute exposure with a deterministic approach. EFSA concluded that the probability of being exposed to pesticide residues exceeding concentrations that may lead to negative health effects is low.
The long‐term (chronic) exposure was calculated, taking into account all unprocessed food products for which residue data on the pesticides covered by the EUCP were reported. Overall, the estimated exposure was well below the ADI in most of the calculated scenarios. Therefore, EFSA concluded that according to the current scientific knowledge, the long‐term dietary exposure to pesticides covered by the 2016 EUCP was unlikely to pose a health risk to consumers.
On the basis of the 2016 pesticide monitoring findings, EFSA recommends the following:
In the framework of the EUCP, two Member States (Hungary and Bulgaria) failed to submit results for the minimum number of samples as requested in the 2016 monitoring regulation. The countries concerned should provide further clarification as to why they did not comply with the requirements of the regulation.
-
A number of non‐approved substances were found repeatedly in samples produced in the EU, in some cases exceeding the legal limit, e.g.
-
–
apples: carbendazim, diphenylamine and propargite;
-
–
strawberries: propargite, hexaconazole, dicofol, dichlorvos and carbendazim;
-
–
lettuce: linuron;
-
–
peaches: propargite and carbendazim;
-
–
tomatoes: procymidone, carbaryl, chlorfenapyr, dicofol, hexaconazole, fenpropathrin and propargite;
-
–
Since these results give an indication of possible misuses of non‐approved active substances, Member States should follow‐up on these findings, investigating the reasons and take corrective measures where appropriate.
Following the revision of the toxicological reference values for chlorpyrifos, EU MRLs were lowered in August 2016 to the LOQ for several commodities. It was noted that a high number of samples produced in the EU and third countries was found with residues of chlorpyrifos exceeding the lowered legal limits after that date. Investigations of the reasons for this are recommended.
In total, 1,131 honey samples were analysed. In 20.1% of these samples, residues were detected, while 1.7% exceeded the legal limits. Since honey is a very minor contributor to exposure, EFSA recommends the analysis of honey samples by Member States to be done under their national programmes, keeping the analytical scope as wide as possible, taking into account the fact that unexpected residues were found in honey in the 2016 monitoring.
Pesticides were also found occasionally in organic food that are not permitted in this type of products, such as chlorpyrifos, thiacloprid, imidacloprid, iprodione, tebuconazole, acetamiprid, carbendazim, glyphosate. Member States should try to elucidate the reasons for these findings.
There are indications of chlormequat used in wine grapes. Although no MRL exceedances were noted so far for wine produced in the EU, Member States should be aware of these findings and should include chlormequat in the analytical scope for their analyses of wine grapes and wine samples. It should be born in mind that due to the persistent nature of chlormequat, the substance can remain in some plants years after its use.
The detailed analysis of national control programmes revealed some unexpected results, e.g. the finding of nicotine residues in spinach, lettuce and chard, residues of ethephon in currants, or residues of mepiquat in apples. Member States are made aware of these findings and are invited to include the pesticide/crop combinations in their national control programmes and – in case of positive detections – to investigate the reasons.
A high frequency of MRL exceedances for anthraquinone in tea was identified; the highest residues amounted to up to 0.37 mg/kg while the MRL is set at the LOQ of 0.02 mg/kg. Measures in tea producing countries are needed to fully investigate the causes and to implement best practices in tea production.
Considering that the residues of three pesticides (i.e. aldicarb, EPN and parathion‐methyl), which are currently included in the EUCP, were not quantified in any of the samples analysed, risk managers may consider to take them out of the mandatory testing in the framework of the EU‐coordinated programme. Instead, it might be sufficient to test samples taken under the national programmes.
EFSA reiterated its previous recommendation to develop analytical methods that allow the differentiation of the actual dithiocarbamate applied in the field as well as to distinguish the contribution of the untreated (blank) commodity to the total CS2 reported. To this last recommendation, Member States and the EURLs on pesticide residues are currently in the process of establishing a database containing background residue concentrations of CS2 in untreated food commodities. This information will be used in the framework of the MRL review for diethiocarbamates, and will allow EFSA to perform a more accurate dietary risk assessment for pesticides belonging to the group of dithiocarbamates in food.
EFSA was repeatedly asked to provide information on the percentage of samples free of residues (i.e. residues below the limit of detection (LOD). This information would also be of importance to perform a more realistic dietary risk assessment. At the moment, reporting countries are not providing systematically information whether the residue levels below the LOD have been found in samples analysed. It was highlighted by different enforcement laboratories that more guidance on the validation methodology for reporting the LOD would be required. Therefore it is recommended that the EURLs include this parameter in the new revision of the guidance document on the method validation (known as AQC guidelines (European Commission, 2018)), in order to use a harmonised EU approach accepted by the accreditation bodies.
This report is intended to provide information to the interested public and all partners who have responsibilities in the food chain, in particular food business operators. The report gives information how to enhance the efficiency of self‐control systems. The report should be consulted to identify which pesticides and food products are to be controlled with high priority, taking into account the findings of the official controls performed by the competent Member State authorities. Efficient strategies to identify at an early stage food products that potentially violate the EU food safety standards can contribute to the reduction of non‐compliant food being placed on the market and will have an effect on the dietary exposure of European consumers to pesticide residues.
Abbreviations
EU/EEA country codes
| AT | Austria | IS | Iceland |
| BE | Belgium | IT | Italy |
| BG | Bulgaria | LT | Lithuania |
| CY | Cyprus | LU | Luxembourg |
| CZ | Czech Republic | LV | Latvia |
| DE | Germany | MT | Malta |
| DK | Denmark | NL | Netherlands |
| EE | Estonia | NO | Norway |
| EL | Greece | PL | Poland |
| ES | Spain | PT | Portugal |
| FI | Finland | RO | Romania |
| FR | France | SE | Sweden |
| HR | Croatia | SI | Slovenia |
| HU | Hungary | SK | Slovak Republic |
| IE | Ireland | UK | United Kingdom |
- ADI
acceptable daily intake
- ARfD
acute reference dose
- BAC
benzalkonium chloride
- bw
body weight
- CAG
Cumulative Assessment Group
- CI
confidence interval
- CS2
carbon disulfide
- DDAC
didecyldimethylammonium chloride
- EC
European Commission
- EEA
European Economic Area
- EFSA
European Food Safety Authority
- EFTA
European Free Trade Association
- EU
European Union
- EUCP
EU‐coordinated control programme
- EURL
European Union Reference Laboratory
- FAO
Food and Agriculture Organization of the United Nations
- FYRM
The Former Yugoslav Republic of Macedonia
- GAP
Good Agricultural Practice
- HCH
hexachlorocyclohexane
- HRM
highest residue measured
- LOD
limit of detection
- LOQ
limit of quantification
- MRL
maximum residue level
- NP
National control programme
- POP
persistent organic pollutants
- PRIMo
Pesticide Residue Intake Model
- RD
residue definition
- SSD
Standard Sample Description
- WHO
World Health Organization
Appendix A – Authorities responsible in the reporting countries for pesticide residue monitoring
1.
| Country | National competent authority | Web address for published national monitoring reports |
|---|---|---|
| Austria | Federal Ministry for Health | https://www.verbrauchergesundheit.gv.at/lebensmittel/lebensmittelkontrolle/monitoring/pestizid.html |
| Austrian Agency for Health and Food Safety | http://www.ages.at/themen/rueckstaende-kontaminanten/pflanzenschutzmittel-rueckstaende/pestizidmonitoringberichte/ | |
| Belgium | Federal Agency for the Safety of the food Chain (FASFC) | http://www.afsca.be |
| Bulgaria | Risk Assessment Centre on Food Chain | The Web site is under construction |
| Croatia | Ministry of Agriculture | http://www.mps.hr/ |
| Cyprus | Pesticides Residues Laboratory of the State General Laboratory of Ministry of Health | http://www.moh.gov.cy/sgl |
| Czech Republic | Czech Agriculture and Food Inspection Authority | http://www.szpi.gov.cz/lstDoc.aspx?nid=11386 |
| State Veterinary Administration | http://www.svscr.cz | |
| Denmark | Danish Veterinary and Food Administration | http://www.food.dtu.dk/publikationer/kemikaliepaavirkninger/pesticider-i-kosten |
| National Food Institute, Technical University of Denmark | ||
| Estonia | Veterinary and Food Board | http://www.vet.agri.ee |
| Finland | Finnish Food Safety Authority Evira and Finnish Customs | http://www.evira.fi/portal/fi/tietoa+evirasta/asiakokonaisuudet/vierasaineet/kasvinsuojeluainejaamat/valvonta/ |
| France | Ministère de l’économie et des finances/Direction générale de la concurrence, de la consommation et de la répression des fraudes (DGCCRF) | http://www.economie.gouv.fr/dgccrf/securite/produits-alimentaires |
| Ministère de l'agriculture, de l'agroalimentaire et de la forêt, Direction générale de l'alimentation (DGAL) | http://agriculture.gouv.fr/plans-de-surveillance-et-de-controle | |
| Germany | Federal Office of Consumer Protection and Food Safety (BVL) | www.bvl.bund.de/berichtpsm |
| Greece | Ministry of Rural Development and Food | http://www.minagric.gr/index.php/en/citizen-menu/foodsafety-menu |
|
General Directorate of Sustainable Plant Produce Directorate of Plant Produce Protection Department of Plant Protection Products & Biocides |
http://www.minagric.gr/index.php/el/for-farmer-2/crop-production/fytoprostasiamenu/ypoleimatafyto | |
| Hungary | National Food Chain Safety Office | https://www.nebih.gov.hu |
| Iceland | MAST – The Icelandic Food and Veterinary Authority | http://www.mast.is |
| Ireland | Department of Agriculture Food and the Marine | www.pcs.agriculture.gov.ie |
| Italy | Ministero della Salute – Direzione Generale per l'Igene e la Sicurezza degli Alimenti e la Nutrizione – Ufficio 7 | http://www.salute.gov.it/portale/temi/p2_6.jsp?lingua=italiano&id=1105&area=fitosanitari&menu=vegetali |
| Latvia | Ministry of Agriculture Food and Veterinary Service of Latvia | www.zm.gov.lv |
| Lithuania | National Food and Veterinary Risk Assessment Institute | http://www.nmvrvi.lt |
| Luxembourg | Food Safety Service (Secualim) | http://www.securite-alimentaire.public.lu/organisme/pcnp/sc/cs9_prod_phyto/ppp_residus_pesticides/index.html |
| Administration of Veterinary Services (ASV) | ||
| Malta | Malta Competition and Consumer Affairs Authority | www.mccaa.org.mt |
| Netherlands | Netherlands Food and Consumer Product Safety Authority (NVWA) | www.nvwa.nl |
| Norway | Norwegian Food Safety Authority | |
| Poland | The State Sanitary Inspection | http://www.gis.gov.pl |
| Portugal | Direção Geral de Alimentação e Veterinária (DGAV) | http://www.dgv.min-agricultura.pt/portal/page/portal/DGV/genericos?generico=4217393&cboui=4217393t |
| Romania | National Sanitary Veterinary and Food Safety Authority | http://www.ansvsa.ro |
| Ministry of Agriculture and Rural Development | http://www.madr.ro | |
| Ministry of Health | ||
| Slovakia | State Veterinary and Food Administration of the Slovakian Republic | http://www.svps.sk/ |
| Public Health Authority of the Slovakian Republic | ||
| Slovenia | Administration of the Republic of Slovenia for Food Safety, Veterinary Sector and Plant Protection | http://www.uvhvvr.gov.si/si/delovna_podrocja/ostanki_pesticidov/porocila/ |
| Spain | Spanish Agency for Consumer Affairs, Food Safety and Nutrition (AECOSAN) | http://www.aecosan.msssi.gob.es/AECOSAN/web/seguridad_alimentaria/subseccion/programa_control_residuos.htm |
| Sweden | National Food Agency | www.livsmedelsverket.se |
| United Kingdom | Health and Safety Executive | https://www.gov.uk/government/publications/expert-committee-on-pesticide-residues-in-food-prif-annual-report-for-2015 |
Appendix B – Background information on the EU‐coordinated programme
1.
Appendix C – Background information and detailed results on the overall control programmes
1.
Appendix D – Background information and detailed results on dietary risk assessment
1.
Results of short‐term dietary risk assessment for food products in focus of the EUCP, expressed as percentage of the ARfD
In the following figures,60 the short‐term exposure calculated for each sample with residues above the LOQ was presented individually, expressing the result as percentage of the ARfD. The blue dots refer to results reported under the EUCP, whereas the orange dots refer to findings in samples that were analysed in the framework of the national control programmes. The figures in brackets next to the name of the pesticides represent the number of samples with residues below the LOQ, number of samples with quantified residues below the MRL, and the number of samples with residues above the MRL.
Figure D.2.
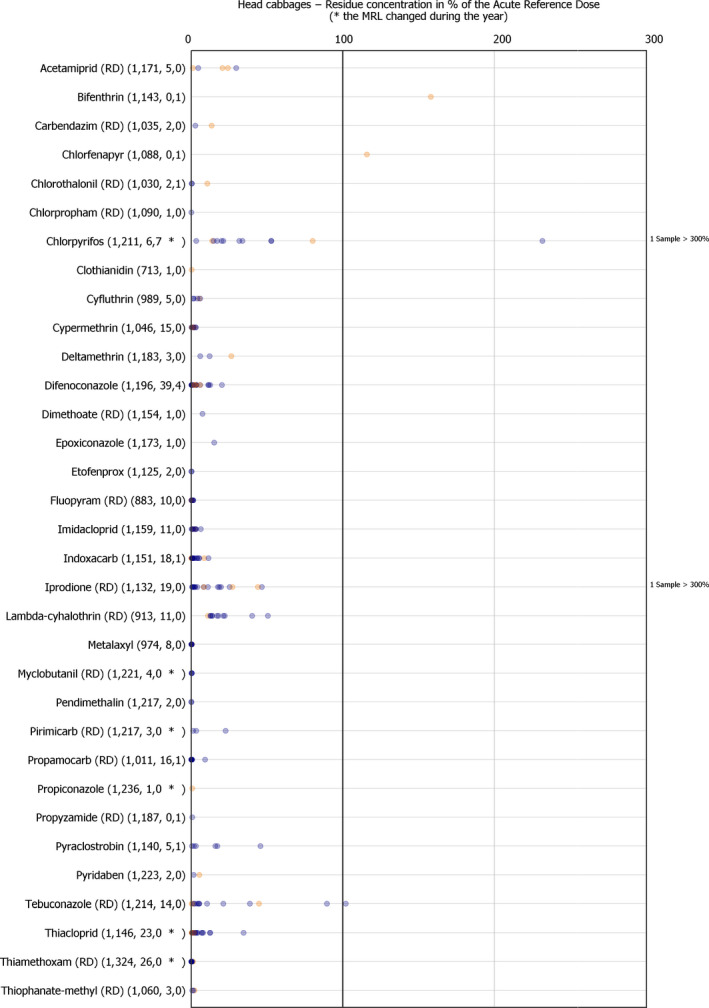
Short‐term dietary exposure assessment – head cabbage
Figure D.3.
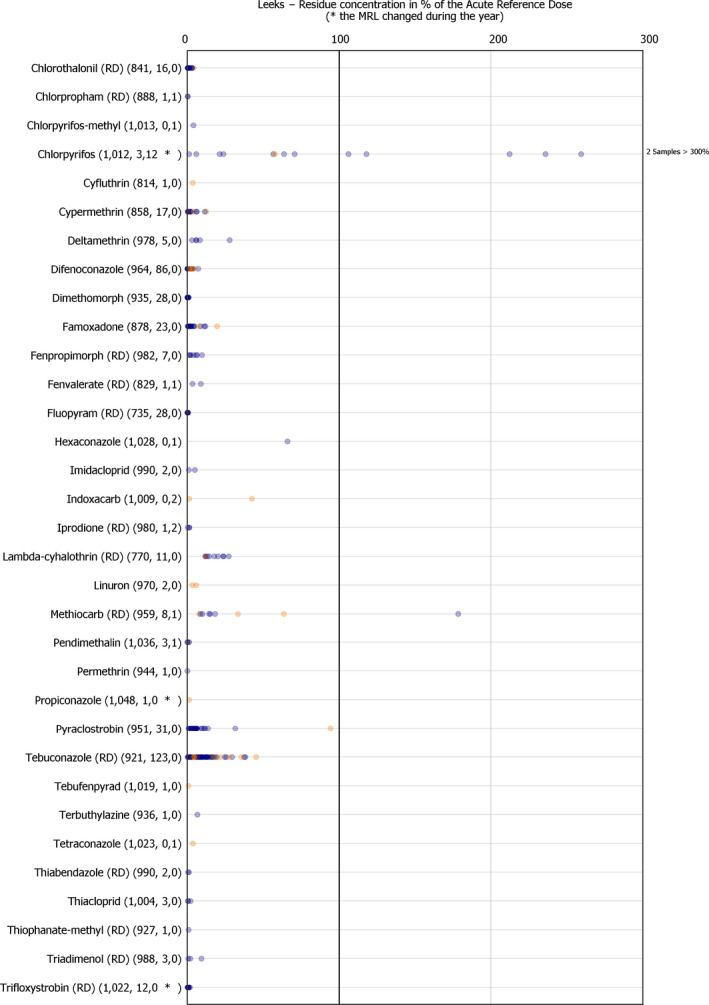
Short‐term dietary exposure assessment – leek
Figure D.4.
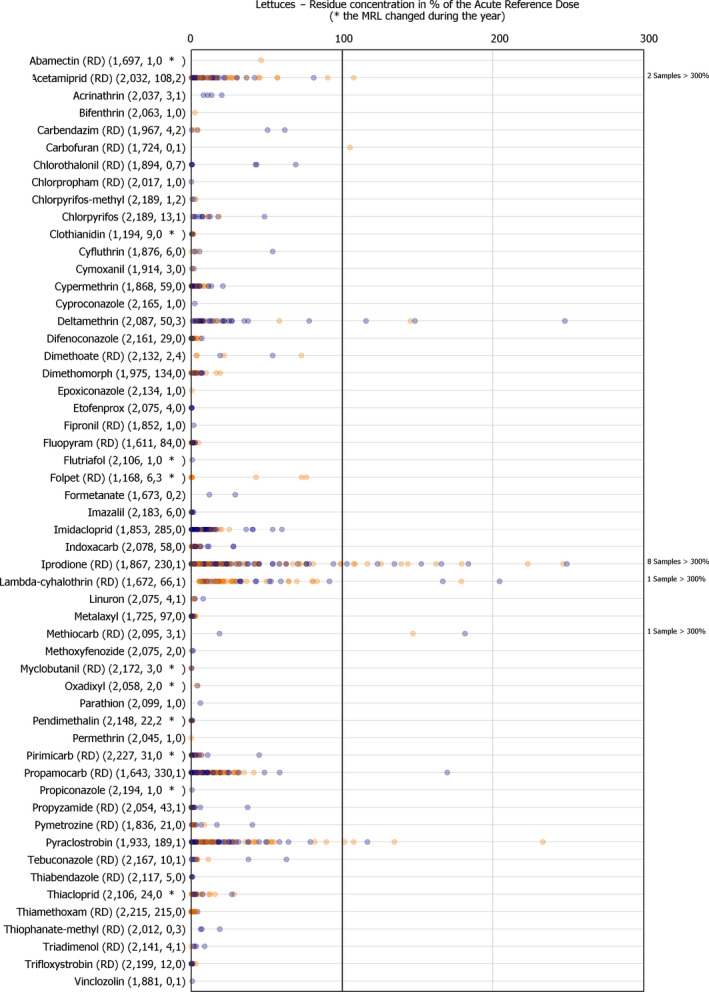
Short‐term dietary exposure assessment – lettuce
Figure D.5.
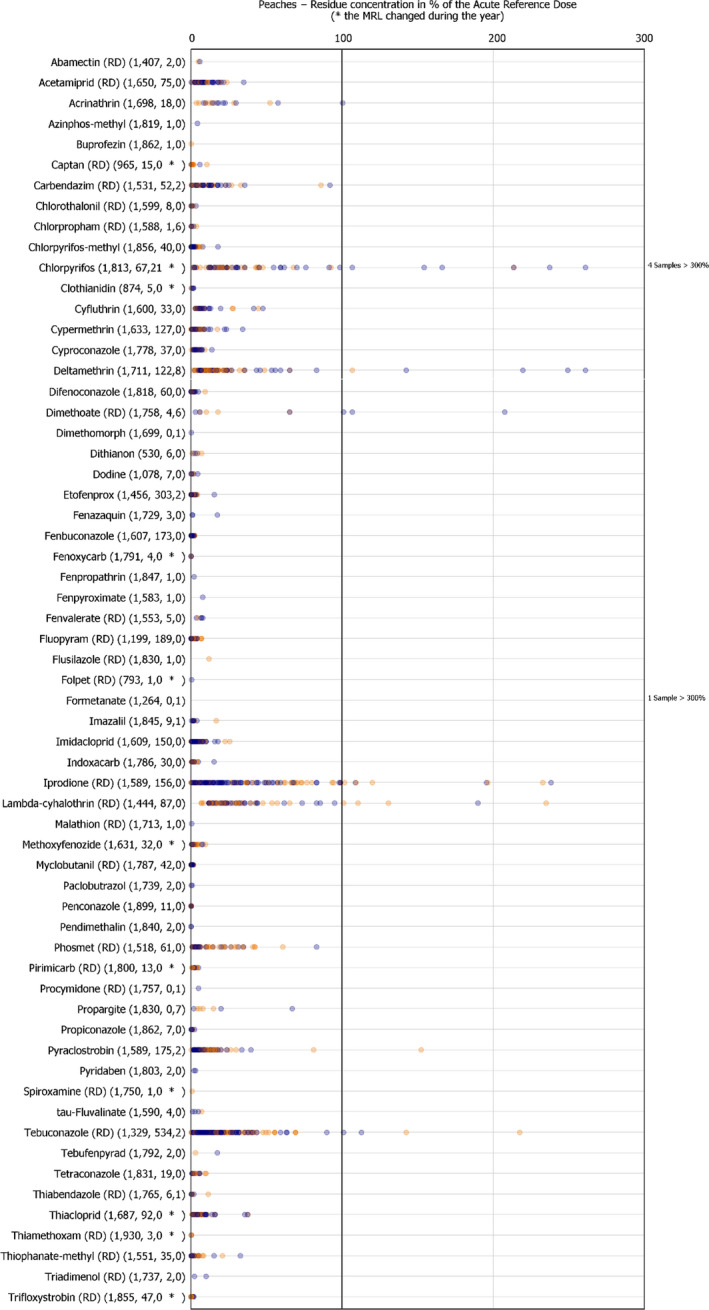
Short‐term dietary exposure assessment – peaches
Figure D.6.
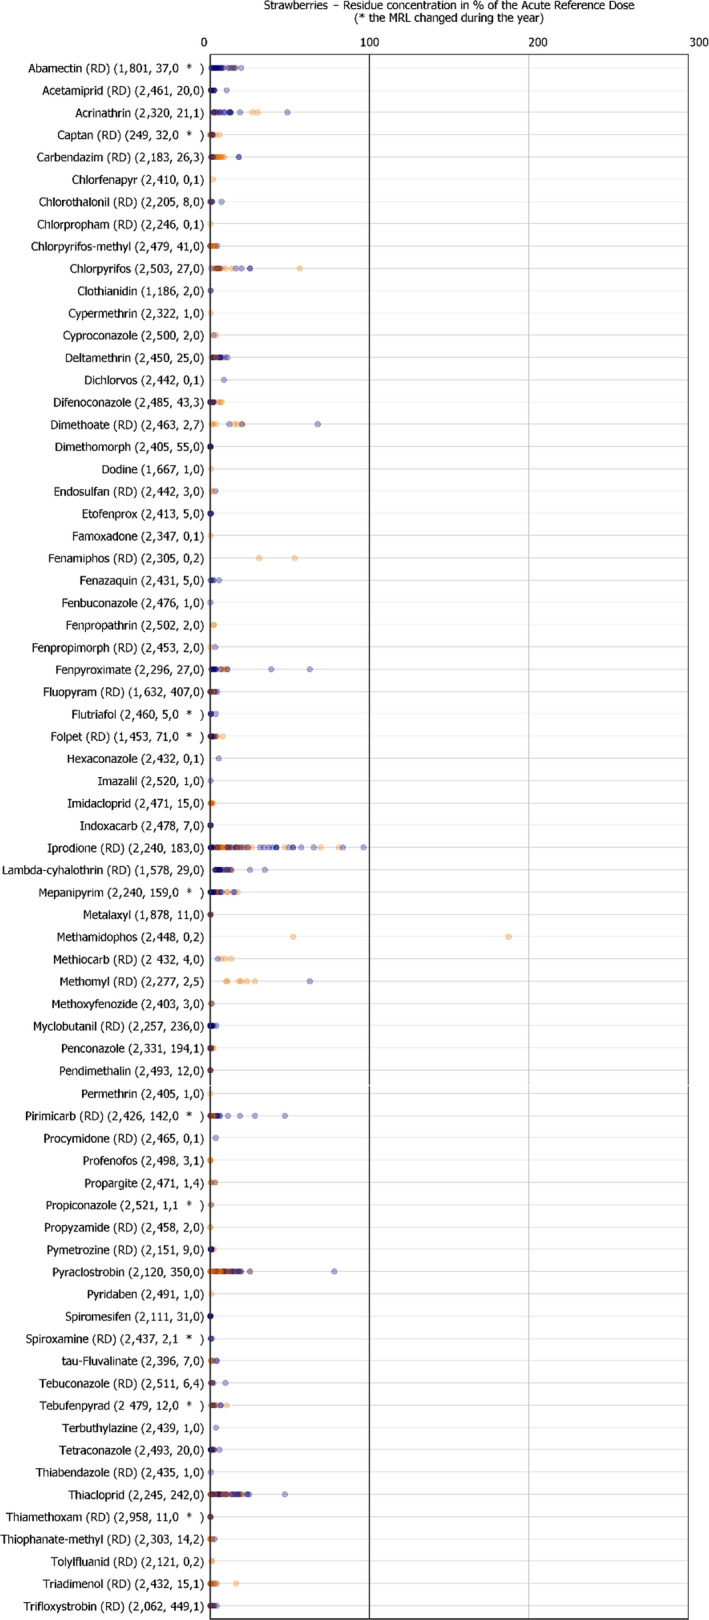
Short‐term dietary exposure assessment – strawberries
Figure D.7.
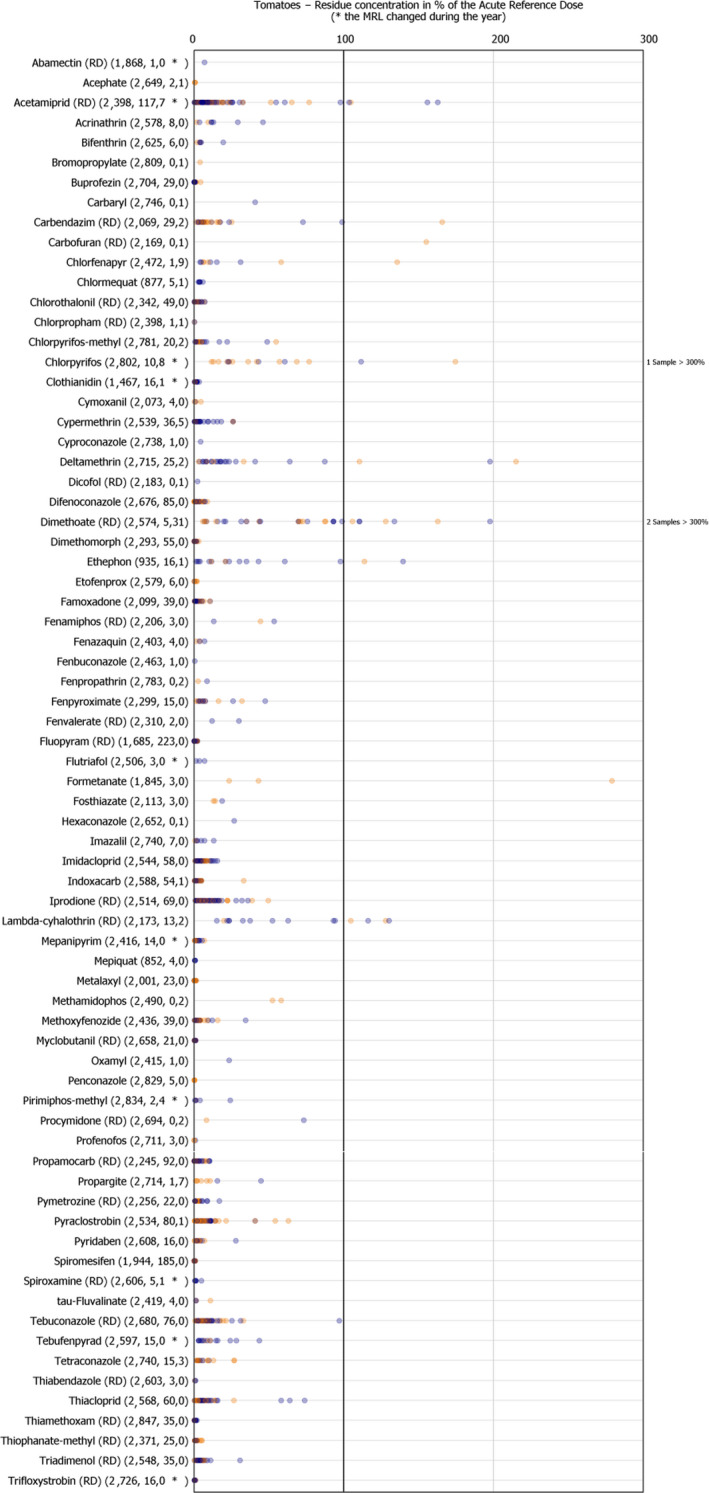
Short‐term dietary exposure assessment – tomatoes(a)
- (a): The existing MRL for tomatoes seems not to be sufficiently protective. With a concentration value of 0.24 mg/kg that is below the MRL of 0.3, the exposure accounts for 279% of the ARfD. In the MRL review (Art. 12, a HR of 0.12 was used for the acute risk assessment, with no exceedance of the ARfD. Also for deltamethrin, there might be a similar case.
Figure D.8.
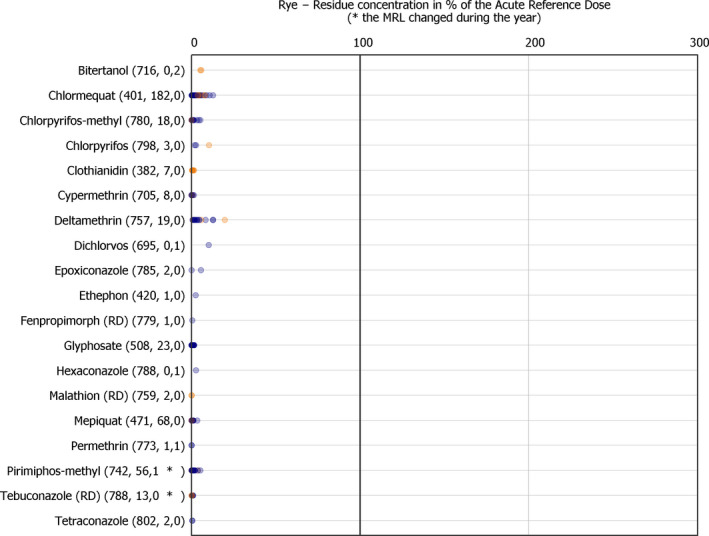
Short‐term dietary exposure assessment – rye
Figure D.9.
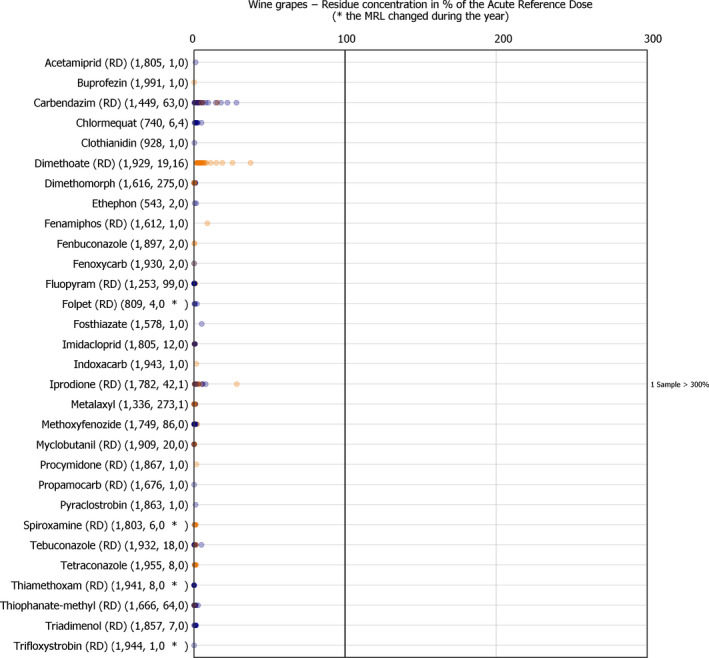
Short‐term dietary exposure assessment – wine
Figure D.10.
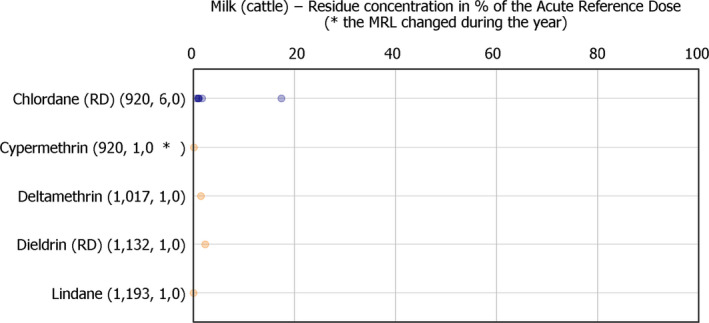
Short‐term dietary exposure assessment – cow's milk
Supporting information
PRIMo 2016 monitoring results risk assessment
Supplement MRL 2016 exceedances
Member States and European Commission consultation on the 2016 EU Report on Pesticide Residues
Suggested citation: EFSA (European Food Safety Authority) , 2018. The 2016 European Union report on pesticide residues in food. EFSA Journal 2018;16(7):5348, 139 pp. 10.2903/j.efsa.2018.5348
Requestor: EFSA
Question number: EFSA‐Q‐2014‐00103
Acknowledgements: The Pesticides Unit wishes to thank Florence Gérault (Ministry of Agriculture, France) for her valuable proposals and the independent scientific review of this report.
Endorsed: 21 June 2018
This publication is linked to the following EFSA Supporting Publications article: http://onlinelibrary.wiley.com/doi/10.2903/sp.efsa.2018.EN-1454/full
Notes
Throughout the report, results describing percentage of samples above the legal limit, within the legal limit and samples free of quantifiable residues are provided with one decimal. Due to the rounding to one decimal place, the added results for these three categories may slightly differ from 100%.
Following the precautionary principle, the legal limit for food intended for infants and young children was set at a very low level equal or close to the limit of quantification; in general, a default MRL of 0.01 mg/kg is applicable unless lower legal limits for the residue levels are defined in Directives 2006/125/EC and 2006/141/EC.
Regulation (EC) No 1107/2009 of the European Parliament and of the Council of 21 October 2009 concerning the placing of plant protection products on the market and repealing Council Directives 79/117/EEC and 91/414/EEC. OJ L 309, 24.11.2009, p. 1–50.
Commission implementing Regulation (EU) 2015/595 of 15 April 2015 concerning a coordinated multiannual control programme of the Union for 2016, 2017 and 2018 to ensure compliance with maximum residue levels of pesticides and to assess the consumer exposure to pesticide residues in and on food of plant and animal origin. OJ L 99, 16.4.2015, p. 7–20.
Commission Directive 2006/125/EC of 5 December 2006 on processed cereal‐based foods and baby foods for infants and young children. OJ L 339, 6.12.2006, p. 16–35.
Commission Directive 2006/141/EC of 22 December 2006 on infant formulae and follow‐on formulae and amending Directive 1999/21/EC. OJ L 401, 30.12.2006, p. 1–33.
Regulation (EU) No 609/2013 of the European Parliament and of the Council of 12 June 2013 on food intended for infants and young children, food for special medical purposes, and total diet replacement for weight control and repealing Council Directive 92/52/EEC, Commission Directives 96/8/EC, 1999/21/EC, 2006/125/EC and 2006/141/EC, Directive 2009/39/EC of the European Parliament and of the Council and Commission Regulations (EC) No 41/2009 and (EC) No 953/2009. OJ L 181, 29.6.2013, p. 35–56.
Commission Regulation (EU) No 37/2010 of 22 December 2009 on pharmacologically active substances and their classification regarding maximum residue limits in foodstuffs of animal origin. OJ L 015, 20.1.2010, p. 1.
Council Directive 96/23/EC of 29 April 1996 on measures to monitor certain substances and residues thereof in live animals and animal products and repealing Directives 85/358/EEC and 86/469/EEC and Decisions 89/187/EEC and 91/664/EEC. OJ L 125, 23.5.1996, p. 10.
The comprehensive results from the monitoring of veterinary medicinal product residues and other substances in live animals and animal products are published in a separate report (EFSA, 2017b).
Commission Regulation (EC) No 889/2008 of 5 September 2008 laying down detailed rules for the implementation of Council Regulation (EC) No 834/2007 on organic production and labelling of organic products with regard to organic production, labelling and control. OJ L 250, 18.9.2008, p. 1–84.
Commission Regulation (EC) No 669/2009 of 24 July 2009 implementing Regulation (EC) No 882/2004 of the European Parliament and of the Council as regards the increased level of official controls on imports of certain feed and food of non‐animal origin and amending Decision 2006/504/EC. OJ L 194, 25.7.2009, p. 11–21.
Commission Implementing Regulation (EU) 2015/2383 of 17 December 2015 amending Annex I to Regulation (EC) No 669/2009 as regards the list of feed and food of non‐animal origin subject to an increased level of official controls on imports. OJ L 332, 18.12.2015, p. 57–62.
Commission Implementing Regulation (EU) 2016/443 of 23 March 2016 amending Annex I to Regulation (EC) No 669/2009 as regards the list of feed and food of non‐animal origin subject to an increased level of official controls on imports. OJ L 78, 24.3.2016, p. 51–57.
Commission Implementing Regulation (EU) 2016/1024 of 24 June 2016 amending Regulation (EC) No 669/2009 implementing Regulation (EC) No 882/2004 of the European Parliament and of the Council as regards the increased level of official controls on imports of certain feed and food of non‐animal origin. OJ L 168, 25.6.2016, p. 1–6.
Council Directive 96/23/EC of 29 April 1996 on measures to monitor certain substances and residues thereof in live animals and animal products and repealing Directives 85/358/EEC and 86/469/EEC and Decisions 89/187/EEC and 91/664/EEC. OJ L 125, 23.5.1996, p. 10–32.
The LOD is the lowest concentration of a pesticide residue that can be identified in a sample with an acceptable degree of certainty. However, the amount of the analyte cannot be quantified reliably.
2,4‐D (RD), amitraz (RD), amitrole, azinphos‐ethyl, benfuracarb, bixafen (RD), bromuconazole, carbosulfan, clorfenvinphos, chlorobenzilate, cyromazine, dichlofluanid, dicrotophos, endrin, ethoprophos, flonicamid, fluazifop‐P‐butyl (RD), flubendiamide, formothion, haloxyfop‐R (RD), ioxynil, isofenphos‐methyl, isoprocarb, maleic hydrazide (RD), meptyldinocap (RD), metaflumizone, metconazole, metobromuron, nitenpyram, phenthoate, phosalone, phoxim, prochloraz (RD), propoxur, prothioconazole (RD), prothiofos, pyrazophos, pyrethrins, resmethrin (RD), rotenone, tetramethrin, trichlorfon, trifluralin, triticonazole and zoxamide.
Some pesticides were removed from the EUCP because of a very low frequency of quantification or because of analytical difficulties. Many of the pesticides removed from the EUCP were included in the ‘Working document on pesticides to be considered for inclusion in the national control programmes to ensure compliance with maximum residue levels of pesticides residues in and on food of plant and animal origin’ (European Commission, 2016). For some of these substances, improvements of analytical methods were considered necessary, while for others it needs to be verified whether residues are found in a significant percentage of the samples. After an evaluation period under the national programmes, the inclusion of these substances in the EUCP will be reconsidered.
Commission Implementing Regulation (EU) No 1274/2011 of 7 December 2011 concerning a coordinated multiannual control programme of the Union for 2012, 2013 and 2014 to ensure compliance with maximum residue levels of pesticides and to assess the consumer exposure to pesticide residues in and on food of plant and animal origin, OJ L 325, 8.12.2011.
Due to the rounding of the numerical results, the total calculated sum may slightly differ from 100%.
The number of samples within and exceeding the legal limit are based on the judgement of the reporting country.
The MRLs applicable at the beginning of the reference period (January 2016) as reported in the MRL database of the European Commission were used for the calculation. Whenever a MRL changed during the calendar year, the MRL reported by the MS to be in place, was taken. The reason for this approach is that the exact date of sampling to decide which MRL is applicable is not reported to EFSA.
The fact that the MRL used to express the residue concentration as percentage of the MRL (i.e. MRL in place at the beginning of the calendar year) and the MRL used by reporting country to decide on an MRL exceedance may be different, explains some inconsistencies between the bar charts and the dot plot figures and the results presented on the on‐line Pesticides Dashboard.
Captan residue definition changed during the year 2016. Throughout the report, the report name ‘captan (RD)’ refers to results enforcing both definitions: ‘captan’ and ‘sum of captan and THPI, expressed as captan’.
The MRL for diphenylamine in apples was lowered in 2014 following a decision on non‐approval of the active substance. However, it was noted that unavoidable cross‐contamination affecting untreated apples still occur. The currently applicable MRL of 0.1 mg/kg will be re‐considered in 2018. The residues found in apples produced in the EU ranged from 0.19 to 1.1 mg/kg.
Two samples of gojiberries are considered in this analysis (2016 EUCP), as for the 2013 EUCP. Gojiberries/wolfberries (Lycium barbarumare and Lycium chinense) are classified as tomatoes (ProdCode=”0231010”) according to Commission Regulation (EU) No 212/2013 of 11 March 2013 replacing Annex I to Regulation (EC) No 396/2005 of the European Parliament and of the Council as regards additions and modifications with respect to the products covered by that Annex (Text with EEA relevance), OJ L 68, 12.3.2013, p. 30–52.
And up to 17 different pesticides in one sample of gojiberries from unknown origin reported by The Netherlands under tomato samples (EUCP).
According to the information provided by France, a focussed control was performed in tomatoes produced in French oversea departments.
The percentage for the category ‘all products’ was recalculated for 2013, excluding swine fat (as swine meat was requested in 2013) and rye (as oat was requested in 2013). This explains the differences between 50.9% and the 46.3% reported in 2013 EU report (EFSA, 2015b).
In addition to these 84,657 samples, the results for 627 samples of feed and fish were reported to EFSA. However, since for these two food groups currently no legal limits are set under Regulation (EC) No 396/2005, these samples are not further taken into account for the detailed analysis of samples analysed within the national control programmes and the 2016 EUCP.
Iceland had 4 samples out of 43 with MRL exceedances. One of those samples with exceedance, triggered follow up action resulting in two more enforcement samples that also exceed the MRL. All samples were grown in the same greenhouse and the production was destroyed.
Food products compliant with the description of in Annex I of Regulation (EC) No 396/2005 are considered as unprocessed products. It should be noted that this food classification comprises mainly unprocessed raw agricultural products, but also some processed products such as fermented tea, dried spices, dried herbal infusions etc., which are considered as ‘unprocessed’ products in the framework of this report.
The number of samples (3,175 samples) exceeding the legal limit is lower than the total number of determinations exceeding the legal limit, since multiple MRL exceedances were found in a number of samples (525 samples).
Baby food samples are referring to: ‘baby foods other than processed cereal‐based foods, processed cereal‐based foods for infants and young children and infant formulae’.
Commission Regulation (EC) No 669/2009 of 24 July 2009 implementing Regulation (EC) No 882/2004 of the European Parliament and of the Council as regards the increased level of official controls on imports of certain feed and food of non‐animal origin and amending Decision 2006/504/EC, OJ L 194, 25.7.2009, p. 11–21.
In general, a default MRL of 0.01 mg/kg is applicable for food covered by Directive 2006/125/EC and 2006/141/EC unless lower legal limits for the residue levels are defined in the Directives. Thus, the provisions are more restrictive than for other food falling under the provisions of Regulation (EC) No 396/2005.
The results related to copper (89 determinations) were not taken into account in the calculation of the MRL exceedance rate, because of the specific provisions on copper in Directive 2006/125/EC and 2006/141/EC.
The baby food samples were not included in this analysis since the results for this food group are presented in detail in the previous chapter.
For this comparison, all pesticides were considered; the naturally occurring substances covered by the MRL legislation were not excluded since they are also present in conventional food and are therefore also covered in the calculation of the quantification rate for conventional food.
For conventional and organic products, the MRLs established in Regulation (EC) No 396/2005 are applicable.
Regulation (EU) No 528/2012 of the European Parliament and of the council of 22 May 2012 concerning the making available on the market and use of biocidal products, OJ L 167, 27.6.2012, p. 1–123.
Further explanations on the cumulative dietary exposure ongoing can be found in EFSA web site: https://www.efsa.europa.eu/en/press/news/180419
The approach using the so‐called unit variability factor of 5 or 7 is applied in the currently used risk assessment methodology for short‐term dietary exposure, postulating an inhomogeneous distribution among the individual units. The variability factors are applied for mid‐sized products like apples, peaches, tomatoes, head cabbage, lettuce and leek; for processed products, for products that are normally mixed or bulked before consumption and for products with a small unit weight, no variability factor is applied (e.g. for wine, strawberries, rye). The latter also applies to cow's milk and swine fat.
For 33 substances included in the EU‐coordinated control programme the setting of an ARfD was not necessary because of the low acute toxicity of the substances. These pesticides are therefore not relevant for acute exposure assessment.
The exposure calculations were carried out separately for each pesticide/crop combination as it is considered unlikely that a consumer would eat two or more different food products in large portions within a short period of time and that all of these food products would contain residues of the same pesticide at the highest level observed during the reporting year.
EFSA under a grant agreement is developing a Compendium of Representative Processing Techniques investigated in regulatory studies in pesticides. It will be published as an EFSA supporting publication in 2018, where the most common processing techniques are described. A compilation of available PF will also be published.
According to the 2016 EUCP control programme, samples of rye flour could have been taken in case rye grains’ samples were not available for monitoring purposes..
In the framework of the Pesticides Peer Review Experts’ Meeting 153 (EFSA, 2018d), new valid genotoxicity studies were provided for propargite having been a data gap during the peer review of 2011 where toxicological reference values were derived.
In the framework of the Pesticides Peer Review Experts’ Meeting 134 on fenamidone (EFSA, 2016a,b,c, 2017a,b,c,de), no toxicological reference values were set because of the lack of conclusive data on the potential genotoxicity. During the renewal procedure, the majority of experts considered that the setting of reference values of fenamidone cannot be supported because of no conclusion on the genotoxic potential of fenamidone could be drawn leading to a critical area of concern. That is why the reference values set in 2003 were not used in the exposure assessment.
During the renewal process, it has been agreed on a separation of the two active substances from the same residue definition of the sum of dimethoate and omethoate expressed as dimethoate. Therefore, no further scenarios were considered necessary taking into account the individual concentration reported of each of the two active substances according to their toxicological potency. Upon request, this analysis could be done.
For metiram, no ARfD was considered necessary. Thus, no metiram scenario was calculated.
For dimethoate (omethoate scenario) and dithiocarbamates (mancozeb, maneb, metiram, propineb, thiram and ziram scenarios), no unambiguous risk assessment could be calculated. Therefore, possible exceedances coming from these, were not included in the number samples exceeding the ARfD.
In strawberries, the consideration of the different scenarios, lead to an exceedance of the ARfD in the omethoate scenario, not so in the dimethoate.
Commission Regulation (EU) 2016/60 of 19 January 2016 amending Annexes II and III to Regulation (EC) No 396/2005 of the European Parliament and of the Council as regards maximum residue levels for chlorpyrifos in or on certain products. OJ L 14, 21.1.2016, p. 1–17.
Commission Implementing Regulation (EU) 2017/2091 of 14 November 2017 concerning the non‐renewal of approval of the active substance iprodione, in accordance with Regulation (EC) No 1107/2009 of the European Parliament and of the Council concerning the placing of plant protection products on the market, and amending Commission Implementing Regulation (EU) No 540/2011. OJ L 297, 15.11.2017, p. 25–27.
Last year, both approaches were calculated considering only EUCP food items. Thus, for comparing results of the 2015 exposure calculations with 2016, discrepancies due to the number of food items accounted for are to be considered.
SANCO/12574/2014 (rev. 5) document (European Commission, 2017) on particular provisions related to the reporting of the LOQ to be reported in case of multicomponent residue definitions entered into force on 1st January 2017. Thus, for the data generated in 2016 and reported to EFSA in 2017, the new LOQ coding approach was not meant to be implemented. However, a few countries reported the summed LOQ for a small number of ‘complex’ residue definitions as ‘9999’ (according to the document, the value should have been ‘99999’). When calculating the upper‐bound scenario EFSA replaced the values of 9999 by 0.01 mg/kg in order to not lose the analytical results reported.
To be clarified that the total number of samples are EUCP and national covering the pesticides listed in the EUCP and for all crops related in Annex I of Regulation 396/2005.
In the following figures, there are some cases where the ARfD was exceeded, while the samples were still within the MRL. Some of these cases are related to ARfD values recently amended. However, for the other cases, risk managers should be aware that it is caused of the difference of HR/MRL.
References
- Abraham J, 2013. Computation of Cis for Binomial proportions in SAS and its practical difficulties. Kreara Solutions Pvt. Ltd. PhUSE 2013, Paper SP05, Thiruvananthapuram, India.
- Clopper CJ and Pearson ES, 1934. The Use of Confidence or Fiducal Limits illustrated in the case of the binomial. Biometrika, 26, 404–413. 10.1093/biomet/26.4.404 [DOI] [Google Scholar]
- Codex , 2006. CAG/GL 59‐2006 Guidelines on Estimation of Uncertainty of Results. Codex Alimentarius Comimission, Rome Italy, 2006. Available online: www.codexalimentarius.net/download/report/701/al31_24e.pdf
- EFSA (European Food Safety Authority), 2006. Conclusion regarding the peer review of the pesticide risk assessment of the active substance dimethoate. EFSA Scientific report, 84, Parma, Italy.
- EFSA (European Food Safety Authority), 2007. Reasoned opinion on the potential chronic and acute risk to consumers’ health arising from proposed temporary EU MRLs. EFSA Journal 2007;5(3):32r, 1141 pp. 10.2903/j.efsa.2007.32r [DOI] [Google Scholar]
- EFSA (European Food Safety Authority), 2010. Modification of the existing MRLs for dimethoate in various crops. EFSA Journal 2010;8(3):1528. 35 pp. 10.2903/j.efsa.2010.1528 [DOI] [Google Scholar]
- EFSA (European Food Safety Authority), 2013. The 2010 European Union report on pesticide residues in food. EFSA Journal 2013;11(3):3130, 808 pp. 10.2903/j.efsa.2013.3130 [DOI] [PMC free article] [PubMed] [Google Scholar]
- EFSA (European Food Safety Authority), 2014a. The 2011 European Union report on pesticide residues in food. EFSA Journal 2014;12(5):3694, 511 pp. 10.2903/j.efsa.2014.3694 [DOI] [Google Scholar]
- EFSA (European Food Safety Authority), 2014b. The 2012 European Union report on pesticide residues in food. EFSA Journal 2014;12(12):3942, 156 pp. 10.2903/j.efsa.2014.3942 [DOI] [PMC free article] [PubMed] [Google Scholar]
- EFSA (European Food Safety Authority), 2015a. Guidance for reporting data on pesticide residues in food and feed according to Regulation (EC) No 396/2005 (2014 data collection). EFSA Journal 2015;13(7):4195, 61 pp. 10.2903/j.efsa.2015.4195 [DOI] [Google Scholar]
- EFSA (European Food Safety Authority), 2015b. The 2013 European Union report on pesticide residues in food. EFSA Journal 2015;13(3):4038, 169 pp. 10.2903/j.efsa.2015.4038 [DOI] [PMC free article] [PubMed] [Google Scholar]
- EFSA (European Food Safety Authority), 2015d. Reasoned opinion on the revision of the review of the existing maximum residue levels for lambda‐cyhalothrin. EFSA Journal 2015;13(12):4324, 119 pp. 10.2903/j.efsa.2015.4324 [DOI] [Google Scholar]
- EFSA (European Food Safety Authority), 2016a. Reporting data on pesticide residues in food and feed according to Regulation (EC) No 396/2005 (2015 data collection). EFSA Journal 2016;14(5):4496, 33 pp. 10.2903/j.efsa.2016.4496 [DOI] [Google Scholar]
- EFSA (European Food Safety Authority), 2016b. The 2014 European Union report on pesticide residues in food. EFSA Journal 2016;14(10):4611, 139 pp. 10.2903/j.efsa.2016.4611 [DOI] [PMC free article] [PubMed] [Google Scholar]
- EFSA (European Food Safety Authority), 2016c. Conclusion on the peer review of the pesticide risk assessment of the active substance fenamidone. EFSA Journal 2016;14(2):4406, 173 pp. 10.2903/j.efsa.2016.4406 [DOI] [Google Scholar]
- EFSA (European Food Safety Authority), 2016d. MCRA made scalable for large cumulative assessment groups. EFSA Supporting publication 2016;13(1):EN‐910, 2 pp. 10.2903/sp.efsa.2016.EN-910 [DOI] [Google Scholar]
- EFSA (European Food Safety Authority), 2017a. The 2015 European Union report on pesticide residues in food. EFSA Journal 2017;15(4):4791, 134 pp. 10.2903/j.efsa.2016.4791 [DOI] [PMC free article] [PubMed] [Google Scholar]
- EFSA (European Food Safety Authority), 2017b. Report for 2015 on the results from the monitoring of veterinary medicinal product residues and other substances in live animals and animal products. EFSA Supporting publication 2017;14(11):EN‐1150, 69pp. 10.2903/sp.efsa.2017.en-1150 [DOI] [Google Scholar]
- EFSA (European Food Safety Authority), 2017c. Reasoned Opinion on the focussed review of the existing maximum residue levels for lambda‐cyhalothrin in light of the unspecific residue definition and the existing good agricultural practices for the substance gamma‐cyhalothrin. EFSA Journal 2017;15(7):4930, 29 pp. 10.2903/j.efsa.2017.4930 [DOI] [PMC free article] [PubMed] [Google Scholar]
- EFSA (European Food Safety Authority), 2017d. Guidance for reporting data on pesticide residues in food and feed according to Regulation (EC) No 396/2005 (2016 data collection). EFSA Journal 2017;15(5):4792, 48 pp. 10.2903/j.efsa.2017.479 [DOI] [PMC free article] [PubMed] [Google Scholar]
- EFSA (European Food Safety Authority), 2018a. National summary reports on pesticide residue analysis performed in 2016. EFSA supporting publication 2018;15(8):EN‐1454, 175 pp. 10.2903/sp.efsa.2018.EN-1454 [DOI] [Google Scholar]
- EFSA (European Food Safety Authority), 2018b. Technical report on the follow up assessment of MRLs for the active substance iprodione. EFSA supporting publication 2018:EN‐1404, 24 pp. 10.2903/sp.efsa.2018.en-1404 [DOI] [Google Scholar]
- EFSA (European Food Safety Authority), 2018c. Monitoring data on pesticide residues in food: results on organic versus conventionally produced food. EFSA supporting publication 2018:EN‐1397, 30 pp. 10.2903/sp.efsa.2018.en-1397 [DOI] [Google Scholar]
- EFSA (European Food Safety Authority), 2018d. Reasoned opinion on the setting of maximum residue limits for propargite in citrus fruits and tea. EFSA Journal 2018;16(2):5193, 25 pp. 10.2903/j.efsa.2018.5193 [DOI] [PMC free article] [PubMed] [Google Scholar]
- Ellison SLR and Williams A (eds.), 2012. Eurachem/CITAC guide: Quantifying Uncertainty in Analytical Measurement, 3rd Edition. ISBN 978‐0‐948926‐30‐3. [Google Scholar]
- European Commission , 2016. Working document on pesticides to be considered for inclusion in the national control programmes to ensure compliance with maximum residue levels of pesticides residues in and on food of plant and animal origin. SANCO/12745/2013, 28‐29 November 2016. Rev. 7(3). 53 pp. Working document, Available online: https://ec.europa.eu/food/sites/food/files/plant/docs/pesticides_mrl_guidelines_wrkdoc_12745.pdf
- European Commission , 2017. Working document on the summing up of LOQs in case of complex residue definitions. SANCO/12574/2014. rev. 5(1). Application date: 1 January 2017. 30/11‐01/12 2015.
- European Commission , 2018. Method Validation and Quality Control Procedures for Pesticide Residues Analysis in Food and Feed. SANTE/11813/2017 (implemented from 01.01.2018).
- FAO (Food and Agriculture Organization of the United Nations), 2009. Submission and evaluation of pesticide residues data for the estimation of Maximum Residue Levels in food and feed. Pesticide Residues. 2nd Edition. FAO Plant Production and Protection Paper 197, 2009.
- Robinson J, 2006. Oxford Companion to Wine. Oxford University Press, Oxford. 780 pp. [Google Scholar]
- UNEP , 2001. Stockholm Convention on Persistent Organic Pollutants, United Nation Environment Program, Stockholm Convention Secretariat. Available online: http://chm.pops.int/TheConvention/Overview/tabid/3351/
Associated Data
This section collects any data citations, data availability statements, or supplementary materials included in this article.
Supplementary Materials
PRIMo 2016 monitoring results risk assessment
Supplement MRL 2016 exceedances
Member States and European Commission consultation on the 2016 EU Report on Pesticide Residues


