

Abstract
The data on antimicrobial resistance in zoonotic and indicator bacteria in 2016, submitted by 28 EU Member States (MSs), were jointly analysed by the EFSA and ECDC. Resistance in bacterial isolates of zoonotic Salmonella and Campylobacter from humans, animals and food, and resistance in indicator Escherichia coli as well as in meticillin‐resistant Staphylococcus aureus from animals and food were addressed. ‘Microbiological’ resistance was assessed using epidemiological cut‐off (ECOFF) values; for some countries, qualitative data on isolates from humans were interpreted in a way that corresponds closely to ECOFF‐defined ‘microbiological’ resistance. In Salmonella from humans, the occurrence of resistance to ampicillin, sulfonamides and tetracyclines was high, whereas resistance to third‐generation cephalosporins was low. In Salmonella and E. coli isolates from broilers, fattening turkeys and their meat, resistance to ampicillin, (fluoro)quinolones, tetracyclines and sulfonamides was frequently high, whereas resistance to third‐generation cephalosporins was rare. The occurrence of ESBL‐/AmpC producers was low in Salmonella and E. coli from poultry and in Salmonella from humans. The prevalence of ESBL‐/AmpC‐producing E. coli, assessed in poultry and its meat for the first time, showed marked variations among MSs. Fourteen presumptive carbapenemase‐producing E. coli were detected from broilers and its meat in two MSs. Resistance to colistin was observed at low levels in Salmonella and E. coli from poultry and meat thereof and in Salmonella from humans. In Campylobacter from humans, broilers and broiler meat, resistance to ciprofloxacin and tetracyclines was high to extremely high, whereas resistance to erythromycin was low to moderate. Combined resistance to critically important antimicrobials in isolates from both humans and animals was generally uncommon, but very high to extremely high multidrug resistance levels were observed in certain Salmonella serovars. Specific serovars of Salmonella (notably Kentucky) from both humans and animals exhibited high‐level resistance to ciprofloxacin, in addition to findings of ESBL.
Keywords: antimicrobial resistance, zoonotic bacteria, indicator bacteria, ESBL
Summary
Highlights.
Zoonoses are infections that are transmissible between animals and humans. Infections can be acquired directly from animals, via environmental exposure or through the ingestion of contaminated foodstuffs. The severity of these diseases in humans can vary from mild symptoms to life‐threatening conditions. Zoonotic bacteria that are resistant to antimicrobials are of particular concern, as they might compromise the effective treatment of infections in humans. Data from the European Union (EU) Member States (MSs) are collected and analysed in order to monitor the occurrence of antimicrobial resistance (AMR) in zoonotic bacteria isolated from humans, animals and food in the EU.
For 2016, 27 MSs reported data on AMR in zoonotic bacteria to the European Food Safety Authority (EFSA), and 23 MSs submitted data to the European Centre for Disease Prevention and Control (ECDC). In addition, three other European countries provided information. The enhanced monitoring of AMR in bacteria from food and food‐producing animals set out in Commission Implementing Decision 2013/652/EU was successfully implemented in reporting MSs and non‐MSs in the EU during 2016. In accordance with the legislation, the 2016 AMR data on food and food‐producing animals specifically targeted different poultry populations and their derived meat. EFSA and ECDC performed the analyses of the data, the results of which are published in this EU Summary Report on AMR. Data on resistance were reported regarding Salmonella and Campylobacter isolates from humans, poultry and poultry meat, whereas data on indicator commensal Escherichia coli isolates were related only to poultry and its derived meat. Some MSs also reported data on the occurrence of meticillin‐resistant Staphylococcus aureus (MRSA) in animals and food; the antimicrobial susceptibility of MRSA isolates was reported additionally by three countries.
The quantitative data on AMR in isolates from humans, poultry and poultry meat were assessed using harmonised epidemiological cut‐off values (ECOFFs) that define ‘microbiological’ resistance, i.e. reduced susceptibility to the antimicrobials tested, as well as using clinical breakpoints (CBPs), when considered appropriate. The categorical (qualitative) data on AMR in isolates from humans interpreted by using CBPs were aligned with ‘microbiological’ resistance by combining ‘clinically resistant’ and ‘intermediate resistant’ isolates into a non‐susceptible group. Isolates from different sources should only be directly compared when methods and interpretive criteria are comparable.
The information published in this report provides an overview of AMR in most MSs with detailed consideration of certain important aspects, such as multidrug resistance (MDR), complete susceptibility and combined resistance patterns to critically important antimicrobials in both human and animal isolates at the EU level but also at country level. In addition, for all bacterial species, AMR data could be analysed at the production‐type level, such as broilers and laying hens of Gallus gallus and fattening turkeys, which allows the analysis of the data to be fine‐tuned. More specifically, reporting data at isolate level allowed characterisation of important patterns of resistance, enabling Salmonella serovars to be linked to particular resistance patterns and to identify high‐level resistance to fluoroquinolones and important resistance phenotypes in both Salmonella and indicator E. coli. The information published in this report provides an overview of resistance in most MSs with detailed consideration of certain important aspects.
Overall, in Salmonella from humans, the occurrence of resistance to ampicillin, sulfonamides and tetracyclines was high, whereas resistance to third‐generation cephalosporins was low. In Salmonella and E. coli isolates from broilers, fattening turkeys and their meat, resistance to ampicillin, (fluoro)quinolones, tetracyclines and sulfonamides was frequently high, whereas resistance to third‐generation cephalosporins was rare. Resistance to colistin was observed at low levels in Salmonella and E. coli from poultry and meat thereof and in Salmonella from humans. In Campylobacter from broilers and broiler meat, resistance to ciprofloxacin and tetracyclines was high to extremely high, whereas resistance to erythromycin was low to moderate. Generally, low to very low levels of ‘microbiological’ combined resistance to critically important antimicrobials in Salmonella spp., Campylobacter jejuni and indicator E. coli from poultry were reported. Similar findings were made in isolates from humans with the exception of Salmonella serovar Kentucky (see below). Regarding trends, interestingly, certain MSs, already implementing a national control programme of AMR in food‐producing animals, registered decreasing trends in resistance, whereas other MSs reported either relatively stable or increasing resistance in indicator E. coli isolates from broilers between 2008 and 2016. For Salmonella isolates from humans, more countries observed decreasing trends in ampicillin resistance than countries with increasing trends in the period 2013–2016. For Campylobacter isolates from humans, more countries observed increasing trends in ciprofloxacin resistance and tetracycline resistance than countries with decreasing trends in the same period.
Highlights of this report also include the continued monitoring of the spread of certain highly resistant Salmonella serovars. Two serovars in particular, S. Infantis and S. Kentucky, contribute significantly to the overall numbers of multidrug‐resistant Salmonella in Europe. S. Kentucky displays high‐level resistance to ciprofloxacin and some were also ESBL‐producing (e.g. a fifth of S. Kentucky from humans), and is an important public health concern because ciprofloxacin and third‐generation cephalosporins are the two critical antimicrobials for treatment of invasive salmonellosis in humans.
The inclusion within the harmonised monitoring scheme of a supplementary panel of antimicrobials, to be tested when certain resistances to an initial panel of antimicrobials are detected, enabled detailed screening of resistance to three carbapenem compounds. None of the Salmonella spp. isolates from poultry and meat thereof collected within the routine monitoring were reported as microbiologically resistant to meropenem or imipenem, and only one isolate from broiler meat and one from broilers were microbiologically resistant to ertapenem.
Supplementary testing also allowed detailed characterisation of the β‐lactam resistance phenotypes occurring in Salmonella from poultry and its meat and indicator E. coli from poultry. It enabled further phenotypic characterisation of third‐generation cephalosporin and carbapenem resistance in Salmonella and indicator E. coli, by inferring presumptive profiles of ESBL‐/AmpC‐/carbapenemase producers. The occurrence of extended‐spectrum β‐lactamase (ESBL)‐/AmpC producers in Salmonella and indicator E. coli from poultry was assessed as being at low levels. ESBL‐ and AmpC‐producing Salmonella was detected at low levels also in humans, but in a significant proportion of some serovars, although the latter could be affected by only a few isolates of a specific serovar being tested.
For the first time in 2016, specific monitoring of ESBL‐/AmpC‐/carbapenemase‐producing E. coli, which enables detection of very low numbers of resistant isolates present within a sample, was mandatorily performed on caecal samples from broilers, fattening turkeys and meat from broilers. The occurrence and prevalence of E. coli showing an ESBL, AmpC and ESBL+AmpC profiles from these animal populations and kinds of meat were assessed at both the reporting MS‐group level and the individual MS level. Overall and in most but not all countries, the detection of ESBL‐producing E. coli exceeded that of AmpC‐producing E. coli in broilers, fattening turkeys and meat from broilers. Prevalence observed for meat from broilers was overall similar to that observed in broilers. The prevalence of E. coli with a presumptive ESBL‐producing phenotype in the animals tested varied widely, from low to very high levels, between reporting countries.
In 2016, fourteen presumptive carbapenemase‐producing indicator commensal E. coli isolates from broilers and broiler meat were reported by two MSs (Cyprus 11 isolates and Romania 3 isolates). These isolates were collected within the framework of all monitoring programmes, whether routine monitoring, specific monitoring of ESBL/AmpC/carbapenemase‐producing E. coli or specific monitoring of carbapenemase‐producing microorganisms (voluntary monitoring), and whatever the isolation method used (with non‐selective medium, medium containing cephalosporins, and/or medium containing carbapenem, respectively). Within the mandatory routine monitoring (non‐specific), Cyprus reported one isolate from broilers. Within the mandatory specific monitoring of ESBL/AmpC/carbapenemase‐producing E. coli, Cyprus reported 8 isolates collected from meat from broilers. The voluntary specific carbapenemase‐producing monitoring was also successful to detect two OXA‐48‐producing E. coli isolates from broilers (isolates) and one from broiler meat in Romania, and two presumptive carbapenemase‐producing E. coli isolates from broilers and broiler meat (one from each) in Cyprus. The isolates reported by Cyprus have not yet been confirmed genotypically and require further investigations.
Linezolid is considered to be one of the last‐resort antimicrobials for the treatment of infections caused by highly resistant MRSA, and two LA‐MRSA isolates from the pig production sector in Belgium were reported to be linezolid‐resistant. The detection of the transferable linezolid resistance gene cfr in LA‐MRSA in animals, although at a very low prevalence, may have important public health implications, especially for those people in direct contact with animals who are the most at risk of an LA‐MRSA infection.
The introduction of Commission implementing Decision 2013/652/EU planning the implementation of revised panels of antimicrobials to be tested and specific monitoring has enabled to enlarge the scope of the AMR monitoring, and to enhance the reliability of the results. The continually evolving threat from emerging resistance underlines the need to review the data collected, interpret the findings and assess trends in a constant manner. This report has attempted to highlight some of the most important findings in 2016, but space constraints mean that it is necessarily selective.
Main findings on antimicrobial resistance in Salmonella spp.
The Salmonella spp. data presented in this report comprise all reported non‐typhoidal Salmonella serovars and represent the overall occurrence of AMR in Salmonella spp. in humans and various poultry populations and their meat. Differences in the prevalence of particular serovars and phage types of Salmonella in different countries and poultry populations, and their associated patterns of resistance, may explain some of the differences in the levels of AMR, MDR (reduced susceptibility to at least three of the nine antimicrobial classes tested according to ECOFFs) and complete susceptibility (susceptibility to all the antimicrobial classes tested of the harmonised panel). The spread of particularly resistant clones and the occurrence of resistance genes within these clones can be exacerbated by the use of antimicrobials in human and animal populations and the associated selective pressure. Other factors, such as foreign travel by humans, international food trade, animal movements, farming systems, animal husbandry and the pyramidal structure of some types of animal primary production, may also influence the spread of resistant clones.
In addition to the aggregated data for Salmonella spp., resistance data from isolates from humans were also analysed separately for some of the Salmonella serovars common in human infections and frequently found in broilers, laying hens and/or turkeys: S. Enteritidis, S. Typhimurium, S. Infantis and S. Kentucky. Data are also presented separately for the most common Salmonella serovars in flocks of broilers, laying hens and fattening turkeys, notably S. Infantis, S. Enteritidis, S. Kentucky and S. Derby, due to their high occurrence and the high level of certain resistance observed in animal isolates. In poultry populations and poultry meat, resistance profiles of isolates belonging to these serovars were considered also when less than 10 isolates were recovered from a given animal/food category in a country to account for the low prevalence of certain serovars, to prevent exclusion of emerging serovars and to ensure that the analysis included all relevant data.
The number of countries reporting results for meat from broilers and turkeys differed; the numbers of isolates available for testing in each reporting country were also variable and these factors introduce a source of variation into the results for all reporting countries.
Occurrence of antimicrobial resistance in humans
For 2016, 23 MSs and 2 non‐MSs reported data on AMR in Salmonella isolates from human cases of salmonellosis. Seventeen countries provided data as measured values (quantitative data), which was three more than in 2015. The reported data represented 20.4% of the confirmed human salmonellosis cases reported in the EU/European Economic Area (EEA) in 2016.
High proportions of human Salmonella isolates were resistant to sulfonamides (34.6%), ampicillin (29.5%) and tetracyclines (29.2%). MDR was high overall (26.5%) in the EU. Among the investigated serovars, S. Kentucky exhibited extremely high MDR (76.3%) and almost half of the isolates were resistant to at least five antimicrobial classes. About 40% of both S. Infantis and S. Typhimurium isolates were MDR and one isolate of S. Typhimurium was reported to be resistant to eight of the nine tested substances, only susceptible to meropenem.
The proportions of Salmonella isolates resistant to either of the clinically important antimicrobials ciprofloxacin and cefotaxime were relatively low overall (11.0% resistant to ciprofloxacin and 1.2% to cefotaxime). Extremely high proportions (85.8%) were however resistant to ciprofloxacin in S. Kentucky and a few countries reported extremely high proportions also in S. Infantis and S. Typhimurium. ‘Clinical’ and ‘microbiological’ combined resistance to ciprofloxacin and cefotaxime was overall very low in Salmonella spp. (0.6% and 0.5%, respectively).
Regarding resistance trends in the two most common Salmonella serovars in humans, S. Enteritidis and S. Typhimurium, more countries observed decreasing trends in ampicillin resistance than those with increasing trends in the period 2013–2016. Trends in resistance to ciprofloxacin differed between the serovars. However, increasing trends were more common in S. Typhimurium, decreasing trends were more common in S. Enteritidis.
Thirteen MSs and one non‐MS performed testing for the presence of ESBL‐ and AmpC‐producing Salmonella spp. in human isolates. ESBL‐producing Salmonella bacteria were identified in all 13 MSs in 0.8% of the isolates and encompassed 12 different serovars (Table 1). S. Kentucky with ESBL was detected in four of 13 MSs (in 19.8% of the tested S. Kentucky isolates) and S. Infantis with ESBL in three countries (in 2.5% of the tested S. Infantis isolates). ESBL was more common in S. Typhimurium and monophasic S. Typhimurium 1,4,[5],12:i:‐ than in S. Enteritidis but their proportion was small in comparison with the total number of isolates. AmpC‐producing Salmonella were detected in three MSs at a lower proportion (0.1%) than ESBL. No meropenem resistance was detected in Salmonella isolates from humans; however, the meropenem results were interpreted with clinical breakpoints (CBPs) in 7 of 23 reporting countries and the European Committee on Antimicrobial Susceptibility Testing (EUCAST) CBP for meropenem resistance in Salmonella is much less sensitive than the EUCAST ECOFF.
Table 1.
Summary of presumptive ESBL‐ and AmpC‐producing Salmonella spp. isolates from meat from broilers, broilers, meat from turkeys, fattening turkeys and laying hens collected within the routine monitoring in 2016
| Matrix | Presumptive ESBL and/or AmpC producersa n (%R) | Presumptive ESBL producersb n (%R) | Presumptive AmpC producersc n (%R) | Presumptive ESBL+AmpC producers n (%R) | Presumptive CP n (%R) |
|---|---|---|---|---|---|
| Humans (N = 8,746, 13 MSs) | 76 (0.9) | 70 (0.8) | 5 (0.1) | 0 (< 0.01) | 0 (< 0.01) |
| Meat from broilers (N = 763, 19 MSs) | 19 (2.5) | 16 (2.1) | 5 (0.7) | 2 (0.6) | 0 (< 0.48) |
| Broilers (N = 1,717, 22 MSs) | 14 (0.8) | 11 (0.6) | 3 (0.2) | 0 (< 0.21) | 0 (< 0.21) |
| Meat from turkeys (N = 295, 8 MSs) | 3 (1.0) | 3 (1.0) | 1 (0.3) | 1 (0.3) | 0 (< 1.3) |
| Fattening turkeys (N = 663, 11 MSs) | 6 (0.9) | 6 (0.9) | 0 (< 0.6) | 0 (< 0.6) | 0 (< 0.6) |
| Laying hens (N = 1,216, 22 MSs) | 1 (0.1) | 1 (0.1) | 0 (< 0.3) | 0 (< 0.3) | 0 (< 0.3) |
N: Total number of isolates reported for this monitoring by the MSs; n: number of the isolates resistant; % R: percentage of resistant isolates; ESBL: extended‐spectrum β‐lactamase; MS: Member States; CP: carbapenemase producers.
Isolates exhibiting only ESBL‐ and/or only AmpC‐ and/or ESBL+AmpC phenotype.
Isolates exhibiting an ESBL‐ and ESBL+AmpC phenotype.
Isolates exhibiting an AmpC‐ and ESBL+AmpC phenotype.
Occurrence of antimicrobial resistance in poultry populations and their derived meat
For 2016, information on AMR in Salmonella isolates from poultry populations and their derived meat was reported by 22 MSs and 2 non‐MS.
Among the Salmonella spp. isolates from poultry meat, the highest levels of resistance to (fluoro)quinolones (ciprofloxacin and nalidixic acid) were noted in broiler meat, from which high to extremely high levels were recorded by most of the MSs included in the analysis (overall, 64.7% and 61.5%, respectively). In Salmonella spp. isolates from turkey meat, both ciprofloxacin and nalidixic acid resistance varied between high and extremely high levels among the eight reporting MSs (overall, 43.7% and 40%, respectively). Among all serovars from poultry meat, isolates resistant to ciprofloxacin, but not to nalidixic acid, were observed, probably indicating an increasing occurrence of plasmid‐mediated quinolone resistance. Conversely, ‘microbiological’ resistance to the third‐generation cephalosporins (cefotaxime and ceftazidime) in Salmonella spp. from poultry meat was either not discerned or detected at low levels in most of the reporting MSs, with the exception of Portugal which reported high levels of resistance at 39.4%. Resistance to tetracycline, ampicillin and sulfamethoxazole in Salmonella spp. isolates from poultry meat generally ranged from moderate to extremely high. The highest levels of resistance to these substances were typically observed among S. Infantis isolates from broiler meat, resulting in extremely high levels of MDR (> 70.0%). Resistance to azithromycin in Salmonella spp. isolates from broiler meat was generally low or not detected, with the exception of Belgium and Portugal which reported low levels of resistance at 8% and 3%, respectively. In turkey meat, resistance to azithromycin in Salmonella spp. isolates was reported only by Germany (8.9%). Resistance to carbapenems (meropenem) in Salmonella spp. in poultry meat was not observed in any of the reporting countries.
MDR (reduced susceptibility to at least three of the nine antimicrobial classes tested) in Salmonella spp. was overall high and almost at the same level in broiler and turkey meat (50.3% and 23.7%, respectively). The rate of complete susceptibility (susceptibility to all the antimicrobial classes tested of the harmonised panel) among Salmonella spp. isolates was overall high in broiler and turkey meat (27% and 18.6%, respectively). Situations regarding MDR and complete susceptibility varied markedly between reporting countries.
Among Salmonella spp. isolates from poultry populations, most MSs reported moderate or high to extremely high resistance to tetracyclines and sulfonamides, and similar or slightly lower levels of ampicillin resistance. Resistance levels were generally higher in isolates from fattening turkeys than from broilers and laying hens. Overall, high levels of resistance to (fluoro)quinolones (ciprofloxacin and nalidixic acid) were observed in Salmonella spp. isolates from fattening turkeys (overall, 50.5% and 36.5%, respectively) and broilers (overall, 53.8% and 48.3%, respectively) compared with the moderate levels recorded in Salmonella spp. isolates from laying hens (overall, 17.3% and 16%, respectively). Among all serovars from poultry, isolates resistant to ciprofloxacin, but not to nalidixic acid, were observed, probably indicating an increasing occurrence of plasmid‐mediated quinolone resistance. Resistance to third‐generation cephalosporins (cefotaxime and ceftazidime) was generally at very low or low levels in Salmonella spp. isolates from broilers (overall, 0.8% and 0.6%, respectively) in most reporting MSs, with the striking exception of the 12% cefotaxime and ceftazidime resistance reported in Salmonella spp. from broilers in Italy. In laying hens (overall, 0.1% and 0%, respectively), third‐generation cephalosporin resistance was not detected in reporting countries, except in Malta where two cefotaxime‐resistant isolates were detected. For fattening turkeys, resistance to third‐generation cephalosporins was only detected at low to very low levels in Spain (3.5% and 0.6%, respectively), resulting in overall resistance of 0.9% and 0.2%, respectively. It is of note that all the isolates detected as ‘microbiologically’ resistant also exhibited ‘clinical’ resistance. Resistance to meropenem in Salmonella spp. in poultry was not observed in any of the reporting countries.
Generally, low to very low levels of ‘microbiological’ combined resistance to ciprofloxacin and cefotaxime in Salmonella spp. from broiler flocks (0.75%), laying hen flocks (0.08%) and fattening turkey flocks (0.75%, corresponding to only five isolates in Spain) were reported. A striking exception to this pattern is Italy, where the ‘microbiological’ combined resistance to ciprofloxacin and cefotaxime in Salmonella spp. from broilers was assessed at the moderate level of 12%. Nevertheless, when the combined resistance to ciprofloxacin and cefotaxime was interpreted using CBPs in isolates from broilers, only one isolate in Romania and two in Malta displayed ‘clinical’ resistance. MDR (reduced susceptibility to at least three of the nine antimicrobial classes tested) in Salmonella spp. was overall low in laying hens (overall, 6.6%), high in broilers (overall, 39.7%) and in fattening turkeys (overall, 42.8%). Complete susceptibility (susceptibility to all the antimicrobial classes tested of the harmonised panel) among Salmonella spp. isolates was overall extremely high in laying hens (overall, 75.6%), high in broilers (overall, 35.6%), and moderate in fattening turkeys (overall, 18.6%). Situations that concern MDR and complete susceptibility varied markedly between reporting countries.
Phenotypic characterisation of third‐generation cephalosporin and carbapenem resistance in Salmonella spp.
The proportion of Salmonella spp. isolates from poultry and its meat collected within the routine monitoring in the MSs and considered as presumptive ESBL, AmpC, ESBL+AmpC producers was very low, as only 43 isolates from meat from broilers, broilers, meat from turkeys, fattening turkeys and laying hens presented any of these phenotypes (0.9% of all isolates tested by the MSs). The highest number of presumptive ESBL producers was found in meat from broilers (16 isolates, 2.1%) (Table 1).
The ESBL‐ or AmpC phenotype was particularly associated with certain serovars, mainly S. Infantis, S. Paratyphi B dT+, S. Typhimurium monophasic variant and S. Agona in poultry and S. Kentucky, S. Infantis, S. Typhimurium and its monophasic variant in humans.
None of the Salmonella spp. isolates from poultry and its meat collected within the routine monitoring was reported as microbiologically resistant to meropenem or imipenem, and only one isolate from broiler meat and one from broilers were microbiologically resistant to ertapenem.
Occurrence of resistance at Salmonella serovar level
Poultry populations (broilers, laying hens and fattening turkeys) were the main focus of the monitoring in 2016 in accordance with Commission Implementing Decision 2013/652/EU. The detailed reporting of results at the serovar level clearly demonstrates the major contribution of a few serovars to the observed occurrence of resistance in Salmonella. In broilers, eight serovars (Infantis, Enteritidis, Mbandaka, Kentucky, Senftenberg, Typhimurium, Kedougou, Thompson and monophasic Typhimurium) accounted for 73.8% of Salmonella spp. and in laying hens, eight serovars (Enteritidis, Infantis, Kentucky, Mbandaka, Typhimurium, Livingstone, Agona, monophasic Typhimurium, Senftenberg) accounted for 69.9% of Salmonella spp. In fattening turkeys, eight serovars (Derby, Infantis, Newport, Kedougou, Bredeney, Kentucky, monophasic Typhimurium, Hadar, Senftenberg, Typhimurium and Agona) accounted for 85.1% of Salmonella spp. Patterns of resistance associated with these serovars, may therefore be expected to have a marked influence on the overall resistance levels in Salmonella from these types of poultry.
S. Infantis is a dominant serovar in broilers, accounting for 38.5% of all Salmonella isolates examined from broilers (659/1,717), and commonly (94.4%) showing resistance to one or more antimicrobials. The proportion of all isolates showing MDR in broilers was also greatly influenced by the occurrence of multiresistant S. Infantis, this serovar accounting for approximately 31% of the multiresistant isolates in broilers. Particular MDR patterns were associated with S. Infantis and because this serovar was prevalent in many countries, these patterns greatly influenced the overall resistance figures. Underlining the significance of resistance in S. Infantis, resistance to third‐generation cephalosporins in isolates from broilers in Italy (with a presumptive ESBL phenotype) and high‐level resistance to ciprofloxacin were both detected in this serovar. High‐level ciprofloxacin resistance was otherwise detected mainly in S. Kentucky, a further significant serovar in poultry in Europe in 2016.
In contrast, S. Enteritidis was much less commonly multiresistant than S. Infantis. S. Enteritidis was the second most dominant serovar in broilers, accounting for 10.6% (182/1717) of all Salmonella isolates examined in broilers and the predominant serovar in laying hens, accounting for 33.1% (400/1,194) of all Salmonella isolates tested in laying hens. The majority of S. Enteritidis isolates from broiler meat, broilers and laying hens, exhibited complete susceptibility to the harmonised set of antimicrobials tested. Nevertheless, higher levels of resistance to colistin were observed for S. Enteritidis than for other Salmonella serovars. This has been reported previously (Agersø et al., 2012) and is considered to reflect probable intrinsic differences in susceptibility for certain serovars of Salmonella (belonging to serogroup O:9 Salmonella according to the Kauffman‐White Scheme; Grimont and Weill, 2013).
High‐level resistance to ciprofloxacin was most often observed in S. Kentucky isolates from Gallus gallus in Cyprus, the Czech Republic, Hungary, Malta, Portugal Romania, Spain and the UK; from turkeys in the Czech Republic, Hungary, Italy, Poland and Spain; in broiler meat from Belgium, Malta, Portugal, Romania Slovakia and Spain; in turkey meat in the Czech Republic, Germany, Hungary, Poland, Portugal, Slovakia and Spain. Most of the S. Kentucky isolates with high‐level ciprofloxacin resistance were multiresistant. S. Kentucky with high‐level ciprofloxacin resistance is likely to belong to the multilocus sequence type ST198 clone, which has shown epidemic spread in North Africa and the Middle East (Le Hello et al., 2013).
S. Derby was the most often reported serovar in turkey flocks representing more than 20% of the isolates. These isolates were identified by three MSs, France, Spain and the United Kingdom, and the full susceptibility level was very low.
Main findings on antimicrobial resistance in Campylobacter spp.
In humans
For 2016, 17 MSs and two non‐MSs reported data on AMR in Campylobacter isolates from human cases of campylobacteriosis. Thirteen countries provided data as measured values (quantitative data), one more compared with 2015. The reported data from the 19 countries represented 24.3% and 22.3% of the confirmed human cases with Campylobacter jejuni and Campylobacter coli, respectively, reported in the EU/EEA in 2016.
Very high to extremely high resistance levels to ciprofloxacin were reported in C. jejuni isolates from humans by all MSs except Denmark, Iceland, Norway and the United Kingdom. Nine out of 19 reporting countries had levels of ciprofloxacin resistance in C. coli of 80–100% with increasing trends in 2013–2016 in two MSs. For C. jejuni, increasing trends of fluoroquinolone resistance was observed in five MSs. The level of acquired resistance to fluoroquinolones is so high in some MSs that this antimicrobial can no longer be considered appropriate for routine empirical treatment of Campylobacter infections in humans.
While the proportion of human C. jejuni isolates resistant to erythromycin was low overall (2.1%), it was markedly higher in C. coli (11.0%) with high to very high proportions (22.8–63.2%) of C. coli being resistant in 5 of 16 reporting MSs. Increasing trends of erythromycin resistance in 2013–2016 was observed in two MSs and one non‐MS for C. jejuni from humans while decreasing trends were observed in two MSs for C. jejuni and one for C. coli from humans. Combined clinical and microbiological resistance to both ciprofloxacin and erythromycin, which are considered critically important for treatment of campylobacteriosis, was very low in C. jejuni and low in C. coli. Two countries however reported high levels of combined clinical resistance in C. coli from humans. Almost all of the isolates having combined resistance to ciprofloxacin and erythromycin were in addition resistant to tetracycline, an antimicrobial which is also used in treatment of Campylobacter infections in humans. In three MS, this resistance combination was observed in a third to more than half of the tested isolates.
In broilers
For 2016, 24 MSs and 3 non‐MSs reported data on Campylobacter from broilers, fattening turkeys and their derived meat. As in previous years, the resistance percentages varied markedly between the different MSs, in particular for ciprofloxacin, nalidixic acid and tetracycline (Figure 1).
Figure 1.
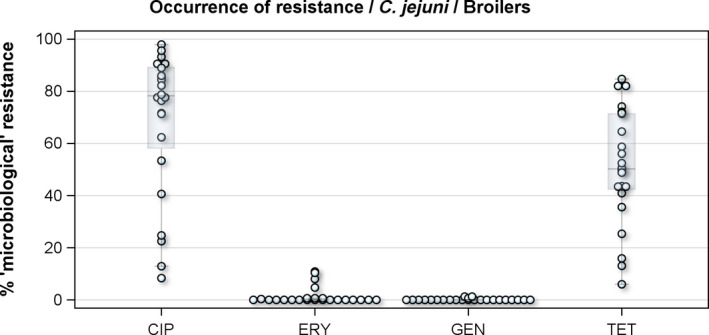
Distribution of the occurrence of resistance to ciprofloxacin (CIP), erythromycin (ERY), gentamicin (GEN) and tetracyclines (TET) in C. jejuni from broilers, 24 EU MSs, 2016
- Dots represent reporting MSs.
For the 3,117 C. jejuni from broilers reported by 24 MSs, the overall observed levels of resistance to ciprofloxacin (66.9%), nalidixic acid (61.7%) and tetracyclines (50.7%) were very high, whereas those to erythromycin (1.3%), streptomycin (6.1%) and gentamicin (0.1%) were low to very low. Considering all reporting MSs, the overall occurrence of combined resistance to the critically important antimicrobials, ciprofloxacin and erythromycin, in C. jejuni was assessed at 1.2%. Overall, complete susceptibility was found in 27.7% of the C. jejuni isolates tested. Resistance to three antimicrobial classes (MDR) in C. jejuni isolates from broilers was observed in 9 countries (out of 27 countries reporting data). For the 24 MSs, the overall MDR of the C. jejuni isolates was 1.1%. Over the 2008–2016 period, the main statistically significant increasing trends were observed for ciprofloxacin and tetracycline in ten and nine European countries, respectively (Figure 1).
In addition, on a voluntary basis, five MSs also reported resistance data for a total of 162 C. coli from broilers. The ciprofloxacin and nalidixic acid overall percentages of resistance were extremely high (87.7% and 84.6%, respectively), and the level of resistance to tetracycline was very high (61.7%). The percentage of resistance to streptomycin was moderate (15.5%) and those of resistance to gentamicin and erythromycin were low (0.6%) and very low (1.2%), respectively. Only 17 C. coli isolates out of 162 (10.5%) were susceptible to all tested antimicrobials. Three (1.9%) C. coli were found resistant to three classes of antimicrobials, two of them (1.2%) being resistant to both ciprofloxacin and erythromycin.
In fattening turkeys
Regarding fattening turkeys, nine MSs reported results for 1061 C. jejuni isolates. The overall percentages of resistance to ciprofloxacin, nalidixic acid and tetracycline were very high, respectively 76.2%, 68.7% and 57.6%, but those to erythromycin (1%), streptomycin (5.7%) and gentamicin (0.2%) were low to very low. The overall occurrence of combined resistance to ciprofloxacin and erythromycin in C. jejuni was 1.0%. Complete susceptibility to the common set of antimicrobials for Campylobacter spp. was observed for 17.2% of the isolates among the reporting countries. The overall rate of MDR in C. jejuni from fattening turkeys was assessed at 1.0% (Figure 2).
Figure 2.
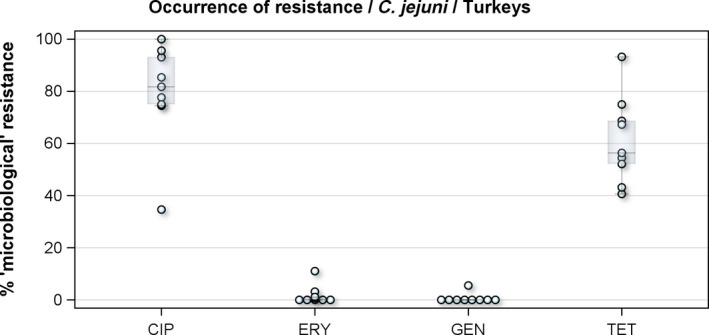
Distribution of the occurrence of resistance to ciprofloxacin (CIP), erythromycin (ERY), gentamicin (GEN) and tetracyclines (TET) in C. jejuni from fattening turkeys, nine EU MSs, 2016
- Dots represent reporting MSs.
Two MSs also reported data on C. coli (n = 251) in fattening turkeys. Resistance levels to antimicrobials were typically higher in C. coli than those in C. jejuni for fattening turkeys, in particular, on erythromycin and streptomycin. No combined resistance to ciprofloxacin and erythromycin was detected in C. coli from fattening turkeys in the two reporting countries in 2016.
Main findings on antimicrobial resistance in indicator commensal Escherichia coli
In 2016, 27 MSs and 3 non‐MSs reported quantitative data on AMR in indicator commensal E. coli isolates from broilers and their meat and 11 MSs and 1 non‐MS the corresponding data for fattening turkeys and their meat.
In broilers
For broilers, the highest overall ‘microbiological’ resistance levels observed in the reporting MSs were to the quinolones, i.e. nalidixic acid (59.8%) and ciprofloxacin (64.0%), and to ampicillin (58.0%), sulfamethoxazole (49.9%), tetracycline (47.1%) and trimethoprim (40.7%). Levels of resistance to the third‐generation cephalosporins, cefotaxime and ceftazidime, were similar at 4.0% and 3.6%, respectively. There were substantial variations in levels of resistance between the reporting MSs (Figure 3).
Figure 3.
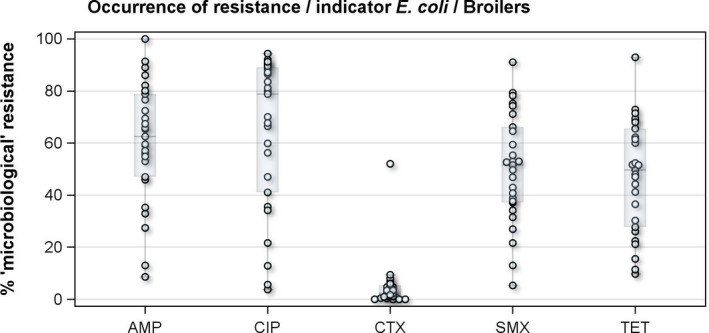
Distribution of the occurrence of resistance to ampicillin (AMP), ciprofloxacin (CIP), colistin (CST), cefotaxime (CTX) and tetracyclines (TET) in indicator commensal E. coli from broilers, 27 EU MSs, 2016
- Dots represent reporting MSs.
Overall, levels of resistance to single antimicrobials were generally similar, or lower by up to 5%, in 2016 and in 2014. There were however deviations from this general pattern in individual MSs. Notably, in 11 MSs, there are 24 statistically significant decreasing and 10 increasing trends in level of resistance to ampicillin, ciprofloxacin, cefotaxime or tetracycline in the period 2008–2016.
The level of MDR (i.e. resistance, according to ECOFFs, to at least three antimicrobial classes) was overall very high (50.2%) but there was considerable variation between the reporting MSs. Of the E. coli isolates reported by the MSs, 3.1% exhibited combined resistance to ciprofloxacin and cefotaxime for ‘microbiological’ resistance and 1.2% for ‘clinical resistance’.
In fattening turkeys
For fattening turkeys, the highest overall ‘microbiological’ resistance levels observed in the reporting MSs were tetracycline (64.8%), ampicillin (64.6%), quinolones, i.e. nalidixic acid (37.2%) and ciprofloxacin (46.3%), sulfamethoxazole (42.8%) and trimethoprim (34.3%). Levels of resistance to the third‐generation cephalosporins, cefotaxime and ceftazidime, were similar at 2.7% and 2.6%, respectively. There were substantial variations in levels of resistance between the reporting MSs (Figure 4).
Figure 4.
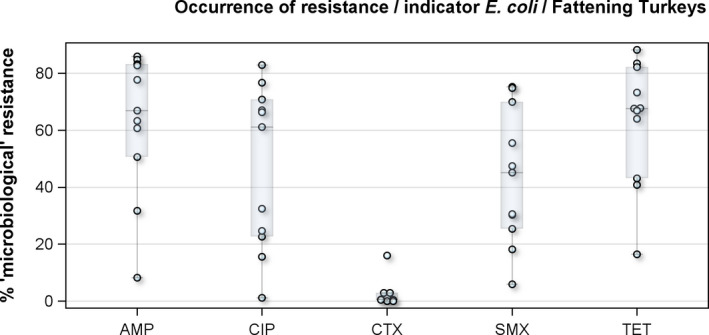
Distribution of the occurrence of resistance to ampicillin (AMP), ciprofloxacin (CIP), colistin (CST), cefotaxime (CTX) and tetracyclines (TET) in indicator commensal E. coli from fattening turkeys, 10 EU MSs, 2016
- Dots represent reporting MSs.
Overall, levels of resistance to single antimicrobials were generally similar, or lower by up to 8.3%, in 2016 and in 2014. At the EU level, resistance to ampicillin, tetracycline, ciprofloxacin and nalidixic acid was statistically lower in 2016 than in 2014. In individual MSs, there were however deviations from this general pattern.
The level of MDR (i.e. resistance to at least three antimicrobial classes according to ECOFFs) was overall high (48.7%) but there was considerable variation between the reporting MSs. Of the E. coli isolates reported by the MSs, 2.2% exhibited combined resistance to ciprofloxacin and cefotaxime for ‘microbiological’ resistance and 1.3% for ‘clinical resistance’.
General observations on indicator E. coli from broilers and fattening turkeys
Levels of resistance to single antimicrobials were mostly of similar magnitude in E. coli isolates from broilers and fattening turkeys and the difference for single antimicrobials was generally < 10% in the reporting MS group. Exceptions were quinolone resistance, which was more common in broilers than in turkeys, and tetracycline resistance which was more common in fattening turkeys than in broilers. Notably, resistance to ampicillin, sulfamethoxazole, tetracycline and trimethoprim was common (> 20%) also in E. coli from pigs and calves < 1 year reported by the same MSs in 2015. The high levels of resistance to these antimicrobials in E. coli from food‐producing animals, as well as the frequent occurrence of resistance to these compounds as a core component of MDR patterns in many reporting MSs, most likely reflects extensive usage of these antimicrobials in these countries over many years. The genes conferring resistance to these four compounds are also frequently linked together on mobile genetic elements, resulting in co‐selection.
Colistin‐resistant indicator E. coli were found by eight MSs in broilers and by seven MSs in fattening turkeys. The occurrence of colistin resistance was overall 1.7% in broilers and 5.7% in fattening turkeys. These figures are slightly higher than the figures reported in 2014 for broilers (0.9%) and slightly lower for fattening turkeys (7.4%). The overall occurrence of colistin resistance in reporting MSs is higher in poultry than in pigs (0.4%) and calves < 1 year (0.9%) in 2015. Resistance to colistin is discussed further in the section on antimicrobial resistance in indicator E. coli.
Further characterisation of third‐generation cephalosporin and carbapenem resistance
The proportion of indicator E. coli isolates from poultry collected within the routine monitoring by the MSs considered as presumptive ESBL, AmpC, ESBL+AmpC producers was in general low or very low (moderate only for Lithuania). In total, 230 isolates (2.2% of all isolates tested) from fattening turkeys and broilers presented any of these phenotypes, being higher this proportion in broilers that in fattening turkeys (2.7% vs. 2.2%), this value was very similar to the ones found in broilers (18) (Table 2).
Table 2.
Summary of presumptive ESBL‐ and AmpC‐producing E. coli isolates from broilers, and fattening turkeys collected within the routine monitoring in 2016
| Matrix | Presumptive ESBL and/or AmpC producersa n (%R) | Presumptive ESBL producersa n (%R)b | Presumptive AmpC producersc n (%R) | Presumptive ESBL+AmpC producers n (%R) | Presumptive CP n (%R) |
|---|---|---|---|---|---|
| Broilers (N = 8,530, 27 MS) | 184 (2.2) | 108 (1.3) | 89 (1.0) | 13 (0.2) | 0 (< 0.04) |
| Fattening turkeys (N = 1,714, 11 MS) | 46 (2.7) | 45 (2.6) | 2 (0.1) | 1 (0.1) | 0 (< 0.2) |
N: Total of isolates reported for this monitoring by the MSs; n: number of the isolates resistant; % R: percentage of resistant isolates; ESBL: extended‐ spectrum β‐lactamase; CP: carbapenemase producers; MS: Member States.
Isolates exhibiting only ESBL‐ and/or only AmpC‐ and/or ESBL+AmpC phenotype.
Isolates exhibiting an ESBL‐ and ESBL/AmpC phenotype.
Isolates exhibiting an AmpC‐ and ESBL/AmpC phenotype.
Presumptive ESBL‐ and AmpC‐producing indicator E. coli isolates in broilers were detected by 19 and 16 out of 23 MSs, respectively, reporting cephalosporin‐resistant isolates for this matrix, Lithuania being the country reporting the highest numbers of isolates (17 and 36 isolates ESBL‐ and AmpC phenotype, 17% and 36%, respectively, of all isolates tested by this MS).
Presumptive ESBL‐producing indicator E. coli isolates in fattening turkeys were detected by eight out of nine MSs reporting cephalosporin‐resistant isolates for this matrix, Spain being the country reporting the highest numbers of isolates (27 isolates ESBL phenotype, 16% of isolates tested by this MS). Only two isolates with an AmpC phenotype were reported by two MSs.
One indicator E. coli isolate from broilers reported by Cyprus showed a presumptive carbapenemase‐producing phenotype. This isolate was however not subjected to any confirmatory test to detect the resistance genotype, and requires further investigation.
Specific monitoring of ESBL‐/AmpC‐/carbapenemase‐producing E. coli
In 2016, the specific monitoring for ESBL‐/AmpC‐/carbapenemase‐producing E. coli was performed on a mandatory basis on caecal contents from broilers, fattening turkeys and fresh meat from broiler gathered at retail. Twenty‐seven MS (all except Malta) and two and three non‐MSs reported data for meat from broilers and broilers, respectively. Eleven MS and Norway reported data for fattening turkeys.
The specific monitoring employs culture of samples on selective media (including cefotaxime at 1 mg/L, which is the ECOFF for this antimicrobial), which is able to detect very low numbers of resistant isolates present within a sample. A screening breakpoint for cefotaxime and/or ceftazidime (> 1 mg/L) was applied to screen for ESBL and AmpC producers as recommended by EUCAST. The occurrence and prevalence of E. coli showing an ESBL, AmpC and ESBL+AmpC profiles from meat from broilers, broilers, and fattening turkeys deriving from specific monitoring in 2016 assessed at the reporting MS‐group level are presented in Table 3.
Table 3.
Summary of presumptive ESBL‐ and AmpC‐producing E. coli isolates from meat from broilers, broilers and fattening turkeys collected by the EU MSs within the specific ESBLs/AmpC/carbapenemase‐producing monitoring and subjected to supplementary testing in 2016
| Presumptive ESBL and/or AmpC producersa | Presumptive ESBL producersb | Presumptive AmpC producersc | Presumptive ESBL+AmpC producers | Presumptive CP | ||||||||||
|---|---|---|---|---|---|---|---|---|---|---|---|---|---|---|
| n | Prev (%) | n | Occ (%) | Prev (%) | n | Occ (%) | Prev (%) | n | Occ (%) | Prev (%) | n | Occ (%) | Prev (%) | |
| Meat from broilersd | 3,583 | 57.4 | 2,125 | 58.6 | 35.9 | 1,588 | 43.8 | 26.8 | 119 | 3.3 | 2.0 | 8 | 0.2 | 0.13 |
| Broilerse | 4,391 | 47.4 | 2,714 | 61.3 | 35.4 | 1,873 | 42.3 | 24.4 | 196 | 4.4 | 2.6 | 0 | 0 | 0 |
| Fattening turkeysf | 1,151 | 42.2 | 1,001 | 86.7 | 36.6 | 197 | 17.1 | 7.2 | 47 | 4.1 | 1.7 | 0 | 0 | 0 |
Ns: number of animal/meat samples; N: number of the isolates tested; n: number of the isolates resistant; %Occ: percentage of cephalosporin‐resistant isolates presenting a presumptive phenotype; %Prev: percentage of samples harbouring a presumptive ESBL‐/AmpC‐producing E. coli; CP: carbapenemase producers; MSs: Member States.
Isolates exhibiting only ESBL and/or only AmpC and/or ESBL + AmpC phenotype.
Isolates exhibiting an ESBL and ESBL/AmpC phenotype.
Isolates exhibiting an AmpC and ESBL/AmpC phenotype.
Ns = 6,241; N = 3,624, 27 MSs.
Ns = 9,273; N = 4,426, 27 MSs.
Ns = 2,727; N = 1,154, 11 MSs.
In those animal populations/food matrices monitored, at the reporting MS‐group level and in most but not all countries, the detection of ESBL E. coli exceeded that of AmpC E. coli. Generally, the occurrence of E. coli with an ESBL phenotype varied widely between reporting countries (almost all MS and non‐MSs reported data), occurring between 17% and 88% of meat from broilers collected at retail (only Norway did not report any isolate with this presumptive phenotype) and between 25% and 99% of broilers caecal samples examined. For fattening turkeys (only 11 MS and 1 non‐MS reported data), the occurrence of ESBLs varied between 51% and 100% (for 11 countries reporting more than 10 isolates). In general, for those reporting countries, the occurrence of ESBL in fattening turkeys was higher than that found in poultry or poultry meat. For the presence of ESBLs in the meat, there are several potential sources of bacteria on meat, including the animals from which the meat was derived, other cross‐contaminating products, machinery and the environment, as well as those workers who are producing and handling the meat product.
Among the isolates collected within the ESBL/AmpC/carbapenemase monitoring of isolates from broiler meat, Cyprus reported the presence of eight E. coli isolates showing a carbapenemase‐producer phenotype, respectively. The presence of carbapenemase‐encoding genes in the isolates reported by Cyprus needs to be further investigated. In the previous year, Germany had reported to EFSA for the first time the presence of carbapenemase‐producing (VIM‐1) E. coli collected within the EU mandatory monitoring of livestock, in this case, pig samples (Irrgang et al., 2016). The detection of all these isolates through mandatory monitoring, confirms that the monitoring is capable of detecting carbapenemase‐producing E. coli.
Specific monitoring of carbapenemase‐producing E. coli (voluntary monitoring)
The specific monitoring of carbapenemase‐producing microorganisms was performed and reported to EFSA by 19 MSs and 1 non‐MS a voluntary basis in 2016, in accordance with Commission Implementing Decision 2013/652/EU. The Netherlands also reported data from their national monitoring performed using different isolations protocols. All reporting countries focused on the isolation of carbapenemase‐producing E. coli. A high number of samples were investigated for the presence of carbapenemase‐producing E. coli in meat from broilers (4,383 samples, 18 MS), other 18 MSs investigated in broilers (5,584 samples, 18 MS). Eight MSs also investigated in fattening turkeys (1,968 samples), while one MS reported data on meat from turkeys (293 samples). From all those samples, six presumptive carbapenemase‐producing E. coli were detected in two MS.
Presumptive carbapenemase‐producing E. coli isolate were identified in these samples by Romania and Cyprus. Romania confirmed the genotype of the three presumptive carbapenemase producers, two isolates from broilers and one isolate from meat from broilers, as E. coli bla OXA‐48 carriers. The two isolates reported by Cyprus, one from broiler meat and one from broilers have not yet been confirmed genotypically. Further investigations are required to elucidate the resistance mechanisms present in these isolates.
Main findings on meticillin‐resistant Staphylococcus aureus
Monitoring of food‐producing animals is carried out periodically in conjunction with systematic surveillance of meticillin‐resistant Staphylococcus aureus (MRSA) in humans, so that trends in the diffusion and evolution of zoonotically acquired MRSA in humans can be identified. The monitoring of MRSA in animals and food is currently voluntary and only a limited number of countries reported MRSA data in 2016, with some countries additionally reporting data on spa‐type and antimicrobial susceptibility. Monitoring of other animal species, with which certain types of MRSA can be associated, provided additional useful information.
Monitoring of MRSA in food
A low number of MSs reported data on the occurrence of MRSA in food. MRSA was detected in meat from broilers, pigs, rabbits and turkeys by four countries. The occurrence of MRSA in meat can reflect colonisation of the animals from which the meat was derived with MRSA. MRSA is not generally considered to be transmitted by food, and detection often involves selective culture techniques which may detect very low levels of contamination. Spa‐typing data were reported for 13/381 MRSA isolates from meat by two MSs and considering the three broad categories of MRSA – community‐associated (CA), healthcare‐associated (HA) and livestock‐associated (LA) – most reported spa‐types (11/13) were those associated with LA‐MRSA. Of these 11 LA‐MRSA isolates, both CC398 (the most common LA‐MRSA occurring in Europe) and ST9 (the second most frequent LA‐MRSA clonal lineage) were reported. A single MRSA of spa‐type t1190 was recovered from rabbit meat in Spain. S. aureus spa‐type t1190 has previously been reported from rabbit carcases and is associated with CC96 (Merz et al., 2016). MRSA ST96/CC96 is not widely reported (Mat Azis et al., 2017) and further typing would assist with characterisation. The remaining isolate, spa‐type t153 was recovered from broiler meat in Switzerland. Spa‐type t153 has been observed in S. aureus isolates with a mosaic genome and can be associated with different clonal lineages, including CC34 and ST10 (Holtfreter et al., 2016). Both spa‐types t1190 and t153 were not categorised as CA‐MRSA or HA‐MRSA, as further typing data including Panton‐Valentine leukocidin (PVL) toxin status were not reported. A decline was evident in the occurrence of MRSA reported in broiler meat in Germany and Switzerland, compared to the monitoring performed in previous years. The reasons for the observed decline were not apparent in the reported data, but may be worthy of further investigation.
Monitoring of MRSA in healthy food‐producing animals
A low number of MSs reported data on the occurrence of MRSA in healthy food‐producing animals. MRSA was detected in pigs from three countries. There was a large degree of variation between reporting countries in the occurrence of MRSA in pigs, from 0.1% to 100.0% of herds testing positive. This variation highlights the success of Norwegian eradication programmes (0.1% prevalence) but also reflects the very small sample sizes tested in some countries. Spa‐typing data were reported for all isolates from two countries and additional multilocus sequence typing (MLST) data were reported for some of these isolates. Spa‐typing data were reported for 176/232 MRSA isolates from food‐producing animals (pigs) and most isolates were those associated with CC398 (175/176) – see Figure 5. The remaining isolate, spa‐type t037 was reported from a fattening pig herd in Belgium. Spa‐type t037 has generally been associated with ST239, a dominant sequence type of HA‐MRSA and mosaic strain which has descended from ST8 and ST30 parents.
Figure 5.
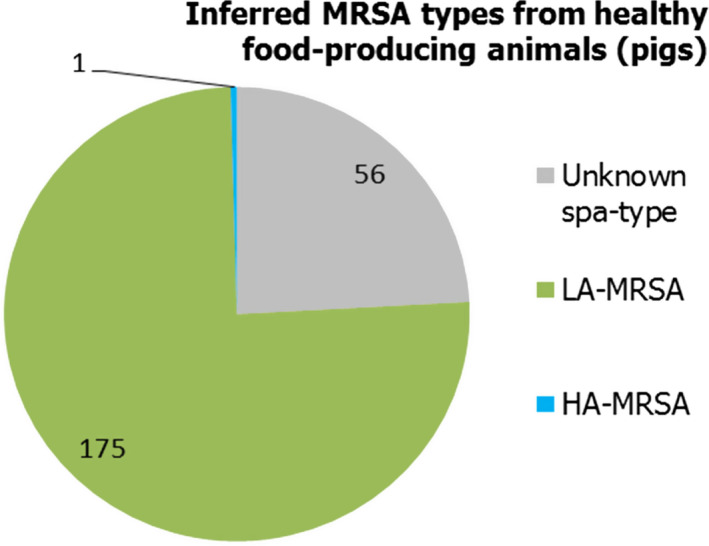
Inferred MRSA types in food‐producing animals – pigs, 2016 (232 MRSA isolates were reported, of which 176 were spa‐typed; some of these were MLST typed)
Linezolid is considered to be one of the last‐resort antimicrobials for the treatment of infections caused by highly resistant MRSA, and two LA‐MRSA isolates from Belgian breeding pigs were reported to be linezolid‐resistant. These were both spa‐type t011, sequence type CC398 and showed a similar resistance pattern across tested antimicrobials. No mutations in the 23S rRNA and L3/L4 ribosomal proteins could be found to account for the linezolid resistance which were found to harbour the (plasmidic) cfr gene. The detection of the transferable linezolid resistance gene cfr in LA‐MRSA in animals, although at a very low prevalence, may have important public health implications, especially for those people in direct contact with animals who are most at risk of LA‐MRSA infection.
Monitoring of MRSA in clinical investigations
Several MSs reported results of clinical investigations which yielded MRSA in cattle, fattening pigs and solipeds, companion, zoo and wild animals. Spa‐types associated with all three MRSA categories (CA‐MRSA, HA‐MRSA and LA‐MRSA) were identified in companion animals, and LA‐MRSA was reported in a domestic horse. CA‐MRSA and HA‐MRSA from companion animals probably represent colonisation of pets with human MRSA strains – from close contact with people or nosocomial infection at the veterinary clinic – rather than persistent establishment of these strains within companion animals. In addition, mecC‐MRSA was reported in a wild hedgehog and three goats at a zoo. Our understanding of the epidemiology of mecC‐MRSA is incomplete but studies have indicated that animal contact and zoonotic transmission are likely to be important in human infections with this organism. Overall, where spa‐typing data were available, most isolates were those associated with LA‐MRSA (Figure 6).
Figure 6.
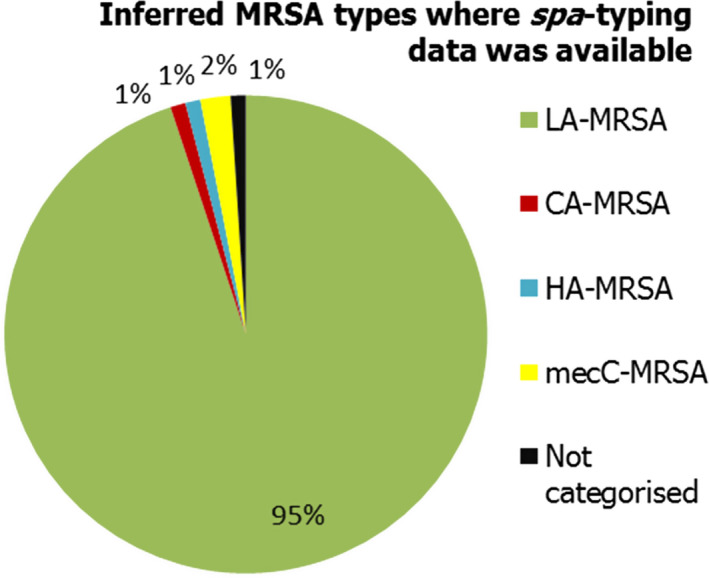
Percentage of MRSA types reported in 2016, inferred from spa‐typing data (198 MRSA isolates were spa‐typed) – from meat, food‐producing animals, solipeds, companion/wild/zoo animals (including clinical investigations)
The lineages and occurrence of the MRSA isolates which were detected can be summarised as follows (Figure 7): (1) LA‐MRSA was reported in broiler meat, rabbit meat and healthy pigs, and during clinical investigations in a dog and a horse; (2) CA‐MRSA was reported in a cat and a dog during clinical investigations; (3) HA‐MRSA was reported in a fattening pig herd and in a cat during clinical investigations; (4) mecC‐MRSA was recorded in a wild hedgehog and three goats during clinical investigations; (5) both spa‐types t1190 (rabbit meat) and t153 (broiler meat) were not categorised as CA‐MRSA or HA‐MRSA as further typing data, including PVL toxin status, were not reported.
Figure 7.
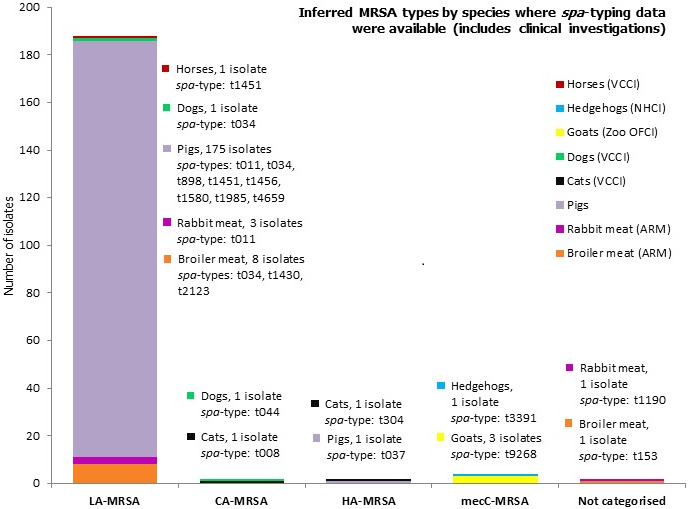
Overview of MRSA types by animal species reported in 2016, including healthy animals and clinical investigations
-
MLST types have for the most part been inferred from spa‐typing data, some isolates were MLST typed. Both spa‐types t1190 and t153 were not categorised as CA‐MRSA or HA‐MRSA as further typing data including PVL status were not reported. In total, 198 MRSA isolates were spa‐typed.VCCI: at veterinary clinic clinical investigation; NHCI: Natural habitat clinical investigations; OFCI: On‐farm clinical investigations; ARM: At retail monitoring; MLST: multilocus sequence typing; CA: community‐associated; HA: healthcare‐associated; LA: livestock‐associated; MRSA: meticillin‐resistant Staphylococcus aureus.
LA‐MRSA is evidently widespread geographically and present in a variety of host species. The findings have underlined the requirement for continued monitoring and appropriate molecular characterisation of MRSA isolates. Detection of LA‐MRSA, HA‐MRSA and CA‐MRSA from companion animals, and the isolation of linezolid‐resistant strains harbouring the cfr gene from pigs highlight that the situation is constantly evolving. The need for further molecular characterisation is highlighted by the occurrence of mosaic strains. The presence or absence of certain virulence or other factors which tend to be associated with certain MRSA lineages is also assuming great importance when assessing the significance of MRSA isolates. Monitoring is currently voluntary and although it provides a considerable amount of useful information, the picture obtained is incomplete.
Legal basis
According to Directive 2003/99/EC on the monitoring of zoonoses and zoonotic agents, Member States (MSs) are obliged to monitor and report antimicrobial resistance (AMR) in Salmonella and Campylobacter isolates obtained from healthy food‐producing animals and from food. Commission Implementing Decision 2013/652/EU of 12 November 20131 sets up priorities for the monitoring of AMR from a public health perspective, drafts a list of combinations of bacterial species, food‐producing animal populations and foodstuffs and lays down detailed requirements on the harmonised monitoring and reporting of AMR.
The data collection on human diseases from MSs is conducted in accordance with Decision 1082/2013/EU2 on serious cross‐border threats to health that, in October 2013, replaced Decision 2119/98/EC on setting up a network for the epidemiological surveillance and control of communicable diseases in the European Union (EU). The case definitions to be followed when reporting data on infectious diseases, including AMR, to the European Centre for Disease Prevention and Control (ECDC) are described in Decision 2012/506/EU.3 ECDC has provided data on zoonotic infections in humans, as well as their analyses, for the EU Summary Reports since 2005. Since 2007, data on human cases have been reported from The European Surveillance System (TESSy), maintained by ECDC.
About the European Food Safety Authority
The European Food Safety Authority (EFSA), located in Parma, Italy, and established and funded by the EU as an independent agency in 2002, provides objective scientific advice, in close collaboration with national authorities and in open consultation with its stakeholders, with a direct or indirect impact on food and feed safety, including animal health and welfare and plant protection. EFSA is also consulted on nutrition in relation to EU legislation. EFSA's risk assessments provide risk managers (the European Commission, the European Parliament and the Council) with a sound scientific basis for defining policy‐driven legislative or regulatory measures required to ensure a high level of consumer protection regarding food and feed safety. EFSA communicates to the public in an open and transparent way on all matters within its remit. Collection and analysis of scientific data, identification of emerging risks and scientific support to the EC, particularly during a food crisis, are also part of EFSA's mandate, as laid down in founding Regulation (EC) No 178/20024 of 28 January 2002.
About the European Centre for Disease Prevention and Control
The European Centre for Disease Prevention and Control (ECDC), an EU agency based in Stockholm, Sweden, was set up in 2005. The objective of ECDC is to strengthen Europe's defences against infectious diseases. According to Article 3 of Founding Regulation (EC) No 851/20045 of 21 April 2004, ECDC's mission is to identify, assess and communicate current and emerging threats to human health posed by infectious diseases. To achieve this goal, ECDC works in partnership with national public health bodies across Europe to strengthen and develop EU‐wide disease surveillance and early warning systems. By working with experts throughout Europe, ECDC pools Europe's knowledge in health to develop authoritative scientific opinions about the risks posed by current and emerging infectious diseases.
Terms of Reference
The EU system for the monitoring and collection of information on zoonoses is based on the Zoonoses Directive 2003/99/EC, which obliges EU MSs to collect relevant and, where applicable, comparable data on zoonoses, zoonotic agents, AMR and food‐borne outbreaks. In addition, MSs are required to assess trends and sources of these agents, as well as outbreaks in their territory, submitting an annual report each year by the end of May to the European Commission covering the data collected. EFSA is assigned the tasks of examining these data and publishing the EU annual Summary Reports. In accordance with Article 9 of the Zoonoses Directive 2003/99/EC, EFSA shall examine the submitted national reports of the EU MSs and publish by the end of November a summary report on the trends and sources of zoonoses, zoonotic agents and AMR in the EU.
1. Introduction
The antimicrobial agents used in food‐producing animals in Europe are frequently the same, or belong to the same classes, as those used in human medicine. AMR is the main undesirable side‐effect of antimicrobial use in both humans and animals, and results from the continuous positive selection of resistant bacterial clones, whether these are pathogenic, commensal or even environmental bacteria. This will change the population structure of microbial communities, leading to accelerated evolutionary trends with unpredictable consequences for human and animal health. Both the route of administration and the administered quantities of antimicrobials may differ between humans and food‐producing animals; moreover, there are important variations between and within food‐producing animal populations, as well as between countries.
Antimicrobial resistance.
Antimicrobial resistance is the ability of microorganisms, such as bacteria, to become increasingly resistant to an antimicrobial to which they were previously susceptible. AMR is a consequence of natural selection and genetic mutation. Such mutation is then passed on conferring resistance. This natural selection process is exacerbated by human factors such as inappropriate use of antimicrobials in human and veterinary medicine, poor hygiene conditions and practices in healthcare settings or in the food chain facilitating the transmission of resistant microorganisms. Over time, this makes antimicrobials less effective and ultimately useless.
Bacterial resistance to antimicrobials occurring in food‐producing animals can spread to people not only via food‐borne routes, but also by routes such as water or other environmental contamination, as well as through direct animal contact. Campylobacter, Salmonella and some strains of Escherichia coli are examples of zoonotic bacteria that can infect people by the food‐borne route. Infections with bacteria that are resistant to antimicrobials may result in treatment failures or necessitate the use of second‐line antimicrobials for therapy. The commensal bacterial flora can also form a reservoir of resistance genes, which may be transferred between bacterial species, including organisms capable of causing disease in both humans and animals (EFSA, 2008).
The monitoring of AMR in zoonotic and commensal bacteria in food‐producing animals and their food products is a pre‐requisite for understanding the development and diffusion of resistance, providing relevant risk assessment data, and evaluating targeted interventions. Resistance monitoring entails specific and continuous data collection, analysis and reporting and enables the following of temporal trends in the occurrence and distribution of resistance to antimicrobials. Resistance monitoring should also allow for the identification of emerging or specific patterns of resistance.
1.1. Monitoring and reporting of antimicrobial resistance at the EU level
Based on Article 33 in Regulation (EC) 178/2002, EFSA is responsible for examining data on AMR collected from the MSs in accordance with Directive 2003/99/EC and for preparing the EU Summary Report from the results. This EU Summary Report 2016 includes data related to the occurrence of AMR both in isolates from animals and foodstuffs and in isolates from human cases. The report is a joint collaboration between the EFSA and the ECDC with the assistance of EFSA's contractor. MSs, other reporting countries, the European Commission and the relevant EU Reference Laboratory (EURL‐AR) were consulted, while preparing the report. The efforts made by MSs, the reporting non‐MSs and the EC in the reporting of data on AMR and in the preparation of this report are gratefully acknowledged.
1.2. Further harmonised monitoring of antimicrobial resistance
The main issues when comparing AMR data originating from different countries are the use of different laboratory methods and different interpretive criteria of resistance. These issues have been addressed by the development of ECDC's protocol for harmonised monitoring and reporting of resistance in humans and recent legislation on harmonised monitoring in food‐producing animals and the food produced.
1.2.1. New legislation on antimicrobial resistance monitoring in animals and food
Commission Decision 2013/652/EU of 12 November 20136 drafts a list of combinations of bacterial species, food‐producing animal populations and food products and sets up priorities for the monitoring of AMR from a public health perspective. Monitoring of AMR in Escherichia coli became mandatory, as it is for Salmonella and Campylobacter jejuni in the major food‐producing animal populations – broilers, laying hens, fattening turkeys, fattening pigs, calves – and their derived meat. The specific monitoring of extended‐spectrum β‐lactamase (ESBL)‐, AmpC‐ and carbapenemase‐producing Salmonella and indicator commensal E. coli is also planned. The collection and reporting of data are to be performed at the isolate level, to enable more in‐depth analyses to be conducted, in particular on the occurrence of multiple drug resistance (MDR). Representative sampling should be performed according to general legislation and to detailed technical specifications issued by EFSA. Monitoring of AMR in food‐producing animals should be performed at the level of domestically produced animal populations, corresponding to different production types with the aim of collecting data that, in the future, could be combined with those on exposure to antimicrobials. Provisions have been taken where possible to exploit samples that would be collected under other existing control programmes. Commission Implementing Decision 2013/652/EU entered into force in 2014, as did Commission Implementing Decision 2013/653/EU of 12 November 2013 on financial aid towards a coordinated control plan for AMR monitoring in zoonotic agents in MSs in 2014.
Microdilution methods for testing should be used and results should be interpreted by the application of European Committee on Antimicrobial Susceptibility Testing (EUCAST) epidemiological cut‐off (ECOFF) values7 for the interpretation of ‘microbiological’ resistance. The harmonised panel of antimicrobials used for Salmonella, Campylobacter, E. coli and Enterococcus spp. is broadened with the inclusion of substances that either are important for human health or can provide clearer insight into the resistance mechanisms involved. The concentration ranges to be used ensure that both the ECOFF and the clinical breakpoints (CBPs) are included so that comparability of results with human data is made possible. Within the animal and food monitoring programmes, the new legislation has specified those types of animals that should be monitored in particular years. Ensuring that all MSs test the same species in a given year has simplified the presentation and increased the comparability of the results, because each annual report will now focus primarily on the target species for a given year.
A particular feature of the revised monitoring protocol for Salmonella and E. coli is the use of a supplementary panel of antimicrobials for testing isolates that show resistance to third‐generation cephalosporins or carbapenems in the first panel. The reporting of isolate‐based data, which was introduced several years ago, has facilitated this change, which allows in‐depth phenotypic characterisation of certain mechanisms of resistance, for example, third‐generation cephalosporin resistance and carbapenem resistance can be further characterised. It seems likely that this principle can be further developed and refined in time.
External quality assurance is provided by the EURL‐AR, which distribute panels of well characterised organisms to all MSs for susceptibility testing. MSs must test and obtain the correct results in such tests to ensure proficiency. The EURL‐AR also provides a source of reference for MSs in cases in which there are issues or problems with the susceptibility test methodology.
1.2.2. Developments in the harmonised monitoring of antimicrobial resistance in humans
Together with its Food‐ and Waterborne Diseases and Zoonoses (FWD) network, ECDC developed an EU protocol for harmonised monitoring of AMR in human Salmonella and Campylobacter isolates (ECDC, 2014, 2016). This document is intended for the National Public Health Reference Laboratories to guide the susceptibility testing required for EU surveillance and reporting to ECDC. Consultation was also sought from EFSA, EUCAST and the EU Reference Laboratory for antimicrobial resistance to facilitate comparison of data between countries and with results from the AMR monitoring performed in isolates from animals and from food products. The protocol is effective from 2014 and supports the implementation of the Commission Action Plan on AMR. One of the recommendations is that, for the purpose of the joint report with EFSA, human data should also be interpreted based on ECOFFs. As this requires quantitative data, ECDC introduced reporting of quantitative antimicrobial susceptibility testing (AST) results in the 2013 data collection and encourages countries to use it. As the EU protocol is not a legal document but a recommendation and joint agreement, it is for each National Public Health Reference Laboratory to decide whether to adapt their practices to the protocol. In 2016, most laboratories had adopted the priority panel of antimicrobials suggested in the protocol, whereas the optional antimicrobials were tested by fewer laboratories. The protocol also proposes a testing algorithm for screening and confirmation of ESBL‐producing Salmonella spp., including detection of AmpC. However, not all countries have implemented this algorithm, or they modified it and hence cannot report the results to The European Surveillance System (TESSy) at ECDC in the current set‐up (instead, data were collected via mail). This issue has now been addressed and will be effective in the data collection of 2017 data.
As most laboratories use disk diffusion for AST, ECDC collaborates with EUCAST to set up inhibition zone diameter (IZD) ECOFFs for C. jejuni, C. coli and Salmonella spp., when missing (Matuschek et al., 2015).
External quality assurance to support laboratories in implementing the recommended test methods and antimicrobials and obtaining high‐quality AST results is provided by the Statens Serum Institute in Denmark through a contract with ECDC.
1.3. The 2016 EU Summary Report on AMR
Most data reported to EFSA by MSs comprise data collected in accordance with Commission Implementing Decision 2013/652/EU. The antimicrobial susceptibility data reported to EFSA for 2016 for Campylobacter, Salmonella, indicator E. coli isolates from animals and food were analysed and all quantitative data were interpreted using ECOFFs. This report also includes results of phenotypic monitoring of resistance to third‐generation cephalosporins caused by ESBLs and AmpC β‐lactamases in Salmonella and indicator E. coli, as well as the investigation at the EU level of the occurrence of complete susceptibility and MDR in data reported at the isolate level. A list of the antimicrobials included in this evaluation of MDR can be found in Section 2, ‘Materials and methods’.
The report also includes resistance in Salmonella and Campylobacter isolates from human cases of salmonellosis and campylobacteriosis, respectively. These data were reported by MSs to TESSy either as quantitative or categorical/qualitative data. The quantitative data were interpreted using EUCAST ECOFFs, where available. The qualitative data had been interpreted using CBPs to guide medical treatment of the patient. The breakpoints for ‘clinical’ resistance are, in many cases, less sensitive than the ECOFF for a specific bacterium–drug combination resulting in higher levels of ‘microbiological’ resistance than ‘clinical’ resistance. By combining the categories of ‘clinically’ resistant and intermediate resistant into a non‐susceptible category, however, close correspondence with the ECOFF was achieved.
CBPs enable clinicians to choose the appropriate treatment based on information relevant to the individual patient. ECOFFs recognise that epidemiologists need to be aware of small changes in bacterial susceptibility, which may indicate emerging resistance and allow for appropriate control measures to be considered. ECOFFs, CBPs and related concepts on antimicrobial resistance/susceptibility are presented in detail within the text.
A new EU action plan against antimicrobial resistance.
The European Commission adopted a new Action Plan to tackle Antimicrobial Resistance (AMR) on 29 June 2017. The Action Plan is underpinned by a One Health approach that addresses resistance in both humans and animals. The key objectives of this new plan are built on three main pillars:
Pillar 1: Making the EU a best practice region: as the evaluation of the 2011 action plan highlighted, this will require better evidence, better coordination and surveillance, and better control measures: EU action will focus on key areas and help Member States in establishing, implementing and monitoring their own One Health action plans on AMR, which they agreed to develop at the 2015 World Health Assembly.
Pillar 2: Boosting research, development and innovation by closing current knowledge gaps, providing novel solutions and tools to prevent and treat infectious diseases, and improving diagnosis in order to control the spread of AMR.
Pillar 3: Intensifying EU effort worldwide to shape the global agenda on AMR and the related risks in an increasingly interconnected world.
In particular, under the first pillar, EU actions will focus on the areas with the highest added value for MSs, e.g. promoting the prudent use of antimicrobials, enhancing cross‐sectorial work, improving infection prevention and consolidating surveillance of AMR and antimicrobial consumption. Examples of support include providing evidence‐based data with the support of EFSA, EMA and ECDC, updating EU implementing legislation on monitoring and reporting AMR in zoonotic and commensal bacteria in farm animals and food, to take into account new scientific development and monitoring needs, enabling mutual learning, exchange of innovative ideas and consensus building, and co‐fund activities in MSs to tackle AMR.
The new plan includes more than 75 concrete actions with EU added value that the EU Commission will develop and strengthen as appropriate in the coming years. All these actions are important in themselves, but they are also interdependent and need to be implemented in parallel to achieve the best outcome.
2. Materials and methods
All tables on resistance data used to produce this 2017 EUSR and cross‐referenced in the text are available on the EFSA Knowledge Junction at: https://doi.org/10.5281/zenodo.1183248
2.1. Antimicrobial susceptibility data from humans available in 2016
Almost 70% of the reporting countries submitted isolate‐based measured values (quantitative antimicrobial susceptibility testing (AST) data) to the European Centre for Disease Prevention and Control (ECDC) for 2016, which is a substantial increase from 30% of the countries reporting measured values for 2013 when isolate‐based reporting was applied. The remaining countries submitted interpreted categorical (qualitative) AST data. As the data collected by European Food Safety Authority (EFSA) are also quantitative, moving towards quantitative data from human isolates improves comparability between the two sectors, as the same interpretive criteria can be applied to the two data sets.
As in the three previous reports, the categories of ‘clinically’ intermediate and ‘clinically’ resistant in the interpreted data were combined in a ‘non‐susceptible’ group. Alignment of the susceptible category with the ‘wild type’ category based on epidemiological cut‐off values (ECOFFs) and of the non‐susceptible category with the ECOFF‐based ‘non‐wild type’ category provides better comparability and more straightforward interpretation of the data for most antimicrobial agents included.
2.1.1. Salmonella data of human origin
Twenty‐three MSs, plus Iceland and Norway provided data for 2016 on human Salmonella isolates. Seventeen countries (Austria, Belgium, Cyprus, Denmark, Estonia, Finland, France, Greece, Ireland, Italy, Luxembourg, the Netherlands, Norway, Portugal, Romania, Slovenia and Spain) reported isolate‐based AST results as measured values (inhibition zone diameters (IZDs) or minimum inhibitory concentrations (MICs)), which was three countries more than for 2015. Eight countries (Germany, Hungary, Iceland, Latvia, Lithuania, Malta, Slovakia and the United Kingdom) reported case‐based AST results interpreted as susceptible (S), intermediate (I) or resistant (R) according to the CBPs applied (Table 4).
Table 4.
Antimicrobials reported, methods used, type of data reported and interpretive criteria applied by MSs for human Salmonella AST data in 2016
| Country | Ampicillin | Azithromycin | Cefotaxime | Ceftazidime | Chloramphenicol | Ciprofloxacin pefloxacin | Colistin | Gentamicin | Meropenem | Nalidixic acid | Sulfonamides | Tetracyclines | Tigecycline | Trimethoprim | Trimethoprim‐&sulfa | Method used | Quantitative (Q) or categorical (SIR) | Interpretive criteria |
|---|---|---|---|---|---|---|---|---|---|---|---|---|---|---|---|---|---|---|
| Austria | ● | ● | ● | ● | ●a | ● | ● | ● | ● | ● | ● | ● | DD | Q | Interpreted by ECDC. EUCAST ECOFFs 2016 for all except CLSI CBP 2016 for SUL | |||
| Belgium | ● | ● | ● | ● | ● | ●a | ● | ● | ● | ● | ● | ● | DD | Q | Interpreted by ECDC, as for Austria | |||
| Cyprus | ● | ● | ● | ●b | ● | ● | ● | ● | ●b | DL | Q | Interpreted by ECDC, as for Austria, except for cefotaxime (CTX) and MEM where EUCAST CBP were used | ||||||
| Denmark | ● | ● | ● | ● | ● | ● | ● | ● | ● | ● | ● | ● | ● | ● | DL | Q | Interpreted by ECDC, as for Austria. EFSA criteria for AZM MIC | |
| Estonia | ● | ● | ● | ● | ● | ● | ● | ● | ● | ● | ● | ● | DL | Q | Interpreted by ECDC, as for Austria | |||
| Finland | ● | ● | ● | ●a | ● | ● | ● | ● | ● | DD | Q | Interpreted by ECDC, as for Austria | ||||||
| France | ● | ● | ● | ● | ● | ● | ● | ● | ● | ● | ● | ● | ● | ● | DL | Q | Interpreted by ECDC, as for Austria, except for MEM where EUCAST CBP were used and CTX where EFSA criteria were used | |
| Germany | ● | ● | ● | ● | ● | ● | ● | ● | ● | ● | DL | SIR | German DIN standard CBP. Only R included for GEN & TET to align with ECOFF | |||||
| Greece | ● | ● | ● | ● | ● | ● | ● | ● | ● | ● | ● | DD | Q | Interpreted by ECDC, as for Austria | ||||
| Hungary | ● | ● | ● | ● | ●a | ● | ● | ● | ● | ● | DD | SIR | EUCAST CBP 2015 except CLSI CBP 2015 for NAL, SUL and TET | |||||
| Iceland | ● | ● | ●a | ● | DD | SIR | EUCAST CBP 2016 | |||||||||||
| Ireland | ● | ● | ● | ● | ● | ● | ● | ● | ● | ● | ● | ● | ● | ● | DL | Q | Interpreted by ECDC, as for Austria. EFSA criteria for AZM MIC | |
| Italy | ● | ● | ● | ● | ●a | ● | ● | ● | ● | ● | ● | ● | DD | Q | Interpreted by ECDC, as for Austria | |||
| Latvia | ● | ● | ● | DD | SIR | No information on guideline used. Earlier CLSI | ||||||||||||
| Lithuania | ● | ● | ● | ● | ●a | ● | ● | ● | ● | ● | ● | DL/DD | SIR | EUCAST CBP 2016 | ||||
| Luxembourg | ● | ● | ● | ● | ●a | ● | ● | ● | ● | ● | ● | DD | Q | Interpreted by ECDC, as for Austria | ||||
| Malta | ● | ● | ● | ● | ●c | ● | ● | DL | SIR | Biomerieux Vitek II system; follows EUCAST CBP 2014 | ||||||||
| Netherlands | ● | ● | ● | ● | ● | ● | ● | ● | ● | ● | ● | ● | ● | ● | DL | Q | Interpreted by ECDC, as for Austria. EFSA criteria for AZM MIC | |
| Norway | ● | ● | ● | ● | ● | ●a | ● | ● | ● | ● | DD | Q | Interpreted by ECDC, as for Austria | |||||
| Portugal | ● | ● | ● | ● | ● | ●a | ● | ● | ● | ● | ● | ● | ● | DD | Q | Interpreted by ECDC, as for Austria | ||
| Romania | ● | ● | ● | ● | ●a | ● | ● | ● | ● | ● | ● | ● | DD | Q | Interpreted by ECDC, as for Austria | |||
| Slovakia | ● | ● | ● | ● | ● | ●c | ● | ● | ● | DD/DL | SIR | No update provided. In 2013, EUCAST CBP 2013 except CLSI CBP 2013 for NAL, SUL and TET | ||||||
| Slovenia | ● | ● | ● | ● | ●a | ● | ● | ● | ● | ● | ● | DD/DLG | Q | Interpreted by ECDC, as for Austria | ||||
| Spain | ● | ● | ● | ● | ●a | ● | ● | ● | ● | ● | ● | DD | Q | Interpreted by ECDC, as for Austria | ||||
| United Kingdom | ● | ● | ● | ● | ● | ●c | ● | ● | ● | ● | ● | ● | DD/DL/DLG | SIR | Varies depending on clinical microbiology laboratory |
AST: antimicrobial susceptibility testing; CBP: clinical breakpoint; DD: disk diffusion; DL: dilution; DLG: dilution with gradient strip; Q: quantitative data; SIR: susceptible, intermediate, resistant (categorical data); ECDC: European Centre for Disease Prevention and Control; ECOFF: epidemiological cut‐off; CLSI: Clinical and Laboratory Standards Institute; EUCAST: European Committee on Antimicrobial Susceptibility Testing; AZM: azithromycin; CTX: cefotaxime; GEN: gentamicin; MEM: meropenem; NAL: nalidixic acid; SUL: sulfonamides; TET: tetracycline.
Pefloxacin.
Tested concentration range did not include the ECOFF nor the clinical breakpoint and data could not be used.
Test results in part or fully from VITEK system which seemingly apply CLSI criteria and report all aminoglycoside results as resistant. Results therefore excluded.
In 2013, the national public health laboratories within the Food‐ and Waterborne Diseases and Zoonoses (FWD) network agreed on a panel of priority antimicrobials and optional antimicrobials to test for and report to ECDC (2014). Two antimicrobials – ceftazidime and meropenem – were new in the priority panel compared with earlier recommendations. By 2016, all but one MS reported results on meropenem for 2016 and all but two for ceftazidime. It was also agreed that three last‐line antimicrobials – azithromycin, colistin and tigecycline – should be included in the priority list when interpretive criteria were available for disk diffusion, in addition to dilution. The European Committee on Antimicrobial Susceptibility Testing (EUCAST) developed such ECOFFs for azithromycin and tigecycline in 2015 (Matuschek et al., 2015). For colistin, however, the methodology is complicated due to chemical properties of the substance. A joint EUCAST and Clinical and Laboratory Standards Institute (CLSI) subcommittee confirmed that broth microdilution is so far the only valid method for colistin susceptibility testing (CLSI & EUCAST, 2016). Disk diffusion does not work because of poor diffusion of the large colistin molecule in the agar and tested gradient strips also underestimate colistin MIC values, again most likely due to poor diffusion in the agar (Matuschek et al., 2017). The three last‐line antimicrobials were added to the priority list in June 2016 (ECDC, 2016), however only countries performing broth microdilution should report on colistin resistance. Six MSs (and one non‐MS for azithromycin) were reporting on these three antimicrobials for 2016.
Due to the problems in detecting low‐level fluoroquinolone resistance in Salmonella spp. using disk diffusion, nalidixic acid was, for a long time, used as a marker for fluoroquinolone resistance. After the discovery that plasmid‐mediated fluoroquinolone resistance is often not detected using nalidixic acid, EUCAST studied alternative disks and concluded that pefloxacin was an excellent surrogate marker (except for isolates having the aac(6′)‐Ib‐cr gene as the only resistance determinant) (Skov et al., 2015). Since 2014, EUCAST has recommended this agent for screening of low‐level fluoroquinolone resistance in Salmonella with disk diffusion (EUCAST, 2014) and, since June 2016, this is also reflected in the EU protocol. Thirteen of 17 MSs using disk diffusion had replaced the ciprofloxacin testing with pefloxacin in 2016. One MS changed in 2017 and, for three MSs, the information was missing.
Half of the countries reported the combination drug co‐trimoxazole (trimethoprim–sulfamethoxazole) in addition to, or instead of, testing the substances separately, partly because this combination is used for clinical treatment and partly because no EUCAST interpretive criterion exists for sulfamethoxazole for Salmonella.
For the methods and guidelines used for testing and interpretation in 2016, 11 MSs, plus Iceland and Norway used only disk diffusion methods (DDs) for their AST, 8 MSs used dilution methods (DLs) and another 4 MSs used a combination of the two, mostly disk diffusion and gradient strip, depending on the situation and the antimicrobial (Table 4). For countries reporting quantitative measured values, all isolates had been tested at a central laboratory. These data were interpreted with EUCAST ECOFFs, when available. Almost all of the countries reporting interpreted data had applied CBPs from EUCAST. Germany however applied criteria from the Deutsches Institut für Normung (DIN). The data from the United Kingdom were derived from testing carried out by clinical microbiology laboratories in primary care, where a mixture of criteria and test methods were used. For two countries, no update on the criteria had been provided in the last years.
As resistance levels differ substantially between Salmonella serovars, results are presented separately for selected serovars of importance, particularly those found in poultry (broilers, laying hens and turkey) due to the focus of the 2016 report. The serovars presented in the report are S. Enteritidis, S. Typhimurium S. Infantis and S. Kentucky, while data on additional serovars among the 10 most common in human cases in 2016 are available in appendices (monophasic S. Typhimurium, S. Newport, S. Derby, S. Stanley, S. Virchow and S. Saintpaul). The proportion of resistant isolates are only shown when at least 10 isolates were tested in that MS.
To better assess the impact from food consumed within each reporting country on the AMR levels found in human Salmonella isolates, the analysis focused on domestically acquired cases. However, as several countries had not provided any information on travel (or non‐travel) of their cases, cases with unknown travel status were also included in addition to domestically acquired cases. The proportions of travel‐associated, domestic and unknown cases among the tested Salmonella isolates are presented in Table SALMTRAVHUM.
Temporal trend graphs were presented by country for S. Enteritidis, S. Typhimurium, S. Infantis and S. Kentucky showing the resistance to ciprofloxacin/pefloxacin/nalidixic acid, cefotaxime, ampicillin and tetracycline from 2013 to 2016 (the years following the agreement on harmonised testing and reporting by public health reference laboratories), by plotting the level of resistance for each year. The statistical significance of temporal trends was assessed with logistic regression in Stata 14.2 for countries providing data for at least 3 years in the 4‐year period. A p‐value of < 0.05 was considered to be significant.
The proportions of human isolates resistant to the critically important antimicrobials for treatment of severe Salmonella infections (WHO, 2017), fluoroquinolones (ciprofloxacin/pefloxacin) and cephalosporins (cefotaxime), were presented in maps to provide an overview of the geographical distribution of resistance in the EU/EEA. Maps were provided for resistance to each of the two substances for the respective serovars. Combined resistance (resistance to both) of ciprofloxacin/pefloxacin and cefotaxime was determined both as ‘microbiological’ resistance (using EUCAST ECOFFs) and ‘clinical’ resistance (using EUCAST CBPs). Combined ‘microbiological resistance’ was presented in a map for Salmonella spp.
Multidrug resistance (MDR) of human Salmonella spp. to nine antimicrobial classes was analysed, harmonised between ECDC and EFSA for better comparison between the two sectors. MDR of an isolate was defined as resistance or non‐susceptibility to at least three different antimicrobial classes (Magiorakos et al., 2012). The antimicrobials included were ampicillin, cefotaxime/ceftazidime, chloramphenicol, ciprofloxacin/pefloxacin/nalidixic acid, gentamicin, meropenem, sulfonamides/sulfamethoxazole, tetracyclines and trimethoprim/trimethoprim‐sulfamethoxazole (co‐trimoxazole). Resistance to nalidixic acid, ciprofloxacin and pefloxacin were addressed together, as they belong to the same class of antimicrobials: quinolones. Isolates that were resistant or non‐susceptible to any of these antimicrobials were classified as resistant or non‐susceptible to the class of quinolones. The same method was applied to the two‐third‐generation cephalosporins cefotaxime and ceftazidime. Trimethoprim and co‐trimoxazole were also addressed together, as a few countries had only tested for susceptibility to the combination. This approach was considered appropriate because among the seven countries that provided data on both trimethoprim alone and the combination co‐trimoxazole, the proportion of resistant or non‐susceptibles corresponded closely between the two.
Only one MS used the option to report results to TESSy from the testing of the second panel of antimicrobials for isolates showing microbiological resistance to third‐generation cephalosporins. Public health reference laboratories were therefore asked to report the data on ESBL‐ and AmpC‐producing Salmonella via mail, like for 2015. Of the 20 MSs plus Norway which had reported microbiological resistance to third‐generation cephalosporins, 13 MSs plus Norway could provide results on further phenotypic and/or genotypic testing for ESBL and/or AmpC. Three MSs did not test for ESBL/AmpC and four MSs did not respond to the request.
2.1.2. Campylobacter data of human origin
Seventeen MSs, plus Iceland and Norway provided data on human Campylobacter isolates for 2016. Thirteen countries (Austria, Cyprus, Denmark, Estonia, Finland, Italy, Luxembourg, Malta, Norway, Portugal, Romania, Slovenia and Spain) reported quantitative isolate‐based AST results as measured values of either IZDs or MICs (Table 5). Six countries (France, Iceland, the Netherlands, Lithuania, Slovakia and the United Kingdom) reported case‐based or isolate‐based AST results interpreted as susceptible (S), intermediate (I) or resistant (R) according to the CBPs applied.
Table 5.
Antimicrobials reported, method used, type of data reported and interpretive criteria applied by MSs for human Campylobacter AST data in 2016
| Country | Ciprofloxacin | Co‐amoxiclav | Erythromycin | Gentamicin | Tetracyclines | Method used | Quantitative (Q) or categorical (SIR) | Interpretive criteria |
|---|---|---|---|---|---|---|---|---|
| Austria | ● | ● | ● | ● | DL | Q | Interpreted by ECDC. EUCAST ECOFF (CIP, ERY, GEN, TET), CA‐SFM CBP 2016 (AMC) | |
| Cyprus | ● | ● | ● | DD | Q | Interpreted by ECDC, as for Austria | ||
| Denmark | ● | ● | ● | ● | DL | Q | Interpreted by ECDC, as for Austria | |
| Estonia | ● | ● | ● | DD | Q | Interpreted by ECDC, as for Austria | ||
| Finland | ● | ● | ● | DD/DLG | Q | Interpreted by ECDC, as for Austria | ||
| France | ● | ● | ● | ● | ● | DD | SIR | EUCAST CBP 2016 (CIP, ERY, TET), CA‐SFM CBP 2016 (AMC, GEN) |
| Iceland | ● | ● | DD/DLG | SIR | EUCAST CBP 2016 | |||
| Italy | ● | ● | ● | ● | DD | Q | Interpreted by ECDC, as for Austria | |
| Lithuania | ● | ● | ● | DD | SIR | EUCAST CBP 2016 | ||
| Luxembourg | ● | ● | ● | ● | DD/DLG | Q | Interpreted by ECDC, as for Austria | |
| Malta | ● | ● | DLG/DD | Q | Interpreted by ECDC, as for Austria | |||
| Netherlands | ● | ● | ● | DD/DL | SIR | Survey in 12 clinical labs in the Netherlands in 2009 (Ned Tijdschr Med Microbiol 2009;17:nr1) | ||
| Norway | ● | ● | ● | ● | DLG | Q | Interpreted by ECDC, as for Austria | |
| Portugal | ● | ● | ● | ● | DD | Q | Interpreted by ECDC, as for Austria | |
| Romania | ● | ● | ● | ● | ● | DD | Q | Interpreted by ECDC, as for Austria |
| Slovakia | ● | ● | ● | ● | ● | DL | SIR | In 2013, CLSI CB |
| Slovenia | ● | ● | ● | DD | Q | Interpreted by ECDC, as for Austria | ||
| Spain | ● | ● | ● | ● | DLG | Q | Interpreted by ECDC, as for Austria | |
| United Kingdom | ● | ● | ● | ● | DD/DL/DLG | SIR | Varies depending on clinical microbiology laboratory |
AST: antimicrobial susceptibility testing; CA‐SFM: French Society for Microbiology; CBP: clinical breakpoint; DD: disk diffusion; DL: dilution; DLG: dilution with gradient strip; ECDC: European Centre for Disease Prevention and Control; ECOFF: epidemiological cut‐off; EUCAST: European Committee on Antimicrobial Susceptibility Testing; Q: quantitative data; SIR: susceptible, intermediate, resistant (categorical data). AMC: amoxicillin/clavulanate; CIP: ciprofloxacin; ERY: erythromycin; GEN: gentamicin; TET: tetracycline.
The antimicrobials included in the 2016 report followed the panel of antimicrobials from the EU protocol for harmonised monitoring of AMR in human Salmonella and Campylobacter isolates (ECDC, 2016). The priority panel for Campylobacter includes ciprofloxacin, erythromycin, tetracyclines and, since June 2016, gentamicin. Gentamicin is recommended for screening of invasive isolates and was added to the priority panel after a EUCAST ECOFF became available for disk diffusion for C. jejuni. Co‐amoxiclav (amoxicillin and clavulanic acid) was included from the list of optional antimicrobials.
For the methods and guidelines used for testing and interpretation in 2016, eight MSs used only disk diffusion methods for their AST, four MSs and Norway used dilution methods and five MSs and Iceland used a combination of the two, mostly disk diffusion and gradient strip, depending on the situation and the antimicrobial (Table 5). All countries providing data from the national public health reference laboratory were using EUCAST guidelines and interpretive criteria in their routine monitoring. Criteria from the French Society for Microbiology (CA‐SFM) were also used when EUCAST was lacking interpretive criteria. Three countries received the data from primary laboratories and could therefore not tell which criteria that had been used to interpret the data. With the exception of Finland, all data provided as quantitative measured values were from antimicrobial susceptibility testing performed at a central laboratory.
Resistance levels differ quite substantially between the two most important Campylobacter species, C. jejuni and C. coli, and data are therefore presented by species. The proportion of resistant isolates is only shown when at least 10 isolates were reported from a MS.
To better assess the impact from food consumed within each reporting country on the AMR levels found in human Campylobacter isolates, the analysis focused on domestically acquired cases. However, as several countries had not provided any information on travel (or non‐travel) of their cases, cases with unknown travel status were included in the analysis. The proportions of travel‐associated, domestic and unknown cases among the tested Campylobacter isolates are presented in Table CAMPTRAVHUM.
Temporal trend graphs were presented by country showing the resistance in C. jejuni and C. coli to ciprofloxacin, erythromycin and tetracycline from 2013 to 2016 (the years following the agreement on harmonised testing and reporting by public health reference laboratories), by plotting the level of resistance for each year. The statistical significance of temporal trends was assessed with logistic regression in Stata 14.2 for countries providing data for at least three of the four years in the period. A p‐value of < 0.05 was considered to be significant.
The proportions of human isolates resistant to the critically important antimicrobials for treatment of severe Campylobacter infections (WHO, 2017), fluoroquinolones (ciprofloxacin) and macrolides (erythromycin), were presented in maps to provide an overview of the geographical distribution of resistance in the EU/EEA. Combined resistance (resistance to both) of ciprofloxacin and erythromycin was determined both as ‘microbiological’ resistance (using EUCAST ECOFFs) and ‘clinical’ resistance (using EUCAST CBPs). (This was so far performed only for isolates included in the MDR analysis.)
MDR of a C. jejuni or C. coli isolate was defined as resistance or non‐susceptibility to at least three different antimicrobial classes (Magiorakos et al., 2012). The antimicrobials in the MDR analysis were harmonised between EFSA and ECDC and included ciprofloxacin, erythromycin, gentamicin and tetracyclines.
2.2. Antimicrobial susceptibility data from animals and food in 2016
2.2.1. Data reported under Directive 2003/99/EC and Commission Implementing Decision 2013/652/EU
For 2016, MSs reported mandatory data collected from AMR routine monitoring in Salmonella spp. and indicator commensal E. coli, as well as from the E. coli specific extended‐spectrum β‐lactamase (ESBL)‐/AmpC‐/carbapenemase‐producing monitoring, according to Commission Implementing Decision 2013/652/EU.
For the routine monitoring of AMR in Salmonella spp., 19 MSs and 1 non‐MS reported data on meat from broilers and 8 MSs on meat from fattening turkeys, 22 MSs and 1 non‐MS reported data on laying hen flocks, 22 MSs and 2 non‐MSs on broiler flocks and 15 MSs on fattening turkey flocks. For the routine monitoring of AMR in indicator commensal E. coli, 27 MSs and 3 non‐MSs reported data on broilers and 11 MSs and 1 non‐MS reported on fattening turkeys. For the routine monitoring of AMR in C. jejuni, 24 MSs and 3 non‐MSs reported data on broilers and 9 MSs on fattening turkeys. Some data on Campylobacter coli was also reported on a voluntary basis.
For the specific monitoring of ESBL‐/AmpC‐/carbapenemase‐producing E. coli, all MSs except Malta, as well as Norway and Switzerland, reported data on fresh meat from broilers gathered at retail, whereas all MSs except Malta, as well as Iceland, Norway and Switzerland, reported data on broilers, and 11 MSs, Norway and Switzerland, on fattening turkeys.
Isolates were sampled through harmonised national schema. Microbroth dilution testing methods were used for susceptibility testing, and quantitative8 isolate‐based data were reported to EFSA and considered for this report. Resistance was interpreted using EUCAST ECOFF values (see following text box for further information). The antimicrobials incorporated in this summary analysis were selected based on their public health relevance and as representatives of different antimicrobial classes.
In addition, data on meticillin‐resistant Staphylococcus aureus (MRSA) and on specific monitoring of carbapenemase‐producing microorganisms were reported on a voluntary basis.
Harmonised representative sampling and monitoring
Representative sampling should be performed according to general provisions of the legislation and to detailed technical specifications issued by EFSA (EFSA, 2014).
Salmonella spp.
In 2014, representative Salmonella isolates for monitoring AMR were collected by MSs from the populations of laying hens, broilers and fattening turkeys sampled according to the Salmonella National Control Programmes (NCPs), set up in accordance with Article 5(1) of Regulation (EC) No 2160/2003, as well as from carcasses of both broilers and fattening turkeys sampled for testing and verification of compliance, in accordance with point 2.1.5 of Chapter 2 of Annex 1 to Regulation (EC) No 2073/2005. Not more than one isolate per Salmonella serovar from the same epidemiological unit (flock of birds) per year should be included in the AMR monitoring. In most MSs, the isolates tested for antimicrobial susceptibility constituted a representative subsample of the total Salmonella isolates available at the National Reference Laboratory (NRL) and/or other laboratories involved, obtained in a way that ensured geographical representativeness and even distribution over the year. Conversely, for low prevalence, all the Salmonella isolates available should be tested for susceptibility.
Campylobacter and indicator commensal E. coli
MSs collected Campylobacter and indicator commensal E. coli 9 isolates as part of their national monitoring programme of AMR according to the provisions of Commission Implementing Decision 2013/652/EU, based on representative random sampling of carcasses of healthy slaughter broilers/fattening turkeys at the slaughterhouse. A two‐stage stratified sampling design, with slaughterhouses as primary sampling units and carcasses as secondary units, with proportional allocation of the number of samples to the annual throughput of the slaughterhouse, was applied in the reporting countries. Only one representative caecal sample (single or pooled) per epidemiological unit (batch of carcasses deriving from the same flock), was gathered to account for clustering. Isolates were recovered from caecal contents samples (single or pooled), in accordance with EFSA's recommendations (EFSA, 2014). The sample collection was approximately evenly distributed over the year 2016.
Specific monitoring of E. coli ESBL/AmpC/carbapenemase producers
Caecal samples gathered at slaughter from broilers and from fattening turkeys, in those MSs where the production of turkey meat in the MS is more than 10,000 tonnes slaughtered per year, and samples of fresh meat from broilers gathered at retail were collected. Only one representative caecal sample (single or pooled) per epidemiological unit (batch of carcasses deriving from the same herd), was gathered to account for clustering. Isolates were recovered from caecal contents samples (single or pooled), in accordance with EFSA's recommendations (EFSA, 2014). MSs shall analyse 300 samples of each of the animal population and food category, listed in above. However, in MSs with a production of less than 100,000 tonnes of poultry meat slaughtered per year, the MS shall analyse 150 samples instead of 300 samples for each corresponding specific combination. The sample collection was approximately evenly distributed over the year 2016.
Epidemiological cut‐off values (ECOFFs) and clinical breakpoints (CBPs).
Epidemiological cut‐off values (ECOFFs) and clinical breakpoints (CBPs)
A microorganism is defined as ‘clinically’ resistant when the degree of resistance shown is associated with a high likelihood of therapeutic failure. The microorganism is categorised as resistant by applying the appropriate CBP in a defined phenotypic test system, and this breakpoint may alter with legitimate changes in circumstances (for example alterations in dosing regimen, drug formulation, patient factors). A microorganism is defined as wild type for a bacterial species when no acquired or mutational resistance mechanisms are present to the antimicrobial in question. A microorganism is categorised as wild type for a given bacterial species presenting a lower MIC to the antimicrobial in question than the appropriate ECOFF in a defined phenotypic test system. This cut‐off value will not be altered by changing circumstances (such as alterations in frequency of antimicrobial administration). Wild‐type microorganisms may or may not respond clinically to antimicrobial treatment. A microorganism is defined as non‐wild type for a given bacterial species by the presence of an acquired or mutational resistance mechanism to the antimicrobial in question. A microorganism is categorised as non‐wild type for a given bacterial species by applying the appropriate ECOFF value in a defined phenotypic test system; non‐wild‐type organisms are considered to show ‘microbiological’ resistance (as opposed to ‘clinical’ resistance). CBPs and ECOFFs may be the same, although it is often the case that the ECOFF is lower than the CBP. EUCAST has defined CBPs and ECOFFs.
Clinical breakpoints (clinical resistance)
The clinician, or veterinarian, choosing an antimicrobial agent to treat humans or animals with a bacterial infection requires information that the antimicrobial selected is effective against the bacterial pathogen. Such information will be used, together with clinical details such as the site of infection, ability of the antimicrobial to reach the site of infection, formulations available and dosage regimes, when determining an appropriate therapeutic course of action. The in vitro susceptibility of the bacterial pathogen can be determined and CBPs used to ascertain whether the organism is likely to respond to treatment. CBPs will take into account the distribution of the drug in the tissues of the body following administration and assume that a clinical response will be obtained if the drug is given as recommended and there are no other adverse factors which affect the outcome. Conversely, if the CBP indicates resistance, then it is likely that treatment will be unsuccessful. Frequency of dosing is one factor that can affect the antimicrobial concentration achieved at the site of infection. Therefore, different dosing regimens can lead to the development of different CBPs, as occurs in some countries for certain antimicrobials where different therapeutic regimes are in place. Although the rationale for the selection of different CBPs may be clear, their use makes the interpretation of results from different countries in reports of this type problematic, as the results are not directly comparable between those different countries.
Epidemiological cut‐off values (microbiological resistance)
For a given bacterial species, the pattern of the MIC distribution (i.e. the frequency of occurrence of each given MIC plotted against the MIC value) can enable the separation of the wild‐type population of microorganisms from those populations that show a degree of acquired resistance. The wild‐type susceptible population is assumed to have no acquired or mutational resistance and commonly shows a normal distribution. When bacteria acquire resistance by a clearly defined and efficacious mechanism, such as the acquisition of a plasmid bearing a gene which produces an enzyme capable of destroying the antimicrobial, then the MIC commonly shows two major subpopulations, one a fully susceptible normal distribution of isolates and the other a fully resistant population which has acquired the resistance mechanism. Resistance may be achieved by a series of small steps, such as changes in the permeability of the bacterial cell wall to the antimicrobial or other mechanisms which confer a degree of resistance. In this case, there may be populations of organisms which occur lying between the fully susceptible population and more resistant populations. The ECOFF value indicates the MIC or zone diameter above which the pathogen has some detectable reduction in susceptibility. ECOFFs are derived by testing an adequate number of isolates to ensure that the wild‐type population can be confidently identified for a given antimicrobial. The clinical breakpoint, which is set to determine the therapeutic effectiveness of the antimicrobial, may fail to detect emergent resistance. Conversely, the ECOFF detects any deviation in susceptibility from the wild‐type population, although it may not be appropriate for determining the likelihood of success or failure for clinical treatment.
MRSA
Isolates may have been collected by different monitoring approaches, either by active monitoring of animals and foods or, in some cases, by passive monitoring based on diagnostic submission of samples from clinical cases of disease in animals, or from foods sampled as part of investigatory work.
Harmonised antimicrobial susceptibility testing
Routine monitoring antimicrobial susceptibility
MSs tested antimicrobials and interpreted the results using the ECOFFs and concentration ranges shown in Tables 6 and 7 to determine the susceptibility of Salmonella spp., C. coli, C. jejuni and indicator commensal E. coli. All E. coli isolates, randomly selected isolates of Salmonella spp. and E. coli that, after testing with the first panel of antimicrobials in accordance with Commission Implementing Decision 2013/652/EU were found to be resistant to cefotaxime, ceftazidime or meropenem, were further tested with a second panel of antimicrobial substances as shown in Table 8. This panel notably includes cefoxitin, cefepime and clavulanate in combination with cefotaxime and ceftazidime for the detection of presumptive ESBL and AmpC producers, as well as imipenem, meropenem and ertapenem to phenotypically identify presumptive carbapenemase producers.
Table 6.
Panel of antimicrobial substances included in AMR monitoring, EUCAST ECOFFs and concentration ranges tested in Salmonella spp. and indicator commensal E. coli (first panel) as laid down in Commission Implementing Decision 2013/652/EU
| Antimicrobial | Salmonella EUCAST ECOFFa | E. coli EUCAST ECOFFa | Concentration range, mg/L (no. of wells) |
|---|---|---|---|
| Ampicillin | > 8 | > 8 | 1–64 (7) |
| Cefotaxime | > 0.5 | > 0.25 | 0.25–4 (5) |
| Ceftazidime | > 2 | > 0.5 | 0.5–8 (5) |
| Meropenem | > 0.125 | > 0.125 | 0.03–16 (10) |
| Nalidixic acid | > 16 | > 16 | 4–128 (6) |
| Ciprofloxacin | > 0.064 | > 0.064 | 0.015–8 (10) |
| Tetracycline | > 8 | > 8 | 2–64 (6) |
| Colistin | > 2 | > 2 | 1–16 (5) |
| Gentamicin | > 2 | > 2 | 0.5–32 (7) |
| Trimethoprim | > 2 | > 2 | 0.25–32 (8) |
| Sulfamethoxazole | NAb | > 64 | 8–1,024 (8) |
| Chloramphenicol | > 16 | > 16 | 8–128 (5) |
| Azithromycin | NAc | NAc | 2–64 (6) |
| Tigecycline | > 1 | > 1 | 0.25–8 (6) |
AMR: antimicrobial resistance; ECOFFs: epidemiological cut‐off values; EUCAST: European Committee on Antimicrobial Susceptibility Testing; NA: not available.
EUCAST epidemiological cut‐off values available as the Decision 2013/652/EU was drafted (2013).
> 256 mg/L was used.
> 16 mg/L was used.
Table 7.
Panel of antimicrobial substances included in AMR monitoring, EUCAST ECOFFs and concentration ranges tested in C. jejuni and C. coli
| Antimicrobial | C. jejuni EUCAST ECOFFa | C. coli EUCAST ECOFFa | Concentration range, mg/L (no. of wells) |
|---|---|---|---|
| Erythromycin | > 4 | > 8 | 1–128 (8) |
| Ciprofloxacin | > 0.5 | > 0.5 | 0.12–16 (8) |
| Tetracycline | > 1 | > 2 | 0.5–64 (8) |
| Gentamicin | > 2 | > 2 | 0.12–16 (8) |
| Nalidixic acid | > 16 | > 16 | 1–64 (7) |
| Streptomycin b | > 4 | > 4 | 0.25–16 (7) |
AMR: antimicrobial resistance; EUCAST: European Committee on Antimicrobial Susceptibility Testing; ECOFFs: epidemiological cut‐off values; NA: not available.
EUCAST epidemiological cut‐off values.
On a voluntary basis.
Table 8.
Panel of antimicrobial substances, EUCAST ECOFFs and concentration ranges used for testing only Salmonella spp. and indicator commensal E. coli isolates resistant to cefotaxime, ceftazidime or meropenem (second panel)
| Antimicrobial | Salmonella EUCAST ECOFFa | E. coli EUCAST ECOFFa | Concentration range, mg/L (no. of wells) |
|---|---|---|---|
| Cefoxitin | > 8 | > 8 | 0.5–64 (8) |
| Cefepime | NAb | > 0.125 | 0.06–32 (10) |
| Cefotaxime + clavulanic acid | NA | NA | 0.06–64 (11) |
| Ceftazidime + clavulanic acid | NA | NA | 0.125–128 (11) |
| Meropenem | > 0.125 | > 0.125 | 0.03–16 (10) |
| Temocillin | NAc | NAc | 0.5–64 (8) |
| Imipenem | > 1 | > 0.5 | 0.12–16 (8) |
| Ertapenem | > 0.06 | > 0.06 | 0.015–2 (8) |
| Cefotaxime | > 0.5 | > 0.25 | 0.25–64 (9) |
| Ceftazidime | > 2 | > 0.5 | 0.25–128 (10) |
ECOFFs: epidemiological cut‐off values; EUCAST: European Committee on Antimicrobial Susceptibility Testing; NA: not available.
EUCAST epidemiological cut‐off values available as the Decision 2013/652/EU was drafted (2013). For some antimicrobials, these values have been updated (see below).
For cefepime, the cut‐off value used in the analysis for Salmonella spp. was > 0.125 mg/L.
For temocillin, the cut‐off value used in the analysis was > 32 mg/L.
Specific monitoring of ESBL‐/AmpC‐/carbapenemase‐producing E. coli
For the specific monitoring of ESBL‐/AmpC‐/carbapenemase‐producing E. coli, the isolation method started with a non‐selective pre‐enrichment step, followed by inoculation on MacConkey agar containing a third‐generation cephalosporin in a selective concentration (cefotaxime 1 mg/L), in accordance with the most recent version of the detailed protocol for standardisation of the EURL‐AR.10 Using this protocol, also carbapenemase‐producing isolates can also be recovered.
If available, one presumptive ESBL‐/AmpC‐/carbapenemase‐producing E. coli isolate obtained from each positive caecal sample and meat sample was tested for its antimicrobial susceptibility to the first panel of antimicrobials (Table 6) to confirm the microbiological resistance to cefotaxime (expected as the antimicrobial is present in the isolation medium at a concentration higher than the ECOFF), and identify possible resistance to ceftazidime and/or ceftazidime and/or meropenem. In a second step, the isolate should be tested using the second panel of antimicrobials (Table 8) to infer the presumptive ESBL‐/AmpC‐/carbapenemase‐producing phenotype according to the β‐lactam resistance phenotype obtained (Figure 8).
Figure 8.
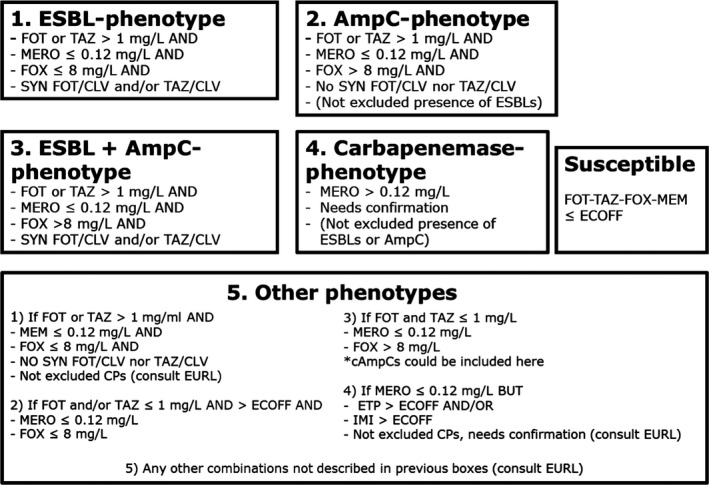
Phenotypes inferred based on the resistance to the β‐lactams included in Panel 2
-
Presumptive ESBL producers include isolates exhibiting phenotype 1 or 3.Presumptive AmpC producers include isolates exhibiting phenotype 2 or 3.
Specific monitoring of carbapenemase‐producing microorganisms
This monitoring programme was performed and reported on a voluntary basis. For the specific monitoring of carbapenemase‐producing microorganisms, isolation required the use of non‐selective pre‐enrichment and subsequent selective plating on carbapenem‐containing media, in accordance with the most recent version of the detailed protocol of the EURL‐AR. The microbial species was identified using an appropriate method.
If available, one presumptive carbapenemase‐producing isolate (primarily E. coli, but also Salmonella) obtained from each positive caecal sample and meat sample was tested for its antimicrobial susceptibility to the first panel of antimicrobials (Table 6) to confirm the microbiological resistance to meropenem, and identify possible resistance to cefotaxime and/or ceftazidime. In a second step, the isolate should be tested using the second panel of antimicrobials (Table 8) to infer the presumptive carbapenemase‐producer phenotype according to the β‐lactam resistance phenotype obtained (Figure 8).
The EUCAST ECOFFs applied for the antimicrobial susceptibility testing (Tables 6, 7, 8) are the ones available during the drafting of the Decision 2013/652/EU in 2013. For some antimicrobials, these values have been updated by EUCAST (www.eucast.org, last accessed 10.8.17). Currently, for Salmonella, there is no ECOFF available for colistin, and for tigecycline the ECOFF of 1 mg/L, is based on the one for S. Typhimurium, S. Typhi and S. Paratyphi, whereas for S. Enteritidis it is 2 mg/L. For E. coli, the current tigecycline ECOFF is 0.5 mg/L. To allow comparison with the data collected in previous years, the ECOFFs laid down in the legislation are considered.
2.2.2. Data validation
Validation against business rules
The reported data were first checked for usability against a series of ‘business rules’, which were automatically applied in the EFSA data collection system once a file was sent. This automatic data validation process refers to the first validation of incoming data. Quality checks are related to a specific business only. The positive result of the automatic validation process places the file in a valid state and makes it available for further steps of validation performed by EFSA.
Scientific data validation
The scientific validation of the data collected by the MSs/non‐MSs and submitted to EFSA consisted on the revision of data and comparison between data reported for the same antimicrobials when tested by different panels. Special attention was given to carbapenems, colistin, azithromycin, tigecycline and to possible discrepancies between results for antimicrobials present in both panels (i.e. cefotaxime, ceftazidime, meropenem). MSs were contacted by EFSA asking for clarifications. If considered needed, MSs were asked to confirm the MIC results and the species identification of the reported isolates.
Reference testing
To ensure the quality of data submitted, a reference testing exercise was run by the EURL‐AR in close collaboration with the MSs. The exercise consisted in retesting the AST of the isolates received using both Panel 1 and Panel 2 of antimicrobials, as well as whole genome sequencing (WGS) analyses of the isolates (WGS analyses still on‐going by the time of drafting the present report). Based on the data submitted to EFSA, a selection of 300 isolates was made. The selection of these isolates was based on different criteria:
The EURL‐AR had reported technical issues when testing azithromycin, tigecycline and colistin during the EURL workshop hold in Lyngby (Denmark) 2016 (www.eurl-ar.eu). Resistant isolates from countries with outstanding prevalence for these antimicrobials were asked to provide selected isolates to the EURL‐AR. Most of the E. coli isolates chosen were selected among the ones reported for the specific ESBL/AMPC/carbapenemase monitoring.
There was a discrepancy between MIC values reported for the antimicrobials present in both panels (impacting the categorisation of the isolate as resistant or susceptible).
If according to the criteria applied (Section 2.2.5), the presence of carbapenemase producers was suspected.
Isolates representing the categorisations presumptive ESBLs‐, AmpC and ESBL + AmpC producers.
Isolates with odd phenotypes.
The MSs/non‐MSs sent the selected isolates to the EURL‐AR, where they were retested. EFSA, EURL‐AR and MSs liaised together to address possible discrepancies found.
2.2.3. Analyses of antimicrobial resistance data
Data are reported in separate sections dedicated to each microorganism. Clinical investigation data were not accounted for in this report.
Overview tables of the resistance data reported
Data generated from the antimicrobial susceptibility testing and reported as quantitative at the isolate level by MSs have been described in the overview tables published on the EFSA website.
Minimum inhibitory concentration distributions
For each combination of microorganism, antimicrobial and food category/animal population were tested, MIC distributions were tabulated in frequency tables, giving the number of isolates tested that have a given MIC at each test dilution (mg/L) of the antimicrobial. Isolate‐based dilution results allowed MIC distributions reported:
for Salmonella for ampicillin, azithromycin, cefepime, cefotaxime, cefotaxime and clavulanic acid, ceftazidime, ceftazidime and clavulanic acid, cefoxitin, chloramphenicol, ciprofloxacin, colistin, ertapenem, gentamicin, imipenem, meropenem, nalidixic acid, sulfamethoxazole, temocillin, tetracycline, tigecycline and trimethoprim;
for Campylobacter for ciprofloxacin, erythromycin, gentamicin, nalidixic acid, streptomycin and tetracycline;
for indicator E. coli for ampicillin, azithromycin, cefepime, cefotaxime, cefotaxime and clavulanic acid, ceftazidime, ceftazidime and clavulanic acid, cefoxitin, chloramphenicol, ciprofloxacin, colistin, ertapenem, gentamicin, imipenem, meropenem, nalidixic acid, sulfamethoxazole, temocillin, tetracycline, tigecycline and trimethoprim;
for MRSA for cefoxitin, chloramphenicol, ciprofloxacin, clindamycin, erythromycin, fusidic acid, gentamicin, kanamycin, linezolid, mupirocin, penicillin, quinupristin/dalfopristin, rifampicin, streptomycin, sulfamethoxazole, tetracycline, tiamulin, trimethoprim and vancomycin.
Epidemiological cut‐off values and the occurrence of resistance
ECOFFs, as listed in Decision 2013/652/EC, have been used in this report to interpret the isolate‐based reported MIC data and determine non‐wild‐type organisms also termed ‘microbiologically’ resistant organisms (i.e. displaying a decreased susceptibility), and to ensure that results from different MSs are comparable. From this point onwards in this report, ‘microbiologically’ antimicrobial‐resistant organisms are referred to as ‘resistant’ for brevity. This report also incorporates re‐evaluation of the historical data accounting for the revised EU legislation, which included the revised ECOFFs.
The occurrence of resistance11 to a number of antimicrobials was determined for Salmonella, Campylobacter, indicator commensal E. coli isolates from broilers, laying hens and fattening turkeys and are tabulated at the production‐type level in this report. The occurrence of resistance (i.e. resistance levels) in reporting MS groups was calculated as totals (the total number of resistant isolates out of the total number of tested isolates across reporting MSs) and not the weighted means.
Resistance in Salmonella serovars of public health importance
In this report, AMR in tested Salmonella isolates were aggregated to give a value for Salmonella spp. for each country and food/animal category. In addition, the most prevalent Salmonella serovars were also reported separately for particular food/animal category. Additional tables have been included in this report to describe the occurrence of AMR among selected Salmonella serovars of public health importance or of high prevalence in animals (S. Enteritidis, S. Infantis, S. Kentucky, S. Derby, S. Typhimurium and monophasic S. Typhimurium). To present a complete overview of the animal populations and food categories in which specific Salmonella serovars of public health importance have been recovered, all the data reported (derived even from fewer than 4 reporting countries and less than 10 isolates tested) have been included.
Data description.
Throughout the report, level or occurrence of AMR means the percentage of resistant isolates as a proportion of the isolates tested of that microorganism. MSs reporting group means the MSs that provided data and were included in the relevant table of antimicrobial resistance for that bacterium–food or animal category–antimicrobial combination. Terms used to describe the levels or occurrence of antimicrobial resistance are ‘rare’: < 0.1%, ‘very low’: 0.1–1.0%, ‘low’: > 1–10.0%, ‘moderate’: > 10.0–20.0%, ‘high’: > 20.0–50.0%, ‘very high’: > 50.0–70.0%, ‘extremely high’: > 70.0%. Although these terms are applied to all antimicrobials, the significance of a given level of resistance depends on the particular antimicrobial and its importance in human and veterinary medicine.
Temporal trends in resistance
Where the minimum criteria11 for data inclusion in this report were met, temporal trend graphs were generated showing the resistance to different antimicrobials from 2009 to 2015, by plotting the level of resistance for each year of sampling. Graphs were created for those countries for which resistance data were available for four or more years in the 2009–2015 period for at least one of the two antimicrobials. MS‐specific resistance levels trend graphs use a unique scale and countries are shown in alphabetical order. For ampicillin, cefotaxime, ciprofloxacin, nalidixic acid and tetracyclines (Salmonella and indicator E. coli), ciprofloxacin, erythromycin, nalidixic acid, streptomycin and tetracycline (Campylobacter), resistance trends over time were visually explored by trellis graphs, using the lattice package in the R software [R version 2.14.2 (29/2/2012)].
To assess the statistical significance of temporal trends, the proportions of resistance were modelled against time in a logistic regression. This analysis was carried out using the PROC LOGISTIC of SAS 9.2 for each country where there were 5 years or more of available data to use in the model. The PROC LOGISTIC function uses a logit transform to model the proportion of prevalence against year, and provides estimates for both intercepts and slope. Models where the likelihood ratio test suggested it to be meaningful and resulting in a p‐value associated with slope of < 0.05 were considered to be significant.
Spatial analysis of resistance through maps
MS‐specific AMR levels for selected bacterium–food category/animal population combinations were plotted in maps for 2015, using ArcGIS 9.3. In the maps, resistance levels are presented with colours reflecting the continuous scale of resistance to the antimicrobial of interest among reporting MSs; so, there might be some apparent discrepancies between the colours and resistance levels between maps.
2.2.4. Analysis of multidrug resistance and co‐resistance data
As a consequence of the availability of AMR data at the isolate level in the MSs, the analysis of MDR and co‐resistance data becomes an important procedure in the light of the public health relevance of the emergence of multiresistant bacteria. The intention is to focus mainly on multi/co‐resistance patterns involving critically important antimicrobials (Collignon et al., 2016; WHO, 2016) according to the bacterial species, such as cephalosporins, fluoroquinolones and macrolides, and to summarise important information in the EU Summary Report. The occurrence of the isolates of a serotype/resistance pattern of interest is studied at the MS level and at the reporting MS group/EU level, as the overall picture for all MSs might show a more definite pattern of emergence and spread. In addition, the analysis of data may reveal the existence of new or emerging patterns of MDR, particularly in Salmonella serotypes.
Definitions
For this analysis, a multiresistant isolate is one defined as resistant to at least three different antimicrobial substances, belonging to any three antimicrobial families listed in the harmonised set of antimicrobials included in the Decision 2013/652/EU. Tables 3 and 4 list those recommended antimicrobials. Resistance to nalidixic acid and resistance to ciprofloxacin, as well as the resistance to cefotaxime and to ceftazidime are, respectively, addressed together.
In contrast, a fully susceptible isolate is one defined as non‐resistant to all of the antimicrobial substances included in the harmonised set of substances for Salmonella, Campylobacter and indicator E. coli.
The term co‐resistance has been defined as two or more resistance genes which are genetically linked, i.e. located adjacent or close to each other on a mobile genetic element (Chapman, 2003). For brevity, the term is used slightly more loosely in this report and indicates two or more phenotypic resistances to different classes of antimicrobials, exhibited by the same bacterial isolate.
MDR patterns
The frequency and percentage of isolates exhibiting various MDR patterns considering the antimicrobials tested were determined for Salmonella (Salmonella spp., S. Enteritidis, S. Typhimurium and monophasic S. Typhimurium), Campylobacter species and indicator E. coli for each country and each animal population/food category. Isolates for which no susceptibility data were provided for some of the antimicrobial substances were disregarded.
Summary indicators’ and ‘diversity’ of MDR
The objective is first to give an overview of the situation on MDR through summary indicators: (1) the proportion of fully susceptible isolates; and (2) the proportion of multiresistant isolates. To illustrate the relative proportions of multiresistant isolates and the diversity of the resistance to multiple antimicrobials, graphical illustration was chosen. The percentage of isolates susceptible and resistant to one, two, three, etc., antimicrobials are shown using a composite bar graph displaying stacked bars, but only for certain combinations of bacterium–animal population or food category–MSs of particular interest.
The co‐resistance patterns of interest
In Salmonella and E. coli isolates, co‐resistance to cefotaxime (CTX) and ciprofloxacin (CIP) was estimated, as these two antimicrobials are of particular interest in human medicine. Co‐resistance was addressed using both ECOFFs (CTX > 0.25 mg/L and CIP > 0.064 mg/L) and CBPs (CTX > 2 mg/L and CIP > 1 mg/L) for E. coli. In C. jejuni and C. coli isolates, co‐resistance to ciprofloxacin and erythromycin (ERY) was estimated, as these two antimicrobials are of particular interest in human medicine in the treatment of severe campylobacteriosis. The interpretive ECOFFs used to address co‐resistance to ciprofloxacin and erythromycin were, for C. jejuni, CIP > 0.5 mg/L and ERY > 4 mg/L and, for C. coli, CIP > 0.5 mg/L and ERY > 8 mg/L. These values may be considered as very similar to CBPs.
2.2.5. Identification of presumptive ESBL, AmpC and/or carbapenemase producers
The categorisation of isolates resistant to third‐generation cephalosporins and/or carbapenems in presumptive ESBL, AmpC or carbapenemase producers was carried out based on the EUCAST guidelines for detection of resistance mechanisms and specific resistances of clinical and/or epidemiological importance (EUCAST, 2013). In these expert guidelines, and based on other EUCAST and CLSI guidelines to detect ESBL/AmpC producers, a screening breakpoint of > 1 mg/L is recommended for cefotaxime and ceftazidime. This screening breakpoint is higher than the ECOFFs applied for antimicrobial susceptibility of both antimicrobials for E. coli, and to cefotaxime for Salmonella. For this report, a first condition for classifying isolates as presumptive ESBL/AmpC producers related to their MIC for either cefotaxime or ceftazidime, was to apply this screening breakpoint of MICs > 1 mg/L. Only isolates which presented MIC values accomplishing with this requisite (as expected for most of the ESBL/AmpC producers) were further considered. In total, for the third‐generation cephalosporin‐ and/or carbapenem‐resistant isolates, five main categorisations are made: (1) ESBL phenotype; (2) AmpC phenotype; (3) ESBL + AmpC phenotype; (4) CP phenotype; and (5) Other phenotypes (Figure 8).
To detect the production of ESBLs, a synergy test for cefotaxime and ceftazidime, in combination with clavulanic acid was performed. An eightfold reduction in the MIC for the cephalosporin combined with clavulanic acid compared with that obtained for the cephalosporin alone was interpreted as a positive synergy test. In all other cases, the synergy test was considered negative. For the present report, isolates with MICs > 1 mg/L for cefotaxime and/or ceftazidime and a synergy test positive for any of these antimicrobials, together with susceptibility to cefoxitin (≤ 8 mg/L) and meropenem (MEM ≤ 0.12 mg/L see CP phenotype) were classified as ESBL phenotype (Figure 8).
For the AmpC phenotype, the combination MIC > 8 mg/L (ECOFF) for cefoxitin together with MICs > 1 mg/L for cefotaxime and/or ceftazidime was used as phenotypic criteria to investigate the presence of AmpC production in E. coli. It should be also underlined that there are a few AmpC enzymes that do not confer resistance to cefoxitin (i.e. ACC‐1), and that there are other mechanisms (porin loss, the presence of carbapenemases, a few ESBLs like cefotaxime (CTX‐M)‐5 that could generate similar MIC values for the different antimicrobials (EFSA, 2012a; EUCAST, 2013). Phenotypic AmpC confirmation tests (i.e. cloxacillin synergy) were not required for the present monitoring. For the present report, isolates with MICs > 1 mg/L for cefotaxime and/or ceftazidime and cefoxitin MIC > 8 mg/L, together with negative synergy test for both cefotaxime and ceftazidime/clavulanic acid, together with susceptibility to meropenem (MEM ≤ 0.12 mg/L) were classified in the AmpC phenotype category. No distinction between acquired AmpC and natural AmpC was made (Figure 8).
-
For the present report, isolates with MICs > 1 mg/L for cefotaxime and/or ceftazidime, positive synergy tests for any of these antimicrobials with clavulanic acid and cefoxitin MIC > 8 mg/L, together with susceptibility to meropenem (MEM ≤ 0.12 mg/L) were classified under the ESBL + AmpC phenotype category (Figure 8).For the occurrence and prevalence tables shown in Section ‘ESBL/AMPC/CP producers monitoring’, presumptive ESBL producers were considered as those exhibiting an ESBL and/or ESBL + AmpC phenotype, and presumptive AmpC producers, those with an AmpC and ESBL + AmpC phenotype.
In some isolates, several mechanisms can be present at the same time, making it very difficult to differentiate the phenotypes. Also the high‐level expression of AmpC β‐lactamases can mask the presence of ESBLs. AmpC can also be present in isolates with positive ESBL tests (clavulanic acid synergy). In this case, the cefepime/clavulanic acid synergy test should be used to overturn/confirm the presence of ESBLs in these isolates (EUCAST, 2013) but, unfortunately, the combination cefepime/clavulanic acid was not included among the substances tested for monitoring. The inclusion of resistance to cefepime with a MIC value ≥ 4 mg/L as an additional criterion proposed elsewhere (EFSA, 2012a), could be useful to ascertain the presence of an ESBL‐producer.
For the classification of isolates into the putative carbapenem producers (CPs), a meropenem screening cut‐off of > 0.12 mg/L (which coincides with the harmonised ECOFF) was chosen. It is known that other mechanisms (i.e. hyperproduction or combination of ESBLs and/or AmpC and porin loss) can also affect to the MIC values generated for the different carbapenems, especially for ertapenem. The confirmation of the carbapenemase production recommended by the EUCAST guidelines cannot be inferred from the carbapenem susceptibility testing data reported, but needs further phenotypic or molecular testing. Those MSs that reported data suggesting the presence of putative CPs were recommended to validate the results by performing further confirmatory testing, and the EURL‐AR offered to apply WGS of the isolates. For the present report, isolates with MIC > 0.12 mg/L for meropenem would be considered as presumptive CP and were classified under the CP phenotype. The presence of other resistance mechanisms (ESBLs, AmpC, etc.) within the isolates placed in this group cannot be ruled out.
In this group, phenotypes not included in the categorisations defined above were included: isolates with a MIC > 0.12 for ertapenem and/or MIC > 1 mg/L for imipenem (EUCAST screening cut‐offs, one dilution step higher than the currently defined ECOFFs) but no resistance to meropenem (MIC < 12 mg/L) were classified under the category ‘other phenotype’. Finally, isolates with MICs ≤ 1 mg/L for cefotaxime and ceftazidime would be considered as not ESBL and/or AmpC producers. This implied that some isolates considered as microbiologically resistant (MICs over the ECOFFs) would not be further classified, as probably other mechanisms or technical issues in the MIC testing (i.e. MIC value close to the ECOFF) would be responsible for the MIC values obtained. For the present report, cefotaxime‐ and ceftazidime‐resistant isolates with MICs ≤ 1 mg/L for both antimicrobials were considered as putative non‐ESBL/AmpC producers and were classified under the category ‘other phenotype’.
We are aware that without a further molecular characterisation of the isolates, it will not be possible to know exactly which resistance mechanisms are present. For epidemiological purposes and based on the EUCAST guidelines, the classification of ‘presumptive’ producers for the different mechanism conferring resistance to third‐generation cephalosporins and/or carbapenems was considered. Molecular characterisation of these mechanisms is recommended.
2.2.6. Data on meticillin‐resistant Staphylococcus aureus (MRSA)
In 2016, Belgium reported data on susceptibility testing of MRSA isolates from pigs (fattening and breeding animals), Switzerland from meat from broilers and Sweden reported data from pet animals (cats and dogs), goats, wild hedgehogs and solipeds (domestic horses). Details of the antimicrobials selected by Belgium, Sweden and Switzerland are provided in the section on MRSA. For further information on reported MIC distributions and the number of resistant isolates, refer to the submitted and validated MS data published on the EFSA website.
Data on MRSA prevalence were reported by five MSs and two non‐MSs (Norway and Switzerland). The methods for collecting and testing samples for MRSA are not harmonised between MSs and, as a result, MSs may use differing procedures. Due to the variety of methods employed by MSs, these are explained in detail within the section on MRSA to enable readers to better follow the procedures carried out by individual countries.
3. Antimicrobial resistance in Salmonella
Human infections with Salmonella .
Most Salmonella infections in humans result in mild, self‐limiting, gastrointestinal illness and usually do not require antimicrobial treatment. In some patients, the infection may be more serious as the bacteria may spread from the intestines to the bloodstream and then to other body sites, the consequences of which can be life threatening. Acute Salmonella infections may sometimes also result in long‐term sequelae affecting the joints (reactive arthritis). In cases of severe enteric disease or invasive infection, effective antimicrobials are essential for treatment. Fluoroquinolones are widely recommended for treating adults and third‐generation cephalosporins are recommended for treating children. Infection with Salmonella strains resistant to these antimicrobials may be associated with treatment failure, which in turn can lead to poor outcomes for patients. Therefore, recommended treatment should take account of up‐to‐date information on local patterns of resistance.
For 2016, 23 MSs, plus Iceland and Norway provided data on AMR in human Salmonella isolates. Seventeen countries reported isolate‐based AST results as measured values (IZDs or MICs), three countries more than for 2015. Eight countries reported case‐based AST results interpreted as susceptible (S), intermediate (I) or resistant (R) according to the CBPs applied (Table SALMOVERVIEW).
3.1. Antimicrobial resistance in Salmonella isolates from humans
When referring to ‘Salmonella spp.’ in this section results for all non‐typhoidal Salmonella serovars from human cases with AST results are included. The resistance levels for Salmonella spp. are greatly influenced by the serovars included, with some serovars exhibiting higher levels of resistance to certain antimicrobials or expressing multidrug resistance to a higher degree than other serovars. Results are therefore presented separately for selected serovars prevalent in poultry (S. Enteritis, S. Infantis, S. Kentucky and S. Typhimurium) due to the legislative monitoring of isolates in this animal group in 2016. Data on additional serovars among the 10 most common in human cases in 2016 are available in appendices (monophasic S. Typhimurium, S. Newport, S. Derby, S. Stanley, S. Virchow and S. Saintpaul). Findings of extended‐spectrum β‐lactamase (ESBL)‐ and AmpC‐producing Salmonella in isolates from humans is available in Chapter 3.5 ESBL‐, AmpC‐ and/or carbapenemase‐producing Salmonella and Escherichia coli.
In total, 19,432 Salmonella isolates from clinical samples, encompassing 325 different serovars and serogroups, were tested for resistance to one or more antimicrobials and reported by 23 MSs, plus Iceland and Norway. This number represents 20.4% of the 95,434 confirmed human salmonellosis cases reported in the EU/EEA in 2016.
To better assess the impact of exposure within each reporting country on the AMR levels found in Salmonella isolates from humans, the analysis focused on domestically acquired cases. Travel information was however missing for a high proportion of cases in some countries (see further Table SALMTRAVHUM).
Methods and interpretive criteria used for antimicrobial susceptibility testing of Salmonella isolates from humans.
1.
Most laboratories fulfilled the ‘EU protocol for harmonised monitoring of antimicrobial resistance in human Salmonella and Campylobacter isolates’ (European Centre for Disease Prevention and Control (ECDC), 2016) on the antimicrobial panel to be tested. The type of method (dilution, disk diffusion, gradient strip) and the interpretive criteria used when providing interpreted results instead of measured values, are presented in Table 1, Materials and methods Section.
Quantitative data were interpreted by ECDC based on the EUCAST epidemiological cut‐off value (ECOFF) values, when available, in the same way as for the animal and food data. Where ECOFFs do not exist, EUCAST or Clinical and Laboratory Standards Institute (CLSI) CBPs were applied. For the qualitative susceptible, intermediate, resistant (SIR)12 data, intermediate and resistant results were combined into a non‐susceptible category.
For 11 antimicrobials, for which results were reported both as quantitative and interpreted data, the commonly used interpretive criteria were aligned (Figure 9). For this purpose, susceptible isolates were aligned with wild‐type isolates based on ECOFFs and non‐susceptible isolates (intermediate and resistant) were aligned with non‐wild‐type isolates. When analysed in this way, there is generally good concordance (± 1 dilution) across categories, also for ciprofloxacin after the CBPs for Salmonella was lowered in 2014. A notable exception is the EUCAST CBPs for meropenem, which is substantially higher (+ 4 dilutions) than the ECOFF.
Figure 9.
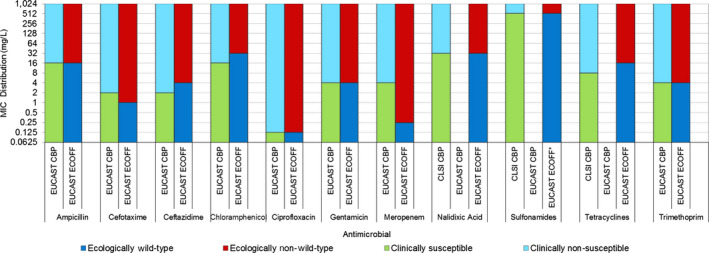
Comparison of CBPs for non‐susceptibility (intermediate and resistant categories combined) and ECOFFs used to interpret MIC data reported for Salmonella spp. from humans, animals or food
Figure 9.
Comparison of CBPs for non‐susceptibility (intermediate and resistant categories combined) and ECOFFs used to interpret MIC data reported for Salmonella spp. from humans, animals or food
3.1.1. Antimicrobial resistance in Salmonella spp. isolates from humans
The serovar distribution within the Salmonella spp. varies by country depending on their frequency among human cases and/or specific sampling strategies for further typing and AST at the national public health reference laboratories. For this reason, comparisons between countries should be avoided at the level of Salmonella spp.
Resistance levels in Salmonella spp. isolates from humans
The highest proportions of resistance in Salmonella spp. isolates from humans in 2016 were reported for sulfonamides/sulfamethoxazole (34.64%), ampicillin (29.5%) and tetracyclines (29.2%) (Table 10).
Table 10.
Antimicrobial resistance in Salmonella spp. (all non‐typhoidal serovars) from humans per country in 2016
| Country | Gentamicin | Chloramphenicol | Ampicillin | Cefotaxime | Ceftazidime | Meropenem | Tigecycline | |||||||
|---|---|---|---|---|---|---|---|---|---|---|---|---|---|---|
| N | % Res | N | % Res | N | % Res | N | % Res | N | % Res | N | % Res | N | % Res | |
| Austria | 1,460 | 1.2 | 1,460 | 2.9 | 1,460 | 13.2 | 1,460 | 0.5 | 1,460 | 0.5 | 1,460 | 0 | 1,460 | 0 |
| Belgium | 984 | 2.2 | 983 | 7.2 | 983 | 42.5 | 984 | 1.7 | 982 | 1.2 | 982 | 0 | – | – |
| Cyprus | 105 | 4.8 | – | – | 106 | 24.5 | 34 | 2.9 | 106 | 0.9 | 102 | 0 | 1 | NA |
| Denmark | 336 | 1.8 | 336 | 6.3 | 336 | 40.2 | 336 | 0.3 | 336 | 0.3 | 336 | 0 | 336 | 0.6 |
| Estonia | 203 | 1.5 | 203 | 3.0 | 203 | 35.5 | 200 | 0 | 204 | 0 | 202 | 0 | – | – |
| Finland | 240 | 0.8 | 240 | 4.6 | 240 | 25.0 | 240 | 2.1 | – | – | 240 | 0 | – | – |
| France | 852 | 0.8 | 852 | 5.3 | 852 | 29.8 | 852 | 0.5 | 852 | 0.2 | 851 | 0 | 852 | 0.8 |
| Germany a | 2,007 | 2.3 | 2,007 | 6.1 | 2,008 | 43.4 | 2,008 | 1.5 | 2,007 | 0.9 | 2,007 | 0 | – | – |
| Greece | 246 | 0.8 | 246 | 1.2 | 246 | 8.1 | 246 | 0.8 | 246 | 0.8 | 245 | 0 | – | – |
| Hungary a | 414 | 2.2 | 417 | 11.8 | 417 | 67.4 | 417 | 0.7 | 416 | 9.6 | 416 | 0 | – | – |
| Ireland | 214 | 4.2 | 214 | 7.0 | 214 | 29.4 | 214 | 1.9 | 214 | 1.9 | 214 | 0 | 214 | 0.5 |
| Italy | 66 | 4.5 | 66 | 9.1 | 66 | 47.0 | 66 | 0 | 66 | 0 | 66 | 0 | – | – |
| Latvia a | – | – | – | – | 26 | 15.4 | 27 | 3.7 | – | – | – | – | – | – |
| Lithuania a | 356 | 0.6 | 469 | 1.5 | 1,020 | 24.5 | 847 | 0.6 | 469 | 1.1 | 288 | 0 | – | – |
| Luxembourg | 108 | 0.9 | 108 | 3.7 | 108 | 26.9 | 108 | 0 | 108 | 0.9 | 108 | 0 | – | – |
| Malta a | – | – | – | – | 180 | 29.4 | 180 | 7.8 | 180 | 7.8 | 181 | 0 | – | – |
| Netherlands | 927 | 2.3 | 927 | 7.8 | 927 | 29.4 | 927 | 1.2 | 927 | 1.1 | 927 | 0 | 927 | 1.2 |
| Portugal | 308 | 1.3 | 308 | 7.5 | 308 | 52.9 | 308 | 0.3 | 308 | 0.3 | 308 | 0 | 308 | 0.3 |
| Romania | 212 | 1.9 | 212 | 2.4 | 212 | 25.5 | 212 | 1.4 | 212 | 1.4 | 212 | 0 | – | – |
| Slovakia a | – | – | 6 | NA | 790 | 8.2 | 201 | 2.0 | 8 | NA | 7 | 0 | – | – |
| Slovenia | 311 | 0.3 | 311 | 0.6 | 311 | 11.6 | 311 | 0 | 311 | 0 | 311 | 0a | – | – |
| Spain | 1,418 | 1.1 | 1,417 | 6.5 | 1,419 | 37.4 | 1,416 | 1.6 | 1,415 | 0.5 | 1,401 | 0 | – | – |
| United Kingdom a | – | – | 2,095 | 11.6 | 3,454 | 23.1 | 1,295 | 1.0 | 749 | 4.4 | 844 | 0 | – | – |
| Total (MSs 23) | 10,767 | 1.7 | 12,877 | 6.5 | 15,886 | 29.5 | 12,889 | 1.2 | 11,576 | 1.4 | 11,708 | 0 | 4,098 | 0.5 |
| Iceland a | – | – | 23 | 0 | 23 | 60.9 | 1 | NA | – | – | – | – | – | – |
| Norway | 223 | 2.2 | 84 | 16.7 | 223 | 20.6 | 223 | 0.9 | 223 | 0.9 | 223 | 0 | – | – |
| Country | Nalidixic acid | Ciprofloxacinb | Azithromycin | Colistin | Sulfamethoxazolec | Trimethoprim | Co‐trimoxazole | Tetracycline | ||||||||
|---|---|---|---|---|---|---|---|---|---|---|---|---|---|---|---|---|
| N | % Res | N | % Res | N | % Res | N | % Res | N | % Res | N | % Res | N | % Res | N | % Res | |
| Austria | 1,460 | 13.3 | 1,100 | 14.7 | – | – | – | – | 1,460 | 15.1 | 1,460 | 2.7 | – | – | 1,460 | 15.6 |
| Belgium | 984 | 13.9 | 984 | 17.1 | 982 | 0.2 | – | – | 984 | 41.8 | 424 | 16.5 | – | – | 984 | 39.1 |
| Cyprus | – | – | – | – | – | – | 68 | 0 | – | – | – | – | – | – | 35 | 31.4 |
| Denmark | 336 | 3.0 | 336 | 4.5 | 336 | 1.2 | 336 | 3.9 | 336 | 37.8 | 336 | 6.0 | – | – | 336 | 38.1 |
| Estonia | 153 | 43.1 | 203 | 36.0 | – | – | 202 | 0.5 | 203 | 35.0 | 203 | 30.5 | – | – | 202 | 37.6 |
| Finland | 240 | 24.6 | 240 | 26.3 | – | – | – | – | – | – | 240 | 5.4 | – | – | 240 | 22.5 |
| France | 852 | 10.3 | 851 | 11.0 | 852 | 1.1 | 852 | 7.5 | 852 | 41.4 | 852 | 6.2 | – | – | 852 | 30.9 |
| Germany a | 2,006 | 11.7 | 2,007 | 2.2 | – | – | – | – | – | – | – | – | 2,006 | 7.2 | 2,003 | 27.1 |
| Greece | 246 | 6.1 | 246 | 2.0 | – | – | – | – | 246 | 62.6 | 233 | 4.3 | – | – | 246 | 7.3 |
| Hungary a | – | – | 419 | 6.0 | – | – | – | – | – | – | 417 | 6.5 | 417 | 12.5 | 417 | 68.3 |
| Ireland | 214 | 18.7 | 214 | 22.9 | 214 | 2.3 | 52 | 0 | 214 | 27.1 | 214 | 7.9 | – | – | 214 | 31.3 |
| Italy | 66 | 7.6 | 66 | 4.5 | – | – | – | – | 66 | 62.1 | 66 | 9.1 | 66 | 9.1 | 66 | 48.5 |
| Latvia a | – | – | 27 | 0 | – | – | – | – | – | – | – | – | 1 | NA | – | – |
| Lithuania a | 362 | 12.4 | 743 | 6.9 | – | – | – | – | – | – | 366 | 4.9 | 1,018 | 2.8 | 361 | 19.9 |
| Luxembourg | – | – | 108 | 7.4 | – | – | – | – | 108 | 35.2 | 108 | 11.1 | 108 | 8.3 | 108 | 32.4 |
| Malta a | – | – | 180 | 11.7 | – | – | – | – | – | – | – | – | – | – | – | – |
| Netherlands | 927 | 14.3 | 927 | 16.2 | 927 | 0.8 | 927 | 7.8 | 927 | 29.6 | 927 | 5.6 | – | – | 927 | 28.7 |
| Portugal | 308 | 17.9 | 308 | 14.6 | 308 | 1.0 | – | – | 308 | 74.0 | 308 | 22.4 | – | – | 308 | 53.2 |
| Romania | 212 | 20.8 | 212 | 11.8 | – | – | – | – | 212 | 25.5 | 212 | 7.1 | 212 | 3.8 | 212 | 14.2 |
| Slovakia a | – | – | 351 | 5.1 | – | – | – | – | – | – | – | – | 234 | 0.9 | 514 | 6.0 |
| Slovenia | – | – | 310 | 14.5 | – | – | – | – | 311 | 18.0 | 311 | 3.5 | 311 | 1.9 | 311 | 13.2 |
| Spain | 1,414 | 17.9 | 1,418 | 14.8 | – | – | – | – | 1,416 | 44.1 | 1,414 | 9.5 | – | – | 1,418 | 38.2 |
| United Kingdom a | 1,096 | 15.1 | 3,572 | 10.2 | – | – | – | – | 499 | 21.2 | 1,813 | 8.6 | 814 | 10.6 | 633 | 29.9 |
| Total (MSs 23) | 10,876 | 14.2 | 14,822 | 11.0 | 3,619 | 0.8 | 2,437 | 6.2 | 8,142 | 34.6 | 9,904 | 7.9 | 5,187 | 6.6 | 11,847 | 29.2 |
| Iceland a | – | – | 23 | 4.3 | – | – | – | – | – | – | – | – | 23 | 0 | – | – |
| Norway | – | – | 223 | 24.7 | 84 | 1.2 | – | – | – | – | – | – | 223 | 6.7 | 84 | 44.0 |
N: number of isolates tested; % Res: percentage of microbiologically resistant isolates (either interpreted as non‐wild type by ECOFFs or clinically non‐susceptible by combining resistant and intermediate categories); –: no data reported; NA: not applicable – if less than 10 isolates were tested, the percentage of resistance was not calculated; MS: Member State.
Data interpreted with clinical breakpoints.
Countries doing disk diffusion have replaced ciprofloxacin with pefloxacin when screening for fluoroquinolone resistance, as recommended by EUCAST.
Combined data on the class of sulfonamides and the substance sulfamethoxazole within this group.
Resistance to ciprofloxacin was reported in 11.0% of the isolates and resistance to cefotaxime or ceftazidime in 1.2% and 1.4%, respectively. These antimicrobials represent the clinically most important antimicrobial classes (fluoroquinolones and third‐generation cephalosporins) for treatment of salmonellosis. Ciprofloxacin resistance decreased slightly compared with 2015 (when it was 13.1%) while resistance to cefotaxime or ceftazidime remained stable (0.9% resistance to both substances in 2015). Estonia reported the highest proportion of isolates resistant to ciprofloxacin (36.0%), which was related to a very high proportion (75.0%) of the S. Typhimurium isolates being resistant. A relatively high level of resistance to cefotaxime and ceftazidime was observed in Malta (7.8%), where 13 of 20 S. Kentucky isolates expressed an ESBL phenotype (see more on ESBL in human Salmonella in Chapter 3.5). No isolates were reported resistant to meropenem in 2016, although it should be noted that meropenem results were interpreted with CBPs in 7 of the 23 reporting countries and the CBP for intermediate resistance differs from the ECOFF by four dilutions. Resistance to colistin was detected in 6.2% of isolates although 85% of the resistant isolates were either S. Enteritidis or S. Dublin. Serotypes within serogroup O:9, such as S. Enteritidis and S. Dublin, have been reported to have inherent resistance to colistin (Agersø et al., 2012).
Combined resistance to critically important antimicrobials in Salmonella spp. isolates from humans
Combined ‘microbiological’ resistance to both of the critically important antimicrobials for treatment of human salmonellosis, ciprofloxacin and cefotaxime, was observed in 76 (0.6%) of 12,118 tested isolates (22 MSs; Table COMSALMHUM, Figure 10). Combined clinical resistance to both ciprofloxacin and cefotaxime was observed in 66 (0.5%) of the isolates. Of the 66 isolates with combined clinical resistance, 25 were S. Kentucky, 11 S. Typhimurium, 9 monophasic S. Typhimurium 1,4,[5],12:i:‐, 6 S. Infantis, 4 S. Enteritidis, 2 S. Newport, 1 each of S. Agona, S. Braenderup, S. Concord, S. Haifa and S. Saintpaul and 6 with unknown or non‐defined serotype.
Figure 10.
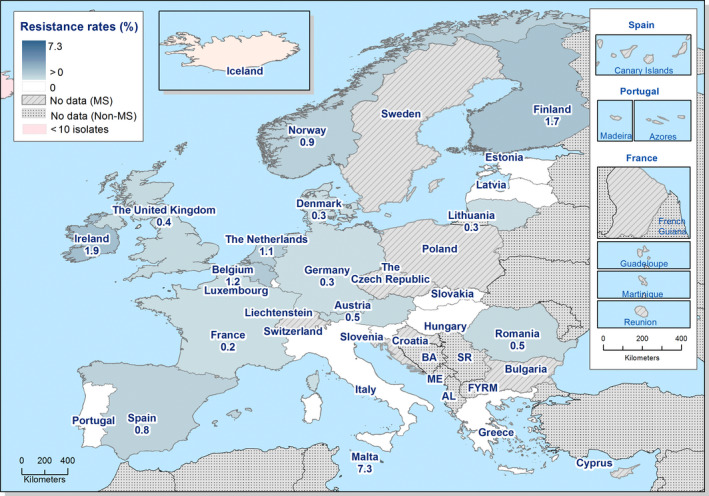
Spatial distribution of combined ‘microbiological’ resistance to ciprofloxacin and cefotaxime among Salmonella spp. from human cases, EU/EEA MSs, 2016
High‐level ciprofloxacin resistance in Salmonella spp. isolates from humans
Of the 2,676 Salmonella spp. isolates with ciprofloxacin MIC data, 1.7% (45 isolates) had a MIC ≥ 4 mg/L (Table 9). Such isolates were reported from four of the five countries which had provided quantitative data from dilution tests. High‐level ciprofloxacin resistance was most frequently reported in S. Kentucky (in 86.0% of tested S. Kentucky) among the five serovars reported with MIC ≥ 4 mg/L.
Table 9.
Occurrence of high‐level resistance to ciprofloxacin (MIC ≥ 4 mg/L) in Salmonella serovars isolated from humans in 2016, 5 MSs
| Serovar | N | High‐level resistance to ciprofloxacin (MIC ≥ 4 mg/L) | |
|---|---|---|---|
| n | % | ||
| S. Agona | 29 | 2 | 6.9 |
| S. Derby | 34 | 1 | 2.9 |
| S. Kentucky | 43 | 37 | 86.0 |
| S. Potsdam | 3 | 1 | 33.3 |
| S. Saintpaul | 30 | 1 | 3.3 |
| Not specified | 27 | 3 | 11.1 |
| Other | 2,510 | 0 | 0 |
| Total (5 MSs) | 2,676 | 45 | 1.7 |
MIC: minimum inhibitory concentration; MS: Member State.
Multidrug resistance in Salmonella spp. isolates from humans
Fourteen MSs tested at least 10 isolates for the nine antimicrobial classes included in the multiple drug resistance (MDR) analysis (Figure 11). On average 51.3% of Salmonella spp. isolates were susceptible to all nine antimicrobial classes (14 MSs, N = 7,040, Table MDRSALMHUM). Multidrug resistance was highest in Portugal (51.0%) and Italy (45.5%). Thirty‐three isolates (0.5% of the 7,040 tested in the 14 MSs for resistance to 9 drug classes) were resistant to 7 or 8 antimicrobial classes, including 11 isolates of monophasic S. Typhimurium, 6 each of S. Typhimurium and S. Saintpaul, 3 of undefined serotype and 1 each of S. Anatum, S. Concord, S. Enteritidis, S. Goldcoast, S. Haifa and S. Infantis. No isolates were reported resistant to all nine classes.
Figure 11.
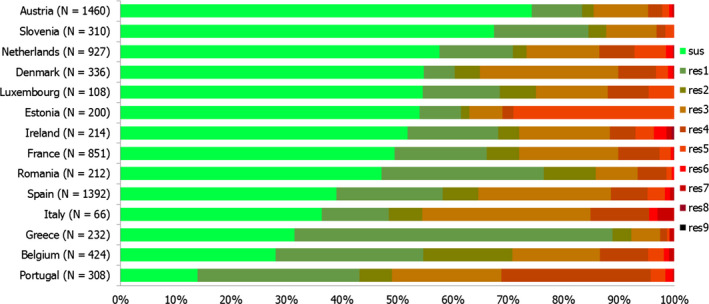
Frequency distribution of Salmonella spp. isolates from humans completely susceptible or resistant to one to nine antimicrobial classes in 2016
- N: total number of isolates tested for susceptibility against the whole common set of antimicrobials for Salmonella; sus: susceptible to all antimicrobial classes of the common set for Salmonella; res1–res9: resistance to one up to nine antimicrobial classes of the common set for Salmonella.
3.1.2. Antimicrobial resistance in Salmonella Enteritidis isolates from humans
Resistance levels in S. Enteritidis isolates from humans
S. Enteritidis was the most common Salmonella serovar identified in cases of salmonellosis in 2016, with 32,685 cases reported in the EU/EEA. The highest proportion of resistance among S. Enteritidis isolates from humans was observed for nalidixic acid (18.4%), colistin (17.5%) and ciprofloxacin/pefloxacin (12.3%) (22 MSs, Table 11). The highest proportions of ciprofloxacin resistance was reported by Finland (53.0%), Ireland (37.0%) and Portugal (26.4%). The high level of ciprofloxacin resistance in Finland can be explained by an outbreak with a multidrug‐resistant, ciprofloxacin‐resistant S. Enteritidis strain from imported mung bean seed for sprouting, affecting at least 22 people in 2016 (THL, 2017). Resistance to cefotaxime or ceftazidime was generally not detected or detected at very low levels in S. Enteritidis in the EU, with the exception of Hungary which reported 25.0% of isolates resistant to ceftazidime. The number of isolates tested was however low. Similarly, resistance to gentamicin was generally not detected or detected at very low levels.
Table 11.
Antimicrobial resistance in Salmonella Enteritidis from humans per country in 2016
| Country | Gentamicin | Chloramphenicol | Ampicillin | Cefotaxime | Ceftazidime | Meropenem | Tigecycline | |||||||
|---|---|---|---|---|---|---|---|---|---|---|---|---|---|---|
| N | % Res | N | % Res | N | % Res | N | % Res | N | % Res | N | % Res | N | % Res | |
| Austria | 716 | 0 | 716 | 0.4 | 716 | 1.8 | 716 | 0 | 716 | 0 | 716 | 0 | 716 | 0 |
| Belgium | 275 | 0 | 275 | 0.4 | 275 | 4.4 | 275 | 0.7 | 274 | 0.7 | 274 | 0 | – | – |
| Cyprus | 13 | 0 | – | – | 13 | 23.1 | 4 | NA | 13 | 0 | 12 | 0 | 1 | NA |
| Estonia | 75 | 0 | 75 | 2.7 | 75 | 0 | 74 | 0 | 75 | 0 | 75 | 0 | – | – |
| Finland | 83 | 0 | 83 | 0 | 83 | 28.9 | 83 | 1.2 | – | – | 83 | 0 | – | – |
| France | 237 | 0 | 237 | 0.4 | 237 | 4.6 | 237 | 0.4 | 237 | 0.4 | 237 | 0 | 237 | 0 |
| Germanya | 210 | 0 | 210 | 0.5 | 210 | 30 | 210 | 0 | 210 | 0 | 209 | 0 | – | – |
| Greece | 114 | 0 | 114 | 0 | 114 | 0 | 114 | 0 | 114 | 0 | 113 | 0 | – | – |
| Hungary | 12 | 0 | 12 | 8.3 | 12 | 66.7 | 12 | 0 | 12 | 25.0 | 12 | 0 | – | – |
| Ireland | 54 | 0 | 54 | 0 | 54 | 3.7 | 54 | 0 | 54 | 0 | 54 | 0 | 54 | 0 |
| Italy | 20 | 0 | 20 | 0 | 20 | 0 | 20 | 0 | 20 | 0 | 20 | 0 | – | – |
| Latviaa | – | – | – | – | 15 | 6.7 | 15 | 0 | – | – | – | – | – | – |
| Lithuania | 247 | 0 | 340 | 0.3 | 766 | 14.5 | 663 | 0.6 | 341 | 0.6 | 215 | 0 | – | – |
| Luxembourg | 22 | 0 | 22 | 0 | 22 | 0 | 22 | 0 | 22 | 0 | 22 | 0 | – | – |
| Maltaa | – | – | – | – | 62 | 0.0 | 61 | 0 | 61 | 0 | 62 | 0 | – | – |
| Netherlands | 237 | 0 | 237 | 0 | 237 | 2.1 | 237 | 0 | 237 | 0 | 237 | 0 | 237 | 0.8 |
| Portugal | 91 | 0 | 91 | 1.1 | 91 | 3.3 | 91 | 0 | 91 | 0 | 91 | 0 | 91 | 0 |
| Romania | 131 | 0.8 | 131 | 0.8 | 131 | 1.5 | 131 | 0.8 | 131 | 0.8 | 131 | 0 | – | – |
| Slovakiaa | – | – | 6 | 0 | 688 | 3.6 | 171 | 0.6 | 8 | NA | 7 | NA | – | – |
| Slovenia | 149 | 0 | 149 | 0 | 149 | 2 | 149 | 0 | 149 | 0 | 149 | 0a | – | – |
| Spain | 617 | 0.6 | 617 | 0.5 | 616 | 1.8 | 615 | 0.5 | 615 | 0.3 | 610 | 0 | – | – |
| United Kingdoma | – | – | 630 | 6.7 | 930 | 7.0 | 390 | 0 | 134 | 0 | 162 | 0 | – | – |
| Total (MSs 22) | 3,303 | 0.2 | 4,019 | 1.4 | 5,516 | 6.6 | 4,344 | 0.3 | 3,514 | 0.3 | 3,491 | 0 | 1,336 | 0.1 |
| Icelanda | – | – | 2 | NA | 2 | NA | – | – | – | – | – | – | – | – |
| Norway | 63 | 0 | 22 | 0 | 63 | 1.6 | 63 | 0 | 63 | 0 | 63 | 0 | – | – |
| Country | Nalidixic acid | Ciprofloxacinb | Azithromycin | Colistin | Sulfamethoxazolec | Trimethoprim | Co‐trimoxazole | Tetracycline | ||||||||
|---|---|---|---|---|---|---|---|---|---|---|---|---|---|---|---|---|
| N | % Res | N | % Res | N | % Res | N | % Res | N | % Res | N | % Res | N | % Res | N | % Res | |
| Austria | 716 | 11.2 | 545 | 11.2 | – | – | – | – | 716 | 1 | 716 | 0.6 | – | – | 716 | 1.1 |
| Belgium | 275 | 14.9 | 275 | 15.6 | 274 | 0 | – | – | 275 | 14.9 | 128 | 0 | – | – | 275 | 2.2 |
| Cyprus | – | – | – | – | – | – | 9 | 0 | – | – | – | – | – | – | 4 | NA |
| Estonia | 67 | 11.9 | 75 | 14.7 | – | – | 74 | 1.4 | 75 | 0.0 | 75 | 0 | – | – | 74 | 4.1 |
| Finland | 83 | 51.8 | 83 | 53.0 | – | – | – | – | – | – | 83 | 0 | – | – | 83 | 27.7 |
| France | 237 | 15.2 | 237 | 15.2 | 237 | 0 | 237 | 17.7 | 237 | 12.2 | 237 | 0.8 | – | – | 237 | 3.4 |
| Germanya | 210 | 11.9 | 210 | 0 | – | – | – | – | – | – | – | – | 209 | 0 | 210 | 3.3 |
| Greece | 114 | 7.9 | 114 | 0 | – | – | – | – | 114 | 57 | 110 | 0.9 | – | – | 114 | 0 |
| Hungary | – | – | 12 | 0 | – | – | – | – | – | – | 12 | 16.7 | 12 | 25.0 | 12 | 75.0 |
| Ireland | 54 | 38.9 | 54 | 37.0 | 54 | 0 | 9 | NA | 54 | 0 | 54 | 1.9 | – | – | 54 | 1.9 |
| Italy | 20 | 5.0 | 20 | 5.0 | – | – | – | – | 20 | 15 | 20 | 0 | 20 | 0 | 20 | 0 |
| Latviaa | – | – | 15 | 0 | – | – | – | – | – | – | – | – | 1 | NA | – | – |
| Lithuaniaa | 250 | 13.6 | 551 | 7.3 | – | – | – | – | – | – | 255 | 1.2 | 765 | 0.5 | 249 | 1.6 |
| Luxembourg | – | – | 22 | 9.1 | – | – | – | – | 22 | 18.2 | 22 | 0 | 22 | 0 | 22 | 4.5 |
| Maltaa | – | – | 61 | 0 | – | – | – | – | – | – | – | – | – | – | – | – |
| Netherlands | 237 | 14.3 | 237 | 14.8 | 237 | 1.3 | 237 | 23.6 | 237 | 0.8 | 237 | 0.4 | – | – | 237 | 0.4 |
| Portugal | 91 | 34.1 | 91 | 26.4 | 91 | 0 | – | – | 91 | 44.0 | 91 | 4.4 | – | – | 91 | 4.4 |
| Romania | 131 | 25.2 | 131 | 11.5 | – | – | – | – | 131 | 9.9 | 131 | 3.8 | 131 | 0 | 131 | 0.8 |
| Slovakiaa | – | – | 310 | 4.8 | – | – | – | – | – | – | – | – | 199 | 0 | 445 | 0.9 |
| Slovenia | – | – | 149 | 13.4 | – | – | – | – | 149 | 4 | 149 | 1.3 | 149 | 0 | 149 | 2.0 |
| Spain | 615 | 28.8 | 617 | 21.4 | – | – | – | – | 616 | 12.8 | 616 | 3.9 | – | – | 617 | 1.1 |
| United Kingdoma | 346 | 17.9 | 958 | 9.2 | – | – | – | – | 208 | 8.7 | 508 | 1.4 | 206 | 2.9 | 234 | 10.3 |
| Total (MSs 22) | 3,446 | 18.4 | 4,767 | 12.3 | 893 | 0.3 | 566 | 17.5 | 2,945 | 10.4 | 3,444 | 1.6 | 1,714 | 0.8 | 3,974 | 2.9 |
| Icelanda | – | – | 2 | NA | – | – | – | – | – | – | – | – | 2 | NA | – | – |
| Norway | – | – | 63 | 25.4 | 22 | 0 | – | – | – | – | – | – | 63 | 1.6 | 22 | 9.1 |
N: number of isolates tested; % Res: percentage of microbiologically resistant isolates (either interpreted as non‐wild type by ECOFFs or clinically non‐susceptible by combining resistant and intermediate categories); –: no data reported; NA: not applicable – if less than 10 isolates were tested, the percentage of resistance was not calculated; MS: Member State.
Data interpreted with clinical breakpoints.
Countries doing disk diffusion have replaced ciprofloxacin with pefloxacin when screening for fluoroquinolone resistance, as recommended by EUCAST.
Combined data on the class of sulfonamides and the substance sulfamethoxazole within this group.
Spatial distribution of resistance among S. Enteritidis isolates from human cases
Ciprofloxacin resistance in S. Enteritidis isolates from human cases (Figure 12) did not show a clear spatial pattern, i.e. resistance levels were not clustered by geographical area. Finland and Ireland reported the highest proportion of resistant isolates, followed by Portugal, Norway and Spain. Cefotaxime resistance levels were generally very low and did not show a spatial pattern (Figure 13).
Figure 12.
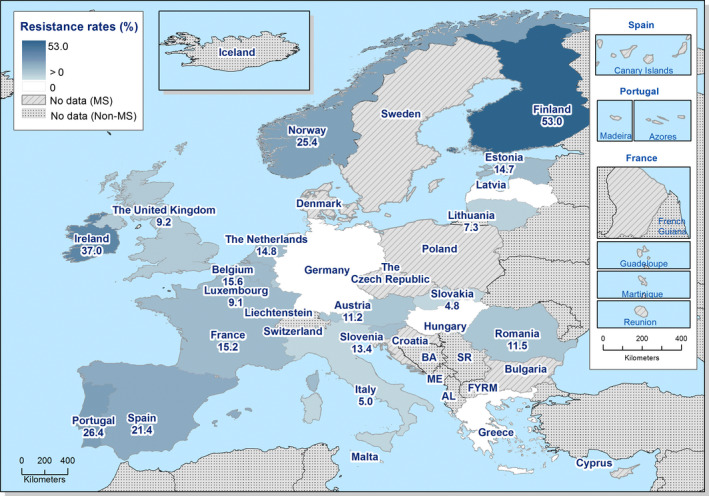
Spatial distribution of ciprofloxacin resistance among S. Enteritidis from human cases, EU/EEA MSs, 2016
Figure 13.
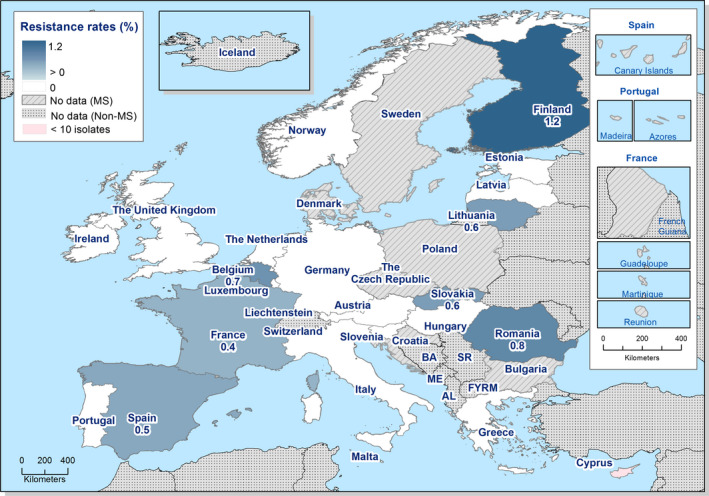
Spatial distribution of cefotaxime resistance among S. Enteritidis from human cases, EU/EEA MSs, 2016
Temporal trends in resistance among S. Enteritidis isolates from humans
Trend analysis was performed for the years 2013–2016 for resistance proportions of four antimicrobials. Twenty‐one MSs and one non‐MS were included in the analysis as they had provided resistance data for a minimum of 3 years in this period and a minimum of 10 S. Enteritidis isolates (Figure 14). Resistance to (fluoro)quinolones was assessed as resistance to either ciprofloxacin, pefloxacin or nalidixic acid due to breakpoint changes during the period and methodological issues (see further in Section 2 Materials and methods). Statistically significant increases in (fluoro)quinolone resistance were observed in Finland and Germany while decreasing (fluoro)quinolone trends were observed in France, Hungary, Malta, Spain and the United Kingdom. Resistance to ampicillin increased significantly in Finland, Germany and Hungary while it decreased in Italy, Latvia, Lithuania, Luxembourg, Malta, Romania, Slovenia and Spain. Tetracycline resistance increased significantly in Finland, Hungary and Norway and decreased in Portugal. No significantly increasing or decreasing trends were observed for cefotaxime resistance.
Figure 14.
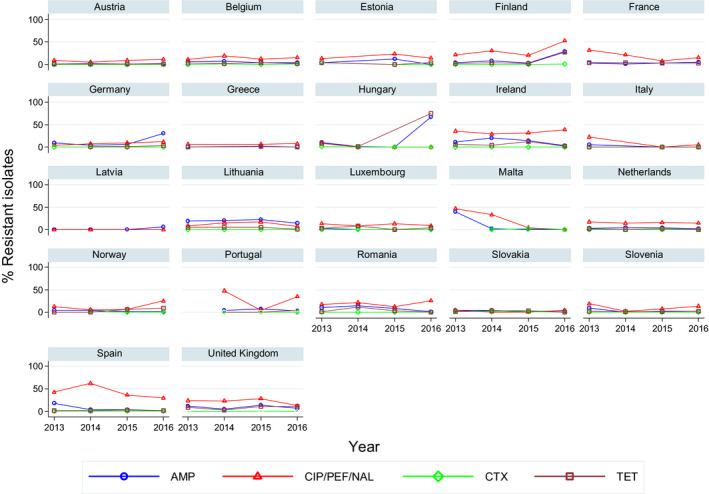
Trends in resistance to ampicillin, ciprofloxacin/pefloxacin/nalidixic acid, cefotaxime and tetracycline in Salmonella Enteritidis isolates from humans in 22 reporting countries, 2013–2016
- Statistically significant increasing trends over 3–4 years, as tested by logistic regression (p ≤ 0.05), were observed for ciprofloxacin in Finland and Germany, for ampicillin in Finland, Germany and Hungary, and for tetracyclines in Finland, Hungary and Norway. Statistically significant decreasing trends over 3–4 years were observed for ciprofloxacin in France, Hungary, Malta, Spain and the United Kingdom, for ampicillin in Italy, Latvia, Lithuania, Luxembourg, Malta, Romania, Slovenia and Spain, and for tetracyclines in Portugal. Only countries testing at least 10 isolates per year were included in the analysis.
Multidrug resistance in S. Enteritidis isolates from humans
Most (70.8%) of the S. Enteritidis isolates from humans were susceptible to all nine antimicrobial classes included in the analysis (13 MSs, N = 2,575) (Figure 15, Table COMENTERHUM). The lowest rates of fully susceptible isolates were reported in Portugal (26.4%) and Greece (33.9%). MDR was on average reported in 1.6% of isolates. Co‐resistance to ciprofloxacin and cefotaxime was detected in Belgium, Romania and Spain at very low levels (0.3–0.8%). One S. Enteritidis isolate resistant to six antimicrobial classes was reported from Portugal and one resistant to seven antimicrobials from Spain.
Figure 15.
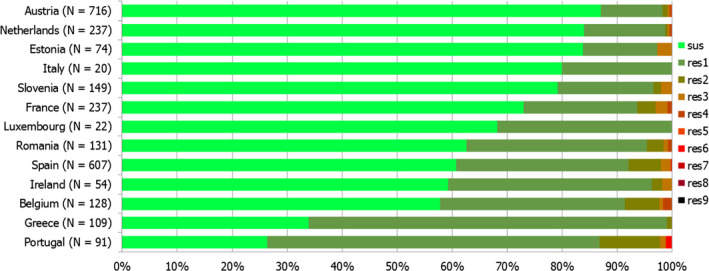
Frequency distribution of Salmonella Enteritidis isolates from humans completely susceptible or resistant to one to nine antimicrobial classes in 2016
- N: total number of isolates tested for susceptibility against the whole common antimicrobial set for Salmonella; sus: susceptible to all antimicrobial classes of the common set for Salmonella; res1–res9: resistance to one up to nine antimicrobial classes of the common set for Salmonella.
3.1.3. Antimicrobial resistance in Salmonella Typhimurium isolates from humans
Resistance levels in S. Typhimurium isolates from humans
S. Typhimurium was the second most common Salmonella serovar identified in 2016 with 9,012 cases reported in the EU/EEA (excluding monophasic S. Typhimurium 1,4,[5],12:i:). The highest proportion of resistance in S. Typhimurium was observed for ampicillin (60.6%), sulfonamides (50.0%) and tetracyclines (51.3%) (23 MSs, Table 12). The proportions of resistance to these antimicrobials were high to extremely high in all reporting MSs, except in Finland where low resistance to both ampicillin and tetracyclines was observed, and Ireland where moderate resistance to sulfonamides and tetracyclines was observed. The proportions of isolates resistant to either of the two clinically most critical antimicrobials were on average 8.5% for ciprofloxacin and 1.5% for cefotaxime. The highest proportion of isolates resistant to ciprofloxacin was reported from Estonia (75.0%) and Portugal (25.5%), whereas the highest proportion of cefotaxime resistance was reported from Slovakia (20.0%) and Greece (5.9%). It should be noted however that the number of isolates tested in Slovakia and Greece was low (n = 10 and n = 17, respectively).
Table 12.
Antimicrobial resistance in Salmonella Typhimurium from humans per country in 2016
| Country | Gentamicin | Chloramphenicol | Ampicillin | Cefotaxime | Ceftazidime | Meropenem | Tigecycline | |||||||
|---|---|---|---|---|---|---|---|---|---|---|---|---|---|---|
| N | % Res | N | % Res | N | % Res | N | % Res | N | % Res | N | % Res | N | % Res | |
| Austria | 178 | 1.7 | 178 | 7.3 | 178 | 32.0 | 178 | 2.2 | 178 | 2.2 | 178 | 0 | 178 | 0 |
| Belgium | 262 | 0.0 | 261 | 14.2 | 261 | 75.1 | 262 | 2.7 | 261 | 1.1 | 261 | 0 | – | – |
| Cyprus | 39 | 5.1 | – | – | 40 | 37.5 | 7 | NA | 40 | 0 | 38 | 0 | – | – |
| Denmark | 57 | 0 | 57 | 17.5 | 57 | 42.1 | 57 | 0 | 57 | 0 | 57 | 0 | 57 | 0 |
| Estonia | 72 | 0 | 72 | 2.8 | 72 | 81.9 | 71 | 0 | 72 | 0 | 72 | 0 | – | – |
| Finland | 57 | 0 | 57 | 7.0 | 57 | 10.5 | 57 | 0 | – | – | 57 | 0 | – | – |
| France | 117 | 0 | 117 | 27.4 | 117 | 47.0 | 117 | 0.9 | 117 | 0.9 | 116 | 0 | 117 | 0.9 |
| Germanya | 575 | 1.2 | 575 | 9.6 | 575 | 80.2 | 575 | 1.2 | 575 | 0.9 | 575 | 0 | – | – |
| Greece | 17 | 0 | 17 | 0 | 17 | 35.3 | 17 | 5.9 | 17 | 5.9 | 17 | 0 | – | – |
| Hungarya | 153 | 4.6 | 154 | 23.4 | 154 | 46.1 | 154 | 1.3 | 153 | 11.8 | 154 | 0 | – | – |
| Ireland | 37 | 0 | 37 | 8.1 | 37 | 24.3 | 37 | 0 | 37 | 0 | 37 | 0 | 37 | 0 |
| Italy | 1 | NA | 1 | NA | 1 | NA | 1 | NA | 1 | NA | 1 | NA | – | – |
| Latviaa | – | – | – | – | 6 | NA | 7 | NA | – | – | – | – | – | – |
| Lithuaniaa | 52 | 0 | 71 | 8.5 | 139 | 81.3 | 96 | 0 | 71 | 0 | 43 | 0 | – | – |
| Luxembourg | 21 | 0 | 21 | 19.0 | 21 | 38.1 | 21 | 0 | 21 | 0 | 21 | 0 | – | – |
| Maltaa | – | – | – | – | 27 | 88.9 | 27 | 0 | 27 | 0 | 27 | 0 | – | – |
| Netherlands | 196 | 1.0 | 196 | 26.0 | 196 | 46.4 | 196 | 0.5 | 196 | 0 | 196 | 0 | 196 | 0 |
| Portugal | 55 | 0 | 55 | 20.0 | 55 | 72.7 | 55 | 0 | 55 | 0 | 55 | 0 | 55 | 0 |
| Romania | 57 | 3.5 | 57 | 5.3 | 57 | 82.5 | 57 | 3.5 | 57 | 3.5 | 57 | 0 | – | – |
| Slovakiaa | – | – | – | – | 38 | 65.8 | 10 | 20.0 | – | – | – | – | – | – |
| Slovenia | 44 | 0 | 44 | 4.5 | 44 | 38.6 | 44 | 0 | 44 | 0 | 44 | 0a | – | – |
| Spain | 58 | 0 | 58 | 48.3 | 58 | 65.5 | 58 | 3.4 | 58 | 0 | 58 | 0 | – | – |
| United Kingdoma | – | – | 358 | 25.1 | 595 | 55.8 | 208 | 2.4 | 110 | 5.5 | 125 | 0 | – | – |
| Total (MSs 23) | 2,048 | 1.1 | 2,386 | 16.2 | 2,802 | 60.6 | 2,312 | 1.5 | 2,147 | 1.9 | 2,189 | 0 | 640 | 0.2 |
| Icelanda | – | – | 8 | NA | 8 | NA | – | – | – | – | – | – | – | – |
| Norway | 34 | 5.9 | 13 | 46.2 | 34 | 23.5 | 34 | 0 | 34 | 0 | 34 | 0 | – | – |
| Country | Nalidixic acid | Ciprofloxacinb | Azithromycin | Colistin | Sulfamethoxazolec | Trimethoprim | Co‐trimoxazole | Tetracycline | ||||||||
|---|---|---|---|---|---|---|---|---|---|---|---|---|---|---|---|---|
| N | % Res | N | % Res | N | % Res | N | % Res | N | % Res | N | % Res | N | % Res | N | % Res | |
| Austria | 178 | 4.5 | 126 | 6.3 | – | – | – | – | 178 | 33.1 | 178 | 4.5 | – | – | 178 | 34.3 |
| Belgium | 262 | 2.3 | 262 | 6.5 | 261 | 0 | – | – | 262 | 51.9 | 94 | 31.9 | – | – | 262 | 55.0 |
| Cyprus | – | – | – | – | – | – | 29 | 0 | – | – | – | – | – | – | 7 | 42.9 |
| Denmark | 57 | 0 | 57 | 0 | 57 | 0.0 | 57 | 0 | 57 | 38.6 | 57 | 5.3 | – | – | 57 | 40.4 |
| Estonia | 64 | 84.4 | 72 | 75.0 | – | – | 72 | 0 | 72 | 81.9 | 72 | 79.2 | – | – | 72 | 81.9 |
| Finland | 57 | 15.8 | 57 | 17.5 | – | – | – | – | – | – | 57 | 3.5 | – | – | 57 | 8.8 |
| France | 117 | 7.7 | 117 | 8.5 | 117 | 0.9 | 117 | 0.9 | 117 | 59.8 | 117 | 15.4 | – | – | 117 | 49.6 |
| Germanya | 574 | 4.2 | 574 | 0.2 | – | – | – | – | – | – | – | – | 575 | 13.2 | 573 | 60.7 |
| Greece | 17 | 5.9 | 17 | 0 | – | – | – | – | 17 | 88.2 | 17 | 5.9 | – | – | 17 | 35.3 |
| Hungarya | – | – | 155 | 7.7 | – | – | – | – | – | – | 154 | 7.8 | 154 | 11.7 | 154 | 45.5 |
| Ireland | 37 | 2.7 | 37 | 2.7 | 37 | 0 | 8 | 0 | 37 | 16.2 | 37 | 0 | – | – | 37 | 18.9 |
| Italy | 1 | NA | 1 | NA | – | – | – | – | 1 | NA | 1 | NA | 1 | NA | 1 | NA |
| Latviaa | – | – | 7 | NA | – | – | – | – | – | – | – | – | – | – | – | – |
| Lithuaniaa | 56 | 5.4 | 115 | 2.6 | – | – | – | – | – | – | 55 | 1.8 | 139 | 5 | 56 | 75.0 |
| Luxembourg | – | – | 21 | 4.8 | – | – | – | – | 21 | 38.1 | 21 | 19.0 | 21 | 19 | 21 | 47.6 |
| Maltaa | – | – | 27 | 0 | – | – | – | – | – | – | – | – | – | – | – | – |
| Netherlands | 196 | 18.4 | 196 | 19.4 | 196 | 0 | 196 | 0.5 | 196 | 41.3 | 196 | 10.2 | – | – | 196 | 36.7 |
| Portugal | 55 | 27.3 | 55 | 25.5 | 55 | 1.8 | – | – | 55 | 78.2 | 55 | 12.7 | – | – | 55 | 67.3 |
| Romania | 57 | 1.8 | 57 | 1.8 | – | – | – | – | 57 | 59.6 | 57 | 7.0 | 57 | 5.3 | 57 | 35.1 |
| Slovakiaa | – | – | 17 | 5.9 | – | – | – | – | – | – | – | – | 16 | 0 | 30 | 53.3 |
| Slovenia | – | – | 43 | 16.3 | – | – | – | – | 44 | 27.3 | 44 | 9.1 | 44 | 6.8 | 44 | 29.5 |
| Spain | 58 | 6.9 | 58 | 6.9 | – | – | – | – | 58 | 60.3 | 58 | 6.9 | – | – | 58 | 62.1 |
| United Kingdoma | 182 | 7.1 | 627 | 7.3 | – | – | – | – | 85 | 56.5 | 293 | 16.0 | 153 | 21.6 | 109 | 69.7 |
| Total (MSs 23) | 1,968 | 9.3 | 2,698 | 8.5 | 723 | 0.3 | 479 | 0.4 | 1,257 | 50.0 | 1,563 | 14.3 | 1,160 | 12.5 | 2,158 | 51.3 |
| Icelanda | – | – | 8 | NA | – | – | – | – | – | – | – | – | 8 | NA | – | – |
| Norway | – | – | 34 | 11.8 | 13 | 7.7 | – | – | – | – | – | – | 34 | 0 | 13 | 53.8 |
N: number of isolates tested; % Res: percentage of microbiologically resistant isolates [either interpreted as non‐wild type by ECOFFs or clinically non‐susceptible by combining resistant and intermediate categories]; –: no data reported; NA: not applicable – if fewer than 10 isolates were tested, the percentage of resistance was not calculated; MS: Member State.
Provided measured values. Data interpreted by ECDC.
Ciprofloxacin has in several countries been replaced by pefloxacin for screening of fluoroquinolone resistance with disc diffusion, as recommended by EUCAST.
Combined data on the class of sulfonamides and the substance sulfamethoxazole within this group.
Spatial distribution of resistance among S. Typhimurium isolates from humans
No geographical pattern was observed in the proportions of (fluoro)quinolone resistance in S. Typhimurium isolates from human cases (Figure 16). The highest proportions of (fluoro)quinolone resistance were observed in Estonia and Portugal. Cefotaxime resistance levels were generally low, particularly in countries in northern Europe where no resistance was observed (Figure 17). In Slovakia, 2 out of the 10 isolates tested were resistant to cefotaxime.
Figure 16.
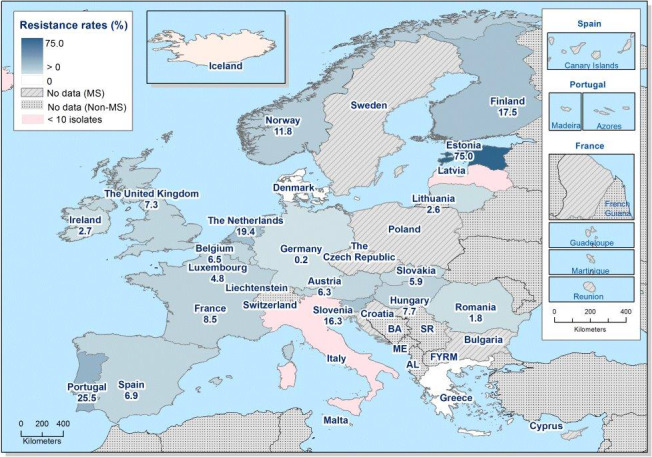
Spatial distribution of fluoroquinolone resistance among S. Typhimurium from human cases, EU/EEA MSs, 2016
Figure 17.
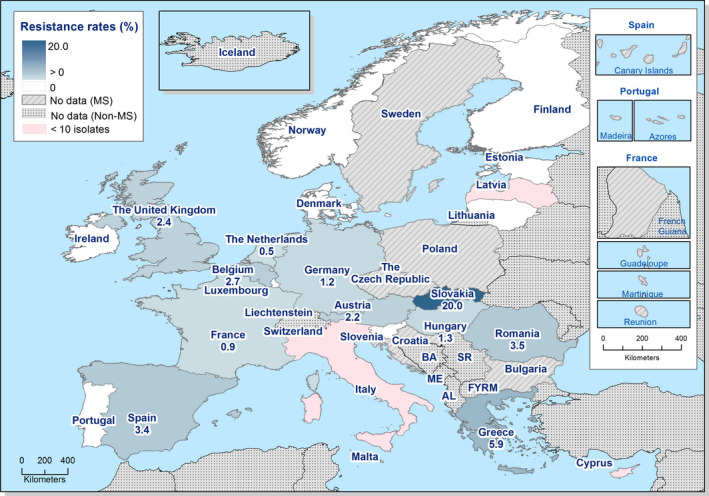
Spatial distribution of cefotaxime resistance among S. Typhimurium from human cases, EU/EEA MSs, 2016
Temporal trends in resistance among S. Typhimurium isolates from humans
Twenty MSs and Norway were included in the trend analysis for 2013–2016 as they had provided resistance data for a minimum of 3 years in this period and a minimum of 10 S. Typhimurium isolates (Figure 18). Statistically significant increases in (fluoro)quinolone resistance were observed in Estonia, Finland, Hungary, the Netherlands and Portugal while a decreasing trend was observed in Lithuania. Resistance to ampicillin increased significantly in Belgium, Lithuania, Slovakia and the United Kingdom while it decreased in Finland, Hungary, Luxembourg, Norway and Spain. Tetracycline resistance increased significantly in Belgium, Denmark and the United Kingdom, while it decreased in Finland, Germany, Hungary, the Netherlands and Spain. Cefotaxime resistance increased significantly in Austria.
Figure 18.
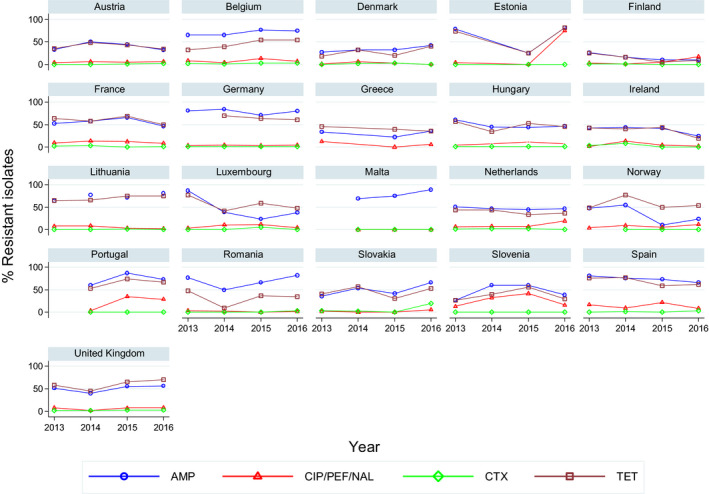
Trends in resistance to ampicillin, ciprofloxacin/pefloxacin, cefotaxime and tetracycline in Salmonella Typhimurium from humans in 21 reporting countries, 2013–2016
- Statistically significant increasing trends over 3–4 years, as tested by logistic regression (p ≤ 0.05), were observed for ciprofloxacin in Estonia, Finland, Hungary, the Netherlands and Portugal, for ampicillin in Belgium, Lithuania, Slovakia and the United Kingdom, for tetracyclines in Belgium, Denmark and the United Kingdom, and for cefotaxime in Austria, Statistically significant decreasing trends over 3–4 years were observed for ciprofloxacin in Lithuania, for ampicillin in Finland, Hungary, Luxembourg, Norway and Spain, and for tetracyclines in Finland, Germany, Hungary, the Netherlands and Spain. Only countries testing at least 10 isolates per year were included in the analysis.
Multidrug resistance in S. Typhimurium isolates from humans
In humans, 40.8% (13 MSs, N = 1,001) of the S. Typhimurium isolates were multiresistant (Table COMTYPHIHUM, Figure 19). This was a slight decrease compared to 2015 when 44.4% of isolates from 12 MSs were multiresistant. Extremely high MDR was reported in Estonia (81.9%) in 2016 and very high MDR in Portugal (67.3%) and Spain (56.9%). S. Typhimurium isolates resistant to 6, 7 or 8 antimicrobial classes were identified in 6 of 13 reporting MSs. ‘Microbiological’ and ‘clinical’ co‐resistance to ciprofloxacin and cefotaxime were reported in 0.6% of isolates, with the highest proportion in Spain (3.4%) (Table COMTYPHIHUM).
Figure 19.
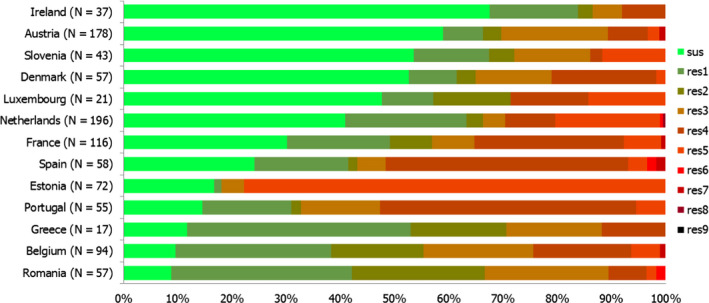
Frequency distribution of Salmonella Typhimurium isolates from humans completely susceptible or resistant to one to nine antimicrobial classes in 2016
- N: total number of isolates tested for susceptibility against the whole common antimicrobial set for Salmonella; sus: susceptible to all antimicrobial classes of the common set for Salmonella; res1–res9: resistance to one up to nine antimicrobial classes of the common set for Salmonella.
3.1.4. Antimicrobial resistance in Salmonella Infantis isolates from humans
Resistance levels in S. Infantis isolates from humans
S. Infantis was the fourth most common serovar in 2016 with 1,596 cases reported by the EU/EEA countries. The highest resistance levels were observed for sulfonamides (42.0%), nalidixic acid (35.3%) and tetracyclines (33.6%) (22 MSs, Table 13) but levels varied markedly between countries, particularly for sulfonamides and tetracycline. The proportion of isolates resistant to the two clinically most important antimicrobials was on average 23.4% for ciprofloxacin and 2.6% for cefotaxime, which was about twice as high compared with all Salmonella spp. (11.0% and 1.2%, respectively). Ciprofloxacin resistance levels were particularly high in Austria (76.5%) and Slovenia (72.7%), although the number of isolates tested in Slovenia was low. The highest resistance levels to cefotaxime (and ceftazidime) were observed in Malta (6.7%), the Netherlands (4.5%) and the United Kingdom (4.3%). Compared with 2014 and 2015, when an ESBL‐producing clone of S. Infantis was circulating in Italy, no isolate of S. Infantis was submitted to the national reference centre in Italy in 2016 (Ida Luzzi, Istituto Superiore di Sanità, personal communication, July 2017).
Table 13.
Antimicrobial resistance in Salmonella Infantis from humans per country in 2016
| Country | Gentamicin | Chloramphenicol | Ampicillin | Cefotaxime | Ceftazidime | Meropenem | Tigecycline | |||||||
|---|---|---|---|---|---|---|---|---|---|---|---|---|---|---|
| N | % Res | N | % Res | N | % Res | N | % Res | N | % Res | N | % Res | N | % Res | |
| Austria | 68 | 4.4 | 68 | 8.8 | 68 | 7.4 | 68 | 2.9 | 68 | 2.9 | 68 | 0 | 68 | 0 |
| Belgium | 61 | 3.3 | 61 | 3.3 | 61 | 9.8 | 61 | 3.3 | 61 | 1.6 | 61 | 0 | – | – |
| Cyprus | 2 | NA | – | – | 2 | NA | – | – | 2 | NA | 2 | NA | – | – |
| Denmark | 8 | NA | 8 | NA | 8 | NA | 8 | NA | 8 | NA | 8 | NA | 8 | NA |
| Estonia | 30 | 0 | 30 | 0 | 30 | 0 | 29 | 0 | 30 | 0 | 29 | 0 | – | – |
| Finland | 2 | NA | 2 | NA | 2 | NA | 2 | NA | – | – | 2 | NA | – | – |
| France | 27 | 0 | 27 | 0 | 27 | 3.7 | 27 | 0 | 27 | 0 | 27 | 0 | 27 | 0 |
| Germanya | 144 | 1.4 | 144 | 11.1 | 144 | 35.4 | 144 | 2.1 | 144 | 0 | 144 | 0 | – | – |
| Greece | 4 | NA | 4 | NA | 4 | NA | 4 | NA | 4 | NA | 4 | NA | – | – |
| Hungary | 5 | NA | 5 | NA | 5 | NA | 5 | NA | 5 | NA | 5 | NA | – | – |
| Ireland | 6 | NA | 6 | NA | 6 | NA | 6 | NA | 6 | NA | 6 | NA | 6 | NA |
| Latviaa | – | – | – | – | 1 | NA | 1 | NA | – | – | – | – | – | – |
| Lithuaniaa | 12 | 0 | 13 | 0 | 17 | 5.9 | 13 | 0 | 13 | 0 | 12 | 0 | – | – |
| Luxembourg | 2 | NA | 2 | NA | 2 | NA | 2 | NA | 2 | NA | 2 | NA | – | – |
| Maltaa | – | – | – | – | 15 | 6.7 | 15 | 6.7 | 15 | 6.7 | 15 | 0 | – | – |
| Netherlands | 22 | 4.5 | 22 | 4.5 | 22 | 9.1 | 22 | 4.5 | 22 | 4.5 | 22 | 0 | 22 | 13.6 |
| Portugal | 2 | NA | 2 | NA | 2 | NA | 2 | NA | 2 | NA | 2 | NA | 2 | NA |
| Romania | 8 | NA | 8 | NA | 8 | NA | 8 | NA | 8 | NA | 8 | NA | – | – |
| Slovakiaa | – | – | – | – | 11 | 18.2 | 2 | NA | – | – | – | – | – | – |
| Slovenia | 11 | 0 | 11 | 0 | 11 | 9.1 | 11 | 0 | 11 | 0 | 11 | 0a | – | – |
| Spain | 11 | 0 | 11 | 0 | 11 | 9.1 | 11 | 0 | 11 | 0 | 11 | 0 | – | – |
| United Kingdoma | – | – | 33 | 12.1 | 63 | 15.9 | 23 | 4.3 | 12 | 0.0 | 18 | 0 | – | – |
| Total (MSs 22) | 425 | 2.1 | 457 | 6.8 | 520 | 16.9 | 464 | 2.6 | 451 | 1.3 | 457 | 0 | 133 | 2.3 |
| Norway | 4 | NA | – | – | 4 | NA | 4 | NA | 4 | NA | 4 | NA | – | – |
| Country | Nalidixic acid | Ciprofloxacinb | Azithromycin | Colistin | Sulfamethoxazolec | Trimethoprim | Co‐trimoxazole | Tetracycline | ||||||||
|---|---|---|---|---|---|---|---|---|---|---|---|---|---|---|---|---|
| N | % Res | N | % Res | N | % Res | N | % Res | N | % Res | N | % Res | N | % Res | N | % Res | |
| Austria | 68 | 72.1 | 51 | 76.5 | – | – | – | – | 68 | 69.1 | 68 | 2.9 | – | – | 68 | 69.1 |
| Belgium | 61 | 27.9 | 61 | 29.5 | 61 | 0 | – | – | 61 | 41 | 25 | 40 | – | – | 61 | 37.7 |
| Cyprus | – | – | – | – | – | – | 2 | NA | – | – | – | – | – | – | – | – |
| Denmark | 8 | NA | 8 | NA | 8 | NA | 8 | NA | 8 | NA | 8 | NA | – | – | 8 | NA |
| Estonia | 7 | NA | 30 | 10.0 | – | – | 30 | 0 | 30 | 3.3 | 30 | 6.7 | – | – | 30 | 6.7 |
| Finland | 2 | NA | 2 | NA | – | – | – | – | – | – | 2 | NA | – | – | 2 | NA |
| France | 27 | 11.1 | 27 | 11.1 | 27 | 0 | 27 | 0 | 27 | 22.2 | 27 | 0 | – | – | 27 | 3.7 |
| Germanya | 144 | 29.2 | 144 | 1.4 | – | – | – | – | – | – | – | – | 144 | 11.1 | 143 | 25.2 |
| Greece | 4 | NA | 4 | NA | – | – | – | – | 4 | NA | 4 | NA | – | – | 4 | NA |
| Hungary | – | – | 5 | NA | – | – | – | – | – | – | 5 | NA | 5 | NA | 5 | NA |
| Ireland | 6 | NA | 6 | NA | 6 | NA | 3 | NA | 6 | NA | 6 | NA | – | – | 6 | NA |
| Latviaa | – | – | 1 | NA | – | – | – | – | – | – | – | – | – | – | – | – |
| Lithuaniaa | 13 | 30.8 | 17 | 29.4 | – | – | – | – | – | – | 13 | 7.7 | 17 | 5.9 | 13 | 0 |
| Luxembourg | – | – | 2 | NA | – | – | – | – | 2 | NA | 2 | NA | 2 | NA | 2 | NA |
| Maltaa | – | – | 15 | 0 | – | – | – | – | – | – | – | – | – | – | – | – |
| Netherlands | 22 | 27.3 | 22 | 27.3 | 22 | 0 | 22 | 0 | 22 | 22.7 | 22 | 18.2 | – | – | 22 | 22.7 |
| Portugal | 2 | NA | 2 | NA | 2 | NA | – | – | 2 | NA | 2 | NA | – | – | 2 | NA |
| Romania | 8 | NA | 8 | NA | – | – | – | – | 8 | NA | 8 | NA | 8 | NA | 8 | NA |
| Slovakiaa | – | – | 3 | NA | – | – | – | – | – | – | – | – | 4 | NA | 8 | NA |
| Slovenia | – | – | 11 | 72.7 | – | – | – | – | 11 | 81.8 | 11 | 9.1 | 11 | 9.1 | 11 | 72.7 |
| Spain | 11 | 18.2 | 11 | 18.2 | – | – | – | – | 11 | 27.3 | 11 | 0 | – | – | 11 | 18.2 |
| United Kingdoma | 16 | 43.8 | 69 | 29.0 | – | – | – | – | 9 | NA | 27 | 11.1 | 19 | 31.6 | 9 | NA |
| Total (MSs 22) | 399 | 35.3 | 499 | 23.4 | 126 | 0 | 92 | 0 | 269 | 42.0 | 271 | 11.4 | 210 | 13.3 | 440 | 33.6 |
| Norway | – | – | 4 | NA | – | – | – | – | – | – | – | – | 4 | NA | – | – |
N: number of isolates tested; % Res: percentage of microbiologically resistant isolates [either interpreted as non‐wild type by ECOFFs or clinically non‐susceptible by combining resistant and intermediate categories]; –: no data reported; NA: not applicable – if fewer than 10 isolates were tested, the percentage of resistance was not calculated; MS: Member State.
Provided measured values. Data interpreted by ECDC.
Ciprofloxacin has in several countries been replaced by pefloxacin for screening of fluoroquinolone resistance with disc diffusion, as recommended by EUCAST.
Combined data on the class of sulfonamides and the substance sulfamethoxazole within this group.
Spatial distribution of resistance among S. Infantis isolates from humans
Ciprofloxacin resistance in S. Infantis isolates from human cases was the highest in two countries in central Europe, Austria and Slovenia (Figure 20). Cefotaxime resistance in S. Infantis was mainly reported from countries in north‐western Europe though the highest level was observed in Malta (where one S. Infantis isolate among 15 tested was an ESBL‐producer) (Figure 21). Please note that 11 countries reported fewer than 10 isolates of S. Infantis and the proportion of resistant isolates to ciprofloxacin and cefotaxime was therefore not calculated.
Figure 20.
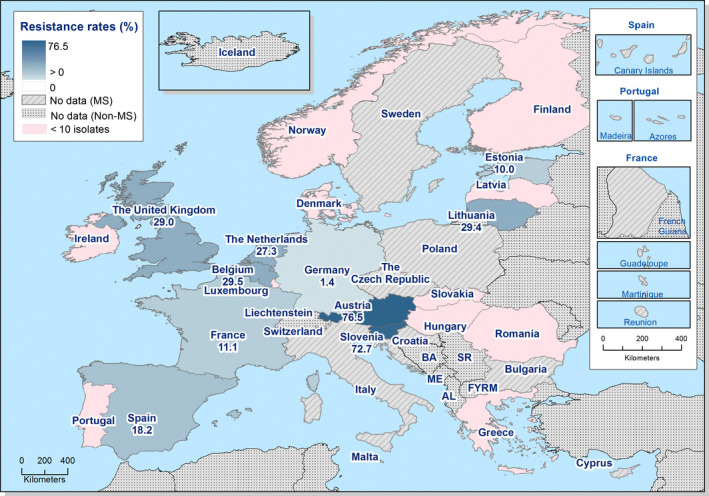
Spatial distribution of ciprofloxacin resistance among S. Infantis from human cases, EU/EEA MSs, 2016
Figure 21.
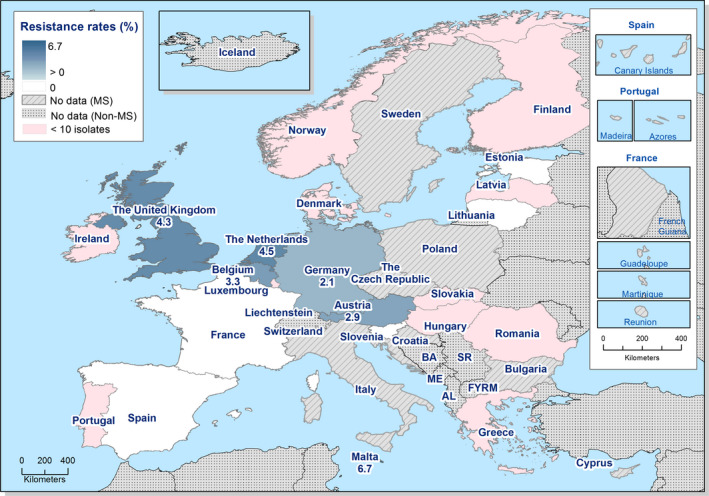
Spatial distribution of cefotaxime resistance among S. Infantis from human cases, EU/EEA MSs, 2016
Temporal trends in resistance among S. Infantis isolates from humans
Ten MSs were included in the trend analysis for 2013–2016 as they had provided resistance data for a minimum of 3 years in this period and a minimum of 10 S. Infantis isolates (Figure 22). A statistically significant increase in (fluoro)quinolone resistance was observed in Germany, while a decreasing trend was observed in Slovakia. Resistance to ampicillin increased significantly in Germany and resistance to tetracycline in the Netherlands. Cefotaxime resistance decreased significantly in Belgium.
Figure 22.
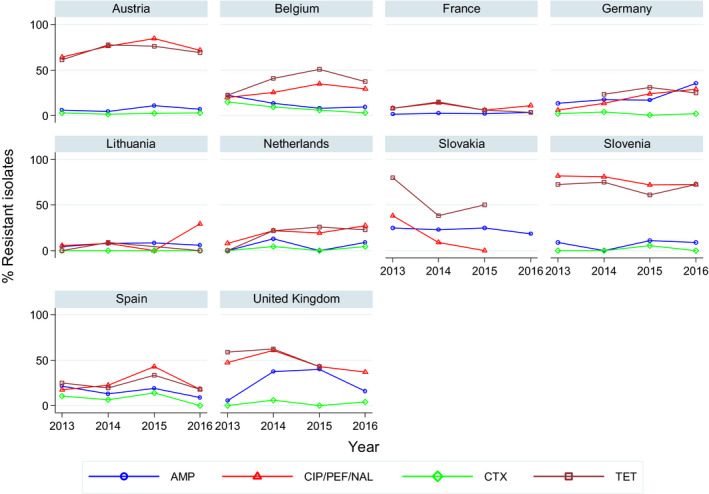
Trends in resistance to ampicillin, ciprofloxacin/pefloxacin/nalidixic acid, cefotaxime and tetracycline in Salmonella Infantis from humans in 10 reporting countries, 2013–2016
- Statistically significant increasing trends over 3–4 years, as tested by logistic regression (p ≤ 0.05), were observed for ciprofloxacin in Germany, for ampicillin in Germany and for tetracyclines in the Netherlands. Statistically significant decreasing trends over 3–4 years were observed for ampicillin in Slovakia and for cefotaxime in Belgium. Only countries testing at least 10 isolates per year were included in the analysis.
Multidrug resistance in S. Infantis isolates from humans
Multidrug resistance was detected in 39.4% (7 MSs, N = 193) of S. Infantis isolates from humans with the highest proportions in Austria (69.1%) and Slovenia (63.6%) (Figure 23, Table COMINFANHUM). ‘Microbiological’ and ‘clinical’ co‐resistance to ciprofloxacin and cefotaxime were reported in 2.1% of isolates with the highest proportion in Belgium (8.0%) and the Netherlands (4.5%).
Figure 23.
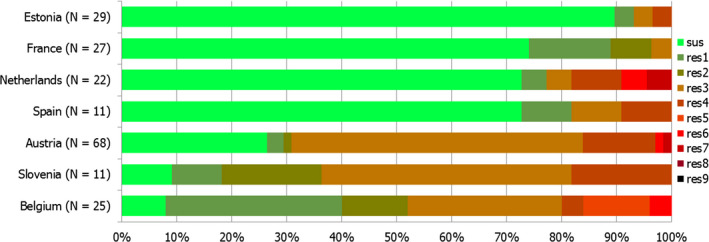
Frequency distribution of Salmonella Infantis isolates from humans completely susceptible or resistant to one to nine antimicrobial classes in 2016
- N: total number of isolates tested for susceptibility against the whole common antimicrobial set for Salmonella; sus: susceptible to all antimicrobial classes of the common set for Salmonella; res1–res9: resistance to one up to nine antimicrobial classes of the common set for Salmonella.
3.1.5. Antimicrobial resistance in Salmonella Kentucky isolates from humans
Resistance levels in S. Kentucky isolates from humans
S. Kentucky was the seventh most common serovar in 2016 with 531 cases reported by the EU/EEA countries. Very high to extremely high proportions of S. Kentucky isolates were resistant to gentamicin (44.7%), sulfonamides (68.7%), ampicillin (71.0%), tetracyclines (71.6%), ciprofloxacin (85.8%) and nalidixic acid (87.3%). This result is consistent with the dissemination of the ciprofloxacin‐resistant S. Kentucky ST198 strain in Europe, and elsewhere, since 2010 (Le Hello et al., 2013). Cefotaxime and ceftazidime resistance levels were also markedly higher (15.5% and 17.1%, respectively) than in other serovars and ESBL‐producing S. Kentucky were reported in four MSs (see further Chapter 3.5 ESBL‐, AmpC‐ and/or carbapenemase‐producing Salmonella and E. coli) (Table 14).
Table 14.
Antimicrobial resistance in Salmonella Kentucky from humans per country in 2016
| Country | Gentamicin | Chloramphenicol | Ampicillin | Cefotaxime | Ceftazidime | Meropenem | Tigecycline | |||||||
|---|---|---|---|---|---|---|---|---|---|---|---|---|---|---|
| N | % Res | N | % Res | N | % Res | N | % Res | N | % Res | N | % Res | N | % Res | |
| Austria | 10 | 30.0 | 10 | 40.0 | 10 | 80.0 | 10 | 0 | 10 | 0 | 10 | 0 | 10 | 0 |
| Belgium | 28 | 46.4 | 28 | 10.7 | 28 | 64.3 | 28 | 3.6 | 28 | 3.6 | 28 | 0 | – | – |
| Cyprus | 1 | NA | – | – | 1 | NA | – | – | 1 | NA | 1 | NA | – | – |
| Denmark | 1 | NA | 1 | NA | 1 | NA | 1 | NA | 1 | NA | 1 | NA | 1 | NA |
| Finland | 1 | NA | 1 | NA | 1 | NA | 1 | NA | – | – | 1 | NA | – | – |
| France | 10 | 50.0 | 10 | 0 | 10 | 60.0 | 10 | 10.0 | 10 | 0 | 10 | 0 | 10 | 0 |
| Germanya | 37 | 54.1 | 38 | 5.3 | 38 | 71.1 | 38 | 7.9 | 38 | 7.9 | 38 | 0 | – | – |
| Greece | 1 | NA | 1 | NA | 1 | NA | 1 | NA | 1 | NA | 1 | NA | – | – |
| Ireland | 4 | NA | 4 | NA | 4 | NA | 4 | NA | 4 | NA | 4 | NA | 4 | NA |
| Luxembourg | 3 | NA | 3 | NA | 3 | NA | 3 | NA | 3 | NA | 3 | NA | – | – |
| Maltaa | – | – | – | – | 20 | 95.0 | 20 | 65.0 | 20 | 65.0 | 20 | 0 | – | – |
| Netherlands | 26 | 53.8 | 26 | 0 | 26 | 65.4 | 26 | 30.8 | 26 | 30.8 | 26 | 0 | 26 | 3.8 |
| Slovenia | 1 | NA | 1 | NA | 1 | NA | 1 | NA | 1 | NA | 1 | NA | – | – |
| Spain | 9 | NA | 9 | NA | 9 | NA | 9 | NA | 9 | NA | 9 | NA | – | – |
| United Kingdoma | – | – | 22 | 0.0 | 33 | 72.7 | 16 | 0 | 6 | NA | 8 | NA | – | – |
| Total (MSs 16) | 132 | 44.7 | 154 | 6.5 | 186 | 71.0 | 168 | 15.5 | 158 | 17.1 | 161 | 0 | 51 | 2.0 |
| Icelanda | – | – | 1 | NA | 1 | NA | – | – | – | – | – | – | – | – |
| Norway | 3 | NA | 1 | NA | 3 | NA | 3 | NA | 3 | NA | 3 | NA | – | – |
| Country | Nalidixic acid | Ciprofloxacinb | Azithromycin | Colistin | Sulfamethoxazolec | Trimethoprim | Co‐trimoxazole | Tetracycline | ||||||||
|---|---|---|---|---|---|---|---|---|---|---|---|---|---|---|---|---|
| N | % Res | N | % Res | N | % Res | N | % Res | N | % Res | N | % Res | N | % Res | N | % Res | |
| Austria | 10 | 90.0 | 7 | NA | – | – | – | – | 10 | 70.0 | 10 | 20.0 | – | – | 10 | 70.0 |
| Belgium | 28 | 89.3 | 28 | 89.3 | 28 | 0 | – | – | 28 | 60.7 | 13 | 7.7 | – | – | 28 | 75.0 |
| Cyprus | – | – | – | – | – | – | 1 | NA | – | – | – | – | – | – | – | – |
| Denmark | 1 | NA | 1 | NA | 1 | NA | 1 | NA | 1 | NA | 1 | NA | – | – | 1 | NA |
| Finland | 1 | NA | 1 | NA | – | – | – | – | – | – | 1 | NA | – | – | 1 | NA |
| France | 10 | 90.0 | 10 | 90.0 | 10 | 0 | 10 | 0 | 10 | 90.0 | 10 | 10.0 | – | – | 10 | 80.0 |
| Germanya | 38 | 86.8 | 38 | 78.9 | – | – | – | – | – | – | – | – | 38 | 5.3 | 38 | 68.4 |
| Greece | 1 | NA | 1 | NA | – | – | – | – | 1 | NA | 1 | NA | – | – | 1 | NA |
| Ireland | 4 | NA | 4 | NA | 4 | NA | 1 | NA | 4 | NA | 4 | NA | – | – | 4 | NA |
| Luxembourg | – | – | 3 | NA | – | – | – | – | 3 | NA | 3 | NA | 3 | NA | 3 | NA |
| Maltaa | – | – | 20 | 95.0 | – | – | – | – | – | – | – | – | – | – | – | – |
| Netherlands | 26 | 92.3 | 26 | 92.3 | 26 | 3.8 | 26 | 0 | 26 | 73.1 | 26 | 11.5 | – | – | 26 | 69.2 |
| Slovenia | – | – | 1 | NA | – | – | – | – | 1 | NA | 1 | NA | 1 | NA | 1 | NA |
| Spain | 9 | NA | 9 | NA | – | – | – | – | 9 | NA | 9 | NA | – | – | 9 | NA |
| United Kingdoma | 14 | 85.7 | 34 | 79.4 | – | – | – | – | 6 | NA | 17 | 5.9 | 8 | NA | 9 | NA |
| Total (MSs 16) | 142 | 87.3 | 183 | 85.8 | 69 | 1.4 | 39 | 0 | 99 | 68.7 | 96 | 8.3 | 50 | 6.0 | 141 | 71.6 |
| Icelanda | – | – | 1 | NA | – | – | – | – | – | – | – | – | 1 | NA | – | – |
| Norway | – | – | 3 | NA | 1 | NA | – | – | – | – | – | – | 3 | NA | 1 | NA |
N: number of isolates tested; % Res: percentage of microbiologically resistant isolates [either interpreted as non‐wild type by ECOFFs or clinically non‐susceptible by combining resistant and intermediate categories]; –: no data reported; NA: not applicable – if fewer than 10 isolates were tested, the percentage of resistance was not calculated; MS: Member State.
Provided measured values. Data interpreted by ECDC.
Ciprofloxacin has in several countries been replaced by pefloxacin for screening of fluoroquinolone resistance with disc diffusion, as recommended by EUCAST.
Combined data on the class of sulfonamides and the substance sulfamethoxazole within this group.
Spatial distribution of resistance among S. Kentucky isolates from humans
Ciprofloxacin resistance in S. Kentucky isolates from human cases was extremely high in all countries reporting data on at least 10 isolates, ranging from 78.9% in Germany to 95.0% in Malta (Figure 24). No geographical pattern was observed for cefotaxime resistance, which was the highest in Malta and the Netherlands (Figure 25).
Figure 24.
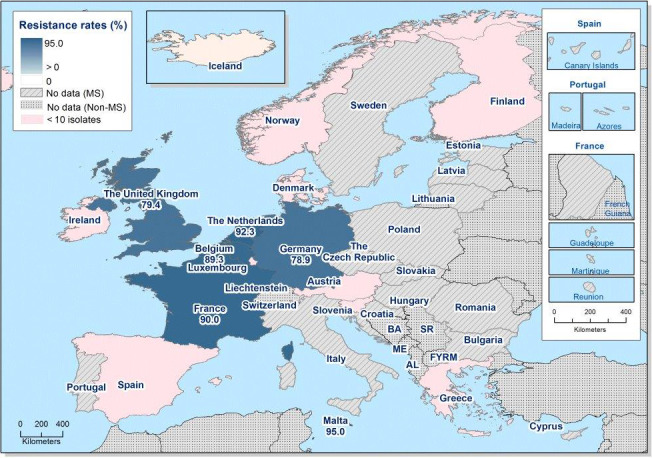
Spatial distribution of ciprofloxacin resistance among S. Kentucky from human cases, EU/EEA MSs, 2016
Figure 25.
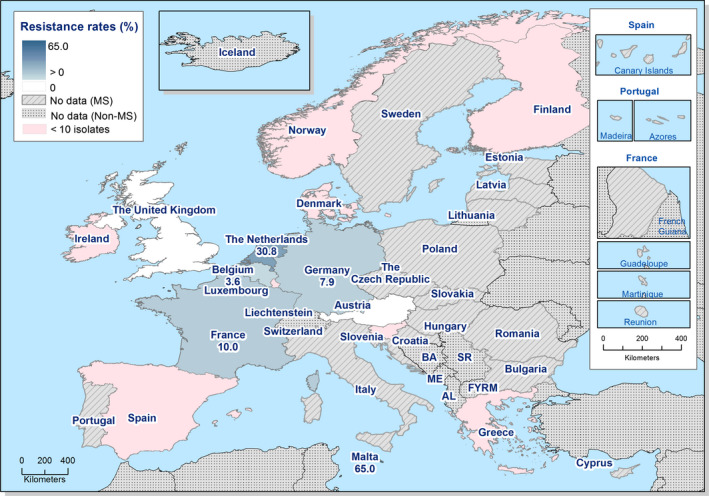
Spatial distribution of cefotaxime resistance among S. Kentucky from human cases, EU/EEA MSs, 2016
Temporal trends in resistance among S. Kentucky isolates from humans
Six MSs were included in the trend analysis for 2013–2016 as they had provided resistance data for a minimum of 3 years in this period and a minimum of 10 S. Kentucky isolates (Figure 26). Statistically significant increases in (fluoro)quinolone resistance were observed in Germany and Malta and in ampicillin in Malta. No increasing or decreasing trends were observed in resistance to tetracycline and cefotaxime.
Figure 26.
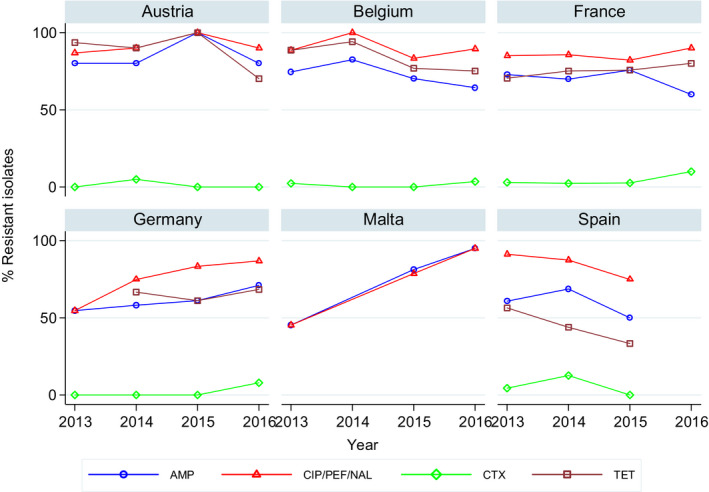
Trends in resistance to ampicillin, ciprofloxacin/pefloxacin, cefotaxime and tetracycline in Salmonella Kentucky from humans in six reporting countries, 2013–2016
- Statistically significant increasing trends over 3–4 years, as tested by logistic regression (p ≤ 0.05), were observed for ciprofloxacin in Germany and Malta and for ampicillin in Malta. Only countries testing at least 10 isolates per year were included in the analysis.
Multidrug resistance in S. Kentucky isolates from humans
Multidrug resistance was very high (76.3%, N = 59) (Figure 27, Table COMKENTHUM) in the four MSs that reported data on at least 10 S. Kentucky isolates. Almost half (45.8%) of the isolates exhibited pentaresistance and 17% of these also hexaresistance. Eight isolates from the Netherlands expressed both ‘microbiological’ and ‘clinical’ co‐resistance to ciprofloxacin and cefotaxime and one isolate from France expressed ‘microbiological’ co‐resistance.
Figure 27.
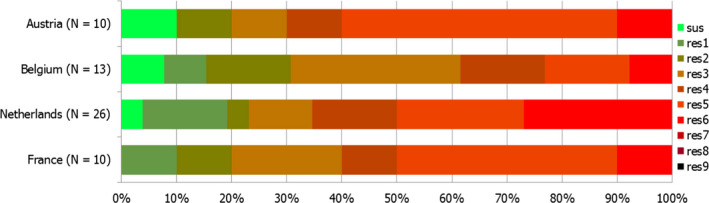
Frequency distribution of Salmonella Kentucky isolates from humans completely susceptible or resistant to one to nine antimicrobial classes in 2016
- N: total number of isolates tested for susceptibility against the whole common antimicrobial set for Salmonella; sus: susceptible to all antimicrobial classes of the common set for Salmonella; res1–res9: resistance to one up to nine antimicrobial classes of the common set for Salmonella.
3.2. Antimicrobial resistance in Salmonella spp. from animals and food
Based on the legislative requirements, the active monitoring of AMR in Salmonella spp. isolates from broilers and laying hens of Gallus gallus, fattening turkeys and from their meat was mandatory in 2016. Salmonella spp. isolates from Gallus gallus and turkeys were primarily obtained from faecal samples and/or environmental samples (boot swabs or dust) collected on farms, as part of Salmonella National Control Programmes (NCPs) carried out according to the EU legislation. Clinical investigations and follow‐up sampling of flocks tested positive for Salmonella were excluded from the analyses. Salmonella isolates from meat were obtained from randomly collected neck skin samples collected under either official sampling or hazard analysis and critical point control (HACCP) and own‐check programmes at slaughterhouses.
Salmonella spp. includes results for all Salmonella serovars reported for different animal populations and food. As the potential for acquiring AMR markedly varies between serovars, the relative contribution of different serovars may significantly influence the general level of resistance presented for Salmonella spp. Trends in the dissemination of specific clones or resistance traits should ideally be considered individually for the different serovars and results are presented for selected serovars of clinical importance.
3.2.1. Antimicrobial resistance in Salmonella spp. in meat from broilers
Resistance levels in Salmonella spp. from broiler meat
In 2016, 19 MSs and 1 non MS reported data on isolates of Salmonella spp. from carcases of broilers according to Decision 2013/652/EU (Table 15). Most MSs recorded high to very high resistance to ciprofloxacin, nalidixic acid, sulfamethoxazole and tetracycline for which overall resistance equalled 64.7%, 61.5%, 55.6% and 46.1%, respectively. Overall resistance to ampicillin and trimethoprim was moderate at 19.7% and 14.8%, respectively. Overall resistance to gentamicin (2.4%) remained at low level, although a high level (40%) of resistance was registered in one MS. Resistance was not detected or low levels of resistance to chloramphenicol were reported by most MSs (1–3.7%); however, one MS registered a moderate level of resistance (11.1%) and two MSs reported high levels of resistance (20–39.4%). Resistance to cefotaxime and ceftazidime was reported only by three MSs at low levels, with the exception of one MS for which a high level of resistance was registered for both substances. Resistance to tigecycline was recorded at moderate level in two MSs, at low levels in four MSs and not detected in all the others reporting countries. Overall resistance to colistin was very low (1.4%), although four MSs reported low levels of resistance and one MS registered a moderate level of resistance (16.7%). Resistance was not detected or low levels of resistance to azithromycin were reported by most MSs. Meropenem resistance was not recorded in any of the reporting countries.
Table 15.
Occurrence of resistance (%) to selected antimicrobials in Salmonella spp. from meat from broilers, using harmonised ECOFFs, 19 EU MSs, 2016
| Country | N | GEN | CHL | AMP | CTX | CAZ | MEM | TGC | NAL | CIP | AZM | COL | SMX | TMP | TET |
|---|---|---|---|---|---|---|---|---|---|---|---|---|---|---|---|
| Austria | 36 | 0 | 0 | 0 | 0 | 0 | 0 | 0 | 47.2 | 47.2 | 0 | 0 | 41.7 | 0 | 41.7 |
| Belgium | 175 | 1.1 | 1.7 | 22.9 | 3.4 | 1.7 | 0 | 2.3 | 54.3 | 56 | 8 | 1.7 | 57.1 | 27.4 | 17.1 |
| Croatia | 56 | 0 | 0 | 1.8 | 0 | 0 | 0 | 0 | 98.2 | 98.2 | 0 | 0 | 33.9 | 0 | 32.1 |
| Cyprus | 16 | 0 | 0 | 0 | 0 | 0 | 0 | 12.5 | 81.3 | 81.3 | 0 | 0 | 75 | 75 | 81.3 |
| Czech Republic | 34 | 0 | 0 | 26.5 | 0 | 0 | 0 | 0 | 47.1 | 47.1 | 0 | 2.9 | 38.2 | 0 | 38.2 |
| Denmarka | 1 | 0 | 0 | 0 | 0 | 0 | 0 | 0 | 0 | 0 | 0 | 0 | 0 | 0 | 0 |
| Germany | 18 | 0 | 11.1 | 44.4 | 0 | 0 | 0 | 5.6 | 61.1 | 61.1 | 0 | 16.7 | 50 | 50 | 44.4 |
| Greecea | 2 | 0 | 0 | 0 | 0 | 0 | 0 | 0 | 50 | 100 | 0 | 0 | 0 | 0 | 0 |
| Hungary | 76 | 1.3 | 0 | 5.3 | 0 | 1.3 | 0 | 7.9 | 82.9 | 82.9 | 0 | 0 | 76.3 | 0 | 76.3 |
| Irelanda | 1 | 0 | 0 | 0 | 0 | 0 | 0 | 0 | 0 | 0 | 0 | 0 | 0 | 0 | 0 |
| Malta | 10 | 40 | 20 | 60 | 0 | 0 | 0 | 0 | 70 | 70 | 0 | 0 | 90 | 10 | 80 |
| Netherlands | 25 | 4 | 0 | 16 | 4 | 4 | 0 | 4 | 80 | 80 | 0 | 0 | 84 | 68 | 68 |
| Poland | 33 | 3 | 0 | 27.3 | 0 | 0 | 0 | 0 | 51.5 | 69.7 | 0 | 0 | 45.5 | 0 | 42.4 |
| Portugal | 33 | 0 | 39.4 | 66.7 | 39.4 | 39.4 | 0 | 0 | 0 | 36.4 | 3 | 0 | 63.6 | 39.4 | 66.7 |
| Romania | 82 | 8.5 | 3.7 | 24.4 | 0 | 0 | 0 | 0 | 59.8 | 61 | 0 | 0 | 67.1 | 9.8 | 67.1 |
| Slovakia | 83 | 0 | 0 | 26.5 | 0 | 0 | 0 | 1.2 | 66.3 | 69.9 | 0 | 1.2 | 53 | 1.2 | 51.8 |
| Slovenia | 17 | 0 | 0 | 17.6 | 0 | 0 | 0 | 0 | 100 | 94.1 | 0 | 0 | 100 | 0 | 100 |
| Spain | 48 | 4.2 | 0 | 4.2 | 0 | 0 | 0 | 16.7 | 68.8 | 68.8 | 0 | 6.3 | 29.2 | 4.2 | 41.7 |
| United Kingdom | 17 | 0 | 0 | 0 | 0 | 0 | 0 | 0 | 0 | 0 | 0 | 0 | 11.8 | 11.8 | 5.9 |
| Total (19 MSs) | 763 | 2.4 | 3 | 19.7 | 2.6 | 2.4 | 0 | 3 | 61.5 | 64.7 | 2 | 1.4 | 55.6 | 14.8 | 46.1 |
| Icelanda | 1 | 0 | 0 | 0 | 0 | 0 | 0 | 0 | 0 | 0 | 0 | 0 | 0 | 0 | 0 |
ECOFFs: epidemiological cut‐off values; EUCAST: European Committee on Antimicrobial Susceptibility Testing; N: number of isolates tested; MSs: Member States; GEN: gentamicin; CHL: chloramphenicol; AMP: ampicillin; CTX: cefotaxime; CAZ: Ceftazidime; MEM: meropenem; TGC: tigecycline; NAL: nalidixic acid; CIP: ciprofloxacin; AZM: azithromycin; COL: colistin; SMX: sulfamethoxazole; TMP: trimethoprim; TET: tetracycline.
The occurrence of resistance is assessed on less than 10 isolates and should only be considered as part of the total of MSs data.
Combined resistance to cefotaxime and ciprofloxacin in Salmonella spp. from broiler meat
‘Microbiological’ combined resistance to ciprofloxacin and cefotaxime in Salmonella spp. isolates from broilers was observed at a rate of 2.2%, corresponding to 17 isolates from 3 of the 20 reporting countries. ‘Microbiological’ combined resistance picked up to 33.3% in the isolates tested in Portugal (Table COMPSALMBRMEAT). ‘Clinical’ combined resistance to both ciprofloxacin and cefotaxime was very rare, and only detected in two Salmonella spp. isolates in Belgium.
Multidrug resistance in Salmonella spp. isolates from broiler meat
Twenty countries reported data on 764 individual isolates, which were addressed in the MDR analysis. The overall rate of MDR equalled 50.3% and among reporting MSs, the proportion of multiresistant isolates ranged between none and 100%. The rate of complete susceptibility equalled 27.1% at the overall level and the proportion of completely susceptible isolates varied from none to 100% (Figure 28).
Figure 28.
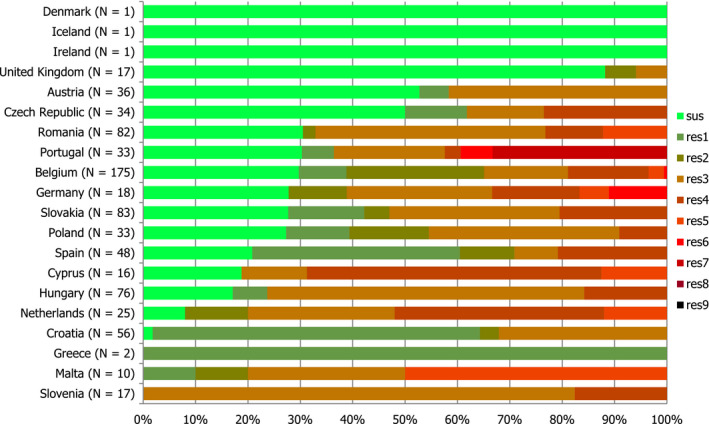
Frequency distribution of completely susceptible isolates and resistant isolates to one to nine antimicrobial classes in Salmonella spp. from broiler meat, EU MSs, 2016
- N: total number of isolates tested for susceptibility against the whole common antimicrobial set for Salmonella; sus: susceptible to all antimicrobial classes of the common set for Salmonella; res1–res9: resistance to one antimicrobial classes/resistance to nine antimicrobial classes of the common set for Salmonella.
Spatial distribution of complete susceptibility in Salmonella spp. from broiler meat
The susceptibility to each individual antimicrobial was determined using ECOFFs; all isolates were tested against the same mandatory panel of antimicrobials. The overall rate of complete susceptibility in Salmonella spp. isolates from broiler meat in reporting countries (N = 764) equalled 27.1%. The spatial distribution of complete susceptibility to the panel of antimicrobial substances tested in Salmonella spp. isolates from broiler meat in 2016 is shown in Figure 29. Among the reporting countries, marked variations were observed in the rates of completely susceptible isolates, which ranged from none in Malta and Slovenia, 1.8% and 8.0% in Croatia and the Netherlands, up to 88.2% in the United Kingdom. The highest levels of complete susceptibility were shown by isolates from the United Kingdom, Austria and the Czech Republic.
Figure 29.
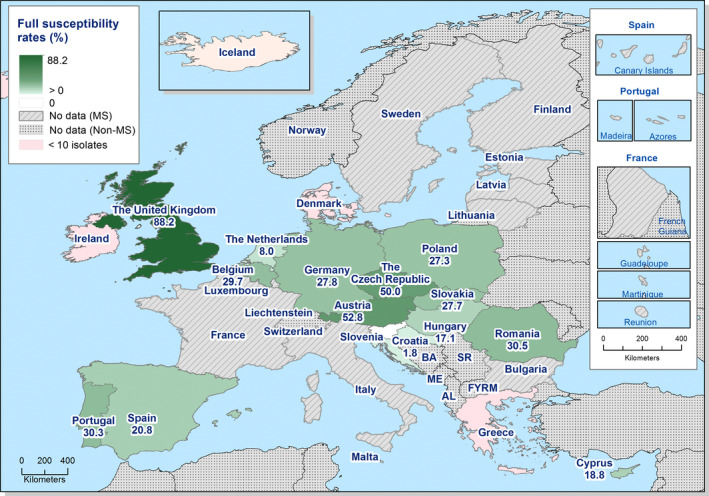
Spatial distribution of complete susceptibility to the panel of antimicrobials tested among Salmonella spp. from broiler meat, using harmonised ECOFFs, 20 EU/EEA MSs, 2016
Resistance levels in certain Salmonella serovars from broiler meat
Among the isolates for which serovar information was provided (N = 752), the most common serovars detected in carcases of broilers (Table SERBRMEATD) were S. Infantis (14 MSs, 54.7%), S. Enteritidis (6 MSs, 9.4%), S. Kentucky (6 MSs, 4.5%), S. Give (1 MS, 3.6%) and S. Typhimurium (9 MSs, 3.2%). Resistance and MDR levels in S. Enteritidis (overall 1.4%) (Table COMENTERBRMEAT) were much lower than those recorded in S. Infantis (72.6%) (Table COMINFANBRMEAT), S. Kentucky (45.5%) (Table COMKENBRMEAT) and Salmonella spp. (50.3%) (Table COMPSALMBRMEAT).
In S. Infantis isolates from carcases of broilers (14 MSs, N = 411), resistance to meropenem, was not detected while resistance to azithromycin, cefotaxime, ceftazidime, chloramphenicol, colistin, and gentamicin was detected by one MS for each antimicrobials; overall resistance to ampicillin and trimethoprim was observed at moderate levels, whereas the overall resistance to tigecycline was at low level. Resistance to sulfamethoxazole and tetracycline ranged from high to extremely high (33.3–100%), with high overall resistance (80.0% and 69.3%, respectively). Resistance to ciprofloxacin and nalidixic acid was recorded by all MSs at high to extremely high levels with the overall resistance at extremely high (90%) (Table INFANBRMEATD). It has been shown that 8.3% of S . Infantis isolates were susceptible to all 11 antimicrobials included in the MDR analysis (0–100%) and the overall multiresistance was 72.6% (Table COMINFANBRMEAT). Overall high resistance to ciprofloxacin and nalidixic acid (40.8% and 38.0%, respectively, was observed in S. Enteritidis isolates from carcases of broilers (N = 71, 6 MSs) (Table ENTERBRMEATD). In contrast with S. Infantis, a high proportion of isolates (54.9%) were susceptible to all 11 antimicrobials included in the MDR analysis and only one isolate was multiresistant (Table COMENTERBRMEAT).
Out of 34 isolates of S. Kentucky tested, resistance to azithromycin, cefotaxime, ceftazidime, chloramphenicol, colistin, and meropenem was not detected (Table KENTUBRMEATD). Resistance to ciprofloxacin and nalidixic acid was either not detected (2 MSs, N = 88) or detected to all isolates tested (4 MSs, N = 25) with the overall resistance at 76.5%. It has been shown that 24.3% of S . Kentucky isolates were susceptible to all 11 antimicrobials included in the MDR analysis (0–100%) (Table COMKENBRMEAT).
3.2.2. Antimicrobial resistance in Salmonella spp. in meat from turkeys
Resistance levels in Salmonella spp. from turkey meat
In 2016, 8 MSs reported MIC data on 295 Salmonella spp. isolates from carcasses of turkeys (Table 16). Levels of resistance were generally lower than those observed in carcasses of broilers. The higher levels of resistance were showed for tetracycline, nalidixic acid and ciprofloxacin, for which overall resistance equalled 59.3%, 40% and 43.7%, respectively. Overall resistance to ampicillin and sulfamethoxazole was moderate at 23.1% and 22%, respectively. The resistance to trimethoprim was either not detected or detected at low levels (6.5–10.7%) in three MSs. Resistance was not detected or low levels of resistance to gentamicin were reported by most MSs (4.4–15.2%); however, one MS registered a high level of resistance (33.3%). Resistance to azithromycin, cefotaxime and colistin were recorded at low level in only one MS, whereas resistance to chloramphenicol was detected at low levels in two MSs. Ceftazidime, meropenem and tigecycline resistance were not recorded in any of the reporting MSs.
Table 16.
Occurrence of resistance (%) to selected antimicrobials in Salmonella spp. from meat from turkeys, using harmonised ECOFFs, 8 EU MSs, 2016
| Country | N | GEN | CHL | AMP | CTX | CAZ | MEM | TGC |
|---|---|---|---|---|---|---|---|---|
| Croatiaa | 4 | 0 | 0 | 0 | 0 | 0 | 0 | 0 |
| Czech Republica | 3 | 33.3 | 0 | 33.3 | 0 | 0 | 0 | 0 |
| France | 168 | 0 | 3 | 14.9 | 0 | 0 | 0 | 0 |
| Germany | 45 | 4.4 | 2.2 | 28.9 | 0 | 0 | 0 | 0 |
| Hungary | 22 | 13.6 | 0 | 59.1 | 0 | 0 | 0 | 0 |
| Polanda | 5 | 0 | 0 | 60 | 0 | 0 | 0 | 0 |
| Slovakiaa | 2 | 0 | 0 | 50 | 0 | 0 | 0 | 0 |
| Spain | 46 | 15.2 | 0 | 26.1 | 6.5 | 0 | 0 | 0 |
| Total (8 MSs) | 295 | 4.4 | 2 | 23.1 | 1 | 0 | 0 | 0 |
| Country | N | NAL | CIP | AZM | COL | SMX | TMP | TET |
|---|---|---|---|---|---|---|---|---|
| Croatiaa | 4 | 50 | 50 | 0 | 0 | 0 | 0 | 0 |
| Czech Republica | 3 | 33.3 | 33.3 | 0 | 0 | 33.3 | 0 | 33.3 |
| France | 168 | 20.2 | 20.2 | 0 | 0 | 18.5 | 10.7 | 68.5 |
| Germany | 45 | 82.2 | 91.1 | 8.9 | 4.4 | 22.2 | 6.7 | 57.8 |
| Hungary | 22 | 77.3 | 95.5 | 0 | 0 | 54.5 | 0 | 81.8 |
| Polanda | 5 | 40 | 80 | 0 | 0 | 20 | 0 | 0 |
| Slovakiaa | 2 | 100 | 100 | 0 | 0 | 0 | 0 | 0 |
| Spain | 46 | 50 | 52.2 | 0 | 0 | 21.7 | 6.5 | 32.6 |
| Total (8 MSs) | 295 | 40 | 43.7 | 1.4 | 0.7 | 22 | 8.1 | 59.3 |
ECOFFs: epidemiological cut‐off values; EUCAST: European Committee on Antimicrobial Susceptibility Testing; N: number of isolates tested; MSs: Member States; GEN: gentamicin, CHL: chloramphenicol; AMP: ampicillin; CTX: cefotaxime; CAZ: Ceftazidime; MEM: meropenem; TGC: tigecycline, NAL: nalidixic acid; CIP: ciprofloxacin; AZM: azithromycin; COL: colistin; SMX: sulfamethoxazole; TMP: trimethoprim; TET: tetracycline.
The occurrence of resistance is assessed on less than 10 isolates and should only be considered as part of the total from all MSs data.
Combined resistance to cefotaxime and ciprofloxacin in Salmonella spp. from turkey meat
Overall ‘Microbiological’ combined resistance to both ciprofloxacin and cefotaxime in Salmonella spp. isolates from turkey meat equalled 1.0% (N = 293), as it was only observed in 3 isolates in Spain (Table COMSALMTURKMEAT). None of the Salmonella spp. isolates reported exhibited ‘clinical’ combined resistance to both ciprofloxacin and cefotaxime.
Multidrug resistance in Salmonella spp. isolates from turkey meat
Among the Salmonella spp. isolates from turkey meat tested in 2016, multidrug resistance was assessed at 23.8% (N = 293), ranging from 14.9% in France to 81.8% in Spain. The proportion of completely susceptible isolates equalled 18.8%, varying between 2.2% in Germany and 46% in Spain, while only considering the MSs reporting on a large number of isolates (Figure 30).
Figure 30.
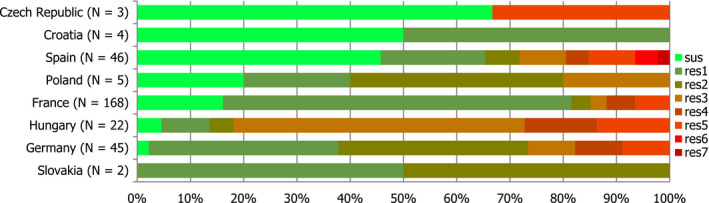
Frequency distribution of completely susceptible isolates and resistant isolates to one to nine antimicrobial classes in Salmonella spp. from turkey meat, EU MSs, 2016
- N: total number of isolates tested for susceptibility against the whole common antimicrobial set for Salmonella; sus: susceptible to all antimicrobial classes of the common set for Salmonella; res1–res5: resistance to one antimicrobial classes/resistance to five antimicrobial classes of the common set for Salmonella.
Spatial distribution of complete susceptibility in Salmonella spp. from turkey meat
The spatial distribution of complete susceptibility to the panel of antimicrobial substances tested in Salmonella spp. isolates from turkey meat in 2016 is shown in Figure 31. The susceptibility to each individual antimicrobial was determined using ECOFFs; all isolates were tested against the same mandatory panel of antimicrobials. Among the reporting countries, marked variations were observed in the percentages of completely susceptible isolates, which ranged from 2.2% and 4.5% in Germany and Hungary, 16.1% in France, and up to 45.7% in Spain, respectively.
Figure 31.
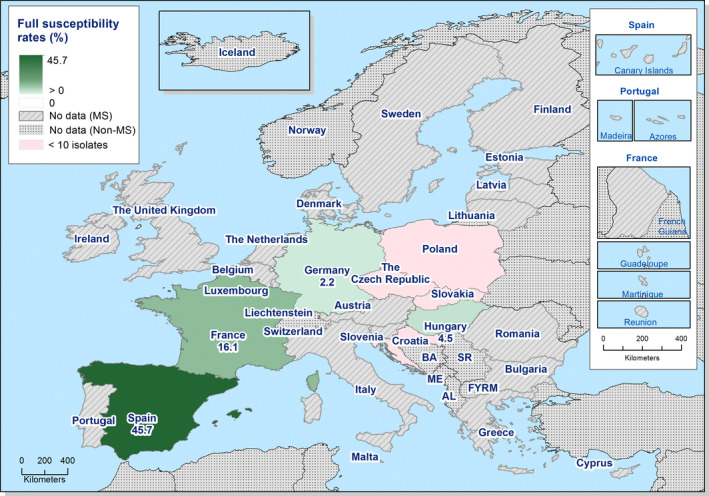
Spatial distribution of complete susceptibility to the panel of antimicrobials tested among Salmonella spp. from turkey meat, using harmonised ECOFFs, 8 EU MSs, 2016
Resistance levels in certain Salmonella serovars from turkey meat
Among the isolates for which serovar information was provided (N = 293), the most common serovars detected in turkey meat (Table SERTURMEATD) were S. Bredeney (2 MSs, 39.0%), S. Anatum, (2 MSs, 8.8%), S. Hadar (4 MSs, 7.8%), S. Newport (4 MSs, 6.1%), S. Saintpaul (2 MSs, 5.8%), S. Kentucky (6 MSs, 4.8%) and S. Infantis (3 MSs, 3.4%). Resistance and MDR levels in Salmonella spp. (23.7%) (Table COMSALMTURKMEAT) were lower than those recorded in S. Infantis (60%) (Table COMINFTURKMEAT) and were much than in S. Kentucky (90.9%) (Table COMKENTUCKYTURKMEAT). In S. Kentucky isolates from carcases of fattening turkeys (6 MSs, N = 14), resistance to azithromycin, colistin, ceftazidime, cefotaxime, chloramphenicol, meropenem, tigecycline and trimethoprim was not detected; the overall resistance to ampicillin was at extremely high level (92.6%). Resistance to sulfamethoxazole and tetracycline ranged from not detected to extremely high (0–100%), with the overall resistance at very high level (both at 71.4%). Resistance to ciprofloxacin and nalidixic acid was recorded for all isolates tested by all MS) (Table KENTURKMEATD). It has been shown that any of S. Kentucky isolates was susceptible to all 11 antimicrobials included in the MDR analysis (Table COMKENTUCKYTURKMEAT). Resistance in S. Infantis isolates from carcases of fattening turkeys was observed (N = 10, 3 MSs) (Table INFTURKMEATD) was detected only in sulfamethoxazole and tetracycline for all isolates tested by one MS and in ciprofloxacin and nalidixic acid with an overall resistance at 80%. Two isolates (20%) were susceptible to all 11 antimicrobials included in the MDR analysis and 6 isolates (60%) were multiresistant (Table COMINFTURKMEAT).
3.2.3. Antimicrobial resistance in Salmonella spp. from flocks of broilers
Resistance levels in Salmonella spp. from broiler flocks
In 2016, 22 MSs and 2 non‐MSs reported data on Salmonella spp. in broiler flocks (Table 17). The reported levels of resistance to ciprofloxacin and nalidixic acid ranged from high to extremely high, with overall resistance at 53.8% and 48.3%, respectively, in most of the reporting countries, whereas no resistance was recorded in Denmark. Overall resistance to ampicillin was moderate at 17.1%, although high levels were also observed in eight MSs. Most MSs recorded low to extremely high resistance to sulfamethoxazole and tetracycline, (ranged from 3.7% up to 96.5%) with overall resistance at 44.1% and 40.1%, respectively. Resistance to trimethoprim was generally low in most reporting MSs (overall resistance at 9.3%), although high levels were also observed in three MSs, extremely high level in one MS and nine MSs did not register any resistance. Resistance to chloramphenicol, colistin and gentamicin was overall low, although resistance levels varied markedly from none to 28.8% between reporting MSs. Resistance to cefotaxime and ceftazidime was generally either not detected (in 16 MSs) or reported at low levels (7 MSs), except in Italy, where moderate levels were registered for both substances. The Czech Republic and Spain detected isolates resistant to cefotaxime but not to ceftazidime. Azithromycin and tigecycline resistance was overall very low (0.5% and 1.8%), with the highest values at 8.3% (Germany) and 7.6% (Hungary), respectively. Meropenem resistance was not detected by any of the MSs reporting data in 2016.
Table 17.
Occurrence of resistance (%) to selected antimicrobials in Salmonella spp. from broiler flocks, using harmonised ECOFFs, 22 EU MSs, 2016
| Country | N | GEN | CHL | AMP | CTX | CAZ | MEM | TGC | NAL | CIP | AZM | COL | SMX | TMP | TET |
|---|---|---|---|---|---|---|---|---|---|---|---|---|---|---|---|
| Austria | 179 | 0 | 0 | 1.7 | 0 | 0 | 0 | 0 | 53.6 | 53.6 | 0 | 0 | 53.6 | 0.6 | 53.6 |
| Belgium | 123 | 2.4 | 3.3 | 34.1 | 0 | 0 | 0 | 0 | 46.3 | 46.3 | 0 | 1.6 | 64.2 | 29.3 | 35 |
| Bulgariaa | 3 | 0 | 0 | 0 | 0 | 0 | 0 | 0 | 66.7 | 66.7 | 0 | 0 | 66.7 | 33.3 | 66.7 |
| Croatia | 125 | 0 | 0 | 2.4 | 0 | 0 | 0 | 0 | 73.6 | 72.8 | 0 | 0 | 15.2 | 0 | 15.2 |
| Cyprus | 24 | 8.3 | 0 | 12.5 | 0 | 0 | 0 | 4.2 | 95.8 | 100 | 0 | 0 | 95.8 | 91.7 | 95.8 |
| Czech Republic | 91 | 4.4 | 1.1 | 14.3 | 1.1 | 0 | 0 | 2.2 | 20.9 | 24.2 | 0 | 13.2 | 12.1 | 2.2 | 12.1 |
| Denmark | 20 | 0 | 0 | 5 | 0 | 0 | 0 | 0 | 0 | 0 | 0 | 0 | 10 | 0 | 75 |
| Finland a | 1 | 0 | 100 | 0 | 0 | 0 | 0 | 0 | 0 | 0 | 0 | 0 | 0 | 0 | 0 |
| France | 29 | 0 | 3.4 | 13.8 | 0 | 0 | 0 | 0 | 10.3 | 10.3 | 0 | 0 | 13.8 | 6.9 | 6.9 |
| Germany | 24 | 0 | 16.7 | 20.8 | 0 | 0 | 0 | 4.2 | 29.2 | 33.3 | 8.3 | 25 | 37.5 | 8.3 | 37.5 |
| Greece | 27 | 0 | 0 | 0 | 0 | 0 | 0 | 0 | 29.6 | 51.9 | 3.7 | 0 | 3.7 | 0 | 0 |
| Hungary | 170 | 0.6 | 0 | 10 | 1.8 | 1.8 | 0 | 7.6 | 86.5 | 87.6 | 0.6 | 0 | 71.8 | 0 | 75.3 |
| Ireland | 14 | 0 | 0 | 7.1 | 0 | 0 | 0 | 0 | 0 | 7.1 | 0 | 0 | 14.3 | 0 | 7.1 |
| Italy | 25 | 0 | 12 | 48 | 12 | 12 | 0 | 0 | 60 | 60 | 0 | 12 | 56 | 52 | 60 |
| Malta | 80 | 28.8 | 5 | 42.5 | 2.5 | 1.3 | 0 | 3.8 | 48.8 | 50 | 0 | 0 | 73.8 | 6.3 | 53.8 |
| Poland | 84 | 0 | 1.2 | 10.7 | 0 | 0 | 0 | 0 | 57.1 | 67.9 | 1.2 | 4.8 | 27.4 | 0 | 29.8 |
| Portugal | 51 | 7.8 | 3.9 | 23.5 | 2 | 2 | 0 | 0 | 5.9 | 21.6 | 5.9 | 2 | 17.6 | 5.9 | 19.6 |
| Romania | 170 | 7.6 | 1.8 | 29.4 | 0.6 | 0.6 | 0 | 4.1 | 45.9 | 57.6 | 0 | 5.3 | 51.8 | 15.9 | 41.8 |
| Slovakia | 53 | 1.9 | 3.8 | 20.8 | 1.9 | 1.9 | 0 | 1.9 | 81.1 | 83 | 1.9 | 0 | 34 | 3.8 | 35.8 |
| Slovenia | 85 | 0 | 0 | 20 | 0 | 0 | 0 | 2.4 | 96.5 | 96.5 | 0 | 0 | 96.5 | 1.2 | 95.3 |
| Spain | 169 | 25.4 | 6.5 | 30.2 | 1.2 | 0 | 0 | 0.6 | 36.7 | 55.6 | 0 | 0.6 | 37.3 | 8.3 | 25.4 |
| United Kingdom | 170 | 1.2 | 0.6 | 3.5 | 0 | 0 | 0 | 0 | 3.5 | 8.8 | 0 | 0 | 18.2 | 17.1 | 19.4 |
| Total (22 MSs) | 1,717 | 5.6 | 2.2 | 17.1 | 0.8 | 0.6 | 0 | 1.8 | 48.3 | 53.8 | 0.5 | 2.2 | 44.1 | 9.3 | 40.1 |
| Iceland | 3 | 0 | 0 | 0 | 0 | 0 | 0 | 0 | 0 | 0 | 0 | 0 | 0 | 0 | 0 |
| Norway | 2 | 0 | 0 | 0 | 0 | 0 | 0 | 0 | 0 | 0 | 0 | 0 | 0 | 0 | 0 |
ECOFFs: epidemiological cut‐off values; EUCAST: European Committee on Antimicrobial Susceptibility Testing; N: number of isolates tested; MSs: Member States; GEN: gentamicin; CHL: chloramphenicol; AMP: ampicillin; CTX: cefotaxime; CAZ: Ceftazidime; MEM: meropenem; TGC: tigecycline, NAL: nalidixic acid; CIP: ciprofloxacin; AZM: azithromycin; COL: colistin; SMX: sulfamethoxazole; TMP: trimethoprim; TET: tetracycline.
The occurrence of resistance is assessed on less than 10 isolates.
Spatial distribution of resistance in Salmonella spp. from broiler flocks
Low levels of cefotaxime resistance (< 10%) were reported only in four MSs from the eastern Europe (the Czech Republic, Hungary, Romania and Slovakia) and three MSs from the southern Europe (Malta, Portugal and Spain). Italy recorded moderate level of resistance (12%), whereas the remaining reporting countries did not detect resistance to cefotaxime (Figure 32).
Figure 32.
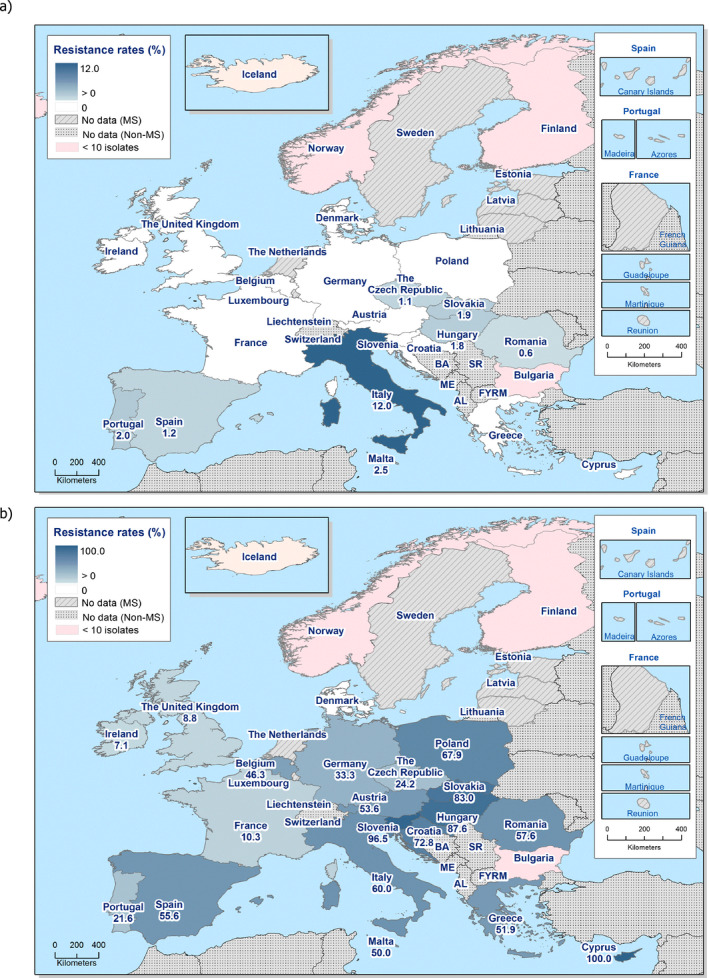
Spatial distribution of cefotaxime (a) and ciprofloxacin (b) resistance among Salmonella spp. from broiler flocks, using harmonised ECOFFs, 24 EU/EEA MSs, 2016
The levels of resistance to ciprofloxacin in Salmonella spp. from broilers were extremely high (> 70%) in some MSs from eastern and southern Europe (Croatia, Cyprus, Hungary, Slovakia and Slovenia), and high to very high in most other MSs (Figure 32). Low levels of ciprofloxacin resistance were reported in only three MSs from northern and western Europe (France, Ireland and the United Kingdom). Only Denmark did not detect resistance to ciprofloxacin (Figure 32).
Combined resistance to cefotaxime and ciprofloxacin in Salmonella spp. from broiler flocks
‘Microbiological’ combined resistance to ciprofloxacin and cefotaxime, equalling overall 0.75% (N = 1,721), was either not detected in 10 Mss or reported at low to very low levels in 7 MSs. The striking exception to this pattern is Italy, where the ‘microbiological’ combined resistance to ciprofloxacin and cefotaxime was assessed at the moderate level of 12% (Table COMSALMBR).
Among the 22 reporting MSs, ‘clinical’ combined resistance to ciprofloxacin and cefotaxime was only detected in three isolates (one isolated in Romania and two in Malta, resulting in 0.6% and 2.5% of ‘clinical’ combined resistance, respectively), corresponding to the overall level of 0.17% (Figure 33).
Figure 33.
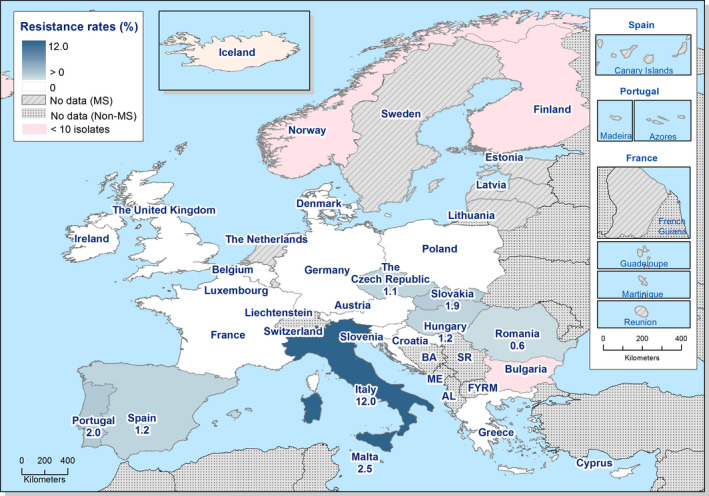
Spatial distribution of combined resistance to cefotaxime and ciprofloxacin in Salmonella spp. from broiler flocks, using harmonised ECOFFs, 24 EU/EEA MSs, 2016
Temporal trends in resistance in Salmonella spp. from broiler flocks
Ten MSs provided resistance data on 4 years or more to be included in the statistical analysis. Over the 8 years of data, levels of resistance to cefotaxime remained mostly constant for most of the reporting MSs. Resistance to cefotaxime is generally very low; however, a statistically significant increasing trend was observed in two MSs and statistically significant decreasing trend occurred in three MSs (Figure 34). Within each MS, similar levels of resistance to ciprofloxacin and nalidixic acid were observed from 2009 to 2016, although a statistically significant increasing occurred for both ciprofloxacin and nalidixic acid in five MSs. Tetracycline resistance exceeded ampicillin resistance in many MSs and, although tetracycline resistance showed some fluctuations, ampicillin resistance tended to show parallel fluctuations, maintaining the interval between tetracycline and ampicillin resistance.
Figure 34.
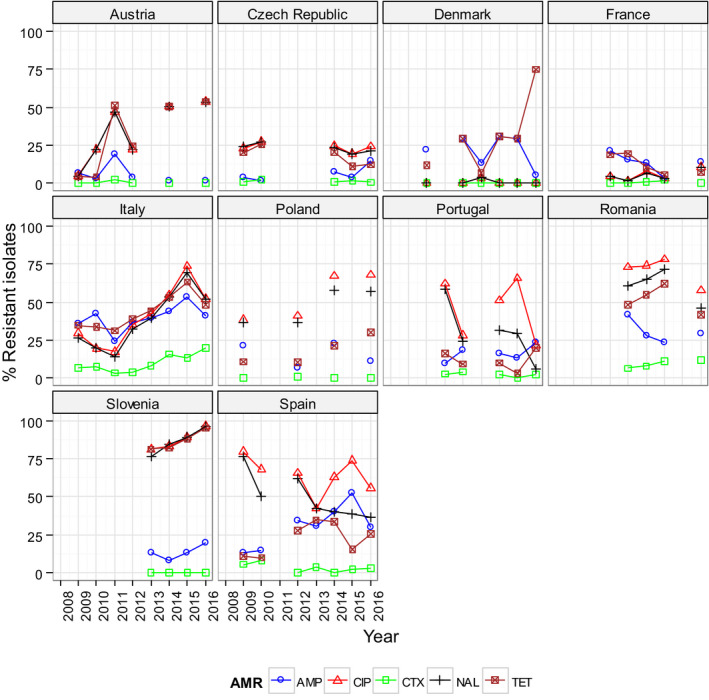
Trends in ampicillin (AMP), cefotaxime (CTX), ciprofloxacin (CIP), nalidixic acid (NAL) and tetracyclines (TET) resistance in Salmonella spp. from broiler flocks, using harmonised ECOFFs, EU MSs, 2008–2016
-
Statistical significance of trends over 4‐5 or more years was tested by a logistic regression model (p ≤ 0.05). Statistically significant increasing trends were observed for ampicillin in the Czech Republic, Italy and Spain, for ciprofloxacin and nalidixic acid in Austria, Italy, Poland, Romania and Slovenia, for cefotaxime in Italy and Romania, as well as for tetracycline in Austria, Denmark, Italy, Poland, Romania, Slovenia and Spain.Statistically significant decreasing trends were observed for ampicillin in Austria and France, for ciprofloxacin and nalidixic acid in Spain, for cefotaxime in the Czech Republic, Portugal and Spain, for nalidixic acid in Portugal, as well as for tetracycline in the Czech Republic and France.
As AMR is associated with particular serovars or clones within serovars, fluctuations in the occurrence of resistance in Salmonella spp. isolates within a country may be the result of changes in the proportions of different Salmonella serovars which contribute to the total numbers of Salmonella spp. isolates.
Multidrug resistance in Salmonella spp. from broiler flocks
Twenty‐two MSs and two non‐MSs submitted isolate‐based data included in the MDR analysis (N = 1,721). Overall, the level of multidrug resistance was assessed at 39.8%, whereas complete susceptibility rate equalled 35.6%. Situations varied markedly between MSs, as from none to 100% of the Salmonella spp. isolates were multiresistant, and none to 100% of them were completely susceptible to the 11 antimicrobial classes considered (Figure 35) (Table COMSALMBR).
Figure 35.
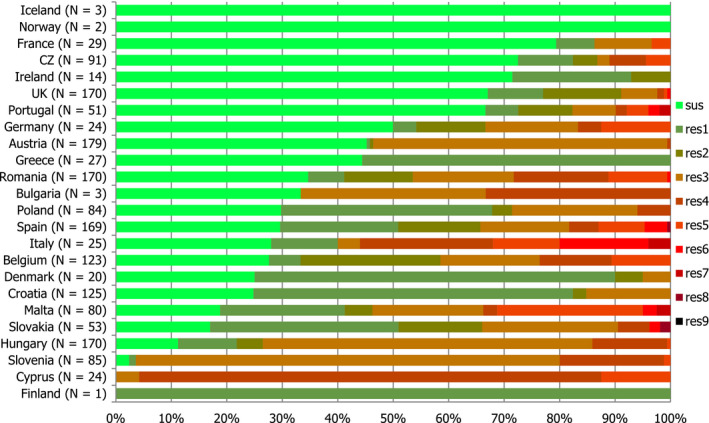
Frequency distribution of completely susceptible isolates and resistant isolates to one to nine antimicrobials classes in Salmonella spp. from broiler flocks, EU MSs, 2016
- N: total number of isolates tested for susceptibility against the whole common antimicrobial set for Salmonella; sus: susceptible to all antimicrobial classes of the common set for Salmonella; res1–res9: resistance to one antimicrobial classes/resistance to nine antimicrobial classes of the common set for Salmonella.
Spatial distribution of complete susceptibility among Salmonella spp. from broiler flocks
The spatial distribution of complete susceptibility to the panel of antimicrobial substances tested in Salmonella spp. from broiler flocks in 2016 is shown in Figure 36. The susceptibility to each individual antimicrobial was determined using ECOFFs; all isolates were tested against the same mandatory panel of antimicrobials. Among the reporting countries, marked variations were observed in the percentages of completely susceptible isolates, which ranged from none in Cyprus, 2.4% and 11.2% in Slovenia and Hungary, and up to 79.3% in France. The highest levels of complete susceptibility were shown by isolates from France, the Czech Republic and Ireland.
Figure 36.
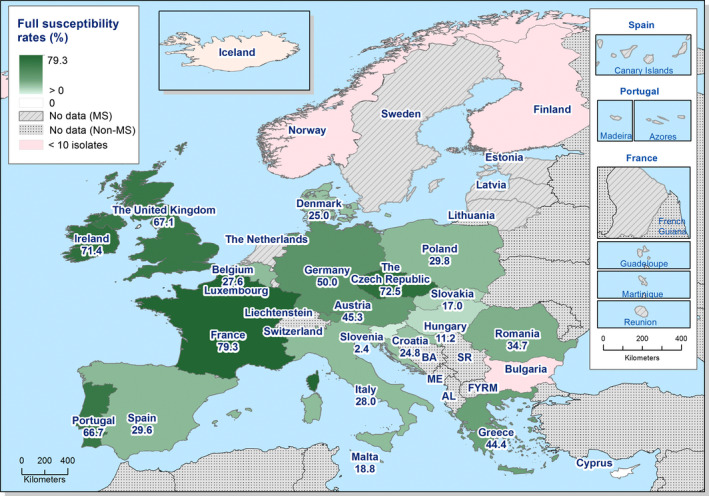
Spatial distribution of complete susceptibility to the panel of antimicrobials tested among Salmonella spp. from broiler flocks, using harmonised ECOFFs, 24 EU/EEA MSs, 2016
3.2.4. Antimicrobial resistance in Salmonella serovars from flocks of broilers
Distribution of salmonella serovars in broiler flocks
Among the isolates for which serovar information was provided (N = 1,715), the most common serovars detected in flocks of broilers (Table SERBRD) were S. Infantis (18 MSs, 38.4%), S. Enteritidis, (12 MSs, 10.6%), S. Mbandaka (11 MSs, 6.1%), S. Kentucky (8 MSs, 4.6%) and S. Senftenberg (14 MSs, 3.4%). Resistance and MDR levels in S. Enteritidis were much lower than those recorded in S. Infantis, S. Kentucky and Salmonella spp.
Figure 37.
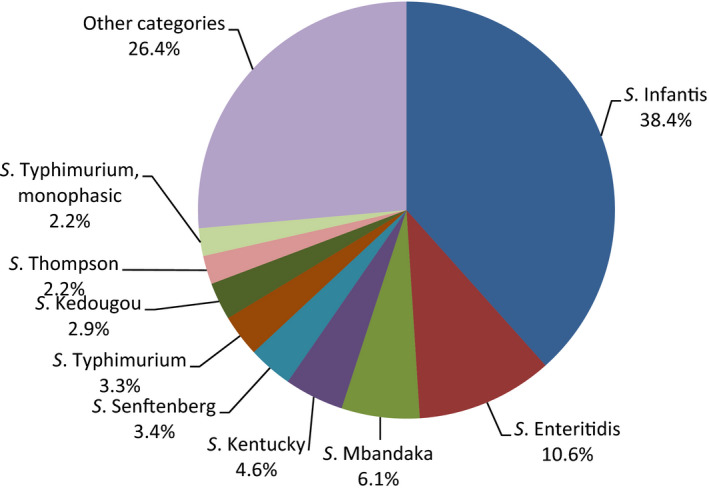
Breakdown of Salmonella serovars in broiler flocks, EU MSs, 2016 (N = 1,707)
Resistance in S. Infantis from broiler flocks
Resistance levels in S. Infantis from broiler flocks
S. Infantis was the first most frequently reported serovars in broiler flocks, accounting for 38.4% of the Salmonella isolates serotyped (N = 659). In S. Infantis isolates from broilers (18 MSs and 1 non‐MSs, Table 18), resistance to nalidixic acid and ciprofloxacin was generally very high to extremely high (overall 94.1% and 94.1%) in most of the reporting countries. The levels of resistance to sulfamethoxazole and tetracycline ranged from high to extremely high and overall was at extremely high levels (78% and 75.6%, respectively), whereas resistance to ampicillin was overall moderate (12.6%). Resistance to trimethoprim varied considerably from none to extremely high and overall was at moderate levels (10.5%). Only five MSs observed resistance to chloramphenicol (overall 1.4%). Resistance to gentamicin was detected at low levels in Romania (1.5%) and Spain (7.7%) and resistance to azithromycin was also detected at low levels only in Hungary (0.7%) and Poland (4.8%). Resistance to colistin were recorded only in two MSs Germany and Italy (13.3%). Overall resistance to tigecycline (4.1%) remained at low level, although high level of resistance (23.1%) was registered in one MS. Resistance to cefotaxime and ceftazidime were either not detected in most of the reporting countries, or detected at low levels only in Hungary and Romania, overall equalled to 1.1% and 0.9%, respectively. Italy registered resistance to cefotaxime and ceftazidime at moderate levels (20% for both substances) and the Czech Republic reported moderate resistance to cefotaxime (11.1%) but without any resistance to ceftazidime. Meropenem resistance was not detected in any of the reporting countries. It is notable that isolates from Hungary, Austria, Slovenia and Croatia comprised 61% of the S. Infantis isolates.
Table 18.
Occurrence of resistance (%) to selected antimicrobials in Salmonella Infantis from flocks of broilers, using harmonised ECOFFs, 18 EU MSs, 2016
| Country | N | GEN | CHL | AMP | CTX | CAZ | MEM | TGC | NAL | CIP | AZM | COL | SMX | TMP | TET |
|---|---|---|---|---|---|---|---|---|---|---|---|---|---|---|---|
| Austria | 104 | 0 | 0 | 1 | 0 | 0 | 0 | 0 | 92.3 | 92.3 | 0 | 0 | 91.3 | 0 | 92.3 |
| Belgium | 52 | 0 | 0 | 28.8 | 0 | 0 | 0 | 0 | 92.3 | 92.3 | 0 | 0 | 92.3 | 30.8 | 46.2 |
| Bulgariaa | 2 | 0 | 0 | 0 | 0 | 0 | 0 | 0 | 100 | 100 | 0 | 0 | 100 | 50 | 100 |
| Croatia | 77 | 0 | 0 | 3.9 | 0 | 0 | 0 | 0 | 96.1 | 97.4 | 0 | 0 | 24.7 | 0 | 24.7 |
| Cyprus | 20 | 0 | 0 | 0 | 0 | 0 | 0 | 0 | 100 | 100 | 0 | 0 | 95 | 100 | 100 |
| Czech Republic | 9 | 0 | 11.1 | 55.6 | 11.1 | 0 | 0 | 0 | 55.6 | 55.6 | 0 | 0 | 55.6 | 0 | 55.6 |
| Denmarka | 1 | 0 | 0 | 0 | 0 | 0 | 0 | 0 | 0 | 0 | 0 | 0 | 0 | 0 | 0 |
| Germanya | 6 | 0 | 0 | 0 | 0 | 0 | 0 | 16.7 | 50 | 50 | 0 | 16.7 | 50 | 0 | 50 |
| Greecea | 1 | 0 | 0 | 0 | 0 | 0 | 0 | 0 | 0 | 0 | 0 | 0 | 0 | 0 | 0 |
| Hungary | 142 | 0 | 0 | 10.6 | 1.4 | 1.4 | 0 | 9.2 | 100 | 100 | 0.7 | 0 | 84.5 | 0 | 88 |
| Italy | 15 | 0 | 20 | 53.3 | 20 | 20 | 0 | 0 | 86.7 | 80 | 0 | 13.3 | 80 | 73.3 | 80 |
| Malta | 13 | 0 | 15.4 | 15.4 | 0 | 0 | 0 | 23.1 | 92.3 | 92.3 | 0 | 0 | 92.3 | 15.4 | 92.3 |
| Poland | 21 | 0 | 0 | 14.3 | 0 | 0 | 0 | 0 | 100 | 100 | 4.8 | 0 | 95.2 | 0 | 100 |
| Romania | 65 | 1.5 | 3.1 | 10.8 | 1.5 | 1.5 | 0 | 10.8 | 87.7 | 87.7 | 0 | 0 | 84.6 | 23.1 | 84.6 |
| Slovakia | 37 | 0 | 2.7 | 18.9 | 0 | 0 | 0 | 2.7 | 100 | 100 | 0 | 0 | 45.9 | 2.7 | 48.6 |
| Slovenia | 80 | 0 | 0 | 20 | 0 | 0 | 0 | 2.5 | 100 | 100 | 0 | 0 | 98.8 | 0 | 98.8 |
| Spain | 13 | 7.7 | 0 | 7.7 | 0 | 0 | 0 | 0 | 69.2 | 69.2 | 0 | 0 | 53.8 | 15.4 | 46.2 |
| United Kingdoma | 1 | 0 | 0 | 0 | 0 | 0 | 0 | 0 | 100 | 100 | 0 | 0 | 100 | 100 | 100 |
| Total (MSs 18) | 659 | 0.3 | 1.4 | 12.6 | 1.1 | 0.9 | 0 | 4.1 | 94.1 | 94.1 | 0.3 | 0.5 | 78 | 10.5 | 75.6 |
| Icelanda | 1 | 0 | 0 | 0 | 0 | 0 | 0 | 0 | 0 | 0 | 0 | 0 | 0 | 0 | 0 |
ECOFFs: epidemiological cut‐off values; EUCAST: European Committee on Antimicrobial Susceptibility Testing; N: number of isolates tested; MSs: Member States; GEN: gentamicin; CHL: chloramphenicol; AMP: ampicillin; CTX: cefotaxime; CAZ: Ceftazidime; MEM: meropenem; TGC: tigecycline; NAL: nalidixic acid; CIP: ciprofloxacin; AZM: azithromycin; COL: colistin; SMX: sulfamethoxazole; TMP: trimethoprim; TET: tetracycline.
The occurrence of resistance is assessed on less than 10 isolates and should only be considered as part of the total from all MSs data.
Multidrug resistance and complete susceptibility in S. Infantis from broiler flocks
Eighteen MSs and one non‐MS submitted isolate‐based data included in the MDR analysis (N = 659). Situations varied markedly between MSs, as from 22.4% to 100% of the S. Infantis isolates were multiresistant, and none to 50% of them were completely susceptible to the 11 antimicrobial classes considered. The overall rate of MDR equalled 75.3% among the reporting countries and the rate of complete susceptibility equalled 5.6% (Figure 38) (Table COMINFANBR).
Figure 38.
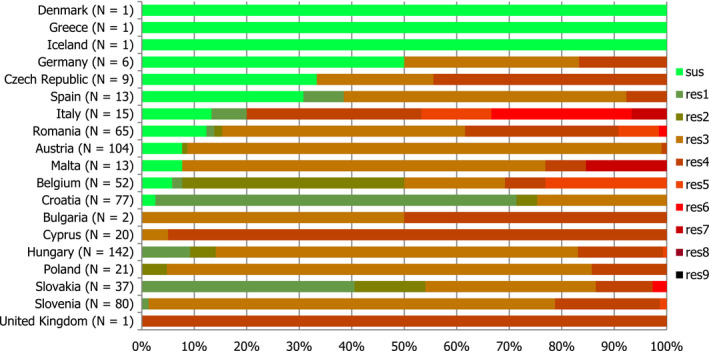
Frequency distribution of completely susceptible isolates and resistant isolates to one to nine antimicrobials classes in Salmonella Infantis from broilers, EU MSs, 2016
- N: total number of isolates tested for susceptibility against the whole common antimicrobial set for Salmonella; sus: susceptible to all antimicrobial classes of the common set for Salmonella; res1–res9: resistance to one antimicrobial classes/resistance to nine antimicrobial classes of the common set for Salmonella.
Spatial distribution of resistance among S. Infantis from broiler flocks
Cefotaxime resistance was reported only by two MSs from Eastern Europe (Hungary and Romania) at low levels, whereas one MS registered a moderate resistance to cefotaxime (Italy, 20%) (Figure 39). No clear geographical patterns were observed in fluoroquinolone resistance levels in S. Infantis isolates from broiler flocks. The levels of resistance to ciprofloxacin in general ranged from very high (> 50%) to extremely high (> 70%) in most of the MSs. Only Denmark and Greece did not detect resistance to ciprofloxacin; however, those countries only reported data for one isolate (Figure 39).
Figure 39.
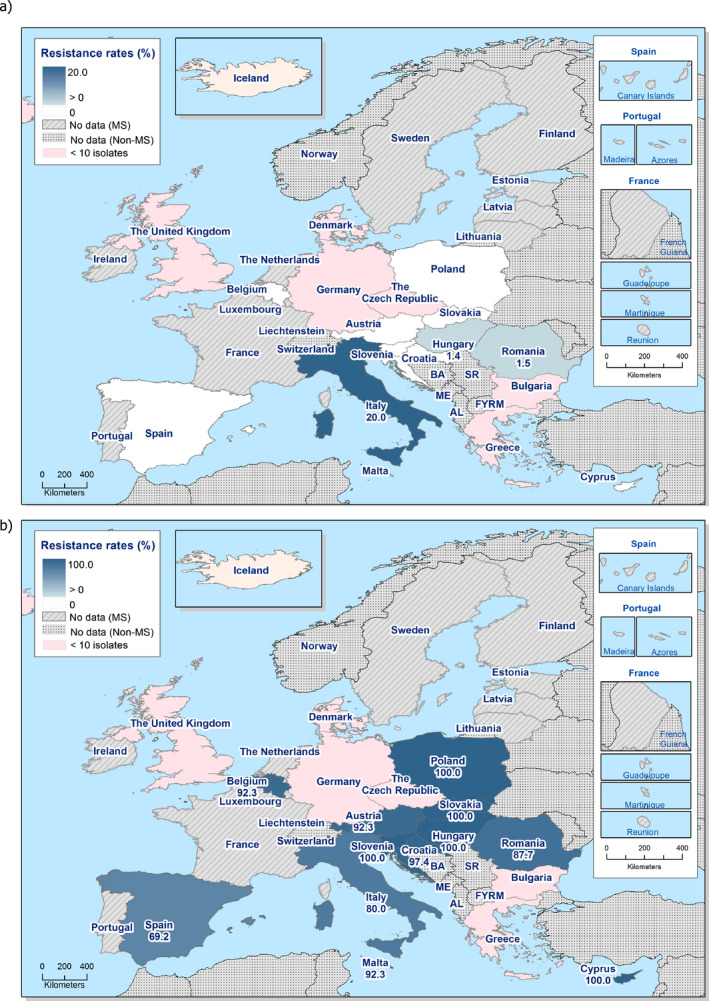
Spatial distribution of cefotaxime (a) and ciprofloxacin (b) resistance among Salmonella Infantis from broiler flocks, using harmonised ECOFFs, 19 EU/EEA MSs, 2016
Combined resistance to ciprofloxacin and cefotaxime in S. Infantis from broiler flocks
‘Microbiological’ combined resistance to ciprofloxacin and cefotaxime was reported at low level in a few isolates in two MSs, Hungary (1.4%) and Romania (1.5%), whereas was detected at moderate levels in Italy (20%), corresponding to the overall level of 1.1% (Table COMINFANBR). ‘Clinical’ combined resistance to ciprofloxacin and cefotaxime was only detected in one isolate from Romania (1.5%), corresponding to the overall level of 0.15% combined resistance among the 19 reporting MSs (Figure 40).
Figure 40.
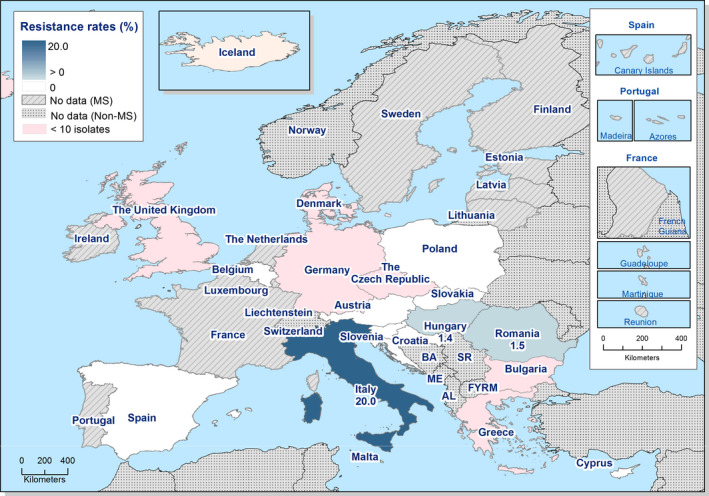
Spatial distribution of combined resistance to cefotaxime and ciprofloxacin in Salmonella Infantis from broiler flocks, using harmonised ECOFFs, 19 EU/EEA MSs, 2016
Resistance in S. Enteritidis from broiler flocks
Resistance levels in S. Enteritidis from broiler flocks
S. Enteritidis was the second most frequently reported serovar in broiler flocks, accounting for 10.6%, of the Salmonella isolates serotyped (N = 182) (Table SERBRD). Among S. Enteritidis isolates from broiler flocks (12 MSs, Table 19), the overall resistance to nalidixic acid and ciprofloxacin was equalled at 19.8% and 27.5%, respectively. Resistance to nalidixic acid and ciprofloxacin were reported at high levels by four MSs, ranging from 33.3% to 61.7%, detected at moderate levels in two MSs or not detected in most of the reporting countries. Marked variations were detected in the levels of resistance to colistin, high level was reported by the Czech Republic, whereas the remaining countries showed either a moderate level (three MSs) or no resistance detected. Overall resistance to ampicillin was low at 6% and overall resistance to chloramphenicol, sulfamethoxazole and trimethoprim were very low at 0.5% for the three substances. Resistance to gentamicin, cefotaxime, ceftazidime, meropenem, tigecycline and azithromycin were not detected by any of the reporting countries.
Table 19.
Occurrence of resistance (%) to selected antimicrobials in Salmonella Enteritidis from flocks of broilers, using harmonised ECOFFs, 12 EU MSs, 2016
| Country | N | GEN | CHL | AMP | CTX | CAZ | MEM | TGC | NAL | CIP | AZM | COL | SMX | TMP | TET |
|---|---|---|---|---|---|---|---|---|---|---|---|---|---|---|---|
| Austriaa | 2 | 0 | 0 | 0 | 0 | 0 | 0 | 0 | 0 | 0 | 0 | 0 | 0 | 0 | 0 |
| Belgiuma | 2 | 0 | 0 | 0 | 0 | 0 | 0 | 0 | 0 | 0 | 0 | 100 | 0 | 0 | 0 |
| Croatia | 12 | 0 | 0 | 0 | 0 | 0 | 0 | 0 | 0 | 0 | 0 | 0 | 0 | 0 | 0 |
| Czech Republic | 50 | 0 | 0 | 4 | 0 | 0 | 0 | 0 | 12 | 16 | 0 | 24 | 0 | 0 | 0 |
| Francea | 1 | 0 | 0 | 0 | 0 | 0 | 0 | 0 | 0 | 0 | 0 | 0 | 0 | 0 | 0 |
| Germanya | 4 | 0 | 0 | 0 | 0 | 0 | 0 | 0 | 0 | 0 | 0 | 100 | 0 | 0 | 0 |
| Hungarya | 3 | 0 | 0 | 0 | 0 | 0 | 0 | 0 | 33.3 | 33.3 | 0 | 0 | 0 | 0 | 0 |
| Poland | 47 | 0 | 2.1 | 4.3 | 0 | 0 | 0 | 0 | 46.8 | 61.7 | 0 | 8.5 | 0 | 0 | 2.1 |
| Portugala | 7 | 0 | 0 | 0 | 0 | 0 | 0 | 0 | 0 | 0 | 0 | 14.3 | 0 | 0 | 0 |
| Romania | 41 | 0 | 0 | 9.8 | 0 | 0 | 0 | 0 | 4.9 | 14.6 | 0 | 12.2 | 2.4 | 2.4 | 2.4 |
| Slovakia | 10 | 0 | 0 | 30 | 0 | 0 | 0 | 0 | 40 | 50 | 0 | 0 | 0 | 0 | 0 |
| Spaina | 3 | 0 | 0 | 0 | 0 | 0 | 0 | 0 | 33.3 | 33.3 | 0 | 0 | 0 | 0 | 0 |
| Total (12 MSs) | 182 | 0 | 0.5 | 6 | 0 | 0 | 0 | 0 | 19.8 | 27.5 | 0 | 15.4 | 0.5 | 0.5 | 1.1 |
ECOFFs: epidemiological cut‐off values; EUCAST: European Committee on Antimicrobial Susceptibility Testing; N: number of isolates tested; MSs: Member States; GEN: gentamicin; CHL: chloramphenicol; AMP: ampicillin; CTX: cefotaxime; CAZ: Ceftazidime; MEM: meropenem; TGC: tigecycline; NAL: nalidixic acid; CIP: ciprofloxacin; AZM: azithromycin; COL: colistin; SMX: sulfamethoxazole; TMP: trimethoprim; TET: tetracycline.
The occurrence of resistance is assessed on less than 10 isolates and should only be considered as part of the total from all MSs data.
Multidrug resistance and complete susceptibility in S. Enteritidis from broiler flocks
Among the S. Enteritidis isolates from broiler flocks tested in 2016, from 36.2% to 100% of the isolates were completely susceptible to the panel of antimicrobials tested. The overall rate of completely susceptible isolates equalled 71.2%, whereas multidrug resistance was assessed at 1.1% (12 MSs, N = 182) (Figure 41) (Table COMENTERBR).
Figure 41.
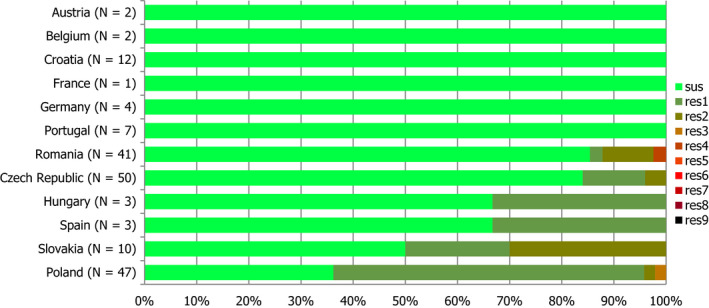
Frequency distribution of completely susceptible isolates and resistant isolates to one to nine antimicrobials classes in Salmonella Enteritidis from broilers in MSs in 2016
- N: total number of isolates tested for susceptibility against the whole common antimicrobial set for Salmonella; sus: susceptible to all antimicrobial classes of the common set for Salmonella; res1–res8: resistance to one antimicrobial classes/resistance to eight antimicrobial classes of the common set for Salmonella.
Spatial distribution of resistance in S. Enteritidis from broiler flocks
The highest proportions of resistance to ciprofloxacin in S. Enteritidis isolates from broiler flocks were reported by eastern European countries, whereas northern and central European countries reported lower levels or did not detect ciprofloxacin resistance in the few S. Enteritidis isolates (n < 10) tested for susceptibility. The proportions of ciprofloxacin resistance were markedly higher in some countries in eastern Europe (Poland and Slovakia) (Figure 42).
Figure 42.
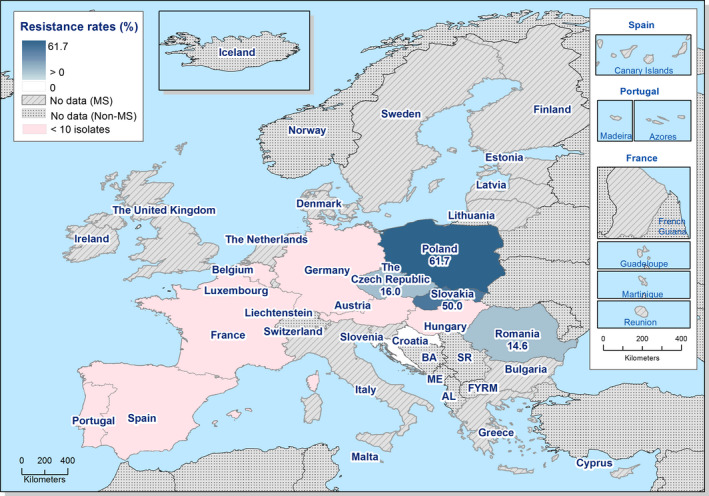
Spatial distribution of ciprofloxacin resistance among Salmonella Enteritidis from broiler flocks, using harmonised ECOFFs, 12 EU MSs, 2016
Combined resistance to ciprofloxacin and cefotaxime in S. Enteritidis from broiler flocks
‘Microbiological’ and ‘clinical’ co‐resistance to ciprofloxacin and cefotaxime was not detected in any of the reporting countries, as none of the reporting countries detected resistance to cefotaxime. (Table COMENTERBR).
Resistance in S. Kentucky isolates from broiler flocks
Resistance levels in S. Kentucky isolates from broiler flocks
S. Kentucky was the fourth most frequently reported serovar in broiler flocks, accounting for 4.6% of the Salmonella isolates serotyped (N = 79) (Table SERBRD). In S. Kentucky isolates from broiler flocks (8 MSs, Table 20), the overall levels of resistance to all the antimicrobial tested were higher than in Salmonella spp. The reported levels of resistance to ampicillin, gentamicin, ciprofloxacin, nalidixic acid, sulfamethoxazole and tetracycline ranged from very high to extremely high, with overall resistance at 74.7%, 70.9%, 78.5%%, 78.5%, 81% and 67.1%, respectively, in all of the reporting countries, with the exception of Ireland for which no resistance to gentamicin, ciprofloxacin, nalidixic acid and tetracycline was recorded and a moderate level of resistance to ampicillin and sulfamethoxazole was registered (20% for both substances). Resistance to colistin was recorded only in one MS, Romania (33.3%). Resistance to cefotaxime and trimethoprim was reported at low levels only by Malta, whereas resistance to chloramphenicol, ceftazidime, meropenem, tigecycline and azithromycin was not detected by any of the MSs reporting data in 2016.
Table 20.
Occurrence of resistance (%) to selected antimicrobials in Salmonella Kentucky from flocks of broilers, using harmonised ECOFFs, 8 EU MSs, 2016
| Country | N | GEN | CHL | AMP | CTX | CAZ | MEM | TGC | NAL | CIP | AZM | COL | SMX | TMP | TET |
|---|---|---|---|---|---|---|---|---|---|---|---|---|---|---|---|
| Cyprusa | 1 | 100 | 0 | 100 | 0 | 0 | 0 | 0 | 100 | 100 | 0 | 0 | 100 | 0 | 100 |
| Czech Republica | 4 | 100 | 0 | 100 | 0 | 0 | 0 | 0 | 100 | 100 | 0 | 0 | 100 | 0 | 100 |
| Irelanda | 5 | 0 | 0 | 20 | 0 | 0 | 0 | 0 | 0 | 0 | 0 | 0 | 20 | 0 | 0 |
| Malta | 36 | 61.1 | 0 | 72.2 | 2.8 | 0 | 0 | 0 | 69.4 | 69.4 | 0 | 0 | 77.8 | 2.8 | 61.1 |
| Portugala | 1 | 100 | 0 | 100 | 0 | 0 | 0 | 0 | 100 | 100 | 0 | 0 | 100 | 0 | 100 |
| Romania | 12 | 91.7 | 0 | 91.7 | 0 | 0 | 0 | 0 | 100 | 100 | 0 | 33.3 | 100 | 0 | 100 |
| Spain | 19 | 84.2 | 0 | 73.7 | 0 | 0 | 0 | 0 | 94.7 | 94.7 | 0 | 0 | 84.2 | 0 | 63.2 |
| United Kingdoma | 1 | 100 | 0 | 100 | 0 | 0 | 0 | 0 | 100 | 100 | 0 | 0 | 100 | 0 | 100 |
| Total (8 MSs) | 79 | 70.9 | 0 | 74.7 | 1.3 | 0 | 0 | 0 | 78.5 | 78.5 | 0 | 5.1 | 81 | 1.3 | 67.1 |
ECOFFs: epidemiological cut‐off values; EUCAST: European Committee on Antimicrobial Susceptibility Testing; N: number of isolates tested; MSs: Member States; GEN: gentamicin; CHL: chloramphenicol; AMP: ampicillin; CTX: cefotaxime; CAZ: Ceftazidime; MEM: meropenem; TGC: tigecycline; NAL: nalidixic acid; CIP: ciprofloxacin; AZM: azithromycin; COL: colistin; SMX: sulfamethoxazole; TMP: trimethoprim; TET: tetracycline.
The occurrence of resistance is assessed on less than 10 isolates and should only be considered as part of the total from all MSs data.
Multidrug resistance and complete susceptibility in S. Kentucky isolates from broiler flocks
In S. Kentucky isolates from broiler flocks (8 MSs, N = 79) from 63.9% to 100% of the isolates included in the MDR analysis were multiresistant and the multidrug resistance was assessed at 73.4%. The proportion of completely susceptible isolates equalled 10.1%, varying between 5.3% in Spain and 60% in Ireland (Figure 43, Table COMKENBR).
Figure 43.
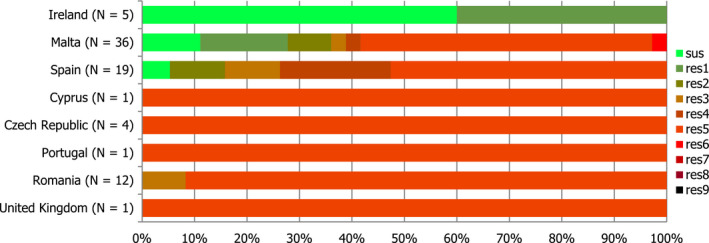
Frequency distribution of completely susceptible isolates and resistant isolates to one to nine antimicrobials classes in Salmonella Kentucky from broilers in MSs in 2016
- N: total number of isolates tested for susceptibility against the whole common antimicrobial set for Salmonella; sus: susceptible to all antimicrobial classes of the common set for Salmonella; res1–res7: resistance to one antimicrobial classes/resistance to seven antimicrobial classes of the common set for Salmonella.
Spatial distribution of resistance in S. Kentucky from broiler flocks
The levels of resistance to ciprofloxacin in S. Kentucky isolates from broiler flocks (Figure 44) ranged from very high (> 50.0–70%) to extremely high (> 70.0%) in all of the reporting countries, whereas resistance to cefotaxime was detected only by one MS at low level (2.8%).
Figure 44.
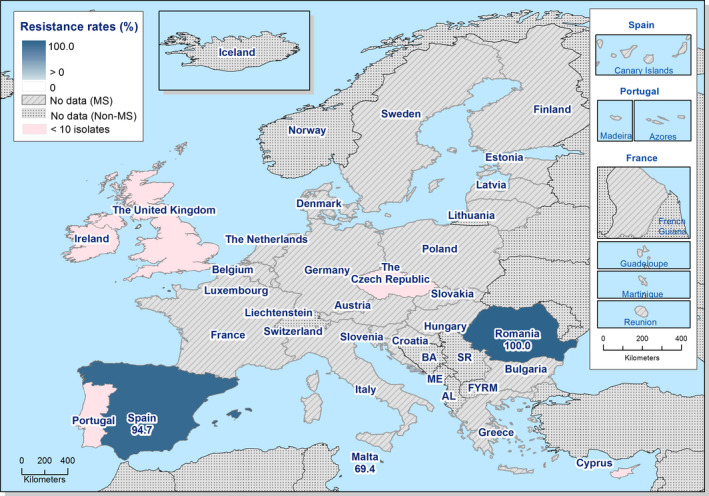
Spatial distribution of ciprofloxacin resistance among Salmonella Kentucky from broilers, using harmonised ECOFFs, 8 EU MSs, 2016
Combined resistance to ciprofloxacin and cefotaxime in S. Kentucky from broiler flocks
‘Microbiological’ and clinical combined resistance to ciprofloxacin and cefotaxime was only detected in one isolate from Malta at low level (2.8%), corresponding to the overall level of 1.3% (N = 79). When the resistance to ciprofloxacin and cefotaxime was interpreted using CBPs, again only one isolate displayed ‘clinical’ resistance (2.8%), equalling overall 1.3% (Table COMKENBR).
Resistance in S. Typhimurium from broiler flocks
Resistance levels in S. Typhimurium from broiler flocks
S. Typhimurium was the sixth most frequently reported serovar in broiler flocks, accounting for 3.3% of the Salmonella isolates serotyped (N = 56) (Table SERBRD). In S. Typhimurium isolates from broilers (12 MSs and 1 non‐MS, Table 21), resistance to most commonly used antimicrobials ampicillin, sulfamethoxazole and tetracycline, nalidixic acid and ciprofloxacin was generally high and equalled to 48.2%, 39.3% and 37.5%, respectively. The levels of resistance to nalidixic acid and ciprofloxacin showed marked variations between reporting countries, from none to extremely high and overall were at moderate levels (19.6% and 21.4%), respectively. Trimethoprim resistance was detected in two MSs (Belgium and Slovakia) at high levels, whereas chloramphenicol resistance was detected in four MSs and ranged from moderate to extremely high levels (15.4–100%). Resistance to cefotaxime and ceftazidime were only detected in one isolate in Slovakia. Resistance to azithromycin was only detected in one isolate in Portugal and Slovakia. Resistance to gentamicin was detected at low level in Spain (7.7%) and at a high level in Slovakia (50%). Meropenem, tigecycline and colistin resistance were not detected in any of the reporting countries.
Table 21.
Occurrence of resistance (%) to selected antimicrobials in Salmonella Typhimurium from flocks of broilers, using harmonised ECOFFs, 12 EU MSs, 2016
| Country | N | GEN | CHL | AMP | CTX | CAZ | MEM | TGC | NAL | CIP | AZM | COL | SMX | TMP | TET |
|---|---|---|---|---|---|---|---|---|---|---|---|---|---|---|---|
| Austriaa | 5 | 0 | 0 | 0 | 0 | 0 | 0 | 0 | 0 | 0 | 0 | 0 | 0 | 0 | 0 |
| Belgium | 22 | 0 | 18.2 | 77.3 | 0 | 0 | 0 | 0 | 27.3 | 27.3 | 0 | 0 | 59.1 | 54.5 | 50 |
| Croatiaa | 5 | 0 | 0 | 0 | 0 | 0 | 0 | 0 | 0 | 0 | 0 | 0 | 0 | 0 | 0 |
| Czech Republica | 2 | 0 | 0 | 0 | 0 | 0 | 0 | 0 | 50 | 50 | 0 | 0 | 0 | 0 | 0 |
| Denmarka | 1 | 0 | 0 | 0 | 0 | 0 | 0 | 0 | 0 | 0 | 0 | 0 | 0 | 0 | 0 |
| Francea | 1 | 0 | 100 | 100 | 0 | 0 | 0 | 0 | 100 | 100 | 0 | 0 | 100 | 0 | 100 |
| Hungarya | 1 | 0 | 0 | 0 | 0 | 0 | 0 | 0 | 0 | 0 | 0 | 0 | 0 | 0 | 0 |
| Irelanda | 1 | 0 | 0 | 0 | 0 | 0 | 0 | 0 | 0 | 0 | 0 | 0 | 0 | 0 | 0 |
| Italya | 1 | 0 | 0 | 0 | 0 | 0 | 0 | 0 | 0 | 0 | 0 | 0 | 0 | 0 | 0 |
| Portugala | 2 | 0 | 0 | 50 | 0 | 0 | 0 | 0 | 0 | 50 | 50 | 0 | 50 | 0 | 50 |
| Slovakiaa | 2 | 50 | 50 | 50 | 50 | 50 | 0 | 0 | 50 | 50 | 50 | 0 | 50 | 50 | 50 |
| Spaina | 13 | 7.7 | 15.4 | 53.8 | 0 | 0 | 0 | 0 | 15.4 | 15.4 | 0 | 0 | 46.2 | 0 | 53.8 |
| Total (12 MSs) | 56 | 3.6 | 14.3 | 48.2 | 1.8 | 1.8 | 0 | 0 | 19.6 | 21.4 | 3.6 | 0 | 39.3 | 23.2 | 37.5 |
| Norway | 1 | 0 | 0 | 0 | 0 | 0 | 0 | 0 | 0 | 0 | 0 | 0 | 0 | 0 | 0 |
ECOFFs: epidemiological cut‐off values; EUCAST: European Committee on Antimicrobial Susceptibility Testing; N: number of isolates tested; MSs: Member States; GEN: gentamicin; CHL: chloramphenicol; AMP: ampicillin; CTX: cefotaxime; CAZ: Ceftazidime; MEM: meropenem; TGC: tigecycline; NAL: nalidixic acid; CIP: ciprofloxacin; AZM: azithromycin; COL: colistin; SMX: sulfamethoxazole; TMP: trimethoprim; TET: tetracycline.
The occurrence of resistance is assessed on less than 10 isolates and should only be considered as part of the total from all MSs data.
Multidrug resistance in S. Typhimurium isolates from broiler flocks
In S. Typhimurium isolates from broiler flocks (12 MSs, N = 56) from 9.1% to 100% of the isolates included in the MDR analysis were complete susceptible to all the antimicrobials tested (Table COMTYPHIBR). ‘Microbiological’ combined resistance to ciprofloxacin and cefotaxime was detected only in one isolate in one country (50%) (Table COMTYPHIBR) and ‘clinical’ combined resistance was not detected by any of the reporting countries.
Resistance in monophasic S. Typhimurium from broiler flocks
Resistance levels in monophasic S. Typhimurium from broiler flocks
Monophasic S. Typhimurium was the ninth most frequently reported serovar in broiler flocks, accounting for 2.2%, of the Salmonella isolates serotyped (N = 42) (Table SERBRD). Among Monophasic S. Typhimurium isolates from broiler flocks (7 MSs, Table 22), the overall resistance to nalidixic acid and ciprofloxacin was equalled at 7.1% and 11.9%, respectively. Resistance to commonly used antimicrobials ampicillin, sulfamethoxazole and tetracycline were reported at extremely high levels by most of the reporting countries and overall equalled at 57.1%, 61.9% and 90.5%, respectively. Chloramphenicol and trimethoprim resistance were generally moderate (overall resistance at 19% and 11.9%, respectively) although high levels were also observed (the United kingdom) and three MSs did not register any resistance to chloramphenicol and three MSs did not register any resistance to trimethoprim. Azithromycin and colistin resistance were only detected in Germany at high levels, whereas cefotaxime and ceftazidime resistance were only reported by Portugal at moderate levels. Resistance to meropenem and tigecycline were not detected in any of the reporting countries.
Table 22.
Occurrence of resistance (%) to selected antimicrobials in monophasic S. Typhimurium from flocks of broilers in 2016, using harmonised ECOFFs, 7 EU MSs, 2016
| Country | N | GEN | CHL | AMP | CTX | CAZ | MEM | TGC | NAL | CIP | AZM | COL | SMX | TMP | TET |
|---|---|---|---|---|---|---|---|---|---|---|---|---|---|---|---|
| Belgiuma | 6 | 0 | 0 | 100 | 0 | 0 | 0 | 0 | 0 | 0 | 0 | 0 | 100 | 16.7 | 100 |
| Denmark | 15 | 0 | 0 | 6.7 | 0 | 0 | 0 | 0 | 0 | 0 | 0 | 0 | 13.3 | 0 | 100 |
| Germanya | 5 | 0 | 60 | 60 | 0 | 0 | 0 | 0 | 60 | 60 | 40 | 20 | 60 | 0 | 60 |
| Maltaa | 5 | 0 | 40 | 80 | 0 | 0 | 0 | 0 | 0 | 0 | 0 | 0 | 100 | 20 | 100 |
| Portugala | 6 | 0 | 33.3 | 100 | 16.7 | 16.7 | 0 | 0 | 0 | 33.3 | 0 | 0 | 100 | 33.3 | 100 |
| Spaina | 4 | 0 | 0 | 75 | 0 | 0 | 0 | 0 | 0 | 0 | 0 | 0 | 75 | 0 | 50 |
| United Kingdoma | 1 | 100 | 100 | 100 | 0 | 0 | 0 | 0 | 0 | 0 | 0 | 0 | 100 | 100 | 100 |
| Total (7 MSs) | 42 | 2.4 | 19 | 57.1 | 2.4 | 2.4 | 0 | 0 | 7.1 | 11.9 | 4.8 | 2.4 | 61.9 | 11.9 | 90.5 |
ECOFFs: epidemiological cut‐off values; EUCAST: European Committee on Antimicrobial Susceptibility Testing; N: number of isolates tested; MSs: Member States; GEN: gentamicin; CHL: chloramphenicol; AMP: ampicillin; CTX: cefotaxime; CAZ: Ceftazidime; MEM: meropenem; TGC: tigecycline; NAL: nalidixic acid; CIP: ciprofloxacin; AZM: azithromycin; COL: colistin; SMX: sulfamethoxazole; TMP: trimethoprim; TET: tetracycline.
The occurrence of resistance is assessed on less than 10 isolates and should only be considered as part of the total from all MSs data.
Multidrug resistance in monophasic S. Typhimurium isolates from broiler flocks
Seven reporting countries reported data for individual isolates, which were addressed in the MDR analysis (N = 42). From 6.7% to 100% of the monophasic S. Typhimurium isolates were multiresistant. ‘Microbiological’ combined resistance to ciprofloxacin and cefotaxime was 16.7% observed in only one isolate in Portugal (Table COMMONTYPHIBR).
3.2.5. Antimicrobial resistance in Salmonella spp. from flocks of laying hens
Resistance levels in Salmonella spp. from laying hen flocks
In 2016, 22 MSs and 1 non‐MS reported data on isolates of Salmonella spp. from flocks of laying hens according to the provisions of Decision 2013/652/EU (Table 23).
Table 23.
Occurrence of resistance (%) to selected antimicrobials in Salmonella spp. from laying hen flocks, using harmonised ECOFFs, 22 EU MSs, 2016
| Country | N | GEN | CHL | AMP | CTX | CAZ | MEM | TGC | NAL | CIP | AZM | COL | SMX | TMP | TET |
|---|---|---|---|---|---|---|---|---|---|---|---|---|---|---|---|
| Austria | 46 | 0 | 0 | 0 | 0 | 0 | 0 | 0 | 6.5 | 6.5 | 0 | 0 | 4.3 | 0 | 13 |
| Belgium | 39 | 0 | 0 | 0 | 0 | 0 | 0 | 0 | 0 | 0 | 0 | 0 | 0 | 0 | 0 |
| Bulgaria | 11 | 0 | 0 | 18.2 | 0 | 0 | 0 | 0 | 90.9 | 90.9 | 0 | 0 | 36.4 | 18.2 | 9.1 |
| Croatia | 44 | 0 | 0 | 0 | 0 | 0 | 0 | 0 | 18.2 | 18.2 | 0 | 0 | 0 | 0 | 0 |
| Cyprus | 10 | 20 | 0 | 10 | 0 | 0 | 0 | 0 | 20 | 20 | 0 | 0 | 20 | 10 | 10 |
| Czech Republica | 9 | 0 | 0 | 11.1 | 0 | 0 | 0 | 0 | 11.1 | 11.1 | 0 | 0 | 11.1 | 0 | 11.1 |
| Denmarka | 3 | 0 | 0 | 66.7 | 0 | 0 | 0 | 0 | 0 | 0 | 0 | 33.3 | 66.7 | 0 | 66.7 |
| Estoniaa | 3 | 0 | 0 | 0 | 0 | 0 | 0 | 0 | 33.3 | 33.3 | 0 | 0 | 0 | 0 | 0 |
| France | 92 | 0 | 0 | 4.3 | 0 | 0 | 0 | 0 | 1.1 | 1.1 | 0 | 1.1 | 4.3 | 1.1 | 9.8 |
| Germany | 95 | 1.1 | 2.1 | 7.4 | 0 | 0 | 0 | 0 | 7.4 | 7.4 | 0 | 31.6 | 10.5 | 0 | 7.4 |
| Greece | 59 | 0 | 0 | 0 | 0 | 0 | 0 | 0 | 8.5 | 11.9 | 1.7 | 3.4 | 6.8 | 0 | 5.1 |
| Hungary | 91 | 2.2 | 0 | 6.6 | 0 | 0 | 0 | 1.1 | 17.6 | 22 | 2.2 | 6.6 | 8.8 | 0 | 11 |
| Irelanda | 1 | 0 | 0 | 0 | 0 | 0 | 0 | 0 | 0 | 0 | 0 | 0 | 0 | 0 | 0 |
| Italy | 125 | 0 | 4 | 6.4 | 0 | 0 | 0 | 0 | 48.8 | 49.6 | 0 | 7.2 | 14.4 | 6.4 | 12.8 |
| Latviaa | 2 | 0 | 0 | 0 | 0 | 0 | 0 | 0 | 0 | 0 | 0 | 100 | 0 | 0 | 0 |
| Malta | 52 | 1.9 | 0 | 3.8 | 1.9 | 0 | 0 | 0 | 3.8 | 3.8 | 0 | 0 | 53.8 | 13.5 | 3.8 |
| Poland | 213 | 0 | 0 | 0.5 | 0 | 0 | 0 | 0 | 14.6 | 14.6 | 0 | 3.8 | 6.6 | 0.5 | 5.2 |
| Portugal | 74 | 2.7 | 0 | 1.4 | 0 | 0 | 0 | 0 | 9.5 | 12.2 | 1.4 | 2.7 | 1.4 | 0 | 0 |
| Romania | 36 | 0 | 0 | 2.8 | 0 | 0 | 0 | 0 | 30.6 | 33.3 | 0 | 0 | 8.3 | 0 | 8.3 |
| Sloveniaa | 8 | 0 | 0 | 0 | 0 | 0 | 0 | 0 | 12.5 | 12.5 | 0 | 0 | 12.5 | 0 | 12.5 |
| Spain | 169 | 0.6 | 1.8 | 7.1 | 0 | 0 | 0 | 1.2 | 15.4 | 17.8 | 0 | 5.3 | 5.9 | 2.4 | 14.8 |
| United Kingdom | 34 | 0 | 0 | 5.9 | 0 | 0 | 0 | 0 | 2.9 | 8.8 | 0 | 0 | 11.8 | 2.9 | 5.9 |
| Total (22 MSs) | 1216 | 0.7 | 0.8 | 4.1 | 0.1 | 0 | 0 | 0.2 | 16 | 17.3 | 0.3 | 5.8 | 9.5 | 2.1 | 8.2 |
| Norwaya | 1 | 0 | 0 | 0 | 0 | 0 | 0 | 0 | 0 | 0 | 0 | 0 | 0 | 0 | 0 |
ECOFFs: epidemiological cut‐off values; EUCAST: European Committee on Antimicrobial Susceptibility Testing; N: number of isolates tested; MSs: Member States; GEN: gentamicin; CHL: chloramphenicol; AMP: ampicillin; CTX: cefotaxime; CAZ: Ceftazidime; MEM: meropenem; TGC: tigecycline, NAL: nalidixic acid; CIP: ciprofloxacin; AZM: azithromycin; COL: colistin; SMX: sulfamethoxazole; TMP: trimethoprim; TET: tetracycline.
The occurrence of resistance is assessed on less than 10 isolates and should only be considered as part of the total from all MSs data.
Overall resistance to nalidixic acid and ciprofloxacin remained at moderate level equalled 16% and 17.3%, respectively, although high level of resistance was registered in two MSs and extremely high level of resistance was recorded in one MS. The reported levels of resistance to sulfamethoxazole and tetracycline ranged from low to very high (1.4–66.7%) in Salmonella spp. from flocks of laying hens in most of the reporting MSs, whereas no resistance to sulfamethoxazole and tetracycline was recorded in Belgium, Croatia and Estonia. Resistance to ampicillin and colistin were generally from very low to moderate in most reporting MSs (0.5–18.2%). Nine and 12 reporting countries did not register any resistance to ampicillin and colistin, respectively, whereas the remaining countries registered resistance to ampicillin and colistin from low to moderate levels. Resistance to trimethoprim was generally low in most reporting MSs (overall resistance at 2.9%), although moderate levels were also observed in two MSs (Bulgaria and Malta), and fourteen MSs did not register any resistance. Resistance to gentamicin, chloramphenicol, tigecycline and azithromycin was generally either no detected or reported at very low levels by most MSs, for which overall resistance equalled 0.7%, 0.8%, 0.2% and 0.3%, respectively. Cefotaxime resistance was reported only by Malta with a low level at 1.2%. Ceftazidime and meropenem resistance were not recorded in any of the reporting countries. Compared with the isolates from broilers, in general lower levels of resistance were reported in Salmonella spp. from laying hens.
Spatial distribution of resistance in Salmonella spp. from laying hen flocks
The spatial distributions of ciprofloxacin resistance in 1,217 isolates from laying hen flocks (Figure 45) show that the highest levels of resistance to this substance were reported by Bulgaria, followed by Italy, Estonia and Romania which reported high resistance levels of ciprofloxacin. Western and northern European countries tended to report lower resistance levels or no resistance detected, whereas three southern countries and two eastern countries reported moderate resistance. The resistance to cefotaxime was reported by only one country (Malta), with a low level (Figure 45).
Figure 45.
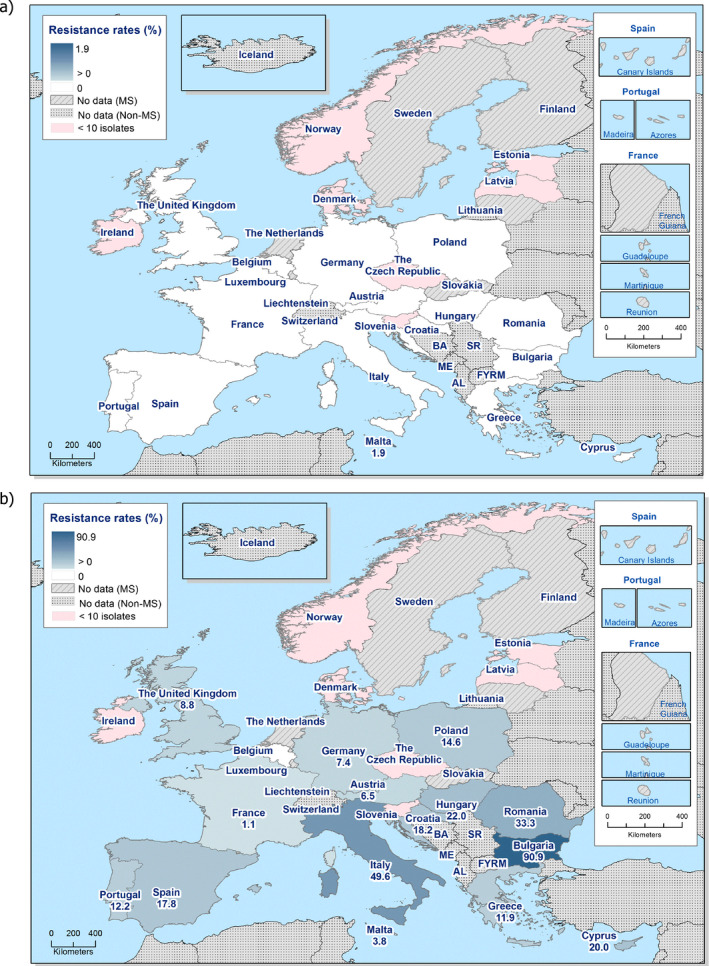
Spatial distribution of cefotaxime (a) and ciprofloxacin (b) resistance in Salmonella spp. from laying hen flocks, 23 EU/EEA MSs, 2016
Combined resistance to ciprofloxacin and cefotaxime in Salmonella spp. from laying hen flocks
‘Microbiological’ combined resistance to ciprofloxacin and cefotaxime in Salmonella spp. from laying hen flocks was detected only in one isolate from Malta (1.9%), corresponding to the overall level of 0.08%, whereas ‘clinical’ combined resistance to ciprofloxacin and cefotaxime in Salmonella spp. from laying hen flocks was not reported by any of the reporting countries (Table COMSALMLAY).
Figure 46.
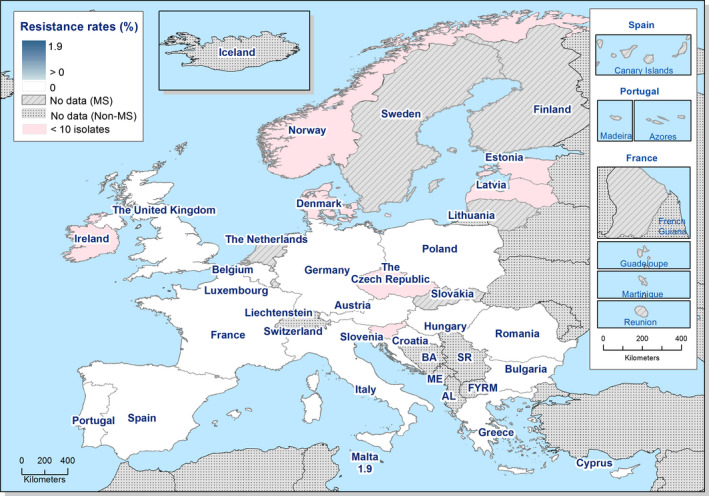
Spatial distribution of co‐resistance to cefotaxime and ciprofloxacin resistance in Salmonella spp. from laying hen flocks, 23 EU/EEA MSs, 2016
Multidrug resistance and complete susceptibility in Salmonella spp. from laying hen flocks
Twenty‐three reporting countries reported data for individual isolates, which were addressed in the MDR analysis (N = 1,217). Multidrug resistance was assessed at 6.6% and the rate of complete susceptibility equalled 75.6% at the overall level, with marked variations between reporting MSs in both cases. From 2.9% to 66.3% of the Salmonella spp. isolates were multiresistant, whereas the proportion of completely susceptible isolates varied from 9.1% to 100% (Figure 47).
Figure 47.
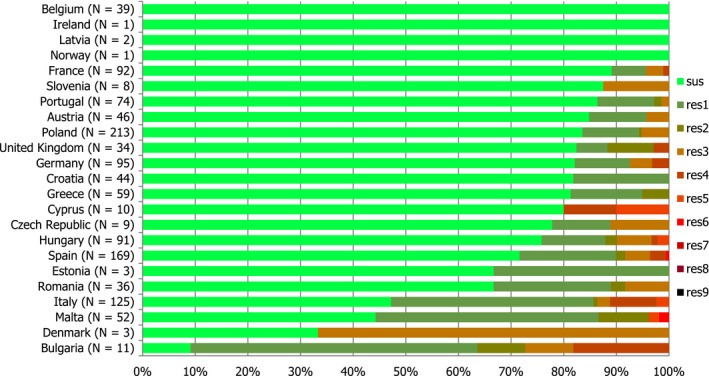
Frequency distribution of completely susceptible isolates and resistant isolates to one to nine antimicrobials classes in Salmonella spp. from laying hen flocks, EU MSs, 2016
- N: total number of isolates tested for susceptibility against the whole common antimicrobial set for Salmonella; sus: susceptible to all antimicrobial classes of the common set for Salmonella; res1–res9: resistance to one antimicrobial classes/resistance to nine antimicrobial classes of the common set for Salmonella.
Spatial distribution of complete susceptibility in Salmonella spp. from laying hen flocks
The spatial distribution of complete susceptibility to the panel of antimicrobial substances tested in Salmonella spp. from laying hen flocks in 2016 is shown in Figure 48. The susceptibility to each individual antimicrobial was determined using ECOFFs; all isolates were tested against the same mandatory panel of antimicrobials. As in previous years, most of the reporting countries, registered in general high percentages of complete susceptibility to all the antimicrobials tested. The highest levels were shown by isolates from France, Slovenia and Portugal, and the levels of complete susceptibility globally decrease in a north to south gradient.
Figure 48.
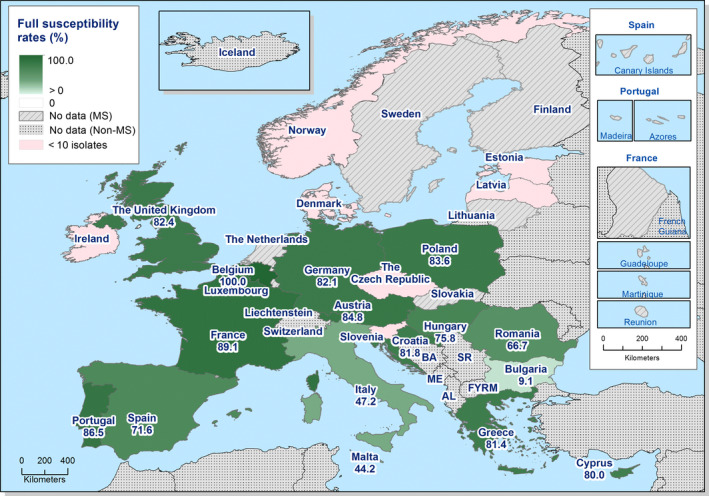
Spatial distribution of complete susceptibility to the panel of antimicrobials tested among Salmonella spp. from laying hen flocks, using harmonised ECOFFs, 23 EU/EEA MSs, 2016
Temporal trends in resistance among Salmonella spp. from laying hens
Nine MSs provided resistance data on 4 years or more to be included in the statistical analysis. Over the 8 years of data, levels of resistance to cefotaxime remained mostly constant for most of the reporting MSs. Resistance to cefotaxime is generally very low and a statistically significant decreasing trend was observed in two MSs (Figure 49). Within each MS, similar levels of resistance to ciprofloxacin and nalidixic acid were observed from 2008 to 2016, although slight differences occurred in two MSs. Tetracycline resistance exceeded ampicillin resistance in many MSs and, although tetracycline resistance showed some fluctuations, ampicillin resistance tended to show parallel fluctuations.
Figure 49.
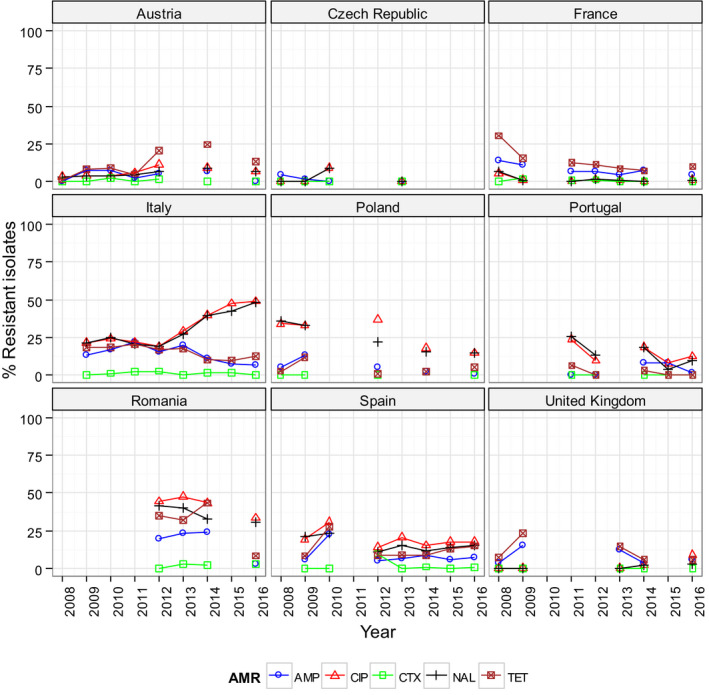
Trends in ampicillin (AMP), cefotaxime (CTX), ciprofloxacin (CIP), nalidixic acid (NAL) and tetracycline (TET) resistance in tested Salmonella spp. from laying hens, EU MSs, 2008–2016
-
Statistical significance of trends over 4‐5 or more years was tested by a logistic regression model (p ≤ 0.05). Statistically significant increasing trends were observed for ampicillin in Romania, for ciprofloxacin in the United Kingdom, for ciprofloxacin and nalidixic acid in Italy and Romania, as well as for tetracycline in Austria.Statistically significant decreasing trends were observed for ampicillin in France, Greece, Italy, Poland and Spain, for ciprofloxacin and nalidixic acid in France, Greece, Poland and Spain, for cefotaxime in Italy and Spain, for nalidixic acid in Portugal, as well as for tetracycline in France, Greece, Italy, Portugal and Romania.
As AMR is associated with particular serovars or clones within serovars, fluctuations in the occurrence of resistance in Salmonella spp. isolates within a country may be the result of changes in the proportions of different Salmonella serovars which contribute to the total numbers of Salmonella spp. isolates.
3.2.6. Antimicrobial resistance in Salmonella serovars from laying hen flocks
Distribution of Salmonella serovars in laying hen flocks
Among the representative Salmonella spp. isolates from laying hen flocks tested for susceptibility for which serovar information was provided (N = 1,194), the most common serovars detected (Figure 50, Table SERLAYD) were S. Enteritidis (18 MSs, 33.1%), S. Infantis, (18 MSs, 9.1%), S. Kentucky (9 MSs, 6.4%), S. Mbandaka (12 MSs, 6.0%) and S. Typhimurium (11 MSs, 4.4%). Typically, resistance and MDR levels in S. Enteritidis were much lower than those recorded in S. Infantis, S. Kentucky and more generally, Salmonella spp.
Figure 50.
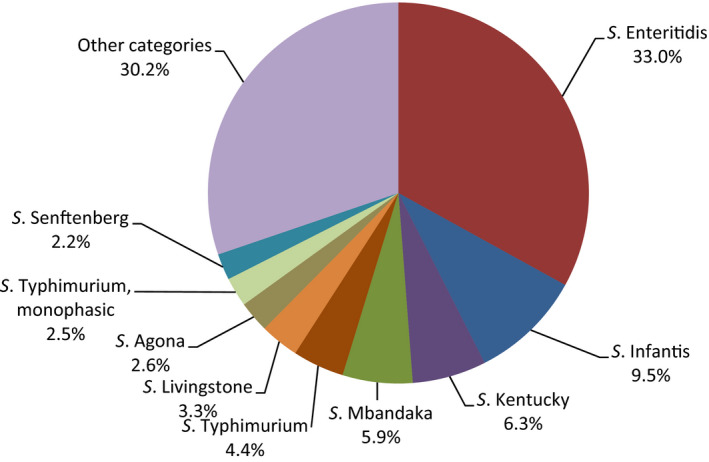
Breakdown of serovars among Salmonella isolates from laying hen flocks tested for susceptibility, EU MSs, 2016. (N = 1,194)
Resistance in S. Enteritidis from laying hen flocks
Resistance levels in S. Enteritidis from laying hen flocks
S. Enteritidis was the first most frequently reported serovars in laying hen flocks, accounting for 33.0% of the Salmonella isolates serotyped (N = 400) (Table SERLAYD). In S. Enteritidis isolates from laying hens (18 MSs, Table 24), resistance to nalidixic acid, ciprofloxacin and colistin varied considerably from none to extremely high and overall was at moderate levels (16%, 16.5% and 15.8%, respectively). Resistance to gentamicin, trimethoprim and tetracycline were detected only in two MSs and at low levels, with the exception of Italy for which the resistance to tetracycline was high. Resistance to sulfamethoxazole was registered by five MSs and ranged from 3.2% to 50%. Resistance to chloramphenicol, cefotaxime, ceftazidime, meropenem, tigecycline, and azithromycin were not detected in any of the reporting countries in S. Enteritidis. It is notable that isolates from Poland and Germany comprised 47% of the S. Derby isolates.
Table 24.
Occurrence of resistance (%) to selected antimicrobials in Salmonella Enteritidis from laying hen flocks, using harmonised ECOFFs, EU MSs, 2016
| Country | N | GEN | CHL | AMP | CTX | CAZ | MEM | TGC | NAL | CIP | AZM | COL | SMX | TMP | TET |
|---|---|---|---|---|---|---|---|---|---|---|---|---|---|---|---|
| Austria | 10 | 0 | 0 | 0 | 0 | 0 | 0 | 0 | 10 | 10 | 0 | 0 | 0 | 0 | 0 |
| Belgium | 17 | 0 | 0 | 0 | 0 | 0 | 0 | 0 | 0 | 0 | 0 | 0 | 0 | 0 | 0 |
| Bulgariaa | 6 | 0 | 0 | 0 | 0 | 0 | 0 | 0 | 100 | 100 | 0 | 0 | 16.7 | 0 | 0 |
| Croatia | 18 | 0 | 0 | 0 | 0 | 0 | 0 | 0 | 0 | 0 | 0 | 0 | 0 | 0 | 0 |
| Czech Republica | 7 | 0 | 0 | 14.3 | 0 | 0 | 0 | 0 | 0 | 0 | 0 | 0 | 0 | 0 | 0 |
| Estoniaa | 2 | 0 | 0 | 0 | 0 | 0 | 0 | 0 | 50 | 50 | 0 | 0 | 0 | 0 | 0 |
| France | 28 | 0 | 0 | 0 | 0 | 0 | 0 | 0 | 3.6 | 3.6 | 0 | 3.6 | 0 | 0 | 0 |
| Germany | 54 | 1.9 | 0 | 3.7 | 0 | 0 | 0 | 0 | 11.1 | 11.1 | 0 | 51.9 | 3.7 | 0 | 0 |
| Greecea | 6 | 0 | 0 | 0 | 0 | 0 | 0 | 0 | 0 | 0 | 0 | 0 | 0 | 0 | 0 |
| Hungary | 33 | 0 | 0 | 0 | 0 | 0 | 0 | 0 | 3 | 3 | 0 | 18.2 | 0 | 0 | 0 |
| Italy | 14 | 0 | 0 | 14.3 | 0 | 0 | 0 | 0 | 42.9 | 57.1 | 0 | 57.1 | 21.4 | 7.1 | 21.4 |
| Latviaa | 2 | 0 | 0 | 0 | 0 | 0 | 0 | 0 | 0 | 0 | 0 | 100 | 0 | 0 | 0 |
| Poland | 134 | 0 | 0 | 0 | 0 | 0 | 0 | 0 | 14.2 | 14.2 | 0 | 6 | 1.5 | 0 | 0 |
| Portugal | 22 | 4.5 | 0 | 4.5 | 0 | 0 | 0 | 0 | 22.7 | 22.7 | 0 | 4.5 | 0 | 0 | 0 |
| Romania | 11 | 0 | 0 | 0 | 0 | 0 | 0 | 0 | 36.4 | 36.4 | 0 | 0 | 0 | 0 | 0 |
| Sloveniaa | 3 | 0 | 0 | 0 | 0 | 0 | 0 | 0 | 0 | 0 | 0 | 0 | 0 | 0 | 0 |
| Spain | 31 | 0 | 0 | 0 | 0 | 0 | 0 | 0 | 45.2 | 45.2 | 0 | 25.8 | 3.2 | 3.2 | 3.2 |
| United Kingdoma | 2 | 0 | 0 | 0 | 0 | 0 | 0 | 0 | 0 | 0 | 0 | 0 | 50 | 0 | 0 |
| Total (18 MSs) | 400 | 0.5 | 0 | 1.5 | 0 | 0 | 0 | 0 | 16 | 16.5 | 0 | 15.5 | 2.5 | 0.5 | 1 |
ECOFFs: epidemiological cut‐off values; EUCAST: European Committee on Antimicrobial Susceptibility Testing; N: number of isolates tested; MSs: Member States; GEN: gentamicin; CHL: chloramphenicol; AMP: ampicillin; CTX: cefotaxime; CAZ: Ceftazidime; MEM: meropenem; TGC: tigecycline; NAL: nalidixic acid; CIP: ciprofloxacin; AZM: azithromycin; COL: colistin; SMX: sulfamethoxazole; TMP: trimethoprim; TET: tetracycline.
The occurrence of resistance is assessed on less than 10 isolates and should only be considered as part of the total from all MSs data.
Spatial distribution of resistance in S. Enteritidis from laying hen flocks
The spatial distribution of ciprofloxacin in S. Enteritidis from laying hen flocks in 2016 is shown in Figure 51. A clear geographical pattern was observed in fluoroquinolone resistance levels in S. Enteritidis isolates from laying hen flocks in 2016 (Figure 51) where the highest proportions of resistance were reported by MSs from southern and eastern Europe (Bulgaria, Italy, Estonia and Spain). Cefotaxime resistance was not detected by any MSs in S. Enteritidis isolates from laying hen flocks in 2016.
Figure 51.
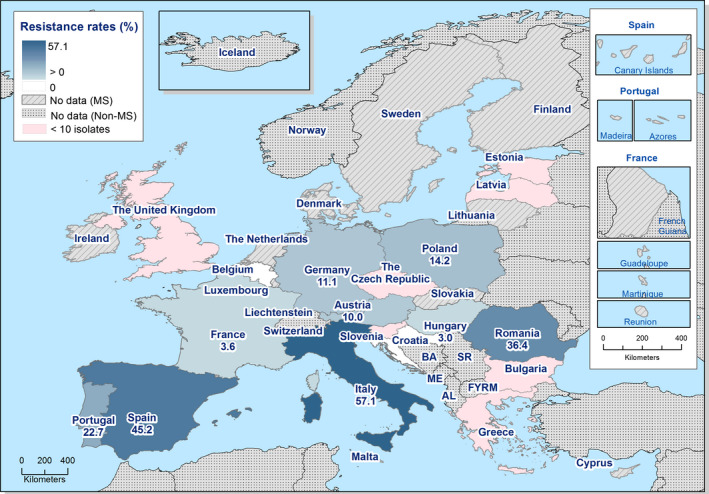
Spatial distribution of ciprofloxacin resistance among Salmonella Enteritidis from laying hen flocks, 18 EU MSs, 2016
Combined resistance to ciprofloxacin and cefotaxime in S. Enteritidis from laying hen flocks
‘Microbiological’ and ‘clinical’ combined resistance to ciprofloxacin and cefotaxime were not reported by any MSs, as cefotaxime resistance was not detected in S. Enteritidis isolates from laying hens in 2016 (Table COMENTERLAY).
Multidrug resistance and complete susceptibility in S. Enteritidis from laying hen flocks
Eighteen reporting countries reported data for individual isolates, which were addressed in the MDR analysis (N = 400). From 1.9% to 21.4% of the S. Enteritidis isolates were multiresistant, with an overall rate of MDR equalled to 1.25%, whereas the proportion of completely susceptible isolates equalled 82%, varying between 42.9% in Italy to 100% in several MSs (Figure 52).
Figure 52.
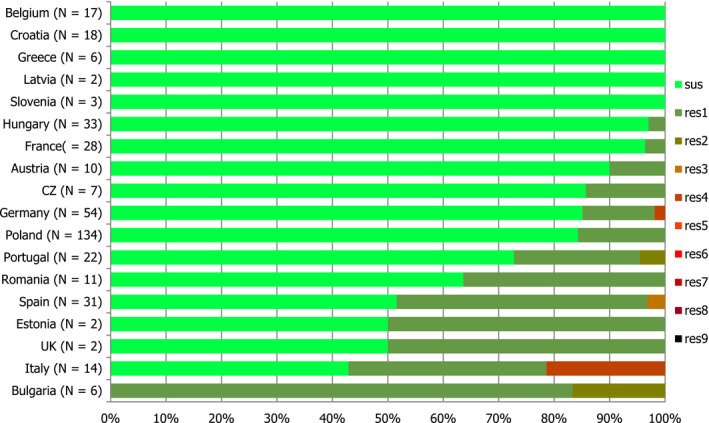
Frequency distribution of completely susceptible isolates and resistant isolates to one to nine antimicrobials classes in Salmonella Enteritidis from laying hen flocks, 18 EU MSs, 2016
- N: total number of isolates tested for susceptibility against the whole common antimicrobial set for Salmonella; CZ: the Czech Republic; UK: the United Kingdom; sus: susceptible to all antimicrobial classes of the common set for Salmonella; res1–res9: resistance to one antimicrobial classes/resistance to nine antimicrobial classes of the common set for Salmonella.
Resistance levels in S. Infantis from laying hen flocks
Resistance levels in S. Infantis from laying hen flocks
S. Infantis was the second most frequently reported serovar in laying hen flocks, accounting for 9.5% of the Salmonella spp. isolates serotyped (N = 115) (Table SERLAYD). In S. Infantis isolates from laying hen flocks (18 MSs, Table 25), the overall levels of resistance to nalidixic acid, ciprofloxacin, sulfamethoxazole and tetracycline were quite higher than in S. Enteritidis and Salmonella spp. Overall resistance to nalidixic acid, ciprofloxacin, sulfamethoxazole and tetracycline equalled to 24.3%, 25.2% 15.7% and 13%, respectively. Ampicillin, tigecycline and azithromycin resistance was reported only by Hungary at low and moderate levels. Trimethoprim resistance was detected only by Malta a high level. Gentamicin, chloramphenicol, cefotaxime, ceftazidime meropenem and colistin were not detected in any MS.
Table 25.
Occurrence of resistance (%) to selected antimicrobials in Salmonella Infantis from laying hen flocks, using harmonised ECOFFs, EU MSs, 2016
| Country | N | GEN | CHL | AMP | CTX | CAZ | MEM | TGC | NAL | CIP | AZM | COL | SMX | TMP | TET |
|---|---|---|---|---|---|---|---|---|---|---|---|---|---|---|---|
| Austriaa | 3 | 0 | 0 | 0 | 0 | 0 | 0 | 0 | 66.7 | 66.7 | 0 | 0 | 66.7 | 0 | 66.7 |
| Belgiuma | 4 | 0 | 0 | 0 | 0 | 0 | 0 | 0 | 0 | 0 | 0 | 0 | 0 | 0 | 0 |
| Bulgariaa | 1 | 0 | 0 | 0 | 0 | 0 | 0 | 0 | 100 | 100 | 0 | 0 | 100 | 0 | 100 |
| Croatiaa | 5 | 0 | 0 | 0 | 0 | 0 | 0 | 0 | 100 | 100 | 0 | 0 | 0 | 0 | 0 |
| Cyprusa | 1 | 0 | 0 | 0 | 0 | 0 | 0 | 0 | 0 | 0 | 0 | 0 | 0 | 0 | 0 |
| Czech Republica | 1 | 0 | 0 | 0 | 0 | 0 | 0 | 0 | 100 | 100 | 0 | 0 | 100 | 0 | 100 |
| Francea | 6 | 0 | 0 | 0 | 0 | 0 | 0 | 0 | 0 | 0 | 0 | 0 | 0 | 0 | 0 |
| Germanya | 2 | 0 | 0 | 0 | 0 | 0 | 0 | 0 | 50 | 50 | 0 | 0 | 50 | 0 | 50 |
| Greecea | 3 | 0 | 0 | 0 | 0 | 0 | 0 | 0 | 0 | 0 | 0 | 0 | 0 | 0 | 0 |
| Hungary | 17 | 0 | 0 | 11.8 | 0 | 0 | 0 | 5.9 | 70.6 | 70.6 | 11.8 | 0 | 29.4 | 0 | 35.3 |
| Italya | 4 | 0 | 0 | 0 | 0 | 0 | 0 | 0 | 0 | 0 | 0 | 0 | 0 | 0 | 0 |
| Malta | 10 | 0 | 0 | 0 | 0 | 0 | 0 | 0 | 0 | 0 | 0 | 0 | 40 | 20 | 0 |
| Poland | 23 | 0 | 0 | 0 | 0 | 0 | 0 | 0 | 4.3 | 4.3 | 0 | 0 | 0 | 0 | 0 |
| Portugal | 10 | 0 | 0 | 0 | 0 | 0 | 0 | 0 | 0 | 10 | 0 | 0 | 0 | 0 | 0 |
| Romaniaa | 2 | 0 | 0 | 0 | 0 | 0 | 0 | 0 | 100 | 100 | 0 | 0 | 100 | 0 | 100 |
| Sloveniaa | 1 | 0 | 0 | 0 | 0 | 0 | 0 | 0 | 100 | 100 | 0 | 0 | 100 | 0 | 100 |
| Spain | 20 | 0 | 0 | 0 | 0 | 0 | 0 | 0 | 10 | 10 | 0 | 0 | 5 | 0 | 5 |
| United Kingdoma | 2 | 0 | 0 | 0 | 0 | 0 | 0 | 0 | 0 | 0 | 0 | 0 | 0 | 0 | 0 |
| Total (18 MSs) | 115 | 0 | 0 | 1.7 | 0 | 0 | 0 | 0.9 | 24.3 | 25.2 | 1.7 | 0 | 15.7 | 1.7 | 13 |
ECOFFs: epidemiological cut‐off values; EUCAST: European Committee on Antimicrobial Susceptibility Testing; N: number of isolates tested; MSs: Member States; GEN: gentamicin; CHL: chloramphenicol; AMP: ampicillin; CTX: cefotaxime; CAZ: Ceftazidime; MEM: meropenem; TGC: tigecycline; NAL: nalidixic acid; CIP: ciprofloxacin; AZM: azithromycin; COL: colistin; SMX: sulfamethoxazole; TMP: trimethoprim; TET: tetracycline.
The occurrence of resistance is assessed on less than 10 isolates and should only be considered as part of the total from all MSs data.
Combine resistance to cefotaxime and ciprofloxacin in S. Infantis from laying hen flocks
‘Microbiological’ and ‘clinical’ combined resistance to ciprofloxacin and cefotaxime was not detected in any isolate in any reporting country as resistance to cefotaxime was absent (Table COMINFANLAY).
Multidrug resistance in S. Infantis from laying hen flocks
In S. Infantis isolates from laying hen flocks (18 MSs, N = 115) from 5% to 100% of the isolates included in the MDR analysis were multiresistant, and the multidrug resistance was assessed at 12.2%. While the proportion of completely susceptible isolates equalled 70.4%, ranging from 23.5% in Hungary to 100% in several MSs (Figure 53, Table COMINFANLAY).
Figure 53.
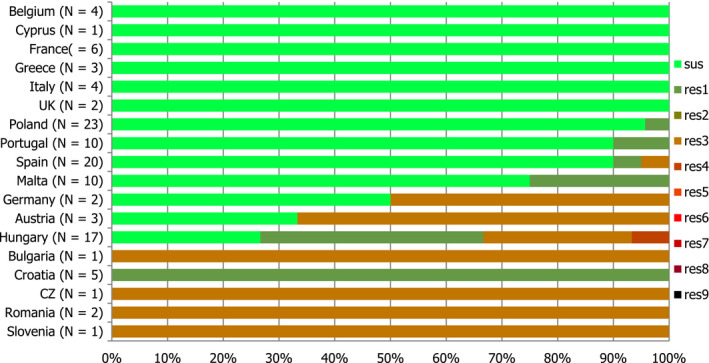
Frequency distribution of completely susceptible isolates and resistant isolates to one to nine antimicrobials classes in Salmonella Infantis from laying hens, 18 EU MSs, 2016
- N: total number of isolates tested for susceptibility against the whole common antimicrobial set for Salmonella; CZ: the Czech Republic; UK: the United Kingdom; sus: susceptible to all antimicrobial classes of the common set for Salmonella; res1–res9: resistance to one antimicrobial classes/resistance to nine antimicrobial classes of the common set for Salmonella.
Spatial distribution of resistance in S. Infantis from laying hen flocks
Ciprofloxacin resistance was reported by five MSs from eastern Europe (Bulgaria, Croatia, the Czech Republic, Hungary and Romania) and one MS from southern Europe (Slovenia) on a low number of strains. However, ciprofloxacin resistance was low in Poland, Portugal and Spain (Figure 54). The remaining reporting countries either not detected resistance to ciprofloxacin or registered resistance at very high levels (> 50.0–70.0%). Resistance to cefotaxime was not reported by any reporting country.
Figure 54.
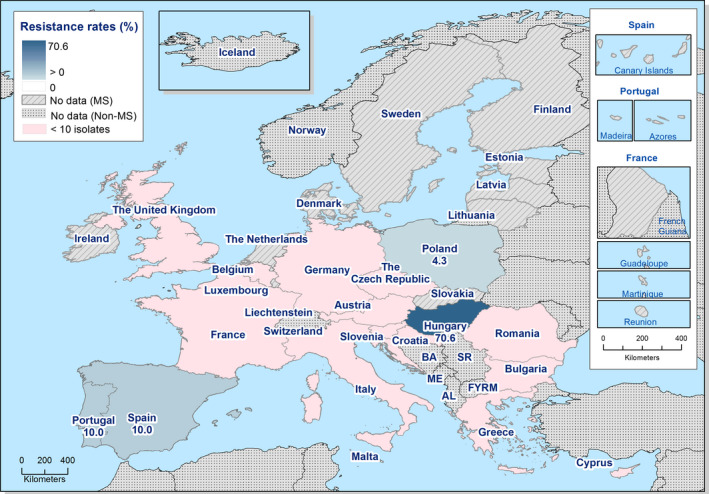
Spatial distribution of ciprofloxacin resistance among Salmonella Infantis from laying hen flocks, 18 EU MSs, 2016
Resistance and multidrug resistance in S. Mbandaka from laying hen flocks
S. Mbandaka was the fourth most frequently reported serovar in laying hen flocks, accounting for 5.9%, of the Salmonella spp. isolates serotyped (N = 72) (Table SERLAYD). Among S. Mbandaka isolates from laying hen flocks (12 MSs, Table 27), only three MSs detected resistant isolates to some of the antimicrobial tested, Italy, Malta and Romania. Two S. Mbandaka isolates were multiresistant (Table COMMBALAY).
Table 27.
Occurrence of resistance (%) to selected antimicrobials in Salmonella Mbandaka from laying hen flocks, using harmonised ECOFFs, EU MSs, 2016
| Country | N | GEN | CHL | AMP | CTX | CAZ | MEM | TGC | NAL | CIP | AZM | COL | SMX | TMP | TET |
|---|---|---|---|---|---|---|---|---|---|---|---|---|---|---|---|
| Austriaa | 6 | 0 | 0 | 0 | 0 | 0 | 0 | 0 | 0 | 0 | 0 | 0 | 0 | 0 | 50 |
| Belgiuma | 4 | 0 | 0 | 0 | 0 | 0 | 0 | 0 | 0 | 0 | 0 | 0 | 0 | 0 | 0 |
| Francea | 5 | 0 | 0 | 0 | 0 | 0 | 0 | 0 | 0 | 0 | 0 | 0 | 0 | 0 | 0 |
| Germanya | 3 | 0 | 0 | 0 | 0 | 0 | 0 | 0 | 0 | 0 | 0 | 0 | 0 | 0 | 0 |
| Hungarya | 2 | 0 | 0 | 0 | 0 | 0 | 0 | 0 | 0 | 0 | 0 | 0 | 0 | 0 | 0 |
| Italya | 2 | 0 | 0 | 50 | 0 | 0 | 0 | 0 | 0 | 0 | 0 | 0 | 50 | 50 | 50 |
| Maltaa | 1 | 0 | 0 | 0 | 0 | 0 | 0 | 0 | 0 | 0 | 0 | 0 | 100 | 0 | 0 |
| Poland | 32 | 0 | 0 | 0 | 0 | 0 | 0 | 0 | 0 | 0 | 0 | 0 | 0 | 0 | 0 |
| Portugala | 5 | 0 | 0 | 0 | 0 | 0 | 0 | 0 | 0 | 0 | 0 | 0 | 0 | 0 | 0 |
| Romaniaa | 3 | 0 | 0 | 0 | 0 | 0 | 0 | 0 | 33.3 | 33.3 | 0 | 0 | 33.3 | 0 | 33.3 |
| Spaina | 4 | 0 | 0 | 0 | 0 | 0 | 0 | 0 | 0 | 0 | 0 | 0 | 0 | 0 | 0 |
| United Kingdoma | 5 | 0 | 0 | 0 | 0 | 0 | 0 | 0 | 0 | 0 | 0 | 0 | 0 | 0 | 0 |
| Total (12 MSs) | 72 | 0 | 0 | 1.4 | 0 | 0 | 0 | 0 | 1.4 | 1.4 | 0 | 0 | 4.2 | 1.4 | 6.9 |
ECOFFs: epidemiological cut‐off values; EUCAST: European Committee on Antimicrobial Susceptibility Testing; N: number of isolates tested; MSs: Member States; GEN: gentamicin; CHL: chloramphenicol; AMP: ampicillin; CTX: cefotaxime; CAZ: Ceftazidime; MEM: meropenem; TGC: tigecycline; NAL: nalidixic acid; CIP: ciprofloxacin; AZM: azithromycin; COL: colistin; SMX: sulfamethoxazole; TMP: trimethoprim; TET: tetracycline.
The occurrence of resistance is assessed on less than 10 isolates and should only be considered as part of the total from all MSs data.
Resistance in S. Kentucky from laying hen flocks
Resistance levels in S. Kentucky from laying hen flocks
The overall resistances in S. Kentucky isolates from laying hens (Table KENTLAYD), were lower than those registered in S. Kentucky isolates from broilers and higher than the levels of resistance found in Salmonella spp. isolates from laying hens. However, the levels of resistance to chloramphenicol, nalidixic acid and ciprofloxacin were in general higher than the levels registered in S. Kentucky isolates from broilers and Salmonella spp. isolates from laying hens, and equalled to 70.9%, 78.5% and 78.5%, respectively. Resistance to cefotaxime, ceftazidime, meropenem, tigecycline, azithromycin and colistin were not detected in any of the reporting countries (9 MSs, Table 26).
Table 26.
Occurrence of resistance (%) to selected antimicrobials in Salmonella Kentucky from laying hen flocks, using harmonised ECOFFs, EU MSs, 2016
| Country | N | GEN | CHL | AMP | CTX | CAZ | MEM | TGC | NAL | CIP | AZM | COL | SMX | TMP | TET |
|---|---|---|---|---|---|---|---|---|---|---|---|---|---|---|---|
| Bulgariaa | 1 | 0 | 0 | 100 | 0 | 0 | 0 | 0 | 100 | 100 | 0 | 0 | 100 | 100 | 0 |
| Francea | 1 | 0 | 0 | 0 | 0 | 0 | 0 | 0 | 0 | 0 | 0 | 0 | 0 | 0 | 0 |
| Greecea | 1 | 0 | 0 | 0 | 0 | 0 | 0 | 0 | 100 | 100 | 0 | 0 | 0 | 0 | 0 |
| Hungarya | 2 | 100 | 0 | 100 | 0 | 0 | 0 | 0 | 100 | 100 | 0 | 0 | 100 | 0 | 100 |
| Italy | 53 | 0 | 9.4 | 7.5 | 0 | 0 | 0 | 0 | 94.3 | 94.3 | 0 | 0 | 15.1 | 3.8 | 13.2 |
| Malta | 12 | 8.3 | 0 | 8.3 | 0 | 0 | 0 | 0 | 8.3 | 8.3 | 0 | 0 | 50 | 0 | 8.3 |
| Romaniaa | 1 | 0 | 0 | 100 | 0 | 0 | 0 | 0 | 100 | 100 | 0 | 0 | 0 | 0 | 0 |
| Spaina | 4 | 25 | 0 | 0 | 0 | 0 | 0 | 0 | 100 | 100 | 0 | 0 | 25 | 0 | 50 |
| United Kingdoma | 1 | 0 | 0 | 0 | 0 | 0 | 0 | 0 | 0 | 100 | 0 | 0 | 100 | 100 | 100 |
| Total (9 MSs) | 76 | 5.3 | 6.6 | 11.8 | 0 | 0 | 0 | 0 | 78.9 | 80.3 | 0 | 0 | 25 | 5.3 | 17.1 |
ECOFFs: epidemiological cut‐off values; EUCAST: European Committee on Antimicrobial Susceptibility Testing; N: number of isolates tested; MSs: Member States; GEN: gentamicin; CHL: chloramphenicol; AMP: ampicillin; CTX: cefotaxime; CAZ: Ceftazidime; MEM: meropenem; TGC: tigecycline; NAL: nalidixic acid; CIP: ciprofloxacin; AZM: azithromycin; COL: colistin; SMX: sulfamethoxazole; TMP: trimethoprim; TET: tetracycline.
The occurrence of resistance is assessed on less than 10 isolates and should only be considered as part of the total from all MSs data.
Multidrug resistance in S. Kentucky from laying hen flocks
Among the S. Kentucky isolates from laying hen flocks (9 MSs, N = 76) tested in 2016, multidrug resistance was assessed at 18.4%, ranging from 8.3% to 100%. The proportion of completely susceptible isolates equalled 13.2%, varying from none to 100% (Figures 53 and 55, Table COMKENLAY).
Figure 55.
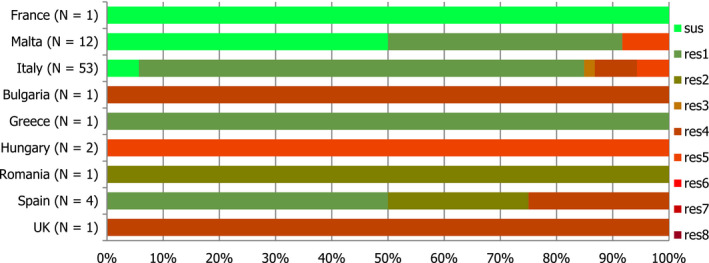
Frequency distribution of completely susceptible isolates and resistant isolates to one to nine antimicrobials classes in Salmonella Kentucky from laying hens, 9 EU MSs, 2016
- N: total number of isolates tested for susceptibility against the whole common antimicrobial set for Salmonella; UK: the United Kingdom; sus: susceptible to all antimicrobial classes of the common set for Salmonella; res1–res7: resistance to one antimicrobial classes/resistance to seven antimicrobial classes of the common set for Salmonella.
‘Microbiological’ and ‘clinical’ combined resistance to ciprofloxacin and cefotaxime was not detected in any isolate in any reporting country (Table COMKENLAY).
Spatial distribution of resistance in S. Kentucky from laying hen flocks
The levels of resistance to ciprofloxacin in S. Kentucky from laying hen flocks showed by the MSs which detected resistance to ciprofloxacin were in general extremely high (> 70%). Low levels of ciprofloxacin resistance were reported only by one MS (Malta, 8.3%) (Figure 56).
Figure 56.
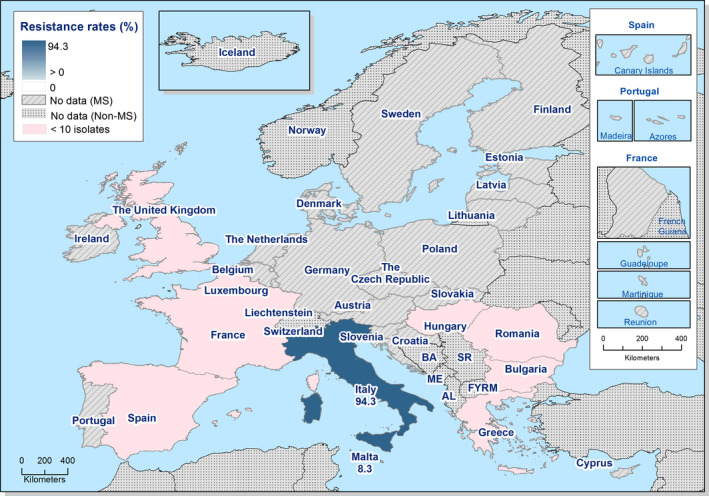
Spatial distribution of ciprofloxacin resistance among Salmonella Kentucky from laying hen flocks, 9 EU MSs, 2016
Temporal trends in resistance among Salmonella spp. from Gallus gallus
Twenty‐four MSs provided resistance data on 4 years or more to be included in the statistical analysis. Over the 8 years of data, levels of resistance to cefotaxime remained mostly constant for most of the reporting MSs. Resistance to cefotaxime is generally very low and a statistically significant decreasing trend was observed in nine MSs (Figure 57). Within each MS, similar levels of resistance to ciprofloxacin and nalidixic acid were observed from 2008 to 2016, although slight differences occurred in three MSs. Tetracycline resistance exceeded ampicillin resistance in many MSs and, although tetracycline resistance showed some fluctuations, ampicillin resistance tended to show parallel fluctuations. As AMR is associated with particular serovars or clones within serovars, fluctuations in the occurrence of resistance in Salmonella spp. isolates within a country may be the result of changes in the proportions of different Salmonella serovars that contribute to the total number of Salmonella spp. isolates.
Figure 57.
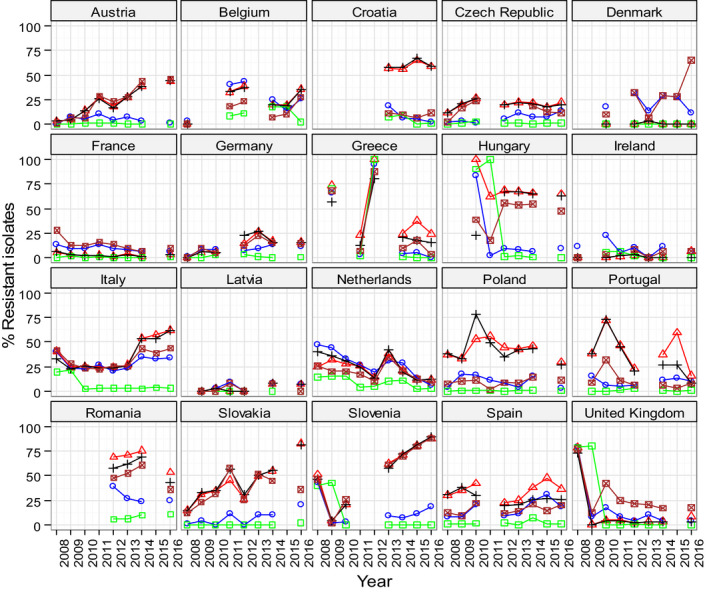
Trends in ampicillin (AMP), cefotaxime (CTX), ciprofloxacin (CIP), nalidixic acid (NAL) and tetracycline (TET) resistance in tested Salmonella spp. from Gallus gallus, EU MSs, 2008–2016
-
Statistical significance of trends over 4‐5 or more years was tested by a logistic regression model (p ≤ 0.05). Statistically significant increasing trends were observed for ampicillin in the Czech Republic, Germany, Italy, Latvia, Portugal, Romania, Slovakia and Spain, for ciprofloxacin in Spain, for ciprofloxacin and nalidixic acid in Austria, Germany, Italy, Romania, Slovakia and Slovenia, for cefotaxime in Italy, Romania and Slovakia, for nalidixic acid in Hungary, as well as for tetracycline in Austria, Denmark, Germany, Hungary, Italy, Slovenia, Slovakia and Spain.Statistically significant decreasing trends were observed for ampicillin in Austria, Belgium, Croatia, Greece, Hungary, the Netherlands, Poland, Slovenia and the United Kingdom, for ciprofloxacin and nalidixic acid in Belgium, Greece, the Netherlands, Poland and the United Kingdom, for cefotaxime in Belgium, Croatia, Germany, Greece, Hungary, the Netherlands, Slovenia, Spain and the United Kingdom, for nalidixic acid in Portugal and Spain, as well as for tetracycline in the Czech Republic, France, Greece, the Netherlands, Portugal, Romania and the United Kingdom.
3.2.7. Antimicrobial resistance in Salmonella spp. from flocks of fattening turkeys
Resistance levels in Salmonella spp. from fattening turkey flocks
In 2016, 15 MSs reported data on Salmonella spp. in fattening turkey flocks (Table 28). The overall resistances in Salmonella spp. isolates from fattening turkey (nine MSs, Table SALMFATTURKD), were higher than those registered in Salmonella spp. isolates from broilers and laying hens. Most MSs recorded high to extremely high resistance to ciprofloxacin, sulfamethoxazole and tetracycline, with overall resistance at 50.5%, 52.3% and 64.1%, respectively. Overall resistance to trimethoprim was moderate at 15.2%. Resistance to gentamicin and chloramphenicol was overall low, although resistance levels varied markedly from none to 22.8% between reporting MSs. The reported levels of resistance to ampicillin and nalidixic acid ranged from low to extremely high (1.8–81.8%) in Salmonella spp. in fattening turkey flocks. Resistance to azithromycin was detected by Hungary and Spain at low level (1.8% and 1.2%, respectively). Low levels of resistance to colistin were recorded by the Czech Republic and Poland equalled 9.1% and 5.9%, respectively. Resistance to tigecycline was generally either not detected (12 MSs) or reported at moderate level (Hungary and Spain), except Germany where low levels were reported. Resistance to cefotaxime and ceftazidime was detected only by Spain at low levels. Meropenem resistance was not detected by any of the MSs reporting 2016 data.
Table 28.
Occurrence of resistance (%) to selected antimicrobials in Salmonella spp., S. Kentucky and S. Derby from flocks of fattening turkeys, using ECOFFs, EU MSs, 2016
| Country | N | GEN | CHL | AMP | CTX | CAZ | MEM | TGC | NAL | CIP | AZM | COL | SMX | TMP | TET |
|---|---|---|---|---|---|---|---|---|---|---|---|---|---|---|---|
| Salmonella spp. | |||||||||||||||
| Austria | 11 | 0 | 0 | 9.1 | 0 | 0 | 0 | 0 | 36.4 | 36.4 | 0 | 0 | 27.3 | 0 | 27.3 |
| Croatia | 33 | 0 | 0 | 3 | 0 | 0 | 0 | 0 | 81.8 | 78.8 | 0 | 0 | 3 | 0 | 6.1 |
| Cyprusa | 1 | 0 | 0 | 0 | 0 | 0 | 0 | 0 | 100 | 100 | 0 | 0 | 100 | 100 | 100 |
| Czech Republic | 11 | 9.1 | 0 | 27.3 | 0 | 0 | 0 | 0 | 9.1 | 9.1 | 0 | 9.1 | 9.1 | 0 | 27.3 |
| Finlanda | 1 | 0 | 0 | 0 | 0 | 0 | 0 | 0 | 0 | 0 | 0 | 0 | 0 | 0 | 0 |
| France | 31 | 0 | 3.2 | 32.3 | 0 | 0 | 0 | 0 | 29 | 29 | 0 | 0 | 38.7 | 19.4 | 41.9 |
| Germany | 27 | 0 | 3.7 | 77.8 | 0 | 0 | 0 | 3.7 | 14.8 | 11.1 | 0 | 0 | 74.1 | 3.7 | 74.1 |
| Hungary | 170 | 8.2 | 0.6 | 45.9 | 0 | 0 | 0 | 10 | 69.4 | 92.9 | 1.8 | 0 | 38.8 | 15.9 | 74.7 |
| Italya | 8 | 12.5 | 0 | 12.5 | 0 | 0 | 0 | 0 | 12.5 | 12.5 | 0 | 0 | 50 | 25 | 50 |
| Poland | 17 | 23.5 | 11.8 | 47.1 | 0 | 0 | 0 | 0 | 47.1 | 52.9 | 0 | 5.9 | 47.1 | 0 | 47.1 |
| Portugala | 2 | 0 | 0 | 100 | 0 | 0 | 0 | 0 | 0 | 0 | 0 | 0 | 100 | 0 | 100 |
| Romaniaa | 1 | 0 | 0 | 0 | 0 | 0 | 0 | 0 | 100 | 100 | 0 | 0 | 0 | 0 | 0 |
| Sloveniaa | 9 | 0 | 0 | 0 | 0 | 0 | 0 | 0 | 0 | 0 | 0 | 0 | 0 | 0 | 0 |
| Spain | 171 | 15.8 | 22.8 | 70.2 | 3.5 | 0.6 | 0 | 12.9 | 38 | 69.6 | 1.2 | 0 | 60.2 | 35.1 | 66.7 |
| United Kingdom | 170 | 0.6 | 0.6 | 5.3 | 0 | 0 | 0 | 0 | 1.8 | 1.8 | 0 | 0 | 74.1 | 2.4 | 75.3 |
| Total (15 MSs) | 663 | 7.2 | 6.8 | 38.3 | 0.9 | 0.2 | 0 | 6 | 36.5 | 50.5 | 0.8 | 0.3 | 52.3 | 15.2 | 64.1 |
| S. Kentucky | |||||||||||||||
| Czech Republica | 1 | 100 | 0 | 100 | 0 | 0 | 0 | 0 | 100 | 100 | 0 | 0 | 100 | 0 | 100 |
| Hungary | 14 | 71.4 | 0 | 92.9 | 0 | 0 | 0 | 0 | 100 | 100 | 0 | 0 | 71.4 | 0 | 78.6 |
| Italya | 1 | 100 | 0 | 100 | 0 | 0 | 0 | 0 | 100 | 100 | 0 | 0 | 100 | 0 | 100 |
| Polanda | 4 | 100 | 0 | 100 | 0 | 0 | 0 | 0 | 100 | 100 | 0 | 0 | 100 | 0 | 100 |
| Spain | 26 | 88.5 | 11.5 | 92.3 | 0 | 0 | 0 | 3.8 | 96.2 | 100 | 3.8 | 0 | 88.5 | 11.5 | 84.6 |
| Total (5 MSs) | 46 | 84.8 | 6.5 | 93.5 | 0 | 0 | 0 | 2.2 | 97.8 | 100 | 2.2 | 0 | 84.8 | 6.5 | 84.8 |
| S. Derby | |||||||||||||||
| Francea | 3 | 0 | 0 | 0 | 0 | 0 | 0 | 0 | 0 | 0 | 0 | 0 | 100 | 0 | 100 |
| Spain | 49 | 0 | 34.7 | 93.9 | 0 | 0 | 0 | 30.6 | 2 | 67.3 | 0 | 0 | 100 | 98 | 98 |
| United Kingdom | 91 | 0 | 0 | 4.4 | 0 | 0 | 0 | 0 | 1.1 | 1.1 | 0 | 0 | 81.3 | 1.1 | 81.3 |
| Total (2 MSs) | 143 | 0 | 11.9 | 35 | 0 | 0 | 0 | 10.5 | 1.4 | 23.8 | 0 | 0 | 88.1 | 34.3 | 87.4 |
ECOFFs: epidemiological cut‐off values; EUCAST: European Committee on Antimicrobial Susceptibility Testing; N: number of isolates tested; MSs: Member States; GEN: gentamicin; CHL: chloramphenicol; AMP: ampicillin; CTX: cefotaxime; CAZ: Ceftazidime; MEM: meropenem; TGC: tigecycline; NAL: nalidixic acid; CIP: ciprofloxacin; AZM: azithromycin; COL: colistin; SMX: sulfamethoxazole; TMP: trimethoprim; TET: tetracycline.
The occurrence of resistance is assessed on less than 10 isolates and should only be considered as part of the total from all MSs data.
Spatial distribution of resistance in Salmonella spp. from fattening turkey flocks
The spatial distribution of ciprofloxacin resistance in 663 Salmonella spp. isolates from fattening turkey flocks (Figure 58) show that the highest levels of resistance to this substance (> 50.0%) were reported in three MSs from the Eastern (Croatia, Hungary and Poland) and two MSs from Southern (Spain). However, northern and western European countries tended to report lower resistance levels. Low resistance to cefotaxime was only reported in Spain, at a level of 3.5% (Figure 58).
Figure 58.
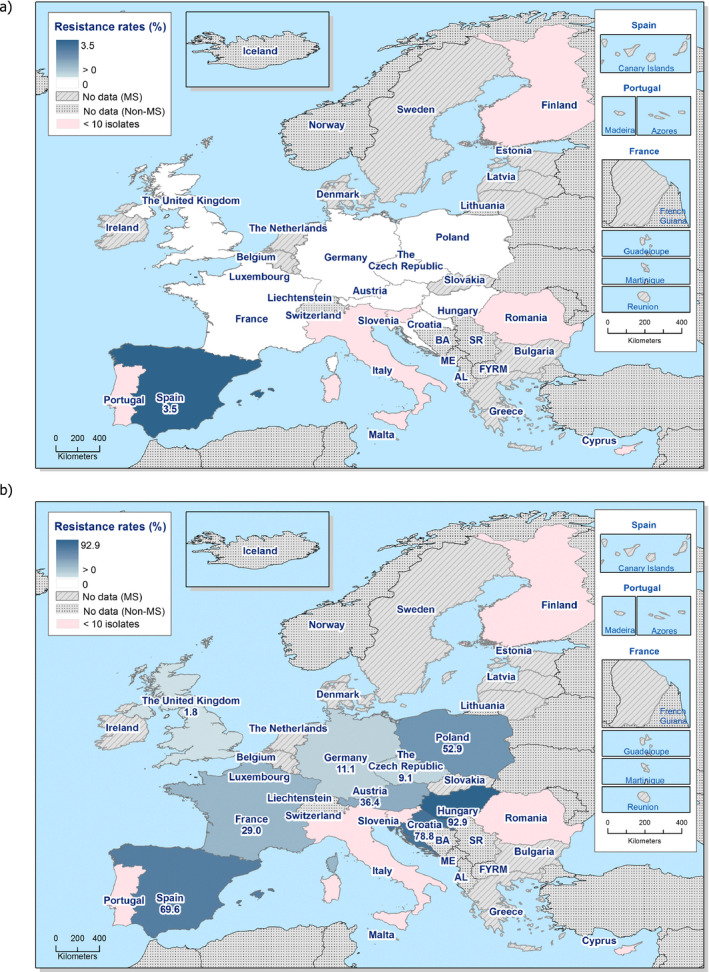
Spatial distribution of cefotaxime (a) and ciprofloxacin (b) resistance among Salmonella spp. from fattening turkeys, using harmonised ECOFFs, 15 EU MSs, 2016
Combined resistance to cefotaxime and ciprofloxacin in Salmonella spp. from fattening turkeys
‘Microbiological’ combined resistance to ciprofloxacin and cefotaxime was reported at low level in five isolates in one MS, Spain, corresponding to the overall level of 0.75%. ‘Clinical’ combined resistance to ciprofloxacin and cefotaxime was not reported by any reporting countries (Table COMSALMTURK).
Multidrug resistance and complete susceptibility in Salmonella spp. from fattening turkeys
Fifteen reporting countries reported data for individual isolates, which were addressed in the MDR analysis (N = 663). The overall rate of MDR equalled 42.82%, whereas the proportion of completely susceptible isolates equalled 18.6% (Figure 59). From 3% to 74.1% of the Salmonella spp. isolates were multiresistant, whereas the proportion of completely susceptible isolates varied from 5% to 72.7%.
Figure 59.
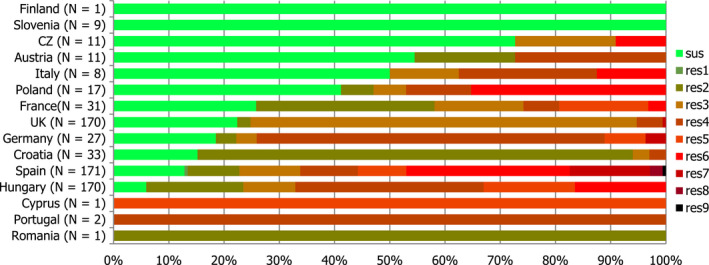
Frequency distribution of completely susceptible isolates and resistant isolates to one to nine antimicrobials classes in Salmonella spp. from fattening turkeys in 2016
- N: total number of isolates tested for susceptibility against the whole common antimicrobial set for Salmonella; CZ: the Czech Republic, UK: the United Kingdom; sus: susceptible to all antimicrobial classes of the common set for Salmonella; res1–res9: resistance to one antimicrobial classes/resistance to nine antimicrobial classes of the common set for Salmonella.
Spatial distribution of complete susceptibility in Salmonella spp. from fattening turkey flocks
The spatial distribution of complete susceptibility to the panel of antimicrobial substances tested in Salmonella spp. from fattening turkey flocks in 2016 is shown in Figure 60. The susceptibility to each individual antimicrobial was determined using ECOFFs; all isolates were tested against the same mandatory panel of antimicrobials. Among the reporting countries, marked variations were observed in the percentages of completely susceptible isolates, which ranged from 5.9% in Hungary, to 12.9%, 15.2% and 18.5% in Spain, Croatia and Germany, and nearly 73% in the Czech Republic. The highest levels of complete susceptibility were shown by isolates from the Czech Republic, Austria and Italy.
Figure 60.
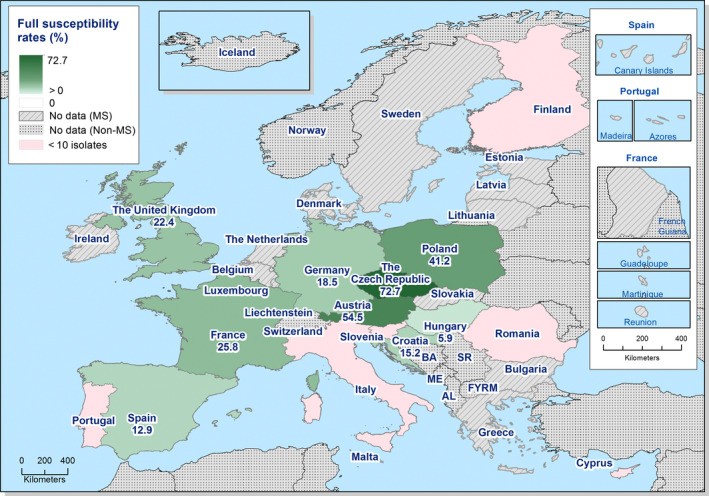
Spatial distribution of complete susceptibility to the panel of antimicrobials tested among Salmonella spp. from fattening turkey flocks, using harmonised ECOFFs, 15 EU MSs, 2016
Temporal trends in resistance in Salmonella from fattening turkey flocks
Nine MSs provided resistance data on 4 years or more to be included in the statistical analysis. Over the 7 years of data, levels of resistance to ciprofloxacin, nalidixic acid and cefotaxime remained mostly constant for most of the reporting MSs. Within each MS, similar levels of resistance to ciprofloxacin and nalidixic acid were observed from 2009 to 2016, although a slight but statistically significant decrease occurred for nalidixic acid in two MSs and for ciprofloxacin in three MSs. Resistance to cefotaxime is generally very low; however, a statistically significant decreasing trend was observed in two MSs (Figure 61). Tetracycline resistance exceeded ampicillin resistance in many MSs and, although tetracycline resistance showed some fluctuations, ampicillin resistance tended to show parallel fluctuations, maintaining the interval between tetracycline and ampicillin resistance.
Figure 61.
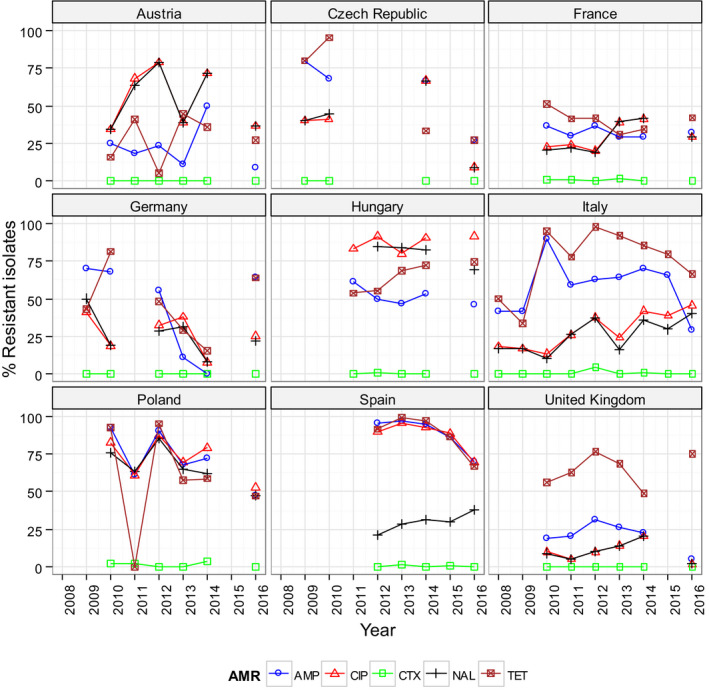
Trends in ampicillin (AMP), cefotaxime (CTX), ciprofloxacin (CIP), nalidixic acid (NAL) and tetracycline (TET) resistance in tested Salmonella spp. isolates from turkeys, EU MSs, 2008–2016
-
Statistical significance of trends over 4‐5 or more years was tested by a logistic regression model (p ≤ 0.05).Statistically significant increasing trends were observed for ampicillin in Spain, for ciprofloxacin and nalidixic acid in the Czech Republic, France, Hungary and Italy, for nalidixic acid in Austria, Spain and the United Kingdom, as well as for tetracycline in Hungary, Italy, Spain and the United Kingdom.Statistically significant decreasing trends were observed for ampicillin in the Czech Republic, Germany, Hungary, Italy, Poland and the United Kingdom, for ciprofloxacin in Austria, Spain and the United Kingdom, for cefotaxime in Hungary and Spain, for nalidixic acid in Germany and Poland, as well as for tetracycline in the Czech Republic and France.
As AMR is associated with particular serovars or clones within serovars, fluctuations in the occurrence of resistance in Salmonella spp. isolates within a country may be the result of changes in the proportions of different Salmonella serovars which contribute to the total numbers of Salmonella spp. isolates.
Distribution of Salmonella serovars in fattening turkey flocks
Among the isolates for which serovar information was provided (N = 656), the most common serovars detected in fattening turkey flocks (Table SEROFATTURKD) were S. Derby (3 MSs, 21.8%), S. Infantis, (7 MSs, 12.7%), S. Newport (7 MSs, 8.4%), S. Kedougou (2 MSs, 7.5%) and S. Bredeney (4 MSs, 7.0% (Figure 62).
Figure 62.
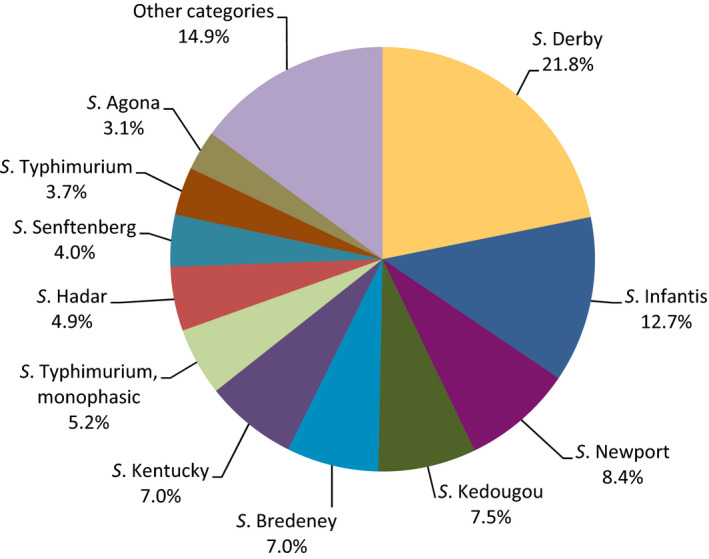
Breakdown of Salmonella serovars in fattening turkey flocks, EU MSs, 2016 (N = 656)
Resistance and multidrug resistance levels in S. Derby from fattening turkey flocks
S. Derby was the most frequently reported serovar in fattening turkeys, accounting for 21.8% of the Salmonella isolates serotyped (N = 143) (Table SEROFATTURKD). In S. Derby isolates from fattening turkeys (3 MSs, Table DERBYTURKD), high to extremely high levels of resistance to sulfamethoxazole and tetracycline were found, the overall levels were 88.1% and 87.4%, respectively. Overall resistance to ampicillin and trimethoprim was high (35% and 34.3%), whereas resistance to chloramphenicol remained moderate. Resistance to nalidixic acid and ciprofloxacin were detected in the United Kingdom at low levels and in Spain with a low level for nalidixic acid but a very high level for ciprofloxacin. Gentamicin, cefotaxime, ceftazidime meropenem, azithromycin and colistin were not detected in any MS. Among the S. Derby isolates from fattening turkeys tested in 2016, multidrug resistance was assessed at 35.7%, whereas the proportion of completely susceptible isolates equalled 10.5% (Table COMDERBYTURK).
Resistance levels in S. Infantis from fattening turkey flocks
S. Infantis was the second most frequently reported serovar in fattening turkey flocks, accounting for 12.7%, of the Salmonella isolates serotyped (N = 83) (Table SEROFATTURKD). Among S. Infantis isolates from fattening turkey flocks (7 MSs, Table 29), the levels of resistance to nalidixic acid and ciprofloxacin ranged from high to extremely high in most of the MSs (90.4% and 91.6% respectively). Resistance to sulfamethoxazole and tetracycline in general was 65.1% and 67.5%, respectively. Ampicillin resistance was detected only in Hungary a high level (22%) and Croatia a low level (4%). Resistance to gentamicin and tigecycline was detected only in one MS (Hungary) at low levels (2% and 8%, respectively). Only two MSs registered resistance to chloramphenicol (Hungary, 2% and Spain, 50%). Resistance to cefotaxime, ceftazidime, meropenem, azithromycin and colistin were not detected in any MS.
Table 29.
Occurrence of resistance (%) to selected antimicrobials in Salmonella Infantis from flocks of turkeys, using ECOFFs, 7 EU MSs, 2016
| Country | N | GEN | CHL | AMP | CTX | CAZ | MEM | TGC |
|---|---|---|---|---|---|---|---|---|
| Austriaa | 3 | 0 | 0 | 0 | 0 | 0 | 0 | 0 |
| Croatia | 25 | 0 | 0 | 4 | 0 | 0 | 0 | 0 |
| Cyprusa | 1 | 0 | 0 | 0 | 0 | 0 | 0 | 0 |
| Germanya | 1 | 0 | 0 | 0 | 0 | 0 | 0 | 0 |
| Hungary | 50 | 6 | 2 | 22 | 0 | 0 | 0 | 8 |
| Polanda | 1 | 0 | 0 | 0 | 0 | 0 | 0 | 0 |
| Spaina | 2 | 0 | 50 | 0 | 0 | 0 | 0 | 0 |
| Total (7 MSs) | 83 | 3.6 | 2.4 | 14.5 | 0 | 0 | 0 | 4.8 |
| Country | N | NAL | CIP | AZM | COL | SMX | TMP | TET |
|---|---|---|---|---|---|---|---|---|
| Austriaa | 3 | 66.7 | 66.7 | 0 | 0 | 66.7 | 0 | 66.7 |
| Croatia | 25 | 92 | 92 | 0 | 0 | 4 | 0 | 8 |
| Cyprusa | 1 | 100 | 100 | 0 | 0 | 100 | 100 | 100 |
| Germanya | 1 | 0 | 0 | 0 | 0 | 0 | 0 | 0 |
| Hungary | 50 | 96 | 98 | 0 | 0 | 96 | 4 | 98 |
| Polanda | 1 | 100 | 100 | 0 | 0 | 100 | 0 | 100 |
| Spaina | 2 | 0 | 0 | 0 | 0 | 50 | 50 | 50 |
| Total (7 MSs) | 83 | 90.4 | 91.6 | 0 | 0 | 65.1 | 4.8 | 67.5 |
ECOFFs: epidemiological cut‐off values; EUCAST: European Committee on Antimicrobial Susceptibility Testing; N: number of isolates tested; MSs: Member States; GEN: gentamicin; CHL: chloramphenicol; AMP: ampicillin; CTX: cefotaxime; CAZ: Ceftazidime; MEM: meropenem; TGC: tigecycline; NAL: nalidixic acid; CIP: ciprofloxacin; AZM: azithromycin; COL: colistin; SMX: sulfamethoxazole; TMP: trimethoprim; TET: tetracycline.
The occurrence of resistance is assessed on less than 10 isolates and should only be considered as part of the total from all MSs data.
Among the S. Infantis isolates from turkey flocks tested in 2016, multidrug resistance was assessed at 66.3%. The proportion of completely susceptible isolates equalled 6.02%.
3.2.8. Analyses of high‐level cefotaxime and ciprofloxacin resistance
Fluoroquinolones and third‐generation cephalosporins, including the class representatives ciprofloxacin and cefotaxime/ceftazidime included in the panels stipulated by Commission Implementing Decision 2013/652/EU, are internationally recognised as highest priority critically important in human medicine (WHO, 2016) and often constitute the first‐line treatment for invasive salmonellosis, although fluoroquinolones are not recommended for children (Chen et al., 2013). Fluoroquinolones may be used for treatment of poultry in Europe. It is nevertheless of note that, according to EU legislation, antimicrobials should not be used as a specific method to control Salmonella in poultry. High levels of resistance to either class of antimicrobials if observed among Salmonella spp. in some animal species are of concern, because of the importance of these compounds in the treatment of invasive salmonellosis in humans.
Comparison of ‘clinical’ and ‘microbiological’ resistance to cefotaxime
In Salmonella spp. from broilers, overall very low levels of ‘microbiological’ and ‘clinical’ resistance to cefotaxime (0.8%) were reported. With the only exception of Italy, which recorded cefotaxime resistance at moderate level (12%), all the remaining MSs detecting cefotaxime resistance, namely the Czech Republic, Hungary, Malta, Portugal, Romania, Slovakia and Spain, registered resistance at low levels. Cefotaxime resistance was not detected in isolates from 18 reporting countries. Applying the European Committee on Antimicrobial Susceptibility Testing (EUCAST) CBPs, ‘clinical’ resistance was found in 8 out of 24 MSs at levels equalling those of ‘microbiological’ resistance, indicating that the isolates detected resistant to cefotaxime exhibited high‐level resistance. (Table 30).
Table 30.
Occurrence of resistance (%) to cefotaxime among Salmonella spp. from broilers, laying hens and fattening turkeys in 2016, using harmonised ECOFFs and EUCAST CBPs
| Country | Broilers | Laying hens | Fattening turkeys | ||||||||||||
|---|---|---|---|---|---|---|---|---|---|---|---|---|---|---|---|
| N | n Res. ECOFF | % Res. ECOFF | n Res. CBP | % Res. CBP | N | n Res. ECOFF | % Res. ECOFF | n Res. CBP | % Res. CBP | N | n Res. ECOFF | % Res. ECOFF | n Res. CBP | % Res. CBP | |
| Austria | 179 | 0 | 0 | 0 | 0 | 46 | 0 | 0 | 0 | 0 | 11 | 0 | 0 | 0 | 0 |
| Belgium | 123 | 0 | 0 | 0 | 0 | 39 | 0 | 0 | 0 | 0 | – | – | – | – | – |
| Bulgariaa | 3 | 0 | 0 | 0 | 0 | 11 | 0 | 0 | 0 | 0 | – | – | – | – | – |
| Croatia | 125 | 0 | 0 | 0 | 0 | 44 | 0 | 0 | 0 | 0 | 33 | 0 | 0 | 0 | 0 |
| Cyprus | 24 | 0 | 0 | 0 | 0 | 10 | 0 | 0 | 0 | 0 | 1 | 0 | 0 | 0 | 0 |
| CZ | 91 | 1 | 1.1 | 1 | 1.1 | 9 | 0 | 0 | 0 | 0 | 11 | 0 | 0 | 0 | 0 |
| Denmark | 20 | 0 | 0 | 0 | 0 | 3 | 0 | 0 | 0 | 0 | – | – | – | – | – |
| Estonia | – | – | – | – | – | 3 | 0 | 0 | 0 | 0 | – | – | – | – | – |
| Finlanda | 1 | 0 | 0 | 0 | 0 | – | – | – | – | – | 1 | 0 | 0 | 0 | 0 |
| France | 29 | 0 | 0 | 0 | 0 | 92 | 0 | 0 | 0 | 0 | 31 | 0 | 0 | 0 | 0 |
| Germany | 24 | 0 | 0 | 0 | 0 | 95 | 0 | 0 | 0 | 0 | 27 | 0 | 0 | 0 | 0 |
| Greece | 27 | 0 | 0 | 0 | 0 | 59 | 0 | 0 | 0 | 0 | – | – | – | – | – |
| Hungary | 170 | 3 | 1.8 | 3 | 1.8 | 91 | 0 | 0 | 0 | 0 | 170 | 0 | 0 | 0 | 0 |
| Ireland | 14 | 0 | 0 | 0 | 0 | 1 | 0 | 0 | 0 | 0 | – | – | – | – | – |
| Italy | 25 | 3 | 12 | 3 | 12 | 125 | 0 | 0 | 0 | 0 | 8 | 0 | 0 | 0 | 0 |
| Latvia | – | – | – | – | – | 2 | 0 | 0 | 0 | 0 | – | – | – | – | – |
| Malta | 80 | 2 | 2.5 | 2 | 2.5 | 52 | 1 | 1.9 | 1 | 1.9 | – | – | – | – | – |
| Poland | 84 | 0 | 0 | 0 | 0 | 213 | 0 | 0 | 0 | 0 | 17 | 0 | 0 | 0 | 0 |
| Portugal | 51 | 1 | 2 | 1 | 2 | 74 | 0 | 0 | 0 | 0 | 2 | 0 | 0 | 0 | 0 |
| Romania | 170 | 1 | 0.6 | 1 | 0.6 | 36 | 0 | 0 | 0 | 0 | 1 | 0 | 0 | 0 | 0 |
| Slovakia | 53 | 1 | 1.9 | 1 | 1.9 | – | – | – | – | – | – | – | – | – | – |
| Slovenia | 85 | 0 | 0 | 0 | 0 | 8 | 0 | 0 | 0 | 0 | 9 | 0 | 0 | 0 | 0 |
| Spain | 169 | 2 | 1.2 | 2 | 1.2 | 169 | 0 | 0 | 0 | 0 | 171 | 6 | 3.5 | 6 | 3.5 |
| UK | 170 | 0 | 0 | 0 | 0 | 34 | 0 | 0 | 0 | 0 | 170 | 0 | 0 | 0 | 0 |
| Total | 1,717 | 14 | 0.8 | 14 | 0.8 | 1216 | 1 | 0.1 | 1 | 0.1 | 663 | 6 | 0.9 | 6 | 0.9 |
CZ: the Czech Republic; UK: the United Kingdom; CBP: clinical breakpoint; ECOFFs: epidemiological cut‐off values; EUCAST: European Committee on Antimicrobial Susceptibility Testing; N: number of isolates tested; n: number of isolates resistant; % Res: percentage of resistant isolates.
The occurrence of resistance is assessed on less than 10 isolates and should only be considered as part of the total from all MSs data.
The ‘microbiological’ and ‘clinical’ resistance to cefotaxime in Salmonella spp. from laying hens was very low (overall 0.1%), and only Malta detected resistance to cefotaxime at the low level of 1.9%.
The overall ‘microbiological’ and ‘clinical’ resistance to cefotaxime in Salmonella spp. from fattening turkeys was very low (overall 0.9%). Cefotaxime resistance at both ‘microbiological’ and clinical ‘levels’ was only reported in isolates from fattening turkeys in Spain at low levels of 3.5%.
The term ‘microbiological’ resistance is used when resistance is interpreted using the EUCAST epidemiological cut‐off values, whereas the term ‘clinical’ resistance is noted when resistance is analysed using the EUCAST clinical breakpoints.
Quinolone and fluoroquinolone resistance in the Enterobacteriaceae is mostly attributed to point mutations in the quinolone resistance‐determining regions (QRDR) of gyrase (gyrA and gyrB) and topoisomerase IV (parC and parD) genes. Plasmid‐mediated quinolone resistance (PMQR) can be caused by the action of efflux pumps (qepA gene), enzymatic modifications (aac(6′)‐Ib‐cr gene, which also confers resistance to kanamycin), and protection of the DNA gyrase (qnrA, qnrB, qnrD and qnrS genes) (Cavaco et al., 2009).
The presence of two single point mutations in the QRDR will usually confer ‘clinical’ resistance to ciprofloxacin (minimum inhibitory concentration (MIC) > 0.064 mg/L for Salmonella and > 0.5 mg/L for E. coli) as well as to nalidixic acid (MIC > 16 mg/L).As EUCAST states ‘there is clinical evidence for ciprofloxacin to indicate a poor response in systemic infections caused by Salmonella spp. with low‐level fluoroquinolone resistance (MIC > 0.064 mg/L)’ In contrast, E. coli isolates harbouring only one single point mutation in the QRDR will usually show ‘clinical’ resistance to nalidixic acid, whereas the susceptibility to ciprofloxacin is reduced to only a ‘microbiological’ resistance level.
In the absence of other mechanisms, the presence of PMQR determinants (i.e. qnr genes) in a bacterium might confer only ‘microbiological’ resistance to ciprofloxacin, but the isolate will be susceptible to nalidixic acid.
Analysis of high‐level ciprofloxacin resistance
High‐level resistance to ciprofloxacin, defined as resistance to MIC values ≥ 4 mg/L, in Salmonella spp. of animal and food origin is shown in Tables HIGHSALMBRMEAT, HIGHSALMTURKMEAT, HIGHSALMBR, HIGHSALMLAY and HIGHSALMTURK. Most of the Salmonella isolates that displayed high‐level resistance to ciprofloxacin originated from fattening turkeys (7.4%, N = 651), turkey meat (4.7%, N = 295), broilers (3.7%, N = 1,707) and broiler meat (2.9%, N = 755).
Reflecting the generally lower levels of resistance in Salmonella spp. from laying hens (Table HIGHSALMLAY), only 0.9% (N = 1,171) of isolates from laying hens displayed high‐level resistance in 5 of the 18 included MSs; corresponding to eight S. Kentucky isolates from Hungary (2.2%, N = 91), Malta (1.9%, N = 52), Romania (2.8%, N = 36) and Spain (2.4%, N = 169) and two S. Corvallis isolates from Bulgaria (18.2%, N = 11).
More than half of the Salmonella spp. isolates from fattening turkeys included in the analysis originated from Hungary and Spain, where, respectively, 9.4% (N = 170) and 15.2% (N = 171) of the isolates showed high‐level resistance (mainly S. Kentucky) (Table HIGHSALMTURK). Among the other 10 MSs included in the analysis of broiler isolates, high‐level resistance was reported by the Czech Republic (9.1%, N = 11), Italy (12.5%, N = 8), and Poland (23.5%, N = 17). In addition, limited number of isolates from turkey meat from the Czech Republic (33.3%, N = 3), Germany (4.4%, N = 45), Hungary (18.2%, N = 22), Poland (20%, N = 5), Slovakia (100%, N = 2) and Spain (8.7%, N = 46) displayed high‐level ciprofloxacin resistance.
In broilers, high‐level ciprofloxacin resistance was primarily observed in Malta (32.5%, N = 80) and Spain (10.7%, N = 169) and to a lesser extent, in Romania (6.5%, N = 170), the Czech Republic (4.4%, 91%), Cyprus (4.2%, N = 24), Portugal (2%, N = 51), Slovenia (1.2%, N = 85) and the United Kingdom (0.6%, N = 170) (Table HIGHSALMBR). Similarly, from Malta and Spain, isolates from broiler meat (50%, N = 10 and 18.8%, N = 48) displayed high‐level ciprofloxacin resistance and to a lesser extent, from Romania (8.4%, 83) and Slovakia (1.2%, 83).
High‐level resistance to ciprofloxacin was most often observed in S. Kentucky isolates from broilers in Cyprus, the Czech Republic, Malta, Portugal, Romania, Spain and the United Kingdom, from fattening turkeys in the Czech Republic, Hungary, Italy, Poland and Spain, from turkey meat in the Czech Republic, Germany, Hungary, Slovakia and Spain, and from broiler meat in Malta, Romania, Slovakia and Spain. The vast majority of the S. Kentucky isolates with high‐level ciprofloxacin resistance (n = 150) were multiresistant (95%), and most isolates (76%) were also resistant to gentamicin, ciprofloxacin, ampicillin, nalidixic acid, sulfamethoxazole and tetracycline (GEN‐CIP‐AMP‐NAL‐SMX‐TET). Resistance to several other antimicrobials included in the MDR analysis were also observed. Malta reported one S. Kentucky isolate and one S. Kedougou isolate with high‐level ciprofloxacin resistance and resistance to cefotaxime. Some isolates of S. Kentucky (n = 8) showed only high‐level resistance to ciprofloxacin and nalidixic acid resistance but were otherwise susceptible to the antimicrobials tested.
In broilers, S. Infantis (n = 1) and S. Kedougou (n = 1) and in laying hens, S. Corvallis (n = 2) displayed high‐level ciprofloxacin resistance and these isolates were frequently also resistant to other antimicrobials.
3.2.9. Tigecycline resistance in Salmonella spp.
Microbiological resistance to tigecycline was reported in 1.9% of 1,717 Salmonella spp. from broilers, 0.2% of 1,216 isolates from laying hens and 0 of 295 isolates from turkeys. There was a marked association of tigecycline microbiological resistance with S. Infantis in poultry and most microbiologically resistant strains had MICs just above the ECOFF at 2 or 4 mg/L. Resistance to tigecycline in Salmonella spp. is thought to be mediated by increased activity of efflux pumps, principally through modifications to the expression of efflux pump regulatory genes and this may explain the distribution of MICs which was obtained. However, determining the susceptibility of tigecycline is not entirely straightforward as the method can be affected by oxidation of the test reagents. The National Reference Laboratory (NRL)s’ attention had been drawn on this technical difficulty over the past 2 years. The results are being further investigated by the EURL for AMR as methodological issues may have influenced the monitoring results in 2016.
Several mechanisms of resistance to tigecycline in Salmonella/Enterobacteriaceae have been described and these include increased activity of efflux pumps (AcrAB), mutation of the ribosomal protein S10 and modification of the Mla system involved in phospholipid transport in cell membranes (He et al., 2016). The mechanisms of development of microbiological resistance, which may involve upregulation of normal cell pathways or processes, probably also contribute to the occurrence of a ‘tail’ of isolates on the MIC distribution with values just above the ECOFF.
The tigecycline MIC distributions for Salmonella spp. from broilers, laying hens, fattening turkeys and meat from these animals are shown in Figure 63. The microbiological cut‐off for tigecycline is that resistant isolates have an MIC > 1 mg/L – the distribution shows a significant proportion of isolates with a tigecycline MIC at 1 mg/L. Therefore, given the variation inherent in the MIC method – MIC measurement is only precise at one dilution step – a proportion of the isolates is likely to show microbiological resistance, simply because of the distribution of MICs and one dilution step from the ECOFF cannot be considered as a significant result. Determining the susceptibility of tigecycline is also not entirely straightforward as the method can be affected by oxidation of the test reagents. Nevertheless, further investigations are needed at molecular level to determine if resistance mechanism(s) is (are) emerging in Salmonella spp.
Figure 63.
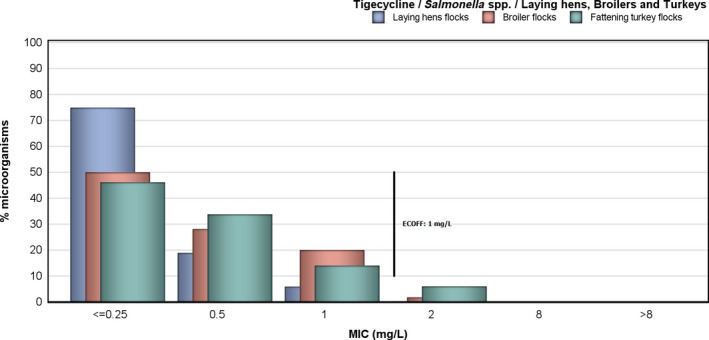
Tigecycline resistance in Salmonella spp. from broilers, laying hens, fattening turkeys
3.2.10. Colistin resistance in Salmonella spp.
Resistance to colistin was reported in 1.7% of 763 Salmonella spp. isolates from meat from broilers, 0.7% of 295 Salmonella spp. isolates from meat from turkeys, 2.5% of 1,717 Salmonella spp. isolates from broiler flocks and 0.3% of 663 Salmonella spp. isolates from fattening turkey flocks. Figure 64 shows the distributions of colistin MICs in Salmonella spp. from broilers, fattening turkeys and meat derived thereof. It is of note that isolates with an MIC close to the clinical/microbiological thresholds of > 2 mg/L will be subject to the inherent variation of the MIC method. The breakdown by serovar of the isolates exhibiting resistance to colistin (MIC > 2 mg/L) is presented in Table 31.
Figure 64.
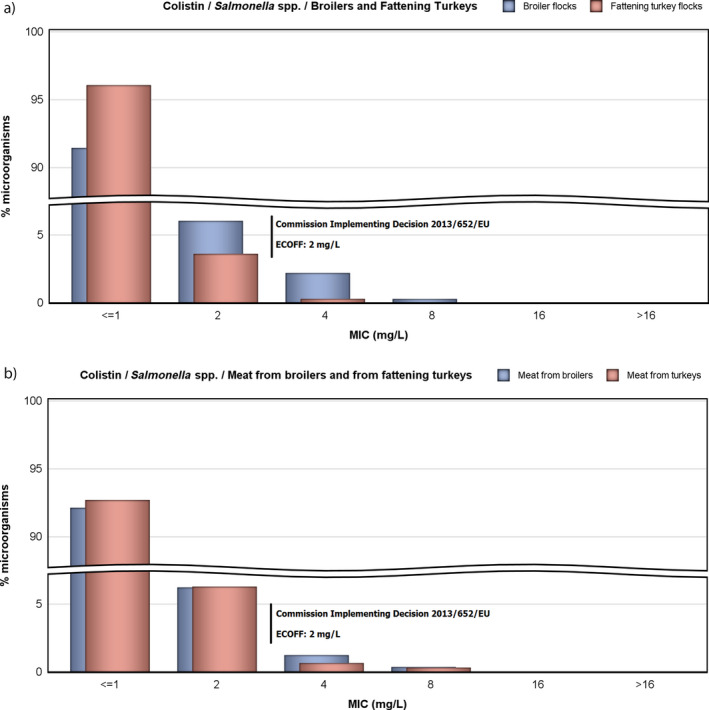
Colistin resistance in Salmonella spp. from (a) broilers, fattening turkeys and (b) meat from these animals
Table 31.
Distribution of MICs of colistin by serovar of Salmonella spp. in isolates exhibiting resistance to colistin (MIC > 2 mg/L) from broiler flocks, fattening turkey flocks, meat from broilers, and meat from turkeys, EU/EEA MSs (2016)
| Salmonella serovar | MIC (mg/L) | Total | |||
|---|---|---|---|---|---|
| 4 | 8 | 16 | > 16 | ||
| Broiler flocks | |||||
| S. 1,4,[5],12:i:‐ | 1 | 0 | 0 | 0 | 1 |
| S. Cerro (1 IT) | 0 | 1 | 0 | 0 | 1 |
| S. Dublin (1 ES) | 1 | 0 | 0 | 0 | 1 |
| S. Enteritidis (1 CZ, 1 PT, 2 RO) | 29 | 4 | 0 | 0 | 33 |
| S. Infantis (1 DE, 2 IT) | 3 | 0 | 0 | 0 | 3 |
| S. Kentucky (4 RO) | 4 | 0 | 0 | 0 | 4 |
| Total | 38 | 5 | 0 | 0 | 43 |
| Fattening turkey flocks | |||||
| S. Enteritidis (1 CZ) | 1 | 0 | 0 | 0 | 1 |
| S. Typhimurium (1 PL) | 1 | 0 | 0 | 0 | 1 |
| Total | 2 | 0 | 0 | 0 | 2 |
| Meat from broilers | |||||
| S. Enteritidis | 9 | 0 | 0 | 0 | 9 |
| S. Infantis | 1 | 0 | 0 | 0 | 1 |
| S. Paratyphi B dT+ (Java) | 0 | 3 | 0 | 0 | 3 |
| Total | 10 | 3 | 0 | 0 | 13 |
| Meat from turkeys | |||||
| S. Enteritidis | 2 | 0 | 0 | 0 | 2 |
| S. Paratyphi B dT+ (Java) | 0 | 1 | 0 | 0 | 1 |
| Total | 2 | 1 | 0 | 0 | 3 |
CZ: the Czech Republic; DE: Germany; ES: Spain; IT: Italy; PL: Poland; PT: Portugal; RO: Romania; MIC: minimum inhibitory concentration; MS: Member State.
There were no Salmonella spp. isolates for which MICs equalled or was greater than 16 mg/L. Among those isolates exhibiting a MIC of colistin of 4 or 8 mg/L, a number of them (S. Enteritidis and S. Dublin isolates) belong to serogroup O:9 whose isolates are reported to show higher intrinsic levels of resistance to colistin than other serogroups. The other Salmonella serovars in Table 31 do not belong to serogroup O:9 and while some display resistance only one dilution above the breakpoint, others show higher levels of resistance, such as S. Cerro and S. Paratyphi B dT+ (Java) isolates. The S. Paratyphi B dT+ (Java) isolates recovered from meat from broilers (n = 3) and meat from turkeys (n = 1) exhibiting a MIC of colistin of 8 mg/L originated from Germany, whereas the S. Cerro (n = 1) and S. Enteritidis (n = 4) exhibiting a MIC of colistin of 8 mg/L originated from Italy, and the Czech Republic, Portugal and Romania, respectively.
3.2.11. Multidrug resistance patterns in certain Salmonella serovars
The data on Salmonella spp. from an MS typically cover a variety of different serovars, each of which may have a different propensity to exhibit AMR. Differences in the occurrence of serovars among MSs may account for much of the pronounced variation in the recorded MDR parameters for Salmonella spp. For example, S. Enteritidis in general exhibited much lower MDR than S. Infantis; however, there were marked differences between MSs in the occurrence of MDR for each of these serovars.
Salmonella spp.
The patterns of AMR exhibited by all reported Salmonella isolates revealed numerous combinations of resistance to the nine different antimicrobial agents included in the analysis. The occurrence of specific MDR profiles reported by MSs in meat and animals are presented in the MDR patterns tables. In meat from broilers, five serovars (Infantis, Enteritidis, Kentucky, Give and Typhimurium) accounted for 76.4% of Salmonella spp. (Table SERBRMEATD). There were a further 35 serovars reported from meat from broilers. In broilers, six serovars (Infantis, Enteritidis, Mbandaka, Kentucky, Senftenberg and Typhimurium) accounted for 66.6% of Salmonella spp. (Table SERBRD). There were a further 94 serovars reported from broilers and 45 of these were represented by only single isolates. In laying hens, six serovars (Enteritidis, Infantis, Kentucky, Mbandaka, Typhimurium and Livingstone) accounted for 62.3% of Salmonella spp. (Table SERLAYD). There were a further 95 serovars reported from broilers and 43 of these were represented by only single isolates. In meat from turkeys, eight serovars (Bredeney, Anatum, Hadar, Newport, Saintpaul, Kentucky, Infantis and Senftenberg) accounted for 80% of Salmonella spp. (Table SERTURMEATD). There were a further 20 serovars reported from meat from turkeys. In fattening turkeys, nine serovars (Derby, Infantis, Newport, Kedougou, Bredeney, Kentucky, monophasic Typhimurium, and Hadar) accounted for 74.4% of Salmonella spp. (Table SEROFATTURKD). There were a further 30 serovars reported from fattening turkeys.
Detailed analysis of the specific patterns of resistance detected is most useful when performed at the serovar level. However, the overall data from all Salmonella spp. have also been examined to determine the pattern most common in highly prevalent sources per country. In meat from broilers, where 384/759 (50.6%) of isolates were MDR (Table MULTISALMBRMEAT) and broilers, where 685/1,675 (40.9%) of isolates were MDR (Table MULTISALMBR), the most common resistance pattern was a combination of ciprofloxacin/nalidixic acid, sulfamethoxazole and tetracycline, followed in broilers by the same pattern with the addition of ampicillin and gentamicin, and in meat from broilers by the same pattern with the addition of trimethoprim; both patterns accounted for 29.0% of the meat from broilers isolates and 24.5% of the broilers isolates were included in the analysis. Most isolates with the patterns ciprofloxacin/nalidixic acid, sulfamethoxazole and tetracycline of resistance both from broiler meat (97.3% of isolates with this pattern) and from broilers (98.3% of isolates with this pattern) were monophasic S. Infantis. This resistant profile (ciprofloxacin/nalidixic acid, sulfamethoxazole and tetracycline) was predominately reported in meat from broilers by Austria (41.7%), Hungary (60.5%) and Slovenia (82.4%), and in broilers by the same countries: Austria (52.5%), Hungary (57.1%) Slovenia (75.3%).
In laying hens 80/1,068 (7.5%) of isolates were MDR (Table MULTISALMLAY). The most common resistance pattern in laying hens was a combination of ciprofloxacin/nalidixic acid, sulfamethoxazole and tetracycline, followed by the combination of ampicillin, sulfamethoxazole and tetracycline; both patterns accounted for 45.0% of the isolates included in the analysis.
In meat from turkeys, where 70/289 (24.2%) of isolates were MDR (Table MULTISALMTURKMEAT), and in fattening turkeys, where 284/652 (43.6%) of isolates were MDR (Table MULTISALTURK), S. Infantis accounted for 8.6% of the MDR isolates in meat from turkeys and 19.4% of the MDR isolates in fattening turkeys. The most common pattern in meat from turkeys was the combination: ampicillin, ciprofloxacin/nalidixic acid and tetracycline, whereas in fattening turkeys it was the combination: ciprofloxacin/nalidixic acid, sulfamethoxazole and tetracycline.
Salmonella Enteritidis
The patterns of MDR for S. Enteritidis isolates were reported from meat from broilers (1 isolate was MDR out of 4 isolates reported, 25.0%) (Table MULTIENTERBRMEAT), broilers (2 isolates were MDR out of 88 isolates reported, 2.3%) (Table MULTIENTERBR) and laying hens (5 isolates were MDR out of 99 isolates reported, 5.1%) (Table MULTIENTERLAY).
Salmonella Infantis
MDR S. Infantis isolates were reported in broiler meat (72.7%) (299 isolates were MDR out of 411 S. Infantis isolates reported) (Table MULTIMOTYPHIPIGMEAT), broilers (58 isolates were MDR out of 74 isolates reported, 78.4%) (Table MULTIINFANTURK), laying hens (14 isolates were MDR out of 73 S. Infatis isolates reported, 19.2%) (Table MULTIINFANTURK) and fattening turkeys (55 isolates were MDR out of 82 S. Infantis isolates reported, 67.1%) (Table MULTIINFANTURK). The most frequent MDR core pattern was resistance to ciprofloxacin/nalidixic acid, sulfamethoxazole and tetracycline in most sources. Resistance to cefotaxime/ceftazidime was reported in two isolates meat from broilers, eight isolates from broilers and was absent in all other sources.
Salmonella Kentucky
The MDR patterns for S. Kentucky isolates were reported from meat from turkeys (10 isolates were MDR out of 11 isolates reported, 90.9%) (Table MULTIKENTUCKYTURKMEAT), fattening turkeys (39/46, 84.8%) (Table MULTIKENTURK), meat from broilers (15/25, 60%) (Table MULTIKENBRMEAT), broilers (58/78, 78.4%) (Table MULTIKENTBR) and laying hens (14 isolates were MDR out of 73 isolates reported, 19.2%) (Table MULTIKENTLAY). The most frequent pattern of resistance observed was resistance to ampicillin, ciprofloxacin/nalidixic acid, gentamicin, sulfamethoxazole and tetracycline occurring in all MDR isolates.
Salmonella Typhimurium
The patterns of MDR for S. Typhimurium isolates were reported from meat from turkeys (4 isolates were MDR out of 8 isolates reported, 50%) (Table MULTITYPHITURKMEAT), from fattening turkeys (8 isolates were MDR out of 14 isolates reported, 57.1%) (Table MULTITYPHITURK), broilers (25 isolates were MDR out of 40 isolates reported, 62.5%) (Table MULTITYPHIBR) and laying hens (4 isolates were MDR out of 17 isolates reported, 23.5%) (Table MULTITYPHILAY).
Monophasic Salmonella Typhimurium
The patterns of MDR for monophasic S. Typhimurium isolates were reported from laying hens (14 isolates were MDR out of 30 isolates reported, 46.7%) (Table MULTIMONTYPHILAY) and broilers (24 isolates were MDR out of 42 isolates reported, 57.1%) (Table MULTIMONTYPHIBR).
Salmonella Mbandaka
The patterns of MDR for S. Mbandaka isolates were reported from laying hens and broilers (2 isolates were MDR out of 5 isolates reported, 40%) (Table MULTIMBALAY and MULTIMBABR).
Salmonella Newport
The patterns of MDR for S. Newport isolates were reported from fattening turkeys (24 isolates were MDR out of 47 isolates reported, 51.1%) (Table MULTINEWNTURK).
3.2.12. Discussion
Antimicrobial resistance in Salmonella in humans
Salmonellosis is the second most commonly reported zoonotic disease in humans in the EU, exceeded only by campylobacteriosis. A decline in incidence was observed since 2004, most likely attributable to the reduction in the prevalence of Salmonella in flocks of laying hens and, to some extent, in broilers and turkeys. The number of cases of salmonellosis in the EU however stabilised in the last 5 years. Infections with S. Enteritidis increased significantly in this period in eight Member States along with an increase in prevalence of S. Enteritidis in laying hens (EFSA and ECDC, 2016a). While most salmonellosis infections cause mild disease, effective antimicrobials are essential for treatment of severe enteric disease or invasive infections.
In 2016, information on AMR in Salmonella spp. isolates from human cases was reported by 23 MSs and 2 non‐MS. Resistance in Salmonella spp. isolates from humans was high to ampicillin, sulfamethoxazole and tetracycline, slightly higher than in 2015, possibly due to the varying subset of countries reporting each year, the number of isolates tested by each country and the serotypes tested. These antimicrobials or other agents of the same class are used commonly for treating infections in animals and humans (although usually not for treating Salmonella infections in humans).
Resistance to ciprofloxacin, a critically important antimicrobial for treating salmonellosis in adults (WHO, 2017), stabilised in Salmonella spp. isolates from humans in 2015–2016 after a few years of increasing resistance. Several factors may have contributed to the increase. EUCAST lowered the threshold for clinical resistance significantly in 2014 which affected results from countries reporting interpreted susceptible, intermediate, resistant (SIR) data. Reporting of quantitative antimicrobial susceptibility testing (AST) results was implemented in TESSy from 2013 onwards, rendering it possible for ECDC to interpret the data with ECOFFs. The most significant change was however the recommendation from EUCAST in 2014 to replace ciprofloxacin discs with pefloxacin discs in disc diffusion testing of Salmonella spp. for better detection of low‐level fluoroquinolone resistance. The level of ciprofloxacin and nalidixic acid resistance are now comparable in most countries, with the exception of Germany and Greece where ciprofloxacin resistance levels were significantly lower than those for nalidixic acid. This is most likely due to the fact that Germany applied CBPs from the Deutsches Institut für Normung (DIN) standard, which for ciprofloxacin is less sensitive than the EUCAST CBPs and ECOFF, and that Greece had not yet replaced the discs in the disc diffusion testing from ciprofloxacin to pefloxacin (started only in 2017). To circumvent the impact of these changes when assessing trends in fluoroquinolone resistance over time, resistance results were combined from the drugs ciprofloxacin, nalidixic acid and pefloxacin.
Resistance to cefotaxime (a cephalosporin), the second critically important antimicrobial drug for salmonellosis, used for treating infections in children (WHO, 2017), was relatively low in Salmonella isolates from humans. The highest proportion of resistant isolates was reported in Malta and related to ESBL‐producing S. Kentucky (see discussion on S. Kentucky further below and in chapter 3.5 ESBL‐, AmpC‐ and/or carbapenemase‐producing Salmonella and E. coli). Combined resistance to both of the two critically important antimicrobials was low overall in Salmonella isolates from humans but higher in some serovars, e.g. 15.8% in S. Kentucky, ranging from 0% to 65% depending on country (data not shown).
The serovar distribution within the Salmonella spp. varies by country depending on their frequency among human cases and/or specific sampling strategies for further typing and susceptibility testing at the national public health reference laboratories. For this reason, comparisons between countries should be avoided at the level of Salmonella spp. Because of the compulsory antimicrobial susceptibility testing of isolates from poultry in 2016, the analysis of human data focused on the most common serovars found in poultry.
The most striking resistance trait of S. Enteritidis, the serovar which accounted for almost 50% of Salmonella infections in 2016, is the higher proportion of quinolone and fluoroquinolone resistance compared to Salmonella spp. in general. This was observed in isolates from humans in 2016 as well as in isolates from broiler flocks and laying hens, though proportions varied by country. Fluoroquinolone levels were increasing in two MSs (Finland and Germany) in the years 2013–2016 while five MSs observed a decreasing level. Multidrug resistance was however rare, as was combined resistance to the two critical antimicrobials. To note is that the S. Enteritidis strains involved in the large multinational food‐borne outbreak linked to eggs, involving 14 EU/EEA countries and more than 200 laboratory‐confirmed cases in 2016 and continuing in 2017 (ECDC & EFSA, 2017), were susceptible to the tested antimicrobials (TESSy data).
S. Typhimurium continued to be the second most common serovar among human Salmonella infections also in 2016. Although it was among the top ten serovars in broilers and laying hens, transmission is more often associated with consumption of pork products. The proportion of isolates resistant to ampicillin, sulfonamides and tetracycline was high to extremely high in S. Typhimurium isolates from humans in all but two reporting MSs. Resistance to ciprofloxacin was relatively low but extremely high levels were observed in Estonia and high levels in Portugal. While Portugal usually report higher proportions of ciprofloxacin resistance, this has not been the case for Estonia. Increasing trends of fluoroquinolone resistance in S. Typhimurium was observed in five MSs in the period 2013–2016 (and decreasing in one). Multidrug resistance was common and particularly high in Estonia, Portugal and Spain. Six S. Typhimurium isolates from five different countries were resistant to seven or eight antimicrobial classes, only susceptible to meropenem and gentamicin or meropenem and trimethoprim.
S. Infantis is now the fourth most common serovar among human Salmonella infections, the most common serovar in broiler flocks and the second most common in laying hens and turkeys. While extremely high proportions of S. Infantis in broilers and fattening turkeys were resistant to quinolones, fluoroquinolones, sulfonamides and tetracycline, similarly high proportions were only found in human isolates from two of 23 reporting countries, Austria and Slovenia. These two countries, plus Hungary and Croatia, accounted for a large proportion (61%) of the S. Infantis isolates from broilers. It is therefore possible that the mentioned multidrug resistance pattern represents a clone of S. Infantis prevalent in that geographical region. No human isolates of the ESBL‐producing S. Infantis clone which emerged in Italian poultry in 2011, was reported to the national reference laboratory in 2016 though cases were reported at the local level (personal communication I. Luzzi and C. Lucarelli, Istituto Superiore di Sanità, April and July 2017). See further discussion on this clone in Chapter 3.5 ESBL‐, AmpC‐ and/or carbapenemase‐producing Salmonella and E. coli.
S. Kentucky was the seventh most common serovar in human Salmonella infections in the EU in 2016. As highlighted in previous years, a multidrug‐resistant clone of S. Kentucky ST198 with high‐level ciprofloxacin resistance is rapidly spreading throughout Europe and elsewhere in the world, both in humans and in the food chain. The clone, which is considered to have been imported to Europe via travellers to North Africa, often carries resistance to amoxicillin, gentamicin, sulfonamides and tetracycline, in addition to quinolones (Le Hello et al., 2013). This resistance pattern was observed in a high to extremely high proportion of S. Kentucky isolates from humans, broilers and fattening turkeys in 2016. Hospital admission has been observed more frequently among ciprofloxacin‐resistant strains of S. Kentucky than ciprofloxacin‐susceptible strains (Le Hello et al., 2011). It is therefore of concern that ESBL‐producing isolates of S. Kentucky from humans were reported from four MSs (Belgium, Luxembourg, Malta and the Netherlands) and possible ESBL‐producing S. Kentucky (based on clinical resistance to cephalosporins) from an additional MS (Germany). All the ESBL‐producing isolates were resistant to ciprofloxacin (with MIC ≥ 8 mg/L where quantitative data were provided) and MDR, which makes these infections difficult to treat. A few of the cases in Malta experienced prolonged infections and at least one case resulted in sepsis. Findings of ESBL‐producing bla CTX‐M S. Kentucky ST198 has been reported from turkeys in Poland since 2009 (Wasyl et al., 2015). ESBL‐producing bla SHV‐12 S. Kentucky, not of ST198, was also reported in broilers in Ireland in 2008–2009 (Boyle et al., 2010). No finding of ESBL‐producing S. Kentucky in poultry was however reported to EFSA in 2016, although cefotaxime resistance was observed in isolates from broilers in Malta.
Considering the occurrence of high MDR among some of the most common serovars (including also monophasic S. Typhimurium), high ciprofloxacin resistance in some serovars and some findings of ESBL‐production, it is important to monitor Salmonella for resistance also to last line antimicrobials such as meropenem, colistin, azithromycin and tigecycline that may need to be considered for treatment of extremely drug‐resistant isolates. For 2016, all MSs except one reported data on meropenem. No meropenem resistance was detected; however, meropenem results were interpreted with CBPs in 7 of 23 reporting countries and the EUCAST CBPs are much less sensitive than the EUCAST ECOFF. See further discussion on this issue in Chapter 3.5 ESBL‐, AmpC‐ and/or carbapenemase‐producing Salmonella spp. and E. coli. Six countries reported data on the other last‐resort drugs. A fairly high proportion of isolates were resistant to colistin, particularly in S. Enteritidis in France and the Netherlands, considering that this is a last line antimicrobial. This observation could be due to that inherent resistance to colistin is common among certain Salmonella serovars, e.g. S. Dublin and S. Enteritidis, which share the same somatic antigens (O:1,9,12) (Agersø et al., 2012). The methodology for susceptibility testing of colistin has also been debated. In 2016, EUCAST and CLSI published a joint recommendation on the method (CLSI & EUCAST, 2016). Because of the methodology problems, EUCAST withdrew the ECOFF for Salmonella and colistin. Until it is replaced, EFSA and ECDC have to apply the CBPs for Enterobacteriaceae for interpretation of colistin data. Azithromycin and tigecycline resistance was low in the six reporting MSs. From June 2016, colistin, azithromycin and tigecycline are listed as priority antimicrobials for AMR monitoring in human Salmonella isolates (ECDC, 2016), which will most likely result in more countries testing these antimicrobials, as was the case for meropenem. In the absence of routine monitoring, resistance to last line antimicrobials may grow and remain undetected. Resistance to last line antimicrobials not used in food‐producing animals may be related to cross‐resistance to agents used in food‐producing animals for some agents, or to antimicrobial use in humans or exposure to sources of Salmonella spp. other than those associated with food‐producing animals.
In this report, isolates from cases reported as having been acquired while travelling abroad were excluded from the analysis. The rationale was to facilitate assessment of the relationship between antimicrobial resistance in Salmonella spp. isolates from food and food‐producing animals with antimicrobial resistance in human isolates of Salmonella spp. However, as imported or traded food can constitute a large proportion of the food available in some countries, the relationship between resistance in food and food‐producing animals and in the human population remains complex. An example of this in 2016 was an outbreak of S. Enteritidis in Finland originating from seeds imported from a non‐member country (THL, 2017, RASFF 2016.1007). Since the strain was ciprofloxacin resistant (as well as multidrug‐resistant) and many people were affected, this caused a significant increase in the rates of ciprofloxacin resistance in Salmonella spp. from humans, not corresponding to the situation in domestically produced food of animal origin. To better understand the sources of antimicrobial resistance in domestically acquired Salmonella isolates, it would be of value to collect AST data from structured sampling at retail of both animal and non‐animal foods, including information on country of origin.
Interpretation of monitoring results must also take into account the variation in the sampling and testing strategies for Salmonella spp. between MSs. While differences in the number of reported isolates by country may in part be related to true differences in the incidence of salmonellosis, it is also likely to be greatly influenced by practices in the country related to the capture of isolates and/or data from primary clinical laboratories. In order for the resistance situation to be reflected correctly, it is important that countries submit AST data on a representative subset of human Salmonella spp. isolates, without an overrepresentation of outbreak cases or serovars of particular interest. ECDC requested that laboratories put more emphasis on this aspect in future data collections and some countries have already adapted to this request, e.g. France, while others are continuously providing AST data from all laboratory‐confirmed cases in the country, e.g. Ireland.
The quality of the AMR data for Salmonella spp. from humans continues to improve as the result of the agreement on harmonised monitoring and reporting (ECDC, 2014, 2016) and related external quality assessment (EQA) schemes. For 2016, 17 of 25 reporting countries provided data as measured values to which ECOFFs could be applied. This was three more countries than for 2015. Eight countries still provided results interpreted with CBPs. By combining the categories of clinically ‘intermediate’ resistant and clinically ‘resistant’, the ECOFF‐based category of ‘wild type’ corresponds closely to the ‘susceptible’ category and the ECOFF‐based category of ‘non‐wild type’ corresponds closely to the ‘non‐susceptible’ category with only one dilution difference across all antimicrobials except meropenem (see above). Therefore, this approach further improves the comparability of human and non‐human data. For future reports, EFSA and ECDC anticipate that more countries will report measured values.
Antimicrobial resistance in Salmonella from poultry and their meat
In Salmonella spp. isolates from poultry and meat, harmonised isolate‐based data were reported by 22 MSs and two non‐MS in 2016. The isolate‐based data enable the analysis of MDR patterns, high level of resistance to ciprofloxacin and co‐resistance to ciprofloxacin and cefotaxime, agents critically important for treating human salmonellosis. The levels of resistance are presented by serovar for the different animal production types; the division of Gallus gallus into broilers and laying hens is particularly relevant. The subdivision of resistance data allows for more accurate analysis and as required by the legislation, all MSs included information on serovars and production type. In 2016, MSs collected Salmonella isolates for susceptibility testing according to the harmonised monitoring plan (Commission Implementing Decision 2013/652/EU). In line with this decision, the antimicrobial agents included in the test panels were changed in 2014; most importantly, testing of resistance to streptomycin was not required, which had an impact on how MDR patterns were interpreted. The animal and meat sections in this chapter focus primarily on Salmonella spp. from poultry and poultry meat, reflecting the monitoring plan for 2016 set out in the Decision.
Antimicrobials such as ampicillin, sulfamethoxazole and tetracycline have been widely used for many years in veterinary medicine to treat infections in production animals. Generally, moderate to high levels of resistance to these antimicrobials are reported by MSs from producing animals and their meat. The highest levels of resistance to tetracycline, ciprofloxacin and sulfamethoxazole were recorded in Salmonella spp. isolates from either Gallus gallus or fattening turkeys and their meat Considering all reporting MSs, isolates from laying hens displayed the lowest levels of resistance to these antimicrobials. Full susceptibility to all the antimicrobials tested on Salmonella spp. isolates displayed in this report varied among the reporting countries. Nevertheless, a North‐West to South‐East gradient was observed whatever the animal species studied. Levels of resistance were generally higher in Salmonella spp. from broiler flocks than from laying hen flocks. This may reflect that laying hens are usually less frequently treated with antimicrobials than broilers. In many MSs, only a limited number of antimicrobial compounds are authorised for the treatment of laying hens and the relatively higher levels of ciprofloxacin resistance in layers, compared to other antimicrobials, may reflect that this is one of the compounds available (although it is also available for the treatment of broilers) or may possibly reflect an association ciprofloxacin resistance in the three most reported serovars, namely S. Enteritidis, S. Infantis and S. Kentucky, with laying hens.
Colistin‐resistant Salmonella spp. isolates were detected by several MSs originating from broilers, laying hens and fattening turkeys. The occurrence of resistance to fluoroquinolones (ciprofloxacin) was encountered at high to very high level in the animal species and sources, except in laying hens. In the reported data, it is clear that S. Kentucky and S. Infantis were mainly responsible for the occurrence of fluoroquinolone resistance in the mentioned sources, which is highly suggestive of clonal expansion (S. Kentucky ST198‐X1) in the production of the food animals, especially poultry (Le Hello et al., 2011, 2013; Westrell et al., 2014). Although genetic typing of isolates would be required for definitive confirmation, the predominance of particular MDR or other resistance patterns in isolates of Infantis and Kentucky as well as published national reports also support clonal expansion.
Third‐generation cephalosporins and fluoroquinolones are critically important for the treatment of life threatening, invasive, human salmonellosis. Co‐resistance to cefotaxime and ciprofloxacin is described at overall very low to low level by some MSs and was not detected in isolates from most MSs. Hungary reported a S. Infantis isolate from broiler meat also resistant to tetracycline and sulfamethoxazole. Malta reported a S. Kedougou isolate from broiler flocks resistant at high level (> 4 mg/L) to ciprofloxacin and also resistant to ampicillin, cefotaxime, ceftazidime, gentamicin, sulfamethoxazole and tetracycline.
As in previous years, the reported levels of ciprofloxacin and nalidixic acid resistance in isolates from the different types of meat or animal species between MSs were generally very similar; however, isolates with resistance to ciprofloxacin, but susceptible to nalidixic acid, were also reported probably indicating the occurrence of plasmid‐mediated qnr genes leading to fluoroquinolone, but not to nalidixic acid, resistance. This was particularly a feature of Salmonella spp. isolates from broilers in Greece, Poland, Romania, Spain and the United Kingdom, from turkeys in Hungary and Spain, and from broiler and turkey meat in Poland, although it was also present to a lesser extent in isolates from layers from some MSs.
MDR, defined as resistance to 3 or more of 11 antimicrobial classes tested, was generally higher in Salmonella spp. from broilers (46.3% of isolates) and turkeys (59.5% of isolates) than in layers (11% of isolates). In broilers, the proportion of all isolates showing MDR, was greatly influenced by the occurrence of MDR S. Infantis and S. Kentucky. Generally, the resistance levels varied among serovars that may exhibit particular MDR patterns, so the relative contribution of different serovars in different production types and between MSs should be kept in mind when comparing the situation between the reporting countries. The analysis of MDR resistance patterns also highlighted multiresistant strains of Salmonella spp. occurring in several MSs. High‐level ciprofloxacin resistance (MIC > 4 mg/L) was mostly observed in multiresistant S. Kentucky isolates from broilers, laying hens and turkeys. It was displayed by much lower numbers of other serovars (Infantis, Corvallis, Kedougou). The MSs reporting high levels of ciprofloxacin‐resistant S. Kentucky isolates in 2014 (Cyprus, the Czech Republic, Hungary, Italy, Poland, Romania, Spain) also reported similar findings in 2016. Those early reporting MS are now joined in 2016 by Belgium, Germany, Greece, Malta, Portugal, Slovakia, the United Kingdom who reports high level of resistance to ciprofloxacin S. Kentucky in poultry flocks or their meat. This finding confirms the rapid geographical spread of S. Kentucky in European poultry flocks.
There were no Salmonella spp. isolates recovered from poultry in 2016 which were resistant to carbapenems, a class of antimicrobials which is not used therapeutically in food‐producing animals, but which is reserved for use in human. Supplementary testing of those Salmonella spp. isolates which were resistant to the indicator cephalosporins (cefotaxime and ceftazidime) with a further panel of antimicrobials revealed the presence of isolates with ESBL, AmpC and combined ESBL plus AmpC phenotypes. Most MSs reported low numbers of isolates with these phenotypes, though in Italy, S. Infantis with an ESBL phenotype contributed to moderate level of cephalosporin resistance in Salmonella from broilers. This occurrence in a restricted geographical region of Europe suggests clonal expansion and spread within broilers in this region. S. Heidelberg with an AmpC phenotype reported by the Netherlands in 2014, and frequently described in the United States and Canadian poultry flocks over the past 15 years, has not been reported by any MS in 2016.
Within a given MS, any attempt to relate AMR in human Salmonella spp. isolates to AMR in isolates from food and food‐producing animals in that MS is complicated, because much of the food consumed in an MS may have originated in other MSs or in non‐member countries. Salmonella spp. infections can also be associated with foreign travel, other types of animal contact (such as pet reptiles) or the environment. Some human infections can also occur through human to human transmission. To improve investigation of these relationships, isolates from cases notified as having been acquired during travel outside of the reporting country were excluded from the analysis, except with respect to the analysis of resistance in different geographical regions. Further improvement of our surveillance would be able to distinct between food isolates from domestically produced animals and those imported from other countries.
MDR and ESBL‐producing Salmonella Infantis.
In 2016, S. Infantis has been the first most frequently reported serovar in the flocks of broilers and in their meat and the second, in the flocks of laying hens and of fattening turkey flocks in the EU. Over the last decade, MDR S. Infantis has increasingly been reported in food‐producing animals and in humans in Italy. In cross‐sectional studies performed in Italian broiler sector at slaughter in 2014 and 2016 (sampling frame: Commission Implementing Decision 2013/652/EU), S. Infantis accounted for 75% and 90% of all isolates detected, respectively, with an among flock prevalence of 9.6% (68/709) in 2014 and 8.7% (70/807) in 2016. An emerging clone harbouring a megaplasmid (around 300 kbp) termed pESI, which carries virulence, fitness and MDR genes/traits, along with CTX‐M‐1 ESBL in an increasing proportion of isolates, was detected in these surveys (3/90 in 2014 and 16/77 in 2016 were MDR, ESBL‐producing S. Infantis, respectively). The pESI‐positive, ESBL‐producing clone was retrospectively identified in the Italian poultry industry in isolates dating back 2011 and soon after as a cause of human salmonellosis (Franco et al., 2015). This emergence is however not limited to Italy and Europe, since a MDR pESI‐positive S. Infantis was firstly described in Israel (Aviv et al., 2014) and it has been also recently identified in chickens, cattle and humans in the USA through the routine National Antimicrobial Resistance Monitoring System (NARMS) surveillance program (Tate et al., 2017). However, it is necessary to highlight that these pESI‐positive isolates from the USA are phylogenetically different from the emerging ESBL‐producing clone detected in the Italian broiler chicken industry. Additionally, the USA isolates carry an ESBL gene (CTX‐M‐65) which is different from the CTX‐M‐1 gene of the ‘broiler chicken’ clone described in Italy, as already demonstrated previously in the Italian study. An on‐going EFSA funded research project called ENGAGE (Establishing Next Generation sequencing Ability for Genomic analysis in Europe) is currently exploring the European spread of this MDR pESI‐positive S. Infantis. Results will be made publicly available in the coming years.
4. Antimicrobial resistance in Campylobacter
Human infections with Campylobacter .
Campylobacter causes many human cases of gastroenteritis and, despite considerable underreporting (Haagsma et al., 2013; Havelaar et al., 2013; Gibbons et al., 2014), campylobacteriosis has been the most frequently reported cause of human food‐borne zoonoses in the EU since 2005 (EFSA and ECDC, 2017a). In 2016, 246,307 laboratory‐confirmed cases of campylobacteriosis were reported in the EU/EEA. C. jejuni and C. coli accounted for 99.7% of cases with species information. Patients infected with Campylobacter may experience mild to severe illness. Symptoms may include (bloody) diarrhoea, abdominal pain, fever, headache and nausea. The mean duration of illness is 2–5 days but can be up to 10 days. Most campylobacteriosis enteric infections are self‐limiting; however, infection can be associated with serious complications. Campylobacteriosis is a significant trigger for autoimmune inflammatory conditions of the central nervous system, heart and joints, which can result in prolonged and debilitating illness (e.g. Guillain–Barré syndrome, acute transverse myelitis and reactive arthritis). Blood stream infection with Campylobacter spp. is very rare, except for infections with C. fetus.
Antimicrobial treatment is usually not required, but effective treatment may shorten the duration of illness. Resistance to antimicrobials in Campylobacter is of concern because of the large number of human infections and the fact that some cases require treatment. Treatment of enteric infections in humans may involve administration of macrolides, such as erythromycin or fluoroquinolones (e.g. ciprofloxacin) as the first‐ and second‐choice drugs (ECDC, EFSA, EMEA and SCENIHR, 2009). With ciprofloxacin, resistance may develop rapidly.
4.1. Antimicrobial resistance in Campylobacter isolates from humans
Seventeen MSs, plus Iceland and Norway provided AMR data from human Campylobacter isolates for 2016. Thirteen countries reported quantitative isolate‐based AST results as measured values of either IZDs or MICs. Six countries reported case‐based or isolate‐based AST results interpreted as susceptible (S), intermediate (I) or resistant (R) according to the CBPs applied. Countries reporting resistance in Campylobacter from humans in 2016 are presented in Tables CAMPJEOVERVIEW and CAMPCOOVERVIEW.
As resistance levels differ substantially between C. jejuni and C. coli, data are reported separately for the two species. Results are presented for the four‐first‐priority antimicrobials currently included in the harmonised panel of antimicrobials to be tested with Campylobacter isolates from humans (ciprofloxacin, erythromycin, tetracycline and, since June 2016, gentamicin) and for one optional agent (co‐amoxiclav) (ECDC, 2016).
The multidrug resistance (MDR) analysis presented here included the four priority antimicrobials. The number of antimicrobials tested per isolate varied by country: all countries except one tested the three original priority antimicrobials (ciprofloxacin, erythromycin and tetracycline), 10 also tested gentamicin and four tested co‐amoxiclav, in addition.
Interpretation of data should take into account the wide variation in the numbers of Campylobacter isolates reported by MSs. While this may in part be related to true differences in the incidence of campylobacteriosis, it is also likely to be greatly influenced by practices related to referral of isolates from primary clinical laboratories to the national public health reference laboratory/ies or by reporting AST data from the primary laboratories to the national public health institutes.
Methods and interpretive criteria used for antimicrobial susceptibility testing of Campylobacter isolates from humans.
1.
Most laboratories fulfil the ‘EU protocol for harmonised monitoring of antimicrobial resistance in human Salmonella and Campylobacter isolates’ (ECDC, 2016) on the antimicrobial panel to be tested. The type of method (dilution, disk diffusion, gradient strip) and the interpretive criteria used when providing interpreted results for Campylobacter, are presented in Table 2, Materials and methods chapter.
Quantitative data were interpreted by ECDC based on the European Committee on Antimicrobial Susceptibility Testing (EUCAST) epidemiological cut‐off (ECOFF) values, when available. In the absence of ECOFFs, CBPs from the French Society for Microbiology (CA‐SFM) were applied. For the qualitative susceptible, intermediate, resistant (SIR) data, the intermediate and resistant results were combined into a ‘non‐susceptible’ category. For the four antimicrobials reported for both human and animal/food isolates, the commonly used interpretive criteria were aligned (Figure 65). For this purpose, ‘susceptible’ isolates were aligned with wild‐type isolates based on ECOFFs, and ‘non‐susceptible’ isolates (‘intermediate’ and ‘resistant’) were aligned with non‐wild‐type isolates. This resulted in total concordance across interpretive categories, except for the EUCAST CBP for C. jejuni for tetracyclines, which is one dilution step higher than the EUCAST ECOFF.
Figure 65.
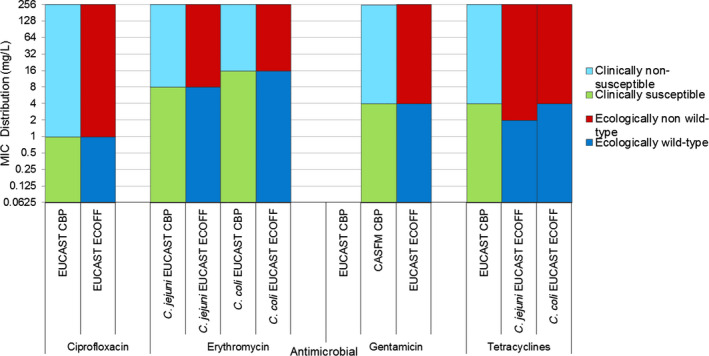
Comparison of clinical breakpoints (CBPs) and epidemiological cut‐off values (ECOFFs) used to interpret MIC data reported for Campylobacter spp. from humans, animals or food
Figure 65.
Comparison of clinical breakpoints (CBPs) and epidemiological cut‐off values (ECOFFs) used to interpret MIC data reported for Campylobacter spp. from humans, animals or food
4.1.1. Antimicrobial resistance in Campylobacter jejuni isolates from humans
As in previous years, C. jejuni was the most common Campylobacter species identified in 2016, with 109,530 cases reported in the EU/EEA. AST data were reported for 22.3% of these cases by 17 MSs, plus Iceland and Norway. A very high proportion (54.6%) of human isolates was resistant to ciprofloxacin in 2016 (17 MSs, Table 32) with extremely high proportions observed in several countries, most noticeably in Portugal (94.0%), Estonia (91.2%), Lithuania (86.9%), Cyprus (86.8%), Italy (85.0%) and Spain (84.5%). The lowest proportions of isolates resistant to ciprofloxacin were reported by Iceland (13.3%) and Denmark (33.3%). Similar observations were made on the levels of resistance to tetracyclines which were high overall (42.8%) with the highest proportion of resistance reported by Cyprus (86.8%), Portugal (82.0%), Spain (78.5%), Italy (67.5%), Estonia (63.8%) and Lithuania (63.6%) and the lowest reported by Denmark (16.0%) and Norway (19.7%). The level of resistance to erythromycin was overall relatively low (2.1%) but varied between countries. The highest proportion of erythromycin‐resistant isolates was reported by Norway (11.6%), Portugal (6.6%), Lithuania (6.1%) and Malta (5.3%). Resistance to gentamicin was overall very low (0.4%) but higher in Italy (4.1%) and Slovakia (2.9%).
Table 32.
Antimicrobial resistance in Campylobacter jejuni from humans per country in 2016
| Country | Gentamicin | Co‐amoxiclav | Ciprofloxacin | Erythromycin | Tetracyclines | |||||
|---|---|---|---|---|---|---|---|---|---|---|
| N | % Res | N | % Res | N | % Res | N | % Res | N | % Res | |
| Austria | 376 | 0.3 | – | – | 376 | 71.5 | 376 | 0 | 376 | 41.5 |
| Cyprus | – | – | – | – | 38 | 86.8 | 38 | 0 | 38 | 86.8 |
| Denmark | 294 | 0.7 | – | – | 294 | 33.3 | 294 | 1.0 | 294 | 16.0 |
| Estonia | – | – | – | – | 194 | 91.2 | 196 | 0 | 196 | 63.8 |
| Finlanda | – | – | – | – | 2,923 | 61.0 | 2,776 | 2.8 | 1,097 | 44.2 |
| Franceb | 5,108 | 0.3 | 5,614 | 0.2 | 5,616 | 55.3 | 5,615 | 0.6 | 5,390 | 46.8 |
| Italy | 74 | 4.1 | – | – | 80 | 85.0 | 80 | 3.8 | 80 | 67.5 |
| Lithuaniab | – | – | – | – | 289 | 86.9 | 329 | 6.1 | 275 | 63.6 |
| Luxembourg | – | – | 457 | 4.8 | 457 | 63.2 | 457 | 0.2 | 457 | 46.2 |
| Malta | 7 | NA | 8 | NA | 134 | 55.2 | 133 | 5.3 | 8 | NA |
| Netherlandsb | – | – | – | – | 2,401 | 56.1 | 2,102 | 1.9 | 1,715 | 39.0 |
| Portugal | 167 | 0.6 | – | – | 167 | 94.0 | 167 | 6.6 | 167 | 82.0 |
| Romania | 18 | 0 | 18 | 0 | 18 | 77.8 | 18 | 0 | 18 | 44.4 |
| Slovakiab | 34 | 2.9 | 109 | 2.8 | 639 | 51.8 | 862 | 1.0 | 665 | 27.2 |
| Slovenia | – | – | – | – | 1,192 | 66.4 | 1,193 | 0.4 | 1,192 | 37.2 |
| Spain | 265 | 1.1 | – | – | 265 | 84.5 | 265 | 2.6 | 265 | 78.5 |
| United Kingdomb | 32 | 0 | – | – | 7,593 | 44.4 | 7,092 | 3.3 | 3,381 | 36.3 |
| Total (17 MSs) | 6,375 | 0.4 | 6,206 | 0.6 | 22,676 | 54.6 | 21,993 | 2.1 | 15,614 | 42.8 |
| Icelandb | – | – | – | – | 60 | 13.3 | 60 | 0.0 | – | – |
| Norway | 173 | 0.6 | – | – | 171 | 41.5 | 173 | 11.6 | 173 | 19.7 |
N: number of isolates tested; % Res: percentage of resistant isolates (either non‐wild type by ECOFFs or clinically non‐susceptible by combining resistant and intermediate categories); –: no data reported; NA: not applicable – if fewer than 10 isolates were tested, resistance was not calculated.
Travel‐associated cases, accounting for 75% of Campylobacter infections in Finland in 2015, could not be excluded from the Finnish AST data.
Data interpreted with clinical breakpoints.
Spatial distribution of resistance among Campylobacter jejuni isolates from human cases
The spatial distribution of ciprofloxacin resistance in C. jejuni isolates from human cases (Figure 66) shows that the highest proportion of resistance was reported by southern and eastern European and Baltic countries, whereas northern and central European countries reported lower levels. Travel‐associated cases, accounting for 65% of Campylobacter infections in Finland in 2016, could not be excluded from the Finnish AST data. The levels of erythromycin resistance did not show any clear geographical trend (Figure 67).
Figure 66.
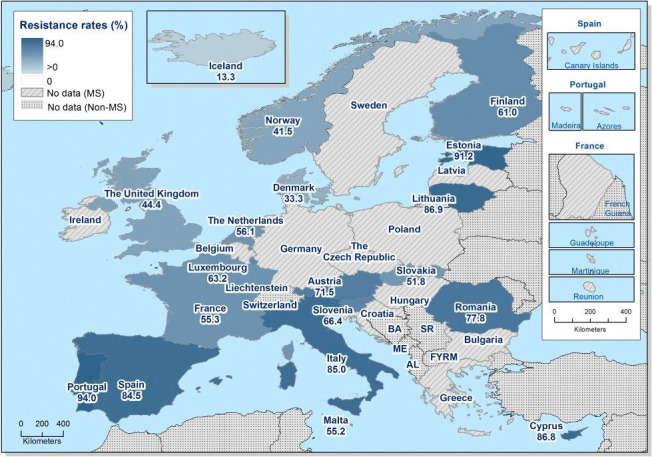
Spatial distribution of ciprofloxacin resistance among Campylobacter jejuni from human cases in reporting countries in 2016
Figure 67.
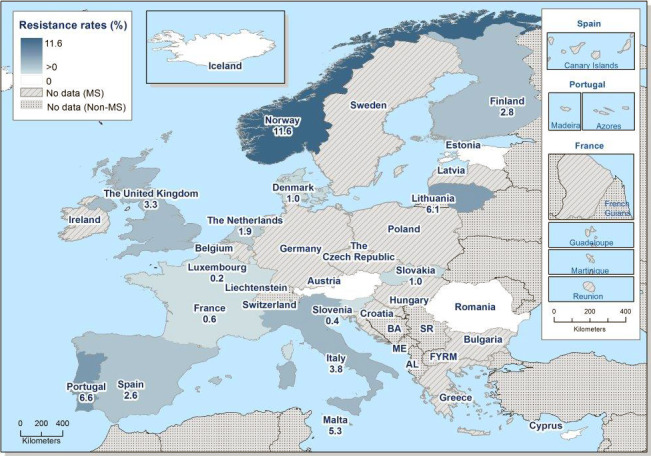
Spatial distribution of erythromycin resistance among Campylobacter jejuni from human cases in reporting countries in 2016
Temporal trends in resistance among C. jejuni isolates from humans
Trend analysis was performed for the years 2013–2016 for the three antimicrobials tested by most countries. Fifteen MSs and one non‐MS were included in the analysis as they had provided resistance data for a minimum of 3 years in this period and a minimum of 10 C. jejuni isolates (Figure 68). For ciprofloxacin resistance, statistically significant increases were observed in Austria, Estonia, France, Italy and Norway. Statistically significant decreases were observed in Spain and Malta. Resistance to erythromycin in C. jejuni remained stable at low levels in many countries during the period 2013–2016, with significantly increasing resistance observed in Lithuania, Norway and the United Kingdom and significant decreasing resistance observed in Luxembourg and Malta. Tetracycline resistance increased significantly in Austria, Estonia, Italy, Lithuania and Slovenia in the same period.
Figure 68.
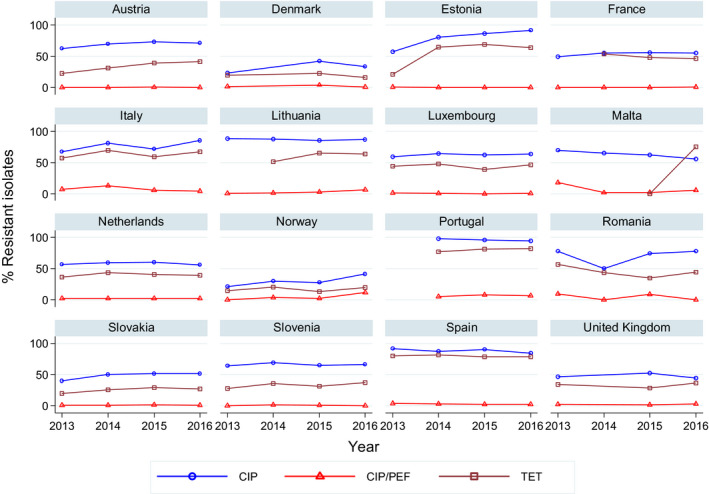
Trends in ciprofloxacin, erythromycin and tetracycline resistance in Campylobacter jejuni from humans in reporting countries, 2013–2016
- Statistically significant increasing trends over 3–4 years, as tested by logistic regression (p ≤ 0.05), were observed for ciprofloxacin in Austria, Estonia, France, Italy and Norway, for erythromycin in Lithuania, Norway and the United Kingdom and for tetracycline in Austria, Estonia, Italy, Lithuania and Slovenia. Statistically significant decreasing trends over 3–4 years were observed for ciprofloxacin in Malta and Spain, for erythromycin in Luxembourg and Malta. Only countries testing at least 10 isolates per year were included in the analysis.
High‐level erythromycin resistance in Campylobacter jejuni
To assess if transferrable erythromycin resistance due to the presence of the erm(B) gene was possibly present in C. jejuni isolates from humans in the EU/EEA, quantitative data were analysed for high‐level erythromycin MICs (> 128 mg/L) (see further text box on mechanisms of high‐level erythromycin resistance in Campylobacter spp. below). Of the C. jejuni isolates with MIC data, 1.2% (39 isolates) had a MIC > 128 mg/L (Figure 69). Such isolates were reported from six of seven countries which had provided quantitative data from dilution tests (Table 33). Similarly, for 47 of 3,367 isolates (1.4%) tested with disk diffusion no inhibition zone could be observed (6 mm zone equals the disk size), which corresponds to a MIC of ≥ 128 mg/L (EUCAST, 2017a). Note however that a high‐level erythromycin resistance also could be due to mutations in the genome and not necessarily transferrable resistance.
Figure 69.
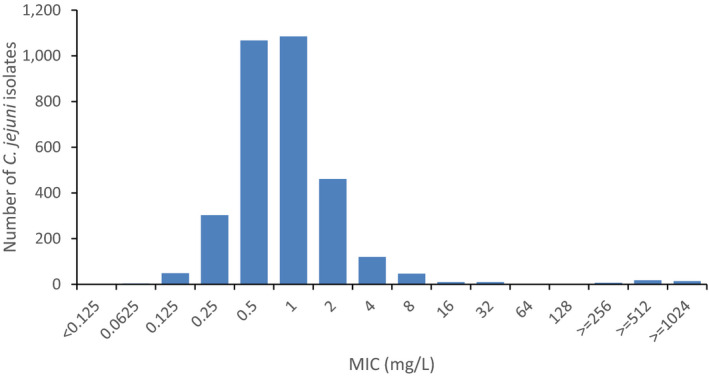
Erythromycin MIC distribution in C. jejuni from humans, 2016 (n = 3,198)
Table 33.
Occurrence of high‐level resistance to erythromycin (MIC > 128 mg/L) in Campylobacter jejuni from humans in 2016
| Country | N | High‐level resistance to erythromycin (MIC > 128 mg/L) | |
|---|---|---|---|
| n | % | ||
| Austria | 409 | 1 | 0.2 |
| Denmark | 365 | 2 | 0.5 |
| Finland | 1,119 | 18 | 1.6 |
| Luxembourg | 457 | 0 | 0.0 |
| Malta | 133 | 4 | 3.0 |
| Spain | 265 | 6 | 2.3 |
| Total (6 MSs) | 2,748 | 31 | 1.1 |
| Norway | 450 | 8 | 1.8 |
N: number of isolates; MIC: minimum inhibitory concentration.
MDR among Campylobacter jejuni isolates from humans
Seven MSs and Norway tested at least 10 isolates of C. jejuni for resistance to the four antimicrobial classes included in the MDR analysis. Overall, 33.8% of human C. jejuni isolates in the seven reporting MSs were susceptible to all four antimicrobial classes (7 MSs, Table COMCAMPJEHUM). The highest levels of susceptibility were reported from Denmark (62.6%) and Norway (53.2%). Particularly low levels of susceptibility were reported from Portugal (3.6%) and Spain (6.8%) (Figure 70). MDR was very low overall (0.8%) but higher when assessing the country average (2.3%). The highest proportions of MDR were observed in Portugal (6.6%), Italy (5.4%) and Norway (4.1%). A very low proportion of isolates (0.6% and 0.6%, respectively) in the seven MSs exhibited ‘microbiological’ as well as ‘clinical’ resistance to both ciprofloxacin and erythromycin, but higher levels were observed in Norway, Portugal and Italy. France reported five isolates, Spain three and Denmark, Italy and Malta one isolate each resistant to all four antimicrobial classes.
Figure 70.
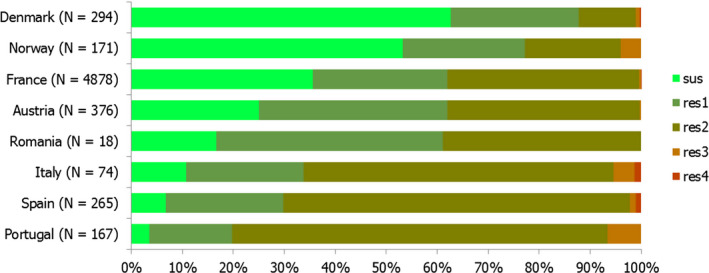
Frequency distribution of Campylobacter jejuni isolates from humans completely susceptible or resistant to one to four antimicrobial classes in 2016
4.1.2. Antimicrobial resistance in Campylobacter coli isolates from humans
With 11,193 human cases, C. coli was the second most common Campylobacter species reported in the EU/EEA in 2016. AST data were reported for 24.3% of these cases in 2016 by 16 MSs, plus Iceland and Norway. Very high proportions of resistance were observed for ciprofloxacin (63.8%) and tetracyclines (64.8%), with extremely high proportions (70.5–100.0%) resistant to ciprofloxacin in 9 of the 16 reporting EU countries (Table 34). Proportions of isolates resistant to erythromycin and gentamicin were markedly higher in C. coli than in C. jejuni (11.0% vs 2.1% and 1.7% vs 0.4%, respectively). Estonia, Portugal, Italy, Spain and Finland reported the highest levels of resistance to erythromycin (63.2, 50.0, 27.3, 23.7 and 22.8%, respectively).
Table 34.
Antimicrobial resistance in Campylobacter coli from humans per country in 2016
| Country | Gentamicin | Co‐amoxiclav | Ciprofloxacin | Erythromycin | Tetracyclines | |||||
|---|---|---|---|---|---|---|---|---|---|---|
| N | % Res | N | % Res | N | % Res | N | % Res | N | % Res | |
| Austria | 37 | 2.7 | – | – | 37 | 81.1 | 37 | 2.7 | 37 | 67.6 |
| Cyprus | – | – | – | – | 7 | NA | 7 | NA | 7 | NA |
| Estonia | – | – | – | – | 19 | 89.5 | 19 | 63.2 | 19 | 73.7 |
| Finlanda | – | – | – | – | 272 | 84.6 | 263 | 22.8 | 143 | 69.2 |
| Franceb | 797 | 1.6 | 881 | 0.5 | 882 | 67.0 | 881 | 6.4 | 851 | 77.3 |
| Italy | 9 | NA | – | – | 11 | 100 | 11 | 27.3 | 11 | 90.9 |
| Lithuaniab | – | – | – | – | 41 | 92.7 | 41 | 17.1 | 40 | 80.0 |
| Luxembourg | – | – | 53 | 26.4 | 53 | 84.9 | 53 | 13.2 | 53 | 81.1 |
| Malta | 6 | NA | 6 | NA | 61 | 70.5 | 61 | 9.8 | 7 | NA |
| Netherlandsb | – | – | – | – | 164 | 65.2 | 146 | 9.6 | 107 | 65.4 |
| Portugal | 34 | 0 | – | – | 34 | 100 | 34 | 50.0 | 34 | 91.2 |
| Romania | 16 | 0 | 16 | 0 | 16 | 31.3 | 16 | 0 | 16 | 18.8 |
| Slovakiab | 1 | NA | 24 | 12.5 | 53 | 60.4 | 64 | 4.7 | 66 | 37.9 |
| Slovenia | – | – | – | – | 130 | 66.2 | 130 | 2.3 | 130 | 47.7 |
| Spain | 38 | 5.3 | – | – | 38 | 84.2 | 38 | 23.7 | 38 | 84.2 |
| United Kingdomb | – | – | – | – | 747 | 44.3 | 678 | 11.1 | 360 | 35.6 |
| Total (16 MSs) | 938 | 1.7 | 980 | 2.7 | 2,565 | 63.8 | 2,479 | 11.0 | 1,919 | 64.8 |
| Icelandb | – | – | – | – | 1 | NA | 1 | NA | – | – |
| Norway | 10 | 0 | – | – | 10 | 80.0 | 10 | 10.0 | 10 | 90.0 |
N: number of isolates tested; % Res: percentage of resistant isolates (either non‐wild type by ECOFFs or clinically non‐susceptible by combining resistant and intermediate categories); –: no data reported; NA: not applicable (if less than 10 isolates were tested, the percentage of resistance was not calculated).
Travel‐associated cases, accounting for 65% of Campylobacter infections in Finland in 2016, could not be excluded from the Finnish AST data.
Data interpreted with clinical breakpoints.
Spatial distribution of resistance among Campylobacter coli isolates from humans
Ciprofloxacin resistance was very common in C. coli from humans in most reporting countries, with lower proportions reported only from the UK and Romania (Figure 71). In Italy and Portugal, all tested isolates were resistant to ciprofloxacin. The number of isolates tested by country was, however, often low. The proportions of erythromycin resistance was notably high in Estonia and Portugal (Figure 72). Note that data from Finland also include isolates from travel‐associated cases, accounting for 65% of Campylobacter infections in the country in 2016 as these could not be separated in the Finnish AST data provided by local laboratories.
Figure 71.
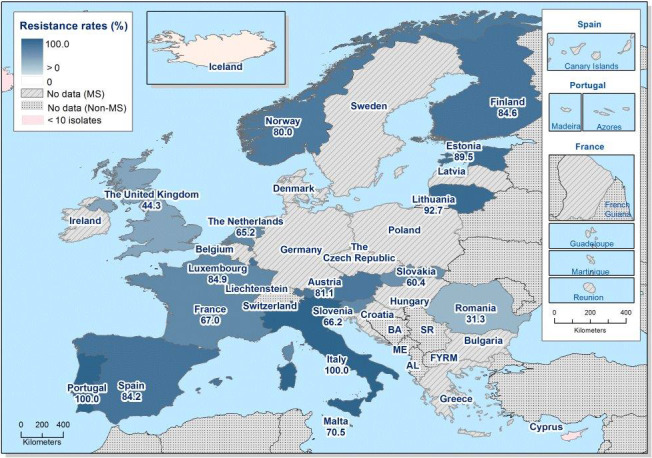
Spatial distribution of ciprofloxacin resistance among Campylobacter coli from human cases in reporting countries in 2016
Figure 72.
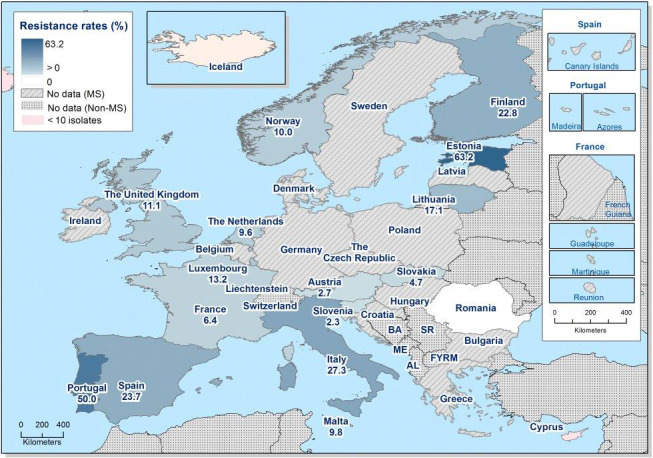
Spatial distribution of erythromycin resistance among Campylobacter coli from human cases in reporting countries in 2016
Temporal trends in resistance among C. coli isolates from humans
Trend analysis was performed for the years 2013–2016 and for the three antimicrobials tested by most countries. Twelve MSs were included in the analysis as they had provided resistance data for a minimum of 3 years in this period and a minimum of 10 C. coli isolates (Figure 73). For ciprofloxacin resistance in C. coli, statistically significant increases were observed in Lithuania and Luxembourg. Resistance to erythromycin decreased significantly in France. Significantly increasing trends were observed for tetracycline resistance in Austria, France, Lithuania, Malta, the Netherlands and the United Kingdom.
Figure 73.
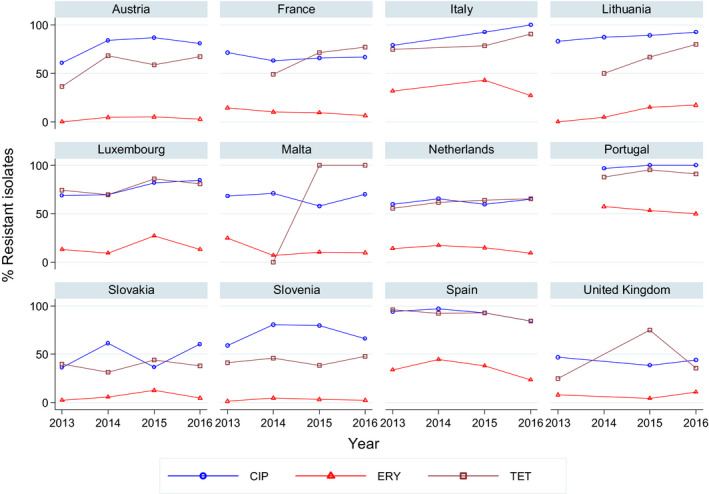
Trends in ciprofloxacin, erythromycin and tetracycline resistance in Campylobacter coli from humans in reporting countries, 2013–2016
- Statistically significant increasing trends over 3–4 years, as tested by logistic regression (p ≤ 0.05), were observed for ciprofloxacin in Lithuania and Luxembourg and for tetracycline in Austria, France, Lithuania, Malta, the Netherlands and the United Kingdom. Statistically significant decreasing trends over 3–4 years were observed for erythromycin in France. Only countries testing at least 10 isolates per year were included in the analysis.
High‐level erythromycin resistance in Campylobacter coli
Of the 337 C. coli isolates with MIC data, 14.8% (50 isolates) had a MIC > 128 mg/L (Figure 74). Such isolates were reported from all six countries which had provided quantitative data from dilution tests (Table 35). Similarly, for 50 of 380 isolates (13.2%) tested with disc diffusion, no inhibition zone could be observed (6 mm zone equals the disc size), which in 95% of isolates corresponds to a MIC of ≥ 128 mg/L and in 5% a MIC of 64 mg/L (EUCAST, 2017a).
Figure 74.
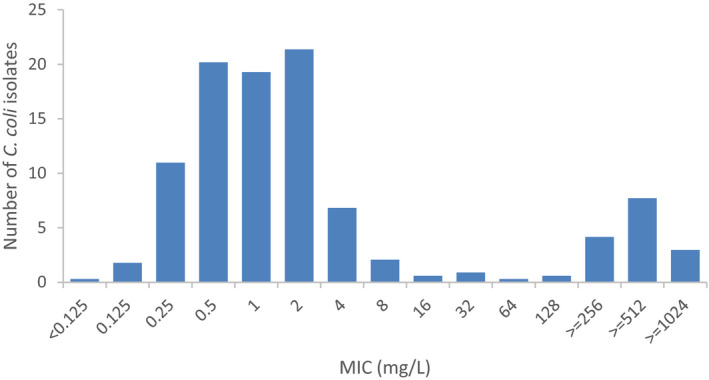
Erythromycin MIC distribution in C. coli from humans, 2016 (n = 337)
Table 35.
Occurrence of high‐level resistance to erythromycin (MIC > 128 mg/L) in Campylobacter coli from humans in 2016
| Country | N | High‐level resistance to erythromycin (MIC > 128 mg/L) | |
|---|---|---|---|
| n | % | ||
| Austria | 43 | 1 | 2.3 |
| Finland | 107 | 22 | 20.6 |
| Luxembourg | 53 | 7 | 13.2 |
| Malta | 61 | 6 | 9.8 |
| Spain | 38 | 6 | 15.8 |
| Total (5 MSs) | 302 | 42 | 13.9 |
| Norway | 35 | 8 | 22.9 |
N: number of isolates tested; MIC: minimum inhibitory concentration.
MDR in Campylobacter coli isolates from humans
Overall, 13.6% of the human C. coli isolates were susceptible to all four antimicrobial classes, with no susceptible isolates reported by Portugal (Figure 75, 5 MSs, Table COMCAMPCOHUM). The level of MDR was low overall (7.9%) and ranged from 0% to 47.1% between countries, with a country average of 15.3%. The overall level of microbiological and clinical co‐resistance to ciprofloxacin and erythromycin was 8.0% but as high as 21.1% in Spain and 50.0% in Portugal. France reported five isolates, Spain two and Austria one isolate resistant to all four antimicrobial classes (Figure 75).
Figure 75.
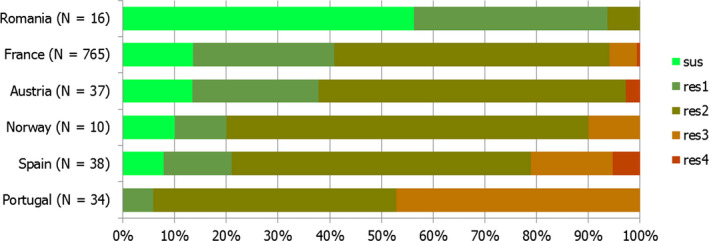
Frequency distribution of Campylobacter coli isolates from humans completely susceptible or resistant to one to four antimicrobial classes in 2016
Combined resistance to the three antimicrobials most commonly used for treatment, ciprofloxacin, erythromycin and tetracycline, was analysed in all reporting countries. Nine per cent (171 of 1,850) of the C. coli isolates tested from humans in 2016 were resistant to all three classes (Table 36), which was a decrease compared with 2015, when 14% of tested C. coli were multidrug resistant. In 3 of 16 MSs, combined resistance was reported in at least a third of the tested isolates with the highest rate in Estonia (57.9%). The number of isolates tested in Estonia was, however, low.
Table 36.
Proportion of C. coli isolates from humans resistant to ciprofloxacin, erythromycin and tetracycline, 2016
| Country | Resistance to ciprofloxacin, erythromycin and tetracycline | |
|---|---|---|
| N | % Res | |
| Austria | 37 | 2.7 |
| Cyprus | 7 | NA |
| Estonia | 19 | 57.9 |
| Finlanda | 143 | 33.6 |
| Franceb | 850 | 5.1 |
| Italy | 11 | 27.3 |
| Lithuaniab | 40 | 12.5 |
| Luxembourg | 53 | 13.2 |
| Malta | 7 | NA |
| Netherlandsb | 99 | 6.1 |
| Portugal | 34 | 47.1 |
| Romania | 16 | 0.0 |
| Slovakiab | 41 | 0.0 |
| Slovenia | 130 | 1.5 |
| Spain | 38 | 21.1 |
| United Kingdom | 325 | 4.6 |
| Total (16 MSs) | 1,850 | 9.2 |
| Norway | 10 | 10.0 |
N: number of isolates tested; NA: not applicable; % Res: percentage of resistant isolates.
Travel‐associated cases, accounting for 65% of Campylobacter infections in Finland in 2016, could not be excluded from the Finnish AST data.
Data interpreted with clinical breakpoints.
4.2. Antimicrobial resistance in Campylobacter spp. from animals and food
Under the framework of Commission Decision 2013/652/EU, for the year 2016, quantitative isolate‐based MIC data on Campylobacter spp. were primarily collected and reported for C. jejuni from broilers, fattening turkeys and their meat products. A general overview of the countries reporting Campylobacter resistance from various animal and food sampling origins in 2016 are presented in Tables CAMPCOOVERVIEW and CAMPJEOVERVIEW. As the AMR monitoring in 2015 concentrated on fattening pigs and calves under 1 year of age, the AST results in C. jejuni and C. coli from poultry and their meat products reported for that year have been also analysed and presented in the 2016 EU Summary Report, which focuses on poultry. Those 2015 data were notably used in the temporal trend analyses.
4.2.1. Antimicrobial resistance in Campylobacter spp. from poultry meat
Representative monitoring
Monitoring resistance in C. jejuni from meat from broilers in 2016 and 2015 was conducted by six and three MSs, respectively. The number of isolates tested per reporting MS was, however, only greater than 50 in 3 MSs in 2016 and 2 MSs in 2015. In 2016 and 2015, four MSs and three MSs also monitored resistance in C. coli but, similarly, the numbers of isolates tested were low, with 122 and 67 isolates in 2016 and 2015, respectively (Table 37).
Table 37.
Occurrence of resistance (%) to selected antimicrobials in Campylobacter coli and C. jejuni from meat from broilers, using harmonised epidemiological cut‐off values (ECOFFs), EU MSs, 2015 and 2016
| Country | N | GEN | STR | CIP | NAL | ERY | TET |
|---|---|---|---|---|---|---|---|
| 2016 | |||||||
| Campylobacter jejuni | |||||||
| Belgium | 370 | 1.1 | 2.2 | 56.5 | 55.7 | 2.4 | 46.5 |
| Croatia | 17 | 5.9 | 0 | 82.4 | 76.5 | 0 | 17.6 |
| Estoniaa | 1 | 0 | 0 | 0 | 0 | 0 | 0 |
| Germany | 246 | 0 | 0.4 | 75.2 | 72.8 | 1.2 | 51.2 |
| Luxembourg | 54 | 0 | 1.9 | 66.7 | 66.7 | 1.9 | 550.6 |
| Portugala | 7 | 0 | 0 | 100 | 85.7 | 28.6 | 100 |
| Total (6 MSs) | 695 | 0.7 | 1.4 | 64.9 | 63.3 | 2.2 | 48.6 |
| Campylobacter coli | |||||||
| Croatia | 12 | 0 | 25 | 66.7 | 66.7 | 0 | 25 |
| Germany | 60 | 0 | 10 | 85 | 75 | 13.3 | 76.7 |
| Luxembourg | 39 | 0 | 15.4 | 74.4 | 71.8 | 7.7 | 76.9 |
| Portugal | 11 | 0 | 0 | 100 | 100 | 45.5 | 90.9 |
| Total (4 MSs) | 122 | 0 | 12.3 | 81.1 | 75.4 | 13.1 | 73 |
| 2015 | |||||||
| Campylobacter jejuni | |||||||
| Austria | 67 | 0 | 3 | 73.1 | 71.6 | 0 | 43.3 |
| Netherlands | 80 | 0 | 0 | 62.5 | 62.5 | 3.8 | 37.5 |
| Portugala | 4 | 0 | 0 | 100 | 100 | 25 | 75 |
| Total (3 MSs) | 151 | 0 | 1.3 | 68.2 | 67.5 | 2.6 | 41.1 |
| Campylobacter coli | |||||||
| Austria | 40 | 0 | 15 | 85 | 85 | 5 | 72.5 |
| Netherlands | 12 | 0 | 8.3 | 91.7 | 100 | 8.3 | 75 |
| Portugal | 15 | 6.7 | 33.3 | 100 | 100 | 40 | 100 |
| Total (3 MSs) | 67 | 1.5 | 17.9 | 89.6 | 91 | 13.4 | 79.1 |
ECOFFs: epidemiological cut‐off values; MSs: Member States; N: number of isolates tested; % Res: percentage of resistant isolates per category of susceptibility; CIP: ciprofloxacin; ERY: erythromycin; GEN: gentamicin; NAL: nalidixic acid; STR: streptomycin; TET: tetracycline.
Occurrence of resistance assessed on less than 10 isolates.
For meat from turkeys, only two MSs reported data on C. jejuni in 2016 and 2015, based on 47 and 7 strains tested, respectively. For C. coli, the numbers of strains analysed were even lower, as it only totalled 10 strains in 2016 (3 reporting MSs) and 14 strains in 2015 (3 reporting MSs) (Table 38).
Table 38.
Occurrence of resistance (%) to selected antimicrobials in Campylobacter coli and C. jejuni from meat from turkeys, using harmonised ECOFFs, EU MSs, 2015 and 2016
| Country | N | GEN | STR | CIP | NAL | ERY | TET |
|---|---|---|---|---|---|---|---|
| 2016 | |||||||
| Campylobacter jejuni | |||||||
| Germany | 46 | 0 | 2.2 | 73.9 | 60.9 | 0 | 47.8 |
| Luxembourga | 1 | 0 | 0 | 100 | 100 | 0 | 100 |
| Total (2 MSs) | 47 | 0 | 2.1 | 74.5 | 61.7 | 0 | 48.9 |
| Campylobacter coli | |||||||
| Germanya | 6 | 0 | 16.7 | 100 | 100 | 33.3 | 83.3 |
| Luxembourga | 3 | 0 | 0 | 100 | 66.7 | 33.3 | 100 |
| Portugala | 1 | 0 | 100 | 100 | 100 | 100 | 100 |
| Total (3 MSs) | 10 | 0 | 20 | 100 | 90 | 40 | 90 |
| 2015 | |||||||
| Campylobacter jejuni | |||||||
| Austriaa | 6 | 0 | 0 | 83.3 | 66.7 | 0 | 33.3 |
| Netherlandsa | 1 | 0 | 0 | 0 | 0 | 0 | 0 |
| Total (2 MSs) | 7 | 0 | 0 | 71.4 | 57.1 | 0 | 28.6 |
| Campylobacter coli | |||||||
| Austria | 12 | 0 | 8.3 | 91.7 | 91.7 | 8.3 | 83.3 |
| Portugala | 2 | 0 | 50 | 100 | 100 | 100 | 100 |
| Total (2 MSs) | 14 | 0 | 14.3 | 92.9 | 92.9 | 21.4 | 85.7 |
ECOFFs: epidemiological cut‐off values; MSs: Member States; N: number of isolates tested; % Res: percentage of resistant isolates per category of susceptibility; CIP: ciprofloxacin; ERY: erythromycin; GEN: gentamicin; NAL: nalidixic acid; STR: streptomycin; TET: tetracycline.
Occurrence of resistance assessed on less than 10 isolates.
Resistance levels in C. jejuni and C. coli from meat from broilers
For C. jejuni, resistance to gentamicin (overall 0.7% and 0% in 2016 and 2015, respectively) and to streptomycin (overall 1.4% and 1.3% in 2016 and 2015, respectively) was low to very low. One exception to this is Croatia, which recorded 5.9% resistance to gentamicin in the 17 strains tested in 2016. Resistance to tetracycline was generally high (overall, 48.6% and 41.1% in 2016 and 2015, respectively), with marked differences between reporting MSs, as it ranged between 17.6% in Croatia (n = 17) to 100% in Portugal (n = 7) in 2016. Low levels of resistance to erythromycin were generally observed in reporting MSs in 2016 and 2015, but with the rather striking exception of Portugal which recorded resistance above 20% in the small sample of strains tested. Resistance to ciprofloxacin and nalidixic acid were typically very high (overall 64.9% and 63.3%, respectively, in 2016 and 68.2% and 67.5%, respectively, in 2015).
For C. coli, resistance to gentamicin was undetected in 2016 and detected at low levels (overall 1.5%) in 2015, whereas resistance to streptomycin was moderate (overall 12.3% in 2016 and 17.9% in 2015). Resistance to erythromycin was recorded at moderate levels (13.1% and 13.4% in 2016 and 2015, respectively). C. coli strains were very frequently resistant to tetracycline (overall 73% and 79.1% in 2016 and 2015, respectively), to ciprofloxacin (81.1% and 89.6% in 2016 and 2015, respectively) and to nalidixic acid (75.4% and 91% in 2016 and 2015, respectively).
Resistance levels in C. jejuni and C. coli from meat from turkeys
Considering the 47 C. jejuni strains from turkey meat reported in 2016, resistance was undetected for gentamicin and erythromycin, detected at low levels for streptomycin, high levels for tetracycline and very high to extremely high levels for nalidixic acid (overall 61.7%) and ciprofloxacin (overall 74.5%).
For the 14 C. coli strains from turkey meat reported in 2015, resistance to gentamicin was undetected, detected at moderate levels for streptomycin (overall 14.3%), high levels for erythromycin (overall 21.4%), and extremely high levels for nalidixic acid (92.9%), ciprofloxacin (92.9%) and tetracycline (85.7%).
4.2.2. Antimicrobial resistance among Campylobacter spp. from broilers
Representative monitoring
In 2016, the implementation of Commission Decision 2013/652/EU, which sets out the requirements for monitoring resistance in C. jejuni from broilers in the EU MSs, resulted in comprehensive monitoring and reporting of AMR in 3,117 isolates in 24 EU MSs and 269 isolates in 3 non‐MS (Iceland, Norway and Switzerland) (Table 39). It is of note that resistance in C. jejuni from broilers was assessed in Luxembourg and Iceland on samples of isolates of small size, whereas, conversely, Romania reported data on 287 isolates. The average number of strains tested for susceptibility in the 24 reporting MSs equalled 130 C. jejuni isolates. In addition, five MSs reported resistance in C. coli from broilers for 2016 (163 isolates in total) on a voluntary basis, with a minimum of 12 strains in Luxembourg and a maximum of 61 in the Czech Republic. For 2015 data, three MSs reported on C. jejuni from broilers (150 isolates) and one MS on C. coli (36 isolates). Further information on the harmonised representative sampling of caecal samples from healthy broilers at slaughter and the harmonised methodology for AST may be found in Section 2 Materials and methods.
Table 39.
Occurrence of resistance (%) to selected antimicrobials in Campylobacter coli and C. jejuni from broilers, using harmonised ECOFFs, EU/EEA MSs, 2015 and 2016
| Country | N | GEN | STR | CIP | NAL | ERY | TET |
|---|---|---|---|---|---|---|---|
| 2016 | |||||||
| Campylobacter jejuni | |||||||
| Austria | 174 | 0 | 6.3 | 77.6 | 73 | 0 | 50 |
| Belgium | 176 | 0 | 0.6 | 53.4 | 50 | 0 | 40.9 |
| Bulgaria | 55 | 0 | 12.7 | 85.5 | 85.5 | 10.9 | 43.6 |
| Croatia | 77 | 0 | 5.2 | 84.4 | 70.1 | 0 | 49.4 |
| Cyprus | 85 | 1.2 | 18.8 | 85.9 | 75.3 | 0 | 84.7 |
| Czech Republic | 59 | 0 | 0 | 76.3 | 74.6 | 0 | 35.6 |
| Denmark | 160 | 0 | 3.8 | 22.5 | 20.6 | 0.6 | 13.1 |
| Finland | 83 | 0 | 1.2 | 8.4 | 14.5 | 0 | 6 |
| Germany | 166 | 0.6 | 3.6 | 71.7 | 68.1 | 0 | 50.6 |
| Greece | 128 | 0 | 7.8 | 89.8 | 76.6 | 0 | 74.2 |
| Hungary | 170 | 0 | 2.4 | 90.6 | 87.1 | 0 | 52.4 |
| Ireland | 174 | 0 | 1.7 | 24.7 | 24.7 | 0 | 25.3 |
| Italy | 258 | 0 | 0.8 | 82.2 | 65.5 | 8.1 | 72.1 |
| Latvia | 48 | 0 | 41.7 | 97.9 | 95.8 | 0 | 64.6 |
| Lithuania | 85 | 0 | 5.9 | 90.6 | 90.6 | 0 | 58.8 |
| Luxembourga | 7 | 0 | 0 | 71.4 | 71.4 | 0 | 71.4 |
| Poland | 176 | 0 | 30.7 | 93.2 | 85.2 | 0 | 71.6 |
| Portugal | 67 | 0 | 1.5 | 95.5 | 88.1 | 10.4 | 82.1 |
| Romania | 287 | 0 | 5.6 | 77.7 | 74.9 | 0.3 | 48.8 |
| Slovakia | 85 | 1.2 | 15.3 | 78.8 | 56.5 | 4.7 | 43.5 |
| Slovenia | 85 | 0 | 0 | 62.4 | 51.8 | 0 | 43.5 |
| Spain | 162 | 0 | 3.7 | 88.9 | 88.3 | 0.6 | 82.1 |
| Sweden | 170 | 0 | 0.6 | 12.9 | 12.9 | 0 | 15.9 |
| United Kingdom | 180 | 0 | 1.1 | 40.6 | 41.1 | 0.6 | 56.1 |
| Total (24 MSs) | 3,117 | 0.1 | 6.1 | 66.9 | 61.7 | 1.3 | 50.7 |
| Iceland | 16 | 0 | 0 | 12.5 | 12.5 | 0 | 6.3 |
| Norway | 113 | 0 | 3.5 | 10.6 | 10.6 | 0 | 5.3 |
| Switzerland | 140 | 1.4 | 7.1 | 51.4 | 51.4 | 2.9 | 40 |
| Campylobacter coli | |||||||
| Croatia | 21 | 0 | 9.5 | 85.7 | 76.2 | 0 | 42.9 |
| Czech Republic | 61 | 0 | 4.9 | 85.2 | 85.2 | 0 | 45.9 |
| Germany | 38 | 0 | 18.4 | 92.1 | 84.2 | 5.3 | 86.8 |
| Luxembourg | 12 | 0 | 0 | 100 | 100 | 0 | 100 |
| Slovenia | 30 | 3.3 | 43.3 | 83.3 | 83.3 | 0 | 60 |
| Total (5 MSs) | 162 | 0.6 | 15.4 | 87.7 | 84.6 | 1.2 | 61.7 |
| Switzerland | 30 | 0 | 63.3 | 66.7 | 66.7 | 10 | 40 |
| 2015 | |||||||
| Campylobacter jejuni | |||||||
| Croatia | 45 | 0 | 11.1 | 75.6 | 77.8 | 0 | 28.9 |
| Denmark | 44 | 0 | 2.3 | 27.3 | 22.7 | 0 | 11.4 |
| Finland | 61 | 0 | 0 | 0 | 1.6 | 0 | 0 |
| Campylobacter coli | |||||||
| Croatia | 36 | 2.8 | 22.2 | 80.6 | 83.3 | 0 | 44.4 |
ECOFFs: epidemiological cut‐off values; MSs: Member States; N: number of isolates tested; % Res: percentage of resistant isolates per category of susceptibility; CIP: ciprofloxacin; ERY: erythromycin; GEN: gentamicin; NAL: nalidixic acid; STR: streptomycin; TET: tetracycline.
Occurrence of resistance assessed on less than 10 isolates.
Resistance levels in C. jejuni and C. coli from broilers
In general, in 2016, the overall levels of resistance observed in C. jejuni from broilers to ciprofloxacin (overall 66.9%), nalidixic acid (overall 61.7%) and tetracyclines (overall 50.7%) were very high to extremely high, whereas those to the remaining substances in the harmonised panel were low (erythromycin, overall, 1.3%; streptomycin, overall, 6.1%) to very low (gentamicin, overall 0.1%). Typically, in 2016 the occurrence of resistance to the antimicrobials studied varied greatly between the reporting countries (Table 39).
For ciprofloxacin (overall 66.9%), the lowest levels of resistance were found in Finland (8.4%, out of 83 strains tested) and Norway (10.6%, out of 113 strains tested), whereas levels of resistance greater than 95% were observed in Latvia (48 strains tested) and Portugal (67 strains tested). A similar variability in nalidixic acid resistance (overall 61.7%) was observed among reporting countries, ranging from 10.6% (113 strains tested) in Norway to 95.8% (48 strains tested) in Latvia. For erythromycin, the overall resistance was low (1.3% for 24 MSs), and erythromycin resistance was undetected in 18 countries, analysing 1,992 isolates. Conversely, C. jejuni strains resistant to macrolides were detected in eight MSs and Switzerland, and the highest occurrences of resistance were observed in Bulgaria (10.9%, 55 strains tested) and in Portugal (10.4%, 67 strains tested).
Gentamicin resistance was undetected in 21 MSs and Iceland and Norway. One gentamicin‐resistant C. jejuni strain was detected in Cyprus (85 strains tested), one in Slovakia (85 strains tested) and one in Germany (166 strains tested) and two gentamicin‐resistant strains were obtained in Switzerland (140 isolates tested). The overall resistance level for gentamicin was very low (0.1%). The overall resistance to streptomycin was low (6.1%). No streptomycin‐resistant C. jejuni was detected in the Czech Republic (59 isolates tested), Luxembourg (7 isolates tested), Slovenia (85 isolates tested) and Iceland (16 isolates tested), whereas the resistance levels recorded in Belgium (1 resistant strain out of 176 isolates tested), Italy (2 resistant strains out of 258 isolates tested) and Sweden (1 out of 170 tested) were very low. Conversely, high levels of resistance were reported in both Latvia (41.7%, 48 isolates tested) and Poland (30.7%, 176 isolates tested). Overall in the 24 reporting MSs, 50.7% C. jejuni strains were resistant to tetracycline. Considering all countries, the lowest levels were observed in Norway (5.3%, 113 tested isolates), Finland (6%, 83 tested isolates) and Iceland (6.3%, 16 tested isolates). Seven MSs had extremely high resistance levels (Cyprus, Portugal, Spain, Greece, Italy, Poland and Luxembourg).
For C. coli isolated from broilers in 2016, the overall ciprofloxacin resistance was extremely high, at 87.7% (162 C. coli isolates tested), reflecting the resistance levels greater than 80% registered in each of the five reporting MSs. A lower level, but still very high (66.7%, 30 isolates tested), was recorded in Switzerland. Results for nalidixic acid globally paralleled those for ciprofloxacin. Erythromycin‐resistant C. coli were not detected in Croatia, the Czech Republic, Luxembourg and Slovenia (respectively 21, 61, 12 and 30 isolates tested), whereas, in Germany, the rate of macrolide‐resistant C. coli was low at 5.3% (38 isolates tested). So, the overall resistance level at the five reporting MSs equalled 1.2%. Switzerland recorded the highest level of erythromycin resistance observed, at 10% (3 out of 30 resistant strains).
Among the 162 C. coli isolates tested by the five reporting MSs, only one gentamicin‐resistant strain was detected in Slovenia (30 isolates tested). The overall gentamicin resistance was thus very low at 0.6%. Switzerland did not detect gentamicin resistance (30 isolates tested). Marked differences in streptomycin resistance were observed between reporting MSs, with no resistant C. coli isolate detected in Luxembourg (12 isolates tested), and low resistance in Croatia and the Czech Republic (respectively 2/21 (9.5%) and 3/61 (4.9%)), whereas resistance reached 43.3% in Slovenia (30 isolates tested). The overall streptomycin resistance was moderate at 15.5%. A very high percentage of streptomycin‐resistant strains was reported in Switzerland (63.3%, 30 isolates tested). Resistance to tetracycline was high to extremely high, ranging between 42.9% in Croatia (21 isolates tested) to 100% in Luxembourg (12 isolates tested). The overall resistance was assessed at 61.7% for the five MSs reporting on C. coli. In Switzerland, resistance equalled 40% (30 isolates tested).
Comparison of resistance in broilers and meat from broilers
In 2016, resistance in C. jejuni from broiler meat was assessed on a voluntary basis in Belgium, Germany and Luxembourg. For strains from caeca, these three MSs analysed 176/3,117, 166/3,117 and 7/3,117 isolates, respectively, for 11% of the results reported by 24 MSs at the overall level. In spite of this strong discrepancy between the geographical origin of the meat and caeca isolates, the overall resistance levels were quite similar.
Spatial distribution of ciprofloxacin and erythromycin resistance in C. jejuni from broilers
The spatial distribution of ciprofloxacin resistance in C. jejuni from broilers (Figure 76) showed that the highest levels of resistance to ciprofloxacin were reported in eastern and southern Europe, whereas northern Europe tended to report lower resistance levels. Although erythromycin resistance was generally either not detected or registered at low to very low levels across Europe, much higher resistance, with a magnitude of around 10%, was observed in Portugal, Italy and Bulgaria.
Figure 76.
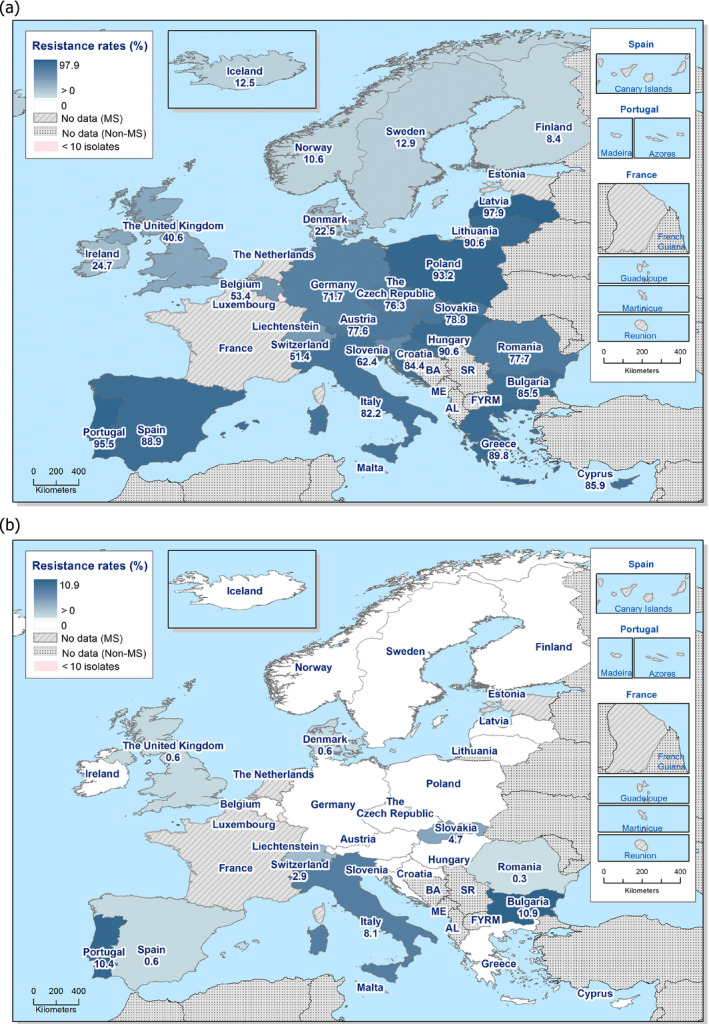
Spatial distribution of ciprofloxacin (a) and erythromycin (b) resistance in Campylobacter jejuni from broilers of Gallus gallus, EU/EEA MSs, 2016
Combined resistance to ciprofloxacin and erythromycin in C. coli and C. jejuni from broilers
The significant combined resistance for public health to both ciprofloxacin and erythromycin in C. jejuni from broilers was detected in 7 out of 27 reporting countries in 2016. Considering all reporting EU MSs, the overall occurrence of combined resistance to ciprofloxacin and erythromycin in C. jejuni from broilers was assessed at 1.22% (38/3,117). Among those countries recording combined resistance to ciprofloxacin and erythromycin in C. jejuni from broilers, two groups can be observed: first, Italy (8.1%), Portugal (10.4%) and Bulgaria (10.9%) registering a combined resistance of about 10%, and second, Switzerland, Slovakia, Romania, Spain and Denmark reporting a combined resistance of about or lower than 2% (Figure 77).
Figure 77.
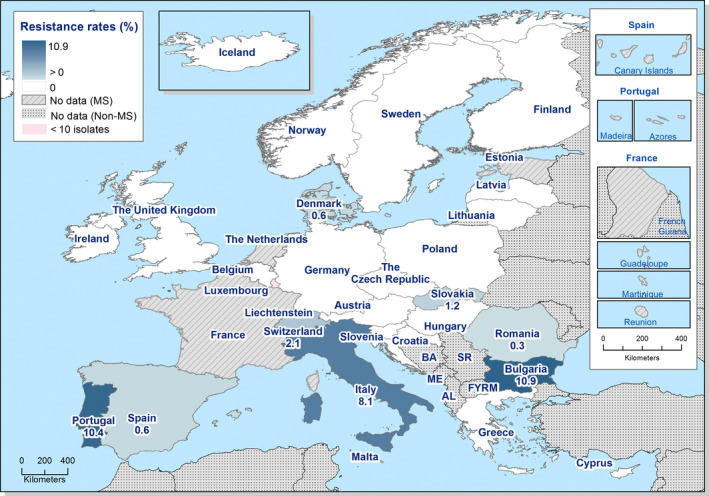
Spatial distribution of combined resistance to ciprofloxacin and erythromycin in Campylobacter jejuni from broilers of Gallus gallus, EU/EEA MSs, 2016
Among the five MSs (Croatia, the Czech Republic, Germany, Luxembourg and Slovenia) and Switzerland reporting on resistance in C. coli from broilers for 2016 on a voluntary basis, only Germany and Switzerland reported combined resistance to both ciprofloxacin and erythromycin, at levels of 5.3% and 10%, respectively. Where comparison of the level of combined resistance is possible between C. jejuni and C. coli in Germany and Switzerland, that recorded in C. coli is greater than that observed in C. jejuni.
Temporal trends in resistance in C. jejuni from broilers
Temporal trends in resistance in indicator C. jejuni from broilers from 12 EU MSs and 1 non‐MS over the period 2008–2016 are displayed in Figure 78. Due to the lack of longitudinal data, evaluation of temporal trends in resistance cannot yet be made for all countries participating in the mandatory monitoring. Among the significant temporal trends observed, the increasing trends in resistance to erythromycin (macrolides) in the Netherlands recently reported over 2015–2016 is of particular significance, as well as those steady increasing trends in resistance to ciprofloxacin (fluoroquinolones) recorded in 10 reporting countries.
Figure 78.
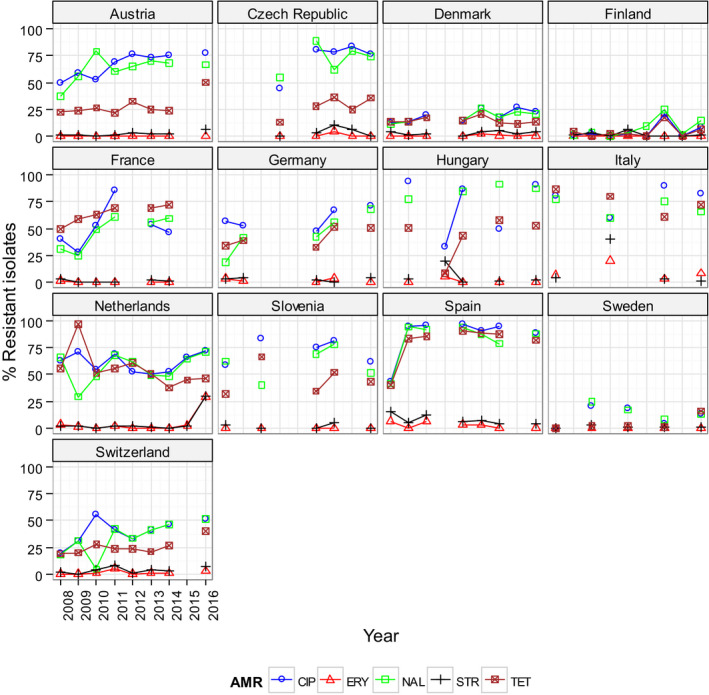
Trends in ciprofloxacin (CIP), erythromycin (ERY) nalidixic acid (NAL), streptomycin (STR) and tetracycline (TET) resistance in Campylobacter jejuni from broilers in reporting MSs, 2008–2016
-
Statistical significance of trends over 4‐5 or more years was tested by a logistic regression model (p ≤ 0.05).Statistically significant increasing trends were observed for ciprofloxacin (and nalidixic acid) in Austria, the Czech Republic, Denmark, Finland, France, Germany, Hungary, the Netherlands, Spain and Switzerland, for erythromycin in the Netherlands, for gentamicin in the Netherlands and Switzerland, for streptomycin in Austria, the Czech Republic, the Netherlands and Switzerland, as well as for tetracycline in Austria, the Czech Republic, Finland, France, Germany, Hungary, Spain, Sweden and Switzerland.Statistically significant decreasing trends were observed for ciprofloxacin in Slovenia, for erythromycin in Hungary and Spain, for gentamicin in Hungary and Spain, for streptomycin in Italy and Spain, as well as for tetracycline in the Netherlands.
Complete susceptibility and multidrug resistance in C. jejuni and C. coli from broilers
The frequency distribution of the numbers of antimicrobials to which individual isolates were resistant (Figures 79 and 80) showed a marked variation in the levels of complete susceptibility to the common set of antimicrobial substances used to test resistance in Campylobacter spp. (four antimicrobials: ciprofloxacin/nalidixic acid, erythromycin, tetracycline and gentamicin) observed among the reporting countries. Overall, complete susceptibility was found in 27.7% of the C. jejuni isolates tested in the reporting MSs (30.4% when considering all reporting countries), and reached 87.6% in Norway and 85.5% in Finland, whereas in Hungary, Greece, Portugal, Latvia and Cyprus the proportion of fully susceptible isolates was much lower (under 10.0%). In Finland, Iceland, Sweden, Norway, Belgium, Denmark, Ireland, Switzerland and the United Kingdom, the fully susceptible profile was the most frequent resistance pattern in C. jejuni from broilers. In Iceland, isolates had a maximum of one resistance.
Figure 79.
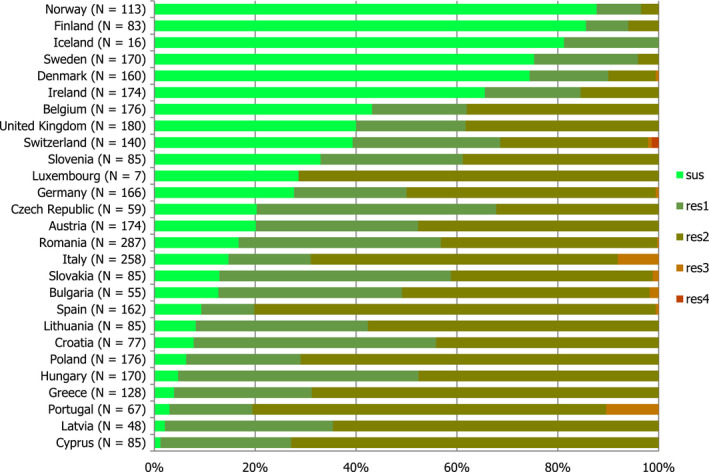
Frequency distribution of Campylobacter jejuni isolates completely susceptible and resistant to one to four antimicrobials, in broilers, EU/EEA MSs, 2016
Figure 80.

Frequency distribution of Campylobacter coli isolates completely susceptible and resistant to one to four antimicrobials, in broilers, EU/EEA MSs, 2016
- N: total number of isolates tested for susceptibility against the whole harmonised set of antimicrobials for Campylobacter; sus: susceptible to all antimicrobial classes of the harmonised set for Campylobacter; res1–res4: resistance to one up to four antimicrobial classes of the harmonised set for Campylobacter.
Resistance to three antimicrobials (MDR) in C. jejuni isolates from broilers was recorded in nine countries (out of 27 countries reporting data), generally at low levels (around 2% or less), although in Italy and Portugal 8.1% and 10.4% of isolates exhibited MDR. Two out of 140 tested isolates were resistant to four antimicrobials in Switzerland, but no other tetra‐resistant isolates was detected in the other contributing countries. The overall MDR of the C. jejuni isolates was 1.1% (Table COMCAMPJEBR).
For the 162 C. coli isolates from MSs, only 17 (10.5%) were susceptible to all tested antimicrobials. Three out of 162 (1.9%) C. coli isolates were found to be resistant to three classes of antimicrobials, two of these (1.2%) were resistant to both ciprofloxacin and erythromycin.
Patterns of multidrug resistance in C. jejuni and C. coli from broilers
For MS and non‐MSs, 37 C. jejuni isolates of broilers were multidrug resistant: 33 were resistant to ciprofloxacin/nalidixic acid, erythromycin and tetracycline and susceptible to gentamicin, among which 21 and 7 were isolated in Italy and Portugal, respectively. Two isolates were resistant to ciprofloxacin/nalidixic acid, erythromycin and gentamicin (one from Germany and one from Slovakia), and two isolates from Switzerland were found to be resistant to the four drugs.
Five C. coli of broilers from Germany (two isolates) and Switzerland (three isolates) were resistant to ciprofloxacin/nalidixic acid, erythromycin and tetracycline and one from Slovenia was resistant to ciprofloxacin/nalidixic acid, gentamicin and tetracycline.
4.2.3. Antimicrobial resistance in Campylobacter spp. from fattening turkeys
Representative monitoring
For 2016, resistance data on Campylobacter jejuni isolates (n = 1,061) from fattening turkeys (Table 40) were provided by 9 MSs, with a minimum of 16 isolates for Romania and a maximum of 201 for Germany. Commission Implementing Decision 2013/652/EU lays down that monitoring resistance in C. jejuni in fattening turkeys is mandatory in those MSs where the production of turkey meat is greater than 10,000 tonnes slaughtered per year. Two MSs also reported data on C. coli (n = 251) in fattening turkeys. Further information on the representative sampling of carcasses of healthy broilers at the slaughterhouse may be found in the Materials and methods section.
Table 40.
Occurrence of resistance (%) to selected antimicrobials in Campylobacter coli and Campylobacter jejuni from fattening turkeys in 2016, using harmonised ECOFFs
| Country | N | GEN | STR | CIP | NAL | ERY | TET |
|---|---|---|---|---|---|---|---|
| Campylobacter jejuni | |||||||
| Austria | 55 | 0 | 7.3 | 74.5 | 63.6 | 0 | 54.5 |
| Germany | 201 | 0 | 3.5 | 77.6 | 73.1 | 0 | 52.2 |
| Hungary | 170 | 0 | 4.1 | 85.3 | 83.5 | 0 | 40.6 |
| Italy | 131 | 0 | 4.6 | 81.7 | 61.1 | 3.1 | 68.7 |
| Poland | 174 | 0 | 16.7 | 93.1 | 77.6 | 0.6 | 67.2 |
| Portugal | 36 | 5.6 | 0 | 100 | 94.4 | 11.1 | 75 |
| Romania | 16 | 0 | 0 | 75 | 62.5 | 0 | 56.3 |
| Spain | 88 | 0 | 5.7 | 95.5 | 95.5 | 0 | 93.2 |
| United Kingdom | 190 | 0 | 1.6 | 34.7 | 32.6 | 1.1 | 43.2 |
| Total (9 MSs) | 1,061 | 0.2 | 5.7 | 76.2 | 68.7 | 1 | 57.6 |
| Campylobacter coli | |||||||
| Germany | 169 | 0 | 13.6 | 95.3 | 88.8 | 14.2 | 78.7 |
| Spain | 82 | 6.1 | 61 | 100 | 100 | 18.3 | 96.3 |
| Total (2 MSs) | 251 | 2 | 29.1 | 96.8 | 92.4 | 15.5 | 84.5 |
ECOFFs: epidemiological cut‐off values; MSs: Member States; N: number of isolates tested; % Res: percentage of resistant isolates per category of susceptibility; CIP: ciprofloxacin; ERY: erythromycin; GEN: gentamicin; NAL: nalidixic acid; STR: streptomycin; TET: tetracycline.
Resistance levels among C. jejuni and C. coli from fattening turkeys
In C. jejuni from fattening turkeys, the ranges of resistance to ciprofloxacin, nalidixic acid and tetracycline generally varied from high to extremely high, with overall levels of resistance at 76.2, 68.7 and 57.6%, respectively. The overall resistance to erythromycin (1%) and streptomycin (5.7%) was low, and resistance to gentamicin (0.2%) was very low. In those MSs having also reported for C. coli, resistance levels to antimicrobials were typically higher in C. coli than in C. jejuni for fattening turkeys, in particular for erythromycin and streptomycin.
For C. jejuni all MSs, except the United Kingdom (34.7% of ciprofloxacin‐resistant strains for 190 strains studied), reported percentages of ciprofloxacin‐resistant strains equal or above 75%. In Portugal, all 36 strains tested were resistant. The overall percentage for the nine MSs was extremely high (76.2%). Nalidixic acid resistance paralleled the levels observed for ciprofloxacin with an overall percentage of 68.7%; as for ciprofloxacin, the United Kingdom showed the lowest percentage of resistance (32.6%, 190 tested isolates) but for other MSs the percentages ranged from 61.1% for Italy (131 strains) to 95.5% for Spain (88 strains).
No strain was detected to be resistant to erythromycin in Austria, Germany, Hungary, Romania and Spain, out of 55, 201, 170, 16 and 88 strains, respectively, tested. In total, 11 erythromycin‐resistant isolates were detected in Italy (4/131), Poland (1/174), Portugal (highest ratio, 4/36) and the United Kingdom (2/190). The overall proportion of erythromycin‐resistant C. jejuni was 1%.
Two out of 36 tested isolates were detected gentamicin‐resistant in Portugal, but no other MSs reported this aminoglycoside resistance. The overall percentage was 0.2%. No streptomycin‐resistant isolate was detected in Portugal (36 isolates tested) and Romania (16 isolates tested) and percentages were low for the other countries, except Poland (16.7% streptomycin‐resistant C. jejuni isolates, 174 strains tested). Overall, the percentage of resistance to streptomycin was 5.7% for the nine MSs. Tetracycline resistance was high to extremely high, varying from 40.6% in Hungary (170 strains tested) to 93.2% in Spain (88 strains tested). The overall percentage was 57.6%.
In the two countries reporting for C. coli from turkeys in 2016, more than 95% of strains were resistant to ciprofloxacin, and percentages of resistance to nalidixic acid were above 89%. Erythromycin resistance level was moderate with 14.2% (Germany) and 18.3% (Spain) resistant isolates. Gentamicin resistance was not detected in Germany, but was detected in 6.1% of the 82 strains tested in Spain. The percentages for streptomycin varied greatly with 13.6% for Germany and 61% for Spain. Resistance to tetracyclines was extremely high in both countries (78.7% for Germany and 96.3% for Spain).
Spatial distribution of resistance among C. jejuni from fattening turkeys
The spatial distributions of ciprofloxacin and erythromycin resistance in C. jejuni from fattening turkeys (Figure 81) show that the highest levels of resistance to these substances were reported by southern European reporting countries, as well as Poland, whereas the United Kingdom reported lower levels.
Figure 81.
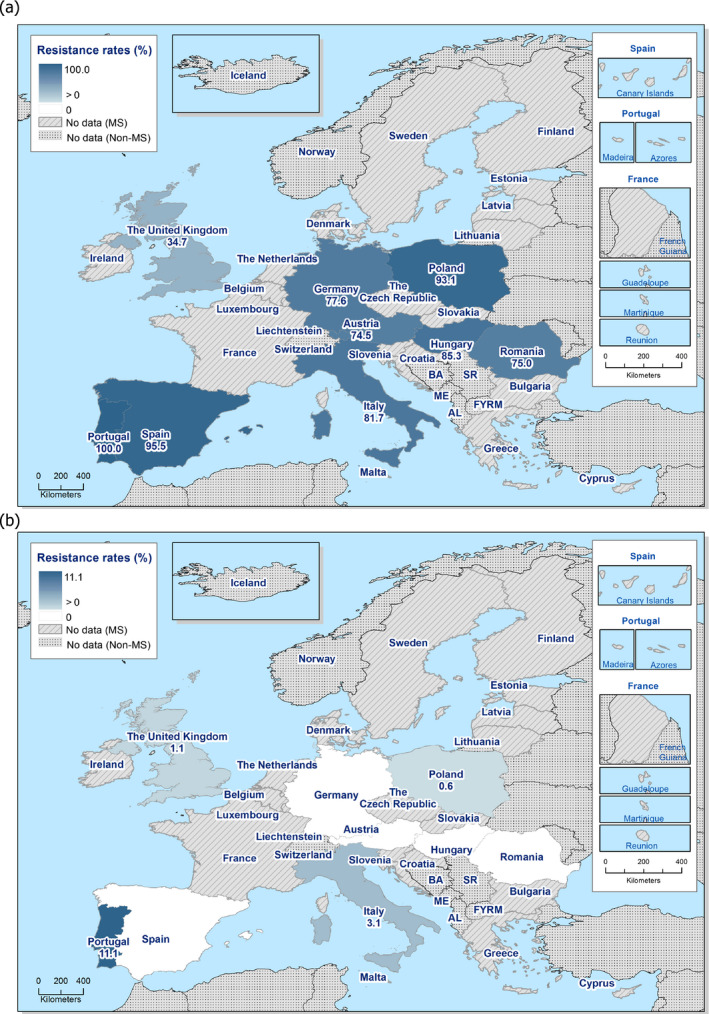
Spatial distribution of ciprofloxacin (a) and erythromycin (b) resistance among Campylobacter jejuni from fattening turkeys, nine EU MSs, 2016
Combined resistance to ciprofloxacin and erythromycin in C. jejuni and C. coli from fattening turkeys
The significant combined resistance for public health to both ciprofloxacin and erythromycin in C. jejuni was detected in four out of nine reporting MSs, with Portugal and Italy reporting the highest occurrence of combined resistance corresponding to 11.1% and 3.1% of the isolates tested, respectively. The overall occurrence of combined resistance to ciprofloxacin and erythromycin in C. jejuni was 1.0%, when considering all reporting MSs.
Although resistance to erythromycin was higher in C. coli than in C. jejuni from fattening turkeys in Germany and Spain in 2016 (Table 40), it is of note that no combined resistance to ciprofloxacin and erythromycin was detected in C. coli from fattening turkeys in these two countries in 2016.
Figure 82.
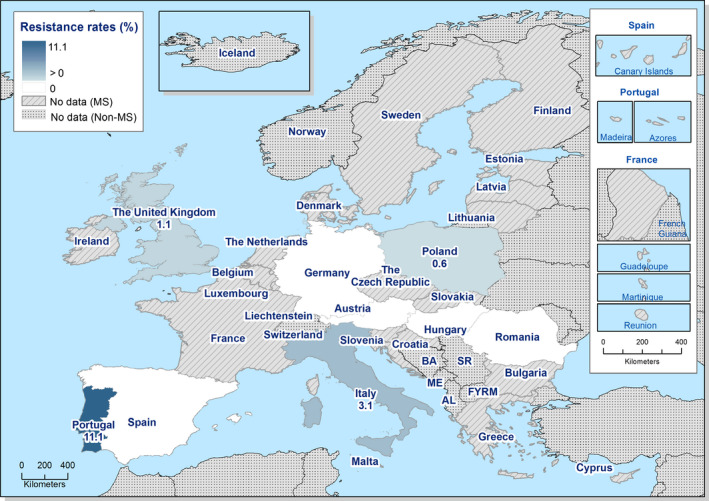
Spatial distribution of combined resistance to ciprofloxacin and erythromycin in Campylobacter jejuni from fattening turkeys, nine EU MSs, 2016
Changes in resistance among C. jejuni from fattening turkeys between 2014 and 2016
The comparison of resistance in C. jejuni isolates from fattening turkeys between 2014 and 2016 showed statistically significant changes in proportions of resistant isolates. Positive differences in resistance to ciprofloxacin between 2016 and 2014 were notably detected in Germany, Poland, Portugal, whereas a negative difference was recorded in Hungary. For resistance to tetracyclines, negative differences were observed in Hungary and the United Kingdom, whereas positive difference was recorded in Austria. At the overall level (nine MSs), where a positive difference in resistance to ciprofloxacin was registered between 2016 and 2014, negative differences in resistance to macrolides and tetracyclines were also detected.
Figure 83.
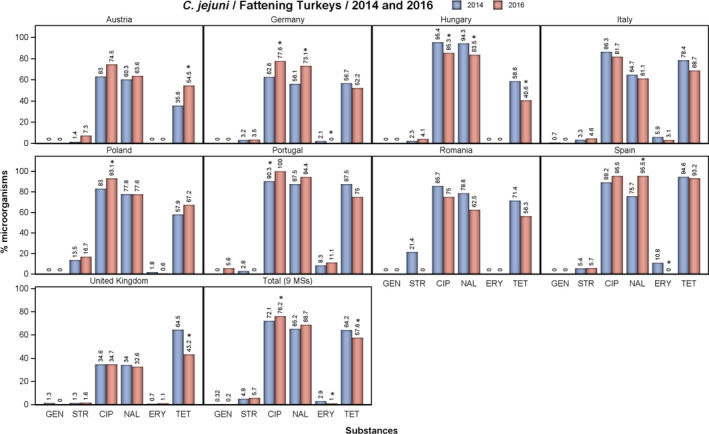
Occurrence of resistance in ciprofloxacin (CIP), erythromycin (ERY) nalidixic acid (NAL), streptomycin (STR) and tetracycline (TET) resistance in Campylobacter jejuni from fattening turkeys in reporting MSs in 2014 and 2016
- Stars indicate statistically significant changes in occurrence of resistance between 2014 and 2016. CIP: ciprofloxacin; ERY: erythromycin; GEN: gentamicin; NAL: nalidixic acid; STR: streptomycin; TET: tetracycline.
Multiresistance among C. jejuni from fattening turkeys
Variation in the levels of complete susceptibility to the common set of antimicrobials for Campylobacter (four antimicrobials: ciprofloxacin/nalidixic acid, erythromycin, tetracycline and gentamicin) was observed among the reporting countries (Figure 84). Complete susceptibility was found in 17.2% of the C. jejuni isolates tested in the reporting MSs, and reached nearly 50% in the United Kingdom, whereas, conversely, in Poland and Spain, the proportion of fully susceptible isolates was lower than 5%. Portugal did not detect any fully susceptible isolate.
Figure 84.
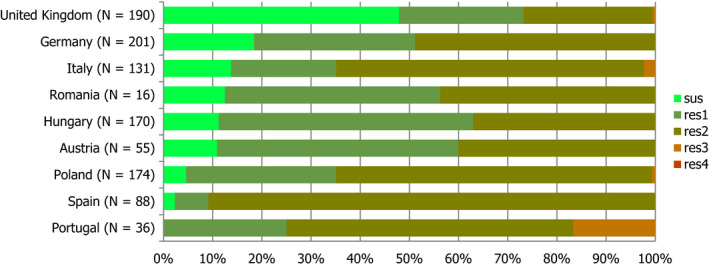
Frequency distribution of Campylobacter jejuni isolates completely susceptible and resistant to one to four antimicrobials, from fattening turkeys, nine EU MSs, 2016
The frequency distributions of the numbers of antimicrobials to which individual isolates were resistant (Figure 8) showed that Austria, Germany, Romania and Spain did not report any isolates exhibiting MDR (resistance to three different antimicrobial classes or more), whereas the three remaining MSs (out of nine reporting data) reported MDR up to levels of 16.7% in Portugal. The overall rate of MDR in C. jejuni from fattening turkeys was assessed at 1.0%.
Patterns of multidrug resistance in C. jejuni from fattening turkeys
Nine C. jejuni isolates from fattening turkeys were found resistant to ciprofloxacin/nalidixic acid, erythromycin and tetracycline, with four and three of them isolated in Portugal and Italy, respectively. Two isolates from Portugal were resistant to ciprofloxacin/nalidixic acid, tetracycline and gentamicin. No C. coli from fattening turkeys was found to be multidrug resistant.
4.2.4. High‐level erythromycin resistance in Campylobacter spp.
Mechanism of high‐level erythromycin resistance in Campylobacter spp.
Resistance to macrolides in Campylobacter spp. has generally been the result of mutations in ribosomal RNA or ribosomal proteins and these mutations are thought to have incurred fitness costs, accounting for the low occurrence of erythromycin resistance in many countries (Wang et al., 2015). Ribosomal mutations can confer high‐level erythromycin resistance (Gibreel and Taylor, 2006). Transferable resistance to erythromycin was first described in Campylobacter isolates from food‐producing animals (including pigs, chickens and ducks) from China in 2014 (Qin et al., 2014; Wang et al., 2015) and frequently resulted in high‐level resistance to erythromycin, with MICs recorded at > 512 mg/L, but isolates with intermediate resistance (MIC of 16 mg/L) have also been described (Zhou et al., 2016). Resistance is conferred by the rRNA methylase gene erm(B), which can be associated with either chromosomal multidrug resistance islands or transferable plasmids. High‐level resistance to erythromycin related to the presence of the erm(B) gene has recently been described in a single isolate of C. coli from broilers in Spain (Florez‐Cuadrado et al., 2016).
The isolate showed high‐level erythromycin resistance (MIC ≥ 1,024 mg/L erythromycin) and the erm(B) gene was located within a chromosomal multidrug resistance island containing five antibiotic resistance genes coding for resistance to tetracycline [tet(O) and ΔtetO] and aminoglycosides (aad9 and aadE), in addition to macrolides. The isolate was resistant to nalidixic acid, ciprofloxacin, tetracyclines and streptomycin and susceptible to gentamicin. This appears to have been the first report of erm(B) in Campylobacter in Europe. Very recently two erm(B) – positive isolates of C. coli from turkeys in Spain were also described (Florez‐Cuadrado et al., 2017).
The recent emergence of transferable macrolide resistance in Campylobacter may provide a means by which macrolide resistance can spread rapidly in Campylobacter. The situation may be compared to tetracycline resistance, which is frequently plasmid mediated in Campylobacter, and is frequently detected in many EU MSs at high levels. The acquisition of the erm(B) gene by successful circulating tetracycline resistance plasmids in C. coli from food animals could provide a rapid means of dissemination of macrolide resistance, since such plasmids would confer resistance to both macrolides and tetracyclines and be subject to co‐selection.
A MIC distribution can be used to assess the proportion of isolates exhibiting higher levels of resistance to the substance in question. The MIC distributions for erythromycin for Campylobacter spp. from broilers and fattening turkeys in 2016 (Figure 85) show that isolates of Campylobacter spp. from broilers and fattening turkeys with MICs > 128 mg/L have been detected.
Figure 85.
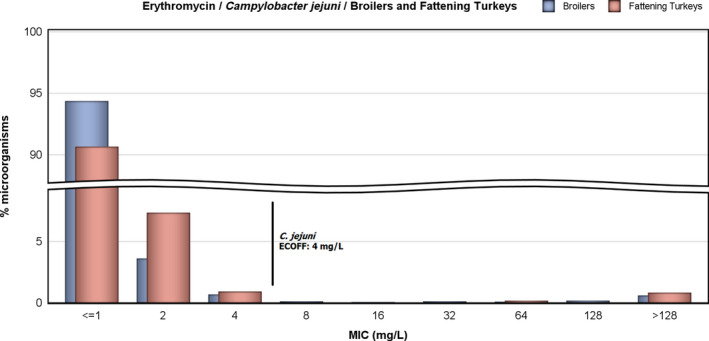
MIC distribution to erythromycin in Campylobacter jejuni from broilers and fattening turkeys, 2016
The distribution by reporting country of isolates that have an erythromycin MIC higher than the highest erythromycin concentration tested (MIC > 128 mg/L) – under the harmonised method set out in Decision 2013/652/EU – is shown in Table 41.
Table 41.
Occurrence (%) of high‐level resistance to erythromycin (MIC > 128 mg/L) in Campylobacter jejuni from broilers and fattening turkeys, 2016
| Country | N | ERY(MIC > 4 mg/L)a | High‐level resistance to ERY (MIC > 128 mg/L) |
|---|---|---|---|
| Broilers | |||
| Austria | 174 | 0 | 0 |
| Belgium | 176 | 0 | 0 |
| Bulgaria | 55 | 10.9 | 7.3 |
| Croatia | 77 | 0 | 0 |
| Cyprus | 85 | 0 | 0 |
| Czech Republic | 59 | 0 | 0 |
| Denmark | 160 | 0.6 | 0.6 |
| Finland | 83 | 0 | 0 |
| Germany | 166 | 0 | 0 |
| Greece | 128 | 0 | 0 |
| Hungary | 170 | 0 | 0 |
| Ireland | 174 | 0 | 0 |
| Italy | 258 | 8.1 | 4.3 |
| Latvia | 48 | 0 | 0 |
| Lithuania | 85 | 0 | 0 |
| Luxembourgb | 7 | 0 | 0 |
| Poland | 176 | 0 | 0 |
| Portugal | 67 | 10.4 | 4.5 |
| Romania | 287 | 0.3 | 0 |
| Slovakia | 85 | 4.7 | 1.2 |
| Slovenia | 85 | 0 | 0 |
| Spain | 162 | 0.6 | 0 |
| Sweden | 170 | 0 | 0 |
| United Kingdom | 180 | 0.6 | 0 |
| Total (24 MSs) | 3,117 | 1.3 | 0.6 |
| Iceland | 16 | 0 | 0 |
| Norway | 113 | 0 | 0 |
| Switzerland | 140 | 2.9 | 1.4 |
| Fattening turkeys | |||
| Austria | 55 | 0 | 0 |
| Germany | 201 | 0 | 0 |
| Hungary | 170 | 0 | 0 |
| Italy | 131 | 3.1 | 1.5 |
| Poland | 174 | 0.6 | 0.6 |
| Portugal | 36 | 11.1 | 11.1 |
| Romania | 16 | 0 | 0 |
| Spain | 88 | 0 | 0 |
| United Kingdom | 190 | 1.1 | 1.1 |
| Total (9 MSs) | 1,061 | 1 | 0.8 |
ERY: erythromycin; MIC: minimum inhibitory concentration; N: number of isolates tested.
EUCAST ECOFF.
Occurrence of resistance and high‐level resistance assessed on less than 10 isolates.
Although transferable erythromycin resistance conferred by erm(B) generally, but not always, results in high‐level resistance to erythromycin, mutational resistance can also result in high‐level resistance to erythromycin, but may equally result in lower MICs, although still above the ECOFF, dependent on the particular mutations having occurred (see text box above). Those isolates exhibiting MICs > 128 mg/L therefore have an erythromycin resistance phenotype consistent with either possession of transferable – erm(B) – or mutational resistance. Genetic investigation of isolates will be necessary for definitive characterisation of the resistance mechanisms which are present. Any fluctuation observed in the MIC proportions observed in the distribution may provide an early indication of changes in the occurrence of high‐level macrolide resistance in Campylobacter spp.
4.2.5. Prevalence of antimicrobial resistance of Campylobacter jejuni in poultry
Attempt at assessing the prevalence of antimicrobial resistance in C. jejuni from broilers and fattening turkeys
The occurrence of resistance in C. jejuni in broilers and fattening turkeys describes the proportion of all C. jejuni isolates tested showing microbiological resistance to each antimicrobial Tables 39 and 40). The prevalence of resistant C. jejuni in broilers and fattening turkeys (Tables 43 and 44) describes the proportion of C. jejuni showing microbiological resistance to each antimicrobial as a percentage of all caecal samples cultured for C. jejuni. This prevalence of C. jejuni resistant is the product of the prevalence of C. jejuni in caecal samples from broilers and fattening turkeys (Table 42) and the occurrence of resistance in the C. jejuni isolates tested for susceptibility (Tables 43 and 44).
Table 43.
Prevalence of resistance to selected antimicrobials in Campylobacter jejuni from broilers, using harmonised ECOFFs, 26 EU/EEA MSs, 2016
| Country | GEN | STR | CIP | NAL | ERY | TET | ||||||
|---|---|---|---|---|---|---|---|---|---|---|---|---|
| Prev. | 95% CI | Prev. | 95% CI | Prev. | 95% CI | Prev. | 95% CI | Prev. | 95% CI | Prev. | 95% CI | |
| Austria | 0 | 0–0.7 | 3 | 1.1–4 | 36.5 | 32.2–40.9 | 34.3 | 30–38.6 | 0 | 0–0.7 | 23.5 | 19.7–27.4 |
| Belgium | 0 | 0–1.6 | 0.5 | 0–2.4 | 40.7 | 34.3–47.3 | 38.1 | 31.8–44.7 | 0 | 0–1.6 | 31.2 | 25.3–37.6 |
| Bulgaria | 0 | 0–0.8 | 2.6 | 0.6–3.2 | 17.8 | 14.4–21.8 | 17.8 | 14.4–21.8 | 2.3 | 0.5–2.9 | 9.1 | 6.5–12.1 |
| Croatia | 0 | 0–0.3 | 2 | 0.1–0.9 | 32.4 | 29.8–35.2 | 26.9 | 24.4–29.5 | 0 | 0–0.3 | 19 | 16.8–21.4 |
| Cyprus | 0.5 | 0–1.8 | 8.1 | 3–8.4 | 36.9 | 31.5–42.7 | 32.3 | 27.1–37.9 | 0 | 0–1.2 | 36.3 | 31.5–42.7 |
| Czech Republic | 0 | 0–1.5 | 0 | 0–1.5 | 19 | 14.2–24.6 | 18.6 | 13.8–24.1 | 0 | 0–1.5 | 8.9 | 5.6–13.2 |
| Denmark | 0 | 0–0.5 | 0.8 | 0.3–1.8 | 4.9 | 3.5–6.7 | 4.5 | 3.1–6.2 | 0.1 | 0–0.8 | 2.9 | 1.8–4.3 |
| Finland | 0 | 0–0.2 | 0.1 | 0–0.3 | 0.4 | 0.1–0.7 | 0.6 | 0.3–1.1 | 0 | 0–0.2 | 0.3 | 0.1–0.6 |
| Germany | 0.2 | 0–1.2 | 1.3 | 0.5–2.9 | 25.4 | 22.6–31 | 24.1 | 21.4–29.6 | 0 | 0–0.8 | 17.9 | 15.3–22.8 |
| Greece | 0 | 0–0.9 | 2.6 | 1.2–4.7 | 29.6 | 25.1–34.5 | 25.3 | 21–29.9 | 0 | 0–0.9 | 24.5 | 20.3–29.1 |
| Hungary | 0 | 0–0.8 | 0.9 | 0.2–2.3 | 35 | 30.3–39.4 | 33.6 | 29–38 | 0 | 0–0.8 | 20.2 | 16.5–24.1 |
| Ireland | 0 | 0–1.4 | 1.1 | 0.2–3.4 | 16.5 | 12.5–22.1 | 16.5 | 12.5–22.1 | 0 | 0–1.4 | 16.9 | 12.9–22.5 |
| Italy | 0 | 0–0.5 | 0.3 | 0–0.9 | 26.3 | 23.3–29.5 | 21 | 18.2–23.9 | 2.6 | 1.6–4 | 23.1 | 20.2–26.1 |
| Latvia | 0 | 0–3.6 | 20 | 12.7–29.2 | 47 | 36.9–57.2 | 46 | 36–56.3 | 0 | 0–3.6 | 31 | 22.1–41 |
| Lithuania | 0 | 0–0.9 | 1.8 | 0.4–2.7 | 27.9 | 23.8–32.5 | 27.9 | 23.8–32.5 | 0 | 0–0.9 | 18.1 | 14.6–22.1 |
| Poland | 0 | 0–2.1 | 30.2 | 24.7–39.1 | 91.6 | 86.6–95.5 | 83.7 | 81.8–92.2 | 0 | 0–2.1 | 70.3 | 66.4–80.1 |
| Portugal | 0 | 0–2.3 | 0.6 | 0–3.4 | 39.7 | 32.1–47.8 | 36.7 | 29.2–44.6 | 4.3 | 1.8–8.8 | 34.2 | 26.9–42 |
| Romania | 0 | 0–0.4 | 2.1 | 1.1–3.1 | 29 | 23.6–29.7 | 27.9 | 22.7–28.7 | 0.1 | 0–0.7 | 18.2 | 14.2–19.4 |
| Slovakia | 0.4 | 0–1.3 | 4.7 | 1.6–5.1 | 24.4 | 20.5–28.8 | 17.5 | 8.4–14.6 | 1.5 | 0.3–2.4 | 13.5 | 10.4–17.1 |
| Slovenia | 0 | 0–1.8 | 0 | 0–1.8 | 35.1 | 28.9–42 | 29.2 | 16.5–28.5 | 0 | 0–1.8 | 24.5 | 13.4–24.7 |
| Spain | 0 | 0–0.7 | 1.2 | 0.4–2.6 | 28.8 | 24.9–33 | 28.6 | 24.7–32.8 | 0.2 | 0–1.1 | 26.6 | 22.8–30.7 |
| Sweden | 0 | 0–0.1 | 0.1 | 0–0.1 | 1.9 | 1.5–2.3 | 1.9 | 1.5–2.9 | 0 | 0–0.1 | 2.3 | 1.9–2.8 |
| United Kingdom | 0 | 0–0.7 | 0.6 | 0–1.5 | 21.8 | 18.1–25.6 | 22.1 | 18.5–26 | 0.3 | 0–1.1 | 30.2 | 26.2–34.5 |
| Total (23MSs) | 0.03 | 0.01–0.07 | 1.7 | 1.5–1.9 | 18.4 | 17.8–19 | 17 | 16.4–17.6 | 0.37 | 0.28–0.48 | 14 | 13.4–14.5 |
| Iceland | 0 | 0–0.5 | 0 | 0–0.5 | 0.4 | 0–1 | 0.4 | 0–1 | 0 | 0–0.5 | 0.2 | 0–0.8 |
| Norway | 0 | 0–1.9 | 2.1 | 0.6–5.4 | 6.4 | 3.3–10.9 | 6.4 | 3.3–10.9 | 0 | 0–1.9 | 3.2 | 1.2–6.8 |
| Switzerland | 0.4 | 0–1.4 | 2 | 1–3.7 | 14.5 | 11.5–17.9 | 14.5 | 11.5–17.9 | 0.8 | 0.2–2.1 | 11.3 | 8.6–14.4 |
ECOFFs: epidemiological cut‐off values; MSs: Member States; N: number of isolates tested; Prev.: percentage of slaughtered broilers (caecal samples) harbouring resistant isolates per category of susceptibility; 95% CI: 95% confidence interval of % Prev.; CIP: ciprofloxacin; ERY: erythromycin; GEN: gentamicin; NAL: nalidixic acid; STR: streptomycin; TET: tetracycline.
Table 44.
Prevalence of resistance to selected antimicrobials in Campylobacter jejuni from fattening turkeys, using harmonised ECOFFs, nine EU MSs, 2016
| Country | GEN | STR | CIP | NAL | ERY | TET | ||||||
|---|---|---|---|---|---|---|---|---|---|---|---|---|
| Prev. | 95% CI | Prev. | 95% CI | Prev. | 95% CI | Prev. | 95% CI | Prev. | 95% CI | Prev. | 95% CI | |
| Austria | 0 | 0–1.8 | 3.7 | 0.6–5.1 | 38.2 | 31.4–45.3 | 32.6 | 26.2–39.7 | 0 | 0–1.8 | 27.9 | 22–35 |
| Germany | 0 | 0–0.7 | 1.4 | 0.6–2.9 | 31.1 | 27–35.3 | 29.3 | 25.3–33.5 | 0 | 0–0.7 | 20.9 | 17.4–24.7 |
| Hungary | 0 | 0–0.5 | 1.1 | 0.4–1.9 | 23 | 20.1–26.2 | 22.5 | 19.5–25.7 | 0 | 0–0.5 | 10.9 | 7.3–11.5 |
| Italy | 0 | 0–0.5 | 0.8 | 0.3–1.7 | 13.6 | 11.3–16.2 | 10.2 | 8.2–12.5 | 0.5 | 0.1–1.3 | 11.5 | 9.3–13.9 |
| Poland | 0 | 0–2.1 | 16.4 | 11.7–23.4 | 91.5 | 90.2–97.6 | 76.2 | 72.1–84.8 | 0.6 | 0–3.2 | 66 | 60.9–75.3 |
| Portugal | 1.1 | 0.1–3.9 | 0 | 0–2 | 19.7 | 14.2–26.2 | 18.6 | 13.2–25 | 2.2 | 0.6–5.5 | 14.8 | 10–20.7 |
| Romania | 0 | 0–11.6 | 0 | 0–11.6 | 40 | 22.7–59.4 | 33.3 | 17.3–52.8 | 0 | 0–11.6 | 30 | 14.7–49.4 |
| Spain | 0 | 0–0.8 | 1 | 0.3–2.4 | 17.2 | 14–20.9 | 17.2 | 14–20.9 | 0 | 0–0.8 | 16.8 | 13.6–20.4 |
| United Kingdom | 0 | 0–0.7 | 0.6 | 0.1–1.8 | 13.7 | 10.4–16.6 | 12.9 | 9.7–15.7 | 0.4 | 0–1.4 | 17.1 | 13.3–20 |
| Total (9 MSs) | 0.06 | 0.01–0.2 | 1.8 | 1.4–2.3 | 24.1 | 22.7–25.6 | 21.7 | 20.4–23.1 | 0.3 | 0.2–0.6 | 18.2 | 17–19.5 |
ECOFFs: epidemiological cut‐off values; MSs: Member States; N: number of isolates tested; Prev.: percentage of slaughtered broilers (caecal samples) harbouring resistant isolates per category of susceptibility; 95% CI: 95% confidence interval of % Prev.; CIP: ciprofloxacin; ERY: erythromycin; GEN: gentamicin; NAL: nalidixic acid; STR: streptomycin; TET: tetracycline.
Table 42.
Number and proportions (%) of Campylobacter jejuni‐positive caecal samples of broilers and fattening turkeys, EU/EEA MSs, 2016
| Country | Total caecal samples | C. jejuni | |
|---|---|---|---|
| Positive caecal samples | % | ||
| Fattening turkeys | |||
| Austria | 199 | 102 | 51.3 |
| Germany | 502 | 201 | 40.0 |
| Hungary | 747 | 201 | 26.9 |
| Italy | 785 | 131 | 16.7 |
| Poland | 171 | 168 | 98.2 |
| Portugal | 183 | 36 | 19.7 |
| Romania | 30 | 16 | 53.3 |
| Spain | 488 | 88 | 18.0 |
| United Kingdom | 498 | 197 | 39.6 |
| Total (9 MSs) | 3,603 | 1,140 | 31.6 |
| Broilers | |||
| Austria | 491 | 231 | 47.0 |
| Belgium | 231 | 176 | 76.2 |
| Bulgaria | 442 | 92 | 20.8 |
| Croatia | 1,184 | 455 | 38.4 |
| Cyprus | 303 | 130 | 42.9 |
| Czech Republic | 237 | 59 | 24.9 |
| Denmark | 735 | 160 | 21.8 |
| Finland | 1,948 | 84 | 4.3 |
| Germany | 446 | 158 | 35.4 |
| Greece | 388 | 128 | 33.0 |
| Hungary | 443 | 171 | 38.6 |
| Ireland | 254 | 170 | 66.9 |
| Italy | 806 | 258 | 32.0 |
| Latvia | 100 | 48 | 48.0 |
| Lithuania | 425 | 131 | 30.8 |
| Poland | 171 | 168 | 98.2 |
| Portugal | 161 | 67 | 41.6 |
| Romania | 840 | 313 | 37.3 |
| Slovakia | 429 | 133 | 31.0 |
| Slovenia | 199 | 112 | 56.3 |
| Spain | 500 | 162 | 32.4 |
| Sweden | 4,389 | 633 | 14.4 |
| United Kingdom | 493 | 265 | 53.8 |
| Total (23 MSs) | 15,615 | 4,304 | 27.6 |
| Iceland | 715 | 22 | 3.1 |
| Norway | 188 | 113 | 60.1 |
| Switzerland | 496 | 140 | 28.2 |
The estimates of the prevalence of C. jejuni in caecal samples of broilers and fattening turkeys are presented in Table 42. The number of colonies tested may have affected the C. jejuni prevalence estimates, because testing multiple colonies, increases the likelihood of detecting a positive C. jejuni sample, especially in cases in which C. jejuni is a minor component of the Campylobacter flora.
The prevalence of C. jejuni resistant to particular antimicrobials in broilers and fattening turkeys at slaughter is shown in Tables 43 and 44, respectively, and discussed below.
Methodological consideration on assessing the prevalence of resistance: isolation and speciation of C. jejuni from poultry
Although the over‐arching principle of the monitoring is that only one C. jejuni isolate from each epidemiological unit should be included in the sampling frame, variations in methods used for isolation and speciation of C. jejuni from poultry have occurred, as they are not fully harmonised between MSs, conversely to the susceptibility testing method. When primary culture plates are examined for suspect Campylobacter colonies, either one or several suspect C. jejuni isolates can be selected for further examination and confirmation of bacterial identification. Three of the countries submitting results (Germany, Norway and Spain) selected a single suspect Campylobacter colony from primary culture plates, whereas the remaining countries selected between two and five colonies. Conversely, the culture methods performed by reporting countries tended to be similar.
The methodology applied may have affected C. jejuni prevalence estimates and, subsequently, the estimates of prevalence of resistant C. jejuni. In general, it may be assumed that MSs using methods with increased intensity of effort to detect C. jejuni will report a higher relative prevalence. Table 42 presents results obtained using the available data, which should be interpreted with the caveat that the intensity of sampling effort is not equal between MSs. Further refinement and harmonisation of the methods and procedures is required and the figures in Table 42 should be considered in this context, keeping in mind these methodological differences between MSs.
4.3. Discussion
4.3.1. Antimicrobial resistance in Campylobacter spp. in humans
Information on antimicrobial resistance in Campylobacter isolates from human cases of campylobacteriosis was available from 17 MSs, plus Iceland and Norway in 2016. For ciprofloxacin, which is one of the two antimicrobials regarded as critically important for treatment of Campylobacter infections in humans (WHO, 2017), very high (> 50%) to extremely high (> 70%) resistance levels were reported in human Campylobacter jejuni isolates from all MSs except Denmark, plus Iceland and Norway. Nine out of 16 countries had levels of ciprofloxacin resistance in C. coli of 80–100%. The level of acquired resistance to fluoroquinolones was so high in some MSs that this antimicrobial agent can no longer be considered appropriate for routine empirical treatment of Campylobacter infections in humans. Increasing trends of fluoroquinolone resistance were observed from 2013 to 2016 in five countries for C. jejuni and in two countries for C. coli. Only two countries reported a decreasing trend for C. jejuni in the same period. Compared with 2015, lower levels of ciprofloxacin resistance were reported on average for the EU as a whole; however, this was mainly due to a dilution effect caused by the United Kingdom having increased their reporting from less than 500 isolates in 2015 to more than 8,700 isolates in 2016, with lower resistance levels compared with the EU average. Fluoroquinolone resistance in Campylobacter is mainly mediated by point mutations in the gyrA gene and these mutations seem to be stable and even constitute enhanced fitness, also after the antibiotic pressure has been removed (Luangtongkum et al., 2009). It may therefore be anticipated that ciprofloxacin resistance levels will remain high even after reduction of antimicrobial consumption.
The second antimicrobial regarded as critically important for treatment of campylobacteriosis in humans is erythromycin, within the class of macrolides (WHO, 2017). The proportion of human C. jejuni isolates resistant to erythromycin was overall low (2.1%) but markedly higher in C. coli (11.0%), with high to very high (22.8–63.2%) proportions of C. coli being resistant to erythromycin in a third of the reporting countries. The highest proportion of erythromycin resistance in C. jejuni from humans (11%) in 2016 was observed in Norway, where a dramatic increase (> 500%) compared with 2015 was observed. The reason for this increase is unknown and no erythromycin resistance was detected in Norwegian broilers in 2016 (Table 39). Increasing trends of erythromycin resistance was observed in three countries during the period 2013–2016 for C. jejuni and decreasing trends in two countries. In contrast with fluoroquinolone resistance, macrolide resistance, caused by mutations in the ribosomal target and/or by active efflux via the CmeABC efflux pump, implies a fitness cost for Campylobacter and removal of the selective pressure will reduce the prevalence of resistance (Luangtongkum et al., 2009). Recently, transferrable macrolide resistance via erm(B) was detected in Campylobacter from animals and humans in China (Wang et al., 2014) and, more recently, in broiler and turkey isolates in Spain (Florez‐Cuadrado et al., 2016, 2017) (see further discussion below). As this gene, which confers high‐level resistance to erythromycin, is often found together with other resistance genes on a multidrug‐resistant genomic island, it is likely that the carriage of this gene can be sustained by antibiotic pressure from other antimicrobials, e.g. tetracycline and aminoglycosides. One per cent of C. jejuni from humans and 14% of C. coli expressed high‐level erythromycin resistance (MIC > 128 mg/L) in 2016 but genotyping would be necessary to determine if this was due to the erm(B) gene.
Combined resistance to ciprofloxacin and erythromycin was low in C. jejuni but moderate in C. coli with five countries reporting high to very high co‐resistance levels. Nine per cent of the tested C. coli isolates were resistant to all three antimicrobials ciprofloxacin, erythromycin and tetracycline, possibly due to the presence of the efflux pump CmeABC. In four MSs, this resistance combination was observed in at least a third of the tested isolates and in two MSs (Estonia and Portugal), in about half of the isolates (the number of isolates tested in Estonia was, however, low). This is worrying since these three antimicrobials are all used for treatment of Campylobacter in humans and two of them are regarded as critically important antimicrobials by WHO (2017).
In this report, isolates from cases notified as having been acquired while travelling abroad were excluded from the analysis. The rationale was to assess the relationship between antimicrobial resistance in Campylobacter isolates from food and food‐producing animals with antimicrobial resistance in human isolates of Campylobacter spp. However, as imported or traded food can constitute a large proportion of the food available in some countries, the relationship between resistance in food and food‐producing animals and in the human population is complex.
While C. jejuni is the Campylobacter species causing most of the infections in humans, resistance to antimicrobials regarded as critically important for clinical treatment is a larger problem in C. coli. C. coli accounted for more than 11,000 laboratory‐confirmed human infections reported to ECDC for 2016. The poultry reservoir as a whole, including environmental transmission and direct animal contact in addition to preparation and consumption of poultry meat, has been estimated to account for up to 80% of campylobacteriosis cases (Wagenaar et al., 2013). C. coli has previously mostly been associated with the pig reservoir, but in several EU countries C. coli is now as prevalent, or even more prevalent, in poultry than C. jejuni (Stella et al., 2016; Torralbo et al., 2015; Wieczorek et al., 2013). To assess the most significant sources for multidrug‐resistant Campylobacter, it is therefore important that countries test and report antimicrobial susceptibility results also for C. coli from animals and food, although only mandatory to report for C. jejuni, according to the Commission Implementing Decision 2013/652/EU.
The quality of the AMR data for Campylobacter from humans has improved as a result of harmonised monitoring and reporting (ECDC, 2014, 2016). In 2016, almost 70% of the 19 reporting countries provided data as measured values to which ECOFFs could be applied. Six countries still provided results interpreted with clinical breakpoints. By combining the categories of clinically ‘intermediate’ resistant and clinically ‘resistant’, the ECOFF‐based category of ‘wild type’ corresponds fully to the ‘susceptible’ category and the ECOFF‐based category of ‘non‐wild type’ corresponds closely to the ‘non‐susceptible’ category with only one exception for tetracyclines and C. jejuni. So, this approach further improves the comparability of human and non‐human data. For future reports, EFSA and ECDC anticipate that more countries will report on both human and animal isolates. Data missing from one sector, while being available in the other, hampers the comparison between sectors in a one‐health perspective.
4.3.2. Antimicrobial resistance in Campylobacter spp. in food and animals
Scope of the monitoring
A recent systematic review of literature could not decide on a causal relationship between use of antimicrobials in agricultural animals and the prevalence of drug‐resistant food‐borne campylobacteriosis in humans, but concluded that, on the farm, antibiotic selection pressure could increase colonisation of animals with drug‐resistant Campylobacter spp. (McCrackin et al., 2016). Given that many studies have pointed to poultry as an important source of human campylobacteriosis, monitoring the antimicrobial resistance in Campylobacter from poultry is a priority. Because of the complexity of the antimicrobial resistance mechanisms of emergence, selection, co‐selection and persistence, this surveillance is also necessary for the evaluation of the impact of the changes in antimicrobial consumption, resulting from voluntary changes or policy initiatives (Zawack et al., 2016).
Commission Implementing Decision 2013/652/EU sets out the requirements for mandatorily monitoring antimicrobial resistance in C. jejuni from broilers and fattening turkeys in 2016. C. jejuni is indeed the main Campylobacter species responsible for human infections and is usually preponderant in poultry, but C. coli is recognised as the second Campylobacter affecting humans and is also very frequently found in poultry, sometimes at higher rates than C. jejuni (Pergola et al., 2017). For these reasons, and as C. coli typically exhibits higher levels of resistance to important antimicrobials than C. jejuni, MSs are also encouraged to monitor antimicrobial resistance in C. coli. In 2016, 5 EU MSs and 1 non‐MS reported AMR data on 192 C. coli isolates from broilers and 2 EU MSs on 251 C. coli isolates from fattening turkeys.
Results
For C. jejuni from poultry, the monitoring conducted in 24 EU MSs and 3 non‐MSs led to the reporting of 3,386 isolates from boilers, whereas 9 MSs reported on 1,061 isolates from fattening turkeys. France and the Netherlands did not report data on broilers and fattening turkeys for 2016, although the poultry farming sector of these countries contribute to a great extent to the European poultry production. Data reported on Campylobacter spp. from poultry meat were rather limited, as only six and two MSs reported on 695 C. jejuni isolates from broiler meat and 47 C. jejuni isolates from turkey meat, respectively. The data on antimicrobial susceptibility of Campylobacter spp. of poultry origin reported by MSs were well harmonised with almost all MSs following the requirements of Commission Implementing Decision 2013/652/EU and the recommendations of EFSA guidelines. Although susceptibility testing of streptomycin was voluntary, all reporting countries included it in the panel of substances tested.
As in previous years, results showed marked differences in resistance levels to some antimicrobials between different European countries, in particular for ciprofloxacin, nalidixic acid and tetracyclines, and to a lesser extent for streptomycin. Conversely, for gentamicin, all reported percentages, whatever their origin, were low or very low. This finding was also true for erythromycin in C. jejuni and strikingly also for C. coli from broilers although, in 2014, 14.5% of C. coli from broilers were found to be resistant to erythromycin. This result is probably linked to differences in the countries reporting data on C. coli in 2014 and 2016, noting that Germany and Slovenia reported lower percentages of erythromycin‐resistant C. coli from broilers in 2016 compared with 2014.
Comparison human/meat/broilers
No country reported on broilers, meat from broilers and humans in 2016. For all reporting MSs, overall resistance to fluoroquinolones in C. jejuni equalled 54.6% (range 33.3–94.0%) in isolates from humans, 66.9% (range 8.4–97.9%) in isolates from broilers and 76.2% (range 34.7–100%) in isolates from fattening turkeys. Overall resistance to erythromycin were 2.1% (range 0–6.6%, but 11.6% in Norway) in isolates from humans, 1.3% (range 0–10.9%, with no erythromycin‐resistant C. jejuni in broilers in Norway) in isolates from broilers and 1% (range 0–11.1%) in isolates from fattening turkeys. Combined resistance to ciprofloxacin and erythromycin was 0.6%, 1.2% and 1% in isolates from humans, broilers and turkeys, respectively, whereas the percentages of isolates susceptible to the four classes of antimicrobials were 33% in humans (seven reporting countries), 27.7% in broilers and 17.2% in turkeys. It must however be mentioned that only 13 MSs produced data on C. jejuni isolates from both human and broiler origins, and only two for human and turkey isolates. Inversely, a few countries reported on several thousands isolates from human but did not report for on any isolates from poultry.
Considering the 12 MSs and Iceland and Norway reporting on C. jejuni from both broilers and humans, significant differences in resistance to ciprofloxacin were observed in Denmark, Finland, Slovakia and Norway with fewer resistant strains in humans than in broilers in Slovakia and the opposite in the other reporting countries. For resistance to erythromycin, there were significant differences in Lithuania, Slovakia, UK and Norway with less resistant strains in humans in Slovakia and the opposite finding in the other three countries. For tetracycline, only data interpreted with ECOFF were considered. So significant differences were only detected for Finland and Norway, with less tetracycline‐resistant C. jejuni in broilers. Gentamicin was tested in only eight MSs and Norway for both broilers and human C. jejuni isolates; the percentages of resistance were less than 1%, except in Italy for human isolates only, in Slovakia (for both human and broiler isolates) and in Spain (for human isolates only).
Only two MSs, Luxembourg and Slovenia, reported results for C. coli isolates from broilers and humans; there were no significant differences in the percentages of resistance to ciprofloxacin, erythromycin and tetracycline between isolates from humans and broilers. Data from broiler meat and human isolates were available only from Luxembourg; the percentages of resistance of C. jejuni and C. coli to ciprofloxacin, erythromycin and tetracycline did not differ significantly between the two origins.
The significant differences in resistance between isolates from humans and those from broilers/broiler meat were observed only for C. jejuni, but this is probably due to the number of countries and isolates tested. These significant differences of resistance may be explained by several factors. As described previously, the origins of reported data for human isolates vary between countries, according to medicine and diagnostic practices, which may result in reporting of various clinical or regional subsets of isolates. The part of domestic versus imported broiler meat consumed in each country may also differ. Additionally, travel‐associated cases may represent diverse percentages of Campylobacter infections, and could not be excluded from national data in certain countries like Finland. Finally human contamination from other sources may also be underestimated as discussed below.
Other sources of human contamination
Recent publications, often based on genomic sequence data, have confirmed that broilers and turkeys and/or poultry meat are sources of Campylobacter infections in humans (Manfreda et al., 2016; Narvaez‐Bravo et al., 2017). In several Asian countries, the sequence type (ST)‐21 complex was shown to be the main ST complex in isolates from humans and chickens (Oh et al., 2017; Ohishi et al., 2017) and the levels of resistance to different antimicrobials observed did not significantly differed between C. jejuni isolates from humans and chickens. Differences between chicken‐ and human‐derived isolates were however detected for other characteristics, such as the lipooligosaccharide (LOS) classes associated to the main STs, suggesting that other sources might be implicated in human Campylobacter infections. Among these different sources, studies revealed the potential role of wild birds (Moré et al., 2017), pets (Szczepanska et al., 2017), environmental water (Szczepanska et al., 2017) and cattle (Cha et al., 2017; Thépault et al., 2017). The role played by these other sources in selection or transmission of antimicrobial‐resistant C. jejuni to humans should be further investigated.
Temporal trends
Steady statistically significant increasing trends in resistance to ciprofloxacin in C. jejuni from broilers were recorded in 10 reporting countries, whereas decreasing trend was only observed in one country (Slovenia). Increasing trends in resistance to tetracyclines were also recorded in 9 European countries. Interestingly, trends in resistance of C. jejuni to ciprofloxacin and to tetracyclines can be compared with those observed in indicator commensal E. coli. Although the two sets of bacteria were obtained from the same collections of representative random caecal samples collected in the countries, the trends observed in a number of countries were opposite between the two genera. Resistance to ciprofloxacin increased in C. jejuni but decreased in indicator E. coli isolated from broilers in Austria, the Netherlands and Spain. In contrast, resistance to tetracyclines increased in C. jejuni but decreased in indicator E. coli in Austria, France, Germany, Spain and Switzerland. Such discrepancies may derive from differing genetic supports of resistance mechanisms, phenomena of co‐selection between these two antimicrobials and/or other ones, as well as to biological cost or fitness of particular resistant clones.
Resistance profiles and mechanisms
Overall, in 2016, complete susceptibility was found in nearly 30% of the C. jejuni isolates from broilers tested in the reporting MSs. The significant combined resistance for public health to both ciprofloxacin and erythromycin in C. jejuni from broilers was detected in 7 out of the 27 reporting countries in 2016, and considering all reporting EU MSs, was assessed at 1.2% (38/3,117). For fattening turkeys, complete susceptibility was generally found in less than 20.0% of the C. jejuni isolates and the overall occurrence of combined resistance to ciprofloxacin and erythromycin in C. jejuni equalled 1.0% considering all reporting MSs.
Mechanisms of resistance to quinolones and fluoroquinolones
Resistance to quinolones and fluoroquinolones is usually due to mutations in the gyrase gene, the C257T mutation in the gyrA gene being the major mechanism for ciprofloxacin resistance. Importantly, Luo et al. (2005) showed that, in certain strains, this mutation did not result in a biological cost and fluoroquinolone‐resistant strains could outcompete susceptible ones in chickens in the absence of selective pressure. The authors concluded that the rapid emergence of fluoroquinolone‐resistant Campylobacter might be attributable partly to this phenomenon. Recently, a study from Ohishi (Ohishi et al., 2017) in Japan, described quinolone‐ and/or fluoroquinolone‐resistant C. jejuni strains of human and chicken origins without the C257T (Thr86Ile) mutation in gyrA and without any other amino‐acid mutations detected in the GyrA protein. Conversely, the authors found 13 C. jejuni isolates of human origin with the C257T mutation but that appeared susceptible to fluoroquinolones. Further characterisation of these strains is needed.
Mechanisms of resistance to macrolides
Resistance to erythromycin was rather low in isolates of poultry in 2016. Up to 2014, resistance to erythromycin was mainly thought to be the result of mutations in the ribosomal proteins L4 and L22 or in one or several copies of the ribosomal RNA genes, such as A2074G, A2074C, and A2075G (Luangtongkum et al., 2009). Conversely to the previously described gyrA mutation, these mutations usually result in a biological cost (Wang et al., 2014), probably explaining the relatively low prevalence of macrolide‐resistant C. jejuni. Recently, the rare A2074T mutation was discovered in a strain isolated from a diarrhoeic patient and it was shown that, when present in the three copies of the 23S rRNA gene, it conferred high‐level macrolide resistance, but imposed an in vitro fitness cost to the bacteria (Ohno et al., 2016).
Campylobacter spp. strains harbouring multidrug‐resistant genomic island (MDRGI).
More importantly from an epidemiological point of view, in 2014, a macrolide‐resistant C. coli isolate with a horizontally acquired rRNA methylase erm(B) was evidenced (Qin et al., 2014; Wang et al., 2014). The erm(B) gene, was detected in a multidrug‐resistant C. coli of porcine origin in China, and was associated with a chromosomal multidrug‐resistant genomic island (MDRGI), probably originated from Gram‐positive bacteria. The erm(B)‐containing MDRGI could be transferred from C. coli to C. jejuni by natural transformation. It contained, besides erm(B), several other resistance determinants [aac, aadE, aacA–aphD, the aadE–sat4–aphA3 cluster and a truncated tet(O)] and could confer resistance to macrolides, lincosamides and aminoglycosides to a recipient strain. As this MDRGI was present in a fluoroquinolone‐ and tetracycline‐resistant C. coli strain, this strain was resistant to all drugs used for the treatment of Campylobacter infections in humans. The same group (Wang et al., 2014) subsequently identified 58 isolates (57 C. coli and 1 C. jejuni) harbouring the erm(B) gene among 1,157 isolates from human patients, swine and poultry origins. All these isolates were resistant to erythromycin (with mainly but not only high‐level MIC), clindamycin, ciprofloxacin, tetracycline; 67% of these were also resistant to gentamicin; 38% also had the mutation A2075G in the 23S rRNA gene. The erm(B) gene was carried on the chromosome and on plasmids of various sizes in, respectively, 57% and 41% of the isolates. Plasmids carrying erm(B) were only found in swine isolates. Six different chromosomal MDRGI (types I–VI) were characterised, type III being the most common and present in both human and animal isolates. All chromosomal MDRGI types could be transferred by transformation but assays of transfer of resistance plasmids by natural transformation or conjugation were unsuccessful. According to Zhang et al. (Zhang et al., 2016), among 154 erythromycin‐resistant C. coli from diarrhoeal patients, chickens and pigs, nine (isolated from chickens) and eight (seven from patients and one from chicken) belonged to ST6322 and ST1145, respectively, and all of these had the erm(B) determinant. In the study by Zhou et al. (2016), for nine erythromycin‐non‐susceptible C. jejuni isolates from human diarrhoea in Beijing, China, obtained from 1994 to 2010, eight strains contained the A2075G mutation in the 23S rRNA gene, and four harboured the erm(B) gene (Zhou et al., 2016). Interestingly, the earliest erm(B)‐positive strain cj94473 was detected in a strain isolated in 1994, and the erm(B) gene was also detected in two intermediately resistant isolates, (erythromycin MIC = 16 mg/L). This was further investigated by Deng et al. (Deng et al., 2015) who highlighted constitutive and inducible expression of the erm(B) gene, the constitutive expression of erm(B) gene being more prevalent and associated with insertions and deletions in the regulatory region of the gene. The two inducible erm(B)‐positive isolates had low erythromycin MIC (2–4 mg/L) before induction and the erythromycin MIC only reached 16–32 mg/L after induction. So, according to Zhou et al. (2016) and Wang et al. (2014), it is important to search the transferable erythromycin resistance gene erm(B) not only in isolates with high‐level macrolide resistance but also in isolates of intermediate susceptibility, or even in susceptible ones, and this factor represents a real challenge for surveillance.
Liu et al. (2017) studied the prevalence of erm(B)‐positive Campylobacter in different regions of China in 2013–2015. They detected 84 erm(B)‐positive C. coli strains from a total of 3,462 samples collected from pig and chicken origins. The authors showed that, in one region, the rates of erm(B)‐positive Campylobacter increased remarkably from 2013 to 2015. Most erm(B) strains were isolated from chickens (83) and one was from a pig. The erm(B) gene was located most often in MDRGI of types V and VII and erm(B)‐positive isolates of chicken origin were found to share PFGE profiles and MLST sequences with human strains, suggesting again the transmission between animals and humans.
In Campylobacter isolates obtained from broilers in live bird markets in Shanghai, China, resistances to erythromycin and to azithromycin reached very high levels, respectively, 84.0% and 80.8% among 125 C. coli, but remained low (6.0% for erythromycin) for the 84 C. jejuni tested (Li et al., 2017). Analysis demonstrated the A2075G mutation in the 23S rRNA gene and the erm(B) gene, respectively in 75.7% and 20.4% of the 103 azithromycin‐resistant Campylobacter spp. The authors concluded that the part played by these live bird markets in Asia in transmission of antimicrobial‐resistant bacteria between flocks and from poultry to humans should be noted and transmission better controlled.
Finally, to date, only two reports relative to erm(B)‐positive Campylobacter in Europe have been published (Florez‐Cuadrado et al., 2016). A C. coli strain also resistant to fluoroquinolones, tetracycline and streptomycin but susceptible to gentamicin was isolated from a broiler in Spain and contained no other known macrolide‐resistance mechanisms. The erm(B) gene was borne on a new MDRGI type (type VIII), which also contained tetracycline and aminoglycoside resistance genes. Very recently, two erm(B)‐positive strains isolated from turkeys in Spain were described.
Resistance driven by efflux pump.
Efflux pumps encoded by bacteria can protect them from natural substances produced by the host such as bile, hormones and host‐defence molecules and are able to confer some resistance against structurally diverse antimicrobials. In C. jejuni, mutations in the CmeABC efflux pump cause a decrease in the MICs of various molecules such as ciprofloxacin, erythromycin, cefotaxime, rifampin, gentamicin and tetracycline (Guo et al., 2010). The expression of this chromosomal efflux pump is negatively regulated by CmeR, which binds to an inverted repeat (IR) on the cmeR–cmeA intergenic region of C. jejuni. Two recent publications (Yang et al., 2017; Zhang et al., 2017) point out the impact of substitutions, insertions or deletions in the IR: strains with such polymorphisms, sometimes in addition to the gyrA C257T mutation, are more often resistant to tetracycline, doxycycline, florfenicol, chloramphenicol and gentamicin and their ciprofloxacin MICs are higher (4–128 mg/L) according to Zhang et al. (Zhang et al., 2017) than the ones of strains without changes in the IR (4–8 mg/L) according to Zhang et al. (Zhang et al., 2017). The explanation lies in the lower binding of CmeR to CmeABC, resulting in an overexpression of the efflux pump. Besides these changes in the expression of the CmeABC pump, Yao et al. in China (Yao et al., 2016) identified isolates with a ‘super’ efflux pump variant of CmeABC (named RE‐CmeABC). The ciprofloxacin MICs of the isolates bearing the RE‐CmeABC and the C257T mutation in gyrA were excessively high (256–512 mg/L), and the isolates were also resistant to tetracycline and florfenicol, whereas erythromycin and chloramphenicol MICs varied, respectively, from 4 to 256 mg/L (erythromycin ECOFF: 4 mg/L for C. jejuni) and from 16 mg/L to 128 mg/L (chloramphenicol ECOFF: 16 mg/L for C. jejuni). The RE‐CmeABC coding region could be transferred between Campylobacter isolates by natural transformation and the MICs of florfenicol, chloramphenicol, ciprofloxacin, erythromycin and tetracycline were increased in the transformants. The authors demonstrated changes in the protein sequence in the drug‐binding pocket of CmeB that may possibly contribute to the enhanced efflux function. The prevalence of the RE‐CmeABC increased in the swine and broilers isolates from 2012 to 2015, mainly in C. jejuni, as a result of both clonal expansion and horizontal transmission, probably in link with the various antimicrobial selection pressures in these animal productions. The acquisition of such ‘super’ efflux pumps is quite worrying as it gives bacteria isolates the capacity to simultaneously gain resistance or decreased susceptibility to diverse classes of antimicrobials, including molecules with a therapeutic interest in humans. It is worth mentioning that Campylobacter sequences found in the gene databases indicate that such ‘super’ efflux pumps were already present in Europe more than 10 years ago. The current harmonised monitoring programme does not allow the detection of precise ciprofloxacin MIC of isolates not inhibited by 16 mg/L and florfenicol is not included in the list of molecules to test. Therefore, it is not possible to phenotypically detect Campylobacter isolates producing these super efflux pumps. Alterations in the monitoring programme to include a larger range of ciprofloxacin concentrations and the addition of florfenicol or chloramphenicol to the harmonised set of antimicrobial substances could be a valuable way to identify isolates with changes in the CmeABC pump sequence that should be further investigated via molecular methods.
Levels and mechanisms of resistance to gentamicin
Gentamicin is sometimes used to treat Campylobacter spp. systemic infections in humans, justifying the monitoring of resistance to this substance. Resistance to gentamicin was very rare in C. jejuni (0.1% in isolates from broilers and 0.2% in isolates from fattening turkeys), whereas resistance to streptomycin was detected in 6.1% of broiler isolates and 5.7% of fattening turkey isolates in 2016. In C. coli, resistance levels to gentamicin (0.6% in isolates from broilers and 2% in isolates from fattening turkeys) and to streptomycin (15.4% for broilers and 29.1% for fattening turkeys), were higher than in C. jejuni but still lower than the levels observed in C. coli isolates from pigs in 2015, particularly for streptomycin (79.4% of resistant C. coli in fattening pigs).
Campylobacter spp. are resistant to aminoglycosides by production of three types of aminoglycosides modifying enzymes (AME) including aminoglycoside acetyltransferases (AAC), aminoglycoside nucleotidyltransferase (ANT) and aminoglycoside phosphotransferases (APH). So aadA and aadE can confer resistance to streptomycin, aacA4 resistance to gentamicin and tobramycin and 3'APHs resistance to kanamycin and neomycin. In 2012, Qin et al. described the increase in gentamicin resistance in up to more than 20% of C. coli from broilers and swine in China (Qin et al., 2012). They could identify several AME genes (the aadE–sat4–aphA–3 cluster, aacA–aphD, aac, and aadE) borne on a chromosomal genomic island, which was particularly present in isolates belonging to the same C. coli clone of ST 1,625. In vitro, the genomic island could be transferred to a C. jejuni recipient strain by natural transformation. Only a few years later, in 2017, Yao et al. (Yao et al., 2017) reported that the prevalence of gentamicin resistance had reached alarming percentages of 15.6% in C. jejuni and 79.9% in C. coli of poultry and swine origins. The study showed that the AME aph(2’’)‐If gene was now more prevalent than the previously reported aacA/aphD gene. The aph(2’’)‐If gene was located on a chromosomal segment of 10.5 kbp containing 7 other AME and the cat (mediating chloramphenicol resistance) genes. This chromosomal segment could be transferred in vitro by natural transformation and the transformants were resistant to gentamicin, amikacin, kanamycin and neomycin. Molecular typing of the isolates from different regions suggested that the high‐level gentamicin resistance was the result of both diffusion of a particular C. coli clone and horizontal transfer of the aph(2’’)‐If gene‐containing chromosomal segment.
In the USA, the prevalence of resistance to gentamicin increased rapidly from rare in 2000–2006 to 18.1% of retail isolates and 12.2% of human isolates in 2011 (Zhao et al., 2015). According to PCR analysis and WGS of human and poultry strains, the authors demonstrated nine variants of gentamicin resistance genes aph(2’’)‐Ib, Ic, Ig, If, If1, If3, Ih, aac(6’)‐Ie/aph(2’’)‐Ia and aac(6’)‐Ie/aph(2’’)‐If, some of these (aph(2’’)‐Ib, Ic, If1, If3, Ih and aac(6’)‐Ie/aph(2’’)‐If2) being described for the first time in Campylobacter. The aph(2’’)‐Ig gene was the only AME gene found in both C. coli isolates from human and retail chicken; these isolates shared the same PFGE and resistance profiles. aph(2’’)‐Ig was carried by a self‐transmissible plasmid bearing other resistance genes [aad9, aadE, sat4, aph‐3 and tet(O)]. So expansion of the clone and dissemination of the plasmid may ensure a rapid diffusion of gentamicin resistance.
Campylobacter spp. strain harbouring cfr gene
Additionally to the different MDRGI previously described, plasmids carrying genes conferring resistance to different families of antimicrobials (Crespo et al., 2016; Yao et al., 2017), efflux pumps extruding structurally diverse molecules, and a new resistance determinant, cfr(C), were recently reported in Campylobacter (Tang et al., 2017). The cfr gene has already been described in various Gram‐positive and Gram‐negative bacteria and shown to confer resistance to phenicols, lincosamides, streptogramin A, pleuromutilins and oxazolidinones. In the studied C. coli isolates obtained from feedlot cattle in the USA, the florfenicol resistance was transferable by conjugation to a susceptible C. jejuni recipient strain, and molecular analyses revealed the presence of a conjugative plasmid of approximately 48 kbp, containing several virulence genes, the tet(O) and the aphA‐3 resistance genes, and the new cfr(C) gene, which was confirmed to increase the MICs of chloramphenicol, florfenicol, clindamycin, tiamulin and linezolid of the recipient strain (Campylobacter are intrinsically resistant to streptogramins). The cfr(C) gene was detected in 10% of 344 C. coli from cattle samples collected in five of the United States but not in 1,886 C. jejuni. All cfr(C)‐positive isolates were resistant to chloramphenicol and shared the same PFGE and MLST profiles, suggesting clonal dispersion. So, although phenicols, lincosamides, streptogramins, pleuromutilins and oxazolidinones are not used for the treatment of human Campylobacter infections, the cfr(C) gene should be monitored as its presence in Campylobacter widens the possibilities of selection or co‐selection of drug‐resistant Campylobacter isolates in animals, because phenicols, lincosamides and pleuromutilins can be used in animals.
Possible further assessment
Methods for determination of Campylobacter isolate susceptibility are harmonised in the EU MSs, contrary to methods used for Campylobacter isolation. The isolation methods, and particularly the enrichment, isolation media and the number of isolates which are tested, very probably impact the Campylobacter and the C. jejuni recovery (Ng et al., 1985; Reperant et al., 2016). This is important to bear in mind, as prevalence of resistance is interesting for study. It is also plausible that diverse isolation methods may yield C. jejuni isolates with varying susceptibilities and susceptibility results for strains isolated from the same collections of samples but using different protocols, therefore these should be evaluated and compared. If there are discrepancies, harmonisation of isolation methods should be considered when revising technical requirements for harmonised monitoring.
New mechanisms of AMR in Campylobacter have emerged or have been demonstrated in the last few years. Some of these, such as erm(B), ‘super’ efflux pumps, gentamicin resistance genes borne on chromosomal genomic island or on self‐transmissible plasmids or cfr(C). These seem to spread very rapidly, either by clonal diffusion or horizontal gene transfer and are already present in C. jejuni field isolates or can be transferred in vitro to C. jejuni, the main Campylobacter species isolated from human patients. As these mechanisms (efflux pumps) and/or their genetic support (plasmids, MDRGI) confer resistance to one or several families of antimicrobials of major importance for therapy (macrolides, fluoroquinolones or aminoglycosides) or could favour co‐selection of resistant clones or plasmids, it is necessary to optimise methods aimed at their early detection. Several changes in the monitoring protocol could be proposed, such as expansion of the range of concentrations tested for erythromycin and ciprofloxacin and evaluation of the susceptibilities of additional molecules, such as phenicols. Detection by PCR analysis of the erm(B) gene should be conducted in all erythromycin‐resistant isolates. WGS of the few isolates with multidrug resistance or resistance to gentamicin should provide evidence of the involved genes, detect resistant clones and could be used to compare with sequences from human isolates. MSs should be strongly encouraged to monitor antimicrobial resistance of C. coli, as several of the newly described mechanisms such as involving erm(B), AMEs and cfr(C) genes, were first discovered in C. coli but later showed possible transfer to C. jejuni.
5. Antimicrobial resistance in indicator Escherichia coli
Rationale for monitoring antimicrobial resistance (AMR) in indicator E. coli in food‐producing animals and food.
Commensal E. coli is typically chosen as the representative indicator of antimicrobial resistance in Gram‐negative bacteria, as it is commonly present in animal faeces, may be relevant to human medicine and can often acquire conjugative plasmids, which can carry resistance determinants and are transferable between enteric bacteria. Commensal E. coli that are resistant and present in the intestines of food‐producing animals constitute a reservoir of resistance genes that can spread horizontally to zoonotic and other bacteria present in the food chain. The monitoring of antimicrobial resistance in indicator E. coli, isolated from either randomly selected healthy animals or carcasses and their meat, and chosen to be representative of the general population, provides valuable data on resistance occurring in that population. Determining the occurrence of resistance to antimicrobials in a representative sample of indicator E. coli provides useful data for investigating the relationship between the occurrence of resistance and the selective pressure exerted by the use of antimicrobials on the intestinal population of bacteria in food‐producing animals. Indicator E. coli is also helpful as a representative of the Enterobacteriaceae to monitor the emergence of and changes in the proportion of bacteria producing extended‐spectrum β‐lactamases (ESBLs). Since 2014, monitoring of AMR in indicator E. coli from food‐producing animals and their food products has been mandatory under the EU legislation.
5.1. Antimicrobial resistance in indicator E. coli from poultry
5.1.1. Antimicrobial resistance in indicator E. coli from broilers and meat from broilers
Representative monitoring
For 2016, 27 EU MSs – all except Luxembourg – and 3 non‐MSs reported susceptibility data on indicator (commensal) E. coli isolates from the caecal content of broilers (Table 45), and 3 MSs also provided data on a voluntary basis on E. coli isolates from broiler meat (Table 46 and Table ESCHEOVERVIEW). Data were obtained according to the requirements laid down in Commission Implementing Decision 2013/652/EC, and ‘microbiological’ resistance to the harmonised set of substances (as opposed to ‘clinical’ resistance) was interpreted using epidemiological cut‐off values (ECOFFs) laid down in the Decision.13
Table 45.
Occurrence of resistance (%) to selected antimicrobials in indicator Escherichia coli from broilers, using harmonised ECOFFs, 30 EU/EEA MSs, 2016
| Country | N | GEN | CHL | AMP | CTX | CAZ | MEM | TGC | NAL | CIP | AZM | COL | SMX | TMP | TET |
|---|---|---|---|---|---|---|---|---|---|---|---|---|---|---|---|
| Austria | 170 | 3.5 | 4.7 | 32.9 | 0.6 | 0.6 | 0 | 0 | 45.3 | 47.1 | 1.8 | 0 | 37.1 | 29.4 | 22.4 |
| Belgium | 151 | 4 | 22.5 | 82.1 | 0.7 | 0.7 | 0 | 0 | 47.7 | 56.3 | 0.7 | 0 | 66.2 | 56.3 | 49.7 |
| Bulgaria | 111 | 18 | 31.5 | 76.6 | 3.6 | 0.9 | 0 | 0 | 79.3 | 86.5 | 5.4 | 0 | 79.3 | 61.3 | 68.5 |
| Croatia | 85 | 7.1 | 7.1 | 52.9 | 4.7 | 3.5 | 0 | 0 | 85.9 | 90.6 | 0 | 0 | 52.9 | 32.9 | 51.8 |
| Cyprus | 85 | 9.4 | 35.3 | 78.8 | 4.7 | 4.7 | 1.2 | 7.1 | 72.9 | 80 | 16.5 | 9.4 | 75.3 | 70.6 | 92.9 |
| Czech Republic | 227 | 0.9 | 1.8 | 35.2 | 0.4 | 0.4 | 0 | 0 | 62.6 | 66.5 | 0.4 | 0 | 21.6 | 15.9 | 21.1 |
| Denmark | 186 | 1.1 | 2.2 | 27.4 | 1.1 | 1.1 | 0 | 0 | 13.4 | 12.9 | 0 | 0 | 26.9 | 21 | 15.6 |
| Estonia | 73 | 1.4 | 11 | 89 | 0 | 0 | 0 | 0 | 80.8 | 89 | 0 | 0 | 31.5 | 42.5 | 26 |
| Finland | 184 | 0 | 0 | 8.7 | 0.5 | 0.5 | 0 | 0 | 3.3 | 3.8 | 0 | 0 | 5.4 | 3.8 | 9.8 |
| France | 188 | 3.2 | 7.4 | 55.9 | 3.7 | 2.1 | 0 | 0.5 | 34 | 35.6 | 0.5 | 2.7 | 55.3 | 47.3 | 62.2 |
| Germany | 177 | 6.8 | 9.6 | 59.3 | 1.1 | 1.1 | 0 | 0 | 56.5 | 59.9 | 2.3 | 4 | 46.9 | 38.4 | 27.7 |
| Greece | 170 | 12.4 | 25.9 | 72.4 | 2.4 | 1.8 | 0 | 0 | 82.4 | 88.2 | 11.2 | 0 | 78.2 | 71.2 | 69.4 |
| Hungary | 170 | 4.1 | 11.8 | 57.1 | 7.1 | 7.1 | 0 | 0 | 74.1 | 81.2 | 2.4 | 0 | 38.8 | 24.1 | 36.5 |
| Ireland | 170 | 1.2 | 8.2 | 65.3 | 2.4 | 1.8 | 0 | 0 | 31.8 | 34.1 | 7.1 | 0 | 52.9 | 45.3 | 52.4 |
| Italy | 171 | 7 | 45 | 86 | 5.3 | 5.3 | 0 | 0 | 74.3 | 78.9 | 2.3 | 2.9 | 74.3 | 63.7 | 65.5 |
| Latvia | 100 | 1 | 16 | 46 | 8 | 7 | 0 | 0 | 62 | 70 | 0 | 0 | 43 | 32 | 48 |
| Lithuania | 100 | 35 | 47 | 100 | 52 | 52 | 0 | 0 | 80 | 92 | 3 | 0 | 91 | 73 | 68 |
| Malta | 31 | 6.5 | 3.2 | 54.8 | 0 | 0 | 0 | 0 | 64.5 | 67.7 | 0 | 0 | 51.6 | 38.7 | 51.6 |
| Netherlands | 300 | 4.3 | 7 | 47 | 1 | 1 | 0 | 0 | 39.3 | 41 | 0 | 0 | 40.7 | 36.7 | 30.3 |
| Poland | 173 | 9.8 | 24.9 | 91.3 | 3.5 | 3.5 | 0 | 1.7 | 78 | 90.2 | 4.6 | 3.5 | 71.1 | 61.8 | 72.8 |
| Portugal | 161 | 14.9 | 23 | 80.1 | 6.2 | 5.6 | 0 | 0 | 90.7 | 94.4 | 8.7 | 5.6 | 64.6 | 56.5 | 71.4 |
| Romania | 840 | 16.4 | 31.3 | 59.6 | 3.5 | 2.9 | 0 | 0 | 85.7 | 89.5 | 9.3 | 5.6 | 59.4 | 46.5 | 60.1 |
| Slovakia | 85 | 1.2 | 5.9 | 65.9 | 0 | 0 | 0 | 0 | 78.8 | 87.1 | 0 | 0 | 37.6 | 31.8 | 47.1 |
| Slovenia | 85 | 2.4 | 2.4 | 69.4 | 5.9 | 5.9 | 0 | 0 | 75.3 | 83.5 | 1.2 | 0 | 34.1 | 25.9 | 41.2 |
| Spain | 171 | 35.7 | 17 | 62.6 | 9.4 | 7.6 | 0 | 0 | 88.3 | 91.2 | 10.5 | 1.2 | 49.7 | 33.3 | 61.4 |
| Sweden | 175 | 0.6 | 0 | 13.1 | 1.7 | 1.7 | 0 | 0 | 6.3 | 5.7 | 0 | 0 | 13.1 | 7.4 | 11.4 |
| United Kingdom | 190 | 7.4 | 3.7 | 67.4 | 0 | 0 | 0 | 0 | 21.1 | 21.6 | 0 | 0 | 52.6 | 42.6 | 44.2 |
| Total (27 MSs) | 4,729 | 8.9 | 16.6 | 58 | 4 | 3.6 | 0 | 0.2 | 59.8 | 64 | 4 | 1.9 | 49.9 | 40.7 | 47.1 |
| Iceland | 94 | 0 | 0 | 6.4 | 0 | 0 | 0 | 0 | 1.1 | 1.1 | 0 | 0 | 3.2 | 1.1 | 7.4 |
| Norway | 181 | 0.6 | 0 | 3.9 | 0 | 0 | 0 | 0.6 | 6.1 | 6.1 | 0 | 0 | 7.2 | 1.7 | 3.3 |
| Switzerland | 190 | 2.1 | 1.1 | 24.7 | 0 | 0 | 0 | 0 | 39.5 | 37.9 | 0.5 | 0.5 | 27.4 | 12.6 | 13.2 |
ECOFFs: epidemiological cut‐off values; MSs: Member States; N: number of isolates tested; GEN: gentamicin; CHL: chloramphenicol; AMP: ampicillin; CTX: cefotaxime; CAZ: Ceftazidime; MEM: meropenem; TGC: tigecycline, NAL: nalidixic acid; CIP: ciprofloxacin; AZM: azithromycin; COL: colistin; SMX: sulfamethoxazole; TMP: trimethoprim; TET: tetracycline.
Table 46.
Occurrence of resistance (%) to selected antimicrobials in indicator Escherichia coli from meat from broilers, using harmonised ECOFFs, 3 EU MSs, 2016
| Country | N | GEN | CHL | AMP | CTX | CAZ | MEM | TGC |
|---|---|---|---|---|---|---|---|---|
| Germany | 162 | 5.6 | 9.9 | 58 | 4.9 | 4.3 | 0 | 0 |
| Italy | 170 | 4.1 | 32.4 | 80.6 | 4.1 | 2.9 | 0 | 0 |
| Netherlands | 134 | 2.2 | 3.7 | 28.4 | 2.2 | 1.5 | 0 | 0 |
| Total (3 MSs) | 466 | 4.1 | 16.3 | 57.7 | 3.9 | 3 | 0 | 0 |
| Country | N | NAL | CIP | AZM | COL | SMX | TMP | TET |
|---|---|---|---|---|---|---|---|---|
| Germany | 162 | 45.1 | 50 | 1.2 | 4.3 | 46.3 | 35.8 | 33.3 |
| Italy | 170 | 60 | 64.7 | 4.1 | 5.9 | 66.5 | 54.7 | 65.9 |
| Netherlands | 134 | 20.9 | 22.4 | 0 | 0.7 | 20.9 | 17.2 | 26.1 |
| Total (3 MSs) | 466 | 43.6 | 47.4 | 1.9 | 3.9 | 46.4 | 37.3 | 43.1 |
ECOFFs: epidemiological cut‐off values; MSs: Member States; N: number of isolates tested; GEN: gentamicin; CHL: chloramphenicol; AMP: ampicillin; CTX: cefotaxime; CAZ: Ceftazidime; MEM: meropenem; TGC: tigecycline; NAL: nalidixic acid; CIP: ciprofloxacin; AZM: azithromycin; COL: colistin; SMX: sulfamethoxazole; TMP: trimethoprim; TET: tetracycline.
Resistance levels in indicator E. coli from broilers and meat from broilers
Occurrence of resistance in indicator E. coli isolated from caecal content of broilers varied markedly between reporting countries (Table 45). Notably, in general, occurrence of resistance was lower in the Nordic countries: Finland, Sweden, Norway and Iceland than in other European countries.
Quinolone resistance (nalidixic acid and ciprofloxacin) was the most common trait and occurrence was overall very high in the MSs, at 59.8% and 64.0% for nalidixic acid and ciprofloxacin, respectively. There was an obvious variation in quinolone resistance between countries. In 14 countries, occurrence was extremely high and, in 4 countries, very high. In contrast, the occurrence of quinolone resistance was low in four countries.
Overall, ampicillin resistance was very high in the EU MSs, 58.0%, and resistance to sulfamethoxazole, tetracyclines and trimethoprim was high, at 49.9%, 47.1% and 40.7%, respectively. There was a marked variation between countries also for these antimicrobials. In seven countries, the occurrence of resistance to these antimicrobials was extremely high or very high, but for all four antimicrobials it was low in three countries.
Chloramphenicol resistance in MSs was overall moderate, 16.6%, and resistance to gentamicin was low, 8.9%. Again, there was variation between countries and nine MSs reported a high occurrence of chloramphenicol resistance and six MSs a high or moderate occurrence of gentamicin resistance. In contrast, resistance to both these antimicrobials was rare in four countries.
Resistance to the third‐generation cephalosporins cefotaxime and ceftazidime was overall low in MSs, 4.0% and 3.6%, respectively. In seven countries, this type of resistance was not detected and in other countries occurrence was very low or low. An exception was Lithuania reporting an occurrence of 52% for both cefotaxime and ceftazidime. For a comprehensive analysis of resistance to third‐generation cephalosporins see Section 7.2.
Azithromycin resistance in MSs was overall low, 4.0%. In 12 countries, azithromycin resistance was not detected and in 4 countries it was very low. However, 11 countries reported an occurrence of 1.8–9.3% (low) and 3 countries (Cyprus, Greece and Spain) a moderate occurrence (10.5–16.5%).
Meropenem resistance was overall rare and detected in one isolate only, from Cyprus, but not in the other countries. The finding of phenotypic resistance to meropenem in the E. coli isolate indicates the presence of genes conferring carbapenem resistance. For more information on carbapenem resistance, see Section 7.2.
Colistin resistance was overall low in MSs, 1.9%. Twenty‐one countries did not report any resistant isolates and one country reported a very low occurrence. However, France, Germany, Italy, Poland Portugal, Romania and Spain reported higher occurrences, 2.7–5.6%, and Cyprus an occurrence of 9.4%.
Tigecycline resistance was reported from four countries. Of these, France and Norway reported only one resistant isolate per country but Poland and Cyprus reported higher occurrences, 1.7% and 7.1%, respectively.
Resistance in E. coli isolated from meat of broilers was reported from three EU MSs (Germany, Italy and the Netherlands), on a voluntary basis (Table 46). Ampicillin resistance was the most common trait with an overall occurrence at the very high level of 57.7%. There were differences between the situation observed in the reporting MSs, as the occurrence in Italy, Germany and the Netherlands was extremely high, very high and high, respectively. Resistance to quinolones (nalidixic acid and ciprofloxacin), sulfamethoxazole, trimethoprim and tetracycline was overall high. Again, there were differences between the MSs and occurrence of resistance to all these antimicrobials was very high in Italy, but high or moderate in Germany and the Netherlands. Chloramphenicol resistance was overall moderate in the three MSs, but low in Germany and the Netherlands and, in contrast, high in Italy. Resistance to gentamicin, third‐generation cephalosporins (cefotaxime and ceftazidime) was low in all MSs. Likewise, resistance to azithromycin and colistin was low in Germany and Italy and very low or rare in the Netherlands. Meropenem and tigecycline resistance was not detected in any of the three MSs.
A comparison of resistance in indicator E. coli from broilers and from broiler meat is limited to Germany, Italy and the Netherlands, as these countries reported data on both broilers and broiler meat for 2016. In these three MSs, the occurrence of resistance to most antimicrobials was generally of the same magnitude in the isolates from broilers and from broiler meat. A striking exception is the Netherlands, where the occurrence of resistance to several antimicrobials (gentamicin, chloramphenicol, ampicillin, nalidixic acid, ciprofloxacin, sulfamethoxazole and trimethoprim) was about twice as high in indicator E. coli isolates from broilers as in isolates recovered from broiler meat (Tables 45 and 46). In Germany, in contrast, resistance to third‐generation cephalosporins (cefotaxime and ceftazidime) was higher in E. coli from broiler meat than in isolates from broilers.
Spatial distribution of resistance in indicator E. coli from broilers
For several antimicrobials, the occurrence of resistance in E. coli from broilers differed substantially between countries (Table 45). The spatial distributions of the levels of resistance to cefotaxime and ciprofloxacin are shown in Figure 86.
Figure 86.
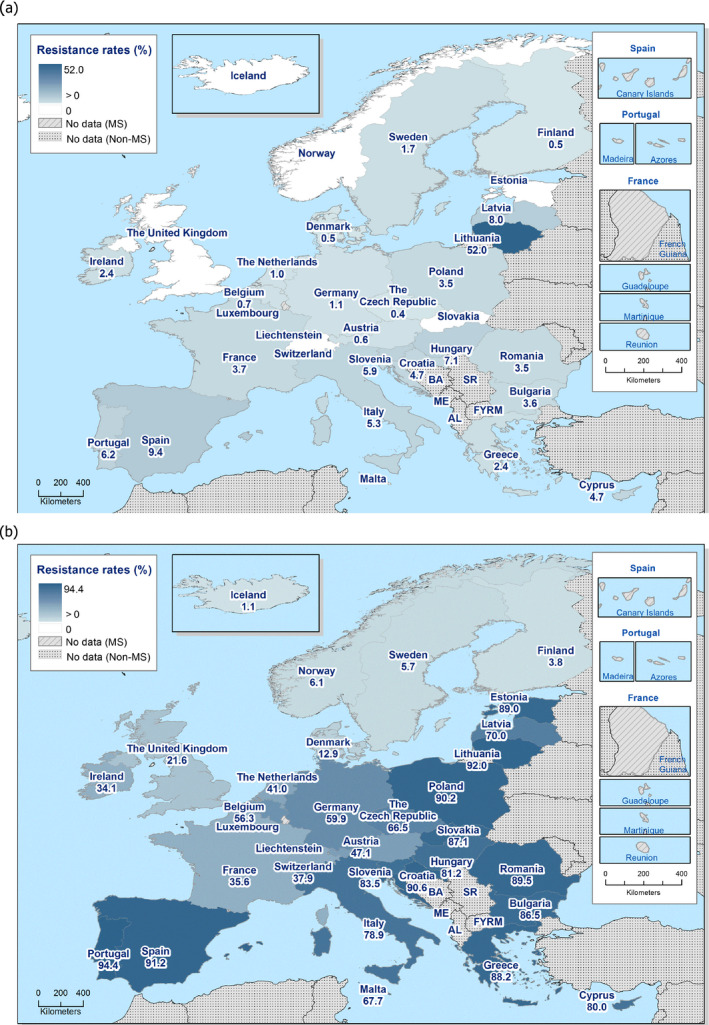
Spatial distribution of resistance to cefotaxime (a) and ciprofloxacin (b) in indicator Escherichia coli from broilers, using harmonised ECOFFs, 30 EU/EEA Member States, 2016
Overall, in 2016, resistance to third‐generation cephalosporins (cefotaxime and ceftazidime) was low in the EU MSs, at 4.0% and 3.6%, respectively (Table 45), but marked differences were observed between countries, as illustrated for cefotaxime resistance in Figure 86a. Notably, six countries reported no cefotaxime‐resistant E. coli isolates, whereas Lithuania reported a very high occurrence of cefotaxime resistance (52%). Although there is no clear spatial pattern in the distribution of cefotaxime resistance, occurrence tended to be higher in eastern and southern Europe.
In 2016, resistance to quinolones (nalidixic acid and ciprofloxacin) was the most common resistance trait reported in E. coli isolates from broilers and occurrence was overall very high in MSs, 59.8% and 64.0% for nalidixic acid and ciprofloxacin, respectively (Table 45). There were, however, large variations between countries, as illustrated for ciprofloxacin resistance in Figure 86b. Occurrence was the lowest in the Nordic countries and the highest in southern and eastern parts of Europe.
Combined resistance to cefotaxime and ciprofloxacin in indicator E. coli from broilers
Resistance to critically important antimicrobials, and particularly the occurrence of isolates exhibiting combined resistance to cefotaxime and ciprofloxacin, is of specific public health relevance in monitoring. In 2016, 3.1% (159/5,194) of the isolates from broilers and originating from 21 MSs, were resistant to both cefotaxime and ciprofloxacin, when MICs were interpreted using ECOFFs (Table 47). Of these isolates, 61 (1.2%; 61/5,194) originating from 10 MSs, were also resistant to ciprofloxacin and cefotaxime when MICs were interpreted using clinical breakpoints (Table 47).
Table 47.
Combined resistance to fluoroquinolones and third‐generation cephalosporins in indicator Escherichia coli from broilers in MSs, 2016
| Country | N | Multiresistance patterns of isolates resistant to both CIP and CTX (number of isolates) | Resistant to both CIP and CTX, applying ECOFFs | Resistant to both CIP and CTX, applying CBPs | ||
|---|---|---|---|---|---|---|
| n | % | n | % | |||
| Belgium | 151 | AMP‐CTX‐CAZ‐CIP‐NAL‐SMX(1) | 1 | 0.7 | – | – |
| Bulgaria | 111 | AMP‐CTX‐CAZ‐CIP‐NAL‐SMX‐TET(1) | 3 | 2.7 | 3 | 2.7 |
| AMP‐CTX‐CHL‐CIP‐GEN‐NAL‐SMX‐TET‐TMP(1) | ||||||
| AMP‐CTX‐CIP‐NAL‐SMX‐TET‐TMP(1) | ||||||
| Croatia | 85 | AMP‐CTX‐CAZ‐CIP‐NAL‐SMX‐TMP(1) | 4 | 4.7 | 1 | 1.2 |
| AMP‐CTX‐CAZ‐CIP‐NAL‐TET(2) | ||||||
| AMP‐CTX‐CIP‐NAL‐TET(1) | ||||||
| Cyprus | 85 | AMP‐CTX‐CAZ‐CHL‐CIP‐COL‐NAL‐SMX‐TET‐TGC‐TMP(1) | 4 | 4.7 | 3 | 3.5 |
| AMP‐CTX‐CAZ‐CHL‐CIP‐GEN‐NAL‐SMX‐TET‐TMP(1) | ||||||
| AMP‐CTX‐CAZ‐CIP‐COL‐NAL‐SMX‐TET‐TGC‐TMP(1) | ||||||
| AMP‐CTX‐CIP‐NAL‐SMX‐TET‐TMP(1) | ||||||
| Czech Republic | 227 | AMP‐CTX‐CAZ‐CIP‐NAL‐SMX‐TET‐TMP(1) | 1 | 0.4 | – | . |
| Denmark | 186 | AMP‐CTX‐CAZ‐CIP‐NAL‐TET(1) | 1 | 0.5 | – | . |
| Finland | 184 | AMP‐CTX‐CAZ‐CIP‐NAL‐SMX‐TET‐TMP(1) | 1 | 0.5 | . | . |
| France | 188 | AMP‐CTX‐CAZ‐CIP‐NAL‐SMX(1) | 3 | 1.6 | 3 | 1.6 |
| AMP‐CTX‐CAZ‐CIP‐NAL‐SMX‐TET(1) | ||||||
| AMP‐CTX‐CAZ‐CIP‐NAL‐TET(1) | ||||||
| Germany | 177 | AMP‐CTX‐CAZ‐CIP‐NAL(1) | 1 | 0.6 | . | . |
| Greece | 170 | AMP‐CTX‐CAZ‐CHL‐CIP‐GEN‐NAL‐SMX‐TET(1) | 3 | 1.8 | 1 | 0.6 |
| AMP‐CTX‐CAZ‐CHL‐CIP‐GEN‐SMX‐TET‐TMP(1) | ||||||
| AMP‐CTX‐CIP‐GEN‐NAL‐SMX‐TET‐TMP(1) | ||||||
| Hungary | 170 | AMP‐CTX‐CAZ‐CHL‐CIP‐NAL‐SMX(1) | 11 | 6.5 | 5 | 2.9 |
| AMP‐CTX‐CAZ‐CHL‐CIP‐NAL‐TET(1) | ||||||
| AMP‐CTX‐CAZ‐CIP(1) | ||||||
| AMP‐CTX‐CAZ‐CIP‐GEN‐NAL‐TET(1) | ||||||
| AMP‐CTX‐CAZ‐CIP‐GEN‐SMX‐TET(1) | ||||||
| AMP‐CTX‐CAZ‐CIP‐NAL(3) | ||||||
| AMP‐CTX‐CAZ‐CIP‐NAL‐SMX‐TET(1) | ||||||
| AMP‐CTX‐CAZ‐CIP‐NAL‐SMX‐TET‐TMP(1) | ||||||
| AMP‐CTX‐CAZ‐CIP‐NAL‐SMX‐TMP(1) | ||||||
| Ireland | 170 | AMP‐CTX‐CAZ‐CHL‐CIP‐GEN‐NAL‐SMX‐TET‐TMP(1) | 2 | 1.2 | . | . |
| AMP‐CTX‐CAZ‐CIP‐NAL‐SMX‐TET‐TMP(1) | ||||||
| Italy | 171 | AMP‐CTX‐CAZ‐CHL‐CIP‐GEN‐NAL‐SMX‐TMP(1) | 6 | 3.5 | 3 | 1.8 |
| AMP‐CTX‐CAZ‐CHL‐CIP‐NAL‐SMX‐TET‐TMP(2) | ||||||
| AMP‐CTX‐CAZ‐CHL‐CIP‐SMX‐TET(1) | ||||||
| AMP‐CTX‐CAZ‐CIP‐NAL‐SMX‐TET(1) | ||||||
| AMP‐CTX‐CAZ‐CIP‐NAL‐TET(1) | ||||||
| Latvia | 100 | AMP‐CTX‐CAZ‐CHL‐CIP‐NAL‐SMX‐TET(1) | 8 | 8 | . | . |
| AMP‐CTX‐CAZ‐CHL‐CIP‐NAL‐SMX‐TET‐TMP(5) | ||||||
| AMP‐CTX‐CAZ‐CHL‐CIP‐NAL‐SMX‐TMP(1) | ||||||
| AMP‐CTX‐CHL‐CIP‐NAL‐SMX‐TET‐TMP(1) | ||||||
| Lithuania | 100 | AMP‐CTX‐CAZ‐CHL‐CIP‐GEN‐NAL‐SMX(4) | 50 | 50 | 8 | 8 |
| AMP‐CTX‐CAZ‐CHL‐CIP‐GEN‐NAL‐SMX‐TET(5) | ||||||
| AMP‐CTX‐CAZ‐CHL‐CIP‐GEN‐NAL‐SMX‐TET‐TMP(5) | ||||||
| AMP‐CTX‐CAZ‐CHL‐CIP‐GEN‐NAL‐SMX‐TMP(1) | ||||||
| AMP‐CTX‐CAZ‐CHL‐CIP‐NAL‐SMX(1) | ||||||
| AMP‐CTX‐CAZ‐CHL‐CIP‐NAL‐SMX‐TET(1) | ||||||
| AMP‐CTX‐CAZ‐CHL‐CIP‐NAL‐SMX‐TET‐TMP(8) | ||||||
| AMP‐CTX‐CAZ‐CHL‐CIP‐NAL‐SMX‐TMP(2) | ||||||
| AMP‐CTX‐CAZ‐CHL‐CIP‐SMX‐TET‐TMP(1) | ||||||
| AMP‐CTX‐CAZ‐CHL‐CIP‐SMX‐TMP(1) | ||||||
| AMP‐CTX‐CAZ‐CIP‐GEN‐NAL‐SMX‐TET(2) | ||||||
| AMP‐CTX‐CAZ‐CIP‐GEN‐NAL‐SMX‐TET‐TMP(3) | ||||||
| AMP‐CTX‐CAZ‐CIP‐GEN‐NAL‐SMX‐TMP(1) | ||||||
| AMP‐CTX‐CAZ‐CIP‐GEN‐SMX‐TET‐TMP(2) | ||||||
| AMP‐CTX‐CAZ‐CIP‐NAL‐SMX‐TET(1) | ||||||
| AMP‐CTX‐CAZ‐CIP‐NAL‐SMX‐TET‐TMP(8) | ||||||
| AMP‐CTX‐CAZ‐CIP‐SMX‐TET‐TMP(2) | ||||||
| AMP‐CTX‐CAZ‐CIP‐SMX‐TMP(2) | ||||||
| Netherlands | 300 | AMP‐CTX‐CAZ‐CHL‐CIP‐NAL‐SMX‐TET‐TMP(1) | 3 | 1 | 0 | 0 |
| AMP‐CTX‐CAZ‐CHL‐CIP‐SMX‐TET‐TMP(1) | ||||||
| AMP‐CTX‐CAZ‐CIP‐GEN‐NAL‐SMX(1) | ||||||
| Poland | 173 | AMP‐CTX‐CAZ‐CIP‐NAL(1) | 6 | 3.5 | 6 | 3.5 |
| AMP‐CTX‐CAZ‐CIP‐NAL‐SMX‐TET(2) | ||||||
| AMP‐CTX‐CAZ‐CIP‐NAL‐SMX‐TET‐TGC‐TMP(1) | ||||||
| AMP‐CTX‐CAZ‐CIP‐NAL‐SMX‐TET‐TMP(1) | ||||||
| AMP‐CTX‐CAZ‐CIP‐NAL‐TET(1) | ||||||
| Portugal | 161 | AMP‐CTX‐CAZ‐CHL‐CIP‐COL‐GEN‐NAL‐SMX‐TET‐TMP(1) | 10 | 6.2 | 6 | 3.7 |
| AMP‐CTX‐CAZ‐CHL‐CIP‐COL‐NAL‐SMX‐TET‐TMP(1) | ||||||
| AMP‐CTX‐CAZ‐CHL‐CIP‐NAL‐SMX‐TET‐TMP(3) | ||||||
| AMP‐CTX‐CAZ‐CIP‐NAL(1) | ||||||
| AMP‐CTX‐CAZ‐CIP‐NAL‐SMX‐TET(1) | ||||||
| AMP‐CTX‐CAZ‐CIP‐SMX(1) | ||||||
| AMP‐CTX‐CAZ‐CIP‐SMX‐TET‐TMP(1) | ||||||
| AMP‐CTX‐CIP‐NAL‐TET(1) | ||||||
| AMP‐CTX‐CAZ‐CHL‐CIP‐GEN‐NAL‐SMX‐TET(2) | ||||||
| AMP‐CTX‐CAZ‐CHL‐CIP‐GEN‐NAL‐SMX‐TET‐TMP(3) | ||||||
| Romania | 840 | AMP‐CTX‐CAZ‐CHL‐CIP‐NAL‐SMX‐TET‐TMP(1) | 24 | 2.9 | 14 | 1.7 |
| AMP‐CTX‐CAZ‐CIP(1) | ||||||
| AMP‐CTX‐CAZ‐CIP‐COL‐NAL‐SMX(1) | ||||||
| AMP‐CTX‐CAZ‐CIP‐GEN‐NAL‐SMX‐TET‐TMP(2) | ||||||
| AMP‐CTX‐CAZ‐CIP‐NAL(3) | ||||||
| AMP‐CTX‐CAZ‐CIP‐NAL‐SMX‐TET(1) | ||||||
| AMP‐CTX‐CAZ‐CIP‐NAL‐SMX‐TET‐TMP(2) | ||||||
| AMP‐CTX‐CAZ‐CIP‐NAL‐SMX‐TMP(2) | ||||||
| AMP‐CTX‐CAZ‐CIP‐NAL‐TET‐TMP(1) | ||||||
| AMP‐CTX‐CHL‐CIP‐COL‐NAL‐SMX‐TET‐TMP(1) | ||||||
| AMP‐CTX‐CHL‐CIP‐GEN‐NAL‐SMX‐TET‐TMP(1) | ||||||
| AMP‐CTX‐CIP‐GEN‐NAL‐SMX‐TET(1) | ||||||
| AMP‐CTX‐CIP‐GEN‐NAL‐SMX‐TET‐TMP(1) | ||||||
| AMP‐CTX‐CIP‐SMX‐TMP(1) | ||||||
| AMP‐CTX‐CAZ‐CIP‐GEN‐SMX(1) | ||||||
| AMP‐CTX‐CAZ‐CIP‐NAL(2) | ||||||
| Slovenia | 85 | AMP‐CTX‐CAZ‐CIP‐NAL‐SMX‐TET(1) | 5 | 5.9 | 3 | 3.5 |
| AMP‐CTX‐CAZ‐CIP‐NAL‐TET(1) | ||||||
| AMP‐CTX‐CAZ‐CHL‐CIP‐NAL‐SMX‐TET(1) | ||||||
| AMP‐CTX‐CAZ‐CIP‐GEN‐NAL(1) | ||||||
| Spain | 171 | AMP‐CTX‐CAZ‐CIP‐GEN‐NAL‐SMX(1) | 12 | 7 | 5 | 2.9 |
| AMP‐CTX‐CAZ‐CIP‐GEN‐NAL‐SMX‐TET(1) | ||||||
| AMP‐CTX‐CAZ‐CIP‐NAL(1) | ||||||
| AMP‐CTX‐CAZ‐CIP‐NAL‐SMX(1) | ||||||
| AMP‐CTX‐CAZ‐CIP‐NAL‐SMX‐TET(1) | ||||||
| AMP‐CTX‐CAZ‐CIP‐NAL‐TET(2) | ||||||
| AMP‐CTX‐CHL‐CIP‐GEN‐NAL‐SMX‐TET(1) | ||||||
| AMP‐CTX‐CIP‐NAL‐SMX‐TET‐TMP(1) | ||||||
| AMP‐CTX‐CIP‐NAL‐SMX‐TMP(1) | ||||||
| AMP‐CTX‐CAZ‐CIP‐NAL‐SMX(1) | ||||||
| AMP‐CTX‐CAZ‐CIP‐NAL‐SMX‐TET(1) | ||||||
| Total (21 MSs) | 4,005 | 159 | 4.0 | 61 | 1.5 | |
ECOFFs: epidemiological cut‐off values; MSs: Member States; N: number of isolates tested; GEN: gentamicin, CHL: chloramphenicol; AMP: ampicillin; CTX: cefotaxime; CAZ: Ceftazidime; TGC: tigecycline; NAL: nalidixic acid; CIP: ciprofloxacin; COL: colistin; SMX: sulfamethoxazole; TMP: trimethoprim; TET: tetracycline; CBP: clinical breakpoint; n: number of resistant isolates.
The occurrence of combined resistance to cefotaxime and ciprofloxacin (using ECOFFs) in indicator E. coli from broilers varied however between countries, as shown in Figure 87. Overall, combined resistance was uncommon in Nordic and central European countries and more common in southern and eastern countries. Notably, occurrence was much higher in Lithuania (50%) than in the other reporting countries.
Figure 87.
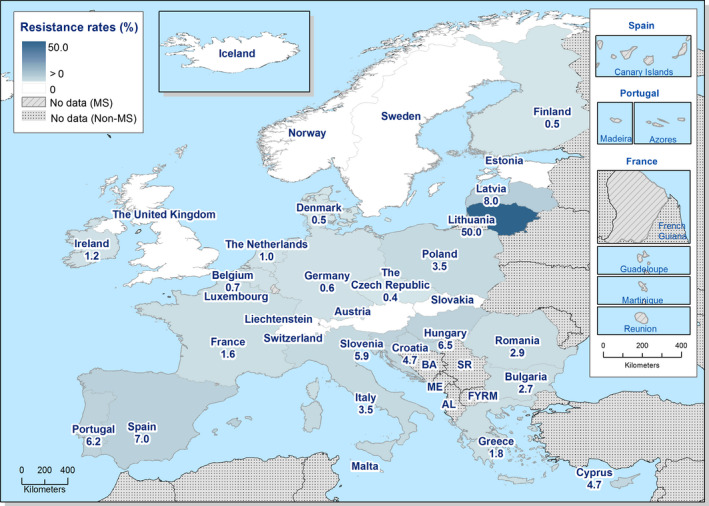
Spatial distribution of combined resistance to cefotaxime and ciprofloxacin in indicator Escherichia coli from broilers, using harmonised ECOFFs, 30 EU/EEA Member States, in 2016
Temporal trends in resistance in indicator E. coli from broilers
Temporal trends in resistance in indicator E. coli from broilers from 11 EU MSs and 2 non‐MSs over the period 2008–2016 are displayed in Figure 88. Due to the lack of longitudinal data, evaluation of temporal trends in resistance cannot yet be made for all countries participating in the mandatory monitoring.
Figure 88.
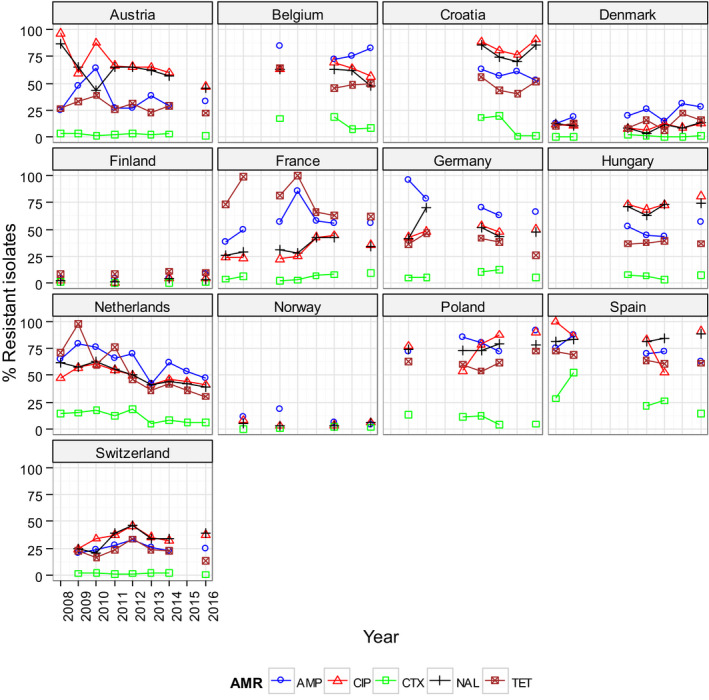
Trends in ampicillin (AMP), cefotaxime (CTX), ciprofloxacin (CIP), nalidixic acid (NAL) and tetracyclines (TET) resistance in indicator commensal Escherichia coli from broilers in reporting countries, 2008–2016
-
Statistical significance of trends over 4‐5 or more years was tested by a logistic regression model (p ≤ 0.05). Statistically significant increasing trends were observed for ampicillin in Belgium, Denmark, France and Poland, for ciprofloxacin in Finland, France, Hungary, Poland and Switzerland, for cefotaxime in France, as well as for tetracycline in Poland.Statistically significant decreasing trends were observed for ampicillin in Austria, Germany, Hungary, the Netherlands, Norway and Spain, for ciprofloxacin in Austria, Croatia, the Netherlands, Norway and Spain, for cefotaxime in Belgium, Croatia, Germany, the Netherlands, Poland and Spain, for nalidixic acid in Belgium and the Netherlands, as well as for tetracycline in Austria, Belgium, Croatia, France, Germany, the Netherlands, Spain and Switzerland.
Thirteen countries have provided data over the period 2008–2016 and, for these countries, trends in resistance to ampicillin, ciprofloxacin, cefotaxime and tetracycline were statistically assessed. The analyses show that resistance to ampicillin has decreased significantly in six countries and increased in four countries. Likewise, resistance to ciprofloxacin has decreased in five countries and increased in four countries. For cefotaxime resistance, occurrence has decreased in eight countries and increased in one country and the same trend applies for tetracycline resistance. Overall, in the 13 countries, there are 27 decreasing and 10 increasing trends over the period 2008–2016. Notably, in the Netherlands and Spain, resistance has decreased significantly for all the antimicrobials mentioned above and in Austria, Germany and Belgium resistance has decreased for three of the substances.
Although longitudinal trends can be evaluated as above for only a subset of the reporting countries, comparison of data on broilers and fattening turkeys reported in 2014 and 2016 can, however, be made because these data were collected according to Decision 2013/652/EC. At the EU level, the occurrence of resistance in E. coli from broilers in 2016 is similar, or lower by up to 5%, when compared with data on 2014 for all antimicrobials except colistin, for which occurrence was 0.9% in 2014 and 1.9% in 2016. In individual MSs, there are however deviations from the overall pattern of similar or slightly lower resistance levels observed at the EU level.
Resistance to tigecycline.
1.
In 2016, phenotypic resistance to tigecycline in E. coli was reported by three MSs (Cyprus, France, Poland) and one non‐MSs (Norway) in isolates from broilers and by one MS (Germany) in isolates from fattening turkeys. Tigecycline resistance was not reported in isolates from meat of broilers. In 2016, altogether, 0.2% of the E. coli isolates from broilers (11/5,194) and fattening turkeys (2/1,870) had an MIC > 1 mg/L. Of these 13 isolates, 10 isolates exhibited an MIC of 2 mg/L, whereas 3 isolates from broilers in Cyprus showed an MIC of 4 mg/L (Figure 89), above the clinical breakpoint (> 2 mg/L).
Figure 89.
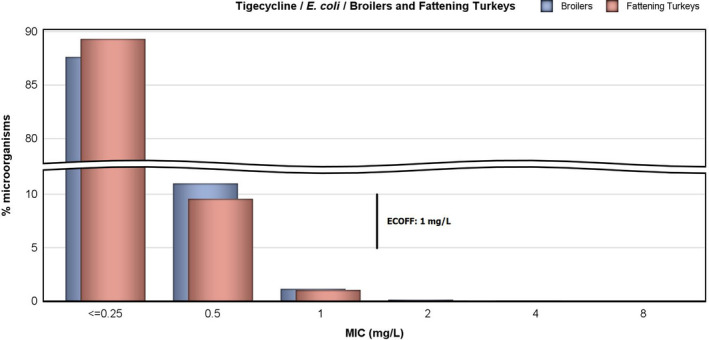
Distribution of MICs of tigecycline in indicator Escherichia coli from broilers (5,013 isolates from 29 EU Member States) and fattening turkeys (1,714 isolates from 11 EU Member States), 2016
The ECOFF for tigecycline in E. coli, separating wild type and non‐wild type isolates, was ≤1 mg/L when the Commission Implementing Decision 2013/652/EU was published. This ECOFF was used for interpretation of the data in this report. However, after the Decision was published, the ECOFF for tigecycline has been revised by EUCAST and the current ECOFF is ≤ 0.5 mg/L.
Susceptibility testing of tigecycline is not straightforward because the method can be affected by oxidation of the test reagents. Several mechanisms of resistance to tigecycline in Enterobacteriaceae have been described and these include increased activity of efflux pumps (AcrAB), mutation of the ribosomal protein S10 and change in the Mla system involved in phospholipid transport in cell membranes (He et al., 2016). The mechanisms of development of microbiological resistance, which may involve upregulation of normal cell pathways or processes presumably contribute to the occurrence of a ‘tail’ of isolates on the MIC distribution, with values just above the ECOFF among isolates from broilers and fattening turkeys (Figure 89).
Figure 89.
Distribution of MICs of tigecycline in indicator Escherichia coli from broilers (5,013 isolates from 29 EU Member States) and fattening turkeys (1,714 isolates from 11 EU Member States), 2016
Multiple drug resistance in indicator E. coli from broilers
Multidrug resistance in E. coli from broilers was reported by all 27 EU MSs and 3 non‐MSs providing data on 2016 but there were marked differences between countries (Figure 90). Considering the design of the test panel used in the harmonised monitoring, the maximum multiple resistance count possible is 11 substances but the highest count reported for an isolate was 9.
Figure 90.
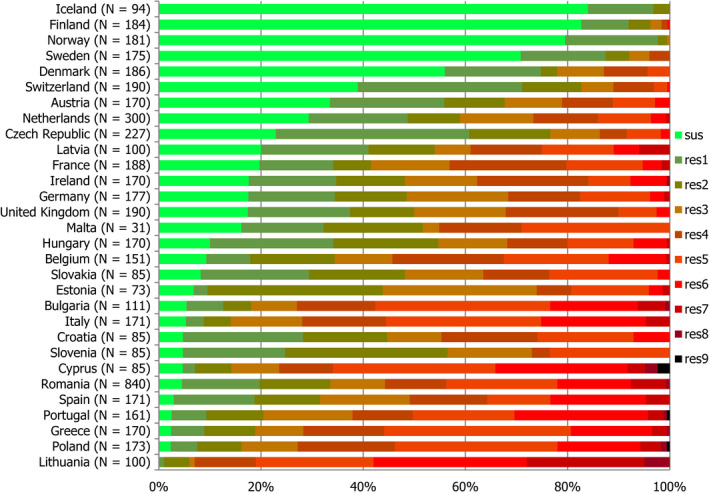
Frequency distribution of Escherichia coli isolates completely susceptible and resistant to 1–11 antimicrobials in broilers, 30 EU/EEA Member States, 2016
- N: total number of isolates tested for susceptibility against the whole harmonised set of antimicrobials for Escherichia coli; sus: susceptible to all antimicrobial classes of the harmonised set for E. coli; res1–res9: resistance to 1 up to 11 antimicrobial classes of the harmonised set for E. coli.
All countries, except Finland, Iceland, Norway and Sweden, reported isolates resistant to five or more substances (Figure 90). Seventeen countries reported isolates resistant to seven or more substances and eight countries isolates resistant to eight or more substances. Isolates with multiple resistance counts of seven or more and eight or more comprised 3.1% (162/5,194) and 0.5% (20/5,194) of the total number of isolates, respectively. Notably, four isolates from Cyprus, Poland and France were resistant to nine substances.
Multidrug‐resistant isolates (MDR) (i.e. resistant to three or more antimicrobial classes) were reported from all countries, except from Iceland, where none of the reported isolates was resistant to more than two antimicrobials. Among the countries reporting MDR isolates, the proportions varied markedly, being the highest in Lithuania (94.0%) and the lowest in Norway (0.6%) (Table COMESCHEBR).
Spatial distribution of complete susceptibility among Escherichia coli from broilers
Another way of addressing the occurrence of resistance, in particular accounting for the phenomenon of combined resistance, is to consider the proportion of isolates exhibiting a complete susceptibility to all the 14 antimicrobials tested in the harmonised panel. In 2016, all countries, except Lithuania, detected completely susceptible indicator E. coli isolates from broilers and, overall, 22.2% (1,155/5,194) of the isolates from broilers reported were completely susceptible. There were, however, large differences between EU/EEA Member States and the proportion of completely susceptible isolates ranged from 0% in Lithuania to 84% in Iceland (Figure 91).
Figure 91.
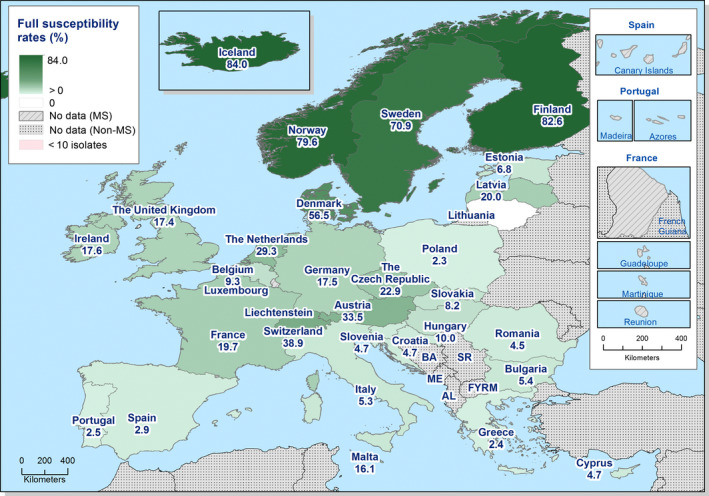
Spatial distribution of complete susceptibility to the panel of antimicrobials tested among indicator Escherichia coli from broilers, using harmonised ECOFFs, 30 EU/EEA Member States, 2016
Notably, in the Nordic countries, more than half of the isolates were completely susceptible, whereas in many countries of southern and eastern Europe less than 10% of the isolates were completely susceptible. In countries in central and western Europe, the proportion of completely susceptible isolates tended to range in between these figures.
Multidrug resistance patterns in indicator E. coli isolates from broilers
Of the 5,194 isolates of E. coli reported from broilers, 77.8% (4,039/5,194) were resistant to any of the 14 antimicrobials tested and 50.2% (2,608/5,194) were multidrug resistant (MDR). Among the MDR isolates there was a multitude of different resistance patterns often including quinolones, ampicillin, sulfamethoxazole, tetracycline and trimethoprim. Of the MDR isolates, 39.6% (1,032/2,608) were co‐resistant to all these five antimicrobials and often also to other substances. Notably, a majority of the MDR isolates, 82.1% (2,140/2,608), was resistant to quinolones but a minority, 7.0% (182/2,608), was resistant to third‐generation cephalosporins.
Using ECOFFs as interpretative criteria, most quinolone‐resistant isolates were resistant to both ciprofloxacin and nalidixic acid and, likewise, isolates resistant to third‐generation cephalosporins were usually resistant to both cefotaxime and ceftazidime.
Overall, 3.1% (159/5,194) of the E. coli isolates from broilers were resistant to both ciprofloxacin and third‐generation cephalosporins and all these were MDR, comprising 6.1% (159/2,608) of the MDR isolates from broilers in 2016. Among these there was a multitude of co‐resistance patterns and all isolates were co‐resistant to ampicillin, with the majority, 81.8% (130/159), also resistant to sulfamethoxazole (Table 47). Co‐resistance to ampicillin, sulfamethoxazole, tetracycline and trimethoprim was present in 45.3% (72/159) of the isolates. Seven isolates (5.0%) were co‐resistant to colistin.
5.1.2. Antimicrobial resistance in indicator Escherichia coli from fattening turkeys and meat from turkeys
Representative monitoring
For 2016, 11 EU MSs and 1 non‐MS reported susceptibility data on indicator E. coli isolates from caecal content of fattening turkeys (Table 48). Three MSs, Germany, Italy and the Netherlands, also provided data on E. coli isolates from turkey meat on a voluntary basis (Table 49). Data were obtained according to the requirements laid down in Commission Implementing Decision 2013/652/EC, and ‘microbiological’ resistance to the harmonised set of substances (as opposed to ‘clinical’ resistance) was interpreted using ECOFFs laid down in the Decision.
Table 48.
Occurrence of resistance (%) to selected antimicrobials in indicator Escherichia coli from fattening turkeys, using harmonised ECOFFs, 12 EU/EEA MSs, 2016
| Country | N | GEN | CHL | AMP | CTX | CAZ | MEM | TGC | NAL | CIP | AZM | COL | SMX | TMP | TET |
|---|---|---|---|---|---|---|---|---|---|---|---|---|---|---|---|
| Austria | 154 | 4.5 | 8.4 | 31.8 | 0.6 | 0.6 | 0 | 0 | 16.9 | 22.7 | 0 | 0 | 18.2 | 11 | 40.9 |
| France | 182 | 1.1 | 13.2 | 67 | 0.5 | 0.5 | 0 | 0 | 21.4 | 24.7 | 2.2 | 2.7 | 45.1 | 41.8 | 67.6 |
| Germany | 188 | 6.4 | 16 | 63.3 | 2.1 | 1.6 | 0 | 0.5 | 22.3 | 32.4 | 2.1 | 9 | 30.3 | 22.3 | 43.1 |
| Hungary | 170 | 2.9 | 18.2 | 50.6 | 1.2 | 1.2 | 0 | 0 | 48.2 | 67.1 | 3.5 | 0 | 30.6 | 24.1 | 64.1 |
| Italy | 170 | 8.8 | 33.5 | 85.9 | 2.9 | 1.8 | 0 | 0 | 50 | 61.2 | 7.1 | 14.7 | 75.3 | 71.8 | 83.5 |
| Poland | 171 | 7.6 | 20.5 | 77.8 | 0.6 | 0.6 | 0 | 0 | 50.3 | 70.8 | 0.6 | 4.7 | 47.4 | 39.8 | 67.8 |
| Portugal | 171 | 15.2 | 55.6 | 84.8 | 2.9 | 2.9 | 0 | 0 | 77.8 | 83 | 4.7 | 25.1 | 74.9 | 56.1 | 88.3 |
| Romania | 30 | 20 | 76.7 | 83.3 | 0 | 0 | 0 | 0 | 50 | 76.7 | 6.7 | 6.7 | 70 | 40 | 73.3 |
| Spain | 169 | 8.9 | 35.5 | 82.8 | 16 | 16 | 0 | 0 | 56.8 | 66.3 | 3 | 3 | 55.6 | 35.5 | 82.2 |
| Sweden | 85 | 0 | 0 | 8.2 | 0 | 0 | 0 | 0 | 1.2 | 1.2 | 0 | 0 | 5.9 | 3.5 | 16.5 |
| United Kingdom | 224 | 2.2 | 7.6 | 60.7 | 0.4 | 0.4 | 0 | 0 | 14.3 | 15.6 | 0.9 | 0 | 25.4 | 22.8 | 67 |
| Total (11 MSs) | 1,714 | 6.2 | 22.5 | 64.6 | 2.7 | 2.6 | 0 | 0.1 | 37.2 | 46.3 | 2.6 | 6.1 | 42.8 | 34.3 | 64.8 |
| Norway | 156 | 1.3 | 0.6 | 12.8 | 0 | 0 | 0 | 0.6 | 0.6 | 1.3 | 0 | 0.6 | 10.9 | 3.2 | 8.3 |
ECOFFs: epidemiological cut‐off values; MSs: Member States; N: number of isolates tested; GEN: gentamicin; CHL: chloramphenicol; AMP: ampicillin; CTX: cefotaxime; CAZ: Ceftazidime; MEM: meropenem; TGC: tigecycline; NAL: nalidixic acid; CIP: ciprofloxacin; AZM: azithromycin; COL: colistin; SMX: sulfamethoxazole; TMP: trimethoprim; TET: tetracycline.
Table 49.
Occurrence of resistance (%) to selected antimicrobials in indicator Escherichia coli from meat from turkeys, using harmonised ECOFFs, 3 EU MSs, 2016
| Country | N | GEN | CHL | AMP | CTX | CAZ | MEM | TGC |
|---|---|---|---|---|---|---|---|---|
| Germany | 171 | 12.9 | 16.4 | 64.3 | 5.3 | 5.3 | 0 | 0 |
| Italy | 170 | 10.6 | 19.4 | 76.5 | 0.6 | 1.2 | 0 | 0 |
| Netherlands | 132 | 9.1 | 24.2 | 74.2 | 1.5 | 6.1 | 0 | 0 |
| Total (3 MSs) | 473 | 11 | 19.7 | 71.5 | 2.5 | 4 | 0 | 0 |
| Country | N | NAL | CIP | AZM | COL | SMX | TMP | TET |
|---|---|---|---|---|---|---|---|---|
| Germany | 171 | 27.5 | 38 | 5.8 | 9.9 | 44.4 | 31.6 | 57.3 |
| Italy | 170 | 43.5 | 55.9 | 5.9 | 11.8 | 60.6 | 60 | 65.9 |
| Netherlands | 132 | 28 | 42.4 | 4.5 | 8.3 | 46.2 | 28 | 55.3 |
| Total (3 MSs) | 473 | 33.4 | 45.7 | 5.5 | 10.1 | 50.7 | 40.8 | 59.8 |
ECOFFs: epidemiological cut‐off values; MSs: Member States; N: number of isolates tested; GEN: gentamicin; CHL: chloramphenicol; AMP: ampicillin; CTX: cefotaxime; CAZ: Ceftazidime; MEM: meropenem; TGC: tigecycline; NAL: nalidixic acid; CIP: ciprofloxacin; AZM: azithromycin; COL: colistin; SMX: sulfamethoxazole; TMP: trimethoprim; TET: tetracycline.
Resistance levels in indicator E. coli from fattening turkeys and meat from turkeys
Occurrence of resistance in indicator E. coli isolated from caecal content of fattening turkeys varied markedly between reporting countries (Table 48). Notably, in general, occurrence of resistance was lower in the two Nordic countries reporting data on fattening turkeys (Sweden and Norway). Tetracycline and ampicillin resistance were the most common traits and occurrence was overall very high in the MSs at 64.8% and 64.6%, respectively. There were, however, large differences between countries and the occurrence of resistance to both antimicrobials was very high or extremely high in eight countries but, in contrast, low or moderate in two countries. Resistance to quinolones (nalidixic acid and ciprofloxacin), sulfamethoxazole and trimethoprim was overall high in MSs, but again there was a marked variation between countries. Occurrence of resistance to these antimicrobials ranged from moderate to extremely high in nine countries but was very low to moderate in two countries.
Chloramphenicol resistance was, overall, moderate, 22.5%, in MSs; resistance to gentamicin was low, 6.2%. Again, there was a large variation between countries, and in two countries resistance to chloramphenicol was rare or very low but, in contrast, extremely high (76.7%) in Romania and very high (55.6%) in Portugal. Likewise, occurrence of gentamicin resistance ranged from rare to low in all countries except in Romania and Portugal, where occurrence was moderate.
Resistance to the third‐generation cephalosporins cefotaxime and ceftazidime was, overall, low in MSs at 2.7% and 2.6%, respectively. In Romania, Sweden and Norway this type of resistance was not detected and in other countries it was very low or low. An exception was Spain, where occurrence was moderate for both cefotaxime and ceftazidime (16.0%).
Azithromycin resistance was, overall, low 2.6%, in MSs and, in five countries, this type of resistance was not reported or reported in single isolates only. Italy, Romania and Portugal reported the highest occurrences, 7.1, 6.7 and 4.7%, respectively.
Colistin resistance was, overall, low in MSs, 6.1%. Five countries did not report any resistant isolates or reported single isolates only, but in Portugal and Italy colistin resistance was substantially higher, at 25.1 and 14.7%, respectively.
Meropenem resistance was not detected in any country and tigecycline resistance was detected in only one isolate from Germany and in one from Norway.
Resistance in E. coli isolated from the meat of fattening turkeys was reported on a voluntary basis from three MSs (Germany, Italy and the Netherlands) (Table 49). Generally, the occurrence of resistance to each single antimicrobial was of similar magnitude in the three MSs. Ampicillin was the most common trait with an overall extremely high occurrence (71.2%). Occurrence of tetracycline and sulfamethoxazole resistance was very high and resistance to quinolones (nalidixic acid and ciprofloxacin) and trimethoprim high. Resistance to gentamicin, chloramphenicol and colistin was moderate. Resistance to third‐generation cephalosporins (cefotaxime and ceftazidime) and azithromycin was overall low. Meropenem and tigecycline resistance was not detected in any of the three MSs.
A comparison of resistance in indicator E. coli from fattening turkeys and from turkey meat is limited to Germany and Italy as these MSs reported data on both turkeys and turkey meat for 2016. In these two MSs, occurrence of resistance to most antimicrobials was generally of the same magnitude in isolates from fattening turkeys and from turkey meat.
Spatial distribution of resistance in indicator E. coli isolates from fattening turkeys
For several antimicrobials, the occurrence of resistance in E. coli from fattening turkeys differed substantially between countries (Table 48). The spatial distributions of the levels of cefotaxime and ciprofloxacin resistance are shown in Figure 92.
Figure 92.
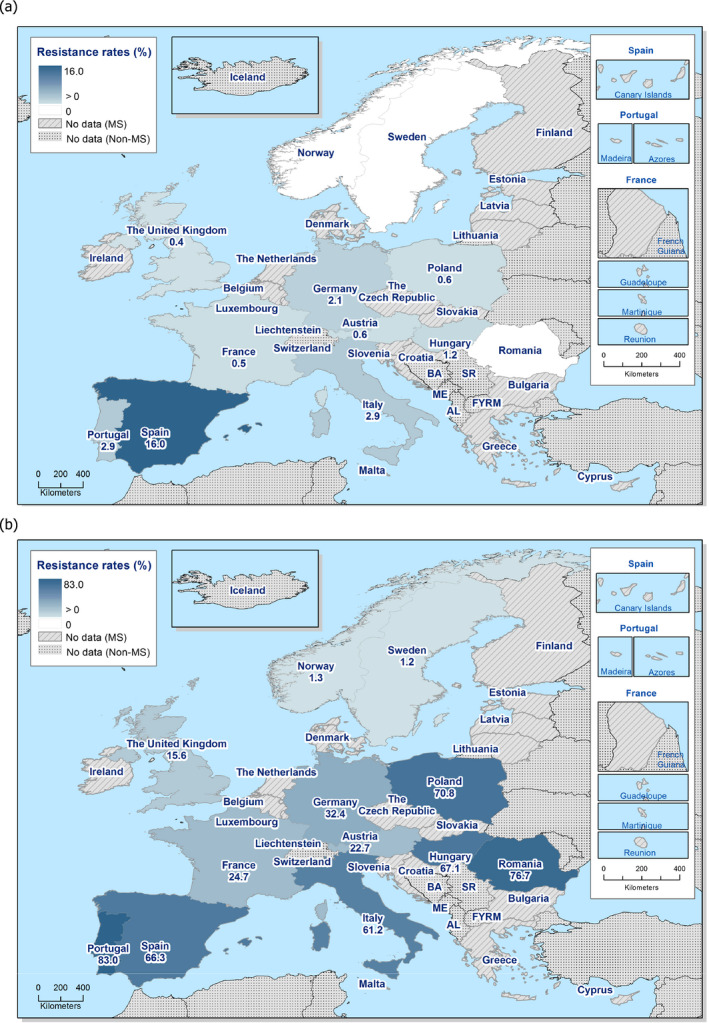
Spatial distribution of resistance to cefotaxime (a) and ciprofloxacin (b) in indicator Escherichia coli from fattening turkeys, 12 EU/EEA MSs, in 2016
Overall, in 2016, resistance to third‐generation cephalosporins (cefotaxime and ceftazidime) was low in MSs, 2.7% and 2.6%, respectively (Table 48) but marked differences were observed between countries, as illustrated for cefotaxime resistance in Figure 92a. Notably, Romania, Sweden and Norway reported no isolates resistant to cefotaxime, whereas the occurrence of resistance observed in Spain was moderate at 16.0%. Although there is no clear spatial pattern for the distribution of cefotaxime resistance among the 12 countries reporting data, occurrence tended to be higher in countries in the southern part of Europe.
In 2016, resistance to quinolones (nalidixic acid and ciprofloxacin) was one of the most common traits reported and occurrence was overall high in MSs, 37.2% and 46.3% for nalidixic acid and ciprofloxacin, respectively (Table 48). However, there were large variations between countries as illustrated for ciprofloxacin resistance in Figure 92b. Occurrence was lower in the Nordic countries and higher in countries in the southern and eastern parts of Europe.
Combined resistance to cefotaxime and ciprofloxacin in indicator E. coli from fattening turkeys
Resistance to critically important antimicrobials, and particularly isolates with combined resistance to third‐generation cephalosporins and fluoroquinolones, is of specific public health relevance in monitoring. In 2016, 2.2% (42/1,870) of indicator E. coli isolates from fattening turkeys and originating from 8 EU/EEA MSs, were resistant to both cefotaxime and ciprofloxacin, when MICs were interpreted using ECOFFs (Table 7). Of these isolates, 25 (1.3%; 25/1,870) and originating from 7 MSs, were also resistant to ciprofloxacin and cefotaxime when MICs were interpreted using clinical breakpoints (Table 50).
Table 50.
Combined resistance to fluoroquinolones and third‐generation cephalosporins in indicator Escherichia coli from fattening turkeys, EU MSs, 2016
| Country | N | Multiresistance patterns of isolates resistant to both CIP and CTX (number of isolates) | Resistant to CIP and CTX, applying ECOFFs | Resistant to CIP and CTX, applying CBPs | ||
|---|---|---|---|---|---|---|
| n | % | n | % | |||
| Austria | 154 | AMP‐CTX‐CAZ‐CIP‐GEN‐TET(1) | 1 | 0.6 | – | – |
| Germany | 188 | AMP‐CTX‐CAZ‐CIP‐GEN‐NAL‐SMX‐TET‐TMP(1) | 4 | 2.1 | 3 | 1.6 |
| AMP‐CTX‐CAZ‐CIP‐NAL(2) | ||||||
| AMP‐CTX‐CHL‐CIP‐NAL‐SMX‐TET‐TMP(1) | ||||||
| Hungary | 170 | AMP‐CTX‐CAZ‐CHL‐CIP‐NAL‐SMX‐TET‐TMP(2) | 2 | 1.2 | 1 | 0.6 |
| Italy | 170 | AMP‐CTX‐CAZ‐CHL‐CIP‐COL‐NAL‐SMX‐TET‐TMP(2) | 4 | 2.4 | 4 | 2.4 |
| AMP‐CTX‐CAZ‐CIP‐NAL‐TET(1) | ||||||
| AMP‐CTX‐CHL‐CIP‐NAL‐SMX‐TET‐TMP(1) | ||||||
| Poland | 171 | AMP‐CTX‐CAZ‐CHL‐CIP‐NAL‐SMX‐TET‐TMP(1) | 1 | 0.6 | 1 | 0.6 |
| Portugal | 171 | AMP‐CTX‐CAZ‐CHL‐CIP‐COL‐NAL‐SMX‐TET(2) | 5 | 2.9 | 4 | 2.3 |
| AMP‐CTX‐CAZ‐CHL‐CIP‐NAL‐SMX‐TET(1) | ||||||
| AMP‐CTX‐CAZ‐CHL‐CIP‐NAL‐SMX‐TET‐TMP(2) | ||||||
| Spain | 169 | AMP‐CTX‐CAZ‐CHL‐CIP‐COL‐SMX‐TET(1) | 24 | 14.2 | 11 | 6.5 |
| AMP‐CTX‐CAZ‐CHL‐CIP‐GEN‐NAL‐SMX‐TMP(1) | ||||||
| AMP‐CTX‐CAZ‐CHL‐CIP‐NAL‐SMX‐TET(7) | ||||||
| AMP‐CTX‐CAZ‐CHL‐CIP‐NAL‐SMX‐TET‐TMP(2) | ||||||
| AMP‐CTX‐CAZ‐CHL‐CIP‐NAL‐SMX‐TMP(1) | ||||||
| AMP‐CTX‐CAZ‐CHL‐CIP‐SMX‐TET(5) | ||||||
| AMP‐CTX‐CAZ‐CIP(1) | ||||||
| AMP‐CTX‐CAZ‐CIP‐COL‐NAL‐TET(1) | ||||||
| AMP‐CTX‐CAZ‐CIP‐NAL‐SMX‐TET‐TMP(2) | ||||||
| AMP‐CTX‐CAZ‐CIP‐NAL‐TET(1) | ||||||
| AMP‐CTX‐CAZ‐CIP‐TET(2) | ||||||
| UK | 224 | AMP‐CTX‐CAZ‐CHL‐CIP‐GEN‐NAL‐SMX‐TET‐TMP(1) | 1 | 0.4 | 1 | 0.4 |
| Total (8 MSs) | 1,417 | 42 | 3 | 25 | 1.8 | |
ECOFFs: epidemiological cut‐off values; MSs: Member States; N: number of isolates tested; GEN: gentamicin; CHL: chloramphenicol; AMP: ampicillin; CTX: cefotaxime; CAZ: Ceftazidime; NAL: nalidixic acid; CIP: ciprofloxacin; COL: colistin; SMX: sulfamethoxazole; TMP: trimethoprim; TET: tetracycline; n: number of resistant isolates.
Occurrence of combined resistance to cefotaxime and ciprofloxacin (using ECOFFs) in E. coli from fattening turkeys varied between countries, as shown in Figure 93. There was, however, no clear spatial pattern for the distribution but, notably, occurrence was much higher in Spain (14.2%) than in the other reporting countries.
Figure 93.
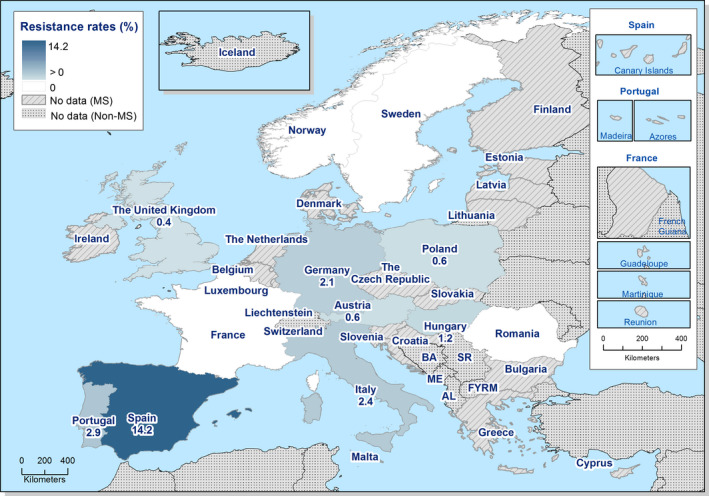
Spatial distribution of combined resistance to cefotaxime and ciprofloxacin in indicator Escherichia coli from fattening turkeys, 12 EU/EEA Member States, in 2016
Changes in resistance in indicator E. coli from fattening turkeys
Temporal trends in ampicillin, cefotaxime, ciprofloxacin, nalidixic acid and tetracycline resistance in indicator commensal E. coli from fattening turkeys in Germany and Poland were assessed over the period 2008–2016. Statistically significance of trends over 4‐5 or more years was tested by a logistic regression model (p ≤ 0.05). Statistically significant increasing trends were observed for ciprofloxacin in Germany and Poland, as well as for tetracycline in Poland. Statistically significant decreasing trends were observed for cefotaxime in Poland, as well as for ampicillin, nalidixic acid and tetracycline in Germany.
In addition, the comparison of resistance in indicator E. coli from fattening turkeys observed in 2014 and 2016 was made for the MSs having reported data on both years according to the Commission Implementing Decision 2013/652/EC (Figure 94). Resistance to ampicillin in Austria, Hungary and Sweden, to tetracycline in Germany and the United Kingdom, to ciprofloxacin in Spain and to nalidixic acid in Germany, Romania and Spain, assessed in 2016, was statistically lower than that assessed in 2014 in the same MSs. At the overall level (11 MSs), the occurrences of resistance to ampicillin, tetracycline, ciprofloxacin and nalidixic acid were statistically lower in 2016 than in 2014.
Figure 94.
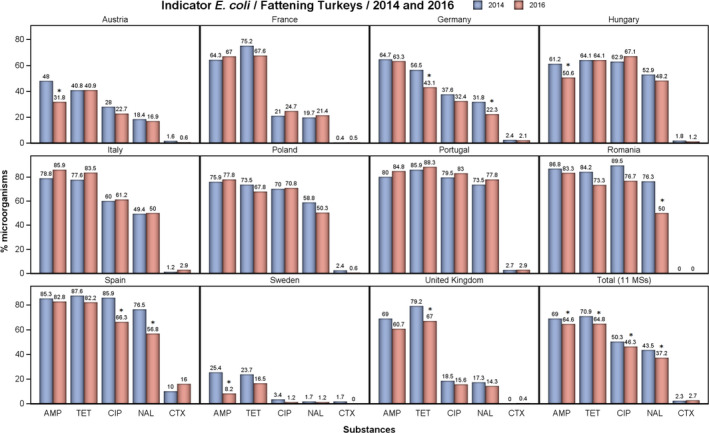
Occurrence of resistance to ampicillin (AMP), tetracycline (TET), ciprofloxacin (CIP), nalidixic acid (NAL) and cefotaxime (CTX) in indicator E. coli from fattening turkeys, in reporting MSs, 2014 and 2016
- Asterisks indicate statistically significant changes in occurrence of resistance between 2014 and 2016.
Multiple drug resistance in indicator E. coli from fattening turkeys
Multiple drug resistance in indicator E. coli from fattening turkeys was reported by all 12 countries reporting data but with marked differences between countries (Figure 95). Considering the design of the test panel used in the harmonised monitoring, the maximum multiple resistance count possible is 11 substances, but the highest count reported for an isolate was 8. All countries, except Sweden and Norway, reported isolates that were resistant to five or more substances (Figure 95). Eight countries reported isolates resistant to seven or more substances and three countries reported isolates resistant to eight substances. Isolates with multiple resistance counts of seven or more and eight, comprised 4.2% (79/1,870) and 0.5% (9/1,870) of the total number of isolates reported, respectively.
Figure 95.
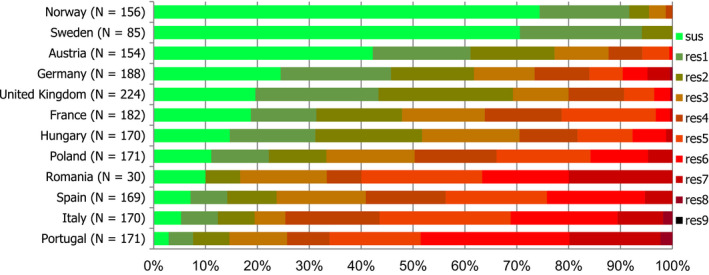
Frequency distribution of Escherichia coli isolates completely susceptible and resistant to 1–11 antimicrobials in fattening turkeys, 12 EU/EEA Member States, 2016
- N: total number of isolates tested for susceptibility against the whole harmonised set of antimicrobials for Escherichia coli; sus: susceptible to all antimicrobial classes of the harmonised set for Escherichia coli; res1–res9: resistance to one up to 11 antimicrobial classes of the harmonised set for Escherichia coli.
MDR isolates (i.e. resistant to three or more antimicrobial classes) were reported from all countries except from Sweden, where no isolate was resistant to more than two antimicrobials. Among the countries reporting MDR isolates, the proportions varied markedly, being extremely high in Italy, Portugal, Romania and Spain (76.3–85.4%) and low in Norway (4.5%) (Table COMESCHETK).
Spatial distribution of complete susceptibility among E. coli from fattening turkeys
Another way of addressing the occurrence of resistance, in particular accounting for the phenomenon of combined resistance, is to consider the proportion of isolates exhibiting susceptibility to all the 14 antimicrobials tested in the harmonised panel. In 2016, all countries, except Lithuania, reported completely susceptible indicator E. coli from fattening turkeys and, overall, 23.4% (438/1,870) of the isolates reported were categorised as completely susceptible. There were, however, large differences between reporting EU/EEA MSs and the proportion of completely susceptible isolates ranged between 2.9% in Portugal and 74.4% in Iceland (Figure 96). In the Nordic countries more than 70% of the isolates tested were categorised as completely susceptible, whereas in some countries of southern and eastern Europe, less than 15% of the isolates tested were completely susceptible. In countries of central and western Europe, the proportion of completely susceptible isolates tended to range between these figures.
Figure 96.
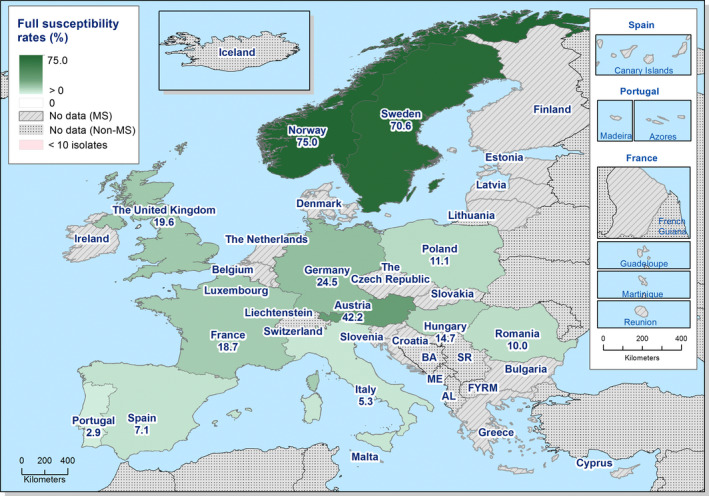
Spatial distribution of complete susceptibility to the panel of antimicrobials tested among indicator Escherichia coli from fattening turkeys, using harmonised ECOFFs, 12 EU/EEA Member States, 2016
Multidrug resistance patterns in indicator E. coli isolates from fattening turkeys
Of the 1,870 isolates of E. coli from fattening turkeys reported, 76.7% (1,432) were resistant to one or more of the 14 antimicrobials tested and 48.7% (911) were MDR. Among the MDR isolates, the core resistance pattern included quinolones, ampicillin, sulfamethoxazole, tetracycline and trimethoprim. Of the MDR isolates, 35.8% (326) were co‐resistant to all these five antimicrobials and often also to additional substances. Notably, a majority of the MDR isolates, 94.3% (859), was resistant to ampicillin and 74.0% (237) to quinolones. In contrast, a minority, 5.0% (46), was resistant to third‐generation cephalosporins.
Using ECOFFs as interpretative criteria, most quinolone‐resistant isolates were resistant to both ciprofloxacin and nalidixic acid and, likewise, isolates resistant to third‐generation cephalosporins were usually resistant to both cefotaxime and ceftazidime.
Overall, 2.2% (42/1,870) of the E coli isolates from fattening turkeys were resistant to both ciprofloxacin and third‐generation cephalosporins; all these were MDR, comprising 4.6% (42/911) of the MDR isolates from broilers in 2016. Among these isolates there was a multitude of co‐resistance patterns and all isolates were co‐resistant to ampicillin; the majority, 78.6% (33/42), were also resistant to sulfamethoxazole (Table 50). Co‐resistance to ampicillin, sulfamethoxazole, tetracycline and trimethoprim was present in 35.7% (15/42) of the isolates. Notably, six isolates (14.3%) were also resistant to colistin.
5.2. Resistance to colistin in indicator E. coli from poultry
Colistin resistance in bacteria from animals has attracted increasing interest in recent years due to problems with multidrug‐resistant Gram‐negative bacteria in human health care and, as a consequence, an increasing need to use colistin as a last resort therapeutic alternative for infections caused by multidrug‐resistant bacteria. Moreover, in 2015 transferable colistin resistance, conferred by the mcr‐1 gene, was reported for the first time in E. coli from animals and humans in China (Liu et al., 2015). Such genes, and variants, were subsequently found in bacteria from animals and humans around the world including Europe (Kempf et al., 2016; Schwarz and Johnson, 2016). The presence of transmissible genetic elements conferring colistin resistance likely increases the potential for spread of such resistance which fuelled the interest in colistin resistance.
In the light of this, the European Commission requested the European Medicines Agency (EMA) to update the previous advice on the impact of, and need for, colistin use for human and animal health (EMA, 2013). In the updated advice, EMA concludes that findings of the mcr‐1 gene in similar plasmids in the same bacteria species from food‐producing animals, food, humans, and environment indicate a possible transmission between these compartments (EMA, 2016). EMA further concludes that transmission from animals to humans is likely to have taken place in Europe but at low frequency. As a risk mitigation strategy EMA recommends that the use of colistin in animals should be reduced in the EU and that the monitoring of colistin resistance, and specifically transmissible resistance genes, in bacteria from food‐producing animals should be enhanced.
Since 2014, colistin has been included in the mandatory monitoring in EU performed under Decision 2013/652/EU. In 2016, the occurrence of phenotypic colistin resistance in E. coli from broilers was overall low (1.9%) in MSs, and reported by only eight MSs and one non‐MS (Switzerland) at an occurrence ranging from 0.5% to 9.4%. Likewise, colistin resistance in isolates from fattening turkeys was overall low in MSs, 6.1%, and reported by seven MSs and one non‐MS (Norway). In four MSs (Germany, Portugal, Italy and Romania), the occurrence of colistin resistance in fattening turkeys was markedly higher than in other reporting countries, ranging from 6.7% to 25.1%. Compared to data from 2014, occurrence of colistin resistance in broilers at EU level was slightly higher in 2016 (1.9 vs 0.9%), and slightly lower in fattening turkeys (6.1 vs 7.4%).
Considering all reporting countries, 90 of 5,194 isolates from broilers and 106 of 1,879 isolates from fattening turkeys exhibited MIC values above the ECOFF (> 2 mg/L) for microbiological resistance to colistin. Of the 90 E. coli isolates from broilers, 68 had MIC 4 mg/L, 7 isolates MIC 8 mg/L, 1 isolate MIC 16 mg/L and 14 isolates MICs > 16 mg/L (Figure 12). Likewise, most isolates from fattening turkeys, 88, had MIC 4 mg/L, 17 isolates MIC 8 mg/L and 1 isolate MIC 16 mg/L (Figure 13). Phenotypic resistance to colistin in E. coli from broiler meat was detected in all three reporting MSs (Germany, Italy and the Netherlands), at levels similar to those observed in isolates from broilers. Similarly, colistin‐resistant E. coli from turkey meat was detected by the three MSs (Germany, Italy and the Netherlands) reporting on turkey meat. In Germany and Italy, colistin resistance was similar in isolates from turkeys and meat derived thereof. The Netherlands did not provide data on turkeys.
The mandatory monitoring according to Decision 2013/652/EU is based on phenotypic susceptibility and does not discriminate between different resistance mechanisms. Therefore, inference regarding the presence of e.g. mcr‐genes cannot be made from the available data. For such evaluation, isolates must be further investigated by molecular methods which currently are out of the scope of the mandatory monitoring. However, in a recent study from France, all 22 isolates of E. coli from pigs, turkeys and broilers collected within the framework of the mandatory monitoring in years 2011–2014, and with colistin MIC > 2 mg/L, were found to harbour the mcr‐1 gene (Perrin‐Guyomard et al., 2016). This indicates that a substantial proportion of the phenotypically resistant isolates reported by other countries participating in the mandatory monitoring also harbour mcr‐genes.
Although the overall occurrence of colistin resistance in food‐producing animals at the EU level is low, knowledge of the proportion of resistant isolates that harbour transmissible genes conferring colistin resistance is urgently needed for the assessment of the potential impact on human health care.
Figure 97.
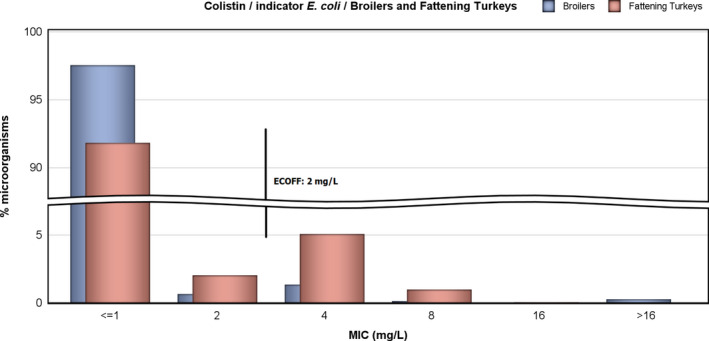
Distribution of MICs of colistin in indicator E. coli from broilers (5,013 isolates from 29 EU Member States) and fattening turkeys (1,714 isolates from 11 EU Member States), 2016
5.3. Discussion
Studying phenotypic antimicrobial resistance of commensal ‘indicator’ E. coli from healthy food‐producing animals and their food provides information on the reservoirs of resistant bacteria that could potentially be transferred between animals and between animals and humans. It also provides indirect information on the reservoirs in animals and food of resistance genes that could be transferred to bacteria that are pathogenic for humans and/or animals. Monitoring, therefore, has relevance to both public and animal health. The occurrence of resistance to antimicrobials in indicator E. coli is likely to depend on a number of factors including: the selective pressure exerted by the use of antimicrobials in various food‐producing animal populations; clonal spreading of resistant organisms; dissemination of particular genetic elements, such as resistance plasmids; and the effects of co‐selection of bacteria exhibiting multiple resistance.
Indicator E. coli are cultured from healthy, representative populations of food‐producing animals using non‐selective culture media (containing no antimicrobials) and, therefore, the most common clones of E. coli occurring in those animals are expected to be those most represented in the data collected. When isolates from non‐selective culture plates are selected at random, occasionally the minor components of the E. coli flora may be sampled.
5.3.1.
Representative monitoring
This was the third year that data on resistance in E. coli from food‐producing animals were reported according to the harmonised methodology for the mandatory AMR monitoring laid down in Commission Implementing Decision 2013/652/EC. This means that the data provided are harmonised with respect to sampling, laboratory methodology, reporting and interpretation. The first year in which data on broilers, fattening turkeys, and their meat products were reported according to the Decision was 2014 and the data collected in previous years may have been biased by differences in methodology, for example by the specific animal population of a certain species that was sampled. This choice could influence temporal trends in resistance observed in individual MSs, and also the overall interpretation on an EU level when comparisons are made to data before 2014.
In 2016, 27 EU MSs and 3 non‐MSs provided data on broilers and 3 MSs also on broiler meat. The same 27 MSs and Norway also provided data on broilers in 2014. The data on the occurrence of antimicrobial resistance in E. coli from broilers could, therefore, be considered as representative and an evaluation of differences in levels of resistance between the years 2014 and 2016 valid. As only three MSs reported data on AMR in isolates from meat of broilers, the data cannot be considered as representative of the situation at the EU level.
Data on fattening turkeys was provided by 11 MSs and all these also provided data in 2014. In addition, one non‐MS (Norway) provided data on 2016. Among those MSs providing data are the main producers of fattening turkeys in the EU, and the data presented could therefore be considered as representative of the situation at the EU level; comparison between the years 2014 and 2016 is therefore valid. Only three MSs reported AMR data on isolates from meat of fattening turkeys and, therefore, the corresponding data cannot be considered as representative of the EU situation.
General observations
It can be observed that resistance to some antimicrobials was common in both isolates from broilers and fattening turkeys at the EU level. Notably, the occurrence of ampicillin resistance was overall very high (> 50%) in broilers and turkeys, as was resistance to quinolones (nalidixic acid and ciprofloxacin), tetracycline, sulfamethoxazole and trimethoprim, which ranged from high to very high in both animal species. These antimicrobials are commonly used in poultry production, and the levels of resistance observed could reflect the effect of usage. There were, however, spatial differences in the occurrence of resistance as, for most antimicrobials, resistance was lowest in Nordic countries and highest in countries in southern and eastern Europe.
The occurrence of resistance to single antimicrobials was typically of a similar magnitude in E. coli from broilers and fattening turkeys, and the difference was generally lower than 10% at the EU level, and also when considering only those countries reporting data on both animal species. There were, however, noticeable exceptions and, in all countries, quinolone resistance (nalidixic acid and ciprofloxacin) was more common in isolates from broilers than in isolates from fattening turkeys. At the level of the group of countries reporting on both broilers and turkeys, the difference was about 20% and 28.4% for ciprofloxacin and nalidixic acid, respectively. In contrast, in most countries, tetracycline resistance was more common in isolates from fattening turkeys than in isolates from broilers. For those countries reporting on both broilers and turkeys, the difference was 13.3%. There were also less uniform differences in resistance to other antimicrobials between broilers and turkeys. In individual countries, differences greater than 20% were observed for ampicillin, chloramphenicol, gentamicin, colistin, sulfamethoxazole and trimethoprim. These differences could reflect the antimicrobials used in production of broilers and turkeys in individual countries and indicate that there is a difference in practices between countries.
Comparison of occurrence of resistance in broilers and fattening turkeys to occurrence in pigs and calves < 1 year
In 2015, the same 27 MSs as those reporting data on E. coli from broilers and fattening turkeys in 2016, reported corresponding data on fattening pigs and most MSs also on calves > 1 year old. A comparison of data at the EU level shows that the occurrence of resistance to azithromycin, third‐generation cephalosporins, colistin and gentamicin was low (> 1–10%) in these four food‐producing animal species. Tigecycline resistance was found in occasional isolates only, and meropenem resistance in only one isolate from broilers but not in the other animal species. The occurrence of resistance to chloramphenicol was moderate (> 10–20%) or high (> 20–50%) and resistance to tetracycline, sulfamethoxazole and trimethoprim was high (> 20–50%) in all the animal species. In contrast, there are differences between the animal species in the occurrence of (fluoro)quinolone resistance (nalidixic acid and ciprofloxacin): it is about 10% in pigs and calves < 1 year old, but about 60% in broilers and about 40% in fattening turkeys. For ampicillin resistance, there is also a noticeable difference with a very high occurrence (> 50–70%) in broilers and turkeys and a high occurrence (< 20–50%) in pigs and calves < 1 year old. These differences in resistance in indicator E. coli from different animal species could reflect a difference in use of antimicrobials with respect to quantity, but perhaps also the mode of administration which may influence selection for resistance. In poultry, flock treatment is almost exclusively practised, whereas in pigs and calves both flock treatment and individual treatment is practised. When four food‐producing animal species were considered, spatial differences in occurrence of resistance were observed between MSs, with generally lower resistance in northern Europe compared with southern and eastern Europe.
Trends in resistance
Due to the lack of harmonised longitudinal data over a longer period, evaluation of trends at the EU level is difficult because data collected before 2014, when harmonised provisions according to Decision 2013/652/EC were implemented, may be biased by differences in methodology and sampling scheme. However, 13 countries have provided relevant data for broilers and two countries for turkeys over the period 2008–2016 and for these countries trends in resistance to ampicillin, ciprofloxacin, nalidixic acid, cefotaxime and tetracycline were statistically assessed by logistic regression.
Regarding broilers, the analysis shows that resistance to ampicillin has decreased significantly in six and increased in four countries. Likewise, resistance to ciprofloxacin has decreased in five and increased in four countries. For cefotaxime resistance, occurrence has decreased in eight and increased in one country and the same applies for tetracycline resistance. Overall, in the 13 countries there are 27 decreasing and 10 increasing trends over the period 2008–2016. Notably, in the Netherlands and Spain, resistance has decreased significantly for all the antimicrobials mentioned above, and in Austria, Germany and Belgium resistance has decreased for three of the substances. Regarding turkeys, increasing trends were observed for resistance to ciprofloxacin in both countries evaluated (Germany and Poland) and for resistance to tetracycline in Poland. Conversely, decreasing trends were observed for cefotaxime in Poland and for ampicillin, nalidixic acid and tetracycline in Germany.
Moreover, a comparison of resistance data for E. coli from turkeys shows that at the EU level resistance to ampicillin, tetracycline, ciprofloxacin and nalidixic acid is significantly lower in 2015 than in 2014. There are, however, deviations from these general observations in individual MSs.
Multiple resistance and multidrug resistance
Overall, about one‐fifth of the E. coli isolates from broilers and fattening turkeys reported in 2016 were susceptible to all 14 antimicrobials tested. Also, the occurrence of MDR isolates14 in broilers and fattening turkeys was similar at about 50%. There were, however, marked differences between countries with respect to the proportion of completely susceptible and MDR isolates for both broilers and fattening turkeys. Completely susceptible isolates were more common in northern Europe than in southern and eastern Europe. For multidrug resistance, the converse situation was observed, as MDR isolates were more common in countries of southern and eastern Europe than in Nordic countries. The overall occurrence of MDR isolates was higher in broilers and fattening turkeys than in pigs (38.1%) and calves < 1 year old (28.6%), considering the same‐reporting MSs group in 2015.
The antimicrobials most often represented in the pattern of MDR isolates in both broilers and fattening turkeys were quinolones, ampicillin, sulfamethoxazole, tetracyclines and trimethoprim. About 40% of the MDR isolates from both broilers and turkeys were resistant to all these five antimicrobials and often also to other substances tested. Ampicillin, sulfamethoxazole, tetracyclines and trimethoprim, but not quinolones, were also included in the core pattern of MDR isolates from pigs and calves < 1 year old reported in 2015. The common resistance to these antimicrobials in MDR profiles could be linked to the current and past usage of these substances in poultry production. Selection pressure for MDR isolates by this use is probably augmented by co‐selection due to the presence in poultry microbiota of genetic elements (plasmids), carrying resistance genes to several antimicrobials and transmissible between bacteria, but also by the presence of specific MDR clones that are clonally spread.
Resistance to critically important antimicrobials
Among the antimicrobials tested in the mandatory monitoring, ciprofloxacin (fluoroquinolones), cefotaxime and ceftazidime (third‐generation cephalosporins), meropenem (carbapenems), colistin (polymyxin E) and azithromycin (macrolides) have been categorised as critically important antimicrobials considered to be of the highest priority by the WHO (WHO, 2016). Resistance to these substances is of particular interest in monitoring food‐producing animals because of the potential risk of reservoirs of bacteria resistant to these antimicrobials that can be spread to humans along the food chain.
In 2016, the occurrence of phenotypic resistance to third‐generation cephalosporins (cefotaxime and ceftazidime) was overall low in both broilers and fattening turkeys at the EU level. In broilers, 4.0% and 3.6% of the isolates were resistant to cefotaxime and ceftazidime, respectively, and in fattening turkeys, the corresponding figures equalled 2.7% and 2.6%. The occurrences reported in poultry are slightly higher than those registered in pigs and calves < 1 year old, reported in 2015. In these animal populations, the occurrence of resistance to cefotaxime and ceftazidime was < 2% for both pigs and calves. Within mandatory monitoring, samples of intestinal content are also cultured on selective media to specifically detect the presence of E. coli resistant to third‐generation cephalosporins. The results of these analyses are presented in Section 7.2.
Resistance to carbapenems (meropenem) was detected in one E. coli isolate from broilers reported by Cyprus. Moreover, all isolates of indicator E. coli with phenotypic resistance to third‐generation cephalosporins were further investigated by testing a wider range of antimicrobials according to the provisions for mandatory monitoring. Among these, 10 isolates showed phenotypic resistance to carbapenems. All isolates showing phenotypic resistance to carbapenems should be subjected to further testing by molecular methods.
In MSs, resistance to quinolones (nalidixic acid and ciprofloxacin) was overall very high in broilers and high in turkeys but there were large differences between countries. The common occurrence of quinolone resistance in broilers and fattening turkeys contrasts with the situation in pigs and calves < 1 year old, in which occurrence in both animal species was, overall, low in the data provided by the MSs in 2015.
Mostly, quinolone‐resistant isolates showed resistance to both nalidixic acid and ciprofloxacin, indicating that resistance was mediated by chromosomal mutations and that spread is mainly by clonal dissemination of resistant clones. Overall the levels of resistance to ciprofloxacin were, however, slightly higher than resistance to nalidixic acid in both broilers and turkeys. The situation was similar in pigs and calves < 1 year old, reported in 2015. This finding indicates that, apart from mutational resistance, there is also, among E. coli from food‐producing animals in Europe, quinolone resistance mediated by transmissible genes that can spread between bacteria.
In 2016, 3.1% (159/5,794) of indicator E. coli isolates from broilers and 2.2% (42/1,870) from fattening turkeys were resistant to both ciprofloxacin and third‐generation cephalosporins when MICs were interpreted by ECOFFs. About half of these isolates also showed clinical resistance to ciprofloxacin and cefotaxime when evaluated by clinical breakpoints. Overall, 1.2% and 1.3% of the co‐resistant isolates from broilers and fattening turkeys showed clinical resistance, respectively. This percentage indicates a higher occurrence of co‐resistance to ciprofloxacin and cefotaxime (ECOFF) than in isolates from pigs (0.5%; 24/4,538) and calves < 1 year old (0.8%; 18/2,187) reported in 2015. Also, the occurrence of isolates showing clinical co‐resistance is lower in pigs (0.3%; 12/4,538) and calves < 1 year old (0.4%; 8/2,187) than in broilers and fattening turkeys. Notably, of the isolates co‐resistant to ciprofloxacin and ceftazidime, seven isolates from broilers and six isolates from fattening turkeys were also resistant to colistin.
Occurrence of resistance to azithromycin in E. coli from broilers and turkeys was overall low at 4% and 2.6%, respectively. This finding is about the same occurrence as reported for broilers (6.7%) and turkeys (3.2%) by the same MSs in 2014. Also, about the same occurrence was reported for pigs (2.8%) and calves < 1 year old (2.4%) in 2015. Notably, for broilers, 16 countries did not report azithromycin resistance in 2016, or single isolates only, but in 14 countries the occurrence ranged from 1.2% up to 16.5% (in Cyprus). Likewise, in fattening turkeys, five countries reported no azithromycin‐resistant isolates or single isolates only, whereas in seven countries occurrence ranged from 2.1% up to 7.1% (in Italy). Azithromycin is not used in animals in Europe and the cause of the rather high levels of resistance to this antimicrobial in both broilers and turkeys in some countries is not known. However, azithromycin is an azalide which is a subgroup of the macrolides. Possibly, selection pressure exerted by use of macrolides, e.g. tylosin, in food‐producing animals may have favoured emergence of azithromycin resistance.
In 2016, occurrence of colistin resistance was overall 1.7% in broilers and 5.7% in fattening turkeys. These figures are slightly higher than those reported for broilers (0.9%) in 2014 and slightly lower than those reported for fattening turkeys (7.4%). The overall occurrence is higher than in pigs (0.4%) and calves < 1 year old (0.9%) reported in 2015. There were large differences in occurrence of colistin resistance between countries and 21 of the 30 countries providing data on broilers did not report colistin resistance. Likewise, 4 of the 12 countries providing data on fattening turkeys did not report colistin resistance. In contrast, in the countries reporting colistin resistance, the occurrence ranged from 0.5% to 9.4% in broilers and from 0.6% to 25.1% in fattening turkeys. Occurrence of colistin resistance could be due to selection from use of colistin in poultry production. The uneven spatial distribution of colistin resistance and the high occurrence in some countries indicated that there are large differences in the usage of colistin in poultry production in Europe.
6. Meticillin‐resistant Staphylococcus aureus
Monitoring food‐producing animals, in particular in intensively reared animals, carried out periodically in conjunction with systematic surveillance of meticillin‐resistant Staphylococcus aureus (MRSA) in humans, allows trends in the diffusion and evolution of zoonotically acquired MRSA in humans to be identified (EFSA, 2009a,b, 2012b). Isolates representative of various animal and food origins should therefore optimally be analysed for determination of lineage, antimicrobial susceptibility and virulence‐associated traits. Monitoring of other animal species, including wild animals, with which certain types of MRSA can be associated, provides additional useful information. Monitoring can also provide an early indication of the occurrence of types of MRSA in animals that have previously not been recognised in animal populations.
Meticillin‐resistant Staphylococcus aureus (MRSA).
MRSA has been recognised for decades as a serious cause of infections in humans. Strains of MRSA that cause infections in humans can be divided into three broad categories: community‐associated (CA−), healthcare‐associated (HA‐) and livestock‐associated (LA‐)MRSA. These categories differ in their epidemiology, although distinctions between types can be blurred. LA‐MRSA has been detected in pigs, poultry and veal calves, as well as in other farm animal species, companion animals and horses in many countries worldwide. HA‐MRSA and CA‐MRSA include strains that predominantly affect humans, and these are much less frequently reported from food‐producing animals. LA‐MRSA may also be carried by humans, especially those persons who have repeated occupational contact with affected livestock and their derived carcases. The severity of LA‐MRSA infection has been shown to be similar to that of other MRSA strains. Indeed, public health surveillance in the Netherlands and Denmark in 1999–2014 detected that LA‐MRSA strains were developing more human‐adapted traits, with distinct strains establishing transmission in the community in the absence of livestock contact (Kinross et al., 2017).
The EFSA's assessment of the public health significance of MRSA in animals and food (EFSA, 2009b) and the Joint Scientific Report of ECDC, EFSA and the European Medicines Agency (EMA) on MRSA in livestock, companion animals and food (EFSA, 2009a) provide more background information and recommendations on MRSA. These issues were also reviewed in the EFSA Scientific Report on proposed technical specifications to improve the harmonisation of the monitoring and reporting of the prevalence, genetic diversity and multidrug resistance profile of MRSA in food‐producing animals and food (EFSA, 2012b).
Antimicrobial susceptibility in European invasive Staphylococcus aureus isolates is reported by the MSs to the European Antimicrobial Resistance Surveillance Network (EARS‐Net) hosted by ECDC. The EU/EEA population‐weighted mean of the proportion of MRSA among invasive S. aureus infections reported by EARS‐Net continued to decrease during the last 4‐year period, from 18.1% in 2013 to 13.7% in 2016. At the country level, MRSA percentages seem to be stabilising or decreasing in a majority of EU/EEA countries. MRSA however remains an important pathogen in Europe, as the levels of MRSA are still high in several countries, and combined resistance to other antimicrobial groups was common (ECDC, 2017).
MRSA typing data are not reported and, therefore, when there may be possible links to the animal reservoir of LA‐MRSA, these cannot be detected easily with current monitoring procedures, at least at the European level. In a 2007, survey of 15 European countries 8 countries had reported detection of LA‐MRSA (i.e. MRSA CC398) in human isolates (Van Cleef et al., 2011). Where MRSA molecular typing was undertaken during a 2013 survey conducted by ECDC, 18/20 participating EU/EEA countries detected LA‐MRSA (i.e. MRSA CC398 and other types of LA‐MRSA). Notably, five geographically‐dispersed EU/EEA NRLs reported that, in 2013, more than 1 in 10 human MRSA isolates that were typed were LA‐MRSA. Seven EU/EEA countries did not perform any typing of human MRSA isolates in 2013 (Kinross et al., 2017).
Recent reports have highlighted the occurrence of MRSA in farmers and those repeatedly exposed to livestock. Fischer et al. (2017) report that nasal MRSA carriage was detected in 84.7% of German pig farmers (72/85 pig farmers from 51 pig farms), while Köck et al. (2017) state that LA‐MRSA persistently colonises between 24% and 86% of pig farmers, 37% of cattle farmers and 9–37% of poultry farmers, as well as a proportion of slaughterhouse workers (3–6%) and veterinarians (3–45%). These reports underline the usefulness of monitoring the MRSA status of livestock populations. The situation is dynamic, exemplified by a recent longitudinal study (Kraemer et al., 2017), as well as the detection of mecC‐MRSA in wild birds (magpies and cinereous vultures) in Spain (Ruiz‐Ripa et al., 2017).
mecC‐meticillin‐resistant Staphylococcus aureus .
A variant of the methicillin resistance gene mecA, termed mecC, was identified in 2011 in MRSA from humans and cattle in Europe (García‐Álvarez et al., 2011; Shore et al., 2011), and has subsequently been detected in ruminants, pigs and companion animals, with increasing reports from wild animals (Paterson et al., 2014; Bengtsson et al., 2017). Although first identified in 2011, mecC‐MRSA isolates have now been found dating back to 1975 (Petersen et al., 2013), and it is reported that the mecC gene shares 70% identity with mecA at the DNA level (García‐Álvarez et al., 2011).
Petersen et al. (2013) demonstrated that mecC‐MRSA infections in humans were primarily community acquired, typically affecting people living in rural areas and those older than typical for CA‐mecA‐MRSA patients. Although our understanding of the epidemiology of mecC‐MRSA is incomplete, studies have indicated that animal contact and zoonotic transmission are likely to be important. Petersen et al. (2013) also demonstrated that mecC‐MRSA can be transmitted between humans and ruminants: for two people with cattle/sheep contact, mecC‐MRSA was detected in both the animals and their owners, and isolates were of the same spa‐type and multiple‐locus variable number tandem repeat analysis (MLVA) profile. Paterson et al. (2014) reported that when tested, mecC‐MRSA strains have been negative for Panton–Valentine leukocidin (PVL) toxin – a virulence feature typically associated with CA‐MRSA – and negative for human immune evasion cluster (IEC) genes, chp (chemotaxis inhibitor protein), sak (staphylokinase) and scn (encoding the staphylococcal complement protein inhibitor). Carriage of these IEC genes is considered an adaptation to enable S. aureus colonisation and infection of humans, and is not usually a feature of animal S. aureus strains (Cuny et al., 2015a).
Interestingly, mecC‐MRSA strains that harbour the scn gene (a human IEC gene) have been detected in wild birds in Spain (Ruiz‐Ripa et al., 2017). This study involved collection of nasotracheal samples from wild birds, obtained in 2015–2016 from different Spanish regions. Isolates of mecC‐MRSA were obtained from magpies and cinereous vultures, and most were spa‐type t843, associated to CC130. Among these spa‐type t843 isolates, scn‐positive and scn‐negative strains were identified by PCR analysis. It should be noted that the mecC‐MRSA isolates from magpies came from a single sampling location and were detected both in 2015 and 2016. These findings indicate that wild birds could act as reservoir of mecC‐MRSA and may play a role in the epidemiology and evolution of MRSA (Ruiz‐Ripa et al., 2017).
Determination of the susceptibility of MRSA isolates to compounds of particular medical importance – such as linezolid and vancomycin – also provides valuable information on the MRSA situation. Monitoring of MRSA in animals and food is currently performed voluntarily by MSs and the findings presented in this report underline the value of such monitoring.
6.1. Meticillin‐resistant Staphylococcus aureus in food and animals
LA‐MRSA isolates are the main focus of this chapter, which summarises the occurrence of MRSA and AMR patterns in meat samples from various species and food‐producing animals/populations reported by five MSs and two non‐MSs to EFSA in 2016 (excluding clinical investigations; Table MRSAOVERVIEW). Belgium and Switzerland were the only countries to report data on AMR of MRSA isolates from food‐producing animals; both countries also reported molecular typing data, as did Norway under their control and eradication programme. This chapter also includes occurrence data on MRSA reported from clinical investigations of food‐producing animals and in solipeds, companion, zoo and wild animals. AMR and molecular typing data of isolates from a horse, a wild hedgehog, and companion and zoo animals were also provided by Sweden and are shown in Table 8. Methods for the isolation of MRSA from food and animals have not been harmonised at the EU level and, therefore, the methods used by individual reporting MSs may differ in sensitivity. Similarly, the sampling strategies used by reporting MSs are not harmonised at the EU level and these may also influence the results obtained.
6.1.1. Monitoring of meticillin‐resistant Staphylococcus aureus in food
In 2016, Germany, Switzerland, Denmark and Spain reported information on the occurrence of MRSA in meat samples (Table 51). Switzerland investigated 302 fresh broiler meat samples, among which 3.0% of batches tested positive for MRSA. Spain investigated fresh meat samples from rabbits and four positive samples were detected (8.0%). Germany examined both fresh broiler meat (422 samples in total) and fresh turkey meat (458 samples in total), among which 13.0% and 44.5% of batches tested positive for MRSA, respectively. Denmark examined pig meat under a national survey (both fresh meat and meat preparation samples); with 78 positive samples out of 195 (40.0%) detected in fresh pig meat, and 31 positive samples out of 64 (48.4%) detected in meat preparation samples. Further information on the Danish national survey is available in the specific text box below.
Table 51.
Meticillin‐resistant Staphylococcus aureus in food, 2016
| Country | Production type/monitoring description (where specified)) | Sample unit | Number | |
|---|---|---|---|---|
| Units tested | (%) positive for MRSA | |||
| Meat from broilers ( Gallus gallus ) | ||||
| Germany | Fresh meat – ARM – active | Single | 422 | 55 (13.0%)* |
| Switzerland | Fresh meat – ARM | Single | 302 | 9 (3.0%)a |
| Meat from pigs | ||||
| Denmark | Fresh meatΔ – ARM – national survey | Single | 195 | 78 (40.0%)* |
| Meat preparationΔ – ARM – national survey | Single | 64 | 31 (48.4%)* | |
| Meat from rabbits | ||||
| Spain | Fresh meat – ARM | Single | 50 | 4 (8.0%)b |
| Meat from turkeys | ||||
| Germany | Fresh meat ‐ ARM – active | Single | 458 | 204 (44.5%)* |
ARM: At‐retail monitoring.
spa‐types: t034 (3 isolates), t1430 (3), t2123 (2), t153 (1). Panton–Valentine leukocidin (PVL) status of the t153 isolate was not reported.
spa‐types: t011 (3 isolates), t1190 (1). PVL status of the t1190 isolate was not reported.
* spa‐types not reported.
Δ Samples originate from both conventional and organic herds.
The corresponding spa‐typing data were not reported from Germany and Denmark. spa‐types t034 and t011 (common spa‐types associated with LA‐MRSA CC398) were reported by Switzerland (fresh broiler meat) and Spain (fresh rabbit meat), respectively. Spain also reported spa‐type t1190 from fresh rabbit meat; S. aureus spa‐type t1190 has previously been reported from rabbit carcasses and is associated with CC96 (Merz et al., 2016). Switzerland reported two livestock‐associated MRSA isolates; spa‐types t2123 (associated with CC398) and t1430 (associated with ST9/CC9, another LA‐MRSA clonal lineage). spa‐type t153 was also reported in broiler meat by Switzerland; t153 is a spa‐type that has been observed in S. aureus isolates with a mosaic genome and can therefore be associated with different clonal lineages, including CC34 and ST10 (Holtfreter et al., 2016).
In summary, meat from broilers, pigs, rabbits and turkeys all proved positive for MRSA, although the level of prevalence varied between meats of different origin.
Germany reported annual results on the occurrence of MRSA in fresh broiler meat in 2011, 2013 and 2016 (Table 52). Prevalence remained at a similar high level in 2011 and 2013 (26.5% and 24.2%, respectively), although in 2016 it fell to a moderate level (13.0%), while the sample size examined remained similar throughout the period. Although Switzerland did not report on the occurrence of MRSA in fresh broiler meat in 2015, data are available for 2014 and 2016. In both years, prevalence was low and, interestingly, the level of occurrence more than halved from 2014 to 2016 (6.9% in 2014 and 3.0% in 2016). While the number of units tested in these years was similar (N = 319 and N = 302), the sampling differed slightly in different years. In 2014, batches of meat were tested and, in 2016, single meat samples were tested. Germany reported annual results on the occurrence of MRSA in fresh turkey meat in 2012, 2014 and 2016, testing more than 300 samples in each year. Prevalence increased slightly, although in all years, a similar high level was recorded: 37.7% (2012), 42.5% (2014) and 44.5% (2016). Spain reported data on the yearly prevalence of MRSA in fresh rabbit meat from 2015 (N = 60) to 2016 (N = 50). In both years, similar low levels of prevalence were recorded at 8.3% and 8.0%.
Table 52.
Temporal occurrence of meticillin‐resistant Staphylococcus aureus in food (at‐retail monitoring)
| Country | Year | Production type/description | Sample unit | Units tested | Number (%) positive for MRSA |
|---|---|---|---|---|---|
| Germany | 2011 | Fresh broiler meat | Single | 404 | 107 (26.5%)* |
| 2013 | Single | 443 | 107 (24.2%)* | ||
| 2016 | Single | 422 | 55 (13.0%)* | ||
| Switzerland | 2014 | Fresh broiler meat | Batch | 319 | 22 (6.9%)a |
| 2016 | Single | 302 | 9 (3.0%)b | ||
| Germany | 2012 | Fresh turkey meat | Single | 749 | 282 (37.7%)* |
| 2014 | Single | 339 | 144 (42.5%)* | ||
| 2016 | Single | 458 | 204 (44.5%)* | ||
| Spain | 2015 | Fresh rabbit meat | Single | 60 | 5 (8.3%)* |
| 2016 | Single | 50 | 4 (8.0%)c |
In 2014, spa‐types: t034 (14 isolates), t011 (3), t032 (3), t571 (1), t899 (1).
In 2016, spa‐types: t034 (3 isolates), t1430 (3), t2123 (2), t153 (1).
In 2016, spa‐types: t011 (3 isolates), t1190 (1). PVL status of the t1190 isolate was not reported.
* spa‐types not reported.
6.1.2. Meticillin‐resistant Staphylococcus aureus in animals
Monitoring of MRSA in food‐producing animals
For 2016, Ireland, Belgium, Denmark and Norway reported data on the occurrence of MRSA in food‐producing animals (Table 53). Ireland tested various livestock species as part of on‐farm monitoring including dairy cows, domestic fowl, goats, rabbits, sheep, horses, turkeys and pigs with no samples testing positive for MRSA at the animal level. Norway tested a large number of pig herds (N = 872) in 2016, as part of an on‐farm control and eradication programme. MRSA was detected in one pig herd, resulting in a very low prevalence at 0.1%. The production type(s) of these herds was not stated. The MRSA isolate was spa‐type t034 and belonged to CC398. Denmark reported an extremely high MRSA prevalence in fattening pig herds under the national survey of 87.7%. In Danish breeding pig herds, only a small number of units was tested (N = 6) and each of these proved positive for MRSA. Belgium tested both breeding (N = 153) and fattening (N = 177) pig herds (testing pooled nasal swabs) during on‐farm monitoring in 2016. A high prevalence was recorded of breeding pig herds that were positive for MRSA (48.4%) and a very high prevalence was also recorded in fattening pig herds (57.1%).
Table 53.
Meticillin‐resistant Staphylococcus aureus in food‐producing animals (excluding clinical investigations), 2016
| Country | Production type/monitoring description (where specified) | Sample unit | Number | |
|---|---|---|---|---|
| Units tested | (%) positive for MRSA | |||
| Cattle (bovine animals) | ||||
| Ireland | Dairy cows – OFM – passive | Animal | 2,784 | 0 |
| Gallus gallus (domestic fowl) | ||||
| Ireland | Breeding flocks, unspecified – OFM – passive | Animal | 96 | 0 |
| Broilers – OFM – passive | Animal | 57 | 0 | |
| Goats | ||||
| Ireland | OFM – passive | Animal | 38 | 0 |
| Pigs | ||||
| Belgium | Breeding animals – OFM | Herd | 153 | 74 (48.4%)a |
| Fattening pigs – OFM | Herd | 177 | 101 (57.1%)b | |
| Denmark | Breeding animals – OFM – national survey | Herd | 6 | 6 (100.0%)* |
| Fattening pigs – OFM – national survey | Herd | 57 | 50 (87.7%)* | |
| Ireland | Breeding animals – OFM – passive | Animal | 12 | 0 |
| Fattening pigs – OFM – passive | Animal | 545 | 0 | |
| Norway | OFCEP | Herd | 872 | 1 (0.1%)c |
| Rabbits | ||||
| Ireland | OFM – passive | Animal | 26 | 0 |
| Sheep | ||||
| Ireland | OFM – passive | Animal | 1,446 | 0 |
| Solipeds, domestic | ||||
| Ireland | Horses – OFM – passive | Animal | 70 | 0 |
| Turkeys | ||||
| Ireland | Fattening flocks – OFM – passive | Animal | 26 | 0 |
OFM: On‐farm monitoring; OFCEP: On‐farm control and eradication programme.
spa‐types: t011 CC398 (55 isolates), t1451 (2), t1456 (1), t1456 CC398 (3), t1580 (1), t1985 (5), t1985 CC398 (1), t034 (1), t034 CC398 (4), t4659 CC398 (1).
spa‐types: t011 CC398 (71 isolates), t1451 (1), t1456 (1), t1456 CC398 (1), t1580 (5), t1985 (8), t1985 CC398 (3), t034 (7), t034 CC398 (2), t037 (1), t898 (1).
spa‐type: t034 CC398 (1 isolate).
* spa‐types not reported.
spa‐types were reported for all MRSA isolates obtained from breeding and fattening pig herds in Belgium (Table 53). The majority (55/74) of isolates from breeding pig herds in Belgium were spa‐type t011, which is associated with MRSA CC398 (LA‐MRSA). All 55 isolates were multilocus sequence typed (MLST), confirming them to belong to CC398. Other spa‐types were recovered in low numbers from breeding pig herds – t034, t1451, t1456, t1580, t1985 and t4659 – and some of these isolates were also examined for MLST. All of these reported spa‐types are associated with CC398. The majority (71/101) of MRSA isolates recovered from fattening pig herds in Belgium were again spa‐type t011, with MLST confirming them all to belong to CC398. Lower numbers of t034, t1456, t1580 and t1985 were detected, with single isolates of t037, t1451 and t898. Most spa‐types from fattening animals were those associated with CC398, with the exception of a single isolate of t037. spa‐type t037 is generally associated with ST239, a dominant sequence type of HA‐MRSA.
Monitoring of MRSA in companion and fur‐producing animals
In 2016, Ireland and Norway reported data on the occurrence of MRSA in companion and fur‐producing animals (Table 54). Ireland tested cats and dogs as part of on‐farm monitoring with no samples testing positive for MRSA at animal level. While a moderately large number of dogs (N = 156) were tested, a low number of cats was tested. As part of Norway's on‐farm control and eradication programme, 121 mink farms were tested with no units testing positive for MRSA.
Table 54.
Meticillin‐resistant Staphylococcus aureus in companion animals and fur animals (excluding clinical investigations), 2016
| Country | Production type/monitoring description (where specified) | Sample unit | Number | |
|---|---|---|---|---|
| Units tested | (%) positive for MRSA | |||
| Cats | ||||
| Ireland | Companion animals – OFM – passive | Animal | 5 | 0 |
| Dogs | ||||
| Ireland | Companion animals – OFM – passive | Animal | 156 | 0 |
| Mink | ||||
| Norway | Farmed animals – OFCEP | Herd | 121 | 0 |
OFM: On‐farm monitoring; OFCEP: On‐farm control and eradication programme.
Monitoring of LA‐MRSA CC398 in Denmark, 2016.
1.
The DANMAP (2016) report provides details of the monitoring performed in 2016 in Denmark on animals, food and humans for LA‐MRSA CC398. Although the occurrence of LA‐MRSA CC398 in people with livestock contact decreased in 2016, only new MRSA cases of carriage or infection are reported in Denmark; previously detected cases are not counted again. In contrast, the occurrence of LA‐MRSA CC398 in people with no livestock contact increased in 2016 (98 cases in 2016, 73 cases in 2015). DANMAP notes that the general population includes a greater proportion of elderly and immunocompromised individuals than the occupationally exposed human population, and that there were greater numbers of blood stream infections and deaths in people with no livestock contact in comparison with those in contact with animals.
In 2016, Denmark screened 227 conventional pig herds for LA‐MRSA: 57 randomly selected herds, 53 herds from two areas which were not monitored in a previous survey in 2014, and 117 production (N = 111) and breeding (N = 6) herds which were monitored in 2014. In the randomly selected herds, prevalence was reported at 88% (as reported in Table 3 of the MRSA chapter of the 2016 EUSR on AMR), with an increase of 20% from 2014, while prevalence was lower in the herds from the two regions that were not surveyed in 2014 (59% and 62%). Interestingly, 62% of pig herds which were negative in 2014 tested positive in 2016. Furthermore, 6/6 breeding herds were reported positive (as reported in Table 53 of the MRSA chapter of the 2016 EUSR on AMR) including three herds which tested negative in 2014, suggesting that LA‐MRSA may have been introduced via human carriers or other sources, as introduction of fresh livestock into these herds had not occurred. All LA‐MRSA‐positive herds in 2014 were reported as positive in 2016, from which it can be inferred that spontaneous elimination of LA‐MRSA from conventional pig herds is likely to occur rarely. This was in contrast with a survey of six free‐range (five organic; one conventional) pig herds in 2016, where 5/6 farms introduced MRSA‐positive conventional breeding pigs, yet 4/6 herds tested MRSA‐negative; the report concludes that MRSA is less well maintained in free‐range than conventional pig farms.
The occurrence of LA‐MRSA in conventional pork meat in 2016 was reported to be high at 48% (78/162 samples testing positive), which is a marked increase from that observed in 2009, 2010 and 2011 (5, 6 and 10%, respectively). In 2016, reported prevalence in organic pork samples was lower at 32% (31/97 samples testing positive), but this figure was still considerably higher than that reported in a 2015 survey of organic pig farms (where only 6% were positive). This finding was interesting and may be explained by cross‐contamination occurring between pigs produced under the different systems at slaughter. Table 55 below provides detailed food origin data on the occurrence of MRSA in Danish pork, 2016. (Data describing MRSA occurrence in Danish pig meat samples are also reported in Table 51 of the MRSA chapter of the 2016 EUSR on AMR, and combine results from conventional and organic herds.) Imported conventional pork meat was also sampled in 2016 and LA‐MRSA prevalence was reported as high (29%).
Table 55.
Occurrence of livestock‐associated MRSA in processed and fresh pork of Danish origin, 2016
| Meat from Danish pigs | Units tested | No. positive for MRSA | % positive for MRSA | |
|---|---|---|---|---|
| Processed meat | Conventional | 34 | 22 | 65 |
| Organic | 30 | 9 | 30 | |
| Total | 64 | 31 | 48 | |
| Fresh meat | Conventional | 128 | 56 | 44 |
| Organic | 67 | 22 | 33 | |
| Total | 195 | 78 | 40 | |
Source: Danish Veterinary and Food Authority, 2016 Final report on MRSA in pork (in Danish). https://www.foedevarestyrelsen.dk/SiteCollectionDocuments/Pressemeddelelser/2016/Slutrapport%20MRSA%20i%20Svinek%C3%B8d%202016.pdf
When spa‐typing was performed on the LA‐MRSA CC398 isolates, t034 and t011 were the most predominant types reported in conventional, organic and imported pig meat, and in conventional pig herds.
In 2016, 89 mink submitted for clinical investigation were also tested for MRSA. Prevalence was reported at 34% which is a similar level to that found in a previous survey conducted in 2015. Bulk milk tank samples were also tested from 236 dairy farms; MRSA was reported in samples (3%). Of these MRSA‐positive samples, six were confirmed as mecA‐MRSA and one isolate was confirmed as mecC‐MRSA; this is the first report of mecC isolation from bulk milk samples in Denmark.
The occurrence of MRSA in Danish horses was also surveyed, between April and August 2015. Prevalence was reported at 4%, with 17/401 horses testing positive for MRSA; the horses with MRSA originated from 7/74 (9%) different farms. Of the 17 equine MRSA isolates, three were reported as mecC‐MRSA CC130, while 14 were reported as mecA‐MRSA CC398, spa‐types t011 and t034. Whole‐genome sequence analysis revealed the isolates of spa‐type t011 belonged to a horse‐adapted sublineage of CC398 and the isolates of spa‐type t034 were closely related to CC398 isolates from Danish pigs, suggesting transmission between differing species.
In summary, monitoring carried out by Denmark demonstrated that the primary reservoir for LA‐MRSA CC398 is primarily conventional pig farms. However, there is much evidence of transmission to other animal species and those with close contact to these species. Furthermore, LA‐MRSA CC398 infections among people with no livestock contact are increasing.
Table 55.
Occurrence of livestock‐associated MRSA in processed and fresh pork of Danish origin, 2016
| Meat from Danish pigs | Units tested | No. positive for MRSA | % positive for MRSA | |
|---|---|---|---|---|
| Processed meat | Conventional | 34 | 22 | 65 |
| Organic | 30 | 9 | 30 | |
| Total | 64 | 31 | 48 | |
| Fresh meat | Conventional | 128 | 56 | 44 |
| Organic | 67 | 22 | 33 | |
| Total | 195 | 78 | 40 | |
Source: Danish Veterinary and Food Authority, 2016 Final report on MRSA in pork (in Danish). https://www.foedevarestyrelsen.dk/SiteCollectionDocuments/Pressemeddelelser/2016/Slutrapport%20MRSA%20i%20Svinek%C3%B8d%202016.pdf
Clinical investigations for MRSA in food‐producing animals
Typically, clinical investigations differ from monitoring studies in food‐producing animals; as selective culture methods may not be used, the number of units tested may be low and the sample may involve a biased sample population. Although these data do not allow prevalence to be inferred and cannot be extrapolated at the population level, it is still considered relevant to report the range of animal species/populations which were affected. In 2016, the Netherlands and Slovakia reported data on clinical investigations for MRSA in various food‐producing animals (Table 56). Slovakia tested cattle (> 2 years of age, calves, dairy cows, heifers), goats, pigeons, fattening pigs and sheep (> 1 year old, lambs, milk ewes). None of these animals tested positive for MRSA; however, in many cases sample size was small. In the Netherlands, MRSA prevalence in dairy cows and fattening pigs was recorded at 0.6% and 10.0%, respectively; a low number of fattening pigs were tested (N = 20).
Table 56.
Meticillin‐resistant Staphylococcus aureus in food‐producing animals, clinical investigations, 2016
| Country | Production type/monitoring description (when specified) | Sample unit | Number | |
|---|---|---|---|---|
| Units tested | (%) positive for MRSA | |||
| Cattle (bovine animals) | ||||
| Netherlands | Dairy cows ‐ VCCI | Animal | 1,542 | 10 (0.6%) |
| Slovakia | Adult cattle over 2 years of age – OFCI | Animal | 21 | 0 |
| Calves (under 1 year of age) – OFCI | Animal | 11 | 0 | |
| Dairy cows – OFCI | Animal | 297 | 0 | |
| Heifers – OFCI | Animal | 1 | 0 | |
| Goats | ||||
| Slovakia | OFCI | Animal | 6 | 0 |
| Pigeons | ||||
| Slovakia | VCCI | Animal | 4 | 0 |
| Pigs | ||||
| Netherlands | Fattening pigs – OFCI | Animal | 20 | 2 (10.0%) |
| Slovakia | Fattening pigs – OFCI | Animal | 1 | 0 |
| Sheep | ||||
| Slovakia | Animals over 1 year of age – OFCI | Animal | 11 | 0 |
| Animals under 1 year of age (lambs) – OFCI | Animal | 12 | 0 | |
| Milk ewes – OFCI | Animal | 53 | 0 | |
VCCI: At‐veterinary‐clinic clinical investigations; OFCI: On‐farm clinical investigations.
Clinical investigations for MRSA in companion animals
The Netherlands and Slovakia reported data on MRSA in companion animals in 2016 (Table 57). Slovakia tested cats, dogs, guinea pigs, parrots, rabbits, horses, during veterinary‐clinic, natural‐habitat and on‐farm clinical investigations. None of these animals tested positive for MRSA. Sample sizes were small, in some instances just one animal was tested, with the exception of cats (N = 88) and dogs (N = 432). The Netherlands tested a large number of cats (N = 438), dogs (N = 3,460) and solipeds (N = 466), resulting in 0.7%, 0.2% and 4.7% occurrence of MRSA, respectively. The Netherlands also tested monkeys during zoo clinical investigations: one of five animals proved positive.
Table 57.
Meticillin‐resistant Staphylococcus aureus in companion animals, clinical investigations, 2016
| Country | Production type/description (where specified) | Sample unit | Number | |
|---|---|---|---|---|
| Units tested | (%) positive for MRSA | |||
| Cats | ||||
| Netherlands | Companion animals – VCCI | Animal | 438 | 3 (0.7%) |
| Slovakia | Companion animals – VCCI | Animal | 88 | 0 |
| Dogs | ||||
| Netherlands | Companion animals – VCCI | Animal | 3,460 | 8 (0.2%) |
| Slovakia | Companion animals – VCCI | Animal | 432 | 0 |
| Guinea pigs | ||||
| Slovakia | Companion animals – VCCI | Animal | 1 | 0 |
| Parrots | ||||
| Slovakia | Unspecified clinical investigations | Animal | 3 | 0 |
| Rabbits | ||||
| Slovakia | Companion animals – OFCI | Animal | 3 | 0 |
| Companion animals – VCCI | Animal | 16 | 0 | |
| Solipeds, domestic | ||||
| Netherlands | Horses – OFCI | Animal | 466 | 22 (4.7%) |
| Slovakia | Horses – OFCI | Animal | 1 | 0 |
| Horses – VCCI | Animal | 1 | 0 | |
VCCI: At‐veterinary‐clinic clinical investigations; OFCI: On‐farm clinical investigations.
Temporal trends in the occurrence of MRSA
Norway reported data on the yearly prevalence of MRSA in pigs (production type not specified) from 2014 to 2016, as part of their on‐farm control and eradication programme. In all years, similar very low levels of prevalence were recorded at 0.1% (N = 986), 0.5% (N = 821) and 0.1% (N = 872); highlighting the favourable impact of the Norwegian programme in eradicating and maintaining freedom of LA‐MRSA from most pig herds (Table 58).
Table 58.
Temporal occurrence of meticillin‐resistant Staphylococcus aureus in animals
| Country | Year | Production type/description | Sample unit | Number | |
|---|---|---|---|---|---|
| Units tested | (%) positive for MRSA | ||||
| Norway | 2014 | Pigs: farm control eradication programme | Herd | 986 | 1 (0.1%)a |
| 2015 | Herd | 821 | 4 (0.5%)b | ||
| 2016 | Herd | 872 | 1 (0.1%)c | ||
In 2014, spa‐type: t011 (1).
In 2015, spa‐type: t011.
In 2016, spa‐type: t034 CC398 (1).
6.2. Susceptibility testing of meticillin‐resistant Staphylococcus aureus isolates
In 2016, data on the antimicrobial susceptibility of MRSA isolates were only reported by Belgium, Sweden and Switzerland (Table 59). All countries used a broth dilution method and applied EUCAST ECOFFs to determine the susceptibility of isolates. All MRSA isolates were resistant to cefoxitin (a single equine isolate from Sweden was not tested against cefoxitin). Tetracycline resistance was extremely high in MRSA isolates from Belgian breeding and fattening pigs (97.3% and 99.0%, respectively) and, where spa‐typing results were available, most isolates were types associated with CC398. This was expected as livestock‐associated MRSA isolates belonging to CC398 are usually tetracycline resistant (Crombé et al., 2013).
Table 59.
Occurrence of resistance (%) to selected antimicrobials in MRSA from food and animals, 2016
| Country | N | GEN | KAN | STR | CHL | FOX | RIF | CIP | ERY | CLI | Q/D | LZD | TIA | MUP | FUS | SMX | TMP | TET |
|---|---|---|---|---|---|---|---|---|---|---|---|---|---|---|---|---|---|---|
| Cats pet animals | ||||||||||||||||||
| Sweden | 2a | 0 | 0 | – | 0 | 100 | – | 50 | 50 | 0 | – | – | – | – | 0 | – | 0 | 0 |
| Dogs pet animals | ||||||||||||||||||
| Sweden | 2b | 50 | 50 | – | 50 | 100 | – | 50 | 50 | 50 | – | – | – | – | 50 | – | 100 | 100 |
| Goats | ||||||||||||||||||
| Sweden | 3c | 0 | 0 | – | 0 | 100 | – | 0 | 0 | 0 | – | – | – | – | 0 | – | 0 | 0 |
| Hedgehogs wild | ||||||||||||||||||
| Sweden | 1d | 0 | 0 | – | 0 | 100 | – | 0 | 0 | 0 | – | – | – | – | 0 | – | 0 | 0 |
| Meat from broilers (Gallus gallus) fresh | ||||||||||||||||||
| Switzerland | 9e | 0 | 0 | 0 | 0 | 100 | 0 | 33.3 | 77.8 | 88.9 | 55.6 | 0 | 55.6 | 0 | 0 | 0 | 55.6 | 55.6 |
| Pigs – breeding animals | ||||||||||||||||||
| Belgium | 74f | 24.3 | 24.3 | 16.2 | 6.8 | 100 | 4.1 | 56.8 | 31.1 | 40.5 | 14.9 | 2.7 | 18.9 | 0 | 5.4 | 16.2 | 95.9 | 97.3 |
| Pigs – fattening animals | ||||||||||||||||||
| Belgium | 101g | 27.7 | 18.8 | 11.9 | 3 | 100 | 1 | 48.5 | 46.5 | 55.4 | 14.9 | 0 | 24.8 | 2 | 6.9 | 6.9 | 97 | 99 |
| Solipeds, domestic horses | ||||||||||||||||||
| Sweden | 1h | 100 | 100 | – | 0 | – | – | 0 | 0 | 0 | – | – | – | – | 0 | – | 100 | 100 |
–: No data reported; MRSA: meticillin‐resistant Staphylococcus aureus; GEN: gentamicin; KAN: kanamycin; STR: streptomycin; CHL: chloramphenicol; FOX: cefoxitin; RIF: rifampicin; CIP: ciprofloxacin; ERY: erythromycin; CLI: clindamycin; Q/D: quinupristin/dalfopristin; LZD: linezolid; TIA: tiamulin; MUP: mupirocin; FUS: fusidic acid; SMX: sulfamethoxazole; TMP: trimethoprim; TET: tetracycline;
N: Number of isolates tested.
Where tested, all MRSA isolates were resistant to cefoxitin, as expected. Where tested, all isolates were susceptible to vancomycin.
spa‐types: t304 (1 isolate), t008 (1). The t304 isolate was PVL‐negative. The t008 isolate was PVL‐positive.
spa‐types: t034 (1 isolate), t044 (1). The t044 isolate was PVL‐positive.
spa‐types: t9268 (3 isolates).
spa‐types: t3391 (1 isolate).
spa–types: t1430 (3 isolates), t034 (3), t2123 (2), t153 (1). PVL status of the t153 isolate was not reported.
spa‐types: t011 CC398 (55 isolates), t1451 (2), t1456 (1), t1456 CC398 (3), t1580 (1), t1985 (5), t1985 CC398 (1), t034 (1), t034 CC398 (4), t4659 CC398 (1).
spa‐types: t011 CC398 (71 isolates), t1451 (1), t1456 (1), t1456 CC398 (1), t1580 (5), t1985 (8), t1985 CC398 (3), t034 (7), t034 CC398 (2), t037 (1), t898 (1).
spa‐types: t1451 (1 isolate).
The high level of MRSA isolates showing resistance to trimethoprim in breeding (95.9%) and fattening (97.0%) pigs in Belgium presumably reflects the relatively common usage of this compound in pig medicine throughout many European countries. Isolates from Belgian pigs showed resistance to most of the other tested antimicrobials to differing extents (with the exception of vancomycin, where no resistance was detected – see below). Considering isolates from breeding and fattening pigs in Belgium, the occurrence of resistance was generally similar in both breeding and fattening animals for most antimicrobials. Erythromycin resistance however equalled 31.1% in breeding animals, but higher at 46.5% in fattening animals; clindamycin resistance was also higher in fatteners, compared with breeding animals.
Vancomycin is one of the antimicrobials of last resort for treating S. aureus infections in humans, and resistance to this antimicrobial is currently extremely rare in S. aureus. Linezolid is another important antimicrobial for the treatment of human MRSA infections. Resistance to vancomycin was not detected in MRSA isolates from food or animals in 2016; however, resistance to linezolid was recorded in two isolates from breeding pigs in Belgium (Table 59). These MRSA strains were both spa‐type t011 and sequence typed as belonging to CC398. The isolates showed a similar resistance pattern with only one difference in antimicrobial susceptibility across the range of antibiotics tested (Table 60). In addition to linezolid resistance, both isolates were resistant to chloramphenicol, clindamycin, gentamicin, kanamycin, quinupristin/dalfopristin, tetracycline, tiamulin and trimethoprim. One of the isolates also showed resistance to ciprofloxacin. The pattern of resistance to linezolid, tiamulin, clindamycin and chloramphenicol is typical of possession of the cfr gene, whose presence has been since confirmed by Belgium.
Table 60.
Resistance patterns of the two linezolid‐resistant isolates recorded from Belgium breeding pigs, 2016
| Antibiotic | ECOFF used (mg/L) | Isolate 1 | Isolate 2 | ||
|---|---|---|---|---|---|
| spa‐type t011, clonal complex CC398 | spa‐type t011, clonal complex CC398 | ||||
| MIC value (mg/L) | S or R | MIC value (mg/L) | S or R | ||
| Cefoxitin | 4 | > 16 | R | > 16 | R |
| Chloramphenicol | 16 | > 64 | R | > 64 | R |
| Ciprofloxacin | 1 | 0.5 | S | 4 | R |
| Clindamycin | 0.25 | > 4 | R | > 4 | R |
| Erythromycin | 1 | 0.5 | S | ≤ 0.25 | S |
| Fusidic acid | 0.5 | ≤ 0.5 | S | ≤ 0.5 | S |
| Gentamicin | 2 | > 16 | R | > 16 | R |
| Kanamycin | 8 | > 64 | R | > 64 | R |
| Linezolid | 4 | 8 | R | 8 | R |
| Mupirocin | 1 | ≤ 0.5 | S | ≤ 0.5 | S |
| Penicillin | 0.12 | > 2 | R | > 2 | R |
| Quinupristin/Dalfopristin | 1 | 2 | R | 2 | R |
| Rifampicin | 0.03 | ≤ 0.016 | S | ≤ 0.016 | S |
| Streptomycin | 16 | 8 | S | 8 | S |
| Sulfamethoxazole | 128 | ≤ 64 | S | ≤ 64 | S |
| Tetracycline | 1 | > 16 | R | > 16 | R |
| Tiamulin | 2 | > 4 | R | > 4 | R |
| Trimethoprim | 2 | > 32 | R | > 32 | R |
| Vancomycin | 2 | ≤ 1 | S | ≤ 1 | S |
S: Susceptible; R: Resistant; MIC: minimum inhibitory concentration.
Two MRSA isolates were reported from pet cats in Sweden, one showed additional resistance to ciprofloxacin and erythromycin; this isolate was spa‐type t008. This spa‐type is associated with ST8 and is usually considered a healthcare‐associated MRSA. Sweden however confirmed that the isolate was PVL toxin positive; possession of PVL is a feature frequently associated with CA‐MRSA. The other feline MRSA isolate was spa‐type t304 and PVL‐negative. spa‐type t304 can be associated with both ST8 and ST6; the latter is generally regarded as a HA‐MRSA lineage (Bartels et al., 2015; Blomfeldt et al., 2016).
Two MRSA isolates were reported from pet dogs in Sweden, both showed resistance to trimethoprim and tetracycline; these were spa‐type t034 and t044. The t044 isolate also showed resistance to erythromycin and fusidic acid, and the t034 isolate showed a wider pattern of resistance to those antimicrobials tested: chloramphenicol, ciprofloxacin, clindamycin, gentamicin and kanamycin. spa‐type t034 is associated with CC398 (LA‐MRSA), and t044 is associated both with ST80 (CA‐MRSA) and ST9 (LA‐MRSA). Sweden confirmed that the t044 isolate was PVL‐positive suggesting that the isolate belongs to ST80 (CA‐MRSA).
Among the low number (N = 9) of MRSA isolates from broiler meat reported by Switzerland, no resistance was detected to aminoglycosides (gentamicin, kanamycin, streptomycin). These isolates were spa‐type: t034 (3), t153 (1), t1430 (3) and t2123 (2). Further typing data were not reported, but spa‐types t034 and t2123 are associated with CC398, and t1430 is associated with ST9 (which in turn belongs to clonal complex CC9, a LA‐MRSA clonal lineage). spa‐type t153 is observed in S. aureus isolates with a mosaic genome and can therefore be associated with different clonal lineages, including CC34 and ST10 (Holtfreter et al., 2016).
Sweden reported three mecC‐MRSA isolates, spa‐type t9268, from goats following clinical investigations at a zoo; no resistance was recorded to antimicrobials with the exception of cefoxitin (3/3), oxacillin (1/3) and, where tested, penicillin (1/1). mecC‐MRSA was also detected in a hedgehog during natural habitat clinical investigations in Sweden. The isolate was spa‐type t3391 and had a similar resistance pattern, showing only resistance to β‐lactams (cefoxitin, oxacillin and penicillin).
6.3. Discussion
The monitoring of MRSA in animals and food was voluntary in 2016 and only a limited number of countries reported data on the occurrence of MRSA, with some countries additionally reporting data on spa‐type and antimicrobial susceptibility. Where typing data were available, most MRSA isolates detected were those associated with LA‐MRSA. Figure 98 provides an overview of the types of MRSA detected, where spa‐typing data were reported.
Figure 98.
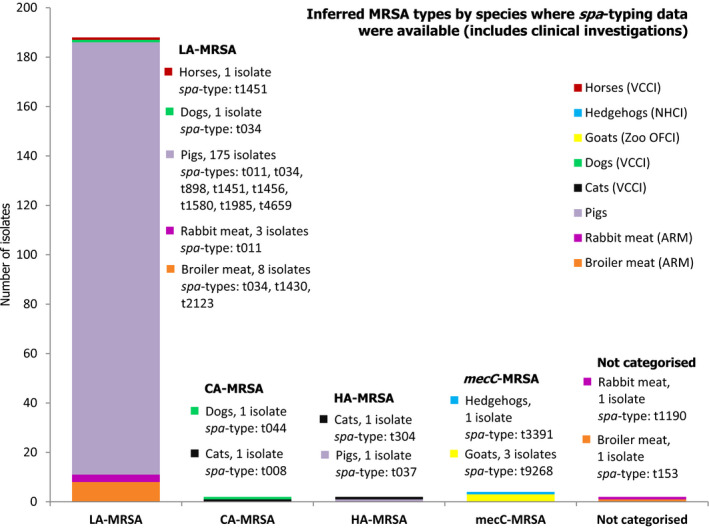
Overview of MRSA types by species reported in 2016, including healthy animals and clinical investigations
-
MLST types have for the most part been inferred from spa‐typing data, some isolates were MLST typed.Both spa‐types t1190 and t153 were not categorised as CA‐MRSA or HA‐MRSA as further typing data including PVL status were not reported. In total, 198 MRSA isolates were spa‐typed.VCCI: At‐veterinary‐clinic clinical investigation; NHCI: Natural habitat clinical investigations; OFCI: On‐farm clinical investigations; ARM: At‐retail monitoring.
In 2016, monitoring of food comprised investigations of meat derived from different animal sources. The monitoring of MRSA in various food products performed by MSs consistently indicates that MRSA can be detected, quite frequently, in different types of food. Such food included meat from broilers, turkeys, rabbits and pigs in 2016. It should be underlined that the laboratory techniques used to detect MRSA employ selective bacterial culture and, therefore, very low levels of contamination can be detected. Cross‐contamination between carcasses on slaughterhouse lines or during production processes may also result in a higher prevalence in meat produced from animals than in the animals themselves. LA‐MRSA is considered a poor coloniser of humans and occurs uncommonly in people without direct or indirect contact with livestock or their carcasses (Graveland et al., 2010). Although a recent report has cautiously suggested that some strains of LA‐MRSA may be adapted to colonise and infect humans and implicate poultry meat as a possible source for humans (Larsen et al., 2016), food is not generally considered to be a significant source of MRSA infection or colonisation of humans (EFSA, 2009b). A recent risk assessment published by the UK Food Standards Agency, reached the same conclusion (FSA, 2017).
The spa‐typing and susceptibility data reported by MSs in 2016 provided useful information in categorising MRSA isolates. Further typing data would in many cases provide extremely useful additional information to aid classification and help assess the origin and significance of the MRSA isolates. For example, possession of the IEC genes (chp, sak and scn) is considered an adaptation facilitating colonisation and infection of humans and is not usually a feature of animal strains (Cuny et al., 2015a; Larsen et al., 2016). Similarly, the presence of the PVL toxin is a virulence feature typically associated with CA‐MRSA strains; other genetic factors can be associated with particular strains or may suggest a particular host preference (e.g. lukM has been associated with animal strains).
spa‐typing data were available for 13/381 MRSA isolates from meat. spa‐types associated with CC398 (LA‐MRSA) and ST9 (LA‐MRSA) were those most frequently reported from meat in 2016. ST9, which in turn belongs to clonal complex CC9, is the second most frequent LA‐MRSA clonal lineage. It is disseminated world‐wide and is particularly prevalent among various species of livestock in Asia (Cuny et al., 2015b). A single MRSA of spa‐type t1190 was recovered from rabbit meat in Spain. S. aureus spa‐type t1190 has previously been reported from rabbit carcasses and is associated with CC96 (Merz et al., 2016). An isolate of CC96‐MRSA with SCCmec type III has previously been reported in Russia, although MRSA ST96/CC96 is not widely reported (Mat Azis et al., 2017). Due to the limited information available, the t1190 isolate from rabbit meat was not categorised as either CA‐MRSA or HA‐MRSA and further typing, in particular PVL testing, would aid such characterisation. Antimicrobial susceptibility data were not reported for this isolate. Another single MRSA isolate, spa‐type t153 was recovered from broiler meat in Switzerland. spa‐type t153 has been observed in S. aureus isolates with a mosaic genome and can therefore be associated with different clonal lineages, including CC34 and ST10 (Holtfreter et al., 2016). The isolate was resistant to only β‐lactams (cefoxitin and penicillin) and was also not categorised as either CA‐MRSA or HA‐MRSA. Further typing would assist with characterisation (including PVL testing); this isolate is perhaps most likely to represent a CA‐MRSA lineage. CA‐MRSA belonging to ST34/CC34 has spread to multiple continents and can cause community‐associated skin and soft tissue infections (Thomas et al., 2012). Kraushaar et al. (2016) reported that MRSA from poultry (chickens and turkeys) collected along the production chains in Germany mainly belonged to ST9, ST398 and ST5, and resistance to clindamycin, erythromycin tetracycline and trimethoprim was most frequently detected. In MRSA from broiler meat from Switzerland, this pattern of resistance was generally reported among the CC398 isolates; however, all three ST9 isolates were susceptible to tetracycline and trimethoprim.
Considering the occurrence of MRSA in food which was reported in previous years, MRSA in fresh broiler meat in Germany has declined over the years 2011, 2013 and 2016, with reported levels of 26.5, 24.2% and 13.0%, respectively. A decline in comparison with previous years was also noted in fresh broiler meat in Switzerland when stratified, randomised sampling was performed throughout 2016. The reasons for these observed declines in the occurrence of MRSA in broiler meat in both Germany and Switzerland are unclear, but the findings are extremely interesting because generally the occurrence of MRSA in food and animals has shown a progressive increase, where it has been investigated.
spa‐typing data were available for 176/232 MRSA isolates from food‐producing animals and most spa‐types detected were associated with CC398 (175/176). The remaining isolate, spa‐type t037 was reported from a fattening pig herd in Belgium. This spa‐type was previously detected in calves under one year of age in Belgium in 2015. spa‐type t037 is generally associated with ST239 (HA‐MRSA), a mosaic strain which has descended from ST8 and ST30 parents. This spa‐type has however also been associated with ST110 and ST241 (Fossum and Bukholm, 2006). The occurrence of mosaic strains, which are hybrid strains formed by recombination of the genome of MRSA belonging to different lineages, has the consequence that certain spa‐types may be associated with more than one sequence type.
Large‐scale chromosomal recombination or replacement in S. aureus – mosaic strains ST239 and CC34.
Although recombination or replacement events are rare and occur much less frequently than mutation, it is an important process in the evolution and adaption of Staphylococcus aureus and is considered to be a factor in the emergence of new MRSA strains. Types of S. aureus with mosaic or hybrid genomes originate from large‐scale chromosomal replacements between parents of distinct genetic backgrounds.
The genome of S. aureus consists of a core genome, a core variable genome and mobile genetic elements (MGEs). The core genome comprises genes associated with central metabolism and other housekeeping functions, and the core variable genome is linked to particular clonal lineages and includes virulence genes and surface proteins (Holtfreter et al., 2016). The mecA gene (which encodes the low‐affinity penicillin‐binding protein) is part of the staphylococcal chromosome cassette mec (SCCmec), a MGE that may also contain genetic structures that encode resistance to non‐β‐lactam antibiotics and heavy metals (Wielders et al., 2002; Smyth et al., 2011).
Sequence type ST239 is the result of chromosomal recombination or replacement involving ST8 and ST30 parents, whereas CC34 strains have a mosaic genome with contributions from ST30 and ST10/ST145 (Holtfreter et al., 2016). While the mechanisms underlying such recombination or replacement events are unclear, Robinson and Enright (2004) showed that they may comprise 20% of the bacterial chromosome without the obvious involvement of MGEs in facilitating the process.
A consequence of replacement of a large section of the bacterial chromosome can be that a given spa‐type, associated with a particular lineage of MRSA as determined by multi‐locus sequence typing, subsequently becomes associated with a new sequence type, because the genes examined by MLST have been replaced.
The occurrence of mosaic strains is relevant to the monitoring performed in 2016 because spa‐types that have been reported in mosaic strains were detected. Thus, spa‐type t153 can be associated with either ST10/ST145 or CC34 and spa‐type t037 can be associated with either ST30 or ST239. The spa‐types that can be associated with different sequence types comprise an extremely low proportion of the total number of MRSA isolates which were reported; full characterisation of these isolates would require further molecular typing.
Switzerland performed annual MRSA surveillance in fattening pigs at slaughter from 2009 to 2015 and, although no data were reported for 2016, a recent study described the temporal occurrence of MRSA in pig farms in western Switzerland in 2008 and 2015 (Kraemer et al., 2017). During this investigation, nasal swabs and faecal samples were collected from piglets, and farmers were asked to complete a questionnaire regarding antibiotic usage and provide nasal and stool samples. The authors document that in 2008, the prevalence of MRSA in Swiss pig farms was very low compared to many other European countries. The prevalence of pig farms positive for MRSA increased between 2008 and 2015 (from 7.3% to 31%); an increase in nasal swabs yielding MRSA was also observed in pig farm workers (from 6.6% to 12%). Kraemer et al. (2017) also performed sampling of airborne bacteria in piggeries in 2008 and found that 2.7% of farms sampled by this means were positive for MRSA, whereas 20.7% of farms were positive in 2015. The presence of MRSA in air or dust can be a route of MRSA exposure to pig farm workers.
Tetracycline resistance was extremely high in MRSA isolates from Belgian pigs, which was expected as tetracycline resistance is commonly observed in LA‐MRSA CC398 (Crombé et al., 2013) and when spa‐typing was performed, spa‐types associated with CC398 predominated. Macrolides and lincosamides are used for the treatment of common infections in pigs (Conceição et al., 2017), and a higher prevalence of resistance to each of these compounds was reported in Belgium in fattening animals compared to breeding animals, probably relating to differences in the level of use between these two pig categories. A similar, although less marked difference between these categories was also noted for tiamulin. Different genes may confer resistance to erythromycin and clindamycin in LA‐MRSA CC398 and both erm and lnu genes have been reported in this MRSA lineage; erm genes usually confer resistance to both compounds when constitutively expressed, whereas the lnu genes confer resistance only to the lincosamides. Molecular investigation could be performed to further characterise the resistance phenotypes which were reported. Ciprofloxacin resistance showed the reverse trend, the prevalence of ciprofloxacin resistance being higher in breeding pigs than in fattening pigs from Belgium and this may again be related to differences in usage levels between the two different types of pigs.
cfr gene conferring resistance to linezolid.
Linezolid is one of the last‐resort antimicrobial agents for the treatment of highly resistant MRSA infections in humans and can be administered both orally and parenterally; resistance levels are low, with global surveillance studies reporting the prevalence of linezolid resistance in S. aureus to be < 1% (Gu et al., 2013). Resistance to linezolid was reported in MRSA spa‐type t011 from breeding pigs in Belgium in the EU Summary Report on AMR for 2013 and in 2016 two further LA‐MRSA isolates from breeding pigs in Belgium were reported to be linezolid resistant. These were both spa‐type t011, sequence type CC398 and both isolates showed a similar resistance pattern (Table 60) of resistance to linezolid, tiamulin, clindamycin and chloramphenicol. This pattern of resistance is typical of that conferred by the cfr gene. Further investigation by Belgian colleagues revealed no mutations in the 23S rRNA and L3/L4 ribosomal proteins that could account for linezolid resistance; they were shown to harbour the (plasmid‐borne) cfr gene.
The detection of cfr in MRSA t011 from breeding pigs is significant because of the importance of linezolid in treating highly resistant MRSA infections in humans. Linezolid can be administered orally to human patients and is consequently suitable for use in patients in the community. The finding has possible implications for future surveillance in animals because the number of countries which have reported susceptibility data on MRSA in animals is low; more widespread testing would indicate whether the detection of cfr is a localised phenomenon or occurs more widely in MRSA in the animal population. The findings also have wider significance because coagulase‐negative staphylococci can also harbour cfr resistance and may form a reservoir of this resistance gene, which can subsequently be transferred to S. aureus (Shen et al., 2013). A comprehensive monitoring programme covering MRSA in animals might therefore also need to include an assessment of the occurrence of cfr resistance in coagulase‐negative staphylococci. Shen et al. (2013) also documented that plasmids carrying the cfr gene, especially in staphylococci, frequently harbour additional resistance genes.
spa‐types associated with each type of MRSA (LA‐MRSA, HA‐MRSA and CA‐MRSA) were reported from companion animals in 2016; denominator data were not provided. In two pet cats from Sweden, spa‐type t008 and t304 were reported; neither were sequence typed. spa‐type t008 is associated with ST8 and is usually considered a HA‐MRSA. The isolate was however reported to be PVL‐positive suggesting a community‐associated lineage as these frequently possess the PVL toxin, which may confer an increase in virulence, although, the exact role of the PVL toxin has been debated (Chadwick et al., 2013). This spa‐type and sequence type combination is seen in isolates of the globally significant CA‐MRSA USA300 strain, which is PVL‐positive. The CA‐MRSA USA300 strain can cause severe infections in humans and has a markedly different epidemiology from HA‐MRSA strains (Tenover and Goering, 2009). Further molecular typing (presence of the arginine catabolic mobile element) would be needed to determine if the t008 isolate shows all of the characteristic traits which are typical of the CA‐MRSA USA300 strain. Tenover and Goering (2009) stated that animals are at risk of acquiring USA300 infections, although they are more likely to be the unfortunate recipients from their human handlers rather than a significant reservoir for disease (Tenover and Goering, 2009). The other feline MRSA isolate, spa‐type t304, can be associated with sequence types, ST6 and ST8, and the isolate was confirmed PVL‐negative indicating a healthcare‐associated MRSA. Both ST6‐MRSA‐t304‐PVL‐negative and ST8‐MRSA‐t304‐PVL‐negative strains have been identified in the Norwegian human population during a study conducted by Akershus University Hospital (Blomfeldt et al., 2016). All MRSA‐t304 isolates detected in a region constituting ~ 25% of the Norwegian population were genotyped (including molecular outbreak investigations) from 2000 to 2013. ST6 was found to appear in two individuals in 2008–2009 and then in seven others in 2011–2012. ST6 is genetically different from ST8 sharing only two of seven MLST alleles (Blomfeldt et al., 2016). Denmark has also previously reported a healthcare‐associated MRSA outbreak due to spa‐type t304, ST6 (PVL‐negative) over 2010–12 which was spread in neonatal hospital wards in Copenhagen (Bartels et al., 2015). Considering MRSA cases reported in dogs, Sweden reported isolation of spa‐type t044 from an infected surgical wound on a pet dog. This spa‐type can be associated with ST80 (CA‐MRSA) and ST9 (LA‐MRSA). The t044 isolate was reported as PVL‐positive and this suggests it belongs to ST80 (CA‐MRSA). ST80‐MRSA‐t044‐PVL‐positive are typical of the widely disseminated European clone of community‐associated MRSA, although further molecular testing would be needed to definitively confirm this. Resistance to fusidic acid, tetracycline and kanamycin are all strongly associated with the European CA‐MRSA clone (Stegger et al., 2014); resistance to fusidic acid and tetracycline were reported in this isolate, although susceptibility to kanamycin was recorded. Detection of CA‐MRSA and HA‐MRSA within these companion animals could represent colonisation with human MRSA strains rather than persistent establishment within these species. This idea is supported by the occurrence of these spa‐types in the Swedish human population. Livestock‐associated MRSA was reported in Sweden from a pet dog (spa‐type t034) and from a horse (spa‐type t1451); both spa‐types are associated with CC398 and the isolates were resistant to tetracyclines, which as previously stated is a typical feature of animal lineages of CC398. Köck et al. (2017) documented that LA‐MRSA CC398 has recently emerged as a significant cause of primarily nosocomial infections in horses.
mecC‐meticillin‐resistant Staphylococcus aureus reported in 2016.
Sweden reported four mecC‐MRSA isolates from clinical investigations; spa‐type t9268 from three goats and t3391 from a wild hedgehog. Although these isolates were not sequence typed, spa‐type t9268 is associated with CC130 (SVARM, 2011), and t3391 is associated with CC2361 (Petersen et al., 2013; Bengtsson et al., 2017) and CC1943 (SVARM, 2011; Stegger et al., 2012). The caprine mecC‐MRSA isolates (t9268) were part of an outbreak that involved 19 goats and 4 sheep, in which a goat with dermatitis was identified as a MRSA carrier and subsequent contact tracings were identified; the animals were subsequently culled. This outbreak indicates an epidemiological link between all MRSA‐positive animals through direct or indirect contact. Resistance to non‐β‐lactam antibiotics is currently uncommon among mecC‐MRSA isolates (Paterson et al., 2014) and, typically, the t3391 and t9268 isolates from clinical investigations were susceptible to non‐β‐lactams. Paterson et al. (2014) comment that the majority of mecC‐MRSA show resistance to cefoxitin and are susceptible to oxacillin; in this instance, all isolates were resistant to cefoxitin, 2/3 caprine isolates were susceptible to oxacillin and the hedgehog isolate was oxacillin‐resistant.
Bengtsson et al. (2017) examined swabs from wild hedgehogs from wildlife rescue centres in three regions of Sweden. mecC‐MRSA was isolated from 64% of 55 wild hedgehogs and eight different spa‐types were identified; t3391 isolates were recorded from two out of three regions sampled and spa‐type t843 was most commonly found (49%). Of 35 mecC‐MRSA isolates, all were resistant to penicillin, all but one isolate showed resistance to cefoxitin, and susceptibility to other β‐lactams varied (12/35 were resistant to cephalothin and 28/35 were resistant to oxacillin). These results demonstrate that oxacillin is a less reliable marker than cefoxitin for detection of mecC‐MRSA and that not all isolates may display cefoxitin resistance. The occurrence of mecC‐MRSA in the sampled hedgehogs supports the hypothesis that wildlife may constitute a reservoir of mecC‐MRSA, although the hedgehogs sampled during this study were affected by varying degrees of debilitation (which might influence the occurrence of mecC‐MRSA) and nosocomial spread between hedgehogs at centres could not be ruled out (Bengtsson et al., 2017).
Both spa‐types t3391 and t9268 mecC‐MRSA have previously been observed in humans (SVARM, 2011; Swedres‐Svarm, 2016) and possible transmission between humans and animals is well documented (Harrison et al., 2013; Petersen et al., 2013; Angen et al., 2017). Angen et al. (2017) identified the first case of mecC‐MRSA in domesticated pigs and findings strongly indicated transmission between farmers and pigs.
Surveillance of human LA‐MRSA CC398 isolates within EU/EEA countries in 2013.
A recent report provides valuable insights regarding surveillance of LA‐MRSA within the European human population. Data on the occurrence of human LA‐MRSA isolates from 2013 were collated (using questionnaires) by the European Centre for Disease Prevention and Control (ECDC) from national/regional laboratories in European Union/European Economic Area (EU/EEA) countries. Following the selected surveillance period of 2013, considerable media attention focused on MRSA due to the death of four people from LA‐MRSA CC398 in Denmark, in 2014. LA‐MRSA is of well‐recognised public health importance, highlighted by the high number of countries participating in this survey. Furthermore, the increasing detection and geographical dispersion of human LA‐MRSA reported during this surveillance period underlines the evolving situation, with the authors recommending that periodic systematic surveillance be considered to monitor the situation. They also propose that veterinary sources be included in such one‐health surveillance to identify possible reservoirs/transmission pathways, providing useful information for prevention and control. MLST is considered a benchmark in molecular typing techniques to characterise isolates, and within this survey, not all reference laboratories used this method; spa‐typing was the method most widely used. However, when possible, extended molecular testing should also be adopted to distinguish between ‘human‐adapted’ and ‘livestock‐adapted’ clades of MRSA CC398; within this survey, ‘human‐adapted’ strains were identified due to the presence of the PVL toxin and/or the immune evasion cluster and/or tetracycline susceptibility. The authors also recommend that when countries do not have this ability to characterise strains in detail, cross‐border collaborations could be considered (Kinross et al., 2017).
In summary, the monitoring of MRSA in 2016 has provided extremely useful information on the occurrence of MRSA in livestock and food. The situation continues to develop and evolve and there is a clear requirement for continued monitoring and appropriate molecular characterisation of MRSA isolates recovered from livestock and food. Molecular characterisation is becoming increasingly necessary to fully evaluate the significance of MRSA isolates and there are limitations to the analyses which can be performed when spa‐typing is used as the only technique to characterise isolates. The detection of all three types of MRSA from companion animals (LA‐MRSA, HA‐MRSA and CA‐MRSA), and the isolation of two linezolid‐resistant strains harbouring the cfr gene from pigs both highlight that the situation is constantly evolving. Most reporting countries have not reported the susceptibility of the MRSA isolates which were detected and as linezolid is an important compound in human medicine for the treatment of MRSA, it will be important to establish whether linezolid resistance is widespread or more localised in distribution. Monitoring also includes some new findings: MRSA spa‐types t1190 and t153 were reported from rabbit and broiler chicken meat, respectively, and methicillin resistance appears not to have been reported previously in these spa‐types. Furthermore, useful information on the LA‐MRSA situation may be obtained by conducting a broader survey of free‐range pig herds; as although sampling size was small, the DANMAP 2016 report indicated that LA‐MRSA is less well maintained in these herds compared with conventional pig herds (DANMAP, 2016).
7. Extended‐spectrum β‐lactamase (ESBL)‐, AmpC‐ and/or carbapenemase‐producing Salmonella and Escherichia coli
Resistance to third‐generation cephalosporins: the importance of extended‐spectrum β‐lactamases (ESBLs), AmpC enzymes and carbapenemases.
Enterobacteria may become resistant to extended‐spectrum cephalosporins due to several different mechanisms, the most common being the production of β‐lactamases. ESBLs and AmpC β‐lactamases are enzymes that hydrolyse extended spectrum β‐lactam antimicrobials. Bacteria which produce ESBL/AmpC enzymes are usually resistant to many or all third‐generation cephalosporins, which are highest priority critically important antimicrobials (Collignon et al., 2016; WHO, 2016) for the treatment of systemic or invasive Gram‐negative bacterial infections in humans. Apart from their widespread use to treat E. coli infections, these drugs play a critical role in the treatment of certain invasive Salmonella infections, particularly in children and immunosuppressed patients. Occurrence of ESBLs and acquired AmpC (aAmpC) β‐lactamases in Gram‐negative bacteria is considered a public health concern (EFSA BIOHAZ Panel, 2011).
β‐Lactamases are encoded by genes that can be located on plasmids (mobile genetic elements) or on the bacterial chromosome. Based on structural similarities (amino acid content) they are subdivided into four classes, designated A–D in the Ambler's classification: ESBL enzymes of the TEM, SHV and CTX‐M families belong to class A, ESBL enzymes of the OXA‐family are included in class D, while class C includes the AmpC β‐lactamases. Some bacterial species have naturally intrinsic β‐lactamase encoding genes on their chromosome (often referred as chromosomal, ‘c’). Acquired (‘a’) β‐lactamases are gained by gene transfer between bacteria. Genes located on the chromosome or plasmids will be usually maintained within the bacterial generation – clonal spread – whereas genes located on mobile genetic elements (plasmids, transposons, integrons) can be further spread to other bacteria by horizontal gene transfer.
The occurrence of β‐lactamases in Salmonella and E. coli (both pathogens and commensals) is mostly due to the acquisition of genes usually from other Enterobacteriaceae by conjugation and to a lesser extent, transduction. The clonal spread of ESBL‐ or AmpC‐carrier bacteria is also important (i.e. international high‐risk clones like E. coli ST131 carrying the ESBL enzyme CTX‐M‐15 in humans; Rogers et al., 2011; Mathers et al., 2015). E. coli also possesses intrinsic AmpC β‐lactamase encoding genes that, in some circumstances can be activated (i.e. through mutations in the promotor regions), and also confer resistance to third‐generation cephalosporins. In contrast, wild‐type Salmonella does not possess endogenous β‐lactamase‐encoding genes. Although all four different types of β‐lactamase classes have been found in Salmonella and E. coli, within the EU, the most important mechanism of resistance to third‐generation cephalosporins in these bacterial species is the production of ESBLs followed by the production of aAMPC, although fluctuations in the level of occurrence or differences between countries and sectors may be expected. Commensal bacteria, such as indicator E. coli, may contribute to the dissemination of ESBLs/aAmpC, as these resistance mechanisms are usually transferable.
The emergence during the last years of resistance to carbapenems, which are regarded as last‐line antimicrobials in human medicine, is also considered as an important public health concern. Carbapenems are used for the treatment of highly resistant infections in humans, including, the treatment of infections with Gram‐negative bacteria producing ESBLs. Resistance to carbapenems in Gram‐negative bacteria is mainly related to the production of carbapenemases (β‐lactamases) and the acquisition of carbapenemase‐encoding genes, although other mechanisms (i.e. related to cell permeability) also exist. The most frequent β‐lactamases with carbapenemase activity can be found in class A (KPC), class D (OXA‐type carbapenemases) and class B (metallo‐ β‐lactamases like NDM, VIM and IMI) of Ambler's classification. Although carbapenem antimicrobials are not used in food‐producing animals in the EU, resistance has occasionally been detected in bacteria carried by animals (EFSA BIOHAZ Panel, 2013; Woodford et al., 2013; Guerra et al., 2014, Madec et al., 2017), and dissemination from humans to animals directly or through environmental routes is suspected.
Considering the public health relevance of resistance to third‐/fourth‐generation cephalosporins, and carbapenem compounds, European legislation on harmonised monitoring of antimicrobial resistance in food‐producing animals and food (Commission implementing Decision 2013/652/EU) has laid down mandatory monitoring of resistance to representative substances of these antimicrobial classes in Salmonella and indicator E. coli from 2014 onwards. All Salmonella and indicator E. coli isolates exhibiting microbiological resistance to cefotaxime, ceftazidime or meropenem are subsequently subjected to further testing using a supplementary panel of substances to obtain more detailed phenotypic characterisation of any resistance detected to third‐generation cephalosporins and/or the carbapenem compound meropenem (Table 8, Material and Methods).
Rationale for the choice of substances included in the supplementary panel (panel 2)
Cefotaxime and ceftazidime have been included in the supplementary panel because, although most ESBL confer resistance to both compounds, some ESBL enzymes primarily confer resistance to one or the other compound.
Confirmatory synergy testing has been also included so that an ESBL phenotype may be identified.
Cefoxitin has been also included so that an AmpC phenotype may be identified.
Meropenem, imipenem and ertapenem have been included so that putative carbapenemase producers may be identified.
Temocillin (6‐α‐methoxy‐ticarcillin) efficacy is unaffected by most ESBL and AmpC enzymes and this substance may be particularly useful in human medicine to treat urinary tract infections caused by ESBL‐producing Gram‐negative organisms (Giske, 2015). Susceptibility to temocillin enables further phenotypic characterisation of carbapenemases.
The results of such further testing allows the inference of the presumptive class of β‐lactamase enzyme which are responsible for conferring the phenotypic profile of resistance to third‐generation cephalosporins or meropenem detected, providing additional epidemiological information.
The routine monitoring of indicator E. coli and Salmonella spp. performed by all MSs, as well as Iceland, Norway and Switzerland did not use selective primary isolation media containing cephalosporins, so the results on occurrence and prevalence of resistance to these antimicrobials generally relate to organisms selected at random from primary culture media. In 2016, the ‘specific’ monitoring of ESBL‐/AmpC‐/carbapenemase‐producing E. coli (by using selective media containing cephalosporins) was also performed on a mandatory basis by all MSs excepting Malta, as well as Iceland, Norway and Switzerland. The corresponding results are presented below. Nineteen MSs and Switzerland also reported results of a ‘specific’ monitoring of carbapenemase‐producing microorganisms (by using selective media containing carbapenems), performed voluntarily. The Netherlands also reported data for this monitoring performed using different isolation methods.
Identification of presumptive ESBL, AmpC and/or carbapenemase producers (see also Materials and methods section).
To infer the class of beta‐lactamase enzyme responsible for conferring the phenotypic profile of resistance to third‐generation cephalosporins or meropenem detected, the EUCAST guidelines for detection of resistance mechanisms and specific resistances of clinical and/or epidemiological importance (EUCAST, 2013) were applied. A screening breakpoint for cefotaxime and/or ceftazidime (> 1 mg/L) was applied to screen for ESBL and AmpC producers, as these isolates typically (with only a few exceptions) show MICs for cefotaxime and/or ceftazidime > 1 mg/L, whereas different resistance mechanisms are expected in the microbiologically resistant isolates (MIC > ECOFFs) exhibiting MICs lower than the screening breakpoint. Some of the countries also voluntarily reported results from the detection of ESBL‐/AmpC‐resistance genes in the third‐generation cephalosporin‐resistant isolates. These data were included with the classifications made on the basis of resistance phenotype. For the occurrence and prevalence tables shown in this section, presumptive ESBL producers were considered as those exhibiting an ESBL and/or ESBL/AmpC phenotype, and presumptive AmpC producers, those with an AmpC and AmpC/ESBL phenotype.
7.1. Presumptive ESBL/AmpC/CP producers in Salmonella spp. from humans (voluntary testing and reporting)
7.1.1. Distribution of ESBL, AmpC and CP phenotypes in Salmonella by country
In 2016, 223 of the 13,610 Salmonella isolates from humans (1.6%, 23 MSs, plus Iceland and Norway), tested for either cefotaxime and/or ceftazidime, were ‘microbiologically’ resistant to either or both antimicrobials. Twelve MSs (of 20 reporting any resistance to cephalosporins) and one non‐MS further tested all or some of their suspected isolates for the presence of ESBL and/or AmpC. ESBL‐producing Salmonella were identified in 0.8% of the tested isolates in the EU MSs with the highest occurrence in Malta (7.7%), Belgium (1.6%) and Ireland (1.2%) (Table 61). AmpC was less frequent, identified in 0.1% of tested isolates. One isolate carrying the AmpC bla CMY‐2 gene did not seem to express the gene when tested phenotypically, so was classified as an atypical phenotype. No isolates were reported to be both AmpC + ESBL and no isolates were reported resistant to carbapenems, although it should be noted that meropenem resistance was interpreted with clinical breakpoints in seven of 23 reporting countries.
Table 61.
ESBL and AmpC phenotypes in Salmonella spp. isolates from humans by country, 2016
| Country | Total Salmonella tested for CTX and/or CAZ | CTX‐ and/or CAZ‐R | Phenotype | Serovars | |||||||
|---|---|---|---|---|---|---|---|---|---|---|---|
| ESBL | AmpC | AmpC + ESBL | Atypical phenotype | ||||||||
| N | N | N | % | N | % | N | % | N | % | ||
| Austria | 1,460 | 8 | 8 | 0.5 | Typhimurium (4), Infantis (2), Braenderup (1), Haifa (1) | ||||||
| Belgium | 984 | 17 | 16 | 1.6 | Typhimurium (7), monophasic Typhimurium (5), Enteritidis (2), Infantis (2), Kentucky (1). Not tested (1) | ||||||
| Cyprus | 106 | 1 | 1 | 0.9 | Blockley (1) | ||||||
| Denmark | 481 | 1 | 1 | 0.2 | Monophasic Typhimurium (1) | ||||||
| France | 852 | 5 | 1 | 0.1 | Enteritidis (1). ‘Only’ β‐lactamase (1), not tested (3) | ||||||
| Greece | 246 | 2 | 1 | 0.4 | Undefined (1). Not tested (1) | ||||||
| Ireland | 214 | 4 | 3 | 1.4 | 1 | 0.5 | Agona (1), Anatum (1), monophasic Typhimurium (1), unknown (1) | ||||
| Luxembourg | 108 | 1 | 1 | 0.9 | Kentucky (1) | ||||||
| Malta | 181 | 14 | 14 | 7.7 | Kentucky (13), Infantis (1) | ||||||
| Romania | 212 | 3 | 2 | 0.9 | 1 | 0.5 | Typhimurium (2), Enteritidis (1) | ||||
| Spain | 1,416 | 24 | 10 | 0.7 | Monophasic Typhimurium (5), Typhimurium (3), Enteritidis (1), Saintpaul (1). Not tested (14) | ||||||
| United Kingdom | 1,559 | 32 | 1 | 0.1 | 3 | 0.2 | 1 | 0.1 | Typhimurium (3), Minnesota (1), undefined (1). ‘Only’ β‐lactamase (1), not tested (27) | ||
| Total (12 MSs) | 7,819 | 112 | 59 | 0.8 | 5 | 0.1 | 1 | 0.0 | |||
| Norway | 223 | 2 | 2 | 0.9 | Newport (1), Saintpaul (1) | ||||||
ESBL: extended‐spectrum β‐lactamase; N = isolates with this phenotype; %: percentage of isolates with this phenotype from the total tested; CTX: cefotaxime; CAZ: ceftazidime; MSs: Member States.
7.1.2. Distribution of ESBL, AmpC and CP phenotypes in Salmonella by serovars
When assessing the same data by serotype, ESBL was most commonly found in S. Blockley (25.0%) and S. Kentucky (16.3%), however for S. Blockley, few isolates had been tested (Table 62). Only one S. Kentucky isolate had been further genotyped, and was found to be CTX‐M‐9/14‐like. ESBL was more commonly detected in S. Typhimurium (1.4%) and monophasic S. Typhimurium 1,4,[5],12:i:‐ (1.3%) than in S. Enteritidis (0.2%) and a variety of genes and gene combinations were reported from all three serovars. Serovar information was provided for four of the six Salmonella isolates reported to carry AmpC‐type β‐lactamases and these were S. Anatum, S. Minnesota and S. Typhimurium.
Table 62.
ESBL and AmpC phenotypes and genotypes in Salmonella spp. isolates from humans by serovar, 2016
| Serovar | Tested for CTX and/or CAZ | CTX‐ and/or CAZ‐R | Phenotype | Genotype | |||||||
|---|---|---|---|---|---|---|---|---|---|---|---|
| ESBL | AmpC | AmpC + ESBL | Atypical phenotype | ||||||||
| N | N | N | % | N | % | N | % | N | % | ||
| Agona | 41 | 1 | 1 | 2.4 | CTX‐M‐15 | ||||||
| Anatum | 11 | 1 | 1 | 9.1 | DHA‐1 | ||||||
| Blockley | 4 | 1 | 1 | 25.0 | |||||||
| Braenderup | 29 | 1 | 1 | 3.4 | CTX‐M‐1 | ||||||
| Enteritidis | 2,302 | 7 | 5 | 0.2 | CTX‐M‐1, CTX‐M‐3, CTX‐M‐5, CTX‐M‐15 (2), TEM‐1 | ||||||
| Haifa | 18 | 1 | 1 | 5.6 | CTX‐M‐1, CTX‐M‐9 | ||||||
| Infantis | 220 | 5 | 5 | 2.3 | CTX‐M‐1 (3), CTX‐M‐9, TEM | ||||||
| Kentucky | 92 | 16 | 15 | 16.3 | CTX‐M‐9/14‐like (1) | ||||||
| Minnesota | 1 | 1 | 1 | 100 | CMY‐2 | ||||||
| Monophasic Typhimurium 1,4,[5],12:i:‐ | 892 | 18 | 12 | 1.3 | CTX‐M‐1‐like, CTX‐M‐9 (4), CTX‐M‐15 (2), CTX‐M‐32, CTX‐M‐55, SHV‐12 (3), TEM‐1 (7) | ||||||
| Newport | 118 | 1 | 1 | 0.8 | |||||||
| Saintpaul | 94 | 2 | 2 | 2.1 | SHV‐12 | ||||||
| Typhimurium | 990 | 20 | 14 | 1.4 | 2 | 0.2 | CMY‐2 (2), CTX‐M‐1 (6), CTX‐M‐5 (1), CTX‐M‐9 (3), CTX‐M‐9/14 (3), OXA‐1 (1), TEM‐1 (6) | ||||
ESBL: extended‐spectrum β‐lactamase; N = isolates with this phenotype; %: percentage of isolates with this phenotype from the total tested; CTX: cefotaxime; CAZ: ceftazidime; MSs: Member States; R: resistant.
7.2. Routine antimicrobial resistance monitoring in poultry and their meat products: presumptive ESBL/AmpC/CP producers
7.2.1. ESBL/AmpC/CP phenotypes identified in Salmonella spp. collected within the routine AMR monitoring from poultry and their meat products
As shown in Salmonella spp. (Chapter 3), in 2016 third‐generation cephalosporin resistance was not detected or was reported at low levels in Salmonella isolates collected according to Decision 2013/652/EU from meat from broilers (4 out of 19 reporting MSs; 2.6% cefotaxime resistance), broilers (8 out of 22 MSs; 0.8% cefotaxime resistance), turkey meat (1 out of 8 MSs; 1% cefotaxime resistance), fattening turkeys (1 out of 15 MSs; 0.9% cefotaxime resistance) and laying hens (1 out of 22 MSs; 0.1% cephalosporin resistance) that were tested with the Panel 1 of antimicrobials (Tables SALMBRMEATD, SALMBRD, SALMTURKMEATD, SALMTURKD and SALMLAYD). The resistant isolates were subjected to supplementary β‐lactams susceptibility testing (panel 2; Tables SALMBRMEATD2, SALMBRD2, SALMTURKMEATD2, SALMTURKD2 and SALMLAYD2). From the results obtained when testing the isolates with Panel 2, ESBLs, AmpC and ESBLs + AmpC and CP phenotypes were inferred.
The proportion of Salmonella spp. isolates from poultry and their meat products collected within the routine monitoring in the MSs and considered as presumptive ESBL, AmpC, ESBL + AmpC producers was very low as only 43 isolates (out of 4,654 tested by all reporting MSs, 0.9%) from meat from broilers, broilers, meat from turkeys and fattening turkeys presented any of these phenotypes. The highest number of presumptive ESBL producers was found in meat from broilers (16 isolates, 2.1%) (Table 63).
Table 63.
Summary of presumptive ESBL‐, and AmpC‐producing Salmonella spp. isolates from meat from broilers, broilers, meat from turkeys, fattening turkeys and laying hens collected within the routine monitoring in 2016
| Matrix | Presumptive ESBL and/or AmpC producersa n (%R) | Presumptive ESBL producersb n (%R) | Presumptive AmpC producersc n (%R) | Presumptive ESBL+AmpC producers n (%R) | Presumptive CP producers n (%R) |
|---|---|---|---|---|---|
| Humans (N = 8,746, 13 MSs) | 76 (0.9) | 70 (0.8) | 5 (0.1) | 0 (< 0.01) | 0 (< 0.01) |
| Meat from broilers (N = 763, 19 MSs) | 19 (2.5) | 16 (2.1) | 5 (0.7) | 2 (0.6) | 0 (< 0.48) |
| Broilers (N = 1,717, 22 MSs) | 14 (0.8) | 11 (0.6) | 3 (0.2) | 0 (< 0.21) | 0 (< 0.21) |
| Meat from turkeys (N = 295, 8 MSs) | 3 (1.0) | 3 (1.0) | 1 (0.3) | 1 (0.3) | 0 (< 1.3) |
| Fattening turkeys (N = 663, 11 MSs) | 6 (0.9) | 6 (0.9) | 0 (< 0.6) | 0 (< 0.6) | 0 (< 0.6) |
| Laying hens (N = 1,216, 22 MSs) | 1 (0.1) | 1 (0.1) | 0 (< 0.3) | 0 (< 0.3) | 0 (< 0.3) |
N: Total number of isolates reported for this monitoring by the MSs; n: number of the isolates resistant; % R: percentage of resistant isolates; ESBL: extended‐ spectrum β‐lactamase. MS: EU Member States.
Isolates exhibiting only ESBL‐ and/or only AmpC‐ and/or ESBL+AmpC phenotype.
Isolates exhibiting an ESBL‐ and ESBL+AmpC phenotype.
Isolates exhibiting an AmpC‐ and ESBL+AmpC phenotype.
The ESBL or AmpC phenotype was particularly associated with certain serovars, suggesting possible clonal expansion of particular strains.
Salmonella spp. isolates with an ESBL phenotype (Table 64) were detected in meat from broilers in Belgium (one isolate Salmonella spp., one Paratyphi B dT+), the Netherlands (one isolate S. Paratyphi B dT+) and Portugal (13 isolates, all S. monophasic Typhimurium); in broilers in the Czech Republic (one S. Infantis), Hungary (two S. Infantis), Italy (three S. Infantis), Malta (one S. Kedougou), Portugal (one S. monophasic Typhimurium), Slovakia (one S. Typhimurium), and Spain (one S. Montevideo and one S. Grumpensis); in meat from turkeys and fattening turkeys in Spain (two S. Bredeney; five S. Agona and one S. Bredeney, respectively); and in laying hens in Malta (one S. Colorado).
Table 64.
Presumptive ESBL‐ and AmpC‐producing Salmonella spp. isolates from meat from broilers, broilers, meat from turkeys, fattening turkeys and laying hens collected within the routine monitoring and subjected to supplementary testing (panel 2) in 2016a
| Presumptive resistance phenotype | ||||||||||||||
|---|---|---|---|---|---|---|---|---|---|---|---|---|---|---|
| Country | Total number tested P1 | Total number tested P2 | ESBLb | ESBL only CLA/CTX SYNc | ESBL only CLA/CAZ SYNd | AmpCe | AmpC + ESBLf | CPsg | ||||||
| n | %h | n | %h | n | %h | n | %h | n | %h | n | %h | |||
| Meat from broilers | ||||||||||||||
| Belgium i | 175 | 7 | 2 | 1.1 | 1 | 0.6 | – | – | 3 | 1.7 | 1 | 0.6 | – | – |
| Hungary | 76 | 1 | – | – | – | – | – | – | 1 | 1.3 | – | – | – | – |
| Netherlands | 25 | 1 | 1 | 4.0 | – | – | – | – | 1 | 4.0 | 1 | 4.0 | – | – |
| Portugal | 33 | 13 | 13 | 39.4 | – | – | – | – | – | – | – | – | – | – |
| Total (4 MSs) | 309 | 22 | 16 | 5.2 | 1 | 0.3 | – | – | 5 | 1.6 | 2 | 0.6 | – | – |
| Broilers | ||||||||||||||
| Czech Republic | 91 | 1 | 1 | 1.1 | – | – | – | – | – | – | – | – | – | – |
| Hungary | 170 | 4 | 2 | 1.2 | 1 | 0.6 | – | – | 2 | 1.2 | – | – | – | – |
| Italy (j) | 25 | 3 | 3 | 12.0 | 1 | 4.0 | – | – | – | – | – | – | – | – |
| Malta i | 80 | 2 | 1 | 1.3 | 0 | – | – | – | – | – | – | – | – | |
| Portugal | 51 | 1 | 1 | 2.0 | 0 | – | – | – | – | – | – | – | – | |
| Romania | 170 | 1 | 0.0 | 0 | – | – | 1 | 0.6 | – | – | – | – | ||
| Slovakia | 53 | 1 | 1 | 1.9 | 0 | – | – | – | – | – | – | – | – | |
| Spain | 169 | 2 | 2 | 1.2 | 2 | 1.2 | – | – | – | – | – | – | – | – |
| Total (9 MSs) | 443 | 15 | 11 | 2.5 | 4 | 0.9 | – | – | 3 | 0.7 | – | – | – | – |
| Meat from turkeys | ||||||||||||||
| Spain | 46 | 3 | 3 | 6.5 | 3 | 6.5 | – | – | 1 | 2.2 | 1 | 2.2 | – | – |
| Fattening turkeys | ||||||||||||||
| Spain | 171 | 6 | 6 | 3.5 | 4 | 2.3 | – | – | – | – | – | – | – | – |
| Laying hens | ||||||||||||||
| Malta | 52 | 1 | 1 | 1.9 | – | – | – | – | – | – | – | – | – | – |
ESBL: extended‐spectrum β‐lactamase; n: isolates with this phenotype; %: percentage of isolates with this phenotype from the total tested; SYN: synergy; CTX: cefotaxime; CAZ: ceftazidime; CLA: clavulanate. MSs: Member States.
According to EUCAST Guidelines (EUCAST, 2013), only isolates showing an MIC > 1 mg/L for cefotaxime and/or ceftazidime (screening breakpoint) were considered (see Materials and Methods chapter 2).
All isolates showing clavulanate synergy with cefotaxime, ceftazidime or with both compounds, suggesting the presence of an ESBL (independently of the presence of other mechanisms).
Isolates showing synergy with cefotaxime only, suggesting the presence of an ESBL with cefotaximase activity.
Isolates showing synergy with ceftazidime only, suggesting the presence of an ESBL with activity.
Isolates with microbiological resistance to cefoxitin, suggesting the presence of an AmpC enzyme (independently of the presence of other mechanisms).
Isolates showing synergy with cefotaxime or ceftazidime and with microbiological resistance to cefoxitin, suggesting the presence of ESBL and AmpC enzymes in the same isolate. These isolates are also included in the ESBL and AmpC columns.
Isolates with microbiological meropenem resistance.
Percentage of the total number of Salmonella spp. isolates tested (with panel 1).
It includes isolates microbiologically resistant to cefotaxime and/or ceftazidime but with MIC ≤ 1 mg/L for both antimicrobials, suggesting the presence of other mechanisms (as stated above, they were not further classified).
Molecular data were reported by Italy: 1 isolate CTX‐M.
Italy reported voluntarily 49 ESBL‐producing S. Infantis collected from broilers at slaughter (18 isolates) of from broiler farms (31 isolates) within their National Monitoring programme and sampled according to Decision 2013/652/EU (see text box below).
Isolates with an AmpC phenotype (Table 64) were detected in meat from broilers in Belgium (2 isolates Salmonella spp., 1 Paratyphi B dT+), Hungary (one S. Infantis) and the Netherlands (Paratyphi B dT+); in broilers in Hungary (one S. Infantis and one S. Mbandaka) and Romania (one S. Infantis); and in meat from turkeys in Spain (one S. Agona).
Some of the Salmonella spp. isolates mentioned above presented an ESBL and AmpC phenotype and were detected in meat from broilers in Belgium and the Netherlands (1 Paratyphi B dT+ from each country); and meat from turkeys in Spain (the S. Agona).
None of the Salmonella spp. isolates from poultry and their meat products collected within the routine monitoring was reported as microbiologically resistant to meropenem nor imipenem. Only one isolate from broiler meat reported by Belgium and one isolate from broilers reported by Slovakia were resistant to ertapenem (Tables SALMBRD2 and SALMBRMEATD2).
MDR and ESBL‐producing Salmonella Infantis (kindly provided by Italy).
In 2016, S. Infantis has been the first most frequently reported serovar in the flocks of broilers and in meat derived thereof and the second, in the flocks of laying hens and of fattening turkey flocks in the EU.
Over the last decade, MDR S. Infantis has increasingly been reported in food‐producing animals and in humans in Italy. In cross‐sectional studies performed in Italian broiler sector at slaughter in 2014 and 2016 (sampling frame: Commission Implementing Decision 2013/652/EU), S. Infantis accounted for 75% and 90% of all isolates detected, respectively, with an among flock prevalence of 9.6% (68/709) in 2014 and 8.7% (70/807) in 2016.
An emerging clone harbouring a megaplasmid (around 300 kbp) termed pESI, which carries virulence, fitness and MDR genes/traits, along with CTX‐M‐1 ESBL in an increasing proportion of isolates, was detected in these surveys (3/90 in 2014 and 16/77 in 2016 were MDR, ESBL‐producing S. Infantis, respectively).
The pESI‐positive, ESBL‐producing clone was retrospectively identified in the Italian poultry industry in isolates dating back 2011 and soon after as a cause of human salmonellosis (Franco et al., 2015). This emergence is however not limited to Italy and Europe, since a MDR pESI‐positive S. Infantis was firstly described in Israel (Aviv et al., 2014) and it has been also recently identified in chickens, cattle and humans in the USA through the routine NARMS surveillance program (Tate et al., 2017). However, it is necessary to highlight that these pESI‐positive isolates from the USA are phylogenetically different from the emerging ESBL‐producing clone detected in the Italian broiler chicken industry. Additionally, the USA isolates carry an ESBL gene (CTX‐M‐65) which is different from the CTX‐M‐1 gene of the ‘broiler chicken’ clone described in Italy, as already demonstrated previously in the Italian study.
On‐going EFSA co‐funded research project called ENGAGE (Establishing Next Generation sequencing Ability for Genomic analysis in Europe, www.engage-europe.eu) is currently exploring the European spread of this MDR pESI‐positive S. Infantis. Results will be made publicly available in the coming years.
7.2.2. Presumptive ESBL/AMPC/CP producers resistance phenotypes identified in Escherichia coli isolates collected within the routine AMR monitoring from poultry
As shown in the E. coli Chapter 5, in 2016, third‐generation cephalosporin resistance was not detected or was reported at low levels in indicator E. coli isolates from broilers (23 out of 27 reporting MSs; 4% cefotaxime resistance) and fattening turkeys (9 out of 11 reporting MSs; 2.7% cefotaxime resistance) that were tested with the Panel 1 of the antimicrobials (Tables ESCHEBRD and ESCHETURKD). The resistant isolates were subjected to supplementary β‐lactams susceptibility testing (panel 2, Tables ESCHEBRD2 and ESCHETURKD2). From the results obtained when testing the isolates with Panel 2, ESBLs, AmpC and ESBLs + AmpC and CP phenotypes were inferred.
The proportion of indicator E. coli isolates from poultry collected within the routine monitoring by the MSs considered as presumptive ESBL, AmpC, ESBL + AmpC producers was low or very low. In total, 230 isolates (out of 10,244 tested, 2.2%) from broilers and fattening turkeys presented any of these phenotypes. The highest number of ESBL producers was found in fattening turkeys (45 isolates, 2.6%) (Table 65).
Table 65.
Summary of presumptive ESBL‐, and AmpC‐producing E. coli isolates from broilers, and fattening turkeys collected within the routine monitoring in 2016
| Matrix | Presumptive ESBL and/or AmpC producersa n (%R) | Presumptive ESBL producersa n (%R)b | Presumptive AmpC producersc n (%R) | Presumptive ESBL+AmpC producers n (%R) | Presumptive CP producers n (%R) |
|---|---|---|---|---|---|
| Broilers (N = 8,530, 27 MS) | 184 (2.2) | 108 (1.3) | 89 (1.0) | 13 (0.2) | 0 (< 0.04) |
| Fattening turkeys (N = 1,714, 11 MS) | 46 (2.7) | 45 (2.6) | 2 (0.1) | 1 (0.1) | 0 (< 0.2) |
N: Total of isolates reported for this monitoring by the MSs; n: number of the isolates resistant; % R: percentage of resistant isolates; ESBL: extended‐ spectrum β‐lactamase. MS: EU Member States.
Isolates exhibiting only ESBL‐ and/or only AmpC‐ and/or ESBL+AmpC phenotype.
Isolates exhibiting an ESBL‐ and ESBL/AmpC phenotype.
Isolates exhibiting an AmpC‐ and ESBL/AmpC phenotype.
Presumptive ESBL and AmpC producers identified in indicator E. coli from broilers
For those countries reporting 3rd generation cephalosporin resistance, the proportion of all E. coli isolates from broilers (Table 66) with an ESBL phenotype was low or very low in all countries except Lithuania, where it was moderate (17%). Presumptive ESBL‐producing indicator E. coli isolates from broilers (108 out of 188 cephalosporin‐resistant isolates tested with the supplementary panel 2, 57.4% of those isolates) were detected in broilers from 19 out of 23 MSs with cephalosporin‐resistant isolates (Belgium, Bulgaria, Croatia, Cyprus, France, Germany, Greece, Hungary, Ireland, Italy, Latvia, Lithuania, the Netherlands, Poland, Portugal, Romania, Slovenia, Spain and Sweden). Significant numbers of isolates showed synergy with only one of the two indicator cephalosporins (mainly with cefotaxime) used in combination with clavulanate to detect synergy.
Table 66.
Presumptive ESBL and AmpC‐producing indicator E. coli isolates from broiler flocks collected within the routine monitoring and subjected to supplementary testing (Panel 2) in 2016a
| Country | Presumptive resistance phenotype | |||||||||||||
|---|---|---|---|---|---|---|---|---|---|---|---|---|---|---|
| Total number tested P1 | Total number tested P2 | ESBLb | ESBL only CLA/CTX SYNc | ESBL only CLA/CAZ SYNd | AmpCe | AmpC + ESBLf | CPsg | |||||||
| n | %h | n | %h | n | %h | n | %h | n | %h | n | %h | |||
| Austria | 170 | 1 | – | – | – | – | – | – | 1 | 0.6 | – | – | – | – |
| Belgium | 151 | 1 | 1 | 0.7 | – | – | – | – | – | – | – | – | – | – |
| Bulgaria | 111 | 4 | 4 | 3.6 | 4 | 3.6 | – | – | – | – | – | – | – | – |
| Croatia | 85 | 4 | 2 | 2.4 | 1 | 1.2 | – | – | 2 | 2.4 | – | – | – | – |
| Cyprus | 85 | 5 | 2 | 2.4 | 2 | 2.4 | – | – | 3 | 3.5 | – | – | 1 | 1.2 |
| Czech Republici | 227 | 1 | – | – | – | – | – | – | – | – | – | – | – | – |
| Denmark | 186 | 1 | – | – | – | – | – | – | 1 | 0.5 | – | – | – | – |
| Finland | 184 | 1 | – | – | – | – | – | – | 1 | 0.5 | – | – | – | – |
| Francei | 188 | 7 | 6 | 3.2 | 2 | 1.1 | – | – | – | – | – | – | – | – |
| Germany | 177 | 2 | 2 | 1.1 | 0. | – | – | 1 | 0.6 | 1 | 0.6 | – | – | |
| Greece | 170 | 4 | 1 | 0.6 | 1 | 0.6 | – | – | 3 | 1.8 | – | – | – | – |
| Hungary | 170 | 12 | 4 | 2.4 | 0. | 1 | 0.6 | 8 | 4.7 | – | – | – | – | |
| Ireland | 170 | 4 | 4 | 2.4 | 2 | 1.2 | – | – | – | – | – | – | – | – |
| Italyj | 171 | 9 | 8 | 4.7 | 2 | 1.2 | 1 | 0.6 | 2 | 1.2 | 1 | 0.6 | – | – |
| Latvia | 100 | 8 | 8 | 8.0 | 7 | 7.0 | – | – | 4 | 4.0 | 4 | 4.0 | – | – |
| Lithuania | 100 | 52 | 17 | 17.0 | 3 | 3.0 | – | – | 36 | 36.0 | 1 | 1.0 | – | – |
| Netherlands | 300 | 3 | 2 | 0.7 | 1 | 0.3 | – | – | 1 | 0.3 | – | – | – | – |
| Poland | 173 | 6 | 5 | 2.9 | – | – | – | – | 5 | 2.9 | 4 | 2.3 | – | – |
| Portugali | 161 | 10 | 9 | 5.6 | – | – | – | – | – | – | – | – | – | – |
| Romania | 840 | 29 | 14 | 1.7 | 9 | 1.1 | – | – | 15 | 1.8 | 1 | 0.1 | – | – |
| Sloveniai | 85 | 5 | 2 | 2.4 | – | – | 1 | 1.2 | 3 | 3.5 | v | – | – | – |
| Spain | 171 | 16 | 14 | 8.2 | 4 | 2.3 | 1 | 0.6 | 3 | 1.8 | 1 | 0.6 | – | – |
| Swedenj | 175 | 3 | 3 | 1.7 | 2 | 1.1 | – | – | – | – | – | – | – | – |
| Total (23 MSs) | 4,350 | 188 | 108 | 2.5 | 40 | 0.9 | 4 | 0.1 | 89 | 2.0 | 13 | 2.0 | 1 | 0.02 |
ESBL: extended‐spectrum β‐lactamase; n = isolates with this phenotype; %: percentage of isolates from the total tested; SYN: synergy; CTX: cefotaxime; CAZ: ceftazidime; CLA: clavulanate. MSs: Member States.
According to EUCAST Guidelines (EUCAST, 2013), only isolates showing an MIC > 1 mg/L for cefotaxime and/or ceftazidime (screening breakpoint) were considered (see Materials and methods Section 2).
All isolates showing clavulanate synergy with cefotaxime, ceftazidime or with both compounds, suggesting the presence of an ESBL (independently of the presence of other mechanisms).
Isolates showing synergy with cefotaxime only, suggesting the presence of an ESBL with cefotaximase activity.
Isolates showing synergy with ceftazidime only, suggesting the presence of an ESBL with ceftazidimase activity.
Isolates with microbiological resistance to cefoxitin, suggesting the presence of an AmpC enzyme (independently of the presence of other mechanisms).
Isolates showing synergy with cefotaxime or ceftazidime and with microbiological resistance to cefoxitin, suggesting the presence of ESBL and AmpC enzymes in the same isolate. These isolates are also included in the ESBL and AmpC columns.
Isolates with microbiological meropenem resistance.
Percentage of the total number of E. coli isolates tested (with Panel 1).
It includes isolates microbiologically resistant to cefotaxime and/or ceftazidime but with MIC ≤ 1 mg/L for both antimicrobials, suggesting the presence of other mechanisms (as stated above, they were not further classified).
Molecular data were reported by: Italy with 5 isolates CTX‐M and one isolate SHV; Sweden: 3 isolates CTX‐M‐1.
For those countries reporting 3rd generation cephalosporin resistance, the proportion of total E. coli (Table 66) with an AmpC phenotype was also very low and low in all MSs except Lithuania, where it was moderate (36%). Presumptive AmpC‐producing indicator E. coli isolates from broilers (89 out of 188 cephalosporin‐resistant isolates tested with the supplementary panel 2, 47.3% of those isolates) were reported by 16 MSs (Austria, Croatia, Cyprus, Denmark, Finland, Germany, Greece, Hungary, Italy, Latvia, Lithuania, the Netherlands, Poland, Romania, Slovenia and Spain).
Thirteen of the E. coli isolates from broilers mentioned above, reported by seven MSs (Germany, Italy, Latvia, Lithuania, Poland, Romania and Spain), presented an ‘ESBL + AmpC’ phenotype.
Presumptive ESBL and AmpC producers identified in indicator E. coli from fattening turkeys
For those countries reporting 3rd generation cephalosporin resistance, the proportion of all E. coli isolates from fattening turkeys (Table 67) with an ESBL phenotype was low or very low in reporting countries excepting Spain (16%). Presumptive ESBL‐producing indicator E. coli isolates from fattening turkeys (45 out of 47 cephalosporin‐resistant isolates tested with the supplementary panel 2, 95.7% of those isolates) were detected in 8 out of 9 MSs with cephalosporin‐resistant isolates from this matrix (Austria, France, Germany, Hungary, Italy, Portugal, Spain and the United Kingdom).
Table 67.
Presumptive ESBL and AmpC‐producing indicator E. coli isolates from fattening turkeys collected within the routine monitoring and subjected to supplementary testing (Panel 2) in 2016b
| Presumptive resistance phenotype | ||||||||||||||
|---|---|---|---|---|---|---|---|---|---|---|---|---|---|---|
| Country | Total number tested P1 | Total number tested P2 | ESBLc | ESBL only CLA/CTX SYNd | ESBL only CLA/CAZ SYNe | AmpCf | AmpC + ESBLg | CPsh | ||||||
| n | %i | n | %i | n | %i | n | %i | n | %i | n | %i | |||
| Austria | 154 | 1 | 1 | 0.6 | – | – | – | – | – | – | – | – | – | |
| France | 182 | 1 | 1 | 0.5 | – | – | – | – | – | – | – | – | – | |
| Germany a | 188 | 4 | 3 | 1.6 | 2 | 1.1 | – | – | – | – | – | – | – | |
| Hungary | 170 | 2 | 2 | 1.2 | – | – | – | – | – | – | – | – | – | |
| Italy j | 170 | 5 | 5 | 2.9 | 4 | 2.4 | – | – | 1 | 0.6 | 1 | 0.6 | – | – |
| Poland | 171 | 1 | – | – | – | – | – | – | 1 | 0.6 | – | – | – | – |
| Portugal | 171 | 5 | 5 | 2.9 | – | – | – | – | – | – | – | – | – | |
| Spain | 169 | 27 | 27 | 16.0 | – | – | 1 | 0.6 | – | – | – | – | – | |
| United Kingdom | 224 | 1 | 1 | 0.4 | – | – | – | – | – | – | – | – | – | – |
| Total (9 MSs) | 1,599 | 47 | 45 | 2.8 | 6 | 0.4 | 1 | 0.1 | 2 | 0.1 | 1 | 0.1 | 0 | 0 |
ESBL: extended‐spectrum β‐lactamase; n = isolates with this phenotype; %: percentage of isolates from the total tested; SYN: synergy; CTX: cefotaxime; CAZ: ceftazidime; CLA: clavulanate. MSs: Member States.
According to EUCAST Guidelines (EUCAST, 2013), only isolates showing an MIC > 1 mg/L for cefotaxime and/or ceftazidime (screening breakpoint) were considered (see Materials and methods Section 2).
All isolates showing clavulanate synergy with cefotaxime, ceftazidime or with both compounds, suggesting the presence of an ESBL (independently of the presence of other mechanisms).
Isolates showing synergy with cefotaxime only, suggesting the presence of an ESBL with cefotaximase activity.
Isolates showing synergy with ceftazidime only, suggesting the presence of an ESBL with ceftazidimase activity.
Isolates with microbiological resistance to cefoxitin, suggesting the presence of an AmpC enzyme (independently of the presence of other mechanisms).
Isolates showing synergy with cefotaxime or ceftazidime and with microbiological resistance to cefoxitin, suggesting the presence of ESBL and AmpC enzymes in the same isolate. These isolates are also included in the ESBL and AmpC columns.
Isolates with microbiological meropenem resistance.
Percentage of the total number of E. coli. isolates tested (with Panel 1).
It includes isolates microbiologically resistant to cefotaxime and/or ceftazidime but with MIC ≤ 1 mg/L for both antimicrobials, suggesting the presence of other mechanisms (as stated above, they were not further classified).
Molecular data were reported by Italy for 4 isolates with CTX‐M.
For those countries reporting 3rd generation cephalosporin resistance, presumptive AmpC‐producing indicator E. coli isolates from fattening turkeys (2 out 47 cephalosporin‐resistant isolates tested with the supplementary panel 2, 4.3% of those isolates) were reported only by two MSs (Italy and Poland).
One of those isolates from Italy presented an ‘ESBL + AmpC’ phenotype.
Presumptive carbapenemase‐producing E. coli from poultry (broilers and fattening turkeys)
One indicator E. coli isolate from broilers reported by Cyprus showed a presumptive carbapenemase‐producing phenotype. The isolate was reported as microbiologically resistant to meropenem and ertapenem, as well as temocillin. Confirmatory tests to elucidate the resistance genotype of this isolate are still needed.
Other 5 E. coli isolates from broilers reported by Lithuania (3 isolates) and Romania (2 isolates) were microbiologically resistant to ertapenem but not to other carbapenems, suggesting the presence of other resistance mechanisms rather than carbapenemases (Table ESCHEBRD2).
None of the E. coli isolates from fattening turkeys were microbiologically resistant to the carbapenems included in the supplementary testing panel (Table ESCHETURKD2).
7.3. Specific monitoring of ESBL‐/AmpC‐/carbapenemase‐producing E. coli from poultry and their meat products: presumptive ESBL/AMPC/CP producers
In certain types of monitoring, selective media containing cephalosporins may be used to investigate the presence of cephalosporin‐resistant organisms in a particular sample, even when they are present at low levels. This type of monitoring (which is referred to as ‘specific monitoring’ in this report) provides a different type of result from that which would be obtained from non‐selective culture. The selective media used (containing cefotaxime at 1 mg/L) in specific monitoring provides a greater sensitivity for detecting resistant organisms in a sample.
For 2016, the specific ESBL/AmpC/carbapenemase‐producing monitoring was performed on a mandatory basis on meat from broilers (fresh meat at retail) by all MSs except Malta, as well as by Norway and Switzerland (Tables ESCHEBRMEATESBL and ESCHEBRMEATESBL2); broilers, by all MSs excepting Malta, as well as Iceland, Norway and Switzerland (Tables ESCHEBRESBL and ESCHEBRESBL2) and fattening turkeys by 11 MSs and Norway (Tables ESCHETURKESBL and ESCHETURKESBL2).
A summary of the occurrence and prevalence of E. coli showing ESBL, AmpC and/or ESBL + AmpC phenotypes from meat from broilers, broilers, and fattening turkeys deriving from specific monitoring in 2016 assessed at the reporting MS‐group level is presented in Table 68.
Table 68.
Summary of presumptive ESBL‐ and AmpC‐producing E. coli isolates from meat from broilers, broilers and fattening turkeys collected by the EU MSs within the specific ESBLs/AmpC/carbapenemase‐producing monitoring and subjected to supplementary testing in 2016
| Matrix | Presumptive ESBL and/or AmpC producersa | Presumptive ESBL producersb | Presumptive AmpC producersc | Presumptive ESBL+AmpC producers | Presumptive CP | |||||||||
|---|---|---|---|---|---|---|---|---|---|---|---|---|---|---|
| n | Prev (%) | n | Occ (%) | Prev (%) | n | Occ (%) | Prev (%) | n | Occ (%) | Prev (%) | n | Occ (%) | Prev (%) | |
| Meat from broilersd | 3,583 | 57.4 | 2,125 | 58.6 | 35,9 | 1,588 | 43.8 | 26.8 | 119 | 3.3 | 2.0 | 8 | 0.2 | 0.13 |
| Broilerse | 4,391 | 47.4 | 2,714 | 61.3 | 35.4 | 1,873 | 42.3 | 24.4 | 196 | 4.4 | 2.6 | 0 | 0 | 0 |
| Fattening turkeysf | 1,151 | 42.2 | 1,001 | 86.7 | 36.6 | 197 | 17.1 | 7.2 | 47 | 4.1 | 1.7 | 0 | 0 | 0 |
Ns: number of animal/meat samples; N: number of the isolates tested; n: number of the isolates resistant; %Occ: percentage of cephalosporin‐resistant isolates presenting a presumptive phenotype; %Prev: percentage of samples harbouring a presumptive ESBL‐/AmpC‐producing E. coli. MSs: EU Member States.
Isolates exhibiting only ESBL and/or only AmpC and/or ESBL + AmpC phenotype.
Isolates exhibiting an ESBL and ESBL/AmpC phenotype.
Isolates exhibiting an AmpC and ESBL/AmpC phenotype.
Ns = 6,241; N = 3,624; 27 MSs.
Ns = 9,273; N = 4,426; 27 MSs.
Ns = 2,727; N = 1,154; 11 MSs.
Detailed information from the findings for each matrix is provided below.
7.3.1. Specific ESBL‐/AmpC‐/carbapenemase‐producing E. coli monitoring in broiler meat
Except Malta, all MSs, as well as Norway and Switzerland reported data for the specific monitoring of ESBL‐/AmpC‐/carbapenemase‐producing E. coli isolated from broiler meat (Tables ESCHEBRMEATESBL and ESCHEBRMEATESBL2).
Presumptive ESBL and AmpC producers identified in E. coli from broiler meat isolated within the specific ESBL‐/AmpC‐/carbapenemase‐producing E. coli monitoring
These MSs tested 6,241 retail meat samples and, following culture on selective media, 32.5% yielded presumptive ESBL‐producing E. coli, while 26,8% yielded presumptive AmpC‐producing E. coli and 2% yielded E. coli with an ESBL + AmpC phenotype (Table 69).
Table 69.
Prevalence of presumptive ESBL‐ and AmpC‐producing E. coli isolates from broiler meat collected within the specific ESBLs‐/AmpC‐/carbapenemase‐producing monitoring and subjected to supplementary testing in 2016a
| Country | Ns | Phenotype | |||||||||||
|---|---|---|---|---|---|---|---|---|---|---|---|---|---|
| ESBLb | ESBL only CTX/CLA SYNc | ESBL only CAZ/CLA SYNd | AmpCe | AmpC + ESBLf | CPs(g) | ||||||||
| %P | 95% CI | %P | 95% CI | %P | 95% CI | %P | 95% CI | %P | 95% CI | %P | 95% CI | ||
| Austria | 300 | 32.7 | (27.4, 38.3) | 17.3 | (13.2, 22.1) | 0.6 | (0.1, 2.4) | 32.3 | (27.1, 37.9) | 1.3 | (0.5, 3.8) | 0.0 | (0.0, 1.2) |
| Belgium | 234 | 78.3 | (10.6, 20.9) | 18.1 | (2.0, 5.9) | 7.5 | (2.7, 8.8) | 22.5 | (2.6, 6.9) | 5.0 | (1.5, 6.6) | 0.0 | (0.0, 1.6) |
| Bulgaria | 152 | 30.3 | (9.8, 38.2) | 26.3 | (8.2, 34.1) | 0.0 | (0.0, 2.4) | 27.6 | (8.8, 35.5) | 1.3 | (0.0, 3.6) | 0.0 | (0.0, 2.4) |
| Croatia | 146 | 28.0 | (21.0, 36.1) | 8.9 | (4.8, 14.7) | 6.1 | (2.9, 11.4) | 60.2 | (51.9, 68.3) | 2.1 | (0.4, 5.9) | 0.0 | (0.0, 2.5) |
| Cyprus | 148 | 44.3 | (34.5, 51.0) | 23.2 | (15.9, 29.9) | 0.0 | (0.0, 2.4) | 36.6 | (27.5, 43.4) | 11.3 | (6.3, 17) | 5.6 | (2.4, 10.4) |
| Czech Republic | 300 | 27.0 | (22.1, 32.4) | 10.7 | (7.4, 14.7) | 5.0 | (2.8, 8.1) | 43.3 | (37.6, 49.1) | 1.0 | (0.2, 2.9) | 0.0 | (0.0, 1.2) |
| Denmark | 295 | 21.4 | (16.8, 26.5) | 8.1 | (5.3, 11.9) | 0.3 | (0.0, 1.9) | 9.5 | (6.4, 13.4) | 0.7 | (0.1, 2.4) | 0.0 | (0.0, 1.2) |
| Estonia | 75 | 25.3 | (16.0, 36.7) | 5.3 | (1.5, 13.1) | 0.0 | (0.0, 4.8) | 36.0 | (25.2, 47.9) | 0.0 | (0.0, 4.8) | 0.0 | (0.0, 4.8) |
| Finland | 309 | 4.9 | (2.7, 7.9) | 0.7 | (0.1, 2.3) | 0.0 | (0.0, 1.2) | 17.1 | (12.8, 21.5) | 0.0 | (0.0, 1.2) | 0.0 | (0.0, 1.2) |
| France | 341 | 41.3 | (35.8, 46.5) | 20.1 | (15.8, 24.6) | 0.9 | (0.2, 2.5) | 17.4 | (13.4, 21.7) | 0.6 | (0.1, 2.1) | 0.0 | (0.0, 1.1) |
| Germany | 360 | 42.8 | (37.6, 48.1) | 11.4 | (8.3, 15.1) | 0.6 | (0.1, 2.0) | 18.9 | (15.0, 23.3) | 5.0 | (3.0, 7.8) | 0.0 | (0.0, 1.0) |
| Greece | 231 | 36.4 | (30.2, 42.9) | 18.2 | (13.4, 23.8) | 0.9 | (0.1, 3.1) | 26.4 | (20.8, 32.6) | 2.6 | (1.0, 5.6) | 0.0 | (0.0, 1.6) |
| Hungary | 300 | 13.4 | (9.7, 17.7) | 8.3 | (5.5, 12.1) | 0.3 | (0.0, 1.8) | 67.0 | (61.4, 72.3) | 1.3 | (0.4, 3.4) | 0.0 | (0.0, 1.2) |
| Ireland | 300 | 49.0 | (43.2, 54.8) | 32.7 | (27.4, 38.3) | 2.3 | (0.9, 4.7) | 16.0 | (12.0, 20.6) | 0.3 | (0.0, 1.8) | 0.0 | (0.0, 1.2) |
| Italy | 325 | 60.3 | (54.8, 65.7) | 23.4 | (18.9, 28.4) | 3.1 | (1.5, 5.6) | 10.2 | (7.1, 14.0) | 2.1 | (0.9, 4.4) | 0.0 | (0.0, 1.1) |
| Latvia | 95 | 74.7 | (64.8, 83.1) | 10.5 | (5.2, 18.5) | 1.1 | (0.0, 5.7) | 16.8 | (9.9, 25.9) | 0.0 | (0.0, 3.8) | 0.0 | (0.0, 3.8) |
| Lithuania | 150 | 25.3 | (18.6, 33.1) | 9.3 | (5.2, 15.2) | 0.0 | (0.0, 2.4) | 36.7 | (29.0, 44.9) | 0.7 | (0.0, 3.7) | 0.0 | (0.0, 2.4) |
| Luxembourg | 106 | 39.0 | (20.0, 37.9) | 6.5 | (1.5, 10.7) | 1.3 | (0.0, 5.1) | 11.7 | (4.0, 15.5) | 2.6 | (0.2, 6.6) | 0.0 | (0.0, 3.4) |
| Netherlands | 208 | 16.9 | (10.8, 21.0) | 6.9 | (3.4, 10.5) | 0.0 | (0.0, 1.8) | 11.6 | (6.7, 15.6) | 2.1 | (0.5, 4.9) | 0.0 | (0.0, 1.8) |
| Poland | 171 | 55.8 | (32.4, 63.1) | 27.5 | (13.9, 34.5) | 0.8 | (0.0, 3.2) | 41.7 | (34.0, 49.3) | 1.7 | (0.1, 4.2) | 0.0 | (0.0, 2.1) |
| Portugal | 198 | 24.8 | (18.9, 31.4) | 6.6 | (3.5, 11.0) | 0.5 | (0.0, 2.8) | 6.1 | (3.2, 10.3) | 0.5 | (0.0, 2.8) | 0.0 | (0.0, 1.8) |
| Romania | 315 | 25.1 | (20.4, 30.2) | 5.4 | (3.2, 8.5) | 0.3 | (0.0, 1.8) | 38.4 | (33.0, 44) | 3.5 | (1.8, 6.2) | 0.0 | (0.0, 1.2) |
| Slovakia | 150 | 42.0 | (31.5, 47.6) | 7.1 | (3.2, 11.9) | 2.2 | (0.4, 5.7) | 36.3 | (26.5, 42.2) | 3.6 | (1.1, 7.6) | 0.0 | (0.0, 2.4) |
| Slovenia | 150 | 20.0 | (13.9, 27.3) | 4.0 | (1.5, 8.5) | 4.7 | (1.9, 9.4) | 55.4 | (47.0, 63.4) | 0.0 | (0.0, 2.4) | 0.0 | (0.0, 2.4) |
| Spain | 300 | 71.0 | (65.5, 76.1) | 160 | (12.0, 20.6) | 0.6 | (0.1, 2.4) | 24.3 | (19.6, 29.6) | 5.0 | (2.8, 8.1) | 0.0 | (0.0, 1.2) |
| Sweden | 269 | 27.9 | (22.6, 33.6) | 16.7 | (12.5, 21.7) | 0.8 | (0.1, 2.7) | 17.1 | (12.8, 22.1) | 0.8 | (0.1, 2.7) | 0.0 | (0.0, 1.4) |
| United Kingdom | 313 | 29.7 | (24.7, 35.1) | 24.0 | (19.3, 29.1) | 0.3 | (0.0, 1.8) | 16.3 | (12.4, 20.9) | 0.9 | (0.2, 2.8) | 0.0 | (0.0, 1.2) |
| Total (27 MSs) | 6,241 | 35.9 | (34.7, 37.1) | 14.3 | (13.5, 15.2) | 1.4 | (1.15, 1.75) | 26.8 | (25.7, 28.0) | 2.0 | (1.7, 2.4) | 0.03 | (0.06, 0.25) |
| Norway | 175 | 0.0 | (0, 2.1) | 0.0 | (0, 2.1) | 0.0 | (0.0, 2.1) | 11.4 | (5.8, 15.1) | 0.0 | (0, 2.1) | 0.0 | (0.0, 2.1) |
| Switzerland | 302 | 22.8 | (18.2, 28) | 8.3 | (5.4, 12.0) | 4.0 | (2.1, 6.8) | 26.5 | (21.6, 31.8) | 2.0 | (0.7, 4.3) | 0.0 | (0.0, 1.2) |
ESBL: extended‐spectrum β‐lactamase; SYN: synergy; CTX: cefotaxime; CAZ: ceftazidime; CLA: clavulanate. MSs: Member States, Ns: total number of samples tested.
According to EUCAST Guidelines (EUCAST, 2013), only isolates showing an MIC > 1 mg/L for cefotaxime and/or ceftazidime (screening breakpoint) were considered (see Materials and Methods chapter 2).
All isolates showing clavulanate synergy with CTX or CAZ or synergy with both compounds, suggesting the presence of an ESBL (independently of the presence of other mechanisms).
Isolates showing synergy with cefotaxime only, suggesting the presence of an ESBL with cefotaximase activity.
Isolates showing synergy with ceftazidime only, suggesting the presence of an ESBL with ceftazidimase activity.
Isolates with microbiological resistance to cefoxitin, suggesting the presence of an AmpC enzyme (independently of the presence of other mechanisms).
Isolates showing synergy with CTX or CAZ and with microbiological resistance to cefoxitin, suggesting the presence of ESBL and AmpC enzymes in the same isolate. These isolates are also included in the ESBL and AmpC columns. Isolates with microbiological meropenem resistance.
Among the reporting countries, marked variations were observed in the prevalence of presumptive ESBL‐producing E. coli isolates, which ranged from none in Norway, 4.9% and 13.4% in Finland and Hungary, up to 60.3% in Italy, 71% in Spain, nearly 75% in Latvia and 78.3% in Belgium. The levels of presumptive AmpC‐producing E. coli were very high (50–70%) in MSs from eastern Europe (Slovenia, Croatia, and Hungary) and moderate to high in most of the other MSs. Low prevalence of AmpC producers was only reported by Portugal and Denmark (6.1–9.5%) (Figure 99).
Figure 99.
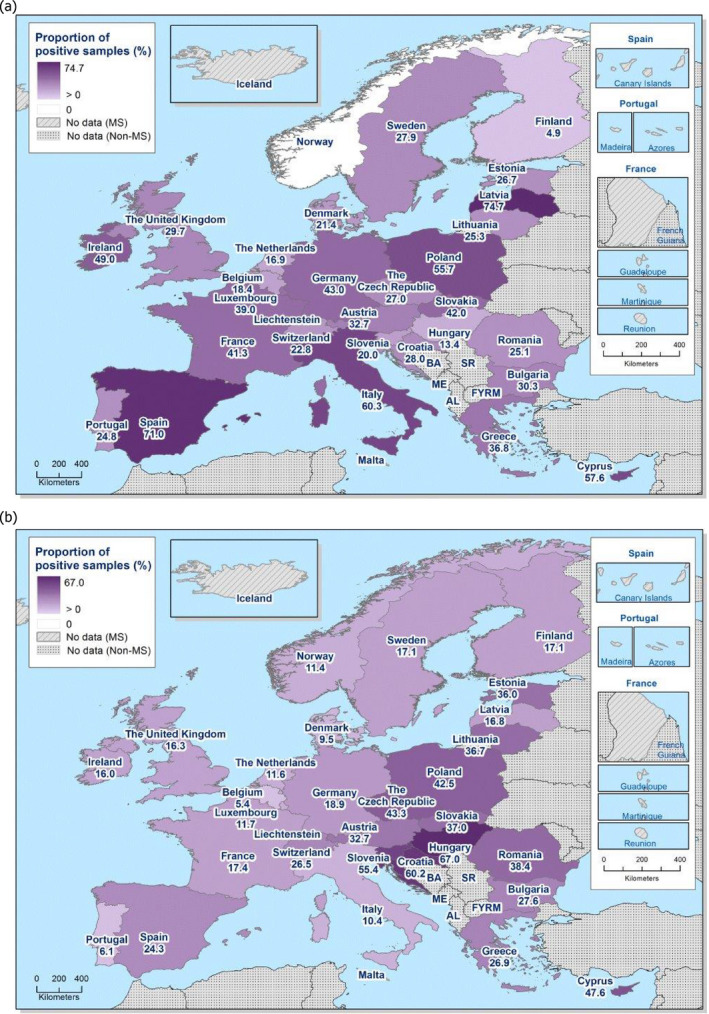
Prevalence of presumptive ESBL‐producing (a) and AmpC‐producing (b) E. coli isolates from broiler meat collected within the specific ESBL‐/AmpC‐/carbapenemase‐producing monitoring and subjected to supplementary testing in 2016
Among the cephalosporin‐resistant isolates (3,624 isolates tested with Panel 2 by the MSs), the occurrence of presumptive ESBL‐producing E. coli isolates from broiler meat collected within this specific monitoring by the MSs was 58.6%, and these isolates were detected in samples from all reporting countries except Norway. The occurrence of presumptive AmpC‐producing E. coli isolates from meat from broilers collected within this specific monitoring was 43.8% and these isolates were detected in samples from all MSs. Here, 3.3% of the E. coli isolates from broiler meat mentioned above, reported by 25 MSs, presented an ‘ESBL + AmpC’ phenotype (Table 70).
Table 70.
Occurrence of presumptive ESBL‐ and AmpC‐producing E. coli isolates from broiler meat collected within the specific ESBLs‐/AmpC‐/carbapenemase‐producing monitoring and subjected to supplementary testing in 2016a
| Country | Total number tested | ESBLb | ESBL only CTX/CLA SYNc | ESBL only CAZ/CLA SYNd | AmpCe | AmpC + ESBLf | CPsg | ||||||
|---|---|---|---|---|---|---|---|---|---|---|---|---|---|
| N | n | %h | n | %h | n | %h | n | %h | n | %h | n | %h | |
| Austria | 191 | 98 | 51.3 | 52 | 27.2 | 2 | 1.0 | 97 | 50.8 | 4 | 2.1 | – | – |
| Belgium i | 159 | 125 | 78.6 | 29 | 18.2 | 12 | 7.5 | 36 | 22.6 | 8 | 5 | – | – |
| Bulgaria | 43 | 23 | 53.5 | 20 | 46.5 | – | – | 21 | 48.8 | 1 | 2.3 | – | – |
| Croatia | 126 | 41 | 32.5 | 13 | 10.3 | 9 | 7.1 | 88 | 69.8 | 3 | 2.4 | – | – |
| Cyprus | 97 | 63 | 64.9 | 33 | 34.0 | – | – | 52 | 53.6 | 16 | 16.5 | 8 | 8.2 |
| Czech Republic | 208 | 81 | 38.9 | 32 | 15.4 | 15 | 7.2 | 130 | 62.5 | 3 | 1.4 | – | – |
| Denmark | 89 | 63 | 70.8 | 24 | 27.0 | 1 | 1.1 | 28 | 31.5 | 2 | 2.2 | – | – |
| Estonia | 46 | 19 | 41.3 | 4 | 8.7 | – | – | 27 | 58.7 | – | – | – | – |
| Finland | 67 | 15 | 22.4 | 2 | 3.0 | – | – | 52 | 77.6 | – | – | – | – |
| France | 202 | 140 | 69.3 | 68 | 33.7 | 3 | 1.5 | 59 | 29.2 | 2 | 1.0 | – | – |
| Germany i | 206 | 154 | 74.8 | 41 | 19.9 | 2 | 1 | 68 | 33.0 | 18 | 8.7 | – | – |
| Greece i | 141 | 84 | 59.6 | 42 | 29.8 | 2 | 1.4 | 61 | 43.3 | 6 | 4.3 | – | – |
| Hungary i | 237 | 40 | 16.9 | 25 | 10.5 | 1 | 0.4 | 201 | 84.8 | 4 | 1.7 | – | – |
| Ireland | 198 | 147 | 74.2 | 98 | 49.5 | 7 | 3.5 | 48 | 24.2 | 1 | 0.5 | – | – |
| Italy i , j | 223 | 196 | 87.9 | 76 | 34.1 | 10 | 4.5 | 33 | 14.8 | 7 | 3.1 | – | – |
| Latvia i , k | 95 | 71 | 74.7 | 10 | 10.5 | 1 | 1.1 | 16 | 16.8 | – | – | – | – |
| Lithuania i | 92 | 38 | 41.3 | 14 | 15.2 | – | – | 55 | 59.8 | 1 | 1.1 | – | – |
| Luxembourg | 37 | 30 | 81.1 | 5 | 13.5 | 1 | 2.7 | 9 | 24.3 | 2 | 5.4 | – | – |
| Netherlands j | 50 | 32 | 64.0 | 13 | 26.0 | – | – | 22 | 44.0 | 4 | 8.0 | – | – |
| Poland i | 118 | 67 | 56.8 | 33 | 28 | 1 | 0.8 | 50 | 42.4 | 2 | 1.7 | – | – |
| Portugal | 60 | 49 | 81.7 | 13 | 21.7 | 1 | 1.7 | 12 | 20.0 | 1 | 1.7 | – | – |
| Romania | 190 | 79 | 41.6 | 17 | 8.9 | 1 | 0.5 | 121 | 63.7 | 11 | 5.8 | – | – |
| Slovakia | 105 | 59 | 56.2 | 10 | 9.5 | 3 | 2.9 | 51 | 48.6 | 5 | 4.8 | – | – |
| Slovenia | 113 | 30 | 26.5 | 6 | 5.3 | 7 | 6.2 | 83 | 73.5 | – | – | – | – |
| Spain | 271 | 213 | 78.6 | 48 | 17.7 | 2 | 0.7 | 73 | 26.9 | 15 | 5.5 | – | – |
| Sweden j | 119 | 75 | 63.0 | 45 | 37.8 | 2 | 1.7 | 46 | 38.7 | 2 | 1.7 | – | – |
| United Kingdom | 141 | 93 | 66.0 | 75 | 53.2 | 1 | 0.7 | 49 | 34.8 | 2 | 1.7 | – | – |
| Total (27 MSs) | 3,624 | 2,125 | 58.6 | 848 | 23.4 | 84 | 2.3 | 1,588 | 43.8 | 119 | 3.3 | 9 | 0.2 |
| Norway | 17 | – | – | – | – | – | – | 17 | 100.0 | – | – | – | – |
| Switzerland i , k | 149 | 69 | 46.3 | 25 | 16.8 | 12 | 8.1 | 80 | 53.7 | 6 | 4 | – | – |
ESBL: extended‐spectrum β‐lactamase; n = isolates with this phenotype; %: percentage of isolates from the total tested; SYN: synergy; CTX: cefotaxime; CAZ: ceftazidime; CLA: clavulanate. MSs: Member States.
According to EUCAST Guidelines (EUCAST, 2013), only isolates showing an MIC > 1 mg/L for cefotaxime and/or ceftazidime (screening breakpoint) were considered (see Materials and methods Section 2).
All isolates showing clavulanate synergy with cefotaxime, ceftazidime or with both compounds, suggesting the presence of an ESBL (independently of the presence of other mechanisms).
Isolates showing synergy with cefotaxime only, suggesting the presence of an ESBL with cefotaximase activity.
Isolates showing synergy with ceftazidime only, suggesting the presence of an ESBL with ceftazidimase activity.
Isolates with microbiological resistance to cefoxitin, suggesting the presence of an AmpC enzyme (independently of the presence of other mechanisms).
Isolates showing synergy with cefotaxime or ceftazidime and with microbiological resistance to cefoxitin, suggesting the presence of ESBL and AmpC enzymes in the same isolate. These isolates are also included in the ESBL and AmpC columns.
Isolates with microbiological meropenem resistance.
Percentage of the total number of Salmonella spp. isolates tested (with Panel 1).
It includes isolates microbiologically resistant to cefotaxime and/or ceftazidime but with MIC ≤ 1 mg/L for both antimicrobials, suggesting the presence of other mechanisms (as stated above, they were not further classified).
Molecular data were reported by Italy: ESBL: 132 isolates CTX‐M, 61 SHV (49 confirmed as SHV‐12), AmpC: 1 ACC and 18 CMY‐2, 11 isolates negative for the genes tested. Sweden: ESBLs, 72 CTX‐M (5 CTX‐M‐1, 1 CTX‐M‐15), 1 TEM‐52, AmpC: 44 CMY (5 confirmed as CMY‐2), 2 isolates negative for the genes tested.
It includes isolates susceptible to both cefotaxime and ceftazidime.
The detection of ESBL‐producing E. coli exceeded that of AmpC‐producing E. coli in most of the reporting countries with the exception of Croatia, the Czech Republic, Estonia, Finland, Hungary, Lithuania, Romania, Slovenia, Norway and Switzerland.
Presumptive carbapenemase producers identified in E. coli from broiler meat isolated within the specific ESBL‐/AmpC‐/carbapenemase‐producing E. coli monitoring
Eight indicator E. coli isolates from broiler meat samples analysed by Cyprus (8 isolates) showed a presumptive carbapenemase‐producing phenotype (Table 70). These isolates showed microbiological resistance to meropenem, imipenem and ertapenem, as well as temocillin (Table ESCHEBRMEATESBL2). However, the isolates were not subjected to any confirmatory test to detect the resistance genotype or production of carbapenemases. Further investigations will be needed to elucidate the resistance mechanisms present in these isolates.
In total, 12 isolates (0.3% isolates tested with Panel 2) were reported by Belgium, Cyprus and Spain as microbiologically resistant to imipenem. Microbiological resistance to ertapenem was reported by 17 MSs (95 isolates, 2.6%) (Table ESCHEBRMEATESBL2).
7.3.2. Specific ESBL‐/AmpC‐/carbapenemase‐producing E. coli monitoring in broilers
All MSs except Malta, as well as Iceland, Norway and Switzerland reported data for the specific ESBL‐/AmpC‐/carbapenemase‐producing E. coli isolated from broilers (Tables ESCHEBRESBL and ESCHEBRESBL2).
Presumptive ESBL and AmpC producers identified in E. coli from broilers isolated within the specific ESBL‐/AmpC‐/carbapenemase‐producing E. coli monitoring
In total, 27 MSs tested 9,273 broiler caecal samples and, following culture on selective media 35.4% yielded presumptive ESBL‐producing E. coli, while 24.4% yielded presumptive AmpC‐producing E. coli and 2.6% yielded E. coli with an ESBL + AmpC phenotype (Table 71).
Table 71.
Prevalence of presumptive ESBL‐ and AmpC‐producing E. coli isolates from broilers collected within the specific ESBLs/AmpC/Carbapenemase‐producing monitoring and subjected to supplementary testing in 2016a
| Country | Ns | Phenotype | |||||||||||
|---|---|---|---|---|---|---|---|---|---|---|---|---|---|
| ESBLb | ESBL only CTX/CLA SYNc | ESBL only CAZ/CLA SYNd | AmpCe | AmpC + ESBLf | CPsg | ||||||||
| %P | 95% CI | %P | 95% CI | %P | 95% CI | %P | 95% CI | %P | 95% CI | %P | 95% CI | ||
| Austria | 306 | 28.4 | (23.4, 33.8) | 7.2 | (4.6, 10.7) | 0.0 | (0.0, 1.2) | 29.4 | (24.4, 34.9) | 5.5 | (3.3, 8.7) | 0.0 | (0.0, 1.2) |
| Belgium | 261 | 86.8 | (57.1, 90.8) | 23.2 | (12.5, 29) | 5.8 | (2.1, 7.4) | 13.7 | (6.6, 14.3) | 3.7 | (1.1, 5.4) | 0.0 | (0.0, 1.4) |
| Bulgaria | 442 | 49.9 | (15.5, 55) | 34.5 | (10.1, 39) | 0.0 | (0.0, 0.8) | 35.7 | (10.5, 40.4) | 12.5 | (3.0, 15.9) | 0.0 | (0.0, 0.83) |
| Croatia | 1,658 | 21.0 | (6.0, 23) | 5.8 | (1.4, 7.0) | 2.3 | (0.4, 3.1) | 33.6 | (10.0, 35.9) | 1.7 | (0.3, 2.4) | 0.0 | (0.0, < 0.01) |
| Cyprus | 151 | 65.6 | (16.1, 73) | 27.0 | (5.2, 35) | 3.8 | (0.2, 4.7) | 52.1 | (12.1, 60.5) | 28.9 | (5.7, 37.1) | 0.0 | (0.0, 2.4) |
| Czech Republic | 307 | 16.3 | (12.3, 20.9) | 6.5 | (4.0, 9.9) | 3.6 | (1.8, 6.3) | 40.1 | (34.5, 45.8) | 0.3 | (0.0, 1.8) | 0.0 | (0.0, 1.2) |
| Denmark | 298 | 6.4 | (3.9, 9.8) | 1.0 | (0.2, 2.9) | 0.0 | (0.0, 1.2) | 9.7 | (6.6, 13.7) | 0.3 | (0.0, 1.9) | 0.0 | (0.0, 1.2) |
| Estonia | 73 | 20.6 | (12.0, 31.6) | 5.5 | (1.5, 13.4) | 0.0 | (0.0, 4.9) | 15.1 | (7.8, 25.4) | 0.0 | (0.0, 4.9) | 0.0 | (0.0, 4.9) |
| Finland | 306 | 3.6 | (1.8, 6.3) | 0.0 | (0.0, 1.2) | 0.0 | (0.0, 1.2) | 11.1 | (7.8, 15.2) | 0.3 | (0.0, 1.8) | 0.0 | (0.0, 1.2) |
| France | 300 | 34.3 | (28.7, 39.7) | 14.8 | (10.9, 19.2) | 0.4 | (0.0, 1.8) | 12.4 | (8.8, 16.6) | 2.7 | (1.2, 5.2) | 0.0 | (0.0, 1.2) |
| Germany | 344 | 35.8 | (30.7, 41.1) | 7.2 | (4.8, 10.5) | 0.6 | (0.1, 2.1) | 19.5 | (15.4, 24.1) | 2.9 | (1.4, 5.3) | 0.0 | (0.0, 1.1) |
| Greece | 388 | 52.3 | (25.1, 57.3) | 29.5 | (13.2, 34.2) | 0.0 | (0.0, 0.9) | 30.5 | (14.1, 35.3) | 5.9 | (1.8, 5.7) | 0.0 | (0.0, 0.95) |
| Hungary | 300 | 19.3 | (15.0, 24.3) | 5.0 | (2.8, 8.1) | 0.7 | (0.1, 2.4) | 59.0 | (53.2, 64.6) | 2 | (0.7, 4.3) | 0.0 | (0.0, 0.01) |
| Ireland | 300 | 68.0 | (62.4, 73.2) | 44.4 | (38.6, 50.2) | 3.0 | (1.4, 5.6) | 18.7 | (14.4, 23.5) | 0.0 | (0.0, 1.2) | 0.0 | (0.0, 0.01) |
| Italy | 409 | 80.7 | (76.5, 84.4) | 27.2 | (22.9, 31.7) | 3.9 | (2.3, 6.3) | 16.9 | (13.4, 20.9) | 3.2 | (1.7, 5.4) | 0.0 | (0.0, 0.9) |
| Latvia | 100 | 90.0 | (82.4, 95.1) | 1.0 | (0.0, 5.4) | 0.0 | (0.0, 3.6) | 1.0 | (0.0, 5.4) | 0.0 | (0.0, 3.6) | 0.0 | (0.0, 3.6) |
| Lithuania | 150 | 30.0 | (22.8, 38.0) | 12.7 | (7.8, 19.1) | 0.0 | (0.0, 2.4) | 67.3 | (59.2, 74.8) | 4.0 | (1.5, 8.5) | 0.0 | (0.0, 2.4) |
| Luxembourg | 19 | 52.6 | (1.3, 76) | 26.3 | (0.1, 52.2) | 0.0 | (0.0, 17.6) | 0.0 | (0.0, 17.6) | 0.0 | (0.0, 17.6) | 0.0 | (0.0, 17.6) |
| Netherlands | 300 | 40.7 | (35.1, 46.5) | 12.0 | (8.5, 16.2) | 0.4 | (0.0, 1.8) | 12.0 | (8.5, 16.2) | 2.7 | (1.2, 5.2) | 0.0 | (0.0, 1.2) |
| Poland | 299 | 34.5 | (29.1, 40.1) | 9.4 | (6.3, 13.2) | 0.4 | (0.0, 1.8) | 33.1 | (27.8, 38.8) | 10.7 | (7.4, 14.8) | 0.0 | (0.0, 1.2) |
| Portugal | 161 | 39.1 | (31.5, 47.1) | 3.7 | (1.4, 7.9) | 0.0 | (0.0, 2.3) | 9.9 | (5.8, 15.6) | 2.5 | (0.7, 6.2) | 0.0 | (0.0, 2.3) |
| Romania | 840 | 31.2 | (28.1, 34.4) | 15.1 | (12.8, 17.7) | 1.4 | (0.7, 2.5) | 34.5 | (31.3, 37.8) | 0.9 | (0.4, 1.9) | 0.0 | (0.0, 0.44) |
| Slovakia | 429 | 47.1 | (10.8, 51.9) | 7.8 | (1.1, 10.6) | 2.4 | (0.1, 4.2) | 36.1 | (8.0, 40.9) | 1.6 | (0.1, 1.7) | 0.0 | (0.0, 0.9) |
| Slovenia | 149 | 31.5 | (24.2, 39.7) | 4.0 | (1.5, 8.6) | 6.7 | (3.3, 12) | 61.8 | (53.4, 69.6) | 0.0 | (0.0, 2.4) | 0.0 | (0.0, 2.4) |
| Spain | 300 | 79.3 | (74.3, 83.8) | 24.6 | (19.9, 29.9) | 1.7 | (0.5, 3.8) | 16.3 | (12.3, 21) | 3.0 | (1.4, 5.6) | 0.0 | (0.0, 1.2) |
| Sweden | 301 | 30.9 | (25.7, 36.5) | 20.9 | (16.5, 26.0) | 0.0 | (0.0, 1.2) | 13.0 | (9.4, 17.3) | 0.6 | (0.1, 2.4) | 0.0 | (0.0, 1.2) |
| United Kingdom | 382 | 19.1 | (15.3, 23.4) | 10.2 | (7.4, 13.7) | 0.0 | (0.0, 1.0) | 10.5 | (7.6, 14.0) | 0.5 | (0.1, 1.9) | 0.0 | (0.0, 1.2) |
| Total (27 MSs) | 9,273 | 35.4 | (34.4, 36.4) | 13.1 | (12.4, 13.8) | 1.3 | (1.1, 1.6) | 24.4 | (23.6, 25.3) | 2.6 | (2.2, 2.9) | 0.0 | (0.0, < 0.001) |
| Iceland | 160 | 1.3 | (0.2, 4.4) | 0.6 | (0.0, 3.4) | 0.0 | (0.0, 2.3) | 1.9 | (0.4, 5.4) | 0.0 | (0.0, 2.3) | 0.0 | (0.0, 2.3) |
| Norway | 188 | 0.5 | (0.0, 2.9) | 0.5 | (0.0, 2.9) | 0.0 | (0.0, 1.9) | 10.6 | (6.6, 16) | 0.5 | (0.0, 2.9) | 0.0 | (0.0, 1.9) |
| Switzerland | 307 | 23.9 | (19.1, 28.9) | 11.2 | (7.8, 15.1) | 2.6 | (1.1, 5.1) | 25.9 | (20.9, 31) | 0.7 | (0.1, 2.3) | 0.0 | (0.0, 1.2) |
ESBL: extended‐spectrum β‐lactamase; SYN: synergy; CTX: cefotaxime; CAZ: ceftazidime; CLA: clavulanate. MSs: Member States; CPs: carbapenemase producers.
According to EUCAST Guidelines (EUCAST, 2013), only isolates showing an MIC > 1 mg/L for cefotaxime and/or ceftazidime (screening breakpoint) were considered (see Materials and Methods, Chapter 2).
All isolates showing clavulanate synergy with CTX or CAZ or synergy with both compounds, suggesting the presence of an ESBL (independently of the presence of other mechanisms).
Isolates showing synergy with cefotaxime only, suggesting the presence of an ESBL with cefotaximase activity.
Isolates showing synergy with ceftazidime only, suggesting the presence of an ESBL with ceftazidimase activity.
Isolates with microbiological resistance to cefoxitin, suggesting the presence of an AmpC enzyme (independently of the presence of other mechanisms).
Isolates showing synergy with CTX or CAZ and with microbiological resistance to cefoxitin, suggesting the presence of ESBL and AmpC enzymes in the same isolate. These isolates are also included in the ESBL and AmpC columns.
Isolates with microbiological meropenem resistance.
Among the reporting countries, marked variations were observed in the prevalence of presumptive ESBL‐producing E. coli isolates from broilers, which ranged from 0.5% in Norway, 3.6% in Finland and Denmark, up to 86.8 in Belgium. The highest prevalence was reported by Latvia, Belgium, Italy, Spain and Ireland (68–90%). The prevalence in Norway was very low (0.5%). The levels of presumptive AmpC‐producing E. coli were very high (50–70%) in four MSs (Cyprus, Hungary, Slovenia and Lithuania). Apart from Luxembourg, were no AmpC‐producing E. coli were reported for this matrix, very low or low prevalence of AmpC producers in broilers was only reported by Latvia (1%), and Portugal and Denmark (9.5–9.7%), whereas in the remaining reporting countries the prevalence ranged from moderate to high. The prevalence in Iceland was also low (1.9%) (Figure 100).
Figure 100.
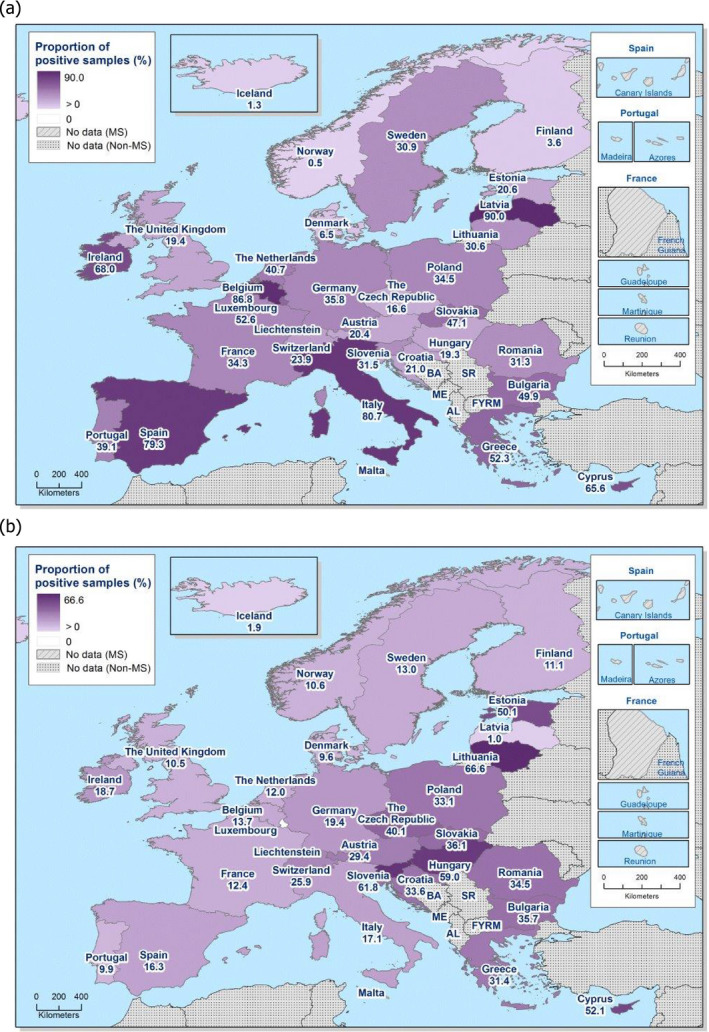
Prevalence of presumptive ESBL‐producing (a) and AmpC‐producing (b) E. coli isolates from broilers collected within the specific ESBL‐/AmpC‐/carbapenemase‐producing monitoring and subjected to supplementary testing in 2016
Among the cephalosporin‐resistant isolates (4,426 isolates tested with Panel 2 by the MSs), the occurrence of presumptive ESBL‐producing E. coli isolates from broilers collected within this specific monitoring was 61.3%, and these isolates were detected in samples from all reporting countries. The occurrence of presumptive AmpC‐producing E. coli isolates from broilers collected within this specific monitoring was 42.3%, and they were detected in samples from all reporting countries except Luxembourg. Here, 4.4% % of these isolates presented an ‘ESBL + AmpC’ phenotype as reported by the MSs. This phenotype was reported by 22 MS, plus Norway and Switzerland (Table 72).
Table 72.
Occurrence of presumptive ESBL‐ and AmpC‐producing E. coli isolates from broilers collected within the specific ESBLs‐/AmpC‐/carbapenemase‐producing monitoring and subjected to supplementary testing in 2016a
| Country | Total number tested | ESBLb | ESBL only CTX/CLA SYNc | ESBL only CAZ/CLA SYNd | AmpCe | AmpC + ESBLf | CPsg | ||||||
|---|---|---|---|---|---|---|---|---|---|---|---|---|---|
| n | %h | n | %h | n | %h | n | %h | n | %h | n | %h | ||
| Austria | 160 | 87 | 54.4 | 22 | 13.8 | – | – | 90 | 56.3 | 17 | 10.6 | – | – |
| Belgium i | 190 | 165 | 86.8 | 44 | 23.2 | 11 | 5.8 | 26 | 13.7 | 7 | 3.7 | – | – |
| Bulgaria | 123 | 84 | 68.3 | 58 | 47.2 | 0.0 | 60 | 48.8 | 21 | 17.1 | – | – | |
| Croatia | 300 | 119 | 39.7 | 33 | 11.0 | 13 | 4.3 | 191 | 63.7 | 10 | 3.3 | – | – |
| Cyprus | 46 | 34 | 73.9 | 14 | 30.4 | 2 | 4.3 | 27 | 58.7 | 15 | 32.6 | – | – |
| Czech Republic i | 174 | 50 | 28.7 | 20 | 11.5 | 11 | 6.3 | 123 | 70.7 | 1 | 0.6 | – | – |
| Denmark i | 48 | 19 | 39.6 | 3 | 6.3 | – | – | 29 | 60.4 | 1 | 2.1 | – | – |
| Estonia i | 28 | 15 | 53.6 | 4 | 14.3 | – | – | 11 | 39.3 | – | – | – | – |
| Finland | 44 | 11 | 25.0 | – | – | – | – | 34 | 77.3 | 1 | 2.3 | – | – |
| France | 131 | 102 | 77.9 | 44 | 33.6 | 1 | 0.8 | 37 | 28.2 | 8 | 6.1 | – | – |
| Germany i | 182 | 123 | 67.6 | 25 | 13.7 | 2 | 1.1 | 67 | 36.8 | 10 | 5.5 | – | – |
| Greece | 170 | 115 | 67.6 | 65 | 38.2 | – | – | 67 | 39.4 | 13 | 7.6 | – | – |
| Hungary | 229 | 58 | 25.3 | 15 | 6.6 | 2 | 0.9 | 177 | 77.3 | 6 | 2.6 | – | – |
| Ireland i | 262 | 204 | 77.9 | 133 | 50.8 | 9 | 3.4 | 56 | 21.4 | – | – | – | – |
| Italy (i,j) | 386 | 330 | 85.5 | 111 | 28.8 | 16 | 4.1 | 69 | 17.9 | 13 | 3.4 | – | – |
| Latvia | 91 | 90 | 98.9 | 1 | 1.1 | – | – | 1 | 1.1 | – | – | – | |
| Lithuania | 141 | 45 | 31.9 | 19 | 13.5 | – | – | 101 | 71.6 | 6 | 4.3 | – | – |
| Luxembourg | 2 | 2 | 100.0 | 1 | 50.0 | – | – | – | – | – | – | – | – |
| Netherlands i | 151 | 122 | 80.8 | 36 | 23.8 | 1 | 0.7 | 36 | 23.8 | 8 | 5.3 | – | – |
| Poland (i,j) | 175 | 103 | 58.9 | 28 | 16.0 | 1 | 0.6 | 99 | 56.6 | 32 | 18.3 | – | – |
| Portugal | 75 | 63 | 84.0 | 6 | 8.0 | – | – | 16 | 21.3 | 4 | 5.3 | – | – |
| Romania i | 553 | 262 | 47.4 | 127 | 23.0 | 12 | 2.2 | 290 | 52.4 | 8 | 1.4 | – | – |
| Slovakia i | 105 | 60 | 57.1 | 10 | 9.5 | 3 | 2.9 | 46 | 43.8 | 2 | 1.9 | – | – |
| Slovenia | 139 | 47 | 33.8 | 6 | 4.3 | 10 | 7.2 | 92 | 66.2 | – | – | – | – |
| Spain | 278 | 238 | 85.6 | 74 | 26.6 | 5 | 1.8 | 49 | 17.6 | 9 | 3.2 | – | – |
| Sweden (j) | 130 | 93 | 71.5 | 63 | 48.5 | – | – | 39 | 30.0 | 2 | 1.5 | – | – |
| United Kingdom (i,k) | 113 | 73 | 64.6 | 39 | 34.5 | – | – | 40 | 35.4 | 2 | 1.8 | – | – |
| Total (27 MSs) | 4,426 | 2,714 | 61.3 | 1,001 | 22.6 | 99 | 2.2 | 1,873 | 42.3 | 196 | 4.4 | – | – |
| Iceland j | 5 | 2 | 40.0 | 1 | 20.0 | – | – | 3 | 60.0 | – | – | – | – |
| Norway | 20 | 1 | 5.0 | 1 | 5.0 | – | – | 20 | 100.0 | 1 | 5.0 | – | – |
| Switzerland (i,k) | 160 | 73 | 45.6 | 34 | 21.3 | 8 | 5.0 | 79 | 49.4 | 2 | 1.3 | – | – |
ESBL: extended‐spectrum β‐lactamase; n = isolates with this phenotype; %: percentage of isolates from the total tested; SYN: synergy; CTX: cefotaxime; CAZ: ceftazidime; CLA: clavulanate. MSs: Member States; CP: carbapenemase producers.
According to EUCAST Guidelines (EUCAST, 2013), only isolates showing an MIC > 1 mg/L for cefotaxime and/or ceftazidime (screening breakpoint) were considered (see Materials and Methods chapter 2).
All isolates showing clavulanate synergy with cefotaxime, ceftazidime or with both compounds, suggesting the presence of an ESBL (independently of the presence of other mechanisms).
Isolates showing synergy with cefotaxime only, suggesting the presence of an ESBL with cefotaximase activity.
Isolates showing synergy with ceftazidime only, suggesting the presence of an ESBL with ceftazidimase activity.
Isolates with microbiological resistance to cefoxitin, suggesting the presence of an AmpC enzyme (independently of the presence of other mechanisms).
Isolates showing synergy with cefotaxime or ceftazidime and with microbiological resistance to cefoxitin, suggesting the presence of ESBL and AmpC enzymes in the same isolate. These isolates are also included in the ESBL and AmpC columns.
Isolates with microbiological meropenem resistance.
Percentage of the total number of Salmonella spp. isolates tested (with Panel 1).
It includes isolates microbiologically resistant to cefotaxime and/or ceftazidime but with MIC ≤ 1 mg/L for both antimicrobials, suggesting the presence of other mechanisms (as stated above, they were not further classified).
Molecular data were reported by Italy: ESBLs: 212 isolates CTX‐M, 111 SHV (110 confirmed as SHV‐12), 1 TEM‐52, AmpC, 55 CMY‐2, 11 isolates negative results. Sweden: 93 CTX‐M (7 CTX‐M‐1), 34 CMY (5 CMY‐2), negative results for 3 isolates. Iceland, 2 CTX‐M and 3 CMY‐2.
It includes isolates susceptible to both cefotaxime and ceftazidime.
The detection of ESBL‐producing E. coli exceeded that of AmpC‐producing E. coli in most of the reporting countries with the exception of Austria, Croatia, the Czech Republic, Denmark, Finland, Hungary, Lithuania, Romania, Slovenia, Iceland, Norway and Switzerland. south‐eastern, south‐central and southern‐western MSs tended to report a higher prevalence of ESBL‐/AmpC‐producing E. coli than the Nordic countries and, to a lesser extent, than MSs from western Europe (Figure 100).
Presumptive carbapenemase producers identified in E. coli from broilers isolated within the specific ESBL‐/AmpC‐/carbapenemase‐producing E. coli monitoring
No presumptive carbapenemase‐producing E. coli was detected (Table 72). Four isolates (0.1% of the isolates tested with Panel 2) were reported by Cyprus, the Netherlands and Portugal as microbiologically resistant to imipenem. Fifteen MSs excepting Luxembourg reported isolates microbiologically resistant to ertapenem (102, 2.3%) (Table ESCHEBRESBL).
7.3.3. Specific ESBL‐/AmpC‐/carbapenemase‐producing E. coli monitoring in fattening turkeys
Eleven MSs and Norway reported data for the specific ESBL‐/AmpC‐/carbapenemase‐producing E. coli isolated from fattening turkeys (Tables ESCHEBRESBL and ESCHEBRESBL2).
Presumptive ESBL and AmpC producers identified in E. coli from fattening turkeys isolated within the specific ESBL‐/AmpC‐/carbapenemase‐producing E. coli monitoring
Eleven MSs tested 2,727 caecal samples from turkeys and, following culture on selective media, 36,6% yielded presumptive ESBL‐producing E. coli, 7. 2% yielded presumptive AmpC‐producing E. coli and 1.7% yielded E. coli with an ESBL + AmpC phenotype (Table 73). Also Norway reported data. In general, the prevalence of presumptive ESBL‐producing E. coli and to a lesser extent AmpC‐producing E. coli in fattening turkeys increased in a north to south gradient (Figure 101).
Table 73.
Prevalence of presumptive ESBL‐ and AmpC‐producing E. coli isolates from fattening turkeys collected within the specific ESBLs‐/AmpC‐/carbapenemase‐producing monitoring and subjected to supplementary testing in 2016a
| Country | Ns | Phenotype | |||||||||||
|---|---|---|---|---|---|---|---|---|---|---|---|---|---|
| ESBLb | ESBL only CTX/CLA SYNc | ESBL only CAZ/CLA SYNd | AmpCe | AmpC + ESBLf | CPsg | ||||||||
| %P | 95% CI | %P | 95% CI | %P | 95% CI | %P | 95% CI | %P | 95% CI | %P | 95% CI | ||
| Austria | 183 | 33.3 | (26.6, 40.7) | 9.8 | (5.9, 15.1) | 0.0 | (0.0, 2.0) | 10.9 | (6.8, 16.4) | 0.5 | (0.0, 3.0) | 0.0 | (0.0, 2.0) |
| France | 300 | 22.7 | (18.1, 27.8) | 9.7 | (6.6, 13.6) | 0.3 | (0.0, 1.8) | 6.7 | (4.1, 10.1) | 1.0 | (0.2, 2.9) | 0.0 | (0.0, 1.2) |
| Germany | 323 | 34.6 | (28, 38.6) | 10.3 | (6.9, 13.7) | 0.0 | (0.0, 1.1) | 4.5 | (2.4, 7.2) | 2.6 | (1.1, 4.8) | 0.0 | (0.0, 1.14) |
| Hungary | 300 | 17.7 | (13.5, 22.5) | 3.7 | (1.8, 6.5) | 0.0 | (0.0, 1.2) | 12.3 | (8.8, 16.6) | 2.0 | (0.7, 4.3) | 0.0 | (0.0, 1.2) |
| Italy | 361 | 75.6 | (70.9, 80) | 28.5 | (23.9, 33.5) | 3.1 | (1.5, 5.4) | 3.3 | (1.7, 5.7) | 1.1 | (0.3, 2.8) | 0.0 | (0.0, 1.0) |
| Poland | 299 | 21.1 | (16.6, 26.1) | 5.0 | (2.8, 8.1) | 0.0 | (0.0, 1.2) | 23.1 | (18.4, 28.3) | 3.0 | (1.4, 5.6) | 0.0 | (0.0, 1.2) |
| Portugal | 183 | 47 | (39.6, 54.5) | 8.8 | (5.1, 13.8) | 1.7 | (0.3, 4.7) | 4.4 | (1.9, 8.4) | 2.7 | (0.9, 6.3) | 0.0 | (0.0, 2.0) |
| Romania | 30 | 56.7 | (37.4, 74.5) | 0.0 | (0.0, 11.6) | 0.0 | (0.0, 11.6) | 0.0 | (0.0, 11.6) | 0.0 | (0.0, 11.6) | 0.0 | (0.0, 0.0) |
| Spain | 300 | 86.7 | (82.3, 90.3) | 5.3 | (3.1, 8.5) | 0.7 | (0.1, 2.4) | 4.0 | (2.1, 6.9) | 3.7 | (1.8, 6.5) | 0.0 | (0.0, 1.2) |
| Sweden | 86 | 1.2 | (0.0, 6.3) | 1.2 | (0.0, 6.3) | 0.0 | (0.0, 4.2) | 0 | (0.0, 4.2) | 0.0 | (0.0, 4.2) | 0.0 | (0.0, 4.2) |
| United Kingdom | 362 | 3.3 | (1.7, 5.7) | 0.6 | (0.1, 2) | 0.0 | (0.0, 1.0) | 1.4 | (0.4, 3.2) | 0.0 | (0.0, 1.0) | 0.0 | (0.0, 1.0) |
| Total (11 MSs) | 2,727 | 36.6 | (34.9, 38.5) | 8.9 | (7.9, 10.0) | 0.6 | (0.36, 1.0) | 7.2 | (6.3, 8.3) | 1.7 | (1.3, 2.3) | 0.0 | (0.0, 0.14) |
| Norway | 156 | 0.0 | (0.0, 2.3) | 0.0 | (0.0, 2.3) | 0.0 | (0.0, 2.3) | 9.6 | (5.5, 15.4) | 0.0 | (0.0, 2.3) | 0.0 | (0.0, 2.3) |
ESBL: extended‐spectrum β‐lactamase; SYN: synergy; CTX: cefotaxime; CAZ: ceftazidime; CLA: clavulanate; MSs: Member States; Ns: total number of samples.
According to EUCAST Guidelines (EUCAST, 2013), only isolates showing an MIC > 1 mg/L for cefotaxime and/or ceftazidime (screening breakpoint) were considered (see Materials and Methods chapter 2).
All isolates showing clavulanate synergy with cefotaxime or ceftazidime or synergy with both compounds, suggesting the presence of an ESBL (independently of the presence of other mechanisms).
Isolates showing synergy with cefotaxime only, suggesting the presence of an ESBL with cefotaximase activity.
Isolates showing synergy with ceftazidime only, suggesting the presence of an ESBL with ceftazidimase activity.
Isolates with microbiological resistance to cefoxitin, suggesting the presence of an AmpC enzyme (independently of the presence of other mechanisms).
Isolates showing synergy with cefotaxime or ceftazidime and with microbiological resistance to cefoxitin, suggesting the presence of ESBL and AmpC enzymes in the same isolate. These isolates are also included in the ESBL and AmpC columns.
Isolates with microbiological meropenem resistance.
Figure 101.
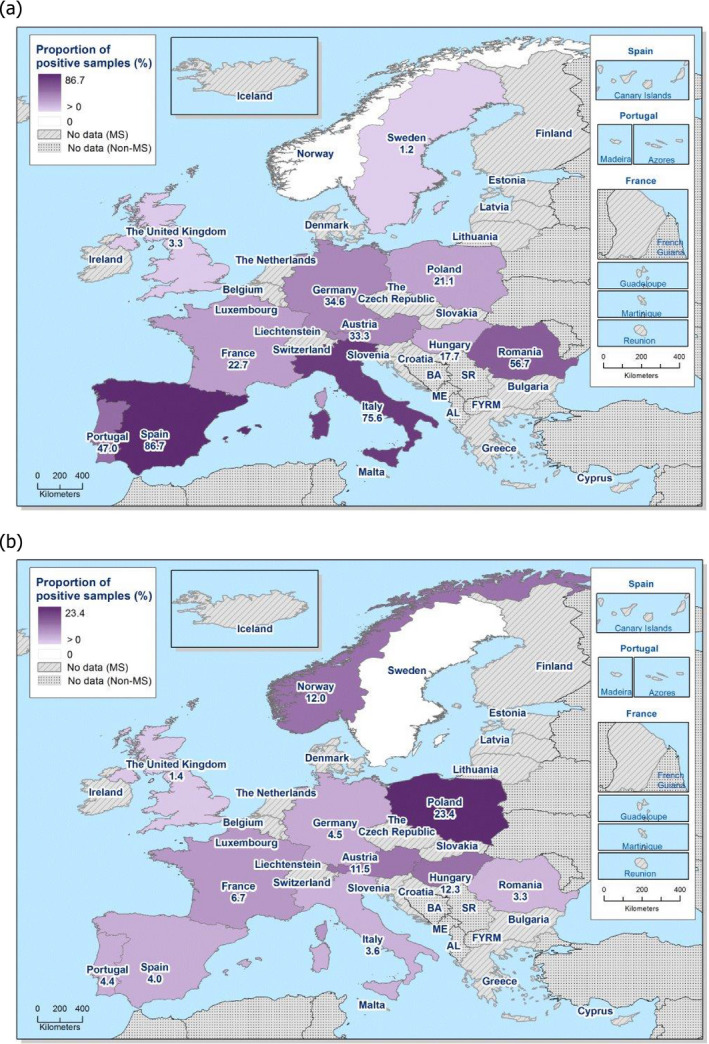
Prevalence of presumptive ESBL‐producing (a) and AmpC‐producing (b) E. coli isolates from fattening turkeys collected within the specific ESBL‐/AmpC‐/carbapenemase‐producing monitoring and subjected to supplementary testing in 2016
The highest prevalence for presumptive ESBL‐producing E. coli in fattening turkeys was reported by MS from southern and eastern Europe. This prevalence was very high in Italy and Spain (86.7–75.6%) but also in Romania (56.7%), whereas the lowest prevalence was registered by MSs from northern and western Europe, with low prevalence for Sweden and the United Kingdom (1.2 and 3.3%, respectively) and Norway, with no isolate. For the remaining reporting MSs, this prevalence was moderate‐high. For presumptive AmpC‐producing E. coli in fattening turkeys, the highest prevalence was reported by Poland, where it was high (23. 1%), followed by moderate prevalence, Austria and Hungary (10.9–12.3%) and also Norway (9.6%). The lowest prevalence in the MSs was reported by Sweden (no isolate) and the United Kingdom (1.4%) (Figure 101).
Among the cephalosporin‐resistant isolates (1,154 isolates tested with Panel 2 by the MSs), the occurrence of presumptive ESBL‐producing E. coli isolates from fattening turkeys collected within this specific monitoring was 86.7%, and these isolates were detected in samples from all reporting MSs. The occurrence of presumptive AmpC‐producing E. coli isolates from fattening turkeys collected within this specific monitoring was 17.1%, and they were detected in samples from all reporting countries except Sweden. Here, 4.1% of these isolates presented an ‘ESBL + AmpC’ phenotype as reported by the MSs. This phenotype was reported by 9 of the 11 reporting MSs, but not by Sweden nor the United Kingdom. They were also absent in the non‐MS Norway (Table 74).
Table 74.
Occurrence of presumptive ESBL‐ and AmpC‐producing E. coli isolates from fattening turkeys collected within the specific ESBLs/AmpC/Carbapenemase‐producing monitoring and subjected to supplementary testing in 2016a
| Country | Total number tested | ESBLb | ESBL only CTX/CLA SYNc | ESBL only CAZ/CLA SYNd | AmpCe | AmpC + ESBLf | CPsg | ||||||
|---|---|---|---|---|---|---|---|---|---|---|---|---|---|
| N | n | %h | n | %h | n | %h | n | %h | n | %h | n | %h | |
| Austria i | 81 | 61 | 75.3 | 18 | 22.2 | – | – | 20 | 24.7 | 1 | 1.2 | – | – |
| France | 85 | 68 | 80.0 | 29 | 34.1 | 1 | 1.2 | 20 | 23.5 | 3 | 3.5 | – | – |
| Germany | 113 | 107 | 94.7 | 32 | 28.3 | – | – | 14 | 12.4 | 8 | 7.1 | – | – |
| Hungary | 84 | 53 | 63.1 | 11 | 13.1 | – | – | 37 | 44.0 | 6 | 7.1 | – | – |
| Italy (i,k) | 283 | 273 | 96.5 | 103 | 36.4 | 11 | 3.9 | 12 | 4.2 | 4 | 1.4 | – | – |
| Poland | 123 | 63 | 51.2 | 15 | 12.2 | – | – | 69 | 56.1 | 9 | 7.3 | – | – |
| Portugal | 89 | 86 | 96.6 | 16 | 18.0 | 3 | 3.4 | 8 | 9.0 | 5 | 5.6 | – | – |
| Romania | 17 | 17 | 100.0 | – | – | – | – | – | – | – | – | – | – |
| Spain | 261 | 260 | 99.6 | 16 | 6.1 | 2 | 0.8 | 12 | 4.6 | 11 | 4.2 | – | – |
| Sweden (k) | 1 | 1 | 100.0 | 1 | 100.0 | – | – | – | 0.0 | – | – | – | – |
| UK | 17 | 12 | 70.6 | 2 | 11.8 | – | – | 5 | 29.4 | – | – | – | – |
| Total (11 MSs) | 1,154 | 1,001 | 86.7 | 243 | 21.1 | 17 | 1.5 | 197 | 17.1 | 47 | 4.1 | – | – |
| Norway i | 16 | – | – | – | – | – | – | 15 | 93.8 | – | – | – | – |
ESBL: extended‐spectrum β‐lactamase; n = isolates with this phenotype; %: percentage of isolates from the total tested; SYN: synergy; CTX: cefotaxime; CAZ: ceftazidime; CLA: clavulanate. MSs: Member States. UK: United Kingdom.
According to EUCAST Guidelines (EUCAST, 2013), only isolates showing an MIC > 1 mg/L for cefotaxime and/or ceftazidime (screening breakpoint) were considered (see Materials and Methods chapter 2).
All isolates showing clavulanate synergy with cefotaxime, ceftazidime or with both compounds, suggesting the presence of an ESBL (independently of the presence of other mechanisms).
Isolates showing synergy with cefotaxime only, suggesting the presence of an ESBL with cefotaximase activity.
Isolates showing synergy with ceftazidime only, suggesting the presence of an ESBL with ceftazidimase activity.
Isolates with microbiological resistance to cefoxitin, suggesting the presence of an AmpC enzyme (independently of the presence of other mechanisms).
Isolates showing synergy with cefotaxime or ceftazidime and with microbiological resistance to cefoxitin, suggesting the presence of ESBL and AmpC enzymes in the same isolate. These isolates are also included in the ESBL and AmpC columns.
Isolates with microbiological meropenem resistance.
Percentage of the total number of Salmonella spp. isolates tested (with Panel 1).
It includes isolates microbiologically resistant to cefotaxime and/or ceftazidime but with MIC ≤ 1 mg/L for both antimicrobials, suggesting the presence of other mechanisms (as stated above, they were not further classified).
It includes isolates susceptible to both cefotaxime and ceftazidime.
Molecular data were reported by Italy: ESBLs: 207 CTX‐M, 59 SHV‐12, 4 TEM‐52, AmpC: 3 CMY‐2; 10 negative results. Sweden, 1 CTX‐M‐1.
Sweden reported only one isolate. For countries reporting less than 10 isolates, occurrence data should be carefully considered.
The detection of presumptive ESBL‐producing E. coli exceeded that of presumptive AmpC‐producing E. coli in most of the reporting countries with the exception of Poland, where the prevalence of AmpC‐producing E. coli was slightly higher than the one for ESBLs producing E. coli was similar and Norway, where only isolates with a AmpC phenotype were detected (9.6%).
Presumptive carbapenemase producers identified in E. coli from fattening turkeys isolated within the specific ESBL‐/AmpC‐/carbapenemase‐producing E. coli monitoring
No presumptive carbapenemase‐producing E. coli was detected by the 11 MSs that reported data (Table 74). None of the isolates was reported as microbiologically resistant to imipenem. Three MSs (France, Italy and Poland) reported isolates microbiologically resistant to ertapenem (10 isolates, 0.9%) (Table ESCHETURKESBL2).
7.4. Voluntary specific monitoring of carbapenemase‐producer E. coli
The specific monitoring of carbapenemase‐producing microorganisms was performed and reported by 19 and one non‐MS a voluntary basis in 2016, according to the Commission Implementing Decision 2013/652/EU (Table 75). The Netherlands also reported data from their national monitoring performed using different isolations protocols (see text box below). All reporting countries focused on the isolation of E. coli.
Table 75.
Prevalence of presumptive carbapenemase‐producing E. coli from meat from broilers, broilers, fattening turkeys and meat from turkeys collected within the specific carbapenemase‐producing monitoring in 2016
| Countrya | Matrix | |||||||||||||||
|---|---|---|---|---|---|---|---|---|---|---|---|---|---|---|---|---|
| Meat from broilers (Gallus gallus) – fresh | Broilers (Gallus gallus) | Fattening turkeys | Meat from turkeys | |||||||||||||
| N | Samples CP+ (n) | %P | 95% CI | N | Samples CP+ (n) | %P | 95% CI | N | Samples CP+ (n) | %P | 95% CI | N | Samples CP+ (n) | %P | 95% CI | |
| Austria | 295 | 0 | 0.0 | (0, 1.2) | 306 | 0 | 0.0 | (0, 1.2) | 183 | 0 | 0.0 | (0, 2.0) | – | – | – | – |
| Belgium | 234 | 0 | 0.0 | (0, 1.6) | 301 | 0 | 0.0 | (0, 1.2) | – | – | – | – | – | – | – | – |
| Croatia | 146 | 0 | 0.0 | (0, 2.5) | 300 | 0 | 0.0 | (0, 1.2) | – | – | – | – | – | – | – | – |
| Cyprus | 71 | 1 | 0.0 | (0, 5.1) | 300 | 1 | 0.0 | (0, 1.2) | – | – | – | – | – | – | – | – |
| CZ | 300 | 0 | 0.0 | (0, 1.2) | 307 | 0 | 0.0 | (0, 1.2) | – | – | – | – | – | – | – | – |
| Denmark | 292 | 0 | 0.0 | (0, 1.3) | 292 | 0 | 0.0 | (0, 1.3) | – | – | – | – | – | – | – | – |
| Estonia | 75 | 0 | 0.0 | (0, 4.8) | 73 | 0 | 0.0 | (0, 4.9) | – | – | – | – | – | – | – | – |
| Finland | 309 | 0 | 0.0 | (0, 1.2) | 306 | 0 | 0.0 | (0, 1.2) | – | – | – | – | – | – | – | – |
| France | 341 | 0 | 0.0 | (0, 1.1) | – | – | – | – | 300 | 0 | 0.0 | (0, 1.2) | – | – | – | – |
| Greece | 232 | 0 | 0.0 | (0, 1.6) | 341 | 0 | 0.0 | (0, 1.1) | – | – | – | – | – | – | – | – |
| Hungary | 233 | 0 | 0.0 | (0, 1.6) | 206 | 0 | 0.0 | (0, 1.8) | 223 | 0 | 0.0 | (0, 1.6) | – | – | – | – |
| Ireland | 300 | 0 | 0.0 | (0, 1.2) | 300 | 0 | 0.0 | (0, 1.2) | – | – | – | – | – | – | – | – |
| Italy | 325 | 0 | 0.0 | (0, 1.1) | 409 | 0 | 0.0 | (0, 0.9) | 361 | 0 | 0.0 | (0, 1.02) | 293 | 0 | 0.0 | (0, 1.25) |
| Poland | – | – | – | – | 310 | 0 | 0.0 | (0, 1.2) | 317 | 0 | 0.0 | (0, 1.16) | – | – | – | – |
| Portugal | 183 | 0 | 0.0 | (0, 2.0) | 161 | 0 | 0.0 | (0, 2.3) | 183 | 0 | 0.0 | (0, 2.0) | – | – | – | – |
| Romania | 315 | 1 | 0.3 | (0, 1.8) | 840 | 2 | 0.4 | (0.1, 1.0) | – | – | – | – | – | – | – | – |
| Slovenia | 150 | 0 | 0.0 | (0, 2.4) | 149 | 0 | 0.0 | (0, 2.4) | – | – | – | – | – | – | – | – |
| Sweden | 269 | 0 | 0.0 | (0, 1.4) | 301 | 0 | 0.0 | (0, 1.2) | 86 | 0 | 0.0 | (0, 4.2) | – | – | – | – |
| UK | 313 | 0 | 0.0 | (0, 1.2) | 382 | 0 | 0.0 | (0, 0.1) | 315 | 0 | 0.0 | (0, 1.2) | – | – | – | – |
| Total (19 MSs) | 4,383 | 2 | 0.05 | (0, 0.16) | 5,584 | 3 | 0.05 | (0.01, 0.16) | 1,968 | 0 | 0.0 | (0, 0.19) | 293 | 0 | 0.0 | (0, 1.25) |
| Switzerland | 302 | 0 | 0.0 | (0, 1.2) | 307 | 0 | 0 | (0, 1.2) | – | – | – | – | – | – | – | – |
N: Number of samples tested on selective culture media; CI: confidence interval; n: number of samples positive for presumptive carbapenemase‐producing E. coli. ‐: not reported; CZ: the Czech Republic; UK: the United Kingdom.
The Netherlands also reported data from their specific carbapenemase monitoring performed with different protocol. These data are shown in a separate text box below.
Eighteen MSs and Switzerland (Table 75) reported results from the investigation of the presence of carbapenemase‐producing E. coli in meat from broilers (4,383 samples analysed by the reporting MSs) performed according to Commission Implementing Decision 2013/652/EU. According to the data reported, all these countries excepting France, and in addition Poland, also investigated samples from broilers (5,584 analysed samples by the MSs). Eight MSs (Austria, France, Hungary, Italy, Poland, Portugal, Sweden and the United Kingdom) also reported data for fattening turkeys (1,968 samples analysed).
From all reporting countries, two MSs, Romania and Cyprus, reported data for five isolates with a presumptive carbapenemase‐producer phenotype. Romania confirmed the genotype of the three presumptive carbapenemase producers, two isolates from broilers and one isolate from meat from broilers, as E. coli bla OXA‐48 carriers. The isolates from Cyprus, one isolate from broiler meat and one from broiler, have not yet been confirmed genotypically and should be further investigated.
Monitoring of carbapenemase‐producing Enterobacteriaceae in livestock in the Netherlands (kindly provided by the Netherlands).
1.
Application of a method with optimum sensitivity is essential in an environment with a very low anticipated prevalence of carbapenem resistance. Therefore, a PCR‐based method was used for all faecal samples sent to Wageningen Bioveterinary Research (WBVR), Lelystad by the Dutch Food and Consumer Protection Authority (NVWA) for the annual antimicrobial resistance monitoring programme. Faecal samples were grown overnight in Buffered Peptone Water (BPW). After incubation, the culture was centrifuged and DNA isolated from pellet; five individual samples were pooled into one. A commercial RT‐PCR assay (Check‐Points, CarbaCheck MDR RT), which can detect the most important carbapenemase gene families (bla KPC, bla NDM, bla VIM, bla IMP and bla OXA‐48), was used on the pooled sample according to the manufacturer's instructions. If RT‐PCR gave suspicious or positive results, a step‐wise analysis was performed to confirm the results:
RT‐PCR was performed on individual purified DNA of the five samples of the pool.
If the RT‐PCR was positive the gene was confirmed with Sanger sequencing.
Original faecal sample and corresponding broth culture of suspected positive samples were inoculated on commercial selective plates (ChromID CARBA and ChromID OXA; Biomerieux) and on heart infusion agar with 5% sheep blood (HIS) with 0.125 mg/L ertapenem (for Shewanella spp. that do not grow easily on ChromID plates).
Carbapenemase screening in 2016 (n = 1,800, Table 76) resulted in two bla OXA‐48‐positive samples in the RT‐PCR assay (one slaughter pig and one veal calf faecal sample). On the selective ChromID plates, no growth of Enterobacteriaceae was observed. From the two positive faecal samples, Shewanella spp. was isolated on HIS plates only from the slaughter pig sample in which the presence of a chromosomally located bla OXA‐48b was confirmed by PCR and sequencing. These results confirmed the findings observed in previous years, in which no carbapenemase‐producing Enterobacteriaceae were detected in livestock in the Netherlands. bla OXA‐48‐like genes have also been found in faecal samples in 2013 and 2015 (Ceccarelli et al., 2017). Considering that Shewanella spp. carries bla OXA‐48‐like genes on the chromosome and is acknowledged as the natural progenitor of this carbapenemase family (Zong, 2012), these genes were considered of environmental origin and not a public health risk.
Table 76.
Overview of results using RT‐PCR screening for carbapenemase‐resistant Enterobacteriaceae in faecal samples of livestock in 2015 and 2016 in the Netherlands
| Animal species | Number of samples screened for CPE | Number of samples positive for CPE | Prevalence (%) (95% IC) |
|---|---|---|---|
| Broilers | 1,000 | 0 | 0 (0–0.37) |
| Layers | 193 | 0 | 0 (0–1.89) |
| Ducks | 100 | 0 | 0 (0–3.62) |
| Dairy cattle | 602 | 0 | 0 (0–0.61) |
| Veal calves | 605 | 0 | 0 (0–0.61) |
| Slaughter pigs | 600 | 0 | 0 (0–0.61) |
Comment provided by the Netherlands: Wang et al. described a PCR‐based method to detect bla NDM directly from faecal samples and compared the results to culture diagnostics (Wang, 2017). They demonstrated that bla NDM was present in 165/330 (50%) samples from commercial farms, whereas culture‐based methods detected carbapenemase‐resistant Enterobacteriaceae (CRE) in 83/330 (25%) samples only.
7.5. Discussion
Third‐generation cephalosporins are antimicrobials of particular importance as they are frequently used as the first‐line treatment in invasive Gram‐negative infections, for example infections caused by E. coli or Salmonella. In 2016, as in the previous years, resistance to third‐generation cephalosporins was generally detected at low levels in Salmonella and indicator E. coli isolates recovered from broilers and their meat products, laying hens and fattening turkeys using non‐selective detection methods.
7.5.1.
Third‐generation cephalosporin and carbapenem resistance in Salmonella spp. from humans (voluntary testing and reporting)
Data on ESBL‐ and AmpC‐producing Salmonella in humans were collected on a voluntary basis from the public health reference laboratories for 2016, as for 2015. Monitoring of these enzymes is voluntary for these laboratories, although European Centre for Disease Prevention and Control (ECDC) recommends screening following a phenotypical testing algorithm based on the ‘EUCAST guidelines for detection of resistance mechanisms and specific resistances of clinical and/or epidemiological importance’ (EUCAST, 2013; ECDC, 2016).
The 21 countries reporting microbiological resistance to either or both of the third‐generation cephalosporins included in the panel were therefore asked to provide results of additional testing, including synergy tests, if available (this was an expansion compared with 2015 when the focus was on isolates resistant to both third‐generation cephalosporins). Of these, 12 MSs and 1 non‐MS had performed testing for presence of ESBL and AmpC. ESBL‐producing Salmonella were identified in all these countries with 0.8% of the tested isolates in MSs being ESBL‐producing. ESBL was reported in 11 different serovars.
In 2011, a clone of S. Infantis, with bla CTX‐M‐1 and multidrug resistance carried on a conjugative mosaic megaplasmid, emerged in Italian poultry in 2011 with human infections being reported in 2012 and then increasing (Franco et al., 2015). In 2015, when ESBL data were included in this report for the first time, four EU/EEA countries reported ESBL‐producing S. Infantis from humans, with half of the isolates from Italy. In 2016, twelve per cent of S. Infantis isolates (n = 25) from Italian poultry were ESBL‐producing in 2016. While no S. Infantis with ESBL from human cases had been received for typing at the Italian public health institute in 2016, cases were reported at the local level and have continued to be reported also in 2017 (personal communication I. Luzzi and C. Lucarelli, Istituto Superiore di Sanità, April and July 2017). Three other Member States reported ESBL in S. Infantis from humans with bla CTX‐M‐1 in 2016. Further typing would be required to assess if these were of the same lineage as the Italian clone. A high carriage of ESBL was reported in S. Kentucky in 2016 where four MSs had detected such isolates. Most isolates were reported by Malta and the Netherlands. Considering the high proportion of MDR and ciprofloxacin resistance in the dominating clone of S. Kentucky in the EU, this finding is of concern. See further discussion on S. Kentucky in the chapter 3.2.1 Antimicrobial resistance in Salmonella. Four MSs reported ESBL in S. Enteritidis in 2016 but the proportion of ESBL producers was small in comparison to the total number of S. Enteritidis isolates. ESBL was more frequent in S. Typhimurium and monophasic S. Typhimurium 1,4,[5],12:i:‐, and a few isolates with AmpC‐producing S. Typhimurium were also reported by two MSs. From next year, it will be easier for public health reference laboratories to report ESBL and AmpC in Salmonella to TESSy. Genotyping results would however continue to be collected via other sources until it has been agreed how the results of whole genome sequencing should be reported and analysed in the molecular surveillance of Salmonella in TESSy.
No meropenem resistance was reported in Salmonella isolates from humans in 2016. It should however be noted that meropenem results were interpreted with clinical breakpoints in seven of 23 reporting countries and the clinical breakpoint for non‐susceptibility to meropenem (resistant and intermediate resistant categories) differs from the ECOFF by four dilutions for Salmonella. Low‐grade meropenem resistance would thus not be detected in countries applying clinical breakpoints. National public health reference laboratories should be aware that EUCAST recommends the use of ECOFFs as the screening breakpoint to detect carbapenemase‐producing Enterobacteriaceae (EUCAST, 2013, 2017b).
Third‐generation cephalosporin and carbapenem resistance in Salmonella spp. from food and animals (routine monitoring)
The analysis of Salmonella spp. serovars with similar characteristics detected in food, man and food‐ producing animals can assist in source attribution and epidemiological investigations, as well as suggesting areas for investigation at the molecular level, which may confirm that isolates are closely related. As in the previous years, in 2016, third‐generation cephalosporin resistance in Salmonella spp. was very low or absent for most of the MSs (only 43 isolates were reported as resistant to any of the third‐generation cephalosporins from more than 4,600 isolates tested). Ertapenem resistance was observed in two isolates with an ESBL or AmpC phenotype and this resistance phenotype could be related to the ESBL or AmpC β‐lactamase production in conjunction with loss of porins. Considering the low number of isolates, only for certain MSs the number of ESBL‐producing Salmonella spp. was clearly higher than the AmpC producers reported. This was the case of Portugal, country that reported the highest number of presumptive ESBL producers (14), all of them S. Typhimurium monophasic variant isolated from broiler meat (carcasses at slaughterhouse, 13 isolates) or broilers (stocks in farm, 1 isolate). The clonal relationship among isolates has not been further elucidated, to our knowledge. The occurrence of only a few serovars having acquired these types of resistance, mainly S. Infantis, S. Paratyphi B dT+ (s. Java) and S. Typhimurium monophasic variant (in Portugal, as explained above) may be related to the prevalence of these serovars in those MSs, where resistance was detected or may be related to particular features that have allowed them to develop resistance or enabled them to spread. Two ESBL/AmpC‐producing Paratyphi B dT+ isolates were detected in meat from broilers in Belgium and the Netherlands. S. Infantis resistant to cefotaxime or ceftazidime due to the production of ESBLs (6 isolates) or AmpC (1) were detected in broilers from the Czech Republic, Hungary, Italy and or Romania and broiler meat from Hungary. Italy also reported additional 49 ESBL‐producing S. Infantis isolates from broilers (sampled at farms and slaughter) collected within their National monitoring programme. During the last years, several studies have been carried out understand the molecular epidemiology of this typically multidrug‐resistant serotype and the spread of highly successful S. Infantis clones (Franco et al., 2015; Hindermann et al., 2017). Contrary to that presented above for human, none of the S. Kentucky reported showed an ESBL phenotype.
Third‐generation cephalosporin and carbapenem resistance in indicator E. coli from food and animals (routine monitoring)
For the routine AMR monitoring in commensal indicator E. coli, the examination of a single randomly selected E. coli isolate from non‐selective culture plates was performed. This approach enables the assessment of the proportion of randomly selected E. coli that is resistant to cephalosporins, and their categorisation as presumptive ESBL/AmpC/carbapenemase producers. It provides a lower degree of sensitivity, particularly where ESBL‐producing E. coli constitutes a small proportion of the total E. coli flora, than that obtained using specific monitoring based on selective media. The approach is useful for consumers risk assessment, as it is considered that E. coli will be transferred along the food chain in a random fashion (EFSA, 2012a).
In 2016, the proportion of indicator E. coli isolates from poultry (broilers and fattening turkeys) collected within the routine monitoring by the MSs considered as presumptive ESBL, AmpC, ESBL + AmpC producers was in general low or very low. In total, only 2.2% of all poultry isolates tested (230 out of more than 10,000) presented any of these phenotypes, being higher this proportion in fattening turkeys than in broilers (2.7% vs 2.2%). For broilers, the only outstanding country in which the prevalence of both presumptive ESBLs‐ and AmpC‐producing E. coli was Lithuania (17% and 36% of Lithuanian isolates tested), whereas for fattening turkeys, the highest prevalence of ESBLs‐producing E. coli isolates was Spain (16% of Spanish isolates tested). While in broilers isolates with an ESBL and AmpC phenotype were found with similar prevalence (1.3% vs 1.0%, respectively), in fattening turkeys the detection of AmpC production in E. coli was very rare (2.6% ESBLs phenotype vs 0.1% AmpC phenotype). In general, except for presumptive AmpC‐producing E. coli in broilers, prevalence was slightly lower than the one reported for isolates collected within the 2014 routine monitoring (ESBLs vs AmpC, 3.6% vs 1.7% in broilers, and 2.1% vs 0.4% in fattening turkeys) (EFSA and ECDC, 2016b).
Specific monitoring of ESBL‐/AmpC‐/carbapenemase‐producing E. coli
For specific ESBL/AmpC/carbapenemase monitoring, culture methods using a non‐selective enrichment and a selective medium containing a third‐generation cephalosporin for the detection of ESBL‐/AmpC‐/carbapenemase‐producing E. coli were used, as recommended by the EURL‐AR (www.eurl-ar.eu; San José et al., 2014; Hasman et al., 2015a; Cavaco et al., 2016). The selective medium contains 1 mg/L of cefotaxime, the screening breakpoint recommended by EUCAST to maximise sensitivity and specificity of the detection of AmpC‐ and ESBL‐producing E. coli. The specific monitoring therefore employs culture of samples on selective media, which is able to detect very low numbers of resistant isolates present within a sample. The method enables the determination of the proportion of the total number of samples tested containing ESBL‐/AmpC‐/carbapenemase‐producing E. coli even when low numbers of such resistant E. coli are present. The sensitivity to detect the producer E. coli by this approach is higher than that obtained when performing the routine monitoring in which E. coli are randomly selected from the total E. coli population present, especially when investigating populations with a low prevalence of ESBL‐producing E. coli. The absolute sensitivity of the method has not however been determined. If large numbers of AmpC‐producing E. coli are present in samples, they may obscure the concurrent presence of ESBL‐producing E. coli in the same samples, because only one confirmed E. coli is subjected to further testing per sample. The proportion of AmpC‐producing vs ESBL‐producing E. coli present within a sample can therefore influence the culture result obtained. Within this monitoring, carbapenemase‐producing isolates resistant to third‐generation cephalosporins could also be identified, although the probability to identify them similarly depends on the number of ESBL/AmpC producers which may concurrently be present in the sample.
In 2016, specific monitoring of ESBL‐/AmpC‐/carbapenemase‐producing E. coli was performed on caecal contents from broilers and fattening turkeys and fresh meat (retail) from broilers. This specific ESBL‐/AmpC‐/carbapenemase‐producing monitoring was performed for the first time on a mandatory basis for these matrices and so all MSs excepting Malta reported data for broilers and their meat products. The specific monitoring in fattening turkeys is only mandatory for countries where the production of turkey meat is more than 10,000 tonnes slaughtered per year. Eleven MSs reported data for this monitoring (Sweden, with a production of 4,200 tonnes in 2016 reported voluntarily). In this case, the prevalence of indicator E. coli isolates from poultry and their meat products (poultry meat) collected within this specific monitoring by the MSs considered as presumptive ESBL, AmpC, ESBL + AmpC producers was in high/very high. In fact, in 57% from the samples from broiler meat, 47% from broilers, and 42% from fattening turkeys, isolates with any of these phenotypes were detected. In general, prevalence of presumptive ESBL producers in all matrices investigated was higher than the one for presumptive AmpC producers (36% vs 27% from isolates from meat from broilers, 35% vs 24% in isolates from broilers, and 37% vs 7% in fattening turkeys, respectively). As described in the literature and several national reports, there were marked geographical variations in the prevalence of ESBL‐producing vs AmpC producing E. coli, with very high ESBL‐producing E. coli prevalence in Belgium, Latvia, Spain (78–71% of samples tested) followed by Italy (60%) vs very high AmpC‐prevalence in eastern Europe MSs (Slovenia, Croatia and Hungary) for isolates from broiler meat. For broilers, the highest prevalence for ESBL‐producing E. coli was also reported also for Latvia, Belgium, Italy and Spain (90–79%), followed by Ireland and Cyprus (68–66), whereas for this matrix, the prevalence of AmpC producers was high in Lithuania, Slovenia, Hungary and Cyprus (67%–52%). Also for fattening turkeys, the highest prevalence for ESBL‐producing E. coli was reported by MSs from southern and eastern Europe, being very high for Spain and Italy (87–76%) followed by Romania (57%), whereas for AmpC‐producing E. coli, a high prevalence was reported by Poland (23%).
Unfortunately, the 2016 collected data could not be compared with the data reported for the specific monitoring performed in these matrices in 2014. In 2014, the specific ESBL‐/AmpC‐/carbapenemase‐producing monitoring was performed on a voluntary basis by only four MSs and two non‐MSs (Finland, Italy, Slovenia, Sweden and Iceland and Switzerland reported data on specific monitoring in broilers; Italy and Sweden reported data on specific monitoring in fattening turkeys) and the prevalence of ESBL/AmpC in the samples analysed was not assessed, as data on positive/negative samples were not collected by EFSA.
In 2016, in most but not all countries, the detection of presumptive ESBL E. coli exceeded that of AmpC E. coli. Among the isolates resistant to third‐generation cephalosporins, the occurrence of E. coli with an ESBL phenotype varied widely between reporting countries (almost all MSs and non‐MSs reported data), occurring between 17% and 82% of meat from broilers collected at retail (only Norway did not report any isolate with this presumptive phenotype) and between 25% and 99% of broilers caecal samples examined. For fattening turkeys (only 11 MSs and one non‐MS reported data), the occurrence of presumptive ESBLs in isolates resistant to third‐generation cephalosporins varied among 51% and 100% (not considering Sweden that reported only data for one isolate). In general, for those reporting countries the occurrence of ESBL in fattening turkeys were higher than those found in poultry or poultry meat.
Several studies have compared the molecular characteristics of the ESBL/AmpC genes, plasmids or clones collected from animal, their meat products and human sources (EFSA, ESBLs, Madec et al., 2017). Some publications have pointed out that the genes/plasmids present in the meat gathered at retail do not correspond with the ones found in the animals or the meat sampled at slaughter. Obviously, there are several potential sources of ESBL/AmpC producers on meat, including the animals from which the meat was derived, but also cross‐contamination with other products, machinery and the environment, as well as those workers who are producing and handling the meat product. The role of imported foodstuffs could also explain the differences found by different authors.
The role of poultry and meat from poultry as an important source of animal‐associated ESBL/AmpC‐E. coli infections in humans remains controversial (Madec et al., 2017; Dorado‐García et al., 2018). Recent studies, have shown that most livestock‐ or food‐associated reservoirs do not show a high level of similarity in their gene profiles compared with humans from the general and clinical populations, suggesting poultry and poultry meat are not major contributors to ESBL/AmpC occurrence in humans (Dorado‐García et al., 2018). However, there are still several gaps in the knowledge of the transmission of ESBL‐producing E. coli between and within livestock holdings and their environment and subsequently to humans (Horigan et al., 2016).
Carbapenemase‐producing E. coli in 2016
The emergence and spread of microorganisms with acquired carbapenemases is of public health concern. Although reports on carbapenemase‐producing microorganisms isolated from food‐ producing animals and foods are still scarce, the numbers tend to be gradually increasing (EFSA BIOHAZ Panel, 2013; Guerra et al., 2014; Rubin et al., 2014; Abdallah et al., 2015; Zurfluh et al., 2015; Fischer et al., 2016; Irrgang et al., 2016; Mollenkopf et al., 2017; Madec et al., 2017; Pulss et al., 2017). In Europe, carbapenemase‐producing E. coli and/or Salmonella have been isolated from livestock farms (Fischer et al., 2016; Irrgang et al., 2016; Pulss et al., 2017) as well as from food of animal origin (Borowiak et al., 2017; EFSA and ECDC, 2017b; Roschanski et al., 2017). In Germany, the first described carbapenemase‐producing E. coli and Salmonella isolates were detected in 2012 (Fischer et al., 2012, 2013). Since them, recurrent detection of the same clone of VIM‐1 producing Salmonella Infantis and/or E. coli in Germany has been reported, being found in poultry and pig farms (Irrgang et al., 2016) and food derived thereof such as a pork sausage (Borowiak et al., 2017). Also, Belgium reported the detection of a VIM‐1‐producing E. coli isolated from a pigmeat sample gathered in 2015 at retail (EUSR‐AMR, 2017). Recently, a seafood sample (Venus clam) collected in a German market also resulted positive for VIM‐1 producing E. coli. In this case, the clams had been a harvested in the Mediterranean see (Italy) (Roschanski et al., 2017). For other carbapenemases, clinical E. coli isolates collected in an Italian pig farm were found to be positive for the bla OXA‐180 gene (Pulss et al., 2017). For those carbapenemase‐producing isolates detected on food samples, the potential sources for these bacteria could be various, including the animals from which the meat was derived, the environment in which the meat was produced, cross‐contamination with other items during production, as well as those people involved in handling and preparing the meat.
Following the adoption of EU Legislation (Decision 2013/652/EU), the MSs implemented the surveillance of carbapenem resistance in both Salmonella and E. coli including carbapenems (meropenem, ertapenem and imipenem) in the antimicrobial susceptibility testing both for the routine and the specific monitoring programmes. The specific monitoring of ESBL‐/AmpC‐/CP‐producing E. coli, in which isolation is performed using a selective medium with extended‐spectrum cephalosporins, became mandatory from 2015 onwards. The option to perform specific monitoring focusing only on carbapenemase‐producing microorganisms (isolation with selective medium containing carbapenems) remained voluntary.
According to the data reported to EFSA by the MSs and non‐MSs, in 2016, presumptive CP‐producing indicator E. coli were found in samples collected within both the routine monitoring and the specific monitoring programmes. Within the routine monitoring of antimicrobial resistance for indicator E. coli and Salmonella, Cyprus found one isolate from broilers which exhibited resistance to meropenem, ertapenem and carbapenem, with a clear presumptive carbapenemase‐producing phenotype. Also within the specific E. coli ESBL‐/AmpC‐/carbapenemase‐producing monitoring, presumptive CP producers E. coli were found in broiler meat samples gathered at retail by Cyprus (eight isolates). These isolates have not been further characterised yet.
In the previous year, Germany had reported to EFSA for the first time the presence of carbapenemase‐producing (VIM‐1) E. coli collected within the EU mandatory ESBL/AmpC/carbapenemase‐producing monitoring of livestock, in this case, in pig samples (Irrgang et al., 2016). Also Belgium had voluntarily reported the detection of a VIM‐1‐producing E. coli isolated from pigmeat gathered at retail collected within their national routine monitoring. The detection of all these isolates through mandatory/voluntary monitoring, confirms that this monitoring is capable of detecting carbapenemase‐producing E. coli.
To increase the probability of detecting carbapenem‐resistant microorganisms, performing specific monitoring of carbapenemase‐producing microorganisms (mainly E. coli, but with the option to report other enterobacteria such as Salmonella) was recommended. Culture methods using a non‐selective enrichment and selective media containing carbapenems for the detection of carbapenemase‐producer E. coli (protocol recommended by the EURL‐AR, www.eurl-ar.eu; San José et al., 2014; Hasman et al., 2015b) were recommended to be used. In this monitoring, which was performed on a voluntary basis, bacteria that produced carbapenemases that do not confer resistance to cephalosporins (i.e. OXA‐48) could also be identified.
In 2016, a high number of countries, 19 MSs and one non‐MS, performed this voluntary selective culture to investigate the presence of carbapenemase‐producing organisms in poultry: meat from (18 MSs, 4,383 samples analysed), broilers (18 MSs, 5,584 samples), fattening turkeys (8 MSs, 1,968 samples) and meat from turkeys (1 MS, 293 samples). The Netherlands also reported voluntarily data from their national monitoring on samples from broilers (1,000 samples), laying hens (193) and ducks (100) as well as in additional matrices, using a different isolation method (Ceccarelli et al., 2017; Wang et al., 2017).
Among all these samples tested within the specific carbapenemase‐producing monitoring, two MSs were able to detect isolates with a presumptive CP‐producer phenotype. Romania confirmed the presence blaOXA‐48 in E. coli isolates from broiler meat (1 isolate from a sample gathered in a restaurant) and broilers (2 isolates). Cyprus reported the presence of two presumptive carbapenemase‐producing isolates in two isolates from broiler meat and broilers, although the genotype from these isolates has not yet been confirmed.
In the previous year (2015), specific carbapenemase monitoring was performed by a considerably lower number of MSs, in meat from pigs (8 MSs; 1,833 samples analysed), meat from bovine animals (8 MSs, 1,818 samples), fattening pigs (10 MSs, 2,584 samples), cattle (3 MSs, 682) or bovines under 1 year of age (2 MSs, 516 samples), and no carbapenemase producers were identified within this specific monitoring.
Within the different monitoring programmes, additional isolates resistant to ertapenem and/or imipenem were observed. In most of the cases these isolates presented an ESBL or/and an AmpC phenotype, and the resistance to carbapenems could be related to the presence of another resistance mechanism (i.e. ESBL or AmpC production in conjunction with loss of porins). In general, all presumptive CP producers detected for the present report exhibited microbiological resistance to meropenem (most of the isolates with MICs very close to EUCAST ECOFF), together with ertapenem and/or imipenem. This can make their detection very difficult through antimicrobial susceptibility testing or isolation with highly selective protocols.
For all the presumptive carbapenemase‐producing isolates reported in 2016 (n = 14), further analysis such as whole genome sequence analysis (i.e. reference testing performed by the EURL‐AR), should help to elucidate the mechanisms responsible for the phenotype.
Despite the very low prevalence of carbapenemase producers, the difficulties in detecting them due to the very low MIC values for carbapenems of most of these isolates, or possible limitations on the sensitivity/specificity of the isolation methods used, already in 2015 samples, Germany and Belgium were able to detect carbapenemase‐producing E. coli (routine or specific ESBL‐/AmpC‐/carbapenemase‐producing microorganisms monitoring). If the data from Cyprus are confirmed, independently of the monitoring programme performed, carbapenem‐producing E. coli could be detected in this country. Specific carbapenem‐producing monitoring was also successful to detect OXA‐48‐producing E. coli in Romania. All these isolates exhibited very low MICs (MIC = 0.25 mg/L, just above the EUCAST ECOFF value) and would not have been detected if only CBPs would have been applied. Due to the importance for public health of carbapenemase‐producing E. coli and or Salmonella, both as pathogens or as vectors for resistance mechanisms, from a One‐Health perspective, there is a need to follow further developments in this area for livestock and their food products. The performance of specific carbapenemase monitoring, especially in those MSs where carbapenemase‐producing microorganisms have been isolated from livestock and/or their food products have been already identified, will give a comprehensive overview of the current situation at European level.
Summarising, in 2016, fourteen presumptive carbapenemase‐producing indicator commensal E. coli isolates from poultry and/or meat thereof were reported by three MSs (Cyprus 11 isolates and Romania 3). These isolates were collected within the framework of all monitoring programmes: routine, specific ESBL/AmpC/carbapenemase‐producing E. coli and/or specific for carbapenemase‐producing microorganisms (voluntary monitoring), independently of the isolation methods used (with non‐selective medium, medium containing cephalosporins, and/or medium containing carbapenem, respectively). Within the mandatory routine monitoring (non‐specific), Cyprus reported one isolate from broilers. Within the mandatory specific monitoring for ESBL/AmpC/carbapenemase‐producing E. coli, Cyprus reported isolates collected from meat from broilers (8). The voluntary specific carbapenem‐producing monitoring was also successful to detect OXA‐48‐producing E. coli from broiler (two isolates) and broiler meat (one isolate) in Romania, in addition to E. coli in Cyprus (one from broiler meat, and one from broiler). The isolates reported by Cyprus have not yet been confirmed genotypically and should be further investigated.
Further assessment
Because this report covers only phenotypic monitoring, it is not possible to determine the class or exact type of β‐lactamase enzyme which is responsible for conferring the resistance detected to third‐generation cephalosporins and or carbapenems. Categorising isolates which are resistant to third‐generation cephalosporins and/or carbapenems according to their presumptive ESBL, AmpC and or carbapenemase phenotype provides useful epidemiological information on the reservoirs of the different types of resistance present in E. coli and Salmonella spp. in different food‐producing animal populations and categories of foodstuffs.
Further developments in the surveillance of antimicrobial resistance, i.e. wider and routinely use of whole genome sequencing, could increase the number of MSs reporting also genotyping data to complement phenotypical data, and allow the detection of emerging resistance genes, plasmids or clones at the European level.
Abbreviations
- %
percentage of resistant isolates per category of susceptibility or multiple resistance
- % f
percentage frequency of isolates tested
- % Res
percentage of resistant isolates
- –
no data reported
- AAC
aminoglycoside acetyltransferases
- AME
aminoglycosides modifying enzyme
- AMR
antimicrobial resistance
- ANT
aminoglycoside nucleotidyltransferase
- APH
aminoglycoside phosphotransferases
- APHA
Animal and Plant Health Agency
- ARM
At‐retail monitoring
- AST
antimicrobial susceptibility testing
- BIOHAZ
EFSA Panel on Biological Hazards
- BPW
buffered peptone water
- CA
community‐associated
- CA‐SFM
French Society for Microbiology
- CBP
clinical breakpoints
- CC
clonal complex
- CLSI
Clinical and Laboratory Standards Institute
- CP
carbapenemase producer
- CTX‐M
cefotaxime
- DD
disc diffusion method
- DIN
Deutsches Institut für Normung
- DL
dilution/dilution method
- DLG
dilution with gradient step
- EARS‐Net
European Antimicrobial Resistance Surveillance Network
- EC
European Commission
- ECDC
European Centre for Disease Prevention and Control
- ECOFF
epidemiological cut‐off value
- EEA
European Economic Area
- EFSA
European Food Safety Authority
- ENGAGE
Establishing Next Generation sequencing Ability for Genomic analysis in Europe
- ESBL
extended‐spectrum β‐lactamase
- EQA
external quality assessment
- EU
European Union
- EUCAST
European Committee on Antimicrobial Susceptibility Testing
- EURL‐AR
EU Reference Laboratory for Antimicrobial Resistance (www.crl-ar.eu)
- FOX
cefoxitin
- FWD
food‐ and waterborne diseases and zoonoses
- HA
healthcare‐associated
- HACCP
hazard analysis and critical control point
- I
intermediate
- IEC
immune evasion cluster
- IR
inverted repeat
- IZD
inhibition zone diameter
- LA
livestock‐associated
- LOS
lipooligosaccharide
- MDR
multiple drug resistance
- MDRGI
multidrug‐resistant genomic island
- MIC
minimum inhibitory concentration
- MGE
mobile genetic element
- MLST
multilocus sequence typing
- MLVA
multiple‐locus variable number tandem repeat analysis
- MRSA
meticillin‐resistant Staphylococcus aureus
- MS
Member State
- NA
not applicable/not available
- NARMS
National Antimicrobial Resistance Monitoring System
- NCP
National Control Programme
- NRL
National Reference Laboratory
- NVWA
Dutch Food and Consumer Protection Authority
- OFCEP
On‐farm control and eradication programme
- OFCI
On‐farm clinical investigations
- PFGE
pulsed‐field gel electrophoresis
- PMQR
plasmid‐mediated quinolone resistance
- PVL
Panton‐Valentine leukocidin
- Q
quantitative
- QRDR
quinolone resistance‐determining regions
- R
resistant
- res1–res9
resistance to one antimicrobial substance/resistance to nine antimicrobial substances of the common set for Salmonella
- S
susceptible
- SCCmec
staphylococcal chromosome cassette mec
- SIR
susceptible, intermediate, resistant
- ST
sequence type
- TESSy
The European Surveillance System
- WBVR
Wageningen Bioveterinary Research
- WGS
whole genome sequencing
- WHO
World Health Organization
Antimicrobial substances
- AMC
amoxicillin/clavulanate
- AMP
ampicillin
- AZM
azithromycin
- CAZ
ceftazidime
- CHL
chloramphenicol
- CIP
ciprofloxacin
- CLA
clavulanate
- CLI
clindamycin
- CST
colistin
- CTX
cefotaxime
- ERY
erythromycin
- FUS
fusidic acid
- GEN
gentamicin
- KAN
kanamycin
- LZD
linezolid
- MEM/MER
meropenem
- MUP
mupirocin
- NAL
nalidixic acid
- QD
quinupristin/dalfopristin
- RIF
rifampicin
- SMX
sulfamethoxazole
- STR
streptomycin
- SUL
sulfonamides
- SXT
sulfamethoxazole
- TGC
tigecycline
- TIA
tiamulin
- TET
tetracycline
- TMP
trimethoprim
MSs of the EU and other reporting countries in 2015
- Austria
AT
- Belgium
BE
- Bulgaria
BG
- Croatia
HR
- Cyprus
CY
- Czech Republic
CZ
- Denmark
DK
- Estonia
EE
- Finland
FI
- France
FR
- Germany
DE
- Greece
GR
- Hungary
HU
- Ireland
IE
- Italy
IT
- Latvia
LV
- Lithuania
LT
- Luxembourg
LU
- Malta
MT
- Netherlands
NL
- Poland
PL
- Portugal
PT
- Romania
RO
- Slovakia
SK
- Slovenia
SI
- Spain
ES
- Sweden
SE
- United Kingdom
UK
Non‐MSs reporting, 2016
- Iceland
IS
- Norway
NO
- Switzerland
CH
Definitions
- ‘Antimicrobial‐resistant isolate’
In the case of quantitative data, an isolate was defined as ‘resistant’ to a selected antimicrobial when its minimum inhibitory concentration (MIC) value (in mg/L) was above the cut‐off value or the disc diffusion diameter (in mm) was below the cut‐off value. The cut‐off values, used to interpret MIC distributions (mg/L) for bacteria from animals and food, are shown in Material and methods, Tables 5, 6 and 7. In the case of qualitative data, an isolate was regarded as resistant when the country reported it as resistant using its own cut‐off value or break point
- ‘Level of antimicrobial resistance’
The percentage of resistant isolates among the tested isolates
- ‘Reporting MS group’
MSs (MSs) that provided data and were included in the relevant table for antimicrobial resistance data for the bacteria–food/animal category–antimicrobial combination
- Terms used to describe the antimicrobial resistance levels
Rare: < 0.1% Very low: 0.1% to 1.0% Low: > 1.0% to 10.0% Moderate: > 10.0% to 20.0% High: > 20.0% to 50.0% Very high: > 50.0% to 70.0% Extremely high: > 70.0%
Suggested citation: EFSA (European Food Safety Authority) and ECDC (European Centre for Disease Prevention and Control) , 2018. The European Union summary report on antimicrobial resistance in zoonotic and indicator bacteria from humans, animals and food in 2016. EFSA Journal 2018;16(2):5182, 270 pp. 10.2903/j.efsa.2018.5182
Requestor: European Commission
Question number: EFSA‐Q‐2016‐00622
Acknowledgements: the European Food Safety Authority (EFSA) and the European Centre for Disease Prevention and Control (ECDC) wish to thank the members of the Scientific Network for Zoonoses Monitoring Data (EFSA) and the Food‐ and Waterborne Diseases and Zoonoses Network (ECDC) who provided the data and reviewed the report and the members of the Scientific Network for Zoonoses Monitoring Data, for their endorsement of this scientific output. Also, the contribution of EFSA staff members: Pierre‐Alexandre Belœil, Gina Cioacata, Raquel Garcia Fierro, Beatriz Guerra, Anca‐Violeta Stoicescu, Kenneth Mulligan, Francesca Riolo and Krisztina Nagy, the contributions of ECDC staff member: Therese Westrell, and the contributions of EFSA's contractors: Sophie Granier, Björn Bengtsonn, Isabelle Kempf and Cathy Tallentire for the support provided to this scientific output.
Approved: 2 February 2018
Data: All tables on resistance data used to produce this 2016 EUSR and cross‐referenced in the text are available on the EFSA Knowledge Junction community at: https://doi.org/10.5281/zenodo.1183248
Notes
Commission Implementing Decision 2013/652/EU of 12 November 2013 on the monitoring and reporting of antimicrobial resistance in zoonotic and commensal bacteria. OJ L 303, 14.11.2013, p. 26–39.
Decision No 1082/2013/EU of the European Parliament and of the Council of 22 October 2013 on serious cross‐border threats to health and repealing Decision No 2119/98/EC. OJ L 293, 5.11.2013, p. 1–15.
Commission Decision 2012/506/EU amending Decision 2002/253/EC laying down case definitions for reporting communicable diseases to the Community network under Decision No 2119/98/EC of the European Parliament and of the Council. OJ L 262, 27.9.2012, p. 1–57.
Regulation (EC) No 178/2002 of the European Parliament and of the Council of 28 January 2002 laying down the general principles and requirements of food law, establishing the EFSA and laying down procedures in matters of food safety. OJ L 31, 1.2.2002, p. 1–24.
Regulation (EC) No 851/2004 of the European Parliament and of the Council of 21 April 2004 establishing a European centre for disease prevention and control. OJ L 142, 30.4.2004, p. 1–11.
Commission Implementing Decision 2013/652/EU of 12 November 2013 on the monitoring and reporting of antimicrobial resistance in zoonotic and commensal bacteria. OJ L 303, 14.11.2013, p. 26–39.
The epidemiological cut‐off (ECOFF) values separate the naive, susceptible wild‐type bacterial populations from isolates that have developed reduced susceptibility to a given antimicrobial agent (Kahlmeter et al., 2003). The ECOFFs may differ from breakpoints used for clinical purposes, which are set out against a background of clinically relevant data, including therapeutic indication, clinical response data, dosing schedules, pharmacokinetics and pharmacodynamics. The use of harmonised methods and ECOFFs ensures the comparability of data over time at the country level and also facilitates the comparison of resistance between MSs.
‘Quantitative data’ derived from dilution methods consisted of the number of isolates having a specific MIC value (measured in mg/L) relative to the total number of isolates tested, for each antimicrobial agent and specific food/animal category.
The same sampling design was used to collect indicator E. coli isolates, whether dedicated to the routine monitoring of AMR or the specific monitoring of ESBL‐/AmpC‐/carbapenemase‐producing E. coli.
Available online: www.eurl-ar.eu
Giving the percentage of isolates ‘microbiologically’ resistant out of those tested.
SIR stands for susceptible, intermediate, resistant.
Of particular note is that ‘microbiological’ resistance to ciprofloxacin was addressed using ECOFF CIP > 0.064 mg/L in this report.
i.e. isolates resistant to three or more antimicrobial classes of the harmonised panel.
References
- Abdallah HM, Reuland EA, Wintermans BB, Al Naiemi N, Koek A, Abdelwahab AM, Ammar AM, Mohamed AA and Vandenbroucke‐Grauls CM, 2015. Extended‐spectrum beta‐lactamases and/or carbapenemases‐producing Enterobacteriaceae isolated from retail chicken meat in Zagazig Egypt. PLoS ONE, 10, e0136052. [DOI] [PMC free article] [PubMed] [Google Scholar]
- Agersø Y, Torpdahl M, Zachariasen C, Seyfarth A, Hammerum AM and Møller Nielsen EM, 2012. Tentative colistin epidemiological cut‐off value for Salmonella spp. Foodborne Pathogens Disease, 9, 367–369. 10.1089/fpd.2011.1015 [DOI] [PubMed] [Google Scholar]
- Angen Ø, Stegger M, Larsen J, Lilje B, Kaya H, Pedersen KS, Jakobsen A, Petersen A and Larsen AR, 2017. Report of mecC‐carrying MRSA in domestic swine. Journal of Antimicrobial Chemotherapy, 72, 60–63. 10.1093/jac/dkw389 [DOI] [PMC free article] [PubMed] [Google Scholar]
- Aviv G, Tsyba K, Steck N, Salmon‐Divon M, Cornelius A, Rahav G, Grassl GA and Gal‐Mor O, 2014. A unique megaplasmid contributes to stress tolerance and pathogenicity of an emergent Salmonella enterica serovar Infantis strain. Environmental Microbiology, 16, 977–994. 10.1111/1462-2920.12351 [DOI] [PubMed] [Google Scholar]
- Bartels MD, Larner‐Svensson H, Meiniche H, Kristoffersen K, Schønning K, Nielsen JB, Rohde SM, Christensen LB, Skibsted AW, Jarløv JO, Johansen HK, Andersen LP, Petersen IS, Crook DW, Bowden R, Boye K, Worning P and Westh H, 2015. Monitoring meticillin resistant Staphylococcus aureus and its spread in Copenhagen, Denmark, 2013, through routine whole genome sequencing. Euro Surveillance, 20, pii=21112. [DOI] [PubMed] [Google Scholar]
- Bengtsson B, Persson L, Ekström K, Unnerstad HE, Uhlhorn H and Börjesson S, 2017. High occurrence of mecC‐MRSA in wild hedgehogs (Erinaceus europaeus) in Sweden. Veterinary Microbiology, 207, 103–107. [DOI] [PubMed] [Google Scholar]
- Blomfeldt A, Hasan AA and Aamot HV, 2016. Can MLVA Differentiate among endemic‐like MRSA isolates with identical spa‐type in a low‐prevalence region? PLoS ONE, 11, e0148772. 10.1371/journal.pone.0148772 [DOI] [PMC free article] [PubMed] [Google Scholar]
- Borowiak M, Szabo I, Baumann B, Junker E, Hammerl JA, Kaesbohrer A, Malorny B and Fischer J, 2017. VIM‐1‐producing Salmonella Infantis isolated from swine and minced pork meat in Germany. Journal of Antimicrobial Chemotheraphy, 72, 2131–2133. 10.1093/jac/dkx101 [DOI] [PubMed] [Google Scholar]
- Boyle F, Morris D, O'Connor J, DeLappe N, Ward J and Cormican M, 2010. First report of extended‐spectrum‐β‐lactamase‐producing Salmonella enterica serovar Kentucky isolated from poultry in Ireland. Antimicrobial Agents and Chemotherapy, 54, 551–553. [DOI] [PMC free article] [PubMed] [Google Scholar]
- Cavaco LM, Hasman H, Xia S and Aarestrup FM, 2009. qnrD, a novel gene conferring transferable quinolone resistance in Salmonella enterica serovar Kentucky and Bovismorbificans strains of human origin. Antimicrobial Agents and Chemotherapy, 53, 603–608. [DOI] [PMC free article] [PubMed] [Google Scholar]
- Cavaco L, Hendriksen R, Agersø Y, Aaby Svendsen C, Nielsen H, Guerra B, Peran R and Hasman H, 2016. Selective enrichment of ESBL, AmpC and carbapenemase producing E. coli in meat and cecal samples ‐ additional validation for poultry samples. 26th European Congress Clinical Microbiology and Infectious Diseases (ECCMID, 2016). Poster P0643, 10 April 2016, Amsterdam, the Netherlands.
- Ceccarelli D, vanEssen‐Zandbergen A , Veldman KT, Tafro N, Haenen O and Mevius DJ, 2017. Chromosome‐based bla OXA‐48‐like variants in Shewanella species isolates from food‐producing animals, fish, and the aquatic environment. Antimicrobial agents and Chemotherapy, 61, pii: e01013‐16. 10.1128/aac.01013-16 [DOI] [PMC free article] [PubMed] [Google Scholar]
- Cha W, Mosci RE, Wengert SL, Venegas Vargas C, Rust SR, Bartlett PC, Grooms DL and Manning SD, 2017. Comparing the genetic diversity and antimicrobial resistance profiles of Campylobacter jejuni recovered from cattle and humans. Frontiers in Microbiology, 8, 818. 10.3389/fmicb.2017.00818 [DOI] [PMC free article] [PubMed] [Google Scholar]
- Chadwick SG, Prasad A, Smith WL, Mordechai E, Adelson ME and Gygax SE, 2013. Detection of epidemic USA300 community‐associated methicillin‐resistant Staphylococcus aureus strains by use of a single allele‐specific PCR assay targeting a novel polymorphism of Staphylococcus aureus pbp3 . Journal of Clinical Microbiology, 51, 2541–2550. [DOI] [PMC free article] [PubMed] [Google Scholar]
- Chapman JS, 2003. Disinfectant resistance mechanisms, cross‐resistance, and co‐resistance. International Biodeterioration and Biodegradation, 51, 271–276. [Google Scholar]
- Chen HM, Wang Y, Su LH and Chiu CH, 2013. Nontyphoid Salmonella infection: microbiology, clinical features, and antimicrobial therapy. Pediatrics and Neonatology, 54, 147–152. [DOI] [PubMed] [Google Scholar]
- CLSI and EUCAST (Clinical and Laboratory Standards Institute and European Committee on Antimicrobial Susceptibility Testing), 2016. Recommendations for MIC determination of colistin (polymyxin E) as recommended by the joint CLSI‐EUCAST Polymyxin Breakpoints Working Group. 22 March 2016. Available online: http://www.eucast.org/fileadmin/src/media/PDFs/EUCAST_files/General_documents/Recommendations_for_MIC_determination_of_colistin_March_2016.pdf
- Collignon P, Powers JH, Chiller TM, Aidara‐Kane A and Aarestrup FM, 2009. World Health Organization ranking of antimicrobials according to their importance in human medicine: A critical step for developing risk management strategies for the use of antimicrobials in food production animals. Clinical Infectious Diseases, 49, 132–141. [DOI] [PubMed] [Google Scholar]
- Conceição T, de Lencastre H and Aires‐de‐Sousa M, 2017. Frequent isolation of methicillin resistant Staphylococcus aureus (MRSA) ST398 among healthy pigs in Portugal. PLoS ONE, 12, e0175340. 10.1371/journal.pone.0175340 [DOI] [PMC free article] [PubMed] [Google Scholar]
- Crespo MD, Altermann E, Olson J, Miller WG, Chandrashekhar K and Kathariou S, 2016. Novel plasmid conferring kanamycin and tetracycline resistance in the turkey‐derived Campylobacter jejuni strain 11601MD. Plasmid, 86, 32–37. 10.1016/j.plasmid.2016.06.001 [DOI] [PubMed] [Google Scholar]
- Crombé F, Argudín MA, Vanderhaeghen W, Hermans K, Haesebrouck F and Butaye P, 2013. Transmission dynamics of methicillin‐resistant Staphylococcus aureus in pigs. Frontiers in Microbiology, 4, 57. 10.3389/fmicb.2013.00057 [DOI] [PMC free article] [PubMed] [Google Scholar]
- Cuny C, Abdelbary M, Layer F, Werner G and Witte W, 2015a. Prevalence of the immune evasion gene cluster in Staphylococcus aureus CC398. Veterinary Microbiology, 177, 219–223. 10.1016/j.vetmic.2015.02.031 [DOI] [PubMed] [Google Scholar]
- Cuny C, Wieler LH and Witte W, 2015b. Livestock‐associated MRSA: the impact on humans. Antibiotics (Basel), 4, 521–543. 10.3390/antibiotics4040521 [DOI] [PMC free article] [PubMed] [Google Scholar]
- DANMAP , 2016. Use of antimicrobial agents and occurrence of antimicrobial resistance in bacteria from food animals, food and humans in Denmark. ISSN 1600‐2032. Available online: www.danmap.org
- Deng F, Shen J, Zhang M, Wu C, Zhang Q and Wang Y, 2015. Constitutive and inducible expression of the rRNA methylase gene erm(B) in Campylobacter . Antimicrobial Agents and Chemotherapy, 59, 6661–6664. 10.1128/AAC.01103-15 [DOI] [PMC free article] [PubMed] [Google Scholar]
- Dorado‐García A, Smid JH, van Pelt W, Bonten MJM, Fluit AC, van den Bunt G, Wagenaar JA, Hordijk J, Dierikx CM, Veldman KT, de Koeijer A, Dohmen W, Schmitt H, Liakopoulos A, Pacholewicz E, Lam TJGM, Velthuis AG, Heuvelink A, Gonggrijp MA, van Duijkeren E, van Hoek AHAM, de Roda Husman AM, Blaak H, Havelaar AH, Mevius DJ and Heederik DJJ, 2018. Molecular relatedness of ESBL/AmpC‐producing Escherichia coli from humans, animals, food and the environment: a pooled analysis. Journal of Antimicrobial Chemotherapy, 73, 339–347. 10.1093/jac/dkx397 [DOI] [PubMed] [Google Scholar]
- ECDC (European Centre for Disease Prevention and Control), 2014. EU protocol for harmonised monitoring of antimicrobial resistance in human Salmonella and Campylobacter isolates. Stockholm: ECDC; 2014. Available online: http://www.ecdc.europa.eu/en/publications/Publications/harmonised-monitoring-antimicrobial-resistance-human-salmonella-campylobacter-isolates-EU-protocol.pdf
- ECDC (European Centre for Disease Prevention and Control), 2016. EU protocol for harmonised monitoring of antimicrobial resistance in human Salmonella and Campylobacter isolates – June 2016. Stockholm: ECDC; 2016. Available online: http://ecdc.europa.eu/en/publications/Publications/antimicrobial-resistance-Salmonella-Campylobacter-harmonised-monitoring.pdf
- ECDC (European Centre for Disease Prevention and Control), 2017. Antimicrobial resistance surveillance in Europe 2016. Annual Report of the European Antimicrobial Resistance Surveillance Network (EARS‐Net). Stockholm: ECDC; 2017.
- ECDC and EFSA (European Centre for Disease Prevention and Control and the European Food Safety Authority), 2017. Multi‐country outbreak of Salmonella Enteritidis phage type 8, MLVA type 2‐9‐7‐3‐2 and 2‐9‐6‐3‐2 infections, 7 March 2017. ECDC and EFSA: Stockholm and Parma; 2017. Available online: https://ecdc.europa.eu/sites/portal/files/media/en/publications/Publications/rapid-outbreak-assessment-Salmonella-Enteritidis-7-mar-2017.pdf
- ECDC, EFSA, EMEA and SCENIHR (European Centre for Disease Prevention and Control, European Food Safety Authority, European Medicines Agency and European Commission's Scientific Committee on Emerging and Newly Identified Health Risks), 2009. Joint opinion on antimicrobial resistance (AMR) focused on zoonotic infections. EFSA Journal 2009;7(11):1372, 78 pp. 10.2903/j.efsa.2009.1372 [DOI] [Google Scholar]
- EFSA (European Food Safety Authority), 2008. Report from the Task Force on Zoonoses Data Collection including guidance for harmonized monitoring and reporting of antimicrobial resistance in commensal Escherichia coli and Enterococcus spp. from food animals. EFSA Journal 2008;6(4):141r, 44 pp. 10.2903/j.efsa.2008.141r [DOI] [Google Scholar]
- EFSA (European Food Safety Authority), 2009a. Joint scientific report of ECDC, EFSA and EMEA on meticillin resistant Staphylococcus aureus (MRSA) in livestock, companion animals and foods. EFSA‐Q‐2009‐00612 (EFSA Scientific Report (2009) 301, 1–10) and EMEA/CVMP/SAGAM/62464/2009. EFSA Journal 2009;7(6):301r, 10 pp. 10.2903/j.efsa.2009.301r [DOI] [Google Scholar]
- EFSA (European Food Safety Authority), 2009b. Scientific opinion of the Panel on Biological Hazards on a request from the European Commission on Assessment of the public health significance of meticillin resistant Staphylococcus aureus (MRSA) in animals and foods. EFSA Journal 2009;7(3):993, 73 pp. 10.2903/j.efsa.2009.993 [DOI] [Google Scholar]
- EFSA (European Food Safety Authority), 2012a. Technical specifications for the analysis and reporting of data on antimicrobial resistance (AMR) in the European Union Summary Report. EFSA Journal 2012;10(2):2587, 53 pp. 10.2903/j.efsa.2012.2587 [DOI] [Google Scholar]
- EFSA (European Food Safety Authority), 2012b. Technical specifications for the harmonised monitoring and reporting of antimicrobial resistance in methicillin‐resistant Staphylococcus aureus in food‐producing animals and foods. EFSA Journal 2012;10(10):2897, 56 pp. 10.2903/j.efsa.2012.2897 [DOI] [Google Scholar]
- EFSA (European Food Safety Authority), 2014. Technical specifications on randomised sampling for harmonised monitoring of antimicrobial resistance in zoonotic and commensal bacteria. EFSA Journal 2014;12(5):3686, 33 pp. 10.2903/j.efsa.2014.3686 [DOI] [Google Scholar]
- EFSA BIOHAZ Panel (EFSA Panel on Biological Hazards), 2011. Scientific Opinion on the public health risks of bacterial strains producing extended‐spectrum β‐lactamases and/or AmpC β‐lactamases in food and food‐producing animals. EFSA Journal 2011;9(8):2322, 95 pp. 10.2903/j.efsa.2011.2322 [DOI] [Google Scholar]
- EFSA BIOHAZ Panel (EFSA Panel on Biological Hazards), 2013. Scientific Opinion on Carbapenem resistance in food animal ecosystems. EFSA Journal 2013;11(12):3501, 70 pp. 10.2903/j.efsa.2013.3501 [DOI] [Google Scholar]
- EFSA and ECDC (European Food Safety Authority, European Centre for Disease Prevention and Control), 2016a. The European Union Summary Report on Trends and Sources of Zoonoses, Zoonotic agents and Food‐borne Outbreaks in 2015. EFSA Journal 2016;14(12):4634, 231 pp. 10.2903/j.efsa.2016.4634 [DOI] [PMC free article] [PubMed] [Google Scholar]
- EFSA and ECDC (European Food Safety Authority, European Centre for Disease Prevention and Control), 2016b. The European Union summary report on antimicrobial resistance in zoonotic and indicator bacteria from humans, animals and food in 2014. EFSA Journal 2016;14(2):4380, 207 pp. 10.2903/j.efsa.2016.4380 [DOI] [PMC free article] [PubMed] [Google Scholar]
- EFSA and ECDC (European Food Safety Authority and European Centre for Disease Prevention and Control), 2017a. The European Union summary report on trends and sources of zoonoses, zoonotic agents and food‐borne outbreaks in 2016. EFSA Journal 2017;15(12):5077, 228 pp. 10.2903/j.efsa.2017.5077 [DOI] [PMC free article] [PubMed] [Google Scholar]
- EFSA and ECDC (European Food Safety Authority and European Centre for Disease Prevention and Control), 2017b. The European Union summary report on antimicrobial resistance in zoonotic and indicator bacteria from humans, animals and food in 2015. EFSA Journal 2017;15(2):4694, 212 pp. 10.2903/j.efsa.2017.4694 [DOI] [PMC free article] [PubMed] [Google Scholar]
- EMA (European Medicines Agency), 2013. Use of colistin products in animals within the European Union: development of resistance and possible impact on human and animal health. Available online: http://www.ema.europa.eu/docs/en_GB/document_library/Report/2013/07/WC500146813.pdf
- EMA (European Medicines Agency), 2016. Updated advice on the use of colistin products in animals within the European Union: development of resistance and possible impact on human and animal health. Available online: http://www.ema.europa.eu/docs/en_GB/document_library/Scientific_guideline/2016/07/WC500211080.pdf
- EUCAST (European Committee for Antimicrobial Susceptibility Testing), 2013. EUCAST guidelines for detection of resistance mechanisms and specific resistances of clinical and/or epidemiological importance. Version 1.0 December 2013. Available online: http://www.eucast.org/fileadmin/src/media/PDFs/EUCAST_files/Resistance_mechanisms/EUCAST_detection_of_resistance_mechanisms_v1.0_20131211.pdf
- EUCAST (European Committee for Antimicrobial Susceptibility Testing), 2014. Screening for fluoroquinolone resistance in Salmonella spp. with pefloxacin 5 μg. Tentative quality control criteria for users and disk manufacturers. Available online: http://www.eucast.org/fileadmin/src/media/PDFs/EUCAST_files/QC/Tentative_QC_criteria_for_pefloxacin_5__g.pdf
- EUCAST (European Committee for Antimicrobial Susceptibility Testing), 2017a. Calibration of zone diameter breakpoints to MIC values ‐ Campylobacter jejuni and coli, Jan 2017. Available online: http://www.eucast.org/fileadmin/src/media/PDFs/EUCAST_files/Disk_criteria/Validation_2017/Camplyobacter_v_2.2_January_2017.pdf
- EUCAST (European Committee for Antimicrobial Susceptibility Testing), 2017b. EUCAST guidelines for detection of resistance mechanisms and specific resistances of clinical and/or epidemiological importance. Version 2.01 July 2017. Available online:http://www.eucast.org/fileadmin/src/media/PDFs/EUCAST_files/Resistance_mechanisms/EUCAST_detection_of_resistance_mechanisms_170711.pdf
- Fischer J, Rodríguez I, Schmoger S, Friese A, Roesler U, Helmuth R and Guerra B, 2012. Escherichia coli producing VIM‐1 carbapenemase isolated on a pig farm. Journal of Antimicrobial Chemotheraphy, 67, 1793–1795. 10.1093/jac/dks108 [DOI] [PubMed] [Google Scholar]
- Fischer J, Rodríguez I, Schmoger S, Friese A, Roesler U, Helmuth R and Guerra B, 2013. Salmonella enterica subsp. enterica producing VIM‐1 carbapenemase isolated from livestock farms. Journal of Antimicrobial Chemotheraphy, 68, 478–480. 10.1093/jac/dks393 [DOI] [PubMed] [Google Scholar]
- Fischer J, San José M, Roschanski N, Schmoger S, Baumann B, Irrgang A, Friese A, Roesler U, Helmuth R and Guerra B, 2016. Spread and persistence of VIM‐1 carbapenemase‐producing Enterobacteriaceae in three German swine farms in 2011 and 2012. Veterinary Microbiology, 200, 118–123. 10.1016/j.vetmic.2016.04.026 [DOI] [PubMed] [Google Scholar]
- Fischer J, Hille K, Ruddat I, Mellmann A, Köck R and Kreienbrock L, 2017. Simultaneous occurrence of MRSA and ESBL‐producing Enterobacteriaceae on pig farms and in nasal and stool samples from farmers. Veterinary Microbiology, 200, 107–113. 10.1016/j.vetmic.2016.05.021 [DOI] [PubMed] [Google Scholar]
- Florez‐Cuadrado D, Ugarte‐Ruíz M, Quesada A, Palomo G, Domínguez L and Porrero MC, 2016. Description of an erm(B)‐carrying Campylobacter coli isolate in Europe. Journal of Antimicrobial Chemotherapy, 71, 841–843. 10.1093/jac/dkv383 [DOI] [PubMed] [Google Scholar]
- Florez‐Cuadrado D, Ugarte‐Ruíz M, Meric G, Quesada A, Porrero MC, Pascoe B, Sáez‐Llorente JL, Orozco GL, Domínguez L and Sheppard SK, 2017. Genome Comparison of Erythromycin Resistant Campylobacter from Turkeys Identifies Hosts and Pathways for Horizontal Spread of erm(B) Genes. Frontiers in Microbiology, 8, art. 2240. 10.3389/fmicb.2017.02240 [DOI] [PMC free article] [PubMed] [Google Scholar]
- Fossum AE and Bukholm G, 2006. Increased incidence of methicillin‐resistant Staphylococcus aureus ST80, novel ST125 and SCCmecIV in the south‐eastern part of Norway during a 12‐year period. Clinical Microbiology and Infectious Diseases, 12, 627–633. 10.1111/j.1469-0691.2006.01467.x [DOI] [PubMed] [Google Scholar]
- Franco A, Leekitcharoenphon P, Feltrin F, Alba P, Cordaro G, Iurescia M, Tolli R, D'Incau M, Staffolani M, Di Giannatale E, Hendriksen RS and Battisti A, 2015. Emergence of a clonal lineage of multidrug‐resistant ESBL‐producing Salmonella Infantis transmitted from broilers and broiler meat to humans in Italy between 2011 and 2014. PLoS ONE, 10, e0144802. 10.1371/journal.pone.0144802 [DOI] [PMC free article] [PubMed] [Google Scholar]
- FSA (Food Standards Agency), 2017. Risk assessment on meticillin‐resistant Staphylococcus aureus (MRSA), with a focus on livestock‐associated MRSA in the UK food chain. Available online: https://www.food.gov.uk/sites/default/files/mrsa_risk_assessment_feb17.pdf
- García‐Álvarez L, Holden MTG, Lindsay H, Webb CR, Brown DFJ, Curran MD, Walpole E, Brooks K, Pickard DJ, Teale C, Parkhill J, Bentley SD, Edwards GF, Girvan EK, Kearns AM, Pichon B, Hill RLR, Larsen AR, Skov RL, Peacock SJ, Maskell DJ and Holmes MA, 2011. Meticillin‐resistant Staphylococcus aureus with a novel mecA homologue in human and bovine populations in the UK and Denmark: a descriptive study. Lancet Infectious Diseases, 11, 595–603. 10.1016/S1473-3099(11)70126-8 [DOI] [PMC free article] [PubMed] [Google Scholar]
- Gibbons CL, Mangen MJ, Plass D, Havelaar AH, Brooke RJ, Kramarz P, Peterson KL, Stuurman AL, Cassini A, Fevre EM, Kretzschmar ME and the Burden of Communicable diseases in Europe (BCoDE) consortium , 2014. Measuring underreporting and under‐ascertainment in infectious disease datasets: a comparison of methods. BMC Public Health, 11, 147. 10.1186/1471-2458-14-147 [DOI] [PMC free article] [PubMed] [Google Scholar]
- Gibreel A and Taylor DE, 2006. Macrolide resistance in Campylobacter jejuni and Campylobacter coli . Journal of Antimicrobial Chemotherapy, 58, 243–255. 10.1093/jac/dkl210 [DOI] [PubMed] [Google Scholar]
- Giske CG, 2015. Contemporary resistance trends and mechanisms for the old antibiotics colistin, temocillin, fosfomycin, mecillinam and nitrofurantoin. Clinical Microbiology and Infection, 21, 899–905. [DOI] [PubMed] [Google Scholar]
- Graveland H, Wagenaar JA, Heesterbeek H, Mevius D, van Duijkeren E and Heederik D, 2010. Methicillin resistant Staphylococcus aureus ST398 in veal calf farming: human MRSA carriage related with animal antimicrobial usage and farm hygiene. PLoS ONE, 5, e10990. 10.1371/journal.pone.0010990 [DOI] [PMC free article] [PubMed] [Google Scholar]
- Grimont PAD and Weill F‐X, 2013. Antigenic formulae of the Salmonella serovars 2007 9th edition. WHO Collaborating Centre for Reference and Research on Salmonella.
- Gu B, Kelesidis T, Tsiodras S, Hindler J and Humphries RM, 2013. The emerging problem of linezolid‐resistant Staphylococcus . Journal of Antimicrobial Chemotherapy, 68, 4–11. 10.1093/jac/dks354 [DOI] [PMC free article] [PubMed] [Google Scholar]
- Guerra B, Fischer J and Helmuth R, 2014. An emerging public health problem: acquired carbapenemase‐producing microorganisms are present in food producing animals, their environment, companion animals and wild birds. Veterinary Microbiology, 171, 290–297. [DOI] [PubMed] [Google Scholar]
- Guo B, Lin J, Reynolds DL and Zhang Q, 2010. Contribution of the multidrug efflux transporter CmeABC to antibiotic resistance in different Campylobacter species. Foodborne Pathogens and Disease, 7, 77–83. 10.1089/fpd.2009.0354 [DOI] [PMC free article] [PubMed] [Google Scholar]
- Haagsma JA, Geenen PL, Ethelberg S, Fetsch A, Hansdotter F, Jansen A, Korsgaard H, O'Brien SJ, Scavia G, Spitznagel H, Stefanoff P, Tam CC and Havelaar AH on behalf of a Med‐Vet‐Net Working Group , 2013. Community incidence of pathogen‐specific gastroenteritis: reconstructing the surveillance pyramid for seven pathogens in seven European Union member states. Epidemiology and Infection, 141, 1625–1639. 10.1017/s0950268812002166 [DOI] [PMC free article] [PubMed] [Google Scholar]
- Harrison EM, Paterson GK, Holden MTG, Larsen J, Stegger M, Larsen AR, Petersen A, Skov RL, Christensen JM, Bak Zeuthen A, Heltberg O, Harris SR, Zadoks RN, Parkhill J, Peacock SJ and Holmes MA, 2013. Whole genome sequencing identifies zoonotic transmission of MRSA isolates with the novel mecA homologue mecC . EMBO Molecular Medicine, 5, 509–515. 10.1002/emmm.201202413 [DOI] [PMC free article] [PubMed] [Google Scholar]
- Hasman H, Agersø Y, Cavaco L, Aaby Svendsen C, San José M, Fisher J, Schmoger S, Jahn S, Guerra B and Peran R, 2015a. Validation of methods for enrichment of ESBL and AmpC producing E. coli in meat and cecal samples. European Congress Clinical Microbiology and Infectious Diseases (ECCMID, 2015) Poster P0995, 27 April 2015. Copenhagen, Denmark.
- Hasman H, Agersø Y, Cavaco L, Aaby Svendsen C, Nielsen H, San José M, Fischer J, Schmoger S, Peran R and Guerra B, 2015b. Evaluation of methods for enrichment of carbapenemase‐producing E. coli in pork meat and cecal samples of porcine and bovine origin. 25th European Congress Clinical Microbiology and Infectious Diseases (ECCMID, 2015), Poster EV0266, 25 April 2015, Copenhagen, Denmark.
- Havelaar AH, Ivarsson S, Löfdahl M and Nauta MJ, 2013. Estimating the true incidence of campylobacteriosis and salmonellosis in the European Union, 2009. Epidemiology and Infection, 141, 293–302. 10.1017/S0950268812000568 [DOI] [PMC free article] [PubMed] [Google Scholar]
- He F, Xu J, Wang J, Chen Q, Hua X, Fu Y and Yu Y, 2016. Decreased susceptibility to tigecycline mediated by a mutation in mlaA in Escherichia coli strains. Antimicrobial Agents and Chemotherapy, 60, 7530–7531. [DOI] [PMC free article] [PubMed] [Google Scholar]
- Hindermann D, Gopinath G, Chase H, Negrete F, Althaus D, Zurfluh K, Tall BD, Stephan R and Nüesch‐Inderbinen M, 2017. Salmonella enterica serovar Infantis from Food and Human Infections, Switzerland, 2010‐2015: poultry‐related multidrug resistant clones and an emerging ESBL producing clonal lineage. Frontiers in Microbiology, 8, 2017. 10.3389/fmicb.2017.01322 [DOI] [PMC free article] [PubMed] [Google Scholar]
- Holtfreter S, Grumann D, Balau V, Barwich A, Kolata J, Goehler A, Weiss S, Holtfreter B, Bauerfeind SS, Döring P, Friebe E, Haasler N, Henselin K, Kühn K, Nowotny S, Radke D, Schulz K, Schulz SR, Trübe P, Vu CH, Walther B, Westphal S, Cuny C, Witte W, Völzke H, Grabe HJ, Kocher T, Steinmetz I and Bröker BM, 2016. Molecular epidemiology of Staphylococcus aureus in the general population in Northeast Germany: results of the Study of Health in Pomerania (SHIP‐TREND‐0). Journal of Clinical Microbiology, 54, 2774–2785. 10.1128/JCM.00312-16 [DOI] [PMC free article] [PubMed] [Google Scholar]
- Horigan V, Kosmider RD, Horton RA, Randall L and Simons RR, 2016. An assessment of evidence data gaps in the investigation of possible transmission routes of extended spectrum β‐lactamase producing Escherichia coli from livestock to humans in the UK. Preventive Veterinary Medicine, 124, 1–8. 10.1016/j.prevetmed.2015.12.020 [DOI] [PubMed] [Google Scholar]
- Irrgang A, Fischer J, Grobbel M, Schmoger S, Skladnikiewicz‐Ziemer T, Thomas K, Hensel A, Tenhagen B‐A and Käsbohrer A, 2016. Recurrent detection of VIM‐1‐producing Escherichia coli clone in German pig production. Journal of Antimicrobial Chemotherapy, 2 pp. 10.1093/jac/dkw47 [DOI] [PMC free article] [PubMed] [Google Scholar]
- Kahlmeter G, Brown DF, Goldstein FW, MacGowan AP, Mouton JW, Osterlund A, Rodloff A, Steinbakk M, Urbaskova P and Vatopoulos A, 2003. European harmonization of MIC breakpoints for antimicrobial susceptibility testing of bacteria. Journal of Antimicrobial Chemotherapy, 52, 145–148. [DOI] [PubMed] [Google Scholar]
- Kempf I, Jouy E and Chauvin C, 2016. Colistin use and colistin resistance in bacteria from animals. International Journal of Antimicrobial Agents, 48, 598–606. 10.1016/j.ijantimicag.2016.09.016 [DOI] [PubMed] [Google Scholar]
- Kinross P, Petersen A, Skov R, Van Hauwermeiren E, Pantosti A, Laurent F, Voss A, Kluytmans J, Struelens MJ, Heuer O and Monnet DL and the European human LA‐MRSA study group , 2017. Livestock‐associated meticillin‐resistant Staphylococcus aureus (MRSA) among human MRSA isolates, European Union/European Economic Area countries, 2013. Euro Surveillance, 22, pii=16‐00696. 10.2807/1560-7917.es.2017.22.44.16-00696 [DOI] [PMC free article] [PubMed] [Google Scholar]
- Köck R, Kreienbrock L, van Duijkeren E and Schwarz S, 2017. Antimicrobial resistance at the interface of human and veterinary medicine. Veterinary Microbiology, 200, 1–5. 10.1016/j.vetmic.2016.11.013 [DOI] [PubMed] [Google Scholar]
- Kraemer JG, Pires J, Kueffer M, Semaani E, Endimiani A, Hilty M and Oppliger A, 2017. Prevalence of extended‐spectrum β‐lactamase‐producing Enterobacteriaceae and methicillin‐resistant Staphylococcus aureus in pig farms in Switzerland. Science of the Total Environment, 603–604, 401–405. 10.1016/j.scitotenv.2017.06.110 [DOI] [PubMed] [Google Scholar]
- Kraushaar B, Ballhausen B, Leeser D, Tenhagen BA, Käsbohrer A and Fetsch A, 2016. Antimicrobial resistances and virulence markers in methicillin‐resistant Staphylococcus aureus from broiler and turkey: a molecular view from farm to fork. Veterinary Microbiology, 200, 25–32. 10.1016/j.vetmic.2016.05.022 [DOI] [PubMed] [Google Scholar]
- Larsen J, Stegger M, Andersen PS, Petersen A, Larsen AR, Westh H, Agersø Y, Fetsch A, Kraushaar B, Käsbohrer A, Feβler AT, Schwarz S, Cuny C, Witte W, Butaye P, Denis O, Haenni M, Madec J, Jouy E, Laurent F, Battisti A, Franco A, Alba P, Mammina C, Pantosti A, Monaco M, Wagenaar JA, de Boer E, van Duijkeren E, Heck M, Domínguez L, Torres C, Zarazaga M, Price LB and Skov RL, 2016. Evidence for human adaptation and foodborne transmission of livestock‐associated methicillin‐resistant Staphylococcus aureus . Clinical Infectious Diseases, 63, 1349–1352. 10.1093/cid/ciw532 [DOI] [PMC free article] [PubMed] [Google Scholar]
- Le Hello S, Hendriksen RS, Doublet B, Fisher I, Nielsen EM, Whichard JM, Bouchrif B, Fashae K, Granier SA, Jourdan‐Da Silva N, Cloeckaert A, Threlfall EJ, Angulo FJ, Aarestrup FM, Wain J and Weill FX, 2011. International spread of an epidemic population of Salmonella enterica serotype Kentucky ST198 resistant to ciprofloxacin. Journal of Infectious Diseases, 204, 675–684. 10.1093/infdis/jir409 [DOI] [PubMed] [Google Scholar]
- Le Hello S, Bekhit A, Granier SA, Barua H, Beutlich J, Zając M, Münch S, Sintchenko V, Bouchrif B, Fashae K, Pinsard JL, Sontag L, Fabre L, Garnier M, Guibert V, Howard P, Hendriksen RS, Christensen JP, Biswas PK, Cloeckaert A, Rabsch W, Wasyl D, Doublet B and Weill FX, 2013. The global establishment of a highly‐fluoroquinolone resistant Salmonella enterica serotype Kentucky ST198 strain. Frontiers in Microbiology, 4, 395. 10.3389/fmicb.2013.00395 [DOI] [PMC free article] [PubMed] [Google Scholar]
- Li B, Ma L, Li Y, Jia H, Wei J, Shao D, Liu K, Shi Y, Qiu Y and Ma Z, 2017. Antimicrobial resistance of Campylobacter species isolated from broilers in live bird markets in Shanghai, China. Foodborne Pathogens and Disease, 14, 96–102. 10.1089/fpd.2016.2186 [DOI] [PubMed] [Google Scholar]
- Liu Y‐Y, Wang T, Walsh TR, Yi L‐X, Zhang R, Spencer J, Doi Y, Tian G, Dong B, Huang X, Yu L‐F, Gu D, Ren H, Chen X, Lv L, He D, Zhou H, Liang Z, Liu J‐H and Shen J, 2015. Emergence of plasmid‐mediated colistin resistance mechanism MCR‐1 in animals and human beings in China: a microbiological and molecular biological study. The Lancet Infectious Diseases, 16, 161–168. published online Nov 18. Available online: 10.1016/s1473-3099(15)00424-7 [DOI] [PubMed] [Google Scholar]
- Liu D, Deng F, Gao Y, Yao H, Shen Z, Wu C, Wang Y and Shen J, 2017. Dissemination of erm(B) and its associated multidrug‐resistance genomic islands in Campylobacter from 2013 to 2015. Veterinary Microbiology, 204, 20–24. 10.1016/j.vetmic.2017.02.022 [DOI] [PubMed] [Google Scholar]
- Luangtongkum T, Jeon B, Han J, Plummer P, Logue CM and Zhang Q, 2009. Antibiotic resistance in Campylobacter: emergence, transmission and persistence. Future Microbiology, 4, 189–200. 10.2217/17460913.4.2.189 [DOI] [PMC free article] [PubMed] [Google Scholar]
- Luo N, Pereira S, Sahin O, Lin J, Huang S, Michel L and Zhang Q, 2005. Enhanced in vivo fitness of fluoroquinolone‐resistant Campylobacter jejuni in the absence of antibiotic selection pressure. Proceedings of the National Academy of Sciences of USA, 102, 541–546. 10.1073/pnas.0408966102 [DOI] [PMC free article] [PubMed] [Google Scholar]
- Madec JY, Haenni M, Nordmann P and Poirel L, 2017. Extended‐spectrum β‐lactamase/AmpC‐ and carbapenemase‐producing Enterobacteriaceae in animals: a threat for humans? Clinical Microbiology and Infection, 23, 826–833. 10.1016/j.cmi.2017.01.013 [DOI] [PubMed] [Google Scholar]
- Magiorakos AP, Srinivasan A, Carey RB, Carmeli Y, Falagas ME, Giske CG, Harbarth S, Hindler JF, Kahlmeter G, Olsson‐Liljequist B, Paterson DL, Rice LB, Stelling J, Struelens MJ, Vatopoulos A, Weber JT and Monnet DL, 2012. Multidrug‐resistant, extensively drug‐resistant and pandrug‐resistant bacteria: an international expert proposal for interim standard definitions for acquired resistance. Clinical Microbiology and Infection, 18, 268–281. [DOI] [PubMed] [Google Scholar]
- Manfreda G, Parisi A, De Cesare A, Mion D, Piva S and Zanoni RG, 2016. Typing of Campylobacter jejuni isolated from turkey by genotypic methods, antimicrobial susceptibility, and virulence gene patterns: a retrospective study. Foodborne Pathogens and Disease, 13, 93–100. 10.1089/fpd.2015.2048 [DOI] [PubMed] [Google Scholar]
- Mat Azis N, Pung HP, Abdul Rachman AR, Amin Nordin S, Sarchio SNE, Suhaili Z and Mohd Desa MN, 2017. A persistent antimicrobial resistance pattern and limited methicillin‐resistance‐associated genotype in a short‐term Staphylococcus aureus carriage isolated from a student population. Journal of Infection and Public Health, 10, 156–164. 10.1016/j.jiph.2016.02.013 [DOI] [PubMed] [Google Scholar]
- Mathers AJ, Peirano G and Pitout JDD, 2015. The role of epidemic resistance plasmids and international high‐risk clones in the spread of multidrug‐resistant enterobacteriaceae. Clinical Microbiology Reviews, 28, 565–591. 10.1128/CMR.00116-14 [DOI] [PMC free article] [PubMed] [Google Scholar]
- Matuschek E, Westrell T and Kahlmether G, 2015. Establishment of zone diameter ECOFFs for Salmonella spp. – a joint EUCAST and ECDC project. Poster session presented at: 25th European Congress of Clinical Microbiology and Infectious Diseases, 25–28 April 2015, Copenhagen, Denmark.
- Matuschek E, Åhman J, Webster C and Kahlmeter G, 2017. Evaluation of five commercial MIC methods for colistin antimicrobial susceptibility testing for Gram‐negative bacteria. Poster session presented at: 27th European Congress of Clinical Microbiology and Infectious Diseases, 22–25 April 2017, Vienna, Austria. Available online: http://www.eucast.org/fileadmin/src/media/PDFs/EUCAST_files/Warnings/Matuschek_colistin_ECCMID_2017.pdf
- McCrackin MA, Helke KL, Galloway AM, Poole AZ, Salgado CD and Marriott BP, 2016. Effect of antimicrobial use in agricultural animals on drug‐resistant foodborne campylobacteriosis in humans: a systematic literature review. Critical Reviews in Food Science and Nutrition, 56, 2115–2132. 10.1080/10408398.2015.1119798 [DOI] [PubMed] [Google Scholar]
- Merz A, Stephan R and Johler S, 2016. Genotyping and DNA microarray based characterization of Staphylococcus aureus isolates from rabbit carcasses. Meat Science, 112, 86–89. 10.1016/j.meatsci.2015.11.002 [DOI] [PubMed] [Google Scholar]
- Mollenkopf DF, Stull JW, Mathys DA, Bowman AS, Feicht SM, Grooters SV, Daniels JB and Wittum TE, 2017. Carbapenemase‐producing Enterobacteriaceae recovered from the environment of a swine farrow‐to‐finish operation in the United States. Antimicrobial Agents and Chemotherapy, 61, e012198–16. 10.1128/AAC.01298-16 [DOI] [PMC free article] [PubMed] [Google Scholar]
- Moré E, Ayats T, Ryan PG, Naicker PR, Keddy KH, Gaglio D, Witteveen M and Cerdà‐Cuéllar M, 2017. Seabirds (Laridae) as a source of Campylobacter spp., Salmonella spp. and antimicrobial resistance in South Africa. Environmental Microbiology, 19, 4146–4176. 10.1111/1462-2920.13874 [DOI] [PubMed] [Google Scholar]
- Narvaez‐Bravo C, Taboada EN, Mutschall SK and Aslam M, 2017. Epidemiology of antimicrobial resistant Campylobacter spp. isolated from retail meats in Canada. International Journal of Food Microbiology, 253, 43–47. 10.1016/j.ijfoodmicro.2017.04.019 [DOI] [PubMed] [Google Scholar]
- Ng LK, Stiles ME and Taylor DE, 1985. Inhibition of Campylobacter coli and Campylobacter jejuni by antibiotics used in selective growth media. Journal of Clinical Microbiology, 22, 510–514. [DOI] [PMC free article] [PubMed] [Google Scholar]
- Oh JY, Kwon YK, Wei B, Jang HK, Lim SK, Kim CH, Jung SC and Kang MS, 2017. Epidemiological relationships of Campylobacter jejuni strains isolated from humans and chickens in South Korea. Journal of Microbiology, 55, 13–20. 10.1007/s12275-017-6308-8 [DOI] [PubMed] [Google Scholar]
- Ohishi T, Aoki K, Ishii Y, Usui M, Tamura Y, Kawanishi M, Ohnishi K and Tateda K, 2017. Molecular epidemiological analysis of human‐ and chicken‐derived isolates of Campylobacter jejuni in Japan using next‐generation sequencing. Journal of Infection and Chemotherapy, 23, 165–172. 10.1016/j.jiac.2016.11.011 [DOI] [PubMed] [Google Scholar]
- Ohno H, Wachino J, Saito R, Jin W, Yamada K, Kimura K and Arakawa Y, 2016. A highly macrolide‐resistant Campylobacter jejuni strain with rare A2074T mutations in 23S rRNA genes. Antimicrobial Agents and Chemotherapy, 60, 2580–2581. 10.1128/AAC.02822-15 [DOI] [PMC free article] [PubMed] [Google Scholar]
- Paterson GK, Harrison EM and Holmes MA, 2014. The emergence of mecC methicillin‐resistant Staphylococcus aureus . Trends in Microbiology, 22, 42–47. 10.1016/j.tim.2013.11.003 [DOI] [PMC free article] [PubMed] [Google Scholar]
- Pergola S, Franciosini MP, Comitini F, Ciani M, De Luca S, Bellucci S, Menchetti L and Casagrande Proietti P, 2017. Genetic diversity and antimicrobial resistance profiles of Campylobacter coli and Campylobacter jejuni isolated from broiler chicken in farms and at time of slaughter in central Italy. Journal of Applied Microbiology, 122, 1348–1356. 10.1111/jam.13419 [DOI] [PubMed] [Google Scholar]
- Perrin‐Guyomard A, Bruneau M, Houée P, Deleurme K, Legrandois P, Poirier C, Soumet C and Sanders P, 2016. Prevalence of mcr‐1 in commensal Escherichia coli from French livestock, 2007 to 2014. euroSurveillance, 21, 10.2807/1560-7917.ES.2016.21.6.30135 [DOI] [PubMed] [Google Scholar]
- Petersen A, Stegger M, Heltberg O, Christensen J, Zeuthen A, Knudsen LK, Urth T, Sorum M, Schouls L, Larsen J, Skov R and Larsen AR, 2013. Epidemiology of methicillin‐resistant Staphylococcus aureus carrying the novel mecC gene in Denmark corroborates a zoonotic reservoir with transmission to humans. Clinical Microbiology and Infection, 19, E16–E22. 10.1111/1469-0691.12036 [DOI] [PubMed] [Google Scholar]
- Pulss S, Semmler T, Prenger‐Berninghoff E, Bauerfeind R and Ewers C, 2017. First report of an Escherichia coli strain from swine carrying an OXA‐181 carbapenemase and the colistin resistance determinant MCR‐1. International Journal of Antimicrobial Agents, 50, 232–236. 10.1016/j.ijantimicag.2017.03.014 [DOI] [PubMed] [Google Scholar]
- Qin S, Wang Y, Zhang Q, Chen X, Shen Z, Deng F, Wu C and Shen J, 2012. Identification of a novel genomic island conferring resistance to multiple aminoglycoside antibiotics in Campylobacter coli . Antimicrobial Agents and Chemotherapy, 56, 5332–5339. 10.1128/AAC.00809-12 [DOI] [PMC free article] [PubMed] [Google Scholar]
- Qin S, Wang Y, Zhang Q, Zhang M, Deng F, Shen Z, Wu C, Wang S, Zhang J and Shen J, 2014. Report of ribosomal RNA methylase gene erm(B) in multidrug‐resistant Campylobacter coli . Journal of Antimicrobial Chemotherapy, 69, 964–968. 10.1093/jac/dkt492 [DOI] [PubMed] [Google Scholar]
- Reperant E, Laisney MJ, Nagard B, Quesne S, Rouxel S, Le Gall F, Chemaly M and Denis M, 2016. Influence of enrichment and isolation media on the detection of Campylobacter spp. in naturally contaminated chicken samples. Journal of Microbiological Methods, 128, 42–47. 10.1016/j.mimet.2016.06.028 [DOI] [PubMed] [Google Scholar]
- Robinson DA and Enright MC, 2004. Evolution of Staphylococcus aureus by large chromosomal replacements. Journal of Bacteriology, 186, 1060–1064. 10.1128/JB.186.4.1060-1064.2004 [DOI] [PMC free article] [PubMed] [Google Scholar]
- Rogers BA, Sidjabat HE and Paterson DL, 2011. Escherichia coli O25b‐ST131: a pandemic, multiresistant, community‐associated strain. Journal of Antimicrobial Chemotherapy, 66, 1–14. [DOI] [PubMed] [Google Scholar]
- Roschanski N, Guenther S, Vu TTT, Fischer J, Semmler T, Huehn S, Alter T and Roesler U, 2017. VIM‐1 carbapenemase‐producing Escherichia coli isolated from retail seafood, Germany 2016. EuroSurveillance, 22, 10.2807/1560-7917.ES.2017.22.43.17-00032 [DOI] [PMC free article] [PubMed] [Google Scholar]
- Rubin JE, Ekanayake S and Fernando C, 2014. Carbapenemase‐producing organism in food. Emerging Infectious Diseases, 20, 1264–1265. [DOI] [PMC free article] [PubMed] [Google Scholar]
- Ruiz‐Ripa L, Gómez P, Camacho MC, Zarazaga M, De la Puente J, Höfle U and Torres C, 2017. Detection of MRSA‐mecC‐t843, MRSA‐mecA‐CC398 and Staphylococcus delphini in magpies and cinereous vultures in Spain. Session: OS199 One health perspective on MDR Gram‐positives: VRE & MRSA. Category 3a, Resistance surveillance & epidemiology: MRSA, VRE & other Grampositives. 25th Congress of ESCMID, Vienna, Austria, 22–25 April 2017. Available online: https://www.escmid.org/escmid_publications/escmid_elibrary/material/?mid=41929
- San José M, Hasman H, Fischer J, Agerso Y, Schmoger S, Jahn S, Thomas K, Guiral E, Helmuth R and Guerra Roman B, 2014. Evaluation of methods for detection of VIM‐1‐carbapenemase‐producing Enterobacteriaceae in bovine minced meat. 24th European Congress Clinical Microbiology and Infectious Diseases (ECCMID, 2014). Poster eP334. 10 May 2014. Barcelona, Spain.
- Schwarz S and Johnson AP, 2016. Transferable resistance to colistin: a new but old threat. Journal of Antimicrobial Chemotherapy, 71, 2066–2070. 10.1093/jac/dkw274 [DOI] [PubMed] [Google Scholar]
- Shen J, Wang Y and Schwarz S, 2013. Presence and dissemination of the multiresistance gene cfr in Gram‐positive and Gram‐negative bacteria. Journal of Antimicrobial Chemotherapy, 68, 1697–1706. 10.1093/jac/dkt092 [DOI] [PubMed] [Google Scholar]
- Shore AC, Deasy EC, Slickers P, Brennan G, O'Connell B, Monecke S, Ehricht R and Coleman DC, 2011. Detection of staphylococcal cassette chromosome mec type XI carrying highly divergent mecA, mecI, mecR1, blaZ, and ccr genes in human clinical isolates of clonal complex 130 methicillin‐resistant Staphylococcus aureus . Antimicrobial Agents and Chemotherapy, 55, 3765–3773. 10.1128/AAC.00187-11 [DOI] [PMC free article] [PubMed] [Google Scholar]
- Skov R, Matuschek E, Sjölund‐Karlsson M, Åhman J, Petersen A, Stegger M, Torpdahl M and Kahlmeter G, 2015. Development of a pefloxacin disk diffusion method for detection of fluoroquinolone‐resistant Salmonella enterica . Journal of Clinical Microbiology, 53, 3411–3417. 10.1128/JCM.01287-15 [DOI] [PMC free article] [PubMed] [Google Scholar]
- Smyth DS, Wong A and Robinson DA, 2011. Cross‐species spread of SCCmec IV subtypes in staphylococci. Infection, Genetics and Evolution, 11, 446–453. 10.1016/j.meegid.2010.12.005 [DOI] [PMC free article] [PubMed] [Google Scholar]
- Stegger M, Andersen PS, Kearns A, Pichon B, Holmes MA, Edwards G, Laurent F, Teale C, Skov R and Larsen AR, 2012. Rapid detection, differentiation and typing of methicillin‐resistant Staphylococcus aureus harbouring either mecA or the new mecA homologue mecA LGA251 . Clinical Microbiology and Infection, 18, 395–400. 10.1111/j.1469-0691.2011.03715.x [DOI] [PubMed] [Google Scholar]
- Stegger M, Wirth T, Andersen PS, Skov RL, De Grassi A, Simões PM, Tristan A, Petersen A, Aziz M, Kiil K, Cirković I, Udo EE, del Campo R, Vuopio‐Varkila J, Ahmad N, Tokajian S, Peters G, Schaumburg F, Olsson‐Liljequist B, Givskov M, Driebe EE, Vigh HE, Shittu A, Ramdani‐Bougessa N, Rasigade J, Price LB, Vandenesch F, Larsen AR and Laurent F, 2014. Origin and evolution of European community‐acquired methicillin‐resistant Staphylococcus aureus . mBio 5, e01044–14. 10.1128/mbio.01044-14. [DOI] [PMC free article] [PubMed] [Google Scholar]
- Stella S, Soncini G, Ziino G, Panebianco A, Pedonese F, Nuvoloni R, Di Giannatale E, Colavita G, Alberghini L and Giaccone V, 2016. Prevalence and quantification of thermophilic Campylobacter spp. in Italian retail poultry meat: analysis of influencing factors. Food Microbiology, 62, 232–238. [DOI] [PubMed] [Google Scholar]
- SVARM , 2011. Swedish Veterinary Antimicrobial Resistance Monitoring. The National Veterinary Institute (SVA), Uppsala, Sweden, 2012. ISSN 1650‐6332. Available online: http://www.sva.se/globalassets/redesign2011/pdf/om_sva/publikationer/trycksaker/svarm2011.pdf
- Swedres‐Svarm , 2016. Consumption of antibiotics and occurrence of resistance in Sweden. Solna/Uppsala ISSN1650‐6332. Available online: http://www.sva.se/globalassets/redesign2011/pdf/om_sva/publikationer/swedres_svarm2016.pdf
- Szczepanska B, Andrzejewska M, Spica D and Klawe JJ, 2017. Prevalence and antimicrobial resistance of Campylobacter jejuni and Campylobacter coli isolated from children and environmental sources in urban and suburban areas. BMC Microbiology, 17, 80. 10.1186/s12866-017-0991-9 [DOI] [PMC free article] [PubMed] [Google Scholar]
- Tang Y, Dai L, Sahin O, Wu Z, Liu M and Zhang Q, 2017. Emergence of a plasmid‐borne multidrug resistance gene cfr(C) in foodborne pathogen Campylobacter. Journal of Antimicrobial Chemotherapy, 72, 1581–1588. 10.1093/jac/dkx023 [DOI] [PubMed] [Google Scholar]
- Tate H, Folster JP, Hsu CH, Chen J, Hoffmann M, Li C, Morales C, Tyson GH, Mukherjee S, Brown AC, Green A, Wilson W, Dessai U, Abbott J, Joseph L, Haro J, Ayers S, McDermott PF and Zhao S, 2017. Comparative analysis of extended‐spectrum‐β‐lactamase CTX‐M‐65‐producing Salmonella enterica serovar Infantis isolates from humans, food animals, and retail chickens in the United States. Antimicrobial Agents and Chemotheraphy, 61, pii: e00488‐17. 10.1128/aac.00488-17 [DOI] [PMC free article] [PubMed] [Google Scholar]
- Tenover FC and Goering RV, 2009. Methicillin‐resistant Staphylococcus aureus strain USA300: origin and epidemiology. Journal of Antimicrobial Chemotherapy, 64, 441–446. 10.1093/jac/dkp241 [DOI] [PubMed] [Google Scholar]
- Thépault A, Méric G, Rivoal K, Pascoe B, Mageiros L, Touzain F, Rose V, Béven V, Chemaly M and Sheppard SK, 2017. Genome‐wide identification of host‐segregating epidemiological markers for source attribution in Campylobacter jejuni . Applied and Environmental Microbiology, 83, pii: e03085‐16. 10.1128/aem.03085-16 [DOI] [PMC free article] [PubMed] [Google Scholar]
- THL (Finnish National Institute for Health and Welfare), 2017. Infectious diseases in Finland 2016. Report 11/2017. Available online: http://urn.fi/URN:ISBN:978-952-302-978-1
- Thomas JC, Godfrey PA, Feldgarden M and Robinson DA, 2012. Draft genome sequences of Staphylococcus aureus sequence type 34 (ST34) and ST42 hybrids. Journal of Bacteriology, 194, 2740–2741. 10.1128/JB.00248-12 [DOI] [PMC free article] [PubMed] [Google Scholar]
- Torralbo A, Borge C, García‐Bocanegra I, Méric G, Perea A and Carbonero A, 2015. Higher resistance of Campylobacter coli compared to Campylobacter jejuni at chicken slaughterhouse. Comparative Immunology, Microbiology and Infectious Diseases, 39, 47–52. [DOI] [PubMed] [Google Scholar]
- Van Cleef BA, Monnet DL, Voss A, Krziwanek K, Allerberger F, Struelens M, Zemlickova H, Skov RL, Vuopio‐Varkila J, Cuny C, Friedrich AW, Spiliopoulou I, Pászti J, Hardardottir H, Rossney A, Pan A, Pantosti A, Borg M, Grundmann H, Mueller‐Premru M, Olsson‐Liljequist B, Widmer AF, Harbarth S, Schweiger A, Unal A and Kluytmans JAJW, 2011. Livestock‐associated Methicillin‐Resistant Staphylococcus aureus in Humans, Europe. Emerging Infectious Diseases, 17, 502–505. 10.3201/eid1703.101036 [DOI] [PMC free article] [PubMed] [Google Scholar]
- Wagenaar JA, French NP and Havelaar AH, 2013. Preventing Campylobacter at the source: why is it so difficult? Clinical Infectious Diseases, 57, 1600–1606. [DOI] [PubMed] [Google Scholar]
- Wang Y, Zhang M, Deng F, Shen Z, Wu C, Zhang J, Zhang Q and Shen J, 2014. Emergence of multidrug‐resistant Campylobacter species isolates with a horizontally acquired rRNA methylase. Antimicrobial Agents and Chemotherapy, 58, 5405–5412. 10.1128/AAC.03039-14 [DOI] [PMC free article] [PubMed] [Google Scholar]
- Wang Y, Zhang M, Deng F, Shen Z, Wu C, Zhang J, Zhang Q and Shena J, 2015. Emergence of Multidrug‐Resistant Campylobacter Species Isolates with a horizontally acquired rRNA methylase. Antimicrobial Agents and Chemotherapy, 58, 5405–5412. [DOI] [PMC free article] [PubMed] [Google Scholar]
- Wang Y, Zhang R, Li J, Wu Z, Yin W, Schwarz S, Tyrrell JM, Zheng Y, Wang S, Shen Z, Liu Z, Liu J, Lei L, Li M, Zhang Q, Wu C, Zhang Q, Wu Y and Walsh T, 2017. Comprehensive resistome analysis reveals the prevalence of NDM and MCR‐1 in Chinese poultry production. Nature Microbiology, 2, art. 16260. 10.1038/nmicrobiol.2016.260 [DOI] [PubMed] [Google Scholar]
- Wasyl D, Kern‐Zdanowicz I, Domańska‐Blicharz K, Zając M and Hoszowski A, 2015. High‐level fluoroquinolone resistant Salmonella enterica serovar Kentucky ST198 epidemic clone with IncA/C conjugative plasmid carrying blaCTX‐M‐25 gene. Veterinary Microbiology, 175, 85–91. 10.1016/j.vetmic.2014.10.014 [DOI] [PubMed] [Google Scholar]
- Westrell T, Monnet DL, Gossner C, Heuer O and Takkinen J, 2014. Drug‐resistant Salmonella enterica serotype Kentucky in Europe. The Lancet. Infectious Diseases, 14, 270–271. [DOI] [PubMed] [Google Scholar]
- WHO (World Health Organization ‐ Advisory Group on Integrated Surveillance of Antimicrobial Resistance), 2016. Critically important antimicrobials for human medicine 4th Revision 2013. 31 pp. Available online: http://www.who.int/foodsafety/publications/antimicrobials-fourth/en
- WHO (World Health Organization), 2017. Critically important antimicrobials for human medicine – 5th revision. 41 pp. Geneva: World Health Organization. Licence: CC BY‐NC‐SA 3.0 IGO. Available online: http://www.who.int/foodsafety/publications/antimicrobials-fifth/en/
- Wieczorek K, Kania I and Osek J, 2013. Prevalence and antimicrobial resistance of Campylobacter spp. isolated from poultry carcasses in Poland. Journal of Food Protection, 76, 1451–1455. [DOI] [PubMed] [Google Scholar]
- Wielders CLC, Fluit AC, Brisse S, Verhoef J and Schmitz FJ, 2002. mecA gene is widely disseminated in Staphylococcus aureus population. Journal of Clinical Microbiology, 40, 3970–3975. 10.1128/JCM.40.11.3970-3975.2002 [DOI] [PMC free article] [PubMed] [Google Scholar]
- Woodford N, Wareham DW, Guerra B and Teale C, 2013. Carbapenemase‐producing Enterobacteriaceae and non‐Enterobacteriaceae from animals and the environment: an emerging public health risk of our own making? Journal of Antimicrobial Chemotherapy, 69, 287–291. [DOI] [PubMed] [Google Scholar]
- Yang W, Zhang M, Zhou J, Pang L, Wang G and Hou F, 2017. The molecular mechanisms of ciprofloxacin resistance in clinical Campylobacter jejuni and their genotyping characteristics in Beijing, China. Foodborne Pathogens and Diseases, 14, 386–392. 10.1089/fpd.2016.2223 [DOI] [PubMed] [Google Scholar]
- Yao H, Shen Z, Wang Y, Deng F, Liu D, Naren G, Dai L, Su CC, Wang B, Wang S, Wu C, Yu EW, Zhang Q and Shen J, 2016. Emergence of a potent multidrug efflux pump variant that enhances Campylobacter resistance to multiple antibiotics. mBio, 7, e01543–16. 10.1128/mbio.01543-16 [DOI] [PMC free article] [PubMed] [Google Scholar]
- Yao H, Liu D, Wang Y, Zhang Q and Shen Z, 2017. High prevalence and predominance of the aph(2’’)‐If gene conferring aminoglycoside resistance in Campylobacter . Antimicrobial Agents and Chemotherapy, 61, pii: e00112‐17. 10.1128/aac.00112-17 [DOI] [PMC free article] [PubMed] [Google Scholar]
- Zawack K, Li M, Booth JG, Love W, Lanzas C and Grohn YT, 2016. Monitoring antimicrobial resistance in the food supply chain and its implications for FDA policy initiatives. Antimicrobial Agents and Chemotherapy, 60, 5302–5311. 10.1128/aac.00688-16 [DOI] [PMC free article] [PubMed] [Google Scholar]
- Zhang A, Song L, Liang H, Gu Y, Zhang C, Liu X, Zhang J and Zhang M, 2016. Molecular subtyping and erythromycin resistance of Campylobacter in China. Journal of Applied Microbiology, 121, 287–293. 10.1111/jam.13135 [DOI] [PubMed] [Google Scholar]
- Zhang T, Cheng Y, Luo Q, Lu Q, Dong J, Zhang R, Wen G, Wang H, Luo L, Wang H, Liu G and Shao H, 2017. Correlation between gyrA and CmeR Box Polymorphism and Fluoroquinolone Resistance in Campylobacter jejuni Isolates in China. Antimicrobial Agents and Chemotherapy, 61, e00422‐17. 10.1128/AAC.00422-17 [DOI] [PMC free article] [PubMed] [Google Scholar]
- Zhao S, Mukherjee S, Chen Y, Li C, Young S, Warren M, Abbott J, Friedman S, Kabera C, Karlsson M and McDermott PF, 2015. Novel gentamicin resistance genes in Campylobacter isolated from humans and retail meats in the USA. Journal of Antimicrobial Chemotherapy, 70, 1314–1321. 10.1093/jac/dkv001 [DOI] [PMC free article] [PubMed] [Google Scholar]
- Zhou J, Zhang M, Yang W, Fang Y, Wang G and Hou F, 2016. A seventeen‐year observation of the antimicrobial susceptibility of clinical Campylobacter jejuni and the molecular mechanisms of erythromycin‐resistant isolates in Beijing, China. International Journal of Infectious Diseases, 42, 28–33. 10.1016/j.ijid.2015.11.005 [DOI] [PubMed] [Google Scholar]
- Zong Z, 2012. Discovery of blaOXA‐199, a chromosome‐based bla OXA‐48 ‐Like variant, in Shewanella xiamenensis . PLoS ONE, 7, e48280. [DOI] [PMC free article] [PubMed] [Google Scholar]
- Zurfluh K, Poirel L, Nordmann P, Klumpp J and Stephan R, 2015. First detection of Klebsiella variicola producing OXA‐181 carbapenemase in fresh vegetable imported from Asia to Switzerland. Antimicrobial Resistance and Infection Control, 4, 38. [DOI] [PMC free article] [PubMed] [Google Scholar]