

SUAMMARY
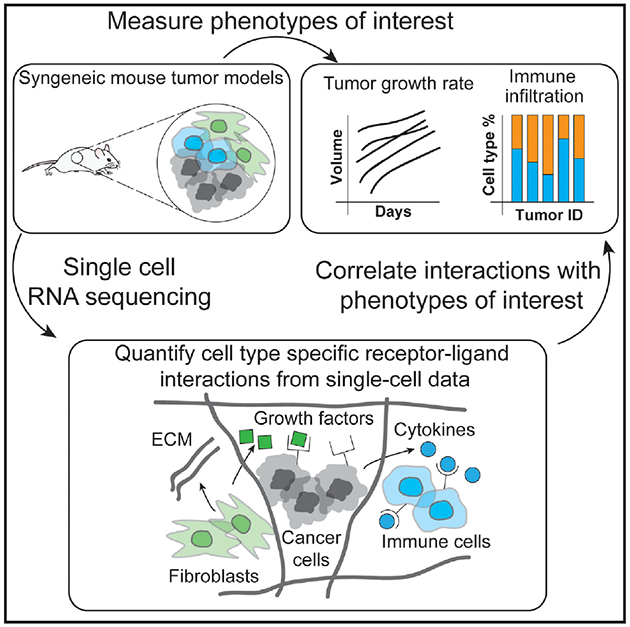
Tumor ecosystems are composed of multiple cell types that communicate by ligand-receptor interactions. Targeting ligand-receptor interactions (for instance, with immune checkpoint inhibitors) can provide significant benefits for patients. However, our knowledge of which interactions occur in a tumor and how these interactions affect outcome is still limited. We present an approach to characterize communication by ligand-receptor interactions across all cell types in a microenvironment using single-cell RNA sequencing. We apply this approach to identify and compare the ligand-receptor interactions present in six syngeneic mouse tumor models. To identify interactions potentially associated with outcome, we regress interactions against phenotypic measurements of tumor growth rate. In addition, we quantify ligand-receptor interactions between T cell subsets and their relation to immune infiltration using a publicly available human melanoma dataset. Overall, this approach provides a tool for studying cell-cell interactions, their variability across tumors, and their relationship to outcome.
In Brief
Tumors are composed of cancer cells and many non-malignant cell types, such as immune and stromal cells. To better understand how all cell types in a tumor cooperate to facilitate malignant growth, Kumar et al. studied communication between cells via ligand and receptor interactions using single-cell data and computational modeling.
Graphical Abstract
INTRODUCTION
The tumor microenvironment is composed of many cell types, including malignant, stromal, and immune cells. This cellular complexity of tumors is further increased by the heterogeneity of each cell type, such as different clones of tumor cells or the various subsets of immune cells (Jiménez-Sánchez et al., 2017; McGranahan and Swanton, 2017). These various cell types all communicate via ligand-receptor interactions, where the ligand can either be secreted and bind to the receptor in soluble form or be membrane-bound and require physical proximity of the two interacting cell types (Ramilowski et al., 2015). Furthermore, communication between these different cell types is implicated in mechanisms for tumorigenesis, tumor progression, therapy resistance, immune infiltration, and inflammation (Hanahan and Weinberg, 2011).
Given the importance of ligand-receptor interactions on patient outcome, therapeutics that target cell-cell interactions have become a useful tool in clinical practice. For example, the immune checkpoint inhibitor ipilimumab targets the CD28 or CTLA4 interaction, and both pembrolizumab and nivolumab target the PD1 or PDL1 interaction (Pardoll, 2012). Despite the clear success of these therapeutics in several tumor types, the response rates are limited. For instance, only about 20%–25% of patients respond to immuno-oncology drugs (Dempke et al., 2017; Schumacher et al., 2015). This limited response rate is likely because of the complex network of cell-cell interactions present in a tumor microenvironment, our knowledge of which is still incomplete (Sarkar et al., 2016). To better stratify patients for existing therapies as well as to discover interactions that could be targeted, there is a need to more fully understand the spectrum of cell-cell interactions occurring in tumor microenvironments and how these interactions affect outcome.
Single-cell RNA sequencing (scRNA-seq) approaches are increasingly being used to characterize both the abundance and functional state of tumor-associated cell types and have provided unprecedented detail of the heterogeneity of the cellular composition (Lavin et al., 2017; Tirosh et al., 2016; Zheng et al., 2017). However, beyond characterizing the cellular composition of a tumor, it is crucial to understand how the different cellular components interact with one another to give rise to emergent tumor behavior. Although examples of using both bulk and single-cell sequencing data to examine cell-cell communication exist (Camp et al., 2017; Choi et al., 2015; Costa et al., 2018; Puram et al., 2017; Skelly et al., 2018; Zhou et al., 2017), techniques for connecting these features to biological outcomes of interest and understanding how these interactions quantitatively relate to specific phenotypic outcomes of interest are still limited.
Here we developed an approach to characterize cell-cell communication mediated by ligand-receptor interactions across all cell types in a microenvironment using scRNA-seq data. After assigning cell types based on the scRNA-seq data using a decision tree classifier, our approach quantifies potential ligand-receptor interactions between all pairs of cell types based on their gene expression profiles. We demonstrated how this approach can assess similarities and differences in cell-cell communication between six syngeneic mouse tumor models. We then extended our approach to quantify ligand-receptor interactions in human metastatic melanoma samples. Importantly, we examined the association of individual cell-cell interactions with pathophysiological characteristics of the tumor microenvironment. This work advances conceptual and methodological approaches for gaining insights from single-cell studies of the tumor microenvironment and has applications for discovering effective therapeutic targets and biomarkers for stratification of patient treatment.
RESULTS
scRNA-seq of Syngeneic Mouse Tumor Models
Syngeneic mouse tumor models are frequently used to investigate novel immune-oncology therapeutics (Sanmamed et al., 2016). However, the different models are still incompletely understood with respect to ligand-receptor interactions. We performed scRNA-seq on tumors from six treatment-naive syngeneic mouse tumor models (B16-F10 melanoma, EMT6 breast mammary carcinoma, LL2 Lewis lung carcinoma, CT26 colon carcinoma, MC-38 colon carcinoma, and Sa1N fibrosarcoma; two samples per tumor model). Because some models are poorly infiltrated by immune cells, we additionally enriched for CD45-positive cells. Notably, measured cell frequencies were well correlated (coefficient of determination [R2] = 0.73, p = 5.6 × 10⁻⁷) between sorted and un-sorted populations, with major differences only noticeable in the B16-F10 model, which is poorly infiltrated by immune cells (Figure S1A; Comparison of scRNA-Seq and Flow Cytometry). In total, we obtained mRNA measurements of more than 10,000 single cells across all models (557 for B16-F10 cells, 4,479 from CT26 cells, 780 from EMT6 cells, 1,677 from LL2 cells, 1,310 from MC-38 cells, and 1,670 from Sa1N cells). The average number of reads per cell was approximately 72,000, and a median of approximately 2,500 genes was detected per cell (scRNA-seq Data Processing; Table S1).
To check that our scRNA-seq measurements reflect protein abundances, we stained the single-cell suspensions from the same tumors in parallel with antibodies and analyzed expression of protein marker genes by flow cytometry (Figure 1A; Table S2). Comparison of the frequencies of single cells positive for cell surface markers between the scRNA-seq data and flow cytometry results showed significant correlation between markers measured using the two approaches (R2 = 0.74, p = 2.3 × 10⁻²⁸). In addition, we evaluated the similarity of frequencies of five immune cell populations, each defined by two or three markers, and again found significant correlation between scRNA-seq and flow cytometry data (R2 = 0.48, p = 3.4 × 10⁻³; Table S2; Figure S1B). Together, these data indicated that scRNA-seq measurements recapitulate both cell type abundances and marker expression measured by flow cytometry.
Figure 1. T-SNE Visualization of Single-Cell Sequencing Data and Cell Type Classification.

(A) The percentage of cells positive for a variety of immune cell markers as measured by either scRNA-seq (x axis) or flow cytometry (y axis) is consistent across tumor models.(B and C) t-distributed scholastic neighbor embedding (t-SNE) plots of cells from six syngeneic tumor models show distinct clusters predominantly determined by cell type.(B) Cells are colored by the tumor model from which the cell originated.(C) Cells are colored by the cell type label assigned at the end of the classification procedure.(D) Percentages of cell types vary across the different tumor models. To reflect the actual cell type abundances, only data from samples not enriched for CD45 are shown. See also Figures S1 and S2.
To aid with visualization of the mouse syngeneic scRNA-seq data, we used t-distributed stochastic neighbor embedding (t-SNE), a non-linear dimensionality reduction technique, to embed the data for all six syngeneic tumor models (Van Der Maaten and Hinton, 2008; Figure 1B).
Classification of Cell Types Based on scRNA-Seq Data of Syngeneic Mouse Tumor Models
To begin identifying cell type specific cell-cell communication, we first identified the cell type of each single cell. Because of limitations in scRNA-seq technology, such as mRNA capture efficiency, the collected data contained undetected genes (Kolodziejczyk et al., 2015). This phenomenon is collectively called “zero dropout” and makes identification of cell types based on individual marker genes infeasible for all cells in the dataset. We therefore refined a previously published supervised classification approach for assigning cell types (Schelker et al., 2017). We first manually defined a list of cell types for which to search in the dataset and then specified marker genes that define each cell type (Table S3; Determining Gene Markers for Syngeneic Tumor Models). To assign individual cells as positive or negative for each marker gene, we fit Gaussian mixture models to the expression values of each marker gene and then assigned each cell in the dataset to one of the mixture components. We tested Gaussian mixture models containing one through five components to allow for the possibility of multi-modal gene expression (Fitting Gaussian Mixture Models to Determine Marker Expression). However, in all cases except one (Rpl29), mixture models containing two components best fit the gene expression profile using the Bayesian information criteria (BIC) as a metric for model selection (Figure S2C).
After we labeled cells as positive or negative for each marker gene, we then created a training dataset of high-confidence cells that matched the specified marker gene profiles for a single cell type. In this manner, we identified tumor cells from the different syngeneic models (171 B16-F10 cells, 3,345 CT26 cells, 433 EMT6 cells, 472 LL2 cells, 780 MC-38 cells, and 23 Sa1N cells) as well as immune and stromal cells (13 B cells, 62 cancer-associated fibroblasts [CAFs], 21 endothelial cells, 495 macrophages, 23 natural killer [NK] cells, 142 T cells, and 55 dendritic cells [DCs]). The training data contained roughly two-thirds (6,035 of 9,232) of all cells and contained cells from all syngeneic models (220 from B16-F10 cells, 3,497 from CT26 cells, 491 from EMT6 cells, 512 from LL2 cells, 867 from MC-38 cells, and 448 from Sa1N cells). This training dataset was conservative in the sense that cells affected by zero dropout were excluded. We then used this “high-confidence” dataset to train a supervised decision tree classifier that used the full gene expression data for predicting the cell type of all remaining cells (Figure 1C). To prevent overfitting, we used only the 500 most variable genes in the dataset and then performed principal-component analysis to further reduce the dimensionality of our input data. We kept only the number of principal components that explained 95% of the gene expression variance as input features to the classifier (Training the Decision Tree Classifier). In this way, the classification became more robust to zero dropout data and noisy data. We verified the accuracy of our classifier using 5-fold cross-validation on the training dataset (Figures S2D and S2E).
Using the trained classifier, we then predicted cell type labels for all cells present in the dataset. We also computed the probabilities of each assigned label and only retained cells with a cell type label assigned with more than 95% probability. On average, about 6% of cells for each model were not assigned a cell type with more than 95% probability. These unassigned cells may be doublets or belong to a cell type not specified by the original set of markers. In line with observations of human scRNA-seq data (Puram et al., 2017; Tirosh et al., 2016), the single cells from murine syngeneic models clustered by model for the malignant cells and by cell type for the non-malignant cells (Figures 1A and 1B), with the exception of macrophages. Given that macrophages exhibit plasticity dependent on tissue context (Biswas and Mantovani, 2010), it is possible that the clustering of macrophages by tumor model is due to the distinct microenvironments of each tumor (Figure S1C). Furthermore, the macrophages also appeared to separate according to mouse strain (Figure S1D).
The frequencies of the identified cell populations in non-CD45-enriched samples varied among models, illustrating the well-known variability of immune infiltration to different tumors (Figures 1D). Within the immune population, macrophages were the most abundant immune cell type across all models, accounting for 80%–95% of immune cells. All tumors models showed T cell infiltration, with T cells representing approximately 2%–12% of immune cells depending on the tumor model. The percentage of NK cells varied from less than 1% of immune cells in the B16-F10 and Sa1N models to approximately 5% in the LL2 model. B cells were detected in four of the six tumors models and represented 1%–2% of the total immune cells. Finally, DCs were the rarest immune cell population and were detected primarily in the Sa1N tumor model.
Scoring Cell-Cell Interactions Using Known Ligand-Receptor Interactions
Having defined cell types, we then quantified potential cell-cell interactions between all cell types present in the tumor microenvironment. We used a reference list of approximately 1,800 known, literature-supported interactions containing receptor-ligand interactions from the chemokine, cytokine, receptor tyro-sine kinase (RTK), and tumor necrosis factor (TNF) families and extracellular matrix (ECM)-integrin interactions (Ramilowski et al., 2015). In addition, we manually added known B7 family member interactions (Southan et al., 2016) because of their relevance to cancer immunology.
To identify potential cell-cell interactions that are conserved across the six syngeneic tumor models, we screened each tumor model for cases where both members of a given ligand-receptor interaction are expressed by cell types present within the tumor microenvironment (Figure 2). We scored interactions by calculating the product of average receptor expression and average ligand expression in the respective cell types under examination (Calculating Ligand-Receptor Interaction Scores). We used the average expression of each cell type to prevent false negatives because of zero dropout. After computing scores for each tumor, we averaged the interaction score across the tumor models to identify conserved interactions (Figure 2). Given the number of cell-cell interactions we screened (approximately 1,500 ligand-receptor pairs after converting to mouse homologs [Human to Mouse Homolog Conversion] and 64 pairwise combinations of cell types), we also assessed the statistical significance of each interaction score using a one-sided Wilcoxon rank-sum test and performed Benjamini-Hochberg multiple hypothesis correction. Although we computed interactions for all identified cell types, we chose to highlight interactions where either CAFs or macrophages secrete the ligand because these cell types were the predominant source of many ligands. In addition, we examined all interactions involving tumor cells.
Figure 2. Quantification of Cell-Cell Interactions Occurring in the Tumor Microenvironment.

Heatmaps show selected interaction scores calculated as the product of the average ligand expression of the first cell type and average receptor expression of the second cell type. Cell type labels are written as (cell type expressing the ligand) ‒ (cell type expressing the receptor). Black dots indicate interactions that are significantly present across all tumor (one-sided Wilcoxon rank-sum test and Benjamini Hochberg false discovery rate [FDR] < 0.33).(A) Interactions where CAFs secrete the ligand (only interactions with a score greater than 2.5 across any cell type pair are displayed).(B) Interactions where macrophages secreted the ligand (only interactions with a score greater than 2.5 across any cell type pair are displayed).(C) Interactions involving tumor cells (only interactions with a score greater than 1.5 across any cell type pair are displayed). See also Figure S3.
Many of the highest-scoring interactions were part of the chemokine family. The chemokine interactions detected often involved the same receptors, including Ccr1, Ccr2, Ccr5, and their shared ligands, including Ccl2, Ccl4, and Ccl12. Although chemokine ligands were predominantly expressed by macrophages, chemokine and cytokine receptors were expressed broadly by T cells, B cells, macrophages, and NK cells. In addition to chemokines, we observed many interactions related to the extracellular matrix. CAFs secreted numerous ECM components, including collagens (e.g., Col1a1 and Col1a2) and fibronectin (Fn1), that bind to adhesion receptors such as integrin receptors (e.g., Itgb1 and Itga5) and CD44, which were expressed broadly across all cells. We also observed secretion of metallopeptidases (MMPs), tissue inhibitors of metalloproteinases (TIMPs), and a disintegrin and metalloproteinases (ADAMs), which are all involved in modulating the extracellular environment of tumors.
The observation that many of the highest-scoring interactions involved common ligands and receptors suggested that interactions scored highly by our metric may be driven predominantly by expression of one component of a ligand-receptor interaction. We therefore examined cell type-specific receptor and ligand expression for all interactions (Figures S3A–S3C). We first calculated pairwise correlations between ligand expression, receptor expression, and interaction scores (Figure S3D) for all ligand-receptor interactions. Neither ligand expression nor receptor expression was strongly correlated with the interaction score (median correlations, 0.26 and0.35, respectively). Furthermore, examining the relationship between ligand expression, receptor expression, and interaction score (Figure S3E) showed that, in general, strong interaction scores occurred only when both the ligand and receptor were expressed.
Associating Cell-Cell Interaction Scores with Phenotypes of Interest
We next wanted to address how interaction scores may be used to gain predictive insights into relevant biological phenotypes of interest (e.g., outcomes such as tumor growth or anti-tumor immune response). In the absence of a treatment condition, we used the tumor growth rate for each tumor model as a phenotype of interest (Figures 3A and 3B; Table S4). We then computed Spearman correlations between the interaction scores across all six tumor models with the tumor growth rate (Figure 3C). Because we focused on tumor growth rate, we only displayed interactions involving tumor cells, although interactions between non-tumor cells are also expected to be relevant.
Figure 3. Interaction Scores Correlate with Relevant Characteristics of the Tumor Microenvironment.

(A) Tumor volume (y axis) of treatment-naive mice measured over time (x axis) (Table S4). Dashed lines indicate the mean of a syngeneic tumor model, and shaded areas represent 1 SEM (n = 8 for Sa1N, 7 for LL2, 10 for CT26, 9 for EMT6, and 9 for MC38). Instances with no shading result from only one mouse surviving at the measured time points. Linear curves were fit to the log-normalized growth curves, and the slope of fit curves was used as a metric for tumor growth. (B) Quantified growth rates for each model. Each point represents a single mouse, and the horizontal black line indicates the median growth rate used for correlation with interaction scores.(C) Heatmap showing the Spearman correlation of interaction scores (shown in Figure 2) with tumor growth. Interactions marked with black circles indicate correlations with p < 0.01. Grey boxes indicate interactions for which the interaction score was zero across all models and no correlation could be computed.(D) Distribution of receptor only, ligand only, and interaction score correlations. Each point represents an interaction (only autocrine interactions between tumor cells are displayed). The x axis represents the correlation of ligand expression alone with tumor growth rate, whereas the y axis represents the correlation of the receptor expression alone with tumor growth rate. Points are colored according to the strength of correlation of the interaction scores with tumor growth rate. Gray points represent interactions that were not detected across all syngeneic tumor models.
We observed many ECM-related interactions positively correlated with tumor growth. Interactions where both CAFs and endothelial cells expressed collagens that bind to either Cd93 or integrin receptors on tumor cells were positively correlated with tumor growth rate. Furthermore, additional adhesion-related interactions, such as the expression of intercellular adhesion molecules (ICAMs) binding to integrins were also positively correlated with tumor growth rate. Expression of the Adam12 and Adam15 proteases also correlated with tumor growth, although these proteases appeared to have opposing effects. Although interactions between Adam12 and its integrin substrates were negatively correlated with tumor growth rate, interactions involving Adam15 and Integrin beta 3 (Itgb3) were positively correlated with tumor growth rate.
We also observed numerous chemokine and cytokine interactions correlated with tumor growth rate. The expression of Ccl11 by tumor cells that interacts with either Ccr5 or Cxcr3 receptors expressed on both macrophages and tumors cells was positively correlated with tumor growth rate. In addition, the interactions of interleukin 1 alpha (Il1a) expressed by CAFs with its cognate receptors IL1r1, IL1r2, and IL1rap expressed on tumor cells were all negatively correlated with tumor growth rate.
Numerous interactions involving RTKs, which did not show up among the most strongly occurring interactions (Figure 2), were correlated with tumor growth rate. The autocrine interaction involving tumor cells that both secrete epidermal growth factor (EGF) and express Erbb3 receptors was positively correlated with tumor growth. In addition, interactions between CAFs secreting platelet-derived growth factor (PDGF) (Pdgfc and Pdgfd) and vascular endothelial growth factor (VEGF) (Vegfa and Vegfc) ligands that bind to both PDGF (Pdgfrb) and VEGF (Kdr/Vegfrr2) receptors on tumor cells were positively correlated with tumor growth rate.
In general, we observed that many interactions that correlated strongly with a specific phenotype contain the same receptor but different ligands. This observation raised the question whether a specific ligand or receptor drives the correlation rather than the interaction itself. To examine this possibility, we calculated Spearman correlations of the receptor expression alone or ligand expression alone with tumor growth rate. We observed that interaction scores with a high correlation with phenotype generally had either a high receptor correlation or high ligand correlation (Figure 3D). This result is not unexpected given that interaction scores are a product of receptor expression and ligand expression and, therefore, are not independent. However, there were also numerous cases where the interaction score was strongly correlated with tumor growth rate, but neither the receptor nor the ligand was strongly correlated (i.e., the region in the center of the plot with ligand and receptor expression between −0.5 and 0.5). In addition, we observed cases where receptor expression and ligand expression had opposing strong correlations (top left and bottom right regions of the plot), indicating that interaction score correlation does not simply reflect ligand and receptor correlations.
Quantifying Interactions in Human Metastatic Melanoma
We next applied our approach for quantifying cell-cell interactions to a published human dataset of metastatic melanoma (Tirosh et al., 2016). We applied the same classification approach to identify cell types and quantify cell type percentages using markers identified by Tirosh et al. (2016) (Analysis of Human Metastatic Melanoma; Figures S4A and S4B). In addition, we selected cells predicted to be T cells and again applied our classification procedure to further categorize cells into CD8+ cells, T helper cells, or regulatory T cells (Tregs).
Given the complex interactions between T cells in the tumor microenvironment and their importance in mounting a successful immunotherapy response, we investigated interactions involving Tregs (Figure 4A). We again observed many interactions involving members of the chemokine family. As before, numerous chemokine interactions shared the same ligands, including CCL3, CCL4, and CCL5, secreted by B cells, macrophages, as well as all T cell subsets. In addition, we observed cytokine interactions involving the IL10 and IL15 ligands and the IL10RA and IL2RG receptors, respectively. Because of the known immunosuppressive role of Tregs, we also examined individual tumors for B7 family interactions where Tregs expressed the ligand and CD8+ T cells expressed the receptor (Figure 4B). We observed expression of numerous inhibitory interactions, including the CD274 (PD-L1)-PDCD1 (PD-1), CTLA4-CD80, and CTLA4-CD86 interactions. However, although these B7 interactions occurred, on average, across all melanoma samples, examination of individual tumors revealed that these interactions are patient-specific (compare Figures 4A and 4B).
Figure 4. Assessing Cell-Cell Interactions Occurring in Human Metastatic Melanoma.

(A) Cell-cell interactions involving Tregs in human metastatic melanoma averaged across 19 tumor samples. The cell type labels are written as (cell type expressing the ligand) ‒ (cell type expressing the receptor). Black dots indicate interactions that are significantly present across all tumors (one-sided Wilcoxon rank-sum test and Benjamini Hochberg FDR < 0.05). Only interactions with a score greater than 0.5 across any cell type pair are displayed.(B) Examination of tumor-specific interactions in the B7 family between CD8+ T cells and Tregs shows that interactions that occur on average in (A) do not occur in all individual patients.(C) Example interactions between macrophages and CD8 cells where the receptor and ligand components of an interaction do not individually correlate with Treg percentage but the interaction score is strongly correlated with phenotype.(D) Distribution of Spearman correlation coefficients between Treg percentage and randomized ligand-receptor interactions from (C). Red lines indicate the Spearman correlation of the actual ligand-receptor pair. The p values indicate the probability that a randomized interaction pair has a stronger correlation than the actual interaction pair. See also Figure S4.
We again wanted to assess the value of interaction scores compared with analysis of receptors or ligands alone. In addition to calculating the correlation of interaction scores with phenotype, we also computed the correlation of receptor expression or ligand expression with phenotype. Despite the general correlation between interaction score correlation and receptor and/or ligand correlation, we again observed cases where neither the receptor nor the ligand was strongly correlated with phenotype, but the interaction score was strongly correlated (Figure 4C).
To understand the probability of observing a ligand-receptor pair correlate with Treg percentage despite neither the receptor nor ligand correlating with Treg percentage, we re-computed correlations using randomized ligand-receptor pairs (Computing Correlations of Randomized Interaction Scores). We assessed the significance of interactions identified in Figure 4C by using randomized interactions with one member of the ligand-receptor interaction being the same and randomizing the other member of the interaction (i.e., using the same ligand but calculating the interaction score with a random receptor and vice versa). We then compared the correlations of these randomized pairs with the observed correlation for the actual interaction (Figure 4D). For both interactions identified in Figure 4C, random interaction pairs did not correlate as strongly as the real interaction. In addition, we calculated the probability that an interaction between a ligand and random receptor would correlate more strongly than the original correlation of the ligand (Figure S4E). In general, the stronger the ligand correlation, the less likely a random ligand-receptor pair is to exhibit a greater correlation. Furthermore, this result demonstrates that ligand-receptor pairs are not expected to correlate with phenotype by chance, even when ligand expression alone is strongly correlated with phenotype.
To examine how interaction scores relate to phenotypes of interest in the context of human metastatic melanoma, we used the percentage of Tregs of the number of T cells in the tumor as a phenotype. Given that we calculated scores for 19 different tumor samples, in addition to using spearman correlation, we also constructed a predictive model using least absolute shrinkage and selection operator (LASSO) regression. For the human melanoma dataset, we started with 9,408 measured cell-cell interactions as predictors (of a total possible of 187,000 = 100 cell type pairs × 1,870 ligand-receptor interactions). We then trained a regression model using 5-fold cross-validation and identified a set of 11 interactions capable of predicting Treg percentage (Figures S4C and S4D). Interactions involving the tumor necrosis factor family receptor TNFRSF25 expressed on Tregs and its ligand TNFSF15, as well as interactions involving TNFRSF21 receptors expressed on macrophages, were predictive of the percentage of Tregs. In addition, the interaction between B cells producing PSEN1, a proteolytic enzyme required for NOTCH receptor maturation, and the NOTCH2 receptor expressed on Tregs (Struhl and Greenwald, 1999) was also predictive of the percentage of Tregs.
DISCUSSION
In this work, we developed a computational approach for analyzing scRNA-seq data to screen for ligand-receptor interactions across all cell types present in a tumor microenvironment. We applied this approach to identify cell-cell interactions common across six different syngeneic mouse tumor models and to identify patient-specific interactions in human metastatic melanoma. Furthermore, we demonstrated how these interaction scores can be used as features in correlative and predictive models to identify ligand-receptor interactions as biomarkers or potential therapeutic targets.
Foundational work by Ramilowski et al. (2015) not only cataloged known ligand-receptor pairs but also examined 144 cell types derived from primary tissue for ligand-receptor expression. The tool provided by Ramilowski et al. (2015), although providing an excellent draft of ligand-receptor communication, does not provide a way to examine how interactions might change in different contexts. When examining malignant tissues, it is not expected that expression of ligands and receptors in a tumor will be identical to expression in the primary tissue of origin. In addition, our methodology enables study of interactions in a data-driven manner when comparing different experimental perturbations (i.e., treated versus untreated tumors). Beyond the study by Ramilowski et al. (2015), numerous studies have also begun to utilize single-cell sequencing data to characterize cell-cell communication (Camp et al., 2017; Choi et al., 2015; Costa et al., 2018; Puram et al., 2017; Skelly et al., 2018; Zhou et al., 2017). The increasing number of these studies examining cell-cell communication underscores the utility of the approach. However, a key next step beyond characterizing the interactions present in a given tissue or tumor microenvironment is to understand how these interactions relate to an outcome of interest (e.g., tumor growth, response, or resistance to therapy).
In this study, we used correlative and predictive models to identify cell-cell interactions that may be related to tumor phenotypes of interest. Recent studies have demonstrated that the location and abundance of immune cells are predictive of patient outcome for standard therapies (Ino et al., 2013). For example, the presence of relevant T cell populations correlates with treatment efficacy for checkpoint inhibitors like anti-PD1, anti-PDL1, and anti-CTLA4 antibodies (Shang et al., 2015). However, the limited response rate to current therapeutic approaches underscores the fact that cellular abundance alone does not fully predict patient-specific responses. Explicit consideration of cell-cell interactions can provide additional insight to improve predicting response to therapies.
Many of the cell-cell interactions that correlated with tumor growth rate in the syngeneic tumor models have known associations with tumor growth rate. For example, numerous interactions involving the binding of tumor cells to ECM components (e.g., collagens and fibronectins) via integrin receptors were positively correlated with tumor growth rate. This result supports the well-established role of the ECM in modulating tumor progression (Pickup et al., 2014; Venning et al., 2015). Similarly, interactions involving the Ccr5 receptor and its ligands as well the cell type specificity of the interaction are supported by literature (Halama et al., 2016). For predicting the percentage of Tregs in human metastatic melanoma, the LASSO regression model selected interactions involving the TNFRSF25 receptor expressed on Tregs and its ligand TNFRSF15 expressed by T helper (Th) cells as well as an interaction between PSEN1 expressed by B cells and the NOTCH2 receptor expressed on Tregs. Previous studies have shown that decreases in Notch2 expression can reduce the proportion of Tregs, whereas agonist antibodies targeting the TNFRSF25 receptor can help expand Treg populations (Bittner et al., 2017; Qin et al., 2017; Schreiber et al., 2010). Altogether, these results suggest that our approach of linking cell-cell interactions to phenotypes of interest has the potential to identify biologically relevant interactions.
Although our results suggest that many interactions correlated with phenotypes of interest are biologically relevant, it often remains a challenge to identify the causal or mechanistic importance of individual correlates or predictive features. By using expression data to examine the activation state of intra-cellular signaling pathways or transcription factors downstream of implicated receptor-ligand interactions, further insights into biological mechanisms could be obtained (Garcia-Alonso et al., 2017; Schubert et al., 2018). Examination of interactions across all pairwise cell types also showed that the same ligand-receptor interaction can have opposite correlations with a given phenotype depending on the interacting cell types. These opposing effects highlight the potentially pleiotropic role of any specific ligand-receptor interaction and the need to account for the effects of disrupting an interaction across all cell types to fully comprehend the likely effect of a proposed treatment.
Another distinction separating our work from published single-cell sequencing studies is the classification approach we use for determining cell types. A common approach for identifying cell types is to cluster cells based on gene expression data and then manually assign a cell type label to each cluster. However, determining the number of clusters is often a subjective process. Furthermore, there is an implicit assumption with this approach that clusters will be based predominantly on cell type. However, when clustering in a high-dimensional space, clusters may form on a variety of factors (e.g., cell cycle stage), and trying to assign a cell type label to each apparent cluster can lead to errors. This can become especially problematic when trying to identify sub-types with more subtle or continuous transitions (e.g., CD8+, Th, or Treg cells or M1 or M2-like macrophages). Although t-SNE is a powerful visualization tool for single-cell sequencing data, proximity in t-SNE mappings is often used as evidence of belonging to the same cell type. Although t-SNE predominantly appears to form clusters based on cell type, the mapping is not guaranteed to always group cells by cell type, and the “accuracy” of separation is not well understood. The classification approach presented in this work provides a more quantitative and less subjective approach for cell type classification.
Several factors may lead to the identification of false positives when using our approach to identify potential cell-cell interactions based on expression of both members of a ligand-receptor interaction. The level of transcripts does not necessarily correlate to protein expression for any gene. Furthermore, because scRNA-seq does not preserve spatial information, identified interactions in which the receptor and the ligand are membrane-bound may not occur when the corresponding cell types are not spatially co-localized in a tumor. By using antibodies to detect protein levels, approaches such as multiplexed immunofluorescence imaging or imaging mass cytometry can validate that membrane-bound interaction components are spatially co-localized (Bodenmiller, 2016; Lin et al., 2015; Schapiro et al., 2017). However, these approaches are not suitable for high-throughput screening of ligand-receptor interactions. In addition, studies examining cell-cell interaction in the tumor microenvironment should consider the specificity of those interactions to the tumor microenvironment. When available, the approach presented in this paper can also be used to compare the interaction strengths observed in the tumor with those in control tissue from the same donor, such as nearby tissue of the same type or peripheral blood. In this manner, tumor-specific cell-cell interactions can be identified.
Our methods provide a screening approach to identify potential ligand-receptor interactions that occur in a tumor microenvironment. The ability to examine cell type-specific communication provided by scRNA-seq enables a broad range of applications. For example, examining samples from different locations within the tumor can provide insights into the heterogeneity of cell-cell interactions within a given tumor. Experiments examining tumors from distinct metastatic locations could reveal how various tissue microenvironments influence which cell-cell interactions occur. Given that many therapeutics target cell-cell interactions, this approach can be used to both identify potential targets or to validate that a target of interest is present. Using this approach in experimental studies that examine patient-specific responses can identify interactions that are predictive biomarkers of response to therapy for use in patient stratification.
STAR★METHODS
KEY RESOURCES TABLE
| REAGENT or RESOURCE | SOURCE | IDENTIFIER |
|---|---|---|
| Antibodies | ||
| FITC-CD45 | Biolegend | 103107 |
| 7-AAD | Biolegend | 640934 |
| AF700-CD8 | BD PharMingen | 557959 |
| PE-CF594-CD44 | Biolegend | 103007 |
| BV421-CD127 | Biolegend | 135027 |
| BV510-CD3 | Biolegend | 100353 |
| BV570-CD4 | Biolegend | 100542 |
| BV605-KLRG1 | Biolegend | 138419 |
| BV650-CD25 | Biolegend | 102038 |
| PECy7-CD11 b | Biolegend | 101216 |
| AF700-CD86 | Biolegend | 105023 |
| APC-Cy7-Ly6C | BD PharMingen | 560596 |
| PE-CF594-CD40 | BD PharMingen | 562847 |
| BV421-CD11C | Biolegend | 117343 |
| BV570-Ly6G | Biolegend | 127629 |
| BV650-HLA-DR | Biolegend | 307649 |
| PECy7-CD317 | eBioscience | 25-3172-80 |
| APC-CD206 | Biolegend | 141707 |
| APC-Cy7-GR1 | Biolegend | 108411 |
| BV421-F4/80 | Biolegend | 123137 |
| BV605-NKp46 | Biolegend | 137619 |
| BV650-B220 | Biolegend | 103241 |
| Critical Commercial Assays | ||
| Chromium Single Cell 3’ v2 reagent kit | 10×Genomics | PN-120237 |
| Deposited Data | ||
| Mouse sygeneic data | NCBI GEO | GSE121861 |
| Tirosh et al. Melanoma scRNA-seq | NCBI GEO | GSE72056 |
| Experimental Models: Cell Lines | ||
| CT26 cancer cell line | ATCC | CRL-2638 |
| MC-38 cancer cell line | NCI/NIH | |
| EMT6 cancer cell line | ATCC | CRL-2755 |
| LL2 cancer cell line | ATCC | CRL-1642 |
| Sa1N cancer cell line | ATCC | CRL-2543 |
| B16-F10 cancer cell line | ATCC | CRL-6475 |
| Experimental Models: Organisms/Strains | ||
| BALB/c inbred mouse | Charles River Laboratories | BALB/cAnNCrl |
| C57B6/J inbred mouse | Charles River Laboratories | C57BL/6NCrl |
| A/J mice inbred mouse | Charles River Laboratories | A/JCr |
| Software and Algorithms | ||
| MATLAB | The Mathworks | R2016b |
| Other | ||
| Mouse Tumor Dissociation Kit | Miltenyi | 130-096-730 |
CONTACT FOR REAGENT AND RESOURCE SHARING
Further information and requests for resources and reagents should be directed to and will be fulfilled by the Lead Contact, Andreas Raue (araue@merrimack.com).
EXPERIMENTAL MODEL AND SUBJECT DETAILS
Animal models
In our study we used three different types of immuno-competent inbred mouse strains: BALB/c (Charles River Laboratories, BALB/cAnNCrl), C57B6/J (Charles River Laboratories, C57BL/6NCrl), and A/J (Charles River Laboratories, A/JCr). All animals enrolled in our study were 6–8 weeks old female mice that were housed in vivarium under specific pathogen free conditions in cages of up to 5 animals and receiving special rodent diet (Teklad). Studies were approved by Merrimack’s Institutional Animal Care and Use Committee (IACUC) under animal protocol MAP#013. IACUC guidelines on the ethical use and care of animals were followed.
Cell lines
For our tumor models, we used six different syngeneic mouse tumor cell lines. The CT26 cancer cell line was obtained from ATCC, maintained in RPMI-10% FBS at 37°C, and implanted into BALB/c mice subcutaneously at 1×10⁶ cells per mouse. The MC-38 cancer cell line was obtained from NCI/NIH, maintained in RPMI-10% FBS at 37°C, and implanted into C57B6/J mice subcutaneously at 2×10⁵ cells per mouse. The EMT6 cancer cell line was obtained from ATCC, maintained in RPMI-10% FBS at 37°C, and implanted into BALB/c mice subcutaneously at 2×10⁵ cells per mouse. The LL2 cancer cell line was obtained from ATCC, maintained in RPMI-10% FBS at 37°C, and implanted into C57B6/J mice subcutaneously at 2×10⁵ cells per mouse. The Sa1N cancer cell line was obtained from ATCC, maintained in Eagle’s Minimum Essential Medium (EMEM, ATCC 30–2003) at 37°C, and implanted into A/J mice subcutaneously at 1 ×10⁶ cells per mouse. The B16-F10 cancer cell line as obtained from ATCC, maintained in RPMI-10% FBS at 37°C, and implanted into C57B6/J mice subcutaneously at 2×10⁵ cells per mouse.
METHOD DETAILS
scRNA-seq of mouse syngeneic tumor models
We implanted two mice for each syngeneic model resulting in a total of 12 samples. Each mouse tumor was harvested when the tumor size reached 100 – 200 mm3. Each sample was minced and digested with reagents from Mouse Tumor Dissociation Kit (Miltenyi) according to the manufacturer’s instructions. Cells were resuspended at 2×10⁵ cells/mL in PBS-0.04% BSA. Each sample was processed individually and run in technical duplicates. For each sample (except CT26 and MC-38) one replicate was enriched for CD45 positive cells. Live CD45 positive cells were sorted with BD Aria after staining with FITC-CD45 (Biolegend) and 7-AAD. Single cell suspensions of all samples were resuspended in PBS-0.04% BSA at 5×10⁵ cells/mL and barcoded with a 10× Chromium Controller (10× Genomics). In total, this procedure resulted in 24 samples. RNA from the barcoded cells for each sample was subsequently reverse-transcribed and sequencing libraries were constructed with reagents from a Chromium Single Cell 3′ v2 reagent kit (10× Genomics) according to the manufacturer’s instructions. Sequencing was performed with Illumina HiSeq according to the manufacturer’s instructions (Illumina).
Comparison of scRNA-seq and flow cytometry
Each of the 24 single cell suspensions was stained for with the following antibodies to quantify the frequencies of various live immune cell populations. Panel one included FITC-CD45, 7-AAD, AF700-CD8, PE-CF594-CD44, BV421-CD127, BV510-CD3, BV570-CD4, BV605-KLRG1 and BV650-CD25. Panel two included FITC-CD45, PECy7-CD11b, 7-AAD, AF700-CD86, APC-Cy7-Ly6C, PECF594-CD40, BV421-CD11c, BV570-Ly6G and BV650-HLA-DR. Panel three included FITC-CD45, PECy7-CD317, 7-AAD, APCCD206, AF700-CD86, APC-Cy7-GR1, PE-CF594-CD40, BV421-F4/80, BV605-NKp46 and BV650-B220. CD317 antibody was purchased from eBiosciences. CD8, Ly6C and CD40 antibodies were obtained from BD PharMingen. All other antibodies were purchased from Biolegend. Flow cytometry data were obtained on BD Fortessa and analyzed with FlowJo. After gating, the percentage of marker-positive cells was compared to the percentage of cells with at least one transcript detected in the scRNA-seq data.
QUANTIFICATION AND STATISTICAL ANALYSIS
Single cell RNA sequencing data processing
FASTQ files were processed with the CellRanger software (10× Genomics, Inc., version 2.0). Mouse genome 10–1.2.0 was used as the reference genome (10× Genomics, Inc.) to generate the matrix files containing cell barcodes and transcript counts. Statistics on the sequencing results are available in Table S1. The total number of reads was 532,180,635. To distinguish true cells from dead cells, debris or background, we used a cut-off of 1,500 on the number of genes detected per barcode, resulting in 10,573 true cells. The mean number of reads per cell was 72,182, the median detected genes per cell was 2,423 (after cut-off), and the median unique molecular identifiers (UMIs) per cell was 10,051. After conversion to transcript-per-million (TPM) values, we computed expression levels as Ei,j = log2(TPMi,j+1), where TPMi,j refers to the TPM for gene i in sample j. We then normalized each cell to its average expression level of 3559 housekeeping genes by adding the average log-normalized housekeeping expression value (equivalent to scaling first) (Eisenberg and Levanon, 2013).
Determining gene markers for syngeneic tumor models
To assign markers for the malignant cell types, we took advantage of the observation that malignant cells tend to form distinct clusters in t-SNE plots (Tirosh et al., 2016). We first performed density-based clustering (DBSCAN) on the result of our t-SNE mapping (Figure S2A). We then assumed that cells in clusters predominantly containing cell types from only one tumor model were malignant cells of that tumor model. For each tumor cluster, we then tested all genes in our dataset as univariate predictors of cluster membership (i.e., a one-versus-rest classifier) and calculated AUC values as a metric for predictive ability. Finally, we manually selected top-ranking genes based on biological relevance to the tumor model. For example, in the case of the B16-F10 melanoma model, top ranking markers included both Mlana, a tumor antigen expressed on the surface of melanoma cells, and Tyrp1, a melanocyte specific gene related to melanin synthesis.
Fitting Gaussian mixture models to determine marker expression
To identify cells positive for a specified marker gene, we fit Gaussian mixture models (GMMs) to the log-normalized expression values. For each marker gene, we tested models containing one through five Gaussian components. For each marker gene and number of components, we fit models on five random partitions of the gene expression data. We then computed the Bayesian information criterion (BIC) of the GMM for each model. To select the number of mixture components for each marker gene, we selected the model with the fewest number of components that had an average BIC value within one standard error of the minimum BIC value (Figure S2C).
Training the decision tree classifier
To create the training dataset used for cell type classification, we used a pre-defined set of 45 marker genes (Schelker et al., 2017). Each marker gene is labeled as either an AND gene, which should be present in the cell type or a NOT gene, which should be absent from the cell type. We then created the training dataset by selecting cells that express all AND markers and do not express all NOT markers. To train the classifier, we used the full gene expression data as an input to predict the assigned training label. We first select the 500 most variable genes and then perform PCA to further reduce the input dimensionality. We keep the number of principal components that explain 95% of the input variance as features for the classifier. Decision trees were fit using the MATLAB fitctree function using the default parameters, except for the MaxNumSplits parameter that was set to 100. To evaluate model accuracy, we used only cells that have a posterior probability of prediction greater than 95%. We then calculated the overall and cell type specific accuracy rates using 5-fold cross-validation.
Calculating ligand-receptor interaction scores
To identify potential cell-cell interactions we scored a given ligand-receptor interaction between cell type A and cell type B as the product of average receptor expression across all cells of cell type A and the average ligand expression across all cells of cell type B.
ei;j = expression of gene j in cell i
nc = number of cells of cell type c
To identify significant interactions, we performed a one-sided Wilcoxon rank-sum test to test the hypothesis than the median inter-action score across all tumors is greater than 0. We also used the Benjamini Hochberg method to correct for multiple hypothesis testing.
Human to mouse homolog conversion
We converted between human and mouse homologous genes using HomoloGene IDs provided in the Mouse Genome Informatics database (Blake et al., 2017).
Analysis of human metastatic melanoma
Markers for cell type identification were taken from directly from Tirosh et al. (2016). We applied the same pre-processing and classification approaches as described for the mouse syngeneic studies. To identify T cell subsets, we first predicted T cells from the full dataset, and then further categorized cells predicted as T cells into either CD8+ positive cells (CD8A+, CD8B+, CD4−), T-helper cells (CD8-+, CD8B-, CD4+, FOXP3-, CD25-), or Tregs (CD8A−, CD8+, CD4+, FOXP3+, CD25+) using the same classification approach described above. We then calculated interaction scores and significance using the approach described above.
LASSO regression models
Human metastatic interaction scores were normalized across tumors to range [0,1] for use as predictors in LASSO regression models. LASSO regression models were fit using the MATLAB lasso function and 5-fold cross-validation. After screening a range of regularization values, we selected the value with mean-squared error (MSE) within one standard error of the minimum MSE.
Computing correlations of randomized interaction scores
Our list of ligand-receptor interactions contained 645 unique ligands and 589 receptors, which resulted in a total of 379,905 possible random ligand-receptor pairs. With 10 different cell-types identified in the human metastatic melanoma analysis, this resulted in a total of 37,990,500 cell type specific random interactions. For each possible cell-type specific randomized interaction pair, we calculated the spearman correlation between Treg percentage with the interaction score of the random pair. To calculate p values, we divided the number of random interactions pairs with stronger correlation than the true interaction by the total number of random pairs.
DATA AND SOFTWARE AVAILABILITY
The accesion number for accessing the syngeneic mouse single-cell expression data reported in this paper is GEO: GSE121861. The accession number for the single-cell sequening data from Tirosh et al. (2016) reported in this paper is GEO: GSE72056. All analysis code is available on Github at https://github.mit.edu/mkumar/scRNAseq_communication.
Supplementary Material
Highlights.
Ligand-receptor interactions in tumors were investigated using single-cell RNA-seq
Identified interactions were regressed against phenotypic measurements of tumors
The approach provides a tool for studying cell-cell interactions and their variability
ACKNOWLEDGMENTS
We thank Merrimack Pharmaceuticals, Inc. for sponsoring the research and supporting publication of the results and the internal review team for reviewing the article prior to submission. We also acknowledge the NIGMS Interdisciplinary Biotechnology Training Program (T32-GM008334) and NCI (U01-CA215798) for funding (to M.P.K. and D.A.L.).
Footnotes
SUPPLEMENTAL INFORMATION
Supplemental Information includes four figures and four tables and can be found with this article online at https://doi.org/10.1016/j.celrep.2018.10.047.
DECLARATION OF INTERESTS
Several co-authors are employed by Merrimack Pharmaceuticals, Inc.
REFERENCES
- Biswas SK, and Mantovani A (2010). Macrophage plasticity and interaction with lymphocyte subsets: cancer as a paradigm. Nat. Immunol 11, 889–896. [DOI] [PubMed] [Google Scholar]
- Bittner S, Knoll G, and Ehrenschwender M (2017). Death receptor 3 signaling enhances proliferation of human regulatory T cells. FEBS Lett 591, 1187–1195. [DOI] [PubMed] [Google Scholar]
- Blake JA, Eppig JT, Kadin JA, Richardson JE, Smith CL, and Bult CJ; the Mouse Genome Database Group (2017). Mouse Genome Database (MGD)-2017: community knowledge resource for the laboratory mouse. Nucleic Acids Res 45 (D1), D723–D729. [DOI] [PMC free article] [PubMed] [Google Scholar]
- Bodenmiller B (2016). Multiplexed Epitope-Based Tissue Imaging for Discovery and Healthcare Applications. Cell Syst 2, 225–238. [DOI] [PubMed] [Google Scholar]
- Camp JG, Sekine K, Gerber T, Loeffler-Wirth H, Binder H, Gac M, Kanton S, Kageyama J, Damm G, Seehofer D, et al. (2017). Multilineage communication regulates human liver bud development from pluripotency. Nature 546, 533–538. [DOI] [PubMed] [Google Scholar]
- Choi H, Sheng J, Gao D, Li F, Durrans A, Ryu S, Lee SB, Narula N, Rafii S, Elemento O, et al. (2015). Transcriptome analysis of individual stromal cell populations identifies stroma-tumor crosstalk in mouse lung cancer model. Cell Rep 10, 1187–1201. [DOI] [PubMed] [Google Scholar]
- Costa A, Kieffer Y, Scholer-Dahirel A, Pelon F, Bourachot B, Cardon M, Sirven P, Magagna I, Fuhrmann L, Bernard C, et al. (2018). Fibroblast Heterogeneity and Immunosuppressive Environment in Human Breast Cancer. Cancer Cell 33, 463–479.e10. [DOI] [PubMed] [Google Scholar]
- Dempke WCM, Fenchel K, Uciechowski P, and Dale SP (2017). Second- and third-generation drugs for immuno-oncology treatment-The more the better? Eur. J. Cancer 74, 55–72. [DOI] [PubMed] [Google Scholar]
- Eisenberg E, and Levanon EY (2013). Human housekeeping genes, revisited. Trends Genet 29, 569–574. [DOI] [PubMed] [Google Scholar]
- Garcia-Alonso L, Iorio F, Matchan A, Fonseca N, Jaaks P, Falcone F, et al. (2017). Transcription factor activities enhance markers of drug response in cancer. Cancer Res, Published online December 11, 2017 10.1158/0008-5472.CAN-17-1679. [DOI] [PMC free article] [PubMed] [Google Scholar]
- Halama N, Zoernig I, Berthel A, Kahlert C, Klupp F, Suarez-Carmona M, Suetterlin T, Brand K, Krauss J, Lasitschka F, et al. (2016). Tumoral Immune Cell Exploitation in Colorectal Cancer Metastases Can Be Targeted Effectively by Anti-CCR5 Therapy in Cancer Patients. Cancer Cell 29, 587–601. [DOI] [PubMed] [Google Scholar]
- Hanahan D, and Weinberg RA (2011). Hallmarks of cancer: the next generation. Cell 144, 646–674. [DOI] [PubMed] [Google Scholar]
- Ino Y, Yamazaki-Itoh R, Shimada K, Iwasaki M, Kosuge T, Kanai Y, and Hiraoka N (2013). Immune cell infiltration as an indicator of the immune micro-environment of pancreatic cancer. Br. J. Cancer 108, 914–923. [DOI] [PMC free article] [PubMed] [Google Scholar]
- Jiménez-Sánchez A, Memon D, Pourpe S, Veeraraghavan H, Li Y, Vargas HA, Gill MB, Park KJ, Zivanovic O, Konner J, et al. (2017). Heterogeneous Tumor-Immune Microenvironments among Differentially Growing Metastases in an Ovarian Cancer Patient. Cell 170, 927–938.e20. [DOI] [PMC free article] [PubMed] [Google Scholar]
- Kolodziejczyk AA, Kim JK, Svensson V, Marioni JC, and Teichmann SA (2015). The technology and biology of single-cell RNA sequencing. Mol. Cell 58, 610–620. [DOI] [PubMed] [Google Scholar]
- Lavin Y, Kobayashi S, Leader A, Amir ED, Elefant N, Bigenwald C, Remark R, Sweeney R, Becker CD, Levine JH, et al. (2017). Innate Immune Landscape in Early Lung Adenocarcinoma by Paired Single-Cell Analyses. Cell 169, 750–765.e17. [DOI] [PMC free article] [PubMed] [Google Scholar]
- Lin JR, Fallahi-Sichani M, and Sorger PK (2015). Highly multiplexed imaging of single cells using a high-throughput cyclic immunofluorescence method. Nat. Commun 6, 8390. [DOI] [PMC free article] [PubMed] [Google Scholar]
- McGranahan N, and Swanton C (2017). Clonal Heterogeneity and Tumor Evolution: Past, Present, and the Future. Cell 168, 613–628. [DOI] [PubMed] [Google Scholar]
- Pardoll DM (2012). The blockade of immune checkpoints in cancer immuno-therapy. Nat. Rev. Cancer 12, 252–264. [DOI] [PMC free article] [PubMed] [Google Scholar]
- Pickup MW, Mouw JK, and Weaver VM (2014). The extracellular matrix modulates the hallmarks of cancer. EMBO Rep 15, 1243–1253. [DOI] [PMC free article] [PubMed] [Google Scholar]
- Puram SV, Tirosh I, Parikh AS, Patel AP, Yizhak K, Gillespie S, Rodman C, Luo CL, Mroz EA, Emerick KS, et al. (2017). Single-Cell Transcriptomic Analysis of Primary and Metastatic Tumor Ecosystems in Head and Neck Cancer. Cell 171, 1611–1624.e24. [DOI] [PMC free article] [PubMed] [Google Scholar]
- Qin L, Zhou Y-C, Wu H-J, Zhuo Y, Wang Y-P, Si C-Y, and Qin Y-M (2017). Notch Signaling Modulates the Balance of Regulatory T Cells and T Helper 17 Cells in Patients with Chronic Hepatitis C. DNA Cell Biol 36, 311–320. [DOI] [PubMed] [Google Scholar]
- Ramilowski JA, Goldberg T, Harshbarger J, Kloppmann E, Lizio M, Satagopam VP, Itoh M, Kawaji H, Carninci P, Rost B, and Forrest AR (2015). A draft network of ligand-receptor-mediated multicellular signalling in human. Nat. Commun 6, 7866. [DOI] [PMC free article] [PubMed] [Google Scholar]
- Sanmamed MF, Chester C, Melero I, and Kohrt H (2016). Defining the optimal murine models to investigate immune checkpoint blockers and their combination with other immunotherapies. Ann. Oncol 27, 1190–1198. [DOI] [PubMed] [Google Scholar]
- Sarkar S, Sabhachandani P, Stroopinsky D, Palmer K, Cohen N, Rose-nblatt J, Avigan D, and Konry T (2016). Dynamic analysis of immune and cancer cell interactions at single cell level in microfluidic droplets. Biomicrofluidics 10, 054115. [DOI] [PMC free article] [PubMed] [Google Scholar]
- Schapiro D, Jackson HW, Raghuraman S, Fischer JR, Zanotelli VRT, Schulz D, Giesen C, Catena R, Varga Z, and Bodenmiller B (2017). histoCAT: analysis of cell phenotypes and interactions in multiplex image cytometry data. Nat. Methods 14, 873–876. [DOI] [PMC free article] [PubMed] [Google Scholar]
- Schelker M, Feau S, Du J, Ranu N, Klipp E, MacBeath G, Schoeberl B, and Raue A (2017). Estimation of immune cell content in tumour tissue using single-cell RNA-seq data. Nat. Commun 8, 2032. [DOI] [PMC free article] [PubMed] [Google Scholar]
- Schreiber TH, Wolf D, Tsai MS, Chirinos J, Deyev VV, Gonzalez L, Malek TR, Levy RB, and Podack ER (2010). Therapeutic Treg expansion in mice by TNFRSF25 prevents allergic lung inflammation. J. Clin. Invest 120, 3629–3640. [DOI] [PMC free article] [PubMed] [Google Scholar]
- Schubert M, Klinger B, Klünemann M, Sieber A, Uhlitz F, Sauer S, Garnett MJ, Blüthgen N, and Saez-Rodriguez J (2018). Perturbation-response genes reveal signaling footprints in cancer gene expression. Nat. Commun 9, 20. [DOI] [PMC free article] [PubMed] [Google Scholar]
- Schumacher TN, Kesmir C, and van Buuren MM (2015). Biomarkers in cancer immunotherapy. Cancer Cell 27, 12–14. [DOI] [PubMed] [Google Scholar]
- Shang B, Liu Y, Jiang SJ, and Liu Y (2015). Prognostic value of tumor-infiltrating FoxP3+ regulatory T cells in cancers: a systematic review and meta-analysis. Sci. Rep 5, 15179. [DOI] [PMC free article] [PubMed] [Google Scholar]
- Skelly DA, Squiers GT, McLellan MA, Bolisetty MT, Robson P, Rosenthal NA, and Pinto AR (2018). Single-Cell Transcriptional Profiling Reveals Cellular Diversity and Intercommunication in the Mouse Heart. Cell Rep 22, 600–610. [DOI] [PubMed] [Google Scholar]
- Southan C, Sharman JL, Benson HE, Faccenda E, Pawson AJ, Alexander SPH, Buneman OP, Davenport AP, McGrath JC, Peters JA, et al. ; NC-IUPHAR (2016). The IUPHAR/BPS Guide to PHARMACOLOGY in 2016: towards curated quantitative interactions between 1300 protein targets and 6000 ligands. Nucleic Acids Res 44 (D1), D1054–D1068. [DOI] [PMC free article] [PubMed] [Google Scholar]
- Struhl G, and Greenwald I (1999). Presenilin is required for activity and nuclear access of Notch in Drosophila. Nature 398, 522–525. [DOI] [PubMed] [Google Scholar]
- Tirosh I, Izar B, Prakadan SM, Wadsworth MH 2nd, Treacy D, Trombetta JJ, Rotem A, Rodman C, Lian C, Murphy G, et al. (2016). Dissecting the multicellular ecosystem of metastatic melanoma by single-cell RNA-seq. Science 352, 189–196. [DOI] [PMC free article] [PubMed] [Google Scholar]
- Van Der Maaten LJP, and Hinton GE (2008). Visualizing high-dimensional data using t-sne. J. Mach. Learn. Res 9, 2579–2605. [Google Scholar]
- Venning FA, Wullkopf L, and Erler JT (2015). Targeting ECM Disrupts Cancer Progression. Front. Oncol 5, 224. [DOI] [PMC free article] [PubMed] [Google Scholar]
- Zheng C, Zheng L, Yoo JK, Guo H, Zhang Y, Guo X, Kang B, Hu R, Huang JY, Zhang Q, et al. (2017). Landscape of Infiltrating T Cells in Liver Cancer Revealed by Single-Cell Sequencing. Cell 169, 1342–1356.e16. [DOI] [PubMed] [Google Scholar]
- Zhou JX, Taramelli R, Pedrini E, Knijnenburg T, and Huang S (2017). Extracting Intercellular Signaling Network of Cancer Tissues using Ligand-Receptor Expression Patterns from Whole-tumor and Single-cell Transcriptomes. Sci. Rep 7, 8815. [DOI] [PMC free article] [PubMed] [Google Scholar]
Associated Data
This section collects any data citations, data availability statements, or supplementary materials included in this article.
Supplementary Materials
Data Availability Statement
The accesion number for accessing the syngeneic mouse single-cell expression data reported in this paper is GEO: GSE121861. The accession number for the single-cell sequening data from Tirosh et al. (2016) reported in this paper is GEO: GSE72056. All analysis code is available on Github at https://github.mit.edu/mkumar/scRNAseq_communication.