

Abstract
Background:
Current differentiation protocols to produce cardiomyocytes from human induced pluripotent stem cells (iPSCs) are capable of generating highly pure cardiomyocyte populations as determined by expression of cardiac troponin T. However, these cardiomyocytes remain immature, more closely resembling the fetal state, with a lower maximum contractile force, slower upstroke velocity, and immature mitochondrial function compared with adult cardiomyocytes. Immaturity of iPSC-derived cardiomyocytes may be a significant barrier to clinical translation of cardiomyocyte cell therapies for heart disease. During development, cardiomyocytes undergo a shift from a proliferative state in the fetus to a more mature but quiescent state after birth. The mechanistic target of rapamycin (mTOR) signaling pathway plays a key role in nutrient sensing and growth. We hypothesized that transient inhibition of the mTOR signaling pathway could lead cardiomyocytes to a quiescent state and enhance cardiomyocyte maturation.
Methods:
Cardiomyocytes were differentiated from three human iPSC lines using small molecules to modulate the Wnt pathway. Torin1 (0–200 nM) was used to inhibit the mTOR pathway at various time points. We quantified contractile, metabolic, and electrophysiological properties of matured iPSC-derived cardiomyocytes. We utilized the small molecule inhibitor, pifithrin-α, to inhibit p53 signaling, and nutlin-3a, a small molecule inhibitor of MDM2 to upregulate and increase activation of p53.
Results:
Torin1 (200 nM) increased the percentage of quiescent cells (G0 phase) from 24% to 48% compared to vehicle control (p<0.05). Torin1 significantly increased expression of selected sarcomere proteins (including TNNI3) and ion channels (including Kir2.1) in a dose-dependent manner when Torin1 was initiated after onset of cardiomyocyte beating. Torin1-treated cells had an increased relative maximum force of contraction, increased maximum oxygen consumption rate, decreased peak rise time, and increased downstroke velocity. Torin1 treatment increased protein expression of p53, and these effects were inhibited by pifithrin-α. In contrast, nutlin-3a independently upregulated p53, led to an increase in TNNI3 expression and worked synergistically with Torin1 to further increase expression of both p53 and TNNI3.
Conclusions:
Transient treatment of human iPSC-derived cardiomyocytes with Torin1 shifts cells to a quiescent state and enhances cardiomyocyte maturity.
Keywords: stem cell, cardiomyocyte, quiescence, maturation
INTRODUCTION
Human embryonic stem cells (ESCs) or induced pluripotent stem cells (iPSCs) are capable of producing highly pure cardiomyocyte populations as determined by expression of cardiac troponin.1 However, these protocols produce immature cardiomyocytes that more closely resemble the fetal state, with less organized sarcomere structure, lower maximum contractile force, slower upstroke velocity, higher resting potential, absent T-tubules, and continued reliance on glycolysis as the primary energy source.2 Notably, delivery of immature ESC-derived cardiomyocytes to large animal models (macaque monkeys or Yorkshire pigs) leads to an increased risk of potentially life-threatening ventricular arrhythmias compared to vehicle control.3, 4 Inadequate maturation of stem cell-derived cardiomyocytes is a major barrier to clinical translation of cell therapies for heart disease.
Prior approaches to enhance maturation of stem cell-derived cardiomyocytes have had limited success. Bioengineered substrates,5 prolonged time in culture,2 external pacing,6, 7 co-culture,8 mechanical stimulation,9 and bioactive molecules such as triiodothyronine,10 glucocorticoids,11 or fatty acids12 have shown some improvement in maturation. However, the underlying molecular mechanisms leading to enhanced cardiomyocyte maturation remain unclear. Aberrant upregulation of hypoxia-inducible factor-1α (HIF1α) signaling seen in the context of high glucose-containing media may result in cardiomyocyte immaturity.13 This suggests that a nutrient sensor may be responsible for initiation of cardiomyocyte maturation.
At birth, mammals undergo significant physiologic changes, as the newborn adapts from deriving oxygen and nutrients from the placenta to deriving oxygen via spontaneous respiration and nutrition via enteral feeding. The underlying molecular mechanisms by which these physiologic changes regulate cardiac phenotype remain unclear. In mice, cardiomyocytes retain the ability to regenerate following myocardial injury in the first few days after birth.14 However, beyond this period, cardiomyocytes exit the cell cycle and become quiescent.15 Although quiescent cells are not actively proliferating, cells are far from dormant in this state – rather, cells retain metabolic and transcriptional activity.16 This quiescent period coincides with increased maturation of cardiomyocytes, with a more organized sarcomere structure, prolongation of the action potential duration and a shift from glycolysis to fatty acid oxidation.15
The mechanistic target of rapamycin (mTOR) is a central regulator of growth and metabolism.17 mTOR serves as a nutrient sensor that can stimulate cell proliferation and can act as metabolic switch between glycolysis and oxidative phosphorylation.18 The mTOR protein forms complexes with other proteins to form mTOR complex 1 (mTORC1) or mTOR complex 2 (mTORC2), each of which serves complementary or at times, competing, purposes.17 The mTOR system is also important in determining whether cells exiting the cell cycle proceed to quiescence versus senescence, a state of irreversible cell cycle arrest associated with aging.19 Cell cycle arrest without accompanying inhibition of mTOR leads to senescence, while cell cycle arrest with concomitant mTOR inhibition leads to quiescence.19, 20 mTOR has also been shown to regulate maturation of other cell types, including pancreatic beta cells,21 erythroid cells,22 and natural killer cells.23 In the heart, mTOR signaling has been shown to regulate cardiac hypertrophy,24 and deletion of mTOR from cardiomyocytes leads to cardiomyocyte apoptosis during development.25 However, whether and how mTOR regulation affects maturation of cardiomyocytes is not well-understood.
mTOR is inhibited by the small molecule rapamycin.17 Rapamycin enhances cardiomyocyte differentiation efficiency when used prior to differentiation and during early differentiation by reducing p53-dependent apoptosis.26 Rapamycin predominantly inhibits mTORC1, although rapamycin can have some inhibitory effect on mTORC2 when used chronically.27 In contrast, the dual mTORC1/2 inhibitor, Torin1, has an acute inhibitory effect on both mTORC1 and mTORC2, and also has a more complete inhibitory effect on phosphorylation of the translation initiation factor 4E-BP1 than rapamycin.28, 29 4E-BP1 can interact in crosstalk with the cell cycle regulator, p53, an important mediator directing cellular quiescence.30 We tested the hypothesis that transient inhibition of the mTOR pathway with Torin1 leads to cellular quiescence and enhances maturation of iPSC-derived cardiomyocytes.
METHODS
An expanded methods section is available in the online Supplement. The data that support the findings of this study are available from the corresponding author upon reasonable request.
Cell lines
The BJRiPS-A (Harvard Stem Cell Institute), UCSD142i-86–1 iPS (Dr. Kelly Frazer, University of California San Diego, distributed by WiCell), and the commercially-available Gibco episomal-derived iPS (ThermoFisher) cell lines were used in this study. Additional details are in Supplemental Methods. Key experiments were performed in all three cell lines to confirm reproducibility. The Institutional Review Board at Harvard University reviewed our use of human materials in this study and provided a determination of not human subjects research. The UCSD142i-86–1 and Gibco episomal iPSC lines are de-identified, were originally derived from tissue samples obtained with informed consent. The providers stated they will not share identifiable information about the donors of these materials. The BJRIPS-A line was derived from the BJ fibroblast line, originally derived from discarded tissue and deposited into ATCC for broad distribution in 2000. There was no consent form for this material as it was collected before it became common practice to require informed consent for use of discarded human tissues. The BJ fibroblast line has been completely stripped of identifiers, and there is no link between sample and donor.
Differentiation of induced pluripotent stem cell derived-cardiomyocytes
Cells were differentiated according to the protocol previously described by Lian et al. with some modifications (Figure 1A, additional details in Supplemental Methods).1 Beating cardiomyocytes were treated with Torin1 (200 nM, unless otherwise noted) or vehicle (0.02% dimethylsulfoxide (DMSO)) beginning at ~2 days after onset of beating for 7 days (media changed with fresh Torin1 or DMSO every 2–3 days), unless otherwise noted.
Figure 1.

Torin1 treatment increases cellular quiescence of induced pluripotent stem cell (iPSC)-derived cardiomyocytes (CMs). (A) Schematic of differentiation protocol, with Torin1 treatment performed for 7 days starting ~2 days after onset of beating, unless otherwise noted. (B) Western analysis of phospho-S6 and phospho-Akt at baseline and 30 minutes, and 2, 4, 10, 24, and 48 hours after a single treatment of iPSC-derived CMs with Torin1 (200 nM), BJRiPS-CMs. (C) Cell counts per well of a 12 well plate during differentiation. Torin1 treatment started on day 9, approximately 2 days after onset of CM beating, BJRiPS-CMs, n=3 per group per time point. (D) Percentage of TNNT2+ CMs out of live cell population by flow cytometry, Gibco iPS-CMs, n=3 per condition, n.s. by one-way ANOVA. (E) qPCR of selected quiescence markers (TP53, RB1, RBL2 (p130), CDKN1a (p21), CDKN1b (p27), CDKN2a (p16) and HES1) and proliferation markers (MKI67, CCNA1, CCNB1, CCNC1, CCND1, CDK3, and E2F1) iPSC-derived cardiomyocytes after treatment with Torin1 (10 nM, 50 nM, or 200 nM) or vehicle control (0.02% DMSO) for 7 days starting ~2 days after onset of beating. n=3 per condition, *p<0.05, ****p<0.001 by multiple t-tests with Holm-Sidak method to compare to control for each gene, BJRiPS-CMs. (F) Representative flow cytometry plots of iPSC-derived CMs stained with Hoechst 33342 and Pyronin Y to distinguish between G0, G1, and S/G2/M phases in control, 10 nM Torin1-treated, or 200 nM Torin1-treated cells, Gibco iPS-CMs. (G) Percentage of TNNT2+ cardiomyocytes in G0, G1 or S/G2/M phases after Torin1-treatment (200 nM) for 1 week starting ~2 days after onset of beating. n=3 per condition, ***p<0.001, ****p<0.0001 by two-way ANOVA with Tukey’s multiple comparisons test, Gibco iPS-CMs. (H) Percentage of TNNT2+ CMs in G0, G1 or S/G2/M phases in control CMs after 0.02% DMSO-treatment for 1 week starting ~2 days after onset of beating followed by 10% FBS or no serum control. n=3 per group, **p<0.01 by two-way ANOVA with Sidak’s multiple comparisons test, Gibco iPSC-CMs. (I) Percentage of TNNT2+ CMs in G0, G1 or S/G2/M phases after Torin1-treatment (200 nM) for 1 week starting ~2 days after onset of beating followed by 10% FBS or no serum control. n=3 per group, **p<0.01 by two-way ANOVA with Sidak’s multiple comparisons test, Gibco iPSC-CMs. DMSO, dimethylsulfoxide; IWP-4, inhibitor of Wnt production-4; RI, ROCK (Rho-associated, coiled coil containing protein kinase) inhibitor (Y-27632); RPMI, Roswell Park Memorial Institute 1640 medium.
Quantitative reverse transcriptase polymerase chain reaction
RNA was extracted from cells using RiboZol (VWR) followed by the E.Z.N.A. Total RNA I kit (Omega) then reverse transcribed to cDNA with the High Capacity cDNA Reverse Transcription kit (Thermo Fisher Scientific) according to the manufacturer’s instructions. Quantitative PCR (qPCR) was performed using the iTaq Universal SYBR Green Supermix (Bio-Rad) (Supplemental Table 1 lists primer pairs).
Western analysis
Western analysis was performed according to methods described in Supplemental Methods. Supplemental Table 2 lists primary and secondary antibodies used.
Flow cytometry
Flow cytometry was performed according to methods described in Supplemental Methods. For cell cycle analysis, Hoechst 33342 (2 μg/ml) and pyronin Y (4 μg/ml) staining was used to distinguish between cells in G0, G1, and S-G2-M phases.31 For other analyses, Supplemental Table 2 lists primary and secondary antibodies used. Data were acquired via a BD LSRII instrument and analyzed using FlowJo software.
Immunocytochemistry
Immunostaining was performed as described in Supplemental Methods. Supplemental Table 2 lists primary and secondary antibodies used. Cells were visualized with a Zeiss LSM700 confocal microscope.
Muscular thin films
Gelatin muscular thin films (MTFs) were prepared as previously described, and further details are provided in the Supplemental Methods.32 In brief, micromolded gelatin MTFs were prepared on glass coverslips then seeded with vehicle- or Torin1-treated iPSC-derived cardiomyocytes. A MyoPacer Cell Stimulator (IonOptix) was used to pace MTFs. The modified Stoney’s equation was used to calculate force for each MTF using the radius of curvature, thickness, and elastic modulus.33 The relative maximum systolic force was normalized to control for each batch.
Seahorse Mito Stress Test
The Seahorse XFe96 Analyzer (Agilent) was used to assess metabolic activity of differentiated cardiomyocytes according to the manufacturer’s instructions (additional details available in Supplemental Methods). The XF Cell Mito Stress Test Kit was used according to the manufacturer’s instructions. Oxygen consumption rate (OCR) values were normalized to baseline values for each well.
Mitochondrial DNA to nuclear DNA ratio
The mitochondrial DNA to nuclear DNA ratio was quantified with qPCR. DNA was extracted from cardiomyocytes using the PureLink genomic DNA mini kit (Invitrogen). Primers for DNA to mitochondrial gene NADH dehydrogenase 1 (ND1) and nuclear gene lipoprotein lipase gene (LPL) were used.10
MitoTracker and MitoProbe JC-1 assays
Live iPSC-derived cardiomyocytes were stained using MitoTracker Green FM (Invitrogen) or the MitoProbe JC-1 assay kit (Invitrogen) according to the manufacturer’s instructions. Cells were evaluated by flow cytometry and mean fluorescence intensity (MFI) of all live cells was quantified. For JC-1, the ratio of red to green MFI for vehicle versus Torin1-treated cells was quantified and normalized to control.
Voltage analysis with Vala Kinetic Image Cytometer
Voltage analysis was performed with the FluoVolt Membrane Potential Kit (Thermo) and an IC200 Kinetic Image Cytometer (Vala) with CyteSeer automated image analysis software (Vala) as described in Supplemental Methods. Voltage analysis was performed using the CyteSeer image analysis software to quantify peak rise time, CTD25 (25% duration of the calcium transient, or duration at 25% decline from maximum amplitude), CTD75 (75% duration of the calcium transient, or duration at 75% decline from maximum amplitude, T75–25 (time for voltage to decay from 75% to 25% of maximum), and downstroke velocity.34
NanoString analysis
We performed gene expression analysis using NanoString technology per the manufacturer’s instructions as described in Supplemental Methods. We selected the nCounter PanCancer Pathways Panel to provide a multiplex analysis of 770 genes in pathways associated with cell cycle regulation, metabolism, quiescence and senescence. Following completion of 7 days of treatment with Torin1 or DMSO, we added 10% fetal bovine serum (FBS) to half of the wells per treatment group for 4 days. Samples were processed on the NanoString prep station then imaged with the nCounter instrument (NanoString Technologies).
Statistics
Data are expressed as mean ± standard error of the mean (SEM) unless noted otherwise. Data were analyzed using GraphPad Prism software. Normally distributed data were evaluated with a Student’s unpaired t-test, one-way ANOVA, or two-way ANOVA as appropriate. Data not normally distributed were analyzed with the Kruskal-Wallis test as appropriate. NanoString data were evaluated using nSolver software with the Advanced Analysis Module 2.0 and open source R with unpaired t-tests to evaluate expression analyses using the Benjamini-Yekutieli method to control for false discovery rate. Tests were considered statistically significant for p<0.05.
RESULTS
Dual mTORC1/2 inhibition with Torin1 leads to cellular quiescence
We transiently inhibited mTOR at different phases of differentiation and at different concentrations of Torin1 (0–200 nM) and then evaluated the effect on cell cycle state and cardiomyocyte purity. Based on results from these protocol optimization steps, for the majority of subsequent experiments, we treated cells with 200 nM Torin1 versus vehicle (0.02% DMSO) for 7 days with treatment beginning ~2 days after onset of beating (Figure 1A) unless noted otherwise.
When administered to differentiated cardiomyocytes, treatment with Torin1 led to acutely decreased phosphorylation of both S6K and Akt, demonstrating its downstream effects on both mTORC1 (S6K) and mTORC2 (Akt) (Figure 1B). We observed recovery of the phosphorylated state for S6K but not Akt within 2 days after a single treatment with Torin1, suggesting that repeated treatment may be necessary to maintain mTORC1 inhibition (Figure 1B). There was a non-significant trend toward decreased absolute numbers of cells per well and increased purity of TNNT2+ cells with Torin1 treatment (Figures 1C and 1D, respectively). We observed a significant decrease in cyclin C1 and E2F1 proliferative markers and non-significant trends toward increased expression of quiescence markers including p16 and p130 (Figure 1E).
Treatment of beating cardiomyocytes with Torin1 led to an increase in quiescent (G0) cells from 24% to 48% and a decrease in G1 cells from 47% to 27% versus vehicle control (representative flow cytometry plots in Figure 1F, analysis in Figure 1G). Due to concern that cell cycle analysis by flow cytometry may be subject to selection bias from dissociation or have false positives due to changes in DNA/RNA content with maturation, we also performed immunostaining for proliferative markers Ki67 and phospho-histone H3 (pH3) in the original 12-well culture plate. Torin1 treatment significantly decreased the percentage of Ki67+ cardiomyocytes but did not change the percentage of pH3+ cardiomyocytes versus control (Supplemental Figure 1). Stimulation with 10% FBS for 48 hours starting two days after completion of Torin1 treatment resulted in a significant decrease in the percentage of Torin1-treated cells in G0 (Figure 1I) but not control (Figure 1H), showing that at least some Torin1-treated cells still retain the ability to re-enter the cell cycle with appropriate stimulation and have not entered cellular senescence or deeper quiescence.
Dual inhibition of mTORC1/2 with Torin1 during late differentiation enhances contractility of iPSC-derived cardiomyocytes
Torin1 treatment trended toward increased expression of MYH6, MYH7, TNNT2 mRNA, and significantly increased TNNI3 mRNA expression in a dose-dependent manner (Figure 2A), although TNNT2 and TNNI3 RNA levels still remain markedly below that of either fetal or adult human heart RNA expression levels (Supplemental Figures 2A and B). In addition, Torin1 treatment resulted in a dose-dependent increase in TNNT2 and TNNI3 protein expression by western analysis (representative blot shown in Figure 2B) and TNNT2 MFI by flow cytometry (Figure 2C). We tested additional time points for Torin1 treatment and also observed beneficial effects on TNNT2 MFI by flow cytometry when Torin1 treatment was shorter (5 days treatment) (Supplementary Figure 3) or later (starting 10 days after initiation of beating) (Supplemental Figure 4); however, for consistency, we selected a single protocol of 7 days of Torin1 treatment starting ~2 days after initiation of beating for the experiments in this study. We also observed an increase in TNNI1 protein levels (Figure 2B) (but not RNA levels, Figure 2A) – this isoform of troponin I would be expected to decrease with cardiomyocyte maturation;35 however, given that overall TNNI3 levels are still much below the level in even a fetal heart, perhaps further increase of all troponin isoforms are still necessary to achieve improved maturity. Following completion of Torin1 treatment for 1 week, cardiomyocytes were dissociated and re-seeded onto gelatin muscular thin films (MTFs) to evaluate contractile force (Figure 2D). MTFs containing Torin1-treated cardiomyocytes had a nearly 2-fold increase in the relative maximum systolic force generated versus control (Figure 2F, with representative force tracing versus time shown in Figure 2E). Torin1-treated cardiomyocytes exhibited no differences in sarcomere length versus control (Figure 2H, representative images shown in Figure 2G). Interestingly, the increase in TNNT2 MFI with Torin1 treatment was reversed by incubation with 10% FBS for 2 days after completion of Torin1 treatment (Figure 2I), suggesting that re-activation of mTOR signaling with growth stimuli can be detrimental to cardiomyocyte phenotype.
Figure 2.

Torin1-treatment increases expression of sarcomere genes and enhances contractility of iPSC-derived cardiomyocytes. (A) qPCR of selected sarcomere genes (MYH6, MYH7, TNNT2, TNNI3) iPSC-derived cardiomyocytes after treatment with Torin1 (10 nM, 50 nM, or 200 nM) or vehicle control (0.02% DMSO) for 7 days starting ~2 days after onset of beating. n=3 per condition, *p<0.05, ****p<0.001 by two-way ANOVA with Tukey’s multiple comparisons test, BJRiPS-CMs. (B) Representative of western blot analysis of TNNT2 and TNNI3 after Torin1 treatment for 7 days starting ~2 days after onset of beating, β-tubulin depicted as loading control, Gibco iPS-CMs. (C) Mean fluorescence intensity of TNNT2-Alexa Fluor 647 of TNNT2+ cells. n=3 per condition, **p<0.01, ****p<0.0001 by one-way ANOVA with Tukey’s multiple comparisons test, Gibco iPS-CMs. (D) Representative image of MTF in diastole and systole, with schematic of MTF on side view in diastole and systole. (E) Representative force versus time plot of muscular thin film (MTF) seeded with iPSC-derived cardiomyocytes treated with Torin1 (200 nM) or vehicle for 7 days starting ~2 days after onset of beating, BJRiPS-CMs. (F) Relative maximum systolic force (normalized to control) as quantified using muscular thin films. n=8–9 per group, **p<0.01 by Kruskal-Wallis test, combined from 3 batches of BJRiPS-CMs (2 batches) and Gibco iPS-CMs (1 batch). (G) Representative immunostained images showing cardiomyocytes treated with or without Torin1 (200 nM × 7 days), blue = DAPI, green = alpha-actinin, yellow = F-actin, magenta = TNNT2, BJRiPS-CMs, scale bar = 10 μm. (H) Sarcomere length of control (n=13 cells) and Torin1-treated (n=17 cells) BJRiPS-CMs, n.s by unpaired t-test. (I) Mean fluorescence intensity of TNNT2-Alexa Fluor 647 of TNNT2+ cells after treatment with DMSO × 7 days (control), DMSO × 7 days followed by 10% fetal bovine serum (FBS) × 2 days, Torin1 (200 nM) × 7 days, or Torin1 (200 nM) × 7 days followed by 10% FBS × 2 days. n=3 per condition, *p<0.01, **p<0.0001 by one-way ANOVA with Sidak’s multiple comparisons test, UCSD-CMs. DMSO, dimethylsulfoxide; TBP, TATA-binding protein
Dual inhibition of mTORC1/2 with Torin1 during late differentiation enhances metabolic maturation of iPSC-derived cardiomyocytes
Using the Seahorse Mito Stress Test to evaluate mitochondrial function (Figure 3A), we observed a significant increase in normalized maximal OCR of Torin1-treated cardiomyocytes versus control (Figure 3B), suggesting a shift toward oxidative phosphorylation exhibited by more mature cardiomyocytes. We also observed a trend toward decreased extracellular acidification rate (ECAR) (Supplemental Figures 5A and 5B). This change appears to be due to a decrease in ECAR from non-glycolytic acidification (Supplemental Figure 5C), such as that which can occur with decreased glycogenolysis.36 Unexpectedly, we observed a decreased mitochondrial to nuclear DNA ratio (Figure 3C) and decreased MFI of MitoTracker by flow cytometry (Figure 3D), perhaps reflecting a state of cellular quiescence. However, we observed a significant increase in mitochondrial membrane polarization as indicated by an increase in the MitoProbe JC-1 red:green fluorescence ratio with Torin1 for 1 week (Figure 3E), suggesting that the mitochondria that are present are more mature. We observed a dose-dependent increase in mRNA expression of PPARGC1a (also known as PGC1α, transcriptional co-activator that regulates mitochondrial biogenesis and maturation37) with Torin1 treatment (Figure 3F). This was accompanied by an increase in mRNA expression of fatty acid transport protein 6 (FATP6). We did not observe significant changes in selected mitochondrial genes (Supplemental Figure 6A) or proteins (Supplemental Figure 6B), although we did observe a trend toward increased expression of fatty acid receptor, CD36, with Torin1 (Supplemental Figure 6C). We also saw a trend of increased expression of OPA1 with treatment of fatty acids; future work should investigate further how Torin1 affects fatty acid utilization.
Figure 3.
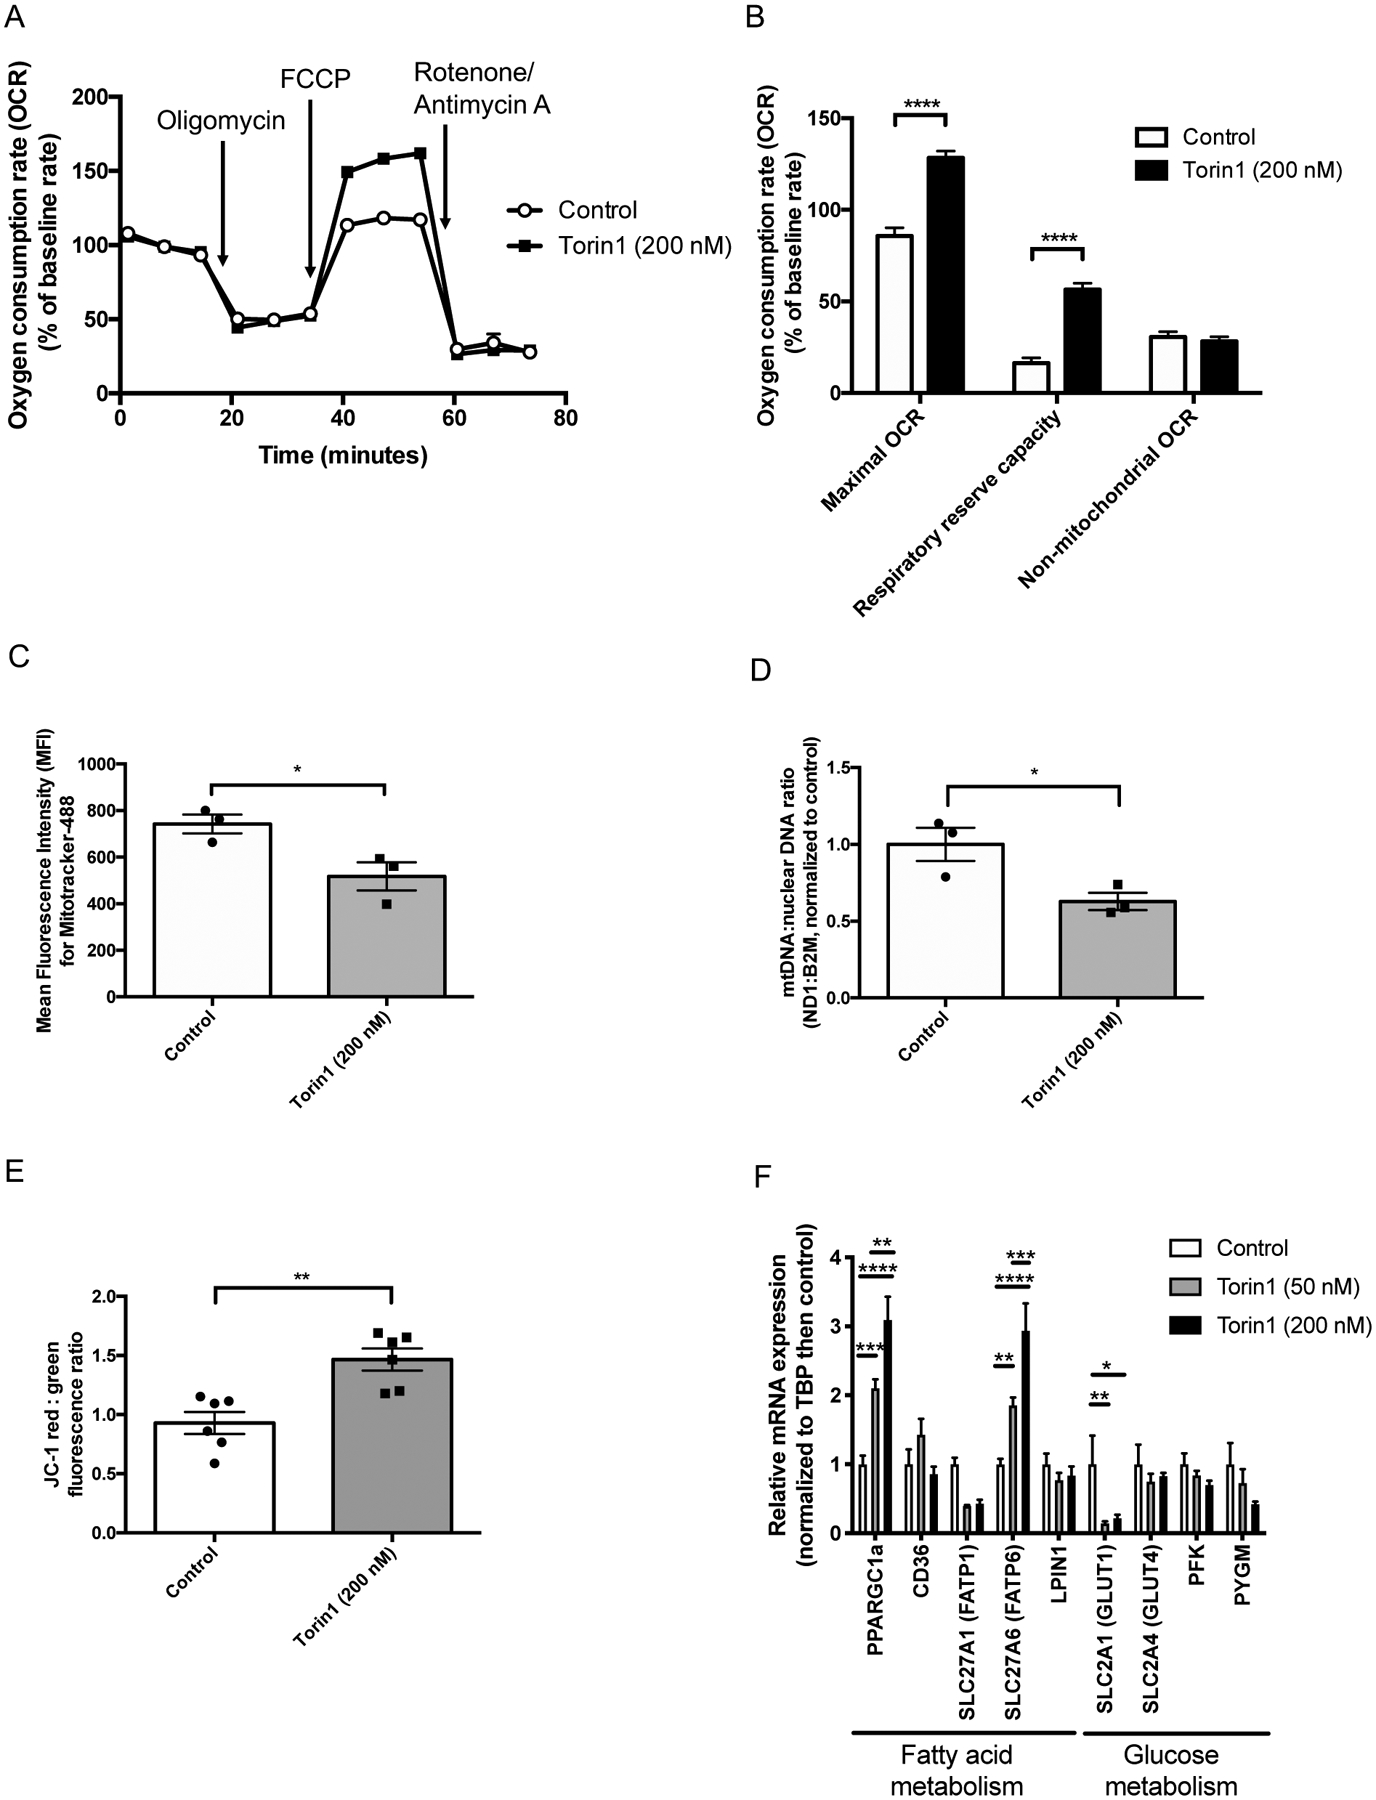
Torin1 increases oxygen consumption rate and mitochondrial polarization of iPSC-derived cardiomyocytes. (A) Profile of average oxygen consumption rate normalized to baseline versus time as evaluated by the Seahorse Mito Stress Test. Open circles = control (n=70 wells), closed squares = Torin1 (69 wells, 200 nM × 7 days; BJRiPS-CMs replated into Seahorse plate for 24–48 hours prior to assay), data from two independent experiments combined. (B) Oxygen consumption rate normalized to baseline of control (open bars, n=70 wells) versus closed bars (open bars, n=69 wells) for maximum OCR, respiratory reserve capacity, and non-mitochondrial OCR, *p<0.05, ***p<0.001 by two-way ANOVA with Sidak’s multiple comparisons test, BJRiPS-CMs. (C) Mean fluorescence intensity of Mitotracker Green FM of BJRiPS-CMs after treatment with Torin1 (200 nM) or vehicle control (0.02% DMSO) for 7 days starting ~2 days after onset of beating. *p<0.05 by unpaired t-test, n=3 per group, BJRiPS cell line. (D) Mitochondrial (ND1) to nuclear (B2M) DNA ratio of BJRiPS-CMs after treatment with Torin1 (200 nM) or vehicle control (0.02% DMSO) for 7 days starting ~2 days after onset of beating. *p<0.05 by unpaired t-test, n=3 per group, BJRiPS cell line. (E) MitoProbe JC-1 relative ratio of red to green fluorescence in BJRiPS-CMs after treatment with Torin1 (200 nM) or vehicle control (0.02% DMSO) for 7 days starting ~2 days after onset of beating, assay run on final day of Torin1 treatment. n=6 per group, **p<0.01 by Kruskal-Wallis test. (F) qPCR of selected genes associated with fatty acid metabolism (PPARGC1a (PGC1α), CD36, SLC27A1 (FATP1), SLC27A6 (FATP6), and LPIN1) or glucose metabolism (GLUT1, GLUT4, PFK, and PYGM) of BJRiPS-CMs after treatment with Torin1 (10 nM, 50 nM, or 200 nM) or vehicle control (0.02% DMSO) for 7 days starting ~2 days after onset of beating. *p<0.05, **p<0.01, ***p<0.001, ****p<0.0001 by two-way ANOVA with Tukey’s multiple comparison’s test, n=3 per group. DMSO, dimethylsulfoxide; FCCP, 2-[2-[4-(trifluoromethoxy)phenyl]hydrazinylidene]-propanedinitrile.
Dual inhibition of mTORC1/2 with Torin1 during late differentiation enhances expression of mature ion channels and increases peak rise time and downstroke velocity
Torin1 treatment led to a significant dose-dependent increase in expression of KCNJ2, CACNA1c, RYR2, ATP2A2 (SERCA2A), and SCN5A mRNA (Figure 4A). There was also a non-significant trend of increased HCN4 (Figure 4A) – while we would have anticipated that a more mature non-pacemaker cardiomyocyte would have lower expression levels of HCN4, the fold-change is still lower for HCN4 than that seen for other ion channels tested. We observed the mRNA levels of RYR2, KCNJ2, and CACNA1c are still well below that found in adult hearts and RYR2 and KCNJ2 expression levels are also markedly below fetal heart levels as well (Supplemental Figure 2). This suggests that all ion channels still need to increase in expression to achieve greater maturity. In addition, Torin1 significantly increased MFI of extracellular Kir2.1 (encoded by KCNJ2) by flow cytometry (Figure 4B). We observed a decrease in the spontaneous rate of contraction in Torin1-treated cells (Figure 4C) – this would be expected with increases in Kir2.1 expression, a key ion channel that inhibits automaticity.38 There may be a different optimal window of time for Torin1 treatment to affect ion channel expression versus sarcomere protein expression (Supplemental Figure 3). Future work should optimize treatment time windows to maximize maturation for both contractile and electrophysiological properties; however, in the experiments shown here, we treated all cells with the same protocol for consistency. The action potential profile generated using FluoVolt (representative images showing CyteSeer software cell segmentation in Figure 4C) showed that Torin1-treated cells generally had a longer plateau phase and a sharper upstroke and downstroke (Figure 4E), which is reflected by numerical parameters, with a significant decrease in peak rise time (Figure 4F), CTD75 (Figure 4I) and T75–25 time (Figure 4J) and a significant increase in downstroke velocity (Figure 4G), with no changes in CTD25 (Figure 4H). We also observed significant decreases in calcium peak rise time, peak decay time, and FWHM (full width half maximum) time with Torin1 treatment, with further decrease in these parameters with isoproterenol stimulation (Supplemental Figure 7).
Figure 4.

Torin1-treatment increases expression selected ion channels and increases peak rise time and downstroke velocity of the action potential profile. (A) qPCR of selected ion channels (KCNJ2, CACNA1c, RY2, ATP2a2, SCN5a, HCN4) of iPSC-derived cardiomyocytes after treatment with Torin1 (10 nM or 200 nM) or vehicle control (0.02% DMSO) for 7 days starting ~2 days after onset of beating. n=3 per group, *p<0.05, ****p<0.001 by two-way ANOVA with Tukey’s multiple comparisons test, BJRiPS line. (B) Flow cytometry analysis of mean fluorescence intensity of Kir2.1 (encoded by KCNJ2) after Torin1 treatment for 7 days starting ~2 days after onset of beating. n=3 per group, *p<0.01 by unpaired t-test, BJRiPS line. (C) Spontaneous beating rate of cardiomyocytes with or without Torin1-treatment, n=6–10 wells per condition, *p<0.05, ***p<0.001 by one-way ANOVA with Tukey’s multiple comparisons test. (D) Representative images showing cell segmentation performed automatically by the CyteSeer software. Blue = Hoechst stain, Green = FluoVolt. (E) Representative action potential profile depicting a Torin1-treated cardiomyocyte with a more prolonged plateau phase versus control. CTD25 (25% duration of the calcium transient, or duration at 25% decline from maximum amplitude), CTD75 (75% duration of the calcium transient, or duration at 75% decline from maximum amplitude, T75–25 (time for voltage to decay from 75% to 25% of maximum). (F) Peak rise time (msec), ****p<0.0001, UCSD-CMs. (G) Downstroke velocity (msec), ****p<0.0001, UCSD-CMs. (H) CTD25 time (msec), n.s., UCSD-CMs. (I) CTD75 time (msec), *p<0.05, UCSD-CMs. (J) T75–25 time (msec), ***p<0.001, UCSD-CMs. For Fluovolt data, control n=531 cells, Torin1 n=315 cells, analysis by unpaired t-test.
Dual mTORC1/2 inhibition with Torin1 enhances expression of p53 and GATA4 while inhibiting expression of p21
We observed a dose-dependent increase in the tumor suppressor protein and cell cycle regulator, p53 (total and phosphorylated proteins), and a dose-dependent decrease in p21 protein expression with Torin1 (Figure 5A). P53 is known to upregulate p21,39 but p21 can also be degraded by hypophosphorylated 4E-BP1 in the context of mTORC1 inhibition.40 Thus, our data suggest that Torin1 acts to directly decrease levels of p21, which may lead to a secondary effect of p53 upregulation. There was also a trend toward increased protein expression of the cardiac transcription factor GATA4 (but not NKX2.5) with Torin1 treatment (Figure 5A), consistent with prior evidence that p53 regulates the cardiac transcriptome.41 We observed that use of pifithrin-α (small molecule inhibitor that inhibits activity of p53)42 with Torin1-treated cells decreased the percentage of quiescent (G0) cardiomyocytes and increased the percentage of cardiomyocytes in the cell cycle (G1, S/G2/M) versus Torin1 alone (Figure 5B). Also, pifithrin-α inhibited the Torin1-induced increase in both p53 and TNNI3 (Figure 5C, representative western blot; Figure 5D, densitometry analysis of p53).
Figure 5.

Torin1 increases p53 expression and effects are inhibited by pifithrin-α. (A) Representative western blot of p53, phospho-53, p21 (CDKN1a), GATA4, NKX2.5, and β-tubulin from Gibco iPS-CM lysates treated with 0 (DMSO), 10, 50, or 200 nM Torin1 for 7 days starting ~2 days after onset of beating. Cells harvested on final day of treatment. (B) Cell cycle analysis showing percentage of TNNT2+ BJRiPS-CMs in G0, G1 or S/G2/M phases after treatment with vehicle (DMSO, dimethylsulfoxide), pifithrin-α (10 μM) for 1 week, Torin1 (200 nM) for 7 days or simultaneous treatment with pifithrin-α (10 μM) and Torin1 (200 nM) for 7 days starting ~2 days after onset of beating. n=3 per group, *p<0.05, **p<0.01, ***p<0.001, ****p<0.0001 by two-way ANOVA with Tukey’s multiple comparisons test. (C) Representative western blot of p53, TNNI3, p21, and β-tubulin from BJRiPS-derived cardiomyocyte lysates treated with control (DMSO), Torin1 (200 nM), pifithrin-α (10 μM) or Torin1 (200 nM) + pifithrin-α (10 μM) for 7 days beginning ~2 days after onset of beating. Cells harvested on final day of treatment. (D) Densitometry of TNNI3 bands by western analysis, n=3 per group, **p<0.01 by two-way ANOVA with Tukey’s multiple comparisons test, BJRiPS-CMs.
Upregulation of p53 with nutlin-3a enhances expression of TNNI3 independently and in a synergistic manner with Torin1
To determine whether upregulation of p53 alone was sufficient to promote cellular quiescence or whether concomitant mTOR inhibition was required (schematic in Figure 6A), we treated cells with nutlin-3a, which increases p53 via inhibition of the E3 ubiquitin ligase MDM2, independent of mTOR. Treatment with nutlin-3a alone (10 μM for 24 hours), 200 nM Torin1 alone (200 nM for 7 days), or nutlin-3a (10 μM for first 24 hours of Torin1 treatment) with Torin1 (200 nM for 7 days) increased the percentage of quiescent (G0) TNNT2+ cardiomyocytes and decreased the percentage of TNNT2+ cardiomyocytes in G1 phase versus control (Figure 6B). In addition, nutlin-3a increased p53 and TNNI3 protein expression independently of Torin1 (Figure 6C). When cardiomyocytes were treated with a combination of nutlin-3a with Torin1, we observed a significant increase in p53 expression levels versus either nutlin-3a alone or Torin1 alone (Figure 6D). In addition, there was a further increase of TNNI3 expression with combination treatment with both nutlin-3a and Torin1 (Figure 6E). Thus, upregulation of p53 alone may promote limited cardiomyocyte maturation but this effect was further enhanced in combination with mTOR inhibition.
Figure 6.

Upregulation of p53 with nutlin-3a enhances TNNI3 expression and has a synergistic effect with Torin1. (A) Schematic showing proposed mechanism of cardiomyocyte maturation. T3, triiodothyronine. (B) Cell cycle analysis showing percentage of TNNT2+ BJRiPS-CMs in G0, G1 or S/G2/M phases after treatment with vehicle (DMSO, dimethylsulfoxide), nutlin-3a (10 μM) for 24 hours, Torin1 (200 nM) for 7 days or simultaneous treatment with nutlin-3a (10 μM for first 24 hours of Torin1 treatment) with Torin1 (200 nM) for 7 days starting ~2 days after onset of beating. n=3 per group, *p<0.05, ***p<0.001, ****p<0.0001 by two-way ANOVA with Tukey’s multiple comparisons test. (C) Representative western blot of MDM2, p53, TNNI3, and β-tubulin from BJRiPS-derived cardiomyocyte lysates treated with control (DMSO), nutlin-3a × 24 hours (10 μM), Torin1 × 7 days (200 nM), or Torin1 × 7 days (200 nM) + nutlin-3a (10 μM) for 24 hours beginning ~2 days after onset of beating (nutlin-3a was only administered during the first 24 hours of Torin1 treatment). Cells harvested on final day of treatment, BJRiPS-CMs. (D) Densitometry of p53 bands by western analysis, **p<0.01 by two-way ANOVA with Tukey’s multiple comparisons test, n=3 per condition. (E) Densitometry of TNNI3 bands by western analysis, *p<0.05, **p<0.01 by two-way ANOVA with Tukey’s multiple comparisons test, n=3 per condition, BJRIPS-CMs.
Torin1 treatment shifts cells from a senescent to quiescent phenotype
We utilized the NanoString PanCancer Pathways Panel to provide a multiplex analysis of genes associated with cell cycle, growth, and metabolism in cells treated with Torin1 followed by treatment with FBS versus control. With unsupervised hierarchical clustering and principal component analysis (PCA), we observed clustering by the four treatment groups (control, control + FBS, Torin1, Torin1 + FBS) at the level of all genes in the panel (Supplemental Figure 8A (heat map) and 8B (PCA)) as well as in certain subsets of genes, including the “Cell Cycle” (Figure 7A (heat map), Supplemental Figure 8F (PCA)) and “Metabolism of Proteins” (Figure 7B (heat map), Supplemental Figure 8H (PCA)) pathways as delineated by NanoString. We also observed clustering by pathway score (numerical value assigned to summarize overall changes across all genes within a particular pathway) for Cell Cycle (Supplemental Figure 8G) and Metabolism of Proteins (Supplemental Figure 8I) pathways.
Figure 7.

NanoString gene expression analysis from PanCancer Pathways Panel comparing cells treated with or without Torin1 followed by treatment with or without 10% fetal bovine serum (FBS), Gibco iPS-CMs. (A) Unsupervised hierarchical clustering of Cell Cycle pathway genes. (B) Unsupervised hierarchical clustering of Metabolism of Proteins pathway genes. (C-E) Volcano plots showing differential gene expression analysis of Cell Cycle pathway genes (C, Control + FBS versus Control; D, Control versus Torin1; E, Torin1 + FBS versus Torin1). (F-H) Volcano plots showing differential gene expression analysis of Metabolism of Proteins pathway genes (F, Control + FBS versus Control; G, Control versus Torin1; H, Torin1 + FBS versus Torin1). QC, quality control.
Differential gene expression for all genes (Supplemental Figures 8C–E) and for Cell Cycle (Figures 7C–E) and Metabolism of Proteins (Figures 7F–H) pathways suggest differences in cellular quiescence versus senescence between the four groups. In particular, Torin1 treatment led to a significant decrease in expression of interleukin-8 (IL8) and SPP1 (osteopontin) (Figure 7G), both secreted factors seen as part of a senescence-associated secretory phenotype (SASP),43 suggesting that Torin1 may re-direct cells away from a senescent phenotype. When control cells are stimulated with FBS, this leads to upregulation of cell cycle inhibitor, CDKN1a (p21), and downregulation of cyclins A2, B1, D2, and E2, which would also be expected in a senescent phenotype. In cells previously treated with Torin1, we do not see a significant increase in CDKN1a (p21) with FBS. However, with serum treatment in Torin1-treated cells, we also see an increase in SPP1 and decrease in cyclin B1, suggesting that at least some cells may be directed toward a senescent rather than quiescent phenotype with FBS treatment. Interestingly, with FBS treatment, we also observed a decrease in MFI of TNNT2 by flow cytometry (Figure 2I), suggesting that gains in maturation seen with Torin1 treatment can be reversed upon direction toward a senescent fate.
DISCUSSION
In this study, we found that the dual mTORC1/2 inhibitor, Torin1, increased the percentage of cells in a quiescent (G0) state and enhanced expression of genes associated with cardiomyocyte maturation, including TNNI3 and KCNJ2. Torin1 treatment led to an increase in the relative contractile force generated by iPSC-derived cardiomyocytes, and an increase in peak rise time and downstroke velocity of the action potential profile. Also, we observed that cardiomyocytes transiently treated with Torin1 had an increased OCR, suggesting these cells are metabolically more mature than control cells. We also observed that Torin1 treatment significantly decreased mRNA expression of the cyclin dependent kinase inhibitor, p21, while increasing expression of the cell cycle regulator, p53. There was also a trend toward increased expression of GATA4, which has previously shown to be regulated by p53.41 Furthermore, nutlin-3a, a p53 activator, independently increased TNNI3 expression and had a synergistic effect with Torin1. These data suggest that increasing expression of p53 has a dual effect to induce both cardiomyocyte quiescence and maturation.
Inadequate maturation of stem cell-derived cardiomyocytes remains a significant barrier to clinical translation due to concerns of immature cardiomyocytes stimulating ventricular arrhythmias.3, 4 Various strategies have been used to enhance maturation of cardiomyocytes derived from stem cells.6, 9 Addition of triiodothyronine with or without dexamethasone10, 11 or downregulation of HIF1α13 improves cardiomyocyte maturation – notably, dexamethasone can suppress mTOR signaling,44 HIF1α is regulated by mTOR,45 and triiodothyronine can downregulate mTOR signaling.46 Stimulation of mTOR signaling may actually inhibit cardiomyocyte maturation – growth signals such as glucose stimulate mTOR, and glucose stimulation has been shown to prevent cardiomyocyte maturation.47 Moreover, insulin is also growth stimulatory molecule that can stimulate mTOR and support the immature state of cardiomyocytes.48 Finally, although hypoxia can inhibit mTOR signaling,49 hypoxia can also upregulate glycolysis in adult murine cardiomyocytes while stimulating cardiomyocyte proliferation (i.e. reduce quiescence). Our data showing that inhibition of mTOR signaling can promote cardiomyocyte maturation are consistent with these prior studies.
Beyond the immediate newborn period, cardiomyocytes exit the cell cycle and largely do not proliferate, with myocardium forming scar tissue rather than regenerating following injury.14 It had been thought that post-natal cardiomyocytes are senescent, with irreversible cell cycle exit. However, more recent data suggest that adult cardiomyocytes are able to proliferate with a cardiomyocyte turnover rate of around 1% per year in adults.50 This suggests that rather than being senescent, perhaps adult mammalian cardiomyocytes are actually in a deep quiescent (G0) state. Cellular quiescence is a resting state triggered by nutrient deprivation and is characterized by the ability to re-enter the cell cycle in response to appropriate stimuli.16 However, although proliferation does not occur, the cells are far from dormant in this state – rather, cells retain metabolic and transcriptional activity.16 Within the G0 state, cells can have varying depths of quiescence, including a transitional entry period into G0, deep G0, and a Galert state, which is a more shallow state of quiescence during which cells are more responsive to stimuli triggering return to the cell cycle.16 Our data suggest that the quiescent state facilitates cardiomyocyte maturation while the senescent state inhibits cardiomyocyte maturation.
We observed a dose-dependent increase in protein expression of the tumor suppressor p53 with not an increase but an unexpected decrease in p21 protein expression following Torin1 treatment. P53 is known to upregulate expression of p21, and p53 in turn is counter-regulated by p21, as the stability of p53 is reduced by p21.39 The decrease in p21 expression may be due to 4E-BP1 regulation of p21, as mTORC1 inhibition with Torin1 prevents phosphorylation of 4E-BP1, and the non-phosphorylated state of 4E-BP1 can bind to and degrade p21.40 This suggests that Torin1 treatment in iPSC-derived cardiomyocytes indirectly leads to increased p53 expression and activity, which may direct cardiomyocyte maturation. The effect of Torin1 on p53 and TNNI3 expression was inhibited with the p53 inhibitor, pifithrin-α. Recently, p53 was identified as being central in maintaining cardiomyocyte phenotype.41 Genome-wide analysis identified p53 as a cardiac transcriptome regulator that induces expression of other cardiac transcription factors including GATA4, NKX2.5, MEF2a, and SRF.41 With such central regulation of key cardiac transcription factors, this may explain the generalized improvement in cardiomyocyte maturation, across contractile, electrophysiologic, and metabolic domains.
P53 can initiate either senescence or quiescence, and this decision is regulated partly by mTOR.19 We observed that upregulation of p53 with the small molecule, nutlin-3a, increased the number of cells in G0 and increased TNNI3 protein expression, with a further synergistic effect in combination with Torin1. In mouse embryonic fibroblasts, upregulation of p53 with nutlin-3a led to senescence.19 However, when these cells were treated both with rapamycin to inhibit mTOR as well as nutlin-3a to upregulate p53, the cells were directed toward cellular quiescence, instead of senescence.19 Thus, in certain cell types, concomitant upregulation of p53 and downregulation of mTOR signaling is necessary to direct cells toward a quiescent phenotype. This combination treatment in iPSC-derived cardiomyocytes with nutlin-3a and Torin1 led to further enhancement of TNNI3 expression versus either alone, suggesting further activation of p53 may have additional beneficial effects on cardiomyocyte maturation.
Multiplex gene expression analysis revealed that Torin1 treatment reduces expression of selected genes associated with the senescence-associated secretory phenotype (SASP), a pro-inflammatory state associated with cellular aging.43 This suggests that Torin1 can redirect differentiating cardiomyocytes away from a senescent state via p21 downregulation and toward a quiescent phenotype via concomitant upregulation of p53 and downregulation of mTOR. However, with mTOR re-activation following removal of Torin1 and simultaneous stimulation with serum, Torin1-treated cells shift toward a senescent phenotype. This is accompanied by a reduction in TNNT2 MFI suggesting that gains in maturation that occur during quiescence can be reversed upon transition to a senescent state. Future investigation should explore whether promotion of a deeper state of quiescence can prevent conversion to either a senescent or proliferative state and maintain cardiomyocyte maturity.
In summary, our results demonstrated that treatment with Torin1 during late differentiation induced cellular quiescence and improved selected parameters of maturation in iPSC-derived cardiomyocytes. This effect appears to be driven at least in part by upregulation of p53, which can both induce cellular quiescence and regulate the cardiac transcriptome. This suggests that the mTOR signaling pathway is a key regulator of cardiomyocyte maturation.
Supplementary Material
Clinical Perspective.
What is new?
Inhibition of mTOR enhances maturation of human stem cell-derived cardiomyocytes.
Upregulation of p53 with downregulation of mTOR leads to cellular quiescence.
Induction of cellular quiescence may facilitate cardiomyocyte maturation.
What are the clinical implications?
Inadequate maturation of stem cell-derived cardiomyocytes is a major barrier to clinical translation, possibly contributing to increased risk of ventricular arrhythmias.
The mTOR inhibitor, Torin1, promotes maturation of human stem cell-derived cardiomyocytes.
Further testing will be necessary to evaluate whether delivery of Torin1-treated cardiomyocytes reduces the risk of ventricular arrhythmias.
Acknowledgements
The authors thank the Harvard Center for Biological Imaging for use of their microscopy center and technical support, the Harvard Bauer Core Facility for use of their flow cytometry equipment and technical support, the Flow Cytometry Core in the Department of Stem Cell and Regenerative Biology, Dr. Lynn Sleeper (Boston Children’s Hospital) for statistical review, and Dr. Clement David and Mr. Eric Miller (NanoString Technologies Inc.) for assistance with NanoString data analysis.
Sources of Funding
This work was supported by the Leducq Foundation (R.T.L.), the Harvard Stem Cell Institute, NIH (HL119230, HL137710) (R.T.L.), a sponsored research agreement with Orig3n, Inc. (R.T.L.), the John A. Paulson School of Engineering and Applied Sciences at Harvard University (K.K.P.), the Wyss Institute for Biologically Inspired Engineering at Harvard University (K.K.P.), Harvard Materials Research Science and Engineering Center (DMR-1420570) (K.K.P.), and the National Center for Advancing Translational Sciences of the NIH (UH3TR000522, 1-UG3-HL-141798-01) (K.K.P.). J.C.G. is funded by an NIH T32 Fellowship (T32HL007572) and the American Academy of Pediatrics Section on Cardiology and Cardiac Surgery Children’s Heart Foundation Research Fellowship Award. V.J.B. is funded by an NIH K08 Fellowship (K08HL140197). The content is solely the responsibility of the authors and does not necessarily represent the official views of the NIH.
Disclosures
Harvard University filed for intellectual property relevant to this manuscript, listing J.C.G, A.H., D.A.M., and R.T.L. as inventors. R.T.L. is a co-founder, scientific advisor, and holds private equity in Elevian, a company that aims to develop medicines to restore regenerative capacity. Elevian provides sponsored research support to the Lee Lab. D.A.M. is founder of Semma, Inc.
Non-standard Abbreviations and Acronyms
- CTD25
25% duration of the calcium transient
- CTD75
75% duration of the calcium transient
- DMSO
dimethylsulfoxide
- ECAR
extracellular acidification rate
- ESC
embryonic stem cell
- FBS
fetal bovine serum
- HIF1α
hypoxia inducible factor 1α
- iPSC
induced pluripotent stem cell
- IWP4
inhibitor of Wnt production-4
- MFI
mean fluorescence intensity
- MTF
muscular thin film
- mTOR
mechanistic target of rapamycin
- mTORC1
mechanistic target of rapamycin complex 1
- mTORC2
mechanistic target of rapamycin complex 2
- OCR
oxygen consumption rate
- PCA
principal component analysis
- SASP
senescence-associated secretory phenotype
- T75–25
time for voltage to decay from 75% to 25% of maximum
References Cited
- 1.Lian X, Zhang J, Azarin SM, Zhu K, Hazeltine LB, Bao X, Hsiao C, Kamp TJ and Palecek SP. Directed cardiomyocyte differentiation from human pluripotent stem cells by modulating Wnt/beta-catenin signaling under fully defined conditions. Nat Protoc. 2013;8:162–175. [DOI] [PMC free article] [PubMed] [Google Scholar]
- 2.Uosaki H, Cahan P, Lee DI, Wang S, Miyamoto M, Fernandez L, Kass DA and Kwon C. Transcriptional Landscape of Cardiomyocyte Maturation. Cell Rep. 2015;13:1705–1716. [DOI] [PMC free article] [PubMed] [Google Scholar]
- 3.Liu YW, Chen B, Yang X, Fugate JA, Kalucki FA, Futakuchi-Tsuchida A, Couture L, Vogel KW, Astley CA, Baldessari A, Ogle J, Don CW, Steinberg ZL, Seslar SP, Tuck SA, Tsuchida H, Naumova AV, Dupras SK, Lyu MS, Lee J, Hailey DW, Reinecke H, Pabon L, Fryer BH, MacLellan WR, Thies RS and Murry CE. Human embryonic stem cell-derived cardiomyocytes restore function in infarcted hearts of non-human primates. Nat Biotechnol. 2018;36:597–605. [DOI] [PMC free article] [PubMed] [Google Scholar]
- 4.Romagnuolo R, Masoudpour H, Porta-Sanchez A, Qiang B, Barry J, Laskary A, Qi X, Masse S, Magtibay K, Kawajiri H, Wu J, Valdman Sadikov T, Rothberg J, Panchalingam KM, Titus E, Li RK, Zandstra PW, Wright GA, Nanthakumar K, Ghugre NR, Keller G and Laflamme MA. Human Embryonic Stem Cell-Derived Cardiomyocytes Regenerate the Infarcted Pig Heart but Induce Ventricular Tachyarrhythmias. Stem Cell Reports. 2019;12:967–981. [DOI] [PMC free article] [PubMed] [Google Scholar]
- 5.DeForest CA and Anseth KS. Advances in bioactive hydrogels to probe and direct cell fate. Annu Rev Chem Biomol Eng. 2012;3:421–444. [DOI] [PubMed] [Google Scholar]
- 6.Nunes SS, Miklas JW, Liu J, Aschar-Sobbi R, Xiao Y, Zhang B, Jiang J, Masse S, Gagliardi M, Hsieh A, Thavandiran N, Laflamme MA, Nanthakumar K, Gross GJ, Backx PH, Keller G and Radisic M. Biowire: a platform for maturation of human pluripotent stem cell-derived cardiomyocytes. Nat Methods. 2013;10:781–787. [DOI] [PMC free article] [PubMed] [Google Scholar]
- 7.Ronaldson-Bouchard K, Ma SP, Yeager K, Chen T, Song L, Sirabella D, Morikawa K, Teles D, Yazawa M and Vunjak-Novakovic G. Advanced maturation of human cardiac tissue grown from pluripotent stem cells. Nature. 2018;556:239–243. [DOI] [PMC free article] [PubMed] [Google Scholar]
- 8.Shadrin IY, Allen BW, Qian Y, Jackman CP, Carlson AL, Juhas ME and Bursac N. Cardiopatch platform enables maturation and scale-up of human pluripotent stem cell-derived engineered heart tissues. Nat Commun. 2017;8:1825. [DOI] [PMC free article] [PubMed] [Google Scholar]
- 9.Zimmermann WH, Schneiderbanger K, Schubert P, Didie M, Munzel F, Heubach JF, Kostin S, Neuhuber WL and Eschenhagen T. Tissue engineering of a differentiated cardiac muscle construct. Circ Res. 2002;90:223–230. [DOI] [PubMed] [Google Scholar]
- 10.Yang X, Rodriguez M, Pabon L, Fischer KA, Reinecke H, Regnier M, Sniadecki NJ, Ruohola-Baker H and Murry CE. Tri-iodo-l-thyronine promotes the maturation of human cardiomyocytes-derived from induced pluripotent stem cells. J Mol Cell Cardiol. 2014;72:296–304. [DOI] [PMC free article] [PubMed] [Google Scholar]
- 11.Parikh SS, Blackwell DJ, Gomez-Hurtado N, Frisk M, Wang L, Kim K, Dahl CP, Fiane A, Tonnessen T, Kryshtal DO, Louch WE and Knollmann BC. Thyroid and Glucocorticoid Hormones Promote Functional T-Tubule Development in Human-Induced Pluripotent Stem Cell-Derived Cardiomyocytes. Circ Res. 2017;121:1323–1330. [DOI] [PMC free article] [PubMed] [Google Scholar]
- 12.Yang X, Rodriguez ML, Leonard A, Sun L, Fischer KA, Wang Y, Ritterhoff J, Zhao L, Kolwicz SC Jr., Pabon L, Reinecke H, Sniadecki NJ, Tian R, Ruohola-Baker H, Xu H and Murry CE. Fatty Acids Enhance the Maturation of Cardiomyocytes Derived from Human Pluripotent Stem Cells. Stem Cell Reports. 2019;13:657–668. [DOI] [PMC free article] [PubMed] [Google Scholar]
- 13.Hu D, Linders A, Yamak A, Correia C, Kijlstra JD, Garakani A, Xiao L, Milan DJ, van der Meer P, Serra M, Alves PM and Domian IJ. Metabolic Maturation of Human Pluripotent Stem Cell-Derived Cardiomyocytes by Inhibition of HIF1alpha and LDHA. Circ Res. 2018;123:1066–1079. [DOI] [PMC free article] [PubMed] [Google Scholar]
- 14.Porrello ER, Mahmoud AI, Simpson E, Hill JA, Richardson JA, Olson EN and Sadek HA. Transient regenerative potential of the neonatal mouse heart. Science. 2011;331:1078–1080. [DOI] [PMC free article] [PubMed] [Google Scholar]
- 15.Yuan X and Braun T. Multimodal Regulation of Cardiac Myocyte Proliferation. Circ Res. 2017;121:293–309. [DOI] [PubMed] [Google Scholar]
- 16.Roche B, Arcangioli B and Martienssen R. Transcriptional reprogramming in cellular quiescence. RNA Biol. 2017;14:843–853. [DOI] [PMC free article] [PubMed] [Google Scholar]
- 17.Sabatini DM. Twenty-five years of mTOR: Uncovering the link from nutrients to growth. Proc Natl Acad Sci U S A. 2017;114:11818–11825. [DOI] [PMC free article] [PubMed] [Google Scholar]
- 18.Lu CL, Qin L, Liu HC, Candas D, Fan M and Li JJ. Tumor cells switch to mitochondrial oxidative phosphorylation under radiation via mTOR-mediated hexokinase II inhibition--a Warburg-reversing effect. PLoS One. 2015;10:e0121046. [DOI] [PMC free article] [PubMed] [Google Scholar]
- 19.Korotchkina LG, Leontieva OV, Bukreeva EI, Demidenko ZN, Gudkov AV and Blagosklonny MV. The choice between p53-induced senescence and quiescence is determined in part by the mTOR pathway. Aging (Albany NY). 2010;2:344–352. [DOI] [PMC free article] [PubMed] [Google Scholar]
- 20.Leontieva OV, Gudkov AV and Blagosklonny MV. Weak p53 permits senescence during cell cycle arrest. Cell Cycle. 2010;9:4323–4327. [DOI] [PubMed] [Google Scholar]
- 21.Sinagoga KL, Stone WJ, Schiesser JV, Schweitzer JI, Sampson L, Zheng Y and Wells JM. Distinct roles for the mTOR pathway in postnatal morphogenesis, maturation and function of pancreatic islets. Development. 2017;144:2402–2414. [DOI] [PMC free article] [PubMed] [Google Scholar]
- 22.Zhang X, Camprecios G, Rimmele P, Liang R, Yalcin S, Mungamuri SK, Barminko J, D’Escamard V, Baron MH, Brugnara C, Papatsenko D, Rivella S and Ghaffari S. FOXO3-mTOR metabolic cooperation in the regulation of erythroid cell maturation and homeostasis. Am J Hematol. 2014;89:954–963. [DOI] [PMC free article] [PubMed] [Google Scholar]
- 23.Wang F, Meng M, Mo B, Yang Y, Ji Y, Huang P, Lai W, Pan X, You T, Luo H, Guan X, Deng Y, Yuan S, Chu J, Namaka M, Hughes T, Ye L, Yu J, Li X and Deng Y. Crosstalks between mTORC1 and mTORC2 variagate cytokine signaling to control NK maturation and effector function. Nat Commun. 2018;9:4874. [DOI] [PMC free article] [PubMed] [Google Scholar]
- 24.Shioi T, McMullen JR, Tarnavski O, Converso K, Sherwood MC, Manning WJ and Izumo S. Rapamycin attenuates load-induced cardiac hypertrophy in mice. Circulation. 2003;107:1664–1670. [DOI] [PubMed] [Google Scholar]
- 25.Zhang P, Shan T, Liang X, Deng C and Kuang S. Mammalian target of rapamycin is essential for cardiomyocyte survival and heart development in mice. Biochem Biophys Res Commun. 2014;452:53–59. [DOI] [PMC free article] [PubMed] [Google Scholar]
- 26.Qiu XX, Liu Y, Zhang YF, Guan YN, Jia QQ, Wang C, Liang H, Li YQ, Yang HT, Qin YW, Huang S, Zhao XX and Jing Q. Rapamycin and CHIR99021 Coordinate Robust Cardiomyocyte Differentiation From Human Pluripotent Stem Cells Via Reducing p53-Dependent Apoptosis. J Am Heart Assoc. 2017;6:e005295. [DOI] [PMC free article] [PubMed] [Google Scholar]
- 27.Sarbassov DD, Ali SM, Sengupta S, Sheen JH, Hsu PP, Bagley AF, Markhard AL and Sabatini DM. Prolonged rapamycin treatment inhibits mTORC2 assembly and Akt/PKB. Mol Cell. 2006;22:159–168. [DOI] [PubMed] [Google Scholar]
- 28.Thoreen CC, Kang SA, Chang JW, Liu Q, Zhang J, Gao Y, Reichling LJ, Sim T, Sabatini DM and Gray NS. An ATP-competitive mammalian target of rapamycin inhibitor reveals rapamycin-resistant functions of mTORC1. J Biol Chem. 2009;284:8023–8032. [DOI] [PMC free article] [PubMed] [Google Scholar]
- 29.Thoreen CC and Sabatini DM. Rapamycin inhibits mTORC1, but not completely. Autophagy. 2009;5:725–726. [DOI] [PubMed] [Google Scholar]
- 30.Chao SK, Horwitz SB and McDaid HM. Insights into 4E-BP1 and p53 mediated regulation of accelerated cell senescence. Oncotarget. 2011;2:89–98. [DOI] [PMC free article] [PubMed] [Google Scholar]
- 31.Kim KH and Sederstrom JM. Assaying Cell Cycle Status Using Flow Cytometry. Curr Protoc Mol Biol. 2015;111:1–11. [DOI] [PMC free article] [PubMed] [Google Scholar]
- 32.McCain ML, Agarwal A, Nesmith HW, Nesmith AP and Parker KK. Micromolded gelatin hydrogels for extended culture of engineered cardiac tissues. Biomaterials. 2014;35:5462–5471. [DOI] [PMC free article] [PubMed] [Google Scholar]
- 33.Lind JU, Yadid M, Perkins I, O’Connor BB, Eweje F, Chantre CO, Hemphill MA, Yuan H, Campbell PH, Vlassak JJ and Parker KK. Cardiac microphysiological devices with flexible thin-film sensors for higher-throughput drug screening. Lab Chip. 2017;17:3692–3703. [DOI] [PMC free article] [PubMed] [Google Scholar]
- 34.Lu HR, Whittaker R, Price JH, Vega R, Pfeiffer ER, Cerignoli F, Towart R and Gallacher DJ. High Throughput Measurement of Ca++ Dynamics in Human Stem Cell-Derived Cardiomyocytes by Kinetic Image Cytometery: A Cardiac Risk Assessment Characterization Using a Large Panel of Cardioactive and Inactive Compounds. Toxicol Sci. 2015;148:503–516. [DOI] [PubMed] [Google Scholar]
- 35.Yang X, Pabon L and Murry CE. Engineering adolescence: maturation of human pluripotent stem cell-derived cardiomyocytes. Circ Res. 2014;114:511–523. [DOI] [PMC free article] [PubMed] [Google Scholar]
- 36.Pike Winer LS and Wu M. Rapid analysis of glycolytic and oxidative substrate flux of cancer cells in a microplate. PLoS One. 2014;9:e109916. [DOI] [PMC free article] [PubMed] [Google Scholar]
- 37.Scarpulla RC. Metabolic control of mitochondrial biogenesis through the PGC-1 family regulatory network. Biochim Biophys Acta. 2011;1813:1269–1278. [DOI] [PMC free article] [PubMed] [Google Scholar]
- 38.Mangoni ME and Nargeot J. Genesis and regulation of the heart automaticity. Physiol Rev. 2008;88:919–982. [DOI] [PubMed] [Google Scholar]
- 39.Broude EV, Demidenko ZN, Vivo C, Swift ME, Davis BM, Blagosklonny MV and Roninson IB. p21 (CDKN1A) is a negative regulator of p53 stability. Cell Cycle. 2007;6:1468–1471. [PubMed] [Google Scholar]
- 40.Llanos S and Garcia-Pedrero JM. A new mechanism of regulation of p21 by the mTORC1/4E-BP1 pathway predicts clinical outcome of head and neck cancer. Mol Cell Oncol. 2016;3:e1159275. [DOI] [PMC free article] [PubMed] [Google Scholar]
- 41.Mak TW, Hauck L, Grothe D and Billia F. p53 regulates the cardiac transcriptome. Proc Natl Acad Sci U S A. 2017;114:2331–2336. [DOI] [PMC free article] [PubMed] [Google Scholar]
- 42.Komarov PG, Komarova EA, Kondratov RV, Christov-Tselkov K, Coon JS, Chernov MV and Gudkov AV. A chemical inhibitor of p53 that protects mice from the side effects of cancer therapy. Science. 1999;285:1733–1737. [DOI] [PubMed] [Google Scholar]
- 43.Taschner-Mandl S, Schwarz M, Blaha J, Kauer M, Kromp F, Frank N, Rifatbegovic F, Weiss T, Ladenstein R, Hohenegger M, Ambros IM and Ambros PF. Metronomic topotecan impedes tumor growth of MYCN-amplified neuroblastoma cells in vitro and in vivo by therapy induced senescence. Oncotarget. 2016;7:3571–3586. [DOI] [PMC free article] [PubMed] [Google Scholar]
- 44.Wang H, Kubica N, Ellisen LW, Jefferson LS and Kimball SR. Dexamethasone represses signaling through the mammalian target of rapamycin in muscle cells by enhancing expression of REDD1. J Biol Chem. 2006;281:39128–39134. [DOI] [PubMed] [Google Scholar]
- 45.Land SC and Tee AR. Hypoxia-inducible factor 1alpha is regulated by the mammalian target of rapamycin (mTOR) via an mTOR signaling motif. J Biol Chem. 2007;282:20534–20543. [DOI] [PubMed] [Google Scholar]
- 46.Yau WW, Singh BK, Lesmana R, Zhou J, Sinha RA, Wong KA, Wu Y, Bay BH, Sugii S, Sun L and Yen PM. Thyroid hormone (T3) stimulates brown adipose tissue activation via mitochondrial biogenesis and MTOR-mediated mitophagy. Autophagy. 2019;15:131–150. [DOI] [PMC free article] [PubMed] [Google Scholar]
- 47.Nakano H, Minami I, Braas D, Pappoe H, Wu X, Sagadevan A, Vergnes L, Fu K, Morselli M, Dunham C, Ding X, Stieg AZ, Gimzewski JK, Pellegrini M, Clark PM, Reue K, Lusis AJ, Ribalet B, Kurdistani SK, Christofk H, Nakatsuji N and Nakano A. Glucose inhibits cardiac muscle maturation through nucleotide biosynthesis. Elife. 2017;6:e29330. [DOI] [PMC free article] [PubMed] [Google Scholar]
- 48.Mills RJ, Titmarsh DM, Koenig X, Parker BL, Ryall JG, Quaife-Ryan GA, Voges HK, Hodson MP, Ferguson C, Drowley L, Plowright AT, Needham EJ, Wang QD, Gregorevic P, Xin M, Thomas WG, Parton RG, Nielsen LK, Launikonis BS, James DE, Elliott DA, Porrello ER and Hudson JE. Functional screening in human cardiac organoids reveals a metabolic mechanism for cardiomyocyte cell cycle arrest. Proc Natl Acad Sci U S A. 2017;114:E8372–E8381. [DOI] [PMC free article] [PubMed] [Google Scholar]
- 49.Nakada Y, Canseco DC, Thet S, Abdisalaam S, Asaithamby A, Santos CX, Shah AM, Zhang H, Faber JE, Kinter MT, Szweda LI, Xing C, Hu Z, Deberardinis RJ, Schiattarella G, Hill JA, Oz O, Lu Z, Zhang CC, Kimura W and Sadek HA. Hypoxia induces heart regeneration in adult mice. Nature. 2017;541:222–227. [DOI] [PubMed] [Google Scholar]
- 50.Bergmann O, Zdunek S, Felker A, Salehpour M, Alkass K, Bernard S, Sjostrom SL, Szewczykowska M, Jackowska T, Dos Remedios C, Malm T, Andra M, Jashari R, Nyengaard JR, Possnert G, Jovinge S, Druid H and Frisen J. Dynamics of Cell Generation and Turnover in the Human Heart. Cell. 2015;161:1566–1575. [DOI] [PubMed] [Google Scholar]
Associated Data
This section collects any data citations, data availability statements, or supplementary materials included in this article.