

Abstract
ECDC, EFSA and EMA have jointly established a list of harmonised outcome indicators to assist EU Member States in assessing their progress in reducing the use of antimicrobials and antimicrobial resistance (AMR) in both humans and food‐producing animals. The proposed indicators have been selected on the basis of data collected by Member States at the time of publication. For humans, the proposed indicators for antimicrobial consumption are: total consumption of antimicrobials (limited to antibacterials for systemic use), ratio of community consumption of certain classes of broad‐spectrum to narrow‐spectrum antimicrobials and consumption of selected broad‐spectrum antimicrobials used in healthcare settings. The proposed indicators for AMR in humans are: meticillin‐resistant Staphylococcus aureus and 3rd‐generation cephalosporin‐resistant Escherichia coli, Klebsiella pneumoniae resistant to aminoglycosides, fluoroquinolones and 3rd‐generation cephalosporins, Streptococcus pneumoniae resistant to penicillin and S. pneumoniae resistant to macrolides, and K. pneumoniae resistant to carbapenems. For food‐producing animals, indicators for antimicrobial consumption include: overall sales of veterinary antimicrobials, sales of 3rd‐ and 4th‐generation cephalosporins, sales of quinolones and sales of polymyxins. Finally, proposed indicators for AMR in food‐producing animals are: full susceptibility to a predefined panel of antimicrobials in E. coli, proportion of samples containing ESBL‐/AmpC‐producing E. coli, resistance to three or more antimicrobial classes in E. coli and resistance to ciprofloxacin in E. coli. For all sectors, the chosen indicators, which should be reconsidered at least every 5 years, are expected to be valid tools in monitoring antimicrobial consumption and AMR. With the exception of the proposed human AMR indicators, the indicators are in general not suitable to monitor the effects of targeted interventions in a specific sector, such as in a single animal species or animal production sector. Management decisions should never be based on these indicators alone but should take into account the underlying data and their analysis.
Keywords: antimicrobial consumption, antimicrobial resistance, food‐producing animals, humans, indicator
Summary
In order to support European Union (EU) Member States (MSs) in their efforts to address antimicrobial resistance (AMR), the European Commission requested the European Centre for Disease Prevention and Control (ECDC), the European Food Safety Authority (EFSA) and the European Medicines Agency (EMA) to jointly establish a list of harmonised outcome indicators for antimicrobial consumption (AMC) and AMR. The European Commission further specified that the list of outcome indicators should be accompanied by a succinct rationale for their selection, that indicators should be limited to a maximum of 15, divided into primary and secondary indicators, and that they should be built, wherever possible, upon data already collected through the existing European networks. According to the mandate, the chosen indicators should also take into account the ‘One Health’ approach, and should be suitable to estimate the progress made towards a reduction in bacterial resistance to key antimicrobials in humans and animals, as well as improvements in the appropriateness and need for the use of antimicrobials in the EU and the MSs.
Four main sectors were identified by the respective agencies: AMC in humans, AMR in humans, AMC in food‐producing animals and AMR in food‐producing animals. AMC is regarded as the main driver of AMR in both humans and animals. Monitoring of AMC is therefore an important indicator in relation to prevention and control of AMR. For resistance, different types of indicators that reflect the state of AMR within MSs can be designed (i.e. single indicators, summary indicators or composite indicators), depending on how the AMR data are summarised. Their advantages and disadvantages are discussed in the opinion.
The selected indicators are divided into primary and secondary indicators. Primary indicators broadly reflect the situation concerning AMC and AMR. Although they do not cover all aspects of AMC and AMR, they can be used to provide a general assessment of the overall situation in each MS. Secondary indicators are designed to provide information on more specific issues that are also considered of importance for public health, but have a more restricted scope, or to encompass areas that are not fully covered by the primary indicator.
For AMC in humans, the primary indicator is the total consumption of antimicrobials, limited to antibacterials for systemic use (ATC group J01), expressed as defined daily doses (DDD) per 1,000 inhabitants and per day. This primary indicator is used to report total AMC in humans in both the hospital and community sector. The first secondary indicator is the ratio of consumption of broad‐spectrum penicillins, cephalosporins, macrolides (except erythromycin) and fluoroquinolones to the consumption of narrow‐spectrum penicillins, cephalosporins and erythromycin, in the community. The second secondary indicator is the proportion of total hospital AMC of glycopeptides, 3rd‐ and 4th‐generation cephalosporins, monobactams, carbapenems, fluoroquinolones, polymyxins, piperacillin and enzyme inhibitor, linezolid, tedizolid and daptomycin (DDD per 1,000 inhabitants and per day), and is an indicator of consumption of broad‐spectrum antimicrobials used in healthcare settings.
For AMR in humans, the proposed primary indicator consists of the proportion of meticillin‐resistant Staphylococcus aureus (MRSA) and 3rd‐generation cephalosporin‐resistant Escherichia coli (3GCR E. coli), expressed as two individual numbers. Both pathogens are of major public health importance. The first secondary indicator is the proportion of Klebsiella pneumoniae with combined resistance to aminoglycosides, fluoroquinolones and 3rd‐generation cephalosporins, chosen to reflect AMR in the hospital sector. The second secondary indicator is the proportion of penicillin‐resistant and macrolide‐resistant Streptococcus pneumoniae, given as two individual numbers, and covers an important cause of community‐acquired infections. The third secondary indicator is the proportion of carbapenem‐resistant K. pneumoniae, which is an emerging threat.
With regard to AMC in food‐producing animals, the proposed primary indicator is the overall sales of veterinary antimicrobials in milligram of active ingredient per kilogram of estimated weight at treatment of livestock and of slaughtered animals (mg/population correction unit (PCU)). It represents a way to measure the overall effect of actions taken on policy interventions for reducing the use of antimicrobials in the food‐producing animal sector. Three secondary indicators are proposed for critically important antimicrobials (CIAs), which are considered as being most relevant for closer follow‐up. These are: sales of 3rd‐ and 4th‐generation cephalosporins, sales of quinolones, specifying the percentage of fluoroquinolones and sales of polymyxins, all expressed in mg/PCU.
For AMR in food‐producing animals, the primary summary indicator is represented by the proportion of indicator E. coli isolates from broilers, fattening turkeys, fattening pigs and calves (collected in the framework of Decision 2013/652/EU), weighted by the size (expressed in PCU) of the four animal populations, that are fully susceptible to the entire panel of antimicrobials defined in the Decision. This indicator can be used to assess the development of AMR in relation to the total use of antimicrobials in food‐producing animals. Indicator E. coli is selected as the reporting organism, for both primary and secondary indicators, instead of zoonotic organisms, since it is expected to better represent the overall AMR situation, including resistance due to plasmid‐mediated AMR genes. The first secondary indicator is the proportion of samples from the above four animal species, weighted by PCU, that are identified as positive for presumptive ESBL‐/AmpC‐producing indicator E. coli in the framework of the specific monitoring for ESBL‐/AmpC‐/carbapenemase‐producing indicator E. coli. This type of resistance is considered of high public health relevance. Another secondary indicator consists of the proportion of indicator E. coli isolates from the same four animal species, weighted by PCU, that are resistant to at least three antimicrobials from different classes from the predefined panel of antimicrobials. This is particularly useful, complementing the primary indicator, in situations where the percentage of fully susceptible isolates is very low to zero. The third and final secondary indicator consists of the proportion of indicator E. coli isolates from the four species, weighted by PCU, that are microbiologically resistant to ciprofloxacin, a fluoroquinolone included in the list of highest priority CIAs. This last indicator correlates well with use of fluoroquinolones and is therefore a suitable indicator for monitoring the outcome of reduced application. In order to obtain information on resistance to important antimicrobials such as macrolides in bacteria from livestock species, more data at the EU level on resistance to macrolides in Campylobacter spp. and indicator species such as enterococci should be collected.
The indicators proposed for the different sectors should provide an overall indication of the situation regarding AMC and AMR at national level, and should support MSs in assessing their progress and the effectiveness of the measures implemented to reduce AMC and the occurrence of AMR in both humans and food‐producing animals.
The use of indicators to summarise large data sets inevitably leads to a loss of information and detail. In particular, for AMR indicators, the analysis and use of the proposed indicators may lead to a simplified representation of the very complex AMR situation in both the human and animal sectors. The proposed indicators should be interpreted with caution and are often not suitable to monitor the effects of targeted interventions in a specific sector, such as for example in a single animal species or animal production sector. In such cases, the relevant single indicators must be analysed. Apart from when proposed indicators are single indicators (i.e. human AMR indicators on MRSA and E. coli resistant to 3rd‐generation cephalosporins), management decisions should never be based on these indicators alone but should take into account the underlying data and their analysis. When indicators are used to evaluate the effectiveness of any single intervention at individual MS level, and therefore, comparisons in time are made, care has to be taken and appropriate statistical techniques applied to account for possible confounding effects, such as changes in the relative distribution of animal species over time.
Comparison of the progress in the different sectors in a ‘One Health’ perspective, e.g. comparing the changes in antimicrobial consumption and the occurrence of AMR in humans or in food‐producing animals, needs to be carried out with caution, given the differences in the data collected and the loss of detail resulting from the combination of data into indicators.
The proposed indicators have been selected on the basis of data and scientific evidence available at the time of publication. The chosen indicators should be reconsidered at least every 5 years to evaluate whether they still reflect the data available, the most urgent AMR issues and the latest surveillance methodologies, or if they can be supplemented or replaced by more relevant ones. Data on resistance to single antimicrobial classes in specific bacteria, as provided by ECDC and EFSA annual reports, should be monitored on a continuous basis in order to follow current AMR issues, evaluate the effectiveness of specific measures and identify newly arising AMR threats to public health as early as possible.
1. Introduction
1.1. Background and Terms of Reference as provided by the European Commission
1.1.1. Background
Antimicrobial resistance (AMR) – the process whereby bacteria evolve to resist the action of antimicrobials, thus making them ineffective – is increasing worldwide, with an estimated 700,000 deaths per year globally. In the European Union (EU) alone, it is estimated that AMR accounts for over 25,000 deaths per year and is estimated to incur over 1.5 billion euros in healthcare costs and loss of productivity yearly. As a global, economic and societal challenge, tackling the emergence of AMR requires the adoption of a multisectorial ‘One Health’ approach.
Combating AMR is a priority for the European Commission. Surveillance of AMR and antimicrobial consumption is essential to have comprehensive and reliable information on the development and spread of drug‐resistant bacteria, to measure the impact of measures taken to reduce AMR and to monitor progress. Such data provide insights to inform decision‐making and facilitate the development of appropriate strategies and actions to manage AMR at European, national and regional levels. In 2001 the European Commission launched the Community strategy against AMR, proposing monitoring the evolution and the effects of interventions through the establishment/strengthening of accurate surveillance systems on AMR and on the consumption of antimicrobial agents in the human and veterinary sectors. In 2011, the 5‐year Action Plan against the rising threats from AMR introduced a set of measures to further strengthen surveillance, monitoring and data collection, improving the scope and coverage both in the human and veterinary sectors.
In the EU, monitoring and surveillance of AMR and antimicrobial consumption (AMC) are currently coordinated by the three EU agencies operating in the areas of human health, food safety and pharmaceuticals: the European Centre for Disease Prevention and Control (ECDC), the European Food Safety Authority (EFSA) and the European Medicines Agency (EMA).
These three agencies collect data from Member States (MSs) and other reporting countries through diverse networks:
The European Antimicrobial Resistance Surveillance Network (EARS‐Net), coordinated by ECDC, collects and analyses European data on the occurrence of AMR in pathogenic bacteria of public health relevance in humans;
The European Surveillance of Antimicrobial Consumption Network (ESAC‐Net), coordinated by ECDC, collects and analyses European data on AMC in humans in the community and in the hospital sector;
The Healthcare‐Associated Infections Surveillance Network (HAI‐Net), coordinated by ECDC, collects and analyses European data on HAI through the European point prevalence survey of HAI and antimicrobial use in acute care hospitals, the European surveillance of surgical site infections, the European surveillance of HAI in intensive care units and the repeated prevalence surveys of HAI and antimicrobial use in European long‐term care facilities;
The Food‐and‐Waterborne Diseases and Zoonoses Network (FWD‐Net), coordinated by ECDC, collects and analyses data on the occurrence of AMR in bacteria acquired by humans through the consumption of food, water or contact with animals;
The Scientific Network for Zoonosis Monitoring Data, coordinated by EFSA, collects and analyses data on AMR in zoonotic and commensal indicator bacteria from food, food‐producing animals and food derived thereof in accordance with the EU legislation;
The European Surveillance of Veterinary Antimicrobial Consumption (ESVAC), coordinated by EMA, collects and analyses data on the sales of veterinary antimicrobials across the EU and European Economic Area (EEA) countries.
The collaboration between ECDC, EFSA and EMA resulted in 2015 in the first joint interagency report on integrated analysis of the consumption of antimicrobial agents and occurrence of antimicrobial resistance in bacteria from humans and food‐producing animals or Joint Interagency Antimicrobial Consumption and Resistance Analysis (JIACRA) Report. The intensification of the cooperation on surveillance of AMR and antimicrobial consumption, building on the expertise and previous joint publications on related subjects, has enabled the report to present data in a harmonised and transparent way.
The recent evaluation of the 2011 5‐year Action Plan against the rising threats from AMR highlighted that the EU achieved better coordination in the area of monitoring and surveillance of AMR, which resulted, for instance, in an enhanced harmonisation of monitoring in zoonotic and commensal indicator bacteria in the targeted food‐producing animal species. However, the evaluation also called for further strengthening of monitoring and surveillance of AMR and AMR‐related activities, in particular by developing expertise on methodologies, indicators and instruments to monitor trends in resistant infections and antimicrobial consumption and the effectiveness of policy interventions both in the human and veterinary sectors.
Finally, the Council conclusions on the next steps under a ‘One Health’ approach to combat AMR, adopted by the Council on 17 June 2016, call upon the MSs to have in place before mid‐2017 national action plans against AMR based on the ‘One Health’ approach and including measurable goals to reduce infections in humans and animals, the use of antimicrobials in the human and veterinary sectors and AMR in all domains.
In order to support the EU and MSs in their efforts to address AMR, including the establishment of measurable goals to reduce infection by key drug‐resistant microorganisms in humans and food‐producing animals, to improve the appropriateness of the use of antimicrobials in the human and veterinary sectors and to combat AMR in all domains, the European Commission would like to establish a list of harmonised outcome indicators that would assist the EU and MSs to assess, in a clear and simple way, the progress made in the implementation of their action plans against AMR.
1.1.2. Terms of Reference
The European Commission therefore requests ECDC, EFSA and EMA to jointly propose a list of outcome indicators suitable for monitoring and detecting reductions of relevant magnitude in the levels of key drug‐resistant microorganisms in humans, food‐producing animals and food derived thereof and in antimicrobial consumption in humans and food‐producing animal species.
The list of outcome indicators should be provided together with a succinct rationale for the election behind each indicator.
These indicators should meet the following requirements:
Their number should be limited to a maximum of 15 indicators, ideally divided into primary and secondary indicators. The list of primary indicators should establish a bare minimum, i.e. the indicators for which monitoring is considered essential to assess the progress made in the implementation of MSs action plans against AMR. The list of secondary indicators should consist of indicators for which monitoring is highly recommended to strengthen the assessment of the performance of national action plans against AMR. We suggest a maximum of five primary indicators and ten secondary indicators.
They should be suitable to estimate progress made towards a reduction in bacterial resistance to key antimicrobials in humans and animals in accordance with World Health Organization (WHO), Antimicrobial Advice Ad Hoc Expert Group (AMEG) and World Organisation for Animal Health (OIE) definitions, as well as improvements in the appropriateness and need for the use of antimicrobials in the EU and the MSs.
They should be robust and take into account the ‘One Health’ approach in order to track and compare improvements in the human and veterinary sectors for the EU as a whole and for individual MSs.
Each indicator on resistance should ideally specify the bacteria, the population concerned (human or animal), the antimicrobial substance (using where possible the anatomical therapeutic chemical (ATC) codes), the recommended protocol (if existing) and the reporting unit. Each indicator on consumption should ideally specify the antimicrobial class (using where possible the ATC codes), the sector (community or hospital for human level) and the reporting unit.
They should be built wherever possible upon data already collected through the afore‐mentioned different networks in order not to create additional administrative burden for MSs and preferably in line with international standards taking particular account of indicators proposed by WHO and OIE.
They should remain pertinent and comparable for a sufficient period of time (e.g. at least 5 years) in order to reliably measure temporal trends.
1.2. Interpretation of the Terms of Reference
The above terms of reference have been further discussed and clarified by ECDC, EFSA, EMA and the European Commission. In particular, it was clarified that:
The aim of the proposed indicators would be to monitor the progress of reducing AMR in relation to its implications on public health. Therefore, indicators should be developed to monitor AMR in bacteria that could contribute to AMR‐related concerns in humans.
The proposed indicators are to be chosen on the basis of data already collected at European level, so no new indicators should be designed.
The proposed indicators are to be used by all EU MSs, not specifically tailored for each MS. The aim is to provide MSs with a tool they can use to monitor their progress in the fight against AMR, which could be translated into new actions in their national action plan. The list provided should be the same for all EU MSs. The proposed indicators are not intended to be used for benchmarking between MSs. It is a tool for individual MSs to use.
The definition and possible setting of targets at EU level for the reduction of AMC and of occurrence/prevalence of antimicrobial‐resistant bacteria are beyond the scope of this opinion.
The number of 15 indicators refers to the total number from all sectors, both consumption of antimicrobials and AMR, in both humans and food‐producing animals.
1.3. ‘Indicators’ in the context of this mandate
The term ‘indicator’ is used in a multitude of different settings such as biology, chemistry, economics or mathematics. The common feature of all these indicators is that they reflect a certain condition or changes in a certain condition and enable the quantification of changes in that condition. Indicators frequently are simple numbers that give information about complex situations and therefore allow for the fast and easy evaluation of the situation and changes of the situation, while their underlying analysis may be fairly complex.
The simplicity of indicators comes with some costs. In the process of converting the complex situation to this number, information is lost. Indicators are always a compromise between an exact analysis on the one hand, and easily communicable information on the other. Generally speaking, the more data are merged in an individual indicator, the more difficult it will be to analyse what a change in the indicator reflects and the more prone it may be to failure in detecting trends if different data contributing to the indicator changes in opposing directions. Changes in an indicator require a thorough analysis of the underlying data and changes in the situation or processes described. The purpose of this indicator is therefore to trigger and direct such analysis, and not to replace it.
In the context of this mandate, indicators are meant to provide a simple overview to facilitate an easy evaluation of whether measures taken to reduce the use of antimicrobials (in both food‐producing animals and humans) and/or to improve the AMR situation (in food‐producing animals, food thereof and humans) are leading to progress, i.e. reduced occurrence/prevalence of AMR bacteria in animals, food and humans, or not.
At present, information on AMR in food is considered not to be sufficiently comprehensive at MS level for meaningful conclusions on incidence to be made (ECDC, EFSA and EMA, 2017). In addition, AMR in animals and food is most directly influenced by measures taken by MSs in the primary production stage. Therefore, samples taken from livestock or faecal matter are more relevant to policy making than those collected in the later stages, when confounding factors may influence the outcome. Resistance in food per se is therefore not included further in this opinion.
In the context of this opinion, four main fields for indicators were identified. These are:
AMC in humans;
AMR in humans;
AMC in food‐producing animals;
AMR in food‐producing animals.
These fields for indicators were chosen as they all reflect different issues; however, they are related to each other but are also distinct individual entities. When indicators in the four fields combine information on several aspects they must be interpreted with caution. In such cases, management decisions should never be based on these indicators alone but should consider the underlying data and their analyses.
One major difference between the two pairs of indicators (those on AMR and those on AMC) is that those relating to AMC partially reflect the consequence of human decisions (i.e. about treatments, antimicrobials used, route of administration and dosage). In contrast, those on AMR reflect consequences of these decisions and their interaction with a multitude of other factors. Therefore, the latter are more difficult to interpret and to influence.
Advantages and disadvantages of the various possible types of AMR indicators are listed in Section 2.2.1 The indicators selected within this mandate, the rationale for their selection and their limitations are described in detail in Section 3
2. Data and methodologies
2.1. Data
2.1.1. Sales/consumption in humans
ECDC conducts surveillance of AMC through ESAC‐Net, which is based on a network of operational contact points in 30 EU/EEA countries (28 EU MSs, Iceland and Norway). AMC data from the community (primary care) and from hospitals in the countries are collected through national surveillance systems and reported to ECDC on an annual basis.
Antimicrobials are reported to ESAC‐Net as defined daily doses (DDD) per 1,000 inhabitants per day and grouped according to the ATC classification. The three major categories of antimicrobials included in the surveillance conducted through ESAC‐Net are the antibacterials for systemic use (ATC group J01), antimycotics and antifungals (J02 and D01BA), and antivirals (J05). Most countries report data based on sales of antimicrobials; one‐third of the countries reports reimbursement data (records of claims of expenses related to buying of antimicrobials) and a few report both sales and reimbursement data.
The data are collected annually and published online at the ECDC website through the ESAC‐Net interactive database1 and in the ECDC report on surveillance of antimicrobial consumption in Europe.2
2.1.2. Sales/consumption in food‐producing animals
There is no EU legislation that requires MSs to collect data on consumption of veterinary antimicrobials. In 22 MSs reporting of sales of veterinary antimicrobials is based on national legislation, in other ESVAC participating MSs information is obtained by voluntary basis (EMA/ESVAC, 2016); however, most of the EU/EEA MS are providing such information. The Proposal for a Regulation of the European Parliament and of the Council on veterinary medicinal products,3 includes a requirement that would make the provision of such data compulsory.
Depending on the objectives, quantification of antimicrobial consumption can be done by several methods (EMA/ESVAC, 2013, 2017; Collineau et al., 2017). For annual surveillance, a simple and robust system that enables routine data collection is preferred. A practical method is to quantify the amount of veterinary antimicrobials sold in a given year. An advantage of using sales data is that it can be obtained from already existing sources, such as bookkeeping of marketing authorisation holders (MAHs), wholesalers, pharmacies and/or feed mills. From the number of packages sold, the amount of active ingredients (tonnes) is calculated which then should be normalised by the animal population at risk of being treated in that period. Sales data do not allow direct species specific follow up as most of the veterinary antimicrobial products are authorised for several species. Methods to obtain species specific data by combining sales data with information provided by, e.g. MAHs, Periodic Safety Update Reports (PSUR) or the information on target species in the Summary of Product Characteristics (SPC) have been developed but need to be validated at country level and over time (ANSES‐ANMV, 2016; Carmo et al., 2017; ECDC, EFSA and EMA, 2017).
Within the ESVAC activity, a system for collection of a harmonised and standardised data on sales of veterinary antimicrobials has been developed and used since 2010. The sales data are collected at package level. The number of packages is calculated to the weight of active substance (tonnes) and subsequently normalised within each country by the population of food‐producing animals at risk for treatment with antimicrobials. The estimated biomass in population correction unit (PCU) is calculated from the weight at treatment of livestock and of slaughtered animals in a given year and is used to correct the antimicrobial consumption (in mg) for the animal population at risk of being treated with antimicrobials (in kg):
Further information on the data sources used, antimicrobial classes included (ATCvet codes) and the methodology for the calculation of PCU are described comprehensively in the report ‘Trends in the sales of veterinary antimicrobial agents in nine European countries: 2005–2009’ (EMA/ESVAC, 2011). The mg/PCU indicator is now being considered by other countries or scientists outside the EU/EEA (e.g. Canada, Japan, New Zealand).
Since official statistics on the number of dogs and cats are not available from all countries, these species are not included in the calculation of the PCU, and therefore tablets, which are almost solely used for companion animals, are excluded from analysis of the sales data and the PCU data. The proportion of other pharmaceutical forms used in companion animals reported as sold for food‐producing animals is generally anticipated to be low.
The main indicator used to report sales data in the ESVAC reports is milligram active ingredient normalised by PCU (mg/PCU). The results are, in addition to overall sales, presented according to the ATCvet classes/subclass and by pharmaceutical formulation. To enable a comprehensive analysis, distribution of sales by antimicrobial class is also described in diverse tables, graphs and maps. A separate section in the ESVAC report has been allocated to each country where observed changes and possible reasons contributing to the changes are discussed.
2.1.3. Occurrence of AMR in humans
At the EU level, surveillance of the occurrence of AMR in bacterial isolates from humans is conducted in accordance with Decision 1082/2013/EU on serious cross‐border threats to health, which, in October 2013, repealed Decision 2119/98/EC. ECDC conducts surveillance of AMR in invasive bacterial isolates (i.e. from blood and cerebrospinal fluid) in humans through EARS‐Net which is the largest publicly funded system for surveillance of AMR in humans in Europe. EARS‐Net is based on a network of operational contact points in 30 EU/EEA countries (28 EU MSs, Iceland and Norway). The data reported by the countries to EARS‐Net originate from more than 900 laboratories serving more than 1,400 hospitals in Europe, and consist of results from routine clinical antimicrobial susceptibility testing (AST) of the following eight bacterial species which are considered of public health importance in Europe: Escherichia coli, Klebsiella pneumoniae, Pseudomonas aeruginosa, Acinetobacter spp., Streptococcus pneumoniae, Staphylococcus aureus, Enterococcus faecalis and Enterococcus faecium. The antimicrobial substance and bacteria combinations to be reported by the countries are defined in the EARS‐Net reporting protocol.2 Data are reported as categorised AST results (susceptible, intermediate and resistant) on a single isolate basis. In addition, a number of countries provide quantitative results. The data are collected annually and published online at the ECDC website in the ECDC Atlas of infectious diseases4 and in the EARS‐Net Annual Report.2
Surveillance of AMR in food‐borne pathogens is conducted by ECDC through FWD‐Net, which currently covers surveillance of 18 diseases acquired by humans through the consumption of food or water, or contact with animals: anthrax, botulism, brucellosis, campylobacteriosis, cholera, cryptosporidiosis, echinococcosis, giardiasis, Hepatitis A, leptospirosis, listeriosis, salmonellosis, shigellosis, toxoplasmosis, trichinellosis, typhoid/paratyphoid fever, Shiga toxin‐producing E. coli (STEC) infection and yersiniosis. AMR data are collected as part of case‐based data sets for salmonellosis and campylobacteriosis and, since 2013, as part of the molecular surveillance of Salmonella spp. and Campylobacter spp. isolates. The case‐based data set contains data from clinical treatment of patients and the results are therefore by default interpreted using clinical breakpoints for assessing treatment options. The isolate‐based data are submitted by the National Public Health Reference Laboratories (NPHRL) who perform reference testing of isolates and report the actual results of the AST as minimum inhibitory concentration (MIC) or inhibition zone (mm).
The data collected by ECDC is published annually in the EU Summary Report on AMR in zoonotic and indicator bacteria from humans, animals and food5 (EUSR‐AMR), which is produced in collaboration between ECDC and EFSA.
2.1.4. Occurrence of AMR in food‐producing animals and food
At the EU level, the monitoring and reporting of AMR in the main livestock animal species (pigs, poultry and cattle) and derived food is regulated by Commission Implementing Decision 2013/652/EU6. This Decision aims at prescribing the scope of the monitoring and harmonising data collection between MSs. It establishes a list of combinations of bacterial species, food‐producing animal populations and food products, as well as technical requirements regarding the sampling framework, the panel of antimicrobials to be used for testing resistance, and information on the laboratory analytical methods, the evaluation criteria, and data reporting. According to this Decision, representative isolates of Salmonella spp., Campylobacter jejuni, indicator commensal E. coli, and ESBL‐, AmpC‐ or carbapenemase‐producing E. coli shall be collected by MSs. Moreover, MSs are invited to collect and report voluntarily AMR data from isolates of Campylobacter coli and indicator commensal Enterococcus faecalis and Enterococcus faecium. Isolates should be collected from faecal/environmental samples, caecal samples, carcasses and fresh meat at retail, depending on the animal species, which include laying hens, broilers, fattening turkeys, fattening pigs and bovines under one year of age. The requirement to perform the monitoring also depends on the amount of animal production in the different countries, while all countries shall collect samples from broilers and pigs, only countries with meat production over a specific threshold of tonnes slaughtered per year shall collect samples for turkeys and calves. The sample size for all species is also modulated according to production, with a reduced number of samples to be collected for countries with moderate compared to high production levels. The decision is scientifically based on expert advice given on monitoring of AMR by EFSA (2012a,b), but does not cover the full range of the advice. Data from the different species are collected on a rotating basis, with data for the same species being collected every 2 years (starting from poultry and turkeys in 2014 and pigs and bovines in 2015). They are reported by MSs to EFSA on a yearly basis, analysed and presented yearly in the EUSR‐AMR, which is produced in collaboration with ECDC, as mentioned above, and which also includes data related to the occurrence of AMR in isolates from human cases, derived from FWD‐Net coordinated by ECDC (see Section 2.1.3).
Further details on the samples collected and data reported in the EUSR‐AMR are available in the annual reports published for 2014 (EFSA and ECDC, 2016), focused on laying hens, broilers and fattening turkeys, and 2015 (EFSA and ECDC, 2017), focused on fattening pigs and on bovines under one year of age.
Appendix A reports the tables with the panel of antimicrobial substances tested for indicator E. coli isolates, and respective epidemiological cut‐off values (ECOFF) to define reduced susceptibility and ‘microbiological’ resistance.
2.2. Methodologies
2.2.1. Types of indicators to be selected
The primary indicators should reflect the situation concerning AMC and AMR. Although the proposed indicators do not cover all aspects of AMC and AMR, they can be used to provide a general assessment of the overall situation in each MS. As such they are important for monitoring the state of AMC and AMR in MSs.
The secondary indicators are designed:
to provide information on more specific issues that are also considered of importance for public health, but have a more restricted scope;
to be applicable in situations in which the primary indicator is less suitable and is better replaced or supported by the secondary indicator;
to encompass areas that are not fully covered by the primary indicator and therefore provide additional information.
The choice of the indicators should be based on their ability to reflect the situation in an accurate and unbiased way. In the context of this mandate, this implies that indicators should cover the whole variety of targeted animal and human populations, bacteria, resistance mechanisms, antimicrobials and administration methods, countries and regions. Potential shortcomings of indicators may result in missing important information for relevant populations (e.g. intensive care units for human patients, animal species/production systems with a relevant market share, etc.), missing relevant bacterial species, and inadequately reflecting antimicrobial use in animals or humans (e.g. ignoring the different potency or public health relevance of certain antimicrobials). Other limitations relate to the availability of data needed to calculate the indicator.
2.2.1.1. Indicators of AMC
The consumption of antimicrobials is an important indicator in relation to prevention and control of AMR. Misuse and overuse of antimicrobials in both the community and in hospitals are some of the main factors driving development of AMR. This scientific opinion concerns consumption of antibacterials for systemic use (ATC group J01 and ATCvet group QJ01) which can cause AMR in bacteria in animals and humans (antifungals and antivirals are not addressed). The data set for AMC in food‐producing animals also includes products for intestinal, intramammary, intrauterine and antiparasitic use (ATCvet codes QA07AA, QA07AB QJ51, QG01 and QP051AG).
A summary indicator based on data on the antimicrobials included in J01 would be a robust, comprehensive and reliable measure reflecting consumption of all main antimicrobial groups relevant to the occurrence of AMR in pathogenic bacteria from humans. The data collected for this antimicrobial group) are based on sales or reimbursement data and reported as DDD per 1,000 inhabitants per day. In order to provide additional and more detailed information on the quality of antimicrobial use, secondary indicators on AMC should address the ratio of consumption of broad spectrum antimicrobials and narrow spectrum antimicrobials, or total use of antimicrobials separately in community/primary care and in hospitals. Primary/community care accounts for the majority of antimicrobial use (80–90%) and most of the antimicrobials are prescribed for respiratory infections.7 Antimicrobials with a broad spectrum are often preferentially used; however, this practice is not in line with available guidelines on prudent use of antimicrobials. In hospitals, one‐third of patients receive antimicrobials on average; however, a large proportion of such treatments may be inappropriate.7 An indicator reflecting the use of broad spectrum antimicrobials in hospitals is therefore important to monitor the aggregated selective pressure of these antimicrobial classes and is likely to capture the effects of implementation of antimicrobial stewardship programs in hospitals.
In most of the EU countries, comprehensive data on AMC in food‐producing animals is only available for sales of veterinary medicines. The ESVAC surveillance data covers extensively sales of different veterinary antimicrobial classes and administration routes (EMA/ESVAC, 2016). Units of measurement available to be used as indicators include population corrected sales in milligrams active ingredient sold per population correction unit (mg/PCU) by antimicrobial class and/or by pharmaceutical form and proportions of different antimicrobial classes and pharmaceutical forms. A summary indicator covering all antimicrobial classes would provide a crude but robust estimate of the overall AMC in food‐producing animals. As overall sales in mg/PCU includes all antimicrobial classes with equal weight, this should not be used as the only indicator but complemented with detailed information on some antimicrobial classes considered as critically important for human medicine for closer follow‐up (Appendix G).
2.2.1.2. Indicators of AMR
To provide the information requested by the mandate, indicators that reflect the state of AMR within MSs can be designed as either single indicators, summary indicators or composite indicators. While single indicators use the data taken directly from the resistance monitoring programmes, summary indicators combine the resistance data from different animal species or antimicrobials. Composite indicators go even further by abstracting information from the raw monitoring data. This can be achieved, for example, by weighting AST results with data derived from other sources such as the relevance of an antimicrobial for public health. Advantages and disadvantages of the three approaches are summarised in Table 1.
Table 1.
Main advantages and disadvantages of AMR indicators
| Type of indicator | Description | Advantages | Disadvantages |
|---|---|---|---|
| Single indicator | One combination of microbe, antimicrobial class and source of isolate |
High level of detail Investigation of the association with AMC data is possible Interpretation is straight‐forward Data are available from current monitoring Useful as basis for design of interventions Easier to detect changes in a single sector |
Poor overview on overall resistance situation for different antimicrobials and, for animals, in different species Influenced by minor changes in a single sector If only few antimicrobials are monitored, a shift to alternative antimicrobials may be provoked which will not be detected in the monitoring Multitude of information can be time‐consuming to analyse |
| Summary indicator | Resistance or susceptibility level obtained as a combination of several microbes and/or resistance to antimicrobials and/or sources of isolates, possibly adjusted for populations |
Reduces complexity by summarising data Easy to communicate Less influenced, than single indicators, by minor changes in resistance to individual antimicrobial classes in specific sectors Useful for monitoring general long‐term trends in the resistance situation in the different sectors |
Using a limited number of summary indicators may not cover the whole resistance situation Proportions of resistant bacteria may not be directly comparable between different antimicrobial classes and different species Combining data may lead to the indicator failing to detect change in AMR Opposing trends in individual components might cancel each other out and remain unnoticed Effects of specific interventions on one antimicrobial class or in one species cannot be monitored effectively Less useful than single indicators as a basis for design of specific interventions |
| Composite indicator | Overall indicator obtained as a combination of several microbes and/or resistance to antimicrobials and/or sources of isolates, and weighting resistance data with data from other sources such as usage data or public health relevance |
Good for monitoring general trends because it is a better representation of the overall situation Allows comparison of the resistance situation between different sectors Less influenced, than single indicators, by minor changes in resistance to individual antimicrobial classes in specific sectors |
Interpretation of these indicators is complex Choice of weighting factors has a major influence on the validity of the indicator Combining data may lead to the indicator failing to detect change in AMR Opposing trends in individual components might cancel each other out and remain unnoticed Effects of specific interventions on one antimicrobial class or in one species cannot be monitored effectively Not useful as basis for design of specific interventions |
Single indicators
Single indicators are based on a single organism/single antimicrobial class combination. Single indicators can be calculated from AMR occurrence/prevalence data for humans and food‐producing animals. Data on various microorganisms and antimicrobials are readily available for a representative sample of indicator and zoonotic bacteria from healthy animals, and isolates of zoonotic and non‐zoonotic bacteria from humans. The interpretation of single indicators and their trends is straightforward. When AMC data are available, the relationship between usage and the occurrence of AMR can be established. Therefore, there are several advantages for selection of a single indicator that make this approach attractive. This is dependent on the chosen indicator accurately representing the overall AMR trends in all MSs, and having relevance for public health AMR policies.
Using a single organism/single antimicrobial class combination as a general indicator could be appropriate if this indicator represents overall trends for several microorganisms and various antimicrobials. This may not always be the case. Analysis of, for example, the data from the 2016 Dutch Maran report (MARAN, 2016) suggests that the E. coli and Salmonella spp. trends resemble each other sufficiently to be labelled as predictors for each other, but they do not correspond with the Campylobacter spp. or Enterococcus spp. trends. The latter two are also not in parallel with each other.
The analysis of AMR trends for different antimicrobials in a single organism could be appropriate if resistance trends for multiple antimicrobials in a single species of microorganism do correlate well enough to limit the number of antimicrobials for which AMR is measured. It might be possible for antimicrobials from the same class, but actual data suggest that this might not always be the case. In addition, if resistance to only few antimicrobials is being monitored, users may switch to other compounds. For example, if the veterinary usage of amoxicillin is monitored, other CIAs might be used instead. This could therefore drive patterns of use in inappropriate ways.
The absolute AMR percentages of isolates from different sources such as poultry, pigs and cattle differ considerably (EFSA and ECDC, 2016, 2017) and extrapolation of data between different sources is difficult, if not impossible. For example, if pig producers make important improvements to their air circulation systems that reduce the need to treat respiratory infections in piglets, this does not affect the poultry sector. There are also differences within the different animal groups. For example, turkeys appear to carry more antimicrobial‐resistant bacteria than broilers (Randall et al., 2013). Similarly, veal calves carry more AMR bacteria than dairy cattle (Bosman et al., 2014). Thus trends in the different species do not follow each other well enough to consider the trend in one animal species or production sector to be a predictor for another animal species or sector. Trends in indicator animals therefore cannot be considered representative for all livestock. Similar considerations apply for humans, since AMR percentages in human isolates also vary between different human populations (e.g. general vs hospitalised vs intensive care units (ICU)).
From the above considerations, choosing a single indicator for monitoring trends of the general AMR situation in a country might be imprudent, as no single indicator can be selected that represents all AMR trends well enough to be considered a predictor of the general AMR situation.
Summary indicators
Data contributing to single indicators can be analysed together to obtain an overall occurrence/prevalence value for several populations or several antimicrobials. The simplest type of summary indicator is the proportion of isolates of a specific bacterium (e.g. indicator E. coli) with multiple resistance (either against a defined number of antimicrobial classes or against a specific combination of classes), and the proportion of isolates fully susceptible to a defined set of antimicrobials. Another option for creating a summary indicator is averaging the occurrence/prevalence of resistances against different antimicrobial classes, in different bacteria species or in different populations (e.g. animal species or production types). If occurrence/prevalence data from different animal populations are combined, the overall occurrence/prevalence value can be calculated by weighting the occurrence/prevalence from each species by the size of the respective animal population in the respective country. The size of the animal population can be expressed as PCU, starting from official figures, such as the ones reported in Eurostat,8 and assigning standard weights (kg) to the different animal species/categories, which represent the theoretical weight at the most likely time for treatment (see Appendix B). In summary indicators, no additional sources of data are used to weight and/or combine AMR data.
The advantage of summary indicators is that more parameters are taken into consideration than for single indicators. This may also be a drawback, as small changes in a single sector may not be detected. Larger changes may also not be noticed if there are opposite trends of single parameters, e.g. resistance of microbe X for antimicrobial Y is increasing, while resistance to antimicrobial Z is decreasing. Furthermore, using a limited number of summary indicators may not cover all aspects of the AMR situation. Changes in summary indicators may also be more difficult to interpret and therefore, for detailed trend analysis of individual microbes, antimicrobials and animal species a return to the original data will be necessary (Oteo et al., 2014). Since the summary indicators are derived from these data, doing so should not be overly demanding.
Composite indicators
Data from additional sources can be used to weight occurrence/prevalence data on AMR. Additional data sources could be, for example, data on the amount of antimicrobials used (ideally expressed as DDD), and/or the importance of a specific resistance to public health. Composite indicators can be calculated by averaging AMR occurrence/prevalence data for a single species for several antimicrobials, using sales or usage data as weighting factor. An example for this approach in humans is the drug resistance index (Laxminarayan and Klugman, 2011), where the proportion of resistant isolates is multiplied by proportion of usage of the respective antimicrobial class. An increase of this indicator could indicate either an increase in usage, or AMR, or both.
Occurrence/prevalence of AMR for microbial species from different animal sources could also be combined using sales data as a weighting factor. For AMR in food‐producing animals, the weighting is not as straightforward as for humans. The main concern in such animals is not treatment failure, but rather development of resistance in bacteria which may be transmitted to humans. A meaningful weighting factor should therefore reflect the importance of AMR, such as the resistance in a specific bacterial species against a specific antimicrobial class for public health. This can be achieved by either weighting by human usage data or by a score determined by risk assessment.
When applying composite indicators and using these for reporting on AMR, in every step of integration specific information is lost, as it is combined with other information. Averaging may make small variations unnoticeable. Therefore, choosing the appropriate combination of single or summary indicators and weighting factors is essential to derive the optimal indicator for a certain purpose.
If the goal is to provide insight on the overall influence of AMR in livestock for public health, then a composite indicator that combines a panel of antimicrobials, weighted for the human health care relevance of each antimicrobial class is likely to be an appropriate option for future consideration.
2.2.2. Description of the methodology followed to define indicators
2.2.2.1. Definition of indicators for AMC and for AMR in humans
In order to identify indicators for AMC and AMR, ECDC recruited members for an expert working group (WG) consisting of nine external experts who represent elected Coordination Committee members of four surveillance networks managed by ECDC and engaged with surveillance of AMC and AMR in humans (EARS‐Net, ESAC‐Net, FWD‐Net and HAI‐Net). A Delphi process was applied as a consensus method using ranking based on Multi‐Criteria Decision Analysis (MCDA) to ensure a structured, science‐based, reproducible and transparent process for identification of indicators. MCDA was applied in accordance with an existing ECDC framework for best practices in conducting risk‐ranking (ECDC, 2015). The process was applied in parallel for AMC and AMR indicators.
An initial list of possible AMC indicators of high priority was drafted based on antimicrobials for which consumption data was available from ESAC‐Net, and a list of possible AMR indicators of high priority was drafted based on combinations of microorganisms and resistance determinants available from EARS‐Net or HAI‐Net or FWD‐Net (Table 2). The lists of indicators were reviewed by the WG in a first virtual meeting and six indicators for AMC and twelve indicators for AMR were selected for subsequent ranking. The objective of the WG was to select a concise set of indicators that would address areas of AMC and AMR of public health importance in both the community and the hospital sectors.
Table 2.
Initial list of proposed AMC and AMR indicators in humans for ranking
| Initial list of proposed indicators (AMC) |
|---|
| Total consumption of antibacterials for systemic use J01 |
| Combinations of penicillins including β‐lactamases, 2nd‐ and 3rd‐generation cephalosporins, carbapenems and fluoroquinolones |
| Ratio of the consumption of broad‐spectrum penicillins, cephalosporins, macrolides and fluoroquinolones (J01(CR+DC+DD+(F‐FA01)+MA)) to the consumption of narrow‐spectrum penicillins, cephalosporins and macrolides (J01(CE+DB+FA01)) |
| Macrolides (except erythromycin) J01FA (−J01FA01) |
| Carbapenems J01DH |
| Glycopeptides, 3rd‐ and 4th‐generation cephalosporins, monobactams, carbapenems, fluoroquinolones, polymyxins, piperacillin and enzyme inhibitor, linezolid, tedizolid, daptomycin |
| Initial list of proposed indicators (AMR) |
| Escherichia coli resistant to 3rd‐generation cephalosporins |
| Meticillin‐resistant Staphylococcus aureus |
| Streptococcus pneumoniae resistant to macrolides |
| Streptococcus pneumoniae resistant to penicillin |
| Salmonella Enteritidis resistant to 3rd‐generation cephalosporins |
| Campylobacter spp. resistant to fluoroquinolones |
| Escherichia coli resistant to aminoglycosides, fluoroquinolones and 3rd‐generation cephalosporins |
| Klebsiella pneumoniae resistant to carbapenems |
| Klebsiella pneumoniae resistant to aminoglycosides, fluoroquinolones and 3rd‐generation cephalosporins |
| Pseudomonas aeruginosa resistant to three or more antimicrobial groups among piperacillin + tazobactam, ceftazidime, fluoroquinolones, aminoglycosides and carbapenems |
| Acinetobacter baumannii resistant to carbapenems |
| Enterococcus faecium resistant to vancomycin |
The expert group agreed on three criteria to be used for ranking each proposed indicator for AMC and AMR. Given that the indicators are intended to support MSs to monitor progress in the implementation of National Action plans, the criteria for the ranking of the indicators were selected to reflect not only the public health importance of the respective resistance and antimicrobials, but also the availability and effectiveness of measures (both antimicrobial stewardship and infection control) to reduce or prevent AMR, to each particular antimicrobial class(es), in each particular microorganism.
The criteria selected by the experts for AMC were: (1) proportion of resistance, (2) impact of resistance and (3) misuse/overuse, reflecting the potential effect of stewardship measures. The respective selected criteria for AMR were: (1) incidence of infections, (2) impact of infections and (3) human‐to‐human transmissibility, reflecting the potential effect of infection control measures (Table 3). Four levels were available for each criterion, with each level representing one order of magnitude higher than the previous level (0.001, 0.01, 0.1 and 1) and labelled with the following qualitative descriptors: very low, low, medium and high. Approximate variable values, indicating what ‘very low’ or ‘high’ should correspond to, were also suggested and agreed by the experts. For example, for the ‘proportion of resistance’ criterion, ‘high’ was defined as more than 99%, whereas ‘very low’ was defined as less than 1%. The assigned values were transformed and rescaled before calculation of the ranking score with application of a linear model (ECDC, 2017a).
Table 3.
Criteria and weights used in MCDA for AMC and AMR indicators in humans
| AMC criteria | Weights | ||
|---|---|---|---|
| Estimated proportion of resistance to this antimicrobial/group of antimicrobials in infections by relevant pathogens in the population over the next 5 years | 0.44 |
Very low Low Medium High |
< 1% 1–10% 10–99% > 99% |
| Estimated impact of resistance to this antimicrobial/group of antimicrobials of relevant human pathogens on the affected population over the next 5 years (morbidity, mortality) | 0.39 |
Very low Low Medium High |
< 1% 1–10% 10–99% > 99% |
| Perceived or known percentage of prescriptions with misuse/overuse of this antimicrobial/group of antimicrobials (consumption reflects misuse/overuse and thus amenable to interventions) | 0.17 |
Very low Low Medium High |
< 1% 1–10% 10–99% > 99% |
| AMR criteria | Weights | ||
|---|---|---|---|
| Estimated incidence of infections by this resistant microorganism in the relevant population (hospital, community or total) over the next 5 years | 0.42 |
Very low Low Medium High |
< 1 per 100,000 population* 1–100 per 100,000 population* 100–1,000 per 100,000 population* > 1,000 per 100,000 population* |
| Estimated impact of infections by this resistant microorganism in the relevant population (hospital, community or total) over the next 5 years (morbidity, mortality) | 0.37 |
Very low Low Medium High |
< 1% 1–10% 10–99% > 99% |
| Perceived or known percentage of resistance of this microorganism linked to human‐to‐human transmission (reflects infection control practice and thus amenable to interventions) | 0.21 |
Very low Low Medium High |
< 1% 1–10% 10–99% > 99% |
Population*: refers to inhabitants or admissions, respectively, for the community and hospital populations.
Weights reflecting the importance of each criterion were proposed by each expert and the average weight was used. The assigned weights were between 0 and 1 adding up to 1.
The ranking scores (RS) for each indicator i, Ri, were calculated using the equation:
where Propi is the proportion of resistance, Impi is the impact of resistance and Inti is the criterion reflecting the availability of effective measures. The factors wt are the respective assigned weights. The average ranking of all the members of the expert group was used as the final score used to rank the indicators.
After the outcome of the final ranking the results were presented to the WG (Tables 4 and 5), the experts agreed in a second meeting on one primary and two secondary AMC indicators, one each for the community and hospital sectors, respectively. Similarly, one primary AMR indicator and three secondary AMR indicators were selected. One secondary AMR indicator related to resistance in the community sector and two secondary AMR indicators, related to resistance in the hospital sector.
Table 4.
Outcome of ranking of AMC indicators in humans
| Rank | Disease | Relative ranking score |
|---|---|---|
| 1 | Total consumption of antibacterials for systemic use J01 | 0.744 |
| 2 | Ratio of the consumption of broad‐spectrum penicillins, cephalosporins, macrolides and fluoroquinolones (J01(CR+DC+DD+(F‐FA01)+MA)) to the consumption of narrow‐spectrum penicillins, cephalosporins and macrolides (J01(CE+DB+FA01)) | 0.719 |
| 3 | Combinations of penicillins including β ‐lactamase inhibitors, 2nd‐ and 3rd‐generation cephalosporins, carbapenems and fluoroquinolones | 0.714 |
| 4 | Glycopeptides, 3rd‐ and 4th‐generation cephalosporins, monobactams, carbapenems, fluoroquinolones, polymyxins, piperacillin and enzyme inhibitor, linezolid, tedizolid, daptomycin | 0.707 |
| 5 | Carbapenems J01DH | 0.538 |
| 6 | Macrolides (except erythromycin) J01FA (‐J01FA01) | 0.457 |
Table 5.
Outcome of ranking of AMR indicators in humans
| Rank | Disease | Relative ranking score |
|---|---|---|
| 1 | Meticillin‐resistant Staphylococcus aureus | 0.667 |
| 2 | Escherichia coli resistant to 3rd‐generation cephalosporins | 0.648 |
| 3 | Streptococcus pneumoniae resistant to penicillin | 0.550 |
| 4 | Klebsiella pneumoniae resistant to aminoglycosides, fluoroquinolones and 3rd‐generation cephalosporins | 0.520 |
| 5 | Escherichia coli resistant to aminoglycosides, fluoroquinolones and 3rd‐generation cephalosporins | 0.507 |
| 6 | Enterococcus faecium resistant to vancomycin | 0.486 |
| 7 | Klebsiella pneumoniae resistant to carbapenems | 0.473 |
| 8 | Streptococcus pneumoniae resistant to macrolides | 0.414 |
| 9 | Acinetobacter baumannii resistant to carbapenems | 0.382 |
| 10 | Pseudomonas aeruginosa resistant to three or more antimicrobial groups among piperacillin + tazobactam, ceftazidime, fluoroquinolones, aminoglycosides and carbapenems | 0.366 |
| 11 | Campylobacter spp. resistant to fluoroquinolones | 0.327 |
| 12 | Salmonella Enteritidis resistant to 3rd‐generation cephalosporins | 0.317 |
After the results of the ranking were presented to the WG, the outcome was discussed and the experts agreed on minor adjustments on the selected indicators and reached final consensus.
2.2.2.2. Definition of indicators for AMC in food‐producing animals
EMA requested the ESVAC Sales Expert Advisory Group (EAG) to draft a proposal for indicators for AMC in food‐producing animals for consideration by the Committee for Medicinal Products for Veterinary Use (CVMP) Antimicrobials Working Party (AWP). Sales EAG is an expert advisory group that supports the ESVAC team in technical, epidemiological and other scientific aspects of surveillance of sales of veterinary antimicrobials.
A list of possible indicators that were already available in current ESVAC reports was reviewed by the ESVAC Sales EAG using criteria set by the European Commission in the terms of reference. Conclusions and recommendations of recent scientific reports (ECDC, EFSA and EMA, 2015, 2017; EMA and EFSA, 2017) and the CVMP strategy 2016–2020 (EMA/CVMP, 2016) were followed.
A short list of indicators was presented to the CVMP AWP and the groups worked together to finalise the proposal, which was finally adopted by the CVMP. Criteria and ranking of antimicrobials by the WHO and AMEG were examined in detail (see Appendix G), as the objective and criteria used for the categorisations were somewhat different.
In June 2017, the proposed primary and secondary indicators for AMC in food‐producing species were presented to the CVMP which discussed them in the July 2017 meeting. Detailed rationale for selection of the indicators, including limitations and guidance for interpretation of changes in indicators for AMC in food‐producing animals are described in Section 3.4.
2.2.2.3. Definition of indicators for AMR in food‐producing animals
In order to identify indicators for AMR in food‐producing animals, EFSA set up a WG consisting of six experts selected on the basis of their expertise in the specific topic, and specifically in the following areas:
monitoring of AMR bacteria in food‐producing animals;
epidemiology of AMR, and transmission of AMR bacteria from food‐producing animals to humans;
public health risks of AMR.
Experts were asked to consider and describe the different possible types of AMR indicators that could be selected, identifying their advantages and disadvantages (see Section 2.2.1.2). Subsequently, the experts defined a list of possible AMR indicators in food‐producing animals, taking into account specifically the following two points of the terms of reference:
(indicators) should be suitable to estimate progress made towards a reduction in bacterial resistance to key antimicrobials in humans and animals in accordance with WHO, AMEG and OIE definitions, as well as improvements in the appropriateness and need for the use of antimicrobials in the EU and the individual MSs;
(indicators) should be robust and take into account the ‘One Health’ approach in order to track and compare improvements in the human and veterinary sectors for the EU as a whole and for individual MSs.
Experts were asked to consider data already collected at EU level, and particularly those presented in the EFSA EU Summary Report on AMR and in the last JIACRA Report (EFSA and ECDC, 2016, 2017; ECDC, EFSA and EMA, 2017).
An initial list of possible indicators was drafted. The suggested indicators were then tested and compared using the EU 2014 and 2015 data sets, as described in Section 3.5.5 and in Appendix F.
For each indicator reasons for selection, as well as possible limitations, are described in Section 3.5, and in Section 3.5.5, a brief description of the indicators considered but not selected is given, together with reasons for their exclusion.
3. Assessment
3.1. Synoptic table of the proposed indicators
Table 6 provides an overview of the proposed indicators, which are described in detail in Sections 3.2–3.5.
Table 6.
| Humans | Food‐producing animals | |||
|---|---|---|---|---|
| AMC | AMR | AMC | AMR | |
| Primary indicators | Total consumption of antibacterials for systemic use (DDD per 1,000 inhabitants and per day) | Proportion of meticillin‐resistant Staphylococcus aureus (MRSA) and 3rd‐generation cephalosporin‐resistant Escherichia coli (3GCR E. coli) given as two individual numbers | Overall sales of veterinary antimicrobials (mg/PCU) | Proportion of indicator E. coli from broilers, fattening turkeys, fattening pigs and calves, weighted by PCU, fully susceptible to a predefined panel of antimicrobials |
| Secondary indicators | Ratio of the consumption of broad‐spectrum penicillins, cephalosporins, macrolides (except erythromycin) and fluoroquinolones to the consumption of narrow‐spectrum penicillins, cephalosporins and erythromycin | Proportion of Klebsiella pneumoniae with combined resistance to aminoglycosides, fluoroquinolones and 3rd‐generation cephalosporins | Sales of 3rd‐ and 4th‐generation cephalosporins (mg/PCU) | Proportion of samples positive for presumptive ESBL‐/AmpC‐producing indicator E. coli from broilers, fattening turkeys, fattening pigs and calves weighted by PCU |
| Proportion of total hospital AMC that are glycopeptides, 3rd‐ and 4th‐generation cephalosporins, monobactams, carbapenems, fluoroquinolones, polymyxins, piperacillin and enzyme inhibitor, linezolid, tedizolid and daptomycin (DDD per 1,000 inhabitants and per day) | Proportion of penicillin‐resistant and macrolide‐resistant Streptococcus pneumoniae | Sales of quinolones (mg/PCU), specifying the proportion of fluoroquinolones | Proportion of indicator E. coli from broilers, fattening turkeys, fattening pigs and calves, weighted by PCU, resistant to at least three antimicrobials from different classes included in a predefined panel of antimicrobials | |
| Proportion of carbapenem‐ resistant Klebsiella pneumoniae | Sales of polymyxins (mg/PCU) | Proportion of indicator E. coli from broilers, fattening turkeys, fattening pigs and calves, weighted by PCU, resistant to ciprofloxacin | ||
AMC: antimicrobial consumption; AMR: antimicrobial resistance; DDD: defined daily doses; PCU: population correction unit.
3.2. Indicators of AMC in humans
3.2.1. Primary indicator – consumption of antibacterials for systemic use (DDD per 1,000 inhabitants and per day)
3.2.1.1. Selected indicator
The proposed primary indicator for antimicrobial consumption in humans is the total consumption of antimicrobials, limited to antibacterials for systemic use (ATC group J01), expressed as DDD per 1,000 inhabitants and per day. This primary indicator represents AMC in humans in both the hospital and community sector.
3.2.1.2. Rationale for selection
The proposed primary indicator is expressed in ‘defined daily doses (DDD) per 1,000 inhabitants and per day’, based on the Anatomical Therapeutic Chemical (ATC)/DDD index (ATC group J01), and this metric is used to report the total AMC in the community (i.e. outside hospitals) and in the hospital sector. DDD is an internationally accepted unit for measuring AMC allows for comparative monitoring of AMC at national and at the EU level. This indicator takes into consideration the amount of antimicrobials (doses) consumed in a country and thereby indicates the potential effect on the development of AMR.
Consumption of antibacterials for systemic use (ATC group J01) in DDD per 1,000 inhabitants and per day is recognised as a useful indicator of AMC in Europe as a whole and in individual MSs. It has proven to be a comprehensive, comparable and reliable indicator of antimicrobial consumption enabling countries to audit AMC and to evaluate antimicrobial stewardship interventions (Adriaenssens et al., 2011; ECDC, 2016). In addition, this indicator provides a measure of the overall selective antimicrobial pressure for selection of AMR (Coenen et al., 2007).
This primary indicator had the highest ranking during the process of evaluation of all indicators for AMC in humans from the WG.
3.2.1.3. General considerations on the proposed primary indicator
The consumption of antimicrobials in humans, limited to antibacterials for systemic use (ATC group J01) in DDD per 1,000 inhabitants and per day, is a large summary indicator composed of data from a wide range of antimicrobial agents for which there are variations in use and indications for treatment between countries. Applying only the total AMC per country implies that relative changes in the proportion of hospital and community AMC will not be directly visible. Likewise, relative changes in the consumption of different antimicrobial groups will not be directly visible. It is therefore important to combine the use of this indicator with secondary indicators on AMC in humans.
3.2.2. Secondary indicator – ratio of the community consumption of broad‐spectrum penicillins, cephalosporins, macrolides and fluoroquinolones to the consumption of narrow‐spectrum penicillins, cephalosporins and macrolides
3.2.2.1. Selected indicators
The proposed secondary indicator is the ratio of consumption of broad‐spectrum penicillins, cephalosporins, macrolides and fluoroquinolones (J01(CR+DC+DD+(F‐FA01)+MA)) to the consumption of narrow‐spectrum penicillins, cephalosporins and macrolides (J01(CA+CE+CF+DB+FA01)).
3.2.2.2. Rationale for selection
This secondary indicator is selected to reflect AMC in the community. It has been documented that antimicrobials with a broader spectrum of activity are potentially overused in ambulatory care (Shapiro et al., 2014; Kourlaba et al., 2016). This indicator targets the use of broad‐spectrum penicillins, cephalosporins, macrolides and fluoroquinolones in community and may be used to monitor changes in the quality of outpatient antimicrobial use. At the same time, this indicator will reflect AMC patterns and is likely to reflect availability of, and compliance with, guidelines on antimicrobial use. In addition, the indicator expresses the combined selective pressure of selected antimicrobial classes on the development of resistance in both Gram‐positive and Gram‐negative bacteria in the community.
A similar ratio of the consumption of broad‐spectrum penicillins, cephalosporins and macrolides to the consumption of narrow‐spectrum penicillins, cephalosporins and macrolides has been proposed by international expert consensus (Coenen et al., 2007) and subsequently used by ESAC‐Net. The variation within European countries when applying the same method (ECDC, 2014) ranging from 0.2 to 258 in 2012. This indicates that this type of AMC ratio can be used for auditing prudent use of antimicrobials in the community and indicate adherence to current available guidelines for the treatment of community‐acquired infections (ECDC, 2017b).
3.2.2.3. General considerations on the proposed secondary indicator
This secondary indicator is selected to predominantly reflect AMC in the community and should for this reason not stand alone, but be used in combination with a hospital AMC indicator. The ATC groups selected for the broad‐spectrum and narrow‐spectrum antimicrobial groups do not include all antimicrobial substances and the ratio thereby gives a measure based only on a subset of the available antimicrobials. The selection provides a balance between full inclusion and inclusion of truly board‐spectrum and truly narrow spectrum antimicrobials. It should be noted that the AMR situation in each individual country at the time of measurement may affect the ratio indicator, and may therefore not always be a reliable indicator of poor prescribing. It may reflect the availability of, and compliance with, guidelines on antimicrobial use, e.g. a country with general high levels of AMR is unlikely to have proportionally high use of narrow‐spectrum antimicrobials.
3.2.3. Secondary indicator – proportion of total hospital AMC that are glycopeptides, 3rd‐ and 4th‐generation cephalosporins, monobactams, carbapenems, fluoroquinolones, polymyxins, piperacillin and enzyme inhibitor, linezolid, tedizolid and daptomycin DDD per 1,000 inhabitants and per day)
3.2.3.1. Selected indicators
The proposed secondary indicator is the proportion of total hospital AMC that are glycopeptides, 3rd‐ and 4th‐generation cephalosporins, monobactams, carbapenems, fluoroquinolones, polymyxins, piperacillin and enzyme inhibitor, linezolid, tedizolid and daptomycin (DDD per 1,000 inhabitants and per day).
3.2.3.2. Rationale for selection
This secondary indicator is selected to reflect AMC in hospitals and aims to measure consumption of broad spectrum antimicrobials which are used in hospitals. In addition, similarly to the proposed indicator for community AMC, this indicator expresses the aggregated selective pressure of the selected antimicrobial classes on the development of AMR in both Gram‐positive and Gram‐negative bacteria in the hospital setting. The selected antimicrobials encompass groups regarded as last line antimicrobials and antimicrobials regarded as critically important for use in humans, and which require specific monitoring. The indicator aims to capture the effects of implementation of antimicrobial stewardship, and the availability of, and compliance with, guidelines on prudent use of antimicrobials in the hospital sector.
3.2.3.3. General considerations on the proposed secondary indicator
This secondary indicator is selected to primarily reflect AMC in the hospital sector and should for this reason not stand alone, but be used in combination with a community AMC indicator. It includes a variety of different broad‐spectrum and/or last line antimicrobials, and change within this spectrum for which some are used at low level in some countries (e.g. colistin to carbapenems, or carbapenems to penicillin, and enzyme inhibitors etc.) may not be captured. It should be noted that the AMR situation in each individual country at the time of measurement may affect the outcome. Countries with high levels of multidrug resistance may have higher use of last line antimicrobials. The measurement obtained using this indicator is therefore not a simple reflection of implementation of antimicrobial stewardship and the availability of, and compliance with, guidelines on prudent use of antimicrobials.
3.3. Indicators of AMR in humans
3.3.1. Primary indicator – proportion of meticillin‐resistant Staphylococcus aureus (MRSA) and 3rd‐generation cephalosporin‐resistant E coli (3GCR E. coli) given as two individual numbers
3.3.1.1. Selected indicator
The primary indicator consists of the proportion of meticillin‐resistant Staphylococcus aureus (MRSA) and 3rd‐generation cephalosporin‐resistant Escherichia coli (3GCR E. coli) expressed as two individual numbers [% MRSA, % 3GCR E. coli].
3.3.1.2. Rationale for selection
Staphylococcus aureus is a leading cause of bloodstream infections (and a common cause of skin, soft tissue and bone infections) in Europe. Its oxacillin‐resistant form, MRSA, is among the most important causes of antimicrobial‐resistant healthcare‐associated infections caused by Gram‐positive bacteria. Despite successful interventions to reduce occurrence of MRSA infection in a few countries in recent years, MRSA remains a public health priority in Europe, as 7 out of 29 EU/EEA countries have reported MRSA proportion higher than 25% (ECDC, 2017c). Among Gram‐negative bacteria, resistance to 3rd‐generation cephalosporins in E. coli has increased significantly at EU/EEA level and in many individual MSs. For this reason, the primary AMR indicator was chosen to express the occurrence of resistance in these two pathogens of major public health importance.
In addition, this indicator reflects the interplay between antimicrobial use and resistance in Gram‐positive and Gram‐negative bacteria, especially within the hospital setting. Antimicrobials used for the treatment of Gram‐negative bacterial infections may impact resistance in Gram‐positive bacteria. This has been shown for fluoroquinolone use (mostly used for Gram‐negative bacteria, including E. coli) and MRSA (Fuzi, 2016). In particular, high levels of fluoroquinolone use have been correlated with high proportions of MRSA and vice versa (Fuzi, 2016). This relationship between fluoroquinolone use and MRSA is so strong that recommendations to reduce rates of MRSA include the prudent use of fluoroquinolones (Byrne and Wilcox, 2011; Lafaurie et al., 2012). The same has been found for 3rd‐generation cephalosporins and MRSA (Smith, 1999; Henderson, 2006).
In the ranking of proposed indicators for AMR by the ECDC expert group, MRSA and 3GCR E. coli had received the highest ranking and were regarded by the experts as the highest priority pathogen‐antimicrobial combinations for use as indicators. At the same time, the combination of the two selected pathogen‐antimicrobial combinations represents AMR in both the community and hospital sectors. Given the limited number of primary indicators requested, and given that both Gram‐positive and Gram‐negative bacteria should ideally be reflected in a single primary indicator of AMR, this indicator combines in a simple way two major AMR problems in Europe.
3.3.1.3. General considerations on the proposed primary indicator
Even though the combinations of MRSA or 3GCR E. coli represent highly important AMR problems in almost all European countries, AMR in other resistant pathogens constitute additional important public health threats in some MS. This primary indicator should therefore not stand alone, but be used in combination with secondary more specific community and hospital indicators for AMR.
3.3.2. Secondary indicator – proportion of Klebsiella pneumoniae with combined resistance to aminoglycosides, fluoroquinolones and 3rd‐generation cephalosporins
3.3.2.1. Selected indicators
This secondary indicator is Klebsiella pneumoniae with combined resistance to aminoglycosides, fluoroquinolones and 3rd‐generation cephalosporins measured as [% K. pneumoniae resistant to aminoglycosides and fluoroquinolones and 3rd‐generation cephalosporins].
3.3.2.2. Rationale for selection
This secondary indicator was selected to reflect AMR in the hospital sector. Over the last years, combined AMR in Gram‐negative bacteria, and especially in K. pneumoniae has increased across Europe. K. pneumoniae predominantly colonises hospitalised individuals and is mainly found in the gastrointestinal tract, skin, oropharynx and upper airways (ECDC, 2017c). The majority of blood stream infections caused by K. pneumoniae are healthcare‐associated and can spread rapidly between colonised or infected patients and via the hands of hospital personnel, leading to nosocomial outbreaks. Of special concern is the increase in combined resistance of K. pneumoniae to 3rd‐ generation cephalosporins, fluoroquinolones and aminoglycosides. This combined resistance is commonly associated with carriage of resistance genes on the same genetic element (Karam et al., 2016).
The increase in combined resistance is worrying, as this leaves few treatment alternatives, among these carbapenems, for patients suffering from infections caused by these bacteria. This may lead to an increased use of carbapenems which is a last‐line group of antibiotics and which in turn contributes to the emergence of carbapenem‐resistant bacteria (Van Boeckel et al., 2014).
Increasing resistance trends have been observed for countries with both low and high resistance levels. Therefore, this secondary indicator would be suitable for all MSs and can be used as an outcome indicator for assessing intervention especially for the hospital sector.
3.3.2.3. General considerations on the proposed secondary indicator
Combined resistance in K. pneumoniae mainly reflects AMR problems in the hospital sector and only constitutes one of several emerging resistance problems. The indicator should therefore not stand alone but be used in combination with indicators reflecting community AMR.
3.3.3. Secondary indicator – proportion of penicillin‐resistant Streptococcus pneumoniae and macrolide‐resistant S. pneumoniae
3.3.3.1. Selected indicators
This secondary indicator is penicillin‐resistant S. pneumoniae and macrolide‐resistant S. pneumoniae measured as [% S. pneumoniae resistant to penicillin, % S. pneumoniae resistant to macrolides] given as two individual numbers.
3.3.3.2. Rationale for selection
Streptococcus pneumoniae is a common cause of community acquired infections, especially among young non‐vaccinated children, elderly people and patients with compromised immune functions. The clinical spectrum includes upper airway infections (sinusitis, otitis media), lower respiratory tract infections (pneumonia) as well as invasive diseases (bloodstream infections and meningitis). S. pneumoniae is the most common cause of pneumonia worldwide with high morbidity and mortality (Cilloniz et al., 2016; ECDC, 2017c).
In Europe, wide variations in the susceptibility S. pneumoniae to penicillins and macrolides have been observed between countries. In general, macrolide non‐susceptibility in S. pneumoniae is, for most countries, higher than penicillin non‐susceptibility. While little variation over time has been noted for penicillin non‐susceptibility, macrolide non‐susceptibility in S. pneumoniae decreased significantly in 8 out of 26 countries between 2012 and 2015. Macrolides are commonly misused in the community for empirical treatment of respiratory tract infections that are often of viral origin. Moreover, decrease in macrolide consumption has been associated with falling resistance rates (Seppala et al., 1997).
Another important issue regarding S. pneumoniae infections and AMR is the effect of vaccination. Most EU/EEA MSs have implemented routine immunisation for children with the multivalent pneumococcal conjugate vaccines (PCVs), and in some instances, they also target adult high‐risk groups, such as the elderly and the immunocompromised, with the polysaccharide vaccine (Pebody et al., 2005; Moreira et al., 2017). It is evident that PCVs has been a powerful tool for combating AMR in S. pneumoniae (Kim et al., 2016; Savulescu et al., 2017).
3.3.3.3. General considerations on the proposed secondary indicator
Differences in clinical breakpoints used for determining penicillin susceptibility in S. pneumoniae, with regard to guidelines used and site of infection, may introduce bias if comparisons between countries are made. At national level the indicator would, however, be a useful tool for monitoring the effect of interventions.
3.3.4. Secondary indicator – proportion of carbapenem‐resistant Klebsiella pneumoniae
3.3.4.1. Selected indicator
This secondary indicator is carbapenem‐resistant K. pneumoniae measured as [% K. pneumoniae resistant to carbapenems].
3.3.4.2. Rationale for selection
This secondary indicator was selected to address an important and increasing problem in the hospital sector in Europe. K. pneumoniae is a common cause of healthcare‐acquired bloodstream infections. Although carbapenem resistance percentages remain low for most countries in 2015, resistance to carbapenems at EU/EEA level increased significantly over the last 4 years, from a population‐weighted mean percentage of 6.2% in 2012 to 8.1% in 2015 (ECDC, 2017c). The vast majority of the carbapenem‐resistant isolates had additional resistance to fluoroquinolones, 3rd‐generation cephalosporins and aminoglycosides.
Very few therapeutic options are left for patients infected with carbapenem‐resistant K. pneumoniae and therapy is often limited to antimicrobials, such as colistin, that may be less effective and/or have more adverse effects. Although data on colistin resistance are not complete in the EARS‐Net surveillance database because countries with high percentages of carbapenem resistance report large numbers of isolates with combined carbapenem and colistin resistance, this is an indication of the further loss of effective treatment options for Gram‐negative bacterial infections.
3.3.4.3. General considerations on the proposed secondary indicator
For countries with very low levels of carbapenem resistance in K. pneumoniae, this indicator may seem less relevant. In such countries, this bacteria/antimicrobial combination should be closely monitored to facilitate early intervention. In countries with increasing levels of carbapenem resistance in K. pneumoniae, monitoring of the effect of interventions is especial important in order to enable timely adjustment of interventions or to inform implementation of additional interventions.
Similar to the secondary indicator on combined resistance in K. pneumoniae, this indicator mainly reflects AMR problems in the hospital sector and only constitutes one of several emerging resistance problems. The indicator should therefore not stand alone but be used in combination with indicators reflecting community AMR.
3.4. Indicators of AMC in food‐producing animals
3.4.1. Primary indicator – overall sales of veterinary antimicrobials (mg/PCU)
3.4.1.1. Selected indicator
Overall sales of veterinary antimicrobials in milligram of active ingredient per kilogram of estimated weight at treatment of livestock and of slaughtered animals in the corresponding year, taking into account the import and export of animals for fattening or slaughter in another MS (mg/PCU).
Overall sales of veterinary antimicrobials are defined by the Anatomical Therapeutic Chemical classification system for veterinary medicinal products (ATCvet) and include:
antimicrobial agents for systemic use (ATCvet codes starting with QJ01);
antimicrobial agents for intestinal use (ATCvet codes: QA07AA, QA07AB);
antimicrobial agents for intrauterine use (ATCvet codes: QG01AA, QG01AE, QG01BA, QG01BE, QG51AA, QG51AG);
antimicrobial agents for intramammary use (ATCvet code: QJ51);
antimicrobial agents for antiparasitic use (ATCvet code: QP51AG), which corresponds solely to sulfonamides.
Sales of veterinary antimicrobials for use in food‐producing animals cover almost all pharmaceutical forms – boluses, injections, intramammary preparations for lactating cows, intramammary preparations for dry cow treatment, intrauterine preparations, oral solutions, oral pastes, oral powders, premixes ‐ with exception of dermatological preparations (ATCvet group QD) and preparations for sensory organs (ATCvet group QS). The contribution from these pharmaceutical forms, in tonnes of active ingredient, to the total amount of veterinary antimicrobials sold is minimal and thus the underestimation of sales is insignificant.
It should be noted that tablets (including capsules) are excluded from the data set used to report sales for food‐producing animals based on the assumption that tablets are used almost solely for companion animals.
Sales data for ionophore coccidiostat feed additives and veterinary medicines containing zinc oxide are not included.
3.4.1.2. Rationale for selection
In accordance with the terms of reference, the indicators should be built wherever possible upon data already collected in order not to create an additional administrative burden for the MSs. Overall sales (mg/PCU) is based on data already collected and therefore causes no extra administrative burden. In several MSs, data are also collected by species but collection of such data requires considerable resources and is not comprehensively available.
When considering the use of the overall sales (mg/PCU), recommendations to reduce the overall use of antimicrobials were taken into account. The CVMP strategy on antimicrobials 2016–2020 (EMA/CVMP, 2016) indicates: ‘It is probable that one of the most effective measures to limit expansion of AMR is an overall reduction in antimicrobial use’. The EMA/EFSA Joint Scientific Opinion on measures to reduce the need to use antimicrobial agents in animal husbandry in the European Union, and the resulting impacts on food safety (RONAFA) (EMA and EFSA, 2017) indicates: ‘Overall, it is reasonable to assume that a reduction in antimicrobial use will result in a general reduction in AMR in bacteria from food‐producing animals and food’. Furthermore, the recently published JIACRA report (ECDC, EFSA and EMA, 2017) indicates that in food‐producing animals a statistically significant negative association was consistently detected between the total consumption of antimicrobials and the occurrence of complete susceptibility, confirming that overall reduction of antimicrobial use is a desirable objective, for which the mg/PC is the most adequate indicator.
Several of the ESVAC participating countries had collected data on consumption of antimicrobials for several years before the ESVAC activity was established in 2009 (Table 7). A total of 27 European MSs provided ESVAC sales data for 2015, thus the coverage of EU countries is very high.
Table 7.
Number of EU/EEA countries delivering data on sales to ESVAC by year
Includes countries with systems in place for several years.
Switzerland included.
The majority of the ESVAC participating countries have reported sales data for several years (Table 7) and it is therefore thought that a stable baseline is established for these countries both in terms of overall sales and sales by classes/subclasses. This implies that the sales data can be used to identify changes (increase/decrease) across years. Considering that sales data are available from almost all EU/EEA countries, the AMC indicators are established for sales data. The change in overall sales (in mg/PCU) is a way to measure the overall effect of actions taken on policy interventions for reducing the use of antimicrobials in the food‐producing animal sector. Large differences in overall sales of veterinary antimicrobials (mg/PCU) between reporting countries have been observed (Appendix E). A substantial decline in the overall sales (in mg/PCU) observed in some countries indicates that there is potential for decrease in other countries also.
3.4.1.3. General considerations on the proposed primary indicator
Some MSs have a long experience in monitoring sales of veterinary antimicrobials, whereas some have only recently started to collect data. It is generally agreed that it takes 3–4 years to establish a valid baseline. Results from countries that are collecting data for the first time or have recently changed their data collection system should thus be interpreted with caution.
The PCU has proven to be stable across the years and suitably robust to describe the animal population at risk of being treated; however, interpretation of the data (mg/PCU) should take into account the distribution of the PCU value between the species in the various countries. All species, both intensively and extensively reared, are included in the PCU with equal weight though the use of antimicrobials in the various animal species and production systems may differ considerably. Therefore, changes in the animal populations should be monitored and analysed for the perspective of the potential effect on the indicator. Also, comparisons between countries should be made with great caution.
The PCU includes information on major food‐producing animal species for which harmonised and standardised data from all MSs was publicly available at the time of the first ESVAC report. Some missing categories have since been identified (e.g. goats) and the need for PCU adjustment is currently under evaluation. The current method used for calculation of PCU has been proven to be stable and any changes to the PCU would have to be applied historically.
Overall sales include all active ingredients with equal weight, although relative activity of substances differs. Decrease in sales of old antimicrobials that usually require higher doses (e.g. tetracyclines) should not be compensated by the use of newer antimicrobials for which lower doses are used (e.g. 3rd‐ and 4th‐generation cephalosporins and fluoroquinolones). Trends in overall sales should therefore be considered together with changes in the sales of especially those antimicrobials of critical importance for human health, e.g. those considered by the WHO9 as critically important antimicrobials of highest priority (HCIA) or those included in category 2 of the AMEG10 classification (see secondary indicators).
Tablets, which are almost solely used for companion animals, are not included in the overall sales (mg/PCU), thus there is an absence of specific data on antimicrobial consumption in companion animals, although use in these species is not insignificant in terms of AMR risks (Pomba et al., 2017).
When monitoring of antimicrobial consumption is based on annual sales collected from MAHs or wholesalers, the time gap between actual sales/use and reporting may in practice be 1–2 years.
3.4.2. Secondary indicators
3.4.2.1. Selected indicators
Three secondary indicators are proposed for critically important antimicrobials (CIA), which are considered as being most relevant for closer follow‐up:
sales of 3rd‐ and 4th‐generation cephalosporins (ATCvet codes QJ01DD, QJ01DE, QJ51DD and QJ51DE) in mg/PCU;
sales of quinolones (ATCvet codes QJ01MA + QJ01MB + QJ01RA96) in mg/PCU, specifying the proportion of fluoroquinolones (ATCvet code QJ01MA);
sales of polymyxins (ATCvet codes QJ01XB, QJ51XB01, QG51AG07 and QA07AA10) in mg/PCU.
3.4.2.2. Rationale for selection
Third‐ and 4th‐generation cephalosporins, quinolones and polymyxins are part of the WHO, OIE, and AMEG lists of antimicrobials of key importance for human health, one of the requests of the Annex of the European Commission mandate (see Section 1.1.2).
A common and widely accepted approach in international and EU strategies for combatting AMR and prudent use recommendations is that CIA should only be used in animals when other preferred options are not effective, and that their use should be reduced to the minimum feasible (EMA/AMEG, 2014). For the time being, common EU‐level reduction targets in veterinary medicine have been recommended for the use of colistin (EMA/AMEG, 2016; EMA and EFSA, 2017). The updated AMEG advice concludes that ‘for the current high and moderate consumers’ the target and desirable levels are set at 5 mg/PCU and 1 or below 1 mg/PCU. Follow up of changes in sales as a secondary indicator is thus essential. Colistin is the antimicrobial substance reported as being currently sold within the class of polymyxins (EMA/ESVAC, 2016).
In the AMEG advice, it is highlighted that the required reduction (of sales of polymyxins) should be obtained without increasing the sales of 3rd‐ and 4th‐generation cephalosporins and/or fluoroquinolones or the overall sales of antimicrobials. Countries that already have a low level of use should try to maintain the favourable situation. Corresponding principles apply to the two other secondary indicators.
The CVMP Strategy on antimicrobials 2016–2020 (EMA/CVMP, 2016) states that ‘Antimicrobials should never be used to compensate for the (negative) impact of (poor) husbandry systems or a lack of biosecurity’. In the EMA and EFSA RONAFA Opinion, it is recommended to establish national targets for reduction of the use of antimicrobials in food‐producing animals, especially CIA (EMA and EFSA, 2017).
3.4.2.3. General considerations on the proposed secondary indicators
Decrease in sales of any of the secondary indicators should not be followed by an increase in the sales of any other secondary indicator or overall sales. As some countries already have a low use of classes/subclasses selected for the secondary indicators, one of the aims should be to maintain the low use of those classes/subclasses.
Special attention should be paid to pharmaceutical forms intended for group treatment.
Due to the different dosage of the substances in these classes or sub‐classes of antimicrobials, secondary indicators should be addressed individually.
Only tablets are excluded from the sales data for food‐producing animals as they are assumed to be used almost solely in companion animals. Thus products, e.g. injectables belonging to 3rd‐generation cephalosporins, marketed for dogs and cats only, are included in sales for food‐producing animals. This might provide an overestimate of sales of 3rd‐ and 4th‐ generation cephalosporins in food‐producing animals and should be taken into account when assessing changes across time.
3.5. Indicators of AMR in food‐producing animals
For the discussion of the suitability of composite indicators for the aims of the European Commission, it is assumed that a complete data set conforming to Decision 2013/652/EU is available for each MS.
3.5.1. Primary indicator – proportion of indicator E. coli from broilers, fattening turkeys, fattening pigs and calves, weighted by PCU, fully susceptible to a predefined panel of antimicrobials
3.5.1.1. Selected indicator
The primary summary indicator consists of the proportion of indicator E. coli isolates from broilers, fattening turkeys, fattening pigs and calves (collected in the framework of Decision 2013/652/EU), weighted by PCU, that are fully susceptible to the entire panel of antimicrobials defined in the Decision.
3.5.1.2. Rationale for selection
For this, as well as for other AMR indicators in food‐producing animals, the choice is made for E. coli as a general reporter organism rather than choosing a zoonotic species or an average of zoonotic species. The rationale for this choice is that plasmid‐mediated AMR genes are considered to be a more significant part of the total resistance that could be transferred from the agricultural sector to human health care than most antimicrobial‐resistant zoonotic pathogens (Hammerum et al., 2014). Therefore, a general and abundant reporter species representing the overall AMR situation is more relevant than less abundant zoonotic species.
The proportion of fully susceptible E. coli isolates can be used as an indicator to assess AMR in relation to ‘total use’ of antimicrobials in agriculture (Queenan et al., 2016; ECDC, EFSA and EMA, 2017). The assumption underlying the choice of this specific indicator is that only E. coli that is rarely, if ever, exposed to antimicrobials will be fully susceptible (Martinez, 2014). Therefore, it is to be expected that a reduction of the use of antimicrobials in food‐producing animals would result in a noticeable improvement of this indicator. The ‘full susceptibility’ indicator can only be applied when data are collected based on use of the same panel of antimicrobials and applying the same cut‐off values (ECOFF) when interpreting the data (Moyaert et al., 2014). Adherence to Decision 2013/652/EU would guarantee this uniformity. Alternatively, a selection of antimicrobials from this panel based on relevance for human healthcare could be considered. In this respect, the panel prescribed by Decision 2013/652/EU already takes human relevance into account, so an alternative may not be appropriate. In accordance with this Decision, it would be most logical to calculate this indicator for E. coli isolated from the most important production animals, e.g. broilers, fattening turkeys, fattening pigs and calves, and to weight the average occurrence for the size of the respective population of each animal species. To compare animals with different body mass, PCU can be applied (Chantziaras et al., 2014).
A major advantage of the full susceptibility indicator is the combination of simplicity and comprehensiveness. Simplicity in the sense that the unit is a simple proportion, and comprehensiveness because all antimicrobials for which an MIC is determined in the framework of Decision 2013/652/EU are taken into consideration. For the reasons listed above and those mentioned in Section 2.2.1.2, a summary indicator such as the proposed primary indicator is considered more appropriate than single or composite indicators.
In the recently published second JIACRA report (ECDC, EFSA and EMA, 2017), the reporting of AMR data at the individual isolate level in the animal domain allowed characterisation of phenotypic profiles of resistance to the harmonised panel of antimicrobial substances tested. This also enabled analysis of complete susceptibility, defined as susceptibility to all of the antimicrobial classes of the harmonised panel tested. In food‐producing animals, a statistically significant negative association was consistently detected between the total consumption of antimicrobials and the occurrence of complete susceptibility. Because of the wide range in total consumption and in the occurrence of full susceptibility in bacteria from food‐producing animals in different MSs, these findings confirm that this parameter might be considered a meaningful epidemiological indicator.
3.5.2. Secondary indicator – proportion of samples positive for presumptive ESBL‐/AmpC‐producing indicator E. coli from broilers, fattening turkeys, fattening pigs and calves, weighted by PCU
3.5.2.1. Selected indicator
A secondary summary indicator consists of the proportion of samples from broilers, fattening turkeys, fattening pigs and calves, weighted by PCU, that are identified as positive for presumptive ESBL‐/AmpC‐producing indicator E. coli in the framework of the specific monitoring for ESBL‐/AmpC‐/carbapenemase‐producing indicator E. coli according to Decision 2013/652/EU.
3.5.2.2. Rationale for selection
One of the most medically relevant forms of AMR is mediated by plasmid‐encoded ESBL genes (EFSA BIOHAZ Panel, 2011; Maslikowska et al., 2016), and there is an ongoing discussion about the contribution of the agricultural sector to β‐lactam resistance problems in hospitals (Valentin et al., 2014). In contrast, the AmpC β‐lactamases in E. coli are often chromosomally encoded and upregulated by overexpression of existing AmpC genes (Handel et al., 2014). Genes for AmpC can also be located on plasmids and transferred between strains. Within the broadly defined ESBL/AmpC‐group, the pathogens resistant to 3rd‐ and 4th‐generation cephalosporins are of particular concern, as these belong to the HCIA list defined by the World Health Organization (WHO, 2017). This indicator is restricted to resistance to 3rd‐ and 4th‐generation cephalosporins and, in contrast to the primary indicator, it is not based on random testing of non‐selectively collected isolates of E. coli. Preliminary analysis of the data from the AMR reports from 2014 and 2015 indicates that this indicator does not necessarily correlate with other types of resistance and with the primary indicator (see Appendix F). It is therefore of a more limited but specific nature than the proposed primary indicator. The many different types of ESBL‐encoding plasmids vary widely in the additional antimicrobials to which they provide resistance (Falagas and Karageorgopoulos, 2009). The AmpC‐mediated resistance extends to a wide variety of cephalosporins and is not inhibited by the regular ESBL inhibitors such as clavulanic acid. This indicator does not distinguish between these.
Resistance to 3rd‐ and 4th‐generation cephalosporins can provide insight on the selection for ESBL‐encoding plasmids due to veterinary antimicrobial usage and on abundance of AmpC‐expressing isolates.
There is a large number of different enzymes that can destroy the β‐lactam ring (Pimenta et al., 2014), with a corresponding variety of genes and plasmids (Chong et al., 2011). The observation that ESBL‐carrying isolates from humans are often more related to chicken isolates than are susceptible isolates indicates that a proportion of ESBL‐ or AmpC‐encoding isolates from agricultural settings may be of importance in human health care situations (Torneke et al., 2015). Plasmids carrying ESBL‐encoding genes can be transferred rapidly between E. coli strains (Handel et al., 2015) and selection can be driven by the use of many β‐lactam antimicrobials (Cavaco et al., 2008).
The proposed secondary indicator is based on the data collected through the specific monitoring on the prevalence of ESBL‐ or AmpC‐producing indicator E. coli among samples collected according to Decision 2013/652/EU. This specific monitoring was introduced following that Decision, and was compulsory by 2015. It is based on the use of selective media containing cefotaxime (1 mg/L) to investigate the presence of cephalosporin‐resistant indicator E. coli in the samples collected. In contrast to testing of randomly selected colonies from non‐selective plates, this procedure is therefore to a certain extent independent of the proportion of cephalosporin‐resistant isolates in the E. coli population of the sample. The resistant isolate will be identified no matter how many susceptible strains of E. coli are present in the sample along with the resistant one. Subsequent phenotypic testing allows classifying isolates collected into presumptive ESBL‐, AmpC‐ and carbapenemase‐producing indicator E. coli. This method is considered to be much more sensitive than the non‐selective culture methods for identifying the presence of these types of E. coli in samples. The indicator is able to estimate the proportion of samples containing presumptive ESBL‐producing indicator E. coli among the samples collected. It thus provides additional information from more sensitive testing to supplement that derived from random testing of E. coli isolates from isolates derived from routine sampling.
3.5.3. Secondary indicator – proportion of indicator E. coli from broilers, fattening turkeys, fattening pigs and calves, weighted by PCU, resistant to at least three antimicrobials from different classes included in a predefined panel of antimicrobials
3.5.3.1. Selected indicator
Another secondary indicator consists of the proportion of indicator E. coli isolates from broilers, fattening turkeys, fattening pigs and calves (collected in the framework of Decision 2013/652/EU), weighted by PCU, that are resistant to at least three antimicrobials from different classes from the predefined panel of antimicrobials.
3.5.3.2. Rationale for selection
Resistance of indicator E. coli from livestock to a single antimicrobial may have limited relevance for human health care if unusual or, for human medicine, less important, antimicrobials are considered. Taking instead resistance to a minimum of three antimicrobials from different classes may to some extent alleviate this problem, as it is unlikely that all three observed antimicrobial resistances are towards unusual, or, for human purposes, irrelevant antimicrobials. Scanning of reports that provide data on the number of antimicrobials to which a bacterial isolate exhibits resistance (MARAN, 2016) suggests a correlation with usage of antimicrobials, indicating that this indicator is also relevant to monitoring the effects of reduced veterinary usage of antimicrobials. There is a strong inverse correlation with the full susceptibility primary indicator (see Appendix F), indicating that resistance to one antimicrobial directly correlates with the likelihood that the isolate will also be resistant to further compounds. This indicator is in particular useful in situations where the percentage of fully susceptible isolates is very low to zero. In those cases, the three‐class resistance indicator can provide better resolution and can help monitoring resistance developments more informatively.
The limitations of this indicator are similar to the full susceptibility indicator. Like the primary indicator, it ignores differences in the relevance of different antimicrobials for public health, and there is no differentiation between three or more resistances. As a result, the scientific information to be derived from this indicator is not immediately obvious, but unexpected deviations can be a reason to initiate further investigations.
3.5.4. Secondary indicator – proportion of indicator E. coli from broilers, fattening turkeys, fattening pigs and calves, weighted by PCU, resistant to ciprofloxacin
3.5.4.1. Selected indicator
The last secondary indicator consists of the proportion of indicator E. coli isolates from broilers, fattening turkeys, fattening pigs and calves (collected in the framework of Decision 2013/652/EU), weighted by PCU, that are microbiologically resistant to ciprofloxacin.
3.5.4.2. Rationale for selection
Ciprofloxacin is on the WHO list of highest priority CIAs for human medicine. Fluoroquinolones are often used to treat invasive infections in humans. Microbiological resistance against fluoroquinolones results largely from chromosomal mutations, although plasmid‐mediated resistance can also occur, and develops rapidly upon exposure to non‐lethal concentrations (Handel et al., 2014) and is often observed in human and veterinary isolates. Fluoroquinolone resistance correlates well and consistently with usage, so it is a suitable indicator for monitoring the outcome of reduced application (ECDC, EFSA and EMA, 2017). Some MSs encounter high levels of fluoroquinolone resistance and are taking measures to reduce usage. The indicator will be useful in assessing the results of any program to reduce veterinary fluoroquinolone application.
This indicator represents microbiological resistance against fluoroquinolones and resistance to quinolones.
3.5.5. General considerations on the proposed primary and secondary indicators of AMR in food‐producing animals
The combination of the single primary and three secondary indicators in food‐producing animals described above is recommended because it covers the most important aspects of AMR in animal production that are relevant for human health:
The primary indicator is related to the overall selection pressure exerted by agricultural usage of antimicrobials (Economou and Gousia, 2015).
The first secondary indicator has direct relevance for human medicine as it reflects the presence of E. coli resistant to 3rd‐ and 4th‐generation cephalosporins in the tested animal populations rather than within the E. coli population of these animals. This indicator is therefore a more sensitive indicator for the extent of resistance to this group of antimicrobials than the result of the random testing of the collected E. coli isolates. 3rd‐ and 4th‐generation cephalosporins are a prioritised critically important antimicrobial class in human medicine.
The second secondary indicator, resistance to antimicrobials of three or more different classes, is informative in situations where levels of resistance are so high that there are few to no isolates displaying full susceptibility to the set of antimicrobials included in the calculation and therefore neither improvements nor a further aggravated situation would be reflected by the primary indicator.
The third secondary indicator reflects microbiological resistance to fluoroquinolones and resistance to quinolones. Resistance to this group of antimicrobials is primarily driven by the use of these antimicrobials as recently shown in the second JIACRA report (ECDC, EFSA and EMA, 2017) and hence progress in this indicator can be expected if the use of this class of substances is limited in animal production.
Together, this set of indicators provides an overview of the AMR selection pressure exerted by veterinary usage of antimicrobials on bacteria that may be transmitted to humans via the food chain or other routes of exposure.
Initially three other values were considered as primary or secondary indicators:
average proportion of indicator E. coli from broilers, fattening turkeys, fattening pigs and calves (collected in the framework of Decision 2013/652/EU), weighted by PCU, that are resistant to the antimicrobials included in the panel of antimicrobials defined in the Decision;
proportion of Campylobacter spp. from broilers, fattening turkeys, fattening pigs and calves (collected in the framework of Decision 2013/652/EU), weighted by PCU, that are resistant to erythromycin;
proportion of indicator E. coli from broilers, fattening turkeys, fattening pigs and calves (collected in the framework of Decision 2013/652/EU), weighted by PCU, that are resistant to colistin.
When available MS data on AMR over 2014 and 2015 were used to calculate potential indicators, the selected primary indicator (i.e. proportion of fully susceptible indicator E. coli) and the average percentage indicator correlated very strongly (see Appendix F). This strong correlation indicated that both indicators give a similar output measure, when calculated with 2014 and 2015 data. Therefore, calculating both is expected to provide limited additional value, even though on theoretical grounds they could be expected to furnish different types of information if the future underlying resistance situation varies.
In contrast, the first secondary indicator on 3rd‐ and 4th‐generation cephalosporins showed a much weaker correlation to the chosen primary indicator. The likely basis of the limited relatedness is that the generation of this indicator reflects a substantially different diagnostic approach. It does not reflect AMR in a set of randomly chosen E. coli isolates but the mere presence of resistant isolates in the populations. The process of selective isolation increases the probability of detection for such a resistant isolate in a disproportionate way as its detection does not show how many other E. coli from the population were suppressed by the isolation procedure.
The graphs of correlation between selected indicators (Appendix F.4), including, for example, between average susceptibility and full susceptibility as well as between multiresistant E. coli and full susceptibility, may suggest that certain indicators might be considered as directly equivalent. The ranges of the selected indicators, their temporal progression, their possible differences in responsiveness to changes in selective pressure and whether the correlation holds over the entire range of observed values may be important features which cannot be thoroughly evaluated at this stage using available field data.
Another secondary indicator considered was the proportion of C. jejuni isolated from broilers and fattening turkeys, resistant to erythromycin, weighted for PCU. The rationale for this indicator is that macrolides are considered within the WHO HCIA list (WHO, 2017). They are not included in the panel to be tested with respect to commensal E. coli according to Decision 2013/652/EU because E. coli is intrinsically resistant to macrolides such as erythromycin and intrinsic resistance to more advanced macrolides such as azithromycin is variable. Erythromycin is primarily directed against other groups of bacteria, such as gram positives, Mycoplasma spp. and Campylobacter spp. Unfortunately, only the testing of C. jejuni from broilers is mandatory for all MSs according to Decision 2013/652/EC leaving this the only database available for calculation in all MSs. It would be useful to also include C. coli from poultry and pigs, as this has been found to be resistant to erythromycin more frequently than C. jejuni. This would, however, mean building upon a database that varies not only between MSs, but also presumably between years. For example, resistance of C. coli from pigs in 2015 was only reported from nine countries (seven MSs and two non‐MSs). Resistance of C. jejuni from turkeys was likewise only reported from ten countries in 2014. Resistance of C. coli from broilers was only reported by eight MSs in 2014.
In summary, this conceivable indicator has only a very small and possibly unrepresentative database and may therefore shift more frequently as a consequence of changes in the underlying data than other indicators, which needs to be considered when interpreting changes of the value of the indicator. Data from those MSs where data for C. jejuni in broilers are available over longer timelines indicate that the change so far has been minimal between years. For these reasons a meaningful analysis of macrolide resistance in animal populations would require mandatory inclusion of further bacterial species in the AMR monitoring.
Finally, it was considered to include a secondary indicator consisting of the percentage of indicator E. coli resistant to colistin. Colistin resistance is considered to have a high impact on public health, particularly following the increasing report of transferable colistin resistance encoded by mcr genes in human and food‐producing animal isolates worldwide. For this reason, polymyxins are categorised by AMEG in category 2 and has been recently included in the list of highest priority CIA by WHO (2017), and recommendations for reduction of its use in food‐producing animals have been made (EMA/AMEG, 2016). According to the second JIACRA report, statistically significant positive associations were observed between polymyxin consumption in food‐producing animals and the corresponding resistance in indicator E. coli from food‐producing animals, from poultry and from pigs, even though the occurrence of resistance to polymyxins in animals is typically low (ECDC, EFSA and EMA, 2017). Moreover, the reported occurrence of colistin resistance is unlikely to equate directly to the occurrence of mcr genes, because a number of different resistance mechanisms can confer colistin resistance (EMA/AMEG, 2016). For these reasons, and taking into consideration the limitation in the number of indicators to be proposed, it was decided to discard for the time being the indicator of resistance, given that the indicator of consumption in food‐producing animals is included among the indicators of consumption (see Section 3.4).
All the proposed indicators represent a simplified assessment of the very complex AMR situation in agriculture (Tripathi and Cytryn, 2017). Extreme care must be applied when analysing trends in these indicators over time and correlating these to AMR related policies. Analysis of the underlying data will always be needed when noteworthy deviations from the expected values are observed. There are several limitations to the use of indicators. For example, resistance to different antimicrobials is given the same weight, regardless of the clinical relevance of the particular resistance for human health care. Shifts in resistance from one class of antimicrobials to another will not be noticeable, even though such a shift may be very relevant from a human health care point of view. The primary indicator may not always be a good measure for overall selective pressure that is exerted by the veterinary use of antimicrobials on resistance of pathogens of importance to human health (EMA/AMEG, 2016; ter Kuile et al., 2016), because isolates with resistance against one or two antimicrobials are counted in the same way as those with resistance against several. Even pan‐resistance carries the same weight as a single resistance. None of the indicators proposed above is suitable to monitor the effects of very specific measures aiming to intervene in a single animal species or production sector. In such cases, the relevant single indicators must be utilised. Similarly, for specific AMR‐related issues that arise from time to time, such as resistance to colistin or to carbapenems, specific monitoring will have to be undertaken (Crofts et al., 2017).
Improvements to the antimicrobial prescribing and medication systems on farms might lessen the selection for resistance considerably (Lam et al., 2017). While the AMR indicators aim to provide insights in the actual occurrence of AMR, they are not designed to provide information about the underlying dynamics influencing selection for such resistance. For a more detailed analysis of the causes for the AMR encountered in the agricultural sector, an in‐depth breakdown to the level of individual drug–microbe combinations by animal species and production sector will always be needed. When communicating about the state of AMR with the aid of indicators these limitations must be kept in mind.
Due to the unavoidable loss of information that occurs when indicators are used to summarise large data sets (Buyle et al., 2013), the stated aim of the European Commission to obtain ‘comprehensive and reliable information on the development and spread of drug‐resistant bacteria’ cannot be realised in full. It will only be partly feasible to monitor the impact of measures taken to reduce AMR and to assess progress using indicators. For more detailed insight in the AMR situation the underlying data and available relevant data should be analysed.
3.6. Use of the proposed indicators
3.6.1. Combined use of indicators
The indicators proposed above for the different sectors should provide an overall indication of the situation regarding AMC and AMR at national level, and should support MSs in assessing their progress and the effectiveness of measures implemented to reduce AMC and the occurrence of AMR in both humans and food‐producing animals.
The analysis of the indicators should always consider the limitations outlined in this document and therefore changes in such indicators should ideally trigger more detailed analysis of the underlying data to avoid misinterpretation of any changes.
Previous interagency work has highlighted important associations between different indicators of AMC and AMR on the veterinary and human side. Therefore, changes in the relationship between indicators that appear to be inconsistent with previous observations should prompt in‐depth analysis of the underlying data.
Comparison of the progress in the different sectors in a ‘One Health’ perspective, e.g. comparing the changes in antimicrobial consumption and the occurrence of AMR in humans or in food‐producing animals, needs to be carried out with caution, given the differences in the data collected and the loss of detail resulting from the combination of data into indicators.
Information provided using the indicators in the different sectors may be analysed in combination. Changes observed in some indicators may be associated with changes in other indicators:
In humans, the primary indicator of AMC (total antimicrobial use) may be used together with both primary and secondary indicators of AMR. The use of antimicrobials together with the dissemination of resistant bacteria or resistance determinants are the most significant drivers of antimicrobial resistance for both Gram‐positive and Gram‐negative bacteria. The total antimicrobial use is therefore likely to be directly associated with primary and secondary AMR indicators.
Although total AMC may influence the burden of AMR, quality AMC indicators for both community and hospital (secondary AMC indicators) may show better correlation with specific AMR indicators in the community and in the hospital setting. For example, an AMC secondary indicator for hospital use may correlate better with general or specific AMR indicators for hospital sector.
In food‐producing animals, the primary indicator of AMC is overall sales (in mg/PCU) which can be analysed in combination with the primary indicator of AMR in food‐producing animals (full susceptibility of indicator E. coli). The amount of antimicrobial use in animals is one of the main drivers of reduced susceptibility in bacterial isolates from animals. The proportion of fully susceptible indicator E. coli isolated from animals can be associated with the amount of the total antimicrobial consumption. As mentioned earlier in this opinion, this has been addressed in the recent second JIACRA report, where complete susceptibility of E. coli in food‐producing animals was found to be associated to the total AMC in food‐producing animals (ECDC, EFSA and EMA, 2017). Odds ratio estimates obtained were consistent in both 2013 and 2014–2015, indicating that an increase in total AMC of 10 mg/kg of estimated biomass and per year resulted in an increase by 10% of the probability of detecting indicator E. coli (microbiologically) resistant to at least one of the substances tested.
Similarly, selected secondary indicators for AMC and AMR in animals may be analysed in combination. Antimicrobial consumption of fluoroquinolones and 3rd‐/4th‐generation cephalosporins may be associated with the following AMR indicators: proportion of indicator E. coli resistant to ciprofloxacin, and proportion of samples positive for presumptive ESBL/AmpC‐producing indicator E. coli, respectively. According to the results of the second JIACRA report, consumption of fluoroquinolones and other quinolones in food‐producing animals was significantly correlated with the probability of resistance to fluoroquinolones in E. coli from food‐producing animals (ECDC, EFSA and EMA, 2017). In contrast, overall (E. coli, Salmonella spp. and Campylobacter spp.), no association was observed (with a few exceptions) between consumption of and resistance to 3rd‐ and 4th‐generation cephalosporins. However, for 2014–2015, there was a significant association between AMC and AMR of 3rd‐ and 4th‐generation cephalosporins in indicator E. coli.
Combined analysis of outcome indicators in humans and food‐producing animals is more complicated. Primary AMC indicators in humans and animals reflect antimicrobial consumption practices in humans and animals, which may or may not be correlated within a MS. Similarly, AMR indicators show the burden of AMR in humans and food‐producing animals, but direct comparison of AMR indicators in humans and AMR or AMC indicators in food‐producing animals is difficult. The only common bacterium used in AMR indicators is pathogenic E. coli in humans (indicator on 3GCR E. coli) and indicator E. coli in food‐producing animals (indicator on ESBL‐/AmpC‐producing indicator E. coli and indicator on full susceptibility). E. coli from blood stream infections in humans are, however, highly preselected and may therefore not be appropriate to be compared with indicator E. coli from the healthy food animal population. In line with the above observation, the second JIACRA report has shown that AMR in zoonotic bacteria (Salmonella spp. and Campylobacter spp.), but not in E. coli, in humans, is correlated to AMR and AMC in food‐producing animals (ECDC, EFSA and EMA, 2017).
3.6.2. Future analysis of indicators to follow trends of AMC and AMR in individual countries
The proposed indicators have been selected in order to facilitate both the estimation of parameters at MS level (e.g. drawing conclusions from a sample of food‐producing animals tested) and the statistical comparisons of the situation over time within the same country.
The point estimates provided by the indicator calculation must be supplemented, as appropriate, with the calculation of appropriate measures of uncertainty (standard errors): in this way, interval estimation (in terms of confidence intervals) and hypothesis testing will be possible. For instance, Appendix F.3 illustrates an example on a methodology that can be used to take this into account when calculating the proposed AMR indicators in food‐producing animals. As previously discussed (see Section 2.2.1.2), indicators represent a simplification of the real situation, with an unavoidable loss of information when compared with the raw data from which they have been derived.
When indicators are used to evaluate the effectiveness of any intervention at individual MS level, and therefore comparisons over time are made, appropriate statistical techniques must be applied to account for possible confounding effects, since the comparison of point estimates and of crude indicators may lead to biased conclusions. As an example, when comparing AMR indicators in food‐producing animals over time, the potential for confounding associated with animal species has to be accounted for, since, even over few years, the relative distribution of species may change, thereby possibly affecting the weighted averages. In such a case, the confounding effect may be successfully adjusted by using conventional techniques such as direct standardisation or regression models. This should also be done when using the indicators to compare the situation between MSs, which was not requested within this mandate, because of, for example, variance in the demography of the different animals populations in the different countries.
4. Conclusions
-
In the context of this opinion, four main sectors for indicators have been identified. These are:
-
☐
AMC in humans;
-
☐
AMR in humans;
-
☐
AMC in food‐producing animals;
-
☐
AMR in food‐producing animals.
-
☐
The indicators for all the above four topics combine information on several aspects of each of these.
The proposed indicators should allow MSs to assess the progress achieved through their actions against AMR and could also serve as tools for setting targets to decrease risks of AMR.
The indicators for AMC reflect the consequence of human decisions (i.e. about treatments, antimicrobials used, route of administration and dosage).
In contrast, the indicators for AMR reflect consequences of these decisions and their interaction with a multitude of other factors. Indicators for AMR are more difficult to interpret and to influence.
Shifts in consumption and resistance from one class of antimicrobial to another may not be noticeable, even though such a shift may be very relevant in a public health perspective. In addition, specific AMR‐related issues may arise, for which targeted monitoring will have to be undertaken, such as resistance to colistin or carbapenems.
Ideally, AMC in animals would be monitored by species allowing for a more detailed analysis of the data, including the use of DDD for animals (DDDvet). A few EU/EEA countries are developing such schemes but due to the considerable resources required such data are not currently widely available.
4.1. Indicators of AMC in humans
The following indicators of AMC in humans are suggested:
-
Primary indicator:
-
☐
Consumption of antibacterials for systemic use, expressed as DDD per 1,000 inhabitants and per day.
-
☐
-
Secondary indicators:
-
☐
Ratio of consumption of broad‐spectrum penicillins, cephalosporins, macrolides and fluoroquinolones to the consumption of narrow‐spectrum penicillins, cephalosporins and macrolides.
-
☐
Proportion of total hospital AMC that are glycopeptides, 3rd‐ and 4th‐generation cephalosporins, monobactams, carbapenems, fluoroquinolones, polymyxins, piperacillin and enzyme inhibitors, linezolid, tedizolid and daptomycin (DDD per 1,000 inhabitants and per day).
-
☐
4.2. Indicators of AMR in humans
The following indicators of AMR in humans are suggested:
-
Primary indicator:
-
☐
Proportion of MRSA and proportion of E. coli resistant to 3rd‐generation cephalosporins.
-
☐
-
Secondary indicators:
-
☐
Proportion of K. pneumoniae isolates with combined resistance to aminoglycosides, fluoroquinolones and 3rd‐generation cephalosporins.
-
☐
Proportion of S. pneumoniae resistant to penicillins and proportion of S. pneumoniae resistant to macrolides.
-
☐
Proportion of K. pneumoniae resistant to carbapenems.
-
☐
4.3. Indicators of AMC in food‐producing animals
The following indicators of AMC in food‐producing animals are suggested:
-
Primary indicator:
-
☐
Overall sales of veterinary antimicrobials in milligram of active ingredient per kilogram of estimated weight at treatment of livestock and of slaughtered animals in the corresponding year, taking into account the import and export of animals for fattening or slaughter in another MS (mg/PCU).
-
☐
-
Secondary indicators:
-
☐
Sales of 3rd‐ and 4th‐generation cephalosporins in mg/PCU.
-
☐
Sales of quinolones in mg/PCU, specifying the proportion of fluoroquinolones.
-
☐
Sales of polymyxins in mg/PCU.
-
☐
4.4. Indicators of AMR in food‐producing animals
The following indicators of AMR in food‐producing animals are suggested:
-
Primary indicator:
-
☐
Proportion of indicator E. coli isolates from broilers, fattening turkeys, fattening pigs and calves (collected in the framework of Decision 2013/652/EU), weighted by PCU, that are fully susceptible to the predefined panel of antimicrobials defined in the Decision.
-
☐
-
Secondary indicators:
-
☐
Proportion of samples from broilers, fattening turkeys, fattening pigs and calves, weighted by PCU, that are identified as positive for presumptive ESBL‐/AmpC‐producing indicator E. coli in the framework of the specific monitoring for ESBL‐/AmpC‐/carbapenemase‐producing indicator E. coli according to Decision 2013/652/EU.
-
☐
Proportion of indicator E. coli isolates from broilers, fattening turkeys, fattening pigs and calves (collected in the framework of Decision 2013/652/EU), weighted by PCU, that are resistant to at least three antimicrobials from different classes from the predefined panel of antimicrobials.
-
☐
Proportion of indicator E. coli isolates from broilers, fattening turkeys, fattening pigs and calves (collected in the framework of Decision 2013/652/EU), weighted by PCU, that are microbiologically resistant to ciprofloxacin.
-
☐
4.5. Limitations of the proposed indicators
The use of indicators to summarise large data sets inevitably leads to a loss of information and detail. This is because the analysis and use of the proposed indicators may lead to a simplified representation of the very complex AMR situation in both the human and animal sectors.
The selection of the indicators was based on available data and therefore no full coverage of all AMC and AMR issues in the different sectors has been achieved.
These indicators should therefore be interpreted with caution, particularly when attempting to correlate these with AMC‐ and AMR‐related policies. The indicators proposed are often not suitable to monitor the effects of targeted interventions in a specific sector, such as for example in a single animal species or animal production sector. In such cases, the relevant single indicators must be analysed.
5. Recommendations
The proposed indicators have been selected on the basis of data and scientific evidence available at the time of publication. The chosen indicators should be reconsidered at least every five years to evaluate whether they still reflect the data available, the most urgent AMR issues and the latest surveillance methodologies, or if they can be supplemented or replaced by more relevant ones.
Data on resistance to single antimicrobial classes in specific bacteria, as provided by ECDC and EFSA annual reports, should be monitored on a continuous basis in order to follow current AMR issues, evaluate the effectiveness of specific measures and identify newly arising AMR threats to public health as early as possible.
Apart from when proposed indicators are single indicators (i.e. human AMR indicators on MRSA and E. coli resistant to 3rd‐generation cephalosporins), management decisions should never be based on these indicators alone but should take into account the underlying data and their analysis.
The point estimates provided by the indicator calculation must be supplemented, as appropriate, with the calculation of appropriate measures of uncertainty (standard errors): in this way, interval estimation (in terms of confidence intervals) and hypothesis testing will be possible.
When indicators are used to evaluate the effectiveness of any national intervention, and therefore comparisons in time are made, care has to be taken and appropriate statistical techniques applied to account for possible confounding effects, such as changes in the relative distribution of animal species over time.
In order to allow for a better evaluation of the joint evolution of the AMC and AMR situation in both the human and food‐producing animal sectors, indicators in the different sectors should be analysed together within a MS.
Data on AMC in animals should, in the future, be collected at farm level and according to different production systems. Analysis should take into account differences in dosing between species and substances, e.g. using the DDDvet system.
In order to obtain information on resistance to macrolides in bacteria from livestock species, more data at the EU level on resistance to this class of antimicrobials in Campylobacter spp. and indicator species such as enterococci should be collected.
Abbreviations
- 3GC
3rd‐generation cephalosporin
- AG
aminoglycosides
- AMC
antimicrobial consumption
- AMEG
Antimicrobial Advice Ad Hoc Expert Group
- AMR
antimicrobial resistance
- AST
antimicrobial susceptibility testing
- ATC
anatomical therapeutic chemical classification of medicines
- ATCvet
system for classification of veterinary medicines based on the same overall principles as the ATC system for substances used in human medicine
- AWP
Antimicrobials Working Party
- BIOHAZ
EFSA Panel on Biological Hazards
- CIA
critically important antimicrobial
- CRKP
carbapenem‐resistant Klebsiella pneumoniae
- CLSI
Clinical and Laboratory Standards Institute (USA)
- CVMP
Committee for Medicinal Products for Veterinary Use
- DDD
defined daily doses
- DDDvet
defined daily dose for animals
- EAG
Expert advisory group
- EARS‐Net
European Antimicrobial Resistance Surveillance Network
- ECDC
European Centre for Disease Prevention and Control
- ECOFF
Epidemiological cut‐off values
- EEA
European Economic Area
- EFSA
European Food Safety Authority
- EMA
European Medicines Agency
- ESAC‐Net
European Surveillance of Antimicrobial Consumption Network
- ESBL
Extended spectrum β‐lactamase
- ESVAC
European Surveillance of Veterinary Antimicrobial Consumption
- EUCAST
European Union Committee for Antimicrobial Susceptibility Testing
- EUSR‐AMR
EU Summary Report on AMR in zoonotic and indicator bacteria from humans, animals and food
- FQ
fluoroquinolones
- FWD‐Net
Food‐and‐Waterborne Diseases and Zoonoses Network
- HAI
Healthcare‐Associated infections
- HAI‐Net
Healthcare‐Associated Infections Surveillance Network
- HCIA
critically important antimicrobials of highest priority
- ICU
intensive care unit
- JIACRA
Joint Interagency Antimicrobial Consumption and Resistance Analysis
- KP
Klebsiella pneumoniae
- MAHs
Marketing authorisation holders
- MCDA
Multi Criteria Decision Analysis
- Mcr
colistin resistance gene(s)
- MIC
minimum inhibitory concentration
- MRSA
meticillin‐resistant Staphylococcus aureus
- MRSP
macrolide‐resistant Streptococcus pneumoniae
- MS
Member State(s)
- NPHRL
National Public Health Reference Laboratories
- OIE
World Organisation for Animal Health
- PCU
population correction unit
- PCVs
pneumococcal conjugate vaccines
- PRSP
penicillin‐resistant Streptococcus pneumoniae
- PSUR
periodic Safety Update Reports
- RS
Ranking score
- SPC
Summary of Product Characteristics
- STEC
Shiga toxin‐producing Escherichia coli
- VMP
Veterinary Medicinal Products
- WG
Working group
- WHO
World Health Organization
Appendix A – Panel of antimicrobial substances tested for indicator E. coli isolates from food‐producing animals and meat thereof
1.
Indicator Escherichia coli isolates collected through samples from food‐producing animals (caecal samples from broilers, fattening turkeys, fattening pigs, calves under one year of age) and meat (retail meat from broilers, pigs, calves under one year of age), under the AMR monitoring established by Decision 2013/652/EU, should be submitted to susceptibility testing with the panel of antimicrobial substances reported in Table A.1 below (‘first panel’). Presumptive ESBL‐, AmpC‐ or carbapenemase‐producing E. coli identified through testing with the first panel should be tested with the additional panel reported in Table A.2 below (‘second panel’). More details on respective clinical breakpoints and range of concentrations tested, and on similar tables for Salmonella spp., Enterococcus faecalis and Enterococcus faecium are reported in legislation.
Table A.1.
First panel for susceptibility testing of E. coli isolates in food‐producing animals and food according to Decision 2013/652/EU
| Antimicrobial | ECOFF (mg/L) |
|---|---|
| Ampicillin | > 8 |
| Cefotaxime | > 0.25 |
| Ceftazidime | > 0.5 |
| Meropenem | > 0.125 |
| Nalidixic acid | > 16 |
| Ciprofloxacin | > 0.064 |
| Tetracycline | > 8 |
| Colistin | > 2 |
| Gentamicin | > 2 |
| Trimethoprim | > 2 |
| Sulfamethoxazole | > 64 |
| Chloramphenicol | > 16 |
| Azithromycin | NA |
| Tigecycline | > 1 |
ECOFF: epidemiological cut‐off values.
Table A.2.
Second panel for susceptibility testing of E. coli isolates in food‐producing animals and food according to Decision 2013/652/EU
| Antimicrobial | ECOFF (mg/L) |
|---|---|
| Cefoxitin | > 8 |
| Cefepime | > 0.125 |
| Cefotaxime + 4 mg/L clavulanic acid | NAa |
| Ceftazidime + 4 mg/L clavulanic acid | NAa |
| Meropenem | > 0.125 |
| Temocillin | NA |
| Imipenem | > 0.5 |
| Ertapenem | > 0.06 |
| Cefotaxime | > 0.25 |
| Ceftazidime | > 0.5 |
ECOFF: epidemiological cut‐off values.
The values shall be compared to the values of cefotaxime and ceftazidime and interpreted according to CLSI or EUCAST guidelines regarding synergy testing.
Appendix B – Methodology for PCU calculation of produced animals per country
1.
Animal data used for calculation of proportion of resistance in food‐producing animals were not directly extracted from the European Surveillance of Veterinary Antimicrobial Consumption (ESVAC) activity, where animal data are presented as population correction unit (PCU). Taking into account that ESVAC PCU aggregates slaughtered, live and trade data per major animal groups – cattle, pigs, poultry, sheep and goats – no specific values per each subgroup included could have been separated, therefore additional calculations were necessary for the estimation of the population for those species which are applicable for the calculation of indicators of AMR in food‐producing animals. Modifications of PCU were introduced for calculating biomass of young cattle, turkeys and broilers. Amendments were introduced in order to correspond to the animal groups for which resistance data were collected.
Harmonised approaches were applied in order to calculate the proportion of resistance in each European country among largest groups of animals – young cattle, pigs and turkey, broilers – where the number of slaughtered animals is combined with the import and export values, where possible.
It should be noted that reference data were gathered from two official databases:
Eurostat (as available via http://ec.europa.eu/eurostat/data/database – slaughtering in slaughterhouses – annual data [apro_mt_pann]) and
TRACES (number of animals was requested directly from the TRACES database).
Values provided in the further examples were valid on 22 March 2017, when data were assembled from the above mentioned data sources.
For the calculation of animal biomass, the average weight at treatment for each animal category was applied, as established by M.H.M.M. Monforts (Environmental risk assessment for veterinary medicinal products, RIVM report 601300 001, April 1999).
B.1. Young cattle
AMR resistance data were not collected from all cattle subgroups, but only young animals were tested, subsequently the whole PCU for cattle, as available at ESVAC, cannot be used for further calculation of proportion of resistance among young cattle.
In order to present a corresponding denominator, the subcategory ‘young cattle’ was extracted from the PCU data representing all cattle biomass. The young cattle subcategory includes the number of slaughtered calves and young cattle per country, as available in the Eurostat database.
Biomass of ‘young cattle’ represents the number of slaughtered calves and young cattle at age of less than 1 year multiplied by the average weight at treatment (140 kg).
Calculation of biomass of slaughtered calves and young cattle per country:
B.2. Fattening pigs
Since no age or weight of the pigs were specified when samples for testing the AMR were collected, the outcome can present resistance among pigs at any life cycle stage, age and/or weight. Therefore, the estimated biomass of pigs was taken directly using the approach by ESVAC, which includes the following porcine subcategories and average weights at treatment (Table B.1).
Table B.1.
Animal subcategories, average weights at treatment and reference data source for the calculation of the estimated biomass of fattening pigs
| Animal subcategory | Average weight at treatment | Reference data source |
|---|---|---|
| Slaughtered pigs | 65 kg | Eurostat, number of animals (pigmeat) [apro_mt_pann] |
| Import slaughter | 65 kg | TRACES, number of animals (CN code: 0103) |
| Export slaughter | 65 kg | TRACES, number of animals (CN code: 0103) |
| Export fatteners | 25 kg | TRACES, number of animals (CN code: 0103) |
| Import fatteners | 25 kg | TRACES, number of animals (CN code: 0103) |
| Living sows | 240 kg | Eurostat, number of animals (breeding sows) [apro_mt_lspig] |
The estimated biomass of pigs is estimated by multiplying together (for each pig type) the number of pigs and the average weight of the pig at treatment. These are summed across the different pig types. An adjustment for imported pigs is made as they are already included in the category ‘slaughtered pigs’.
Calculation of estimated biomass of pigs per country:
B.3. Poultry
In the ESVAC, PCU calculation for poultry estimated biomass includes aggregated values of broilers and turkeys; therefore, it was agreed that for calculation of proportion of resistance among turkeys and broilers estimated biomass should be provided separately, as AMR resistance samples were taken individually for these groups.
List of reference data used for calculation estimated biomass and average weights at treatment are highlighted in Table B.2.
Table B.2.
Subcategories, average weights at treatment and reference data source for the calculation of the estimated biomass of poultry
| Poultry subcategory | Average weight at treatment | Reference data source |
|---|---|---|
| Slaughtered broilers | 1 kg | Eurostat, number of animals (chicken) [apro_mt_pann] |
| Import slaughter broilers | 1 kg | TRACES, number of animals (CN code: 0105 94 00) |
| Export slaughter broilers | 1 kg | TRACES, number of animals (CN code: 0105 94 00) |
| Slaughtered turkeys | 6.5 kg | Eurostat, number of animals (turkey) [apro_mt_pann] |
| Import slaughter turkeys | 6.5 kg | TRACES, number of animals (CN code: 0105 99 30) |
| Export slaughter turkeys | 6.5 kg | TRACES, number of animals (CN code: 0105 99 30) |
B.4. Broilers
In order to calculate the estimated biomass of broilers, not only the number of slaughtered broilers was taken into account, but also import and export values provided by TRACES.
It should be noted that currently ESVAC PCU does not include import and export values for slaughtered broilers reported by country.
Calculation of estimated biomass of broilers per country:
B.5. Fattening turkeys
For the calculation of the estimated biomass of turkeys per country, the number of slaughtered turkeys and additional values on import and export of slaughtered turkeys were taken into account, with application of average weight of 6.5 kg.
It should be noted that currently ESVAC PCU does not include import and export values for slaughtered turkeys reported by country.
Calculation of estimated biomass of turkeys per country:
Appendix C – Example of calculation of indicators for AMC in humans
C.1. Primary indicator: total consumption of antibacterials for systemic use, expressed in DDD per 1,000 inhabitants and per day, ESAC‐Net data 2015
Figure C.1.
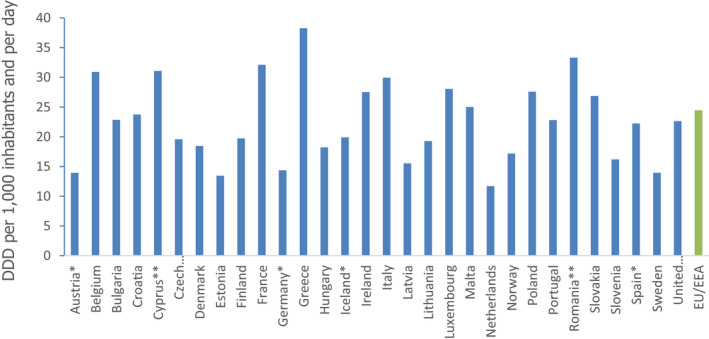
Primary indicator: total consumption in humans of antibacterials for systemic use (ATC group J01), expressed in DDD per 1,000 inhabitants and per day (source: ESAC‐Net data) 2015
-
*: Country reported only community data.**: Country reported total care data (aggregated data for both sectors).EU/EEA: EU/EEA population‐weighted mean consumption.
C.2. Secondary indicator: ratio of the community antimicrobial consumption of broad‐spectrum penicillins, cephalosporins, macrolides and fluoroquinolones, macrolides other than erythromycin to the consumption of narrow‐spectrum penicillins, cephalosporins and erythromycin
Figure C.2.
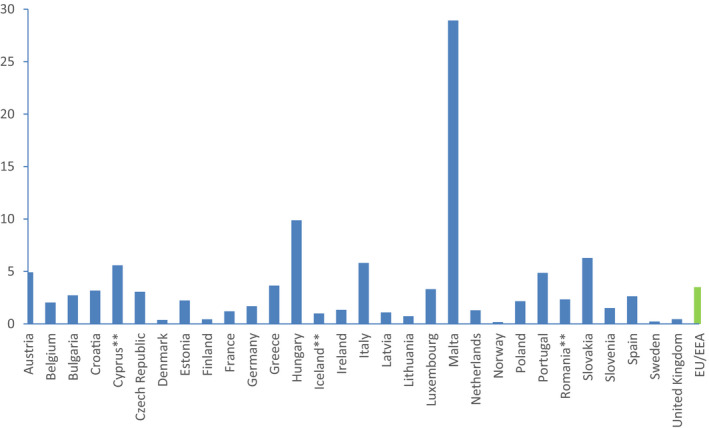
Ratio of the community antimicrobial consumption in humans expressed as DDD per 1,000 inhabitants and per day of broad‐spectrum penicillins, cephalosporins, macrolides and fluoroquinolones, macrolides other than erythromycin (J01(CR+DC+DD+(F‐FA01)+MA)) to the consumption of narrow‐spectrum penicillins, cephalosporins and erythromycin (J01(CA+CE+CF+DB+FA01))
-
*: Country reported total care data (aggregated data for both sectors).EU/EEA: EU/EEA population‐weighted mean consumption.
C.3. Secondary indicator: hospital consumption of glycopeptides, 3rd‐ and 4th‐generation cephalosporins, monobactams, carbapenems, fluoroquinolones, polymyxins, piperacillin and enzyme inhibitor, linezolid, tedizolid and daptomycin (DDD per 1,000 inhabitants and per day)
Figure C.3.
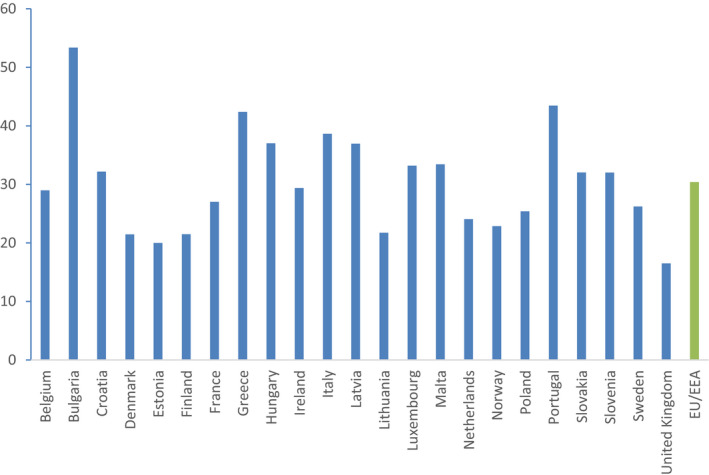
Secondary indicator: Proportion of total hospital AMC that are glycopeptides, 3rd‐ and 4th‐generation cephalosporins, monobactams, carbapenems, fluoroquinolones, polymyxins, piperacillin and enzyme inhibitor, linezolid, tedizolid and daptomycin (DDD per 1,000 inhabitants and per day) (ESAC‐Net, 2015)
Appendix D – Example of calculation of indicators for AMR in humans
D.1. Primary indicator: proportion of meticillin‐resistant Staphylococcus aureus (MRSA) and 3rd‐generation cephalosporin‐resistant E. coli (3GCR E. coli) given as two individual numbers
Figure D.1.
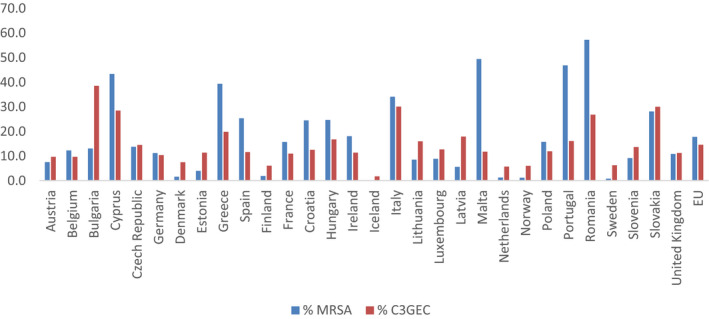
Primary indicator: proportion (%) of meticillin‐resistant Staphylococcus aureus (MRSA) and 3rd‐generation cephalosporin‐resistant E. coli (3GCR E. coli) measured as [% MRSA, % 3GCR E. coli] given as two individual numbers (source: EARS‐Net, 2015)
Table D.1.
Examples of primary and secondary AMR indicators in humans
| Member state | % MRSA | % 3GCR E. coli | %KP resistant to AG, FQ and 3GC | % PRSP | % MRSP | % CRKP |
|---|---|---|---|---|---|---|
| Austria | 7.5 | 9.7 | 3.3 | 2.3 | 8.4 | 0.8 |
| Belgium | 12.3 | 9.7 | 9.3 | 0.6 | 18.6 | 0.5 |
| Bulgaria | 13.1 | 38.5 | 28.6 | 22.9 | 18.2 | 3.2 |
| Cyprus | 43.4 | 28.5 | 17.7 | n.a | n.a | 12.9 |
| Czech Republic | 13.7 | 14.5 | 41.5 | 0.0 | 6.7 | 0.3 |
| Germany | 11.2 | 10.4 | 3.1 | 1.7 | 7.9 | 0.1 |
| Denmark | 1.6 | 7.5 | 1.1 | 0.9 | 5.2 | 0.0 |
| Estonia | 4.0 | 11.4 | 22.2 | 2.8 | 7.4 | 0.0 |
| Greece | 39.4 | 19.8 | 46.7 | n.a | n.a | 61.9 |
| Spain | 25.3 | 11.6 | 11.7 | 23.5 | 21.2 | 2.2 |
| Finland | 1.9 | 6.1 | 1.1 | 0.1 | 14.0 | 0.0 |
| France | 15.7 | 11.0 | 22.5 | 0.3 | 24.4 | 0.5 |
| Croatia | 24.5 | 12.5 | 32.4 | 19.0 | 19.0 | 2.4 |
| Hungary | 24.7 | 16.7 | 30.2 | 2.2 | 10.6 | 0.1 |
| Ireland | 18.1 | 11.4 | 7.2 | 0.3 | 13.9 | 0.5 |
| Iceland | 0.0 | 1.7 | 0.0 | 4.0 | 12.0 | 0.0 |
| Italy | 34.1 | 30.1 | 29.7 | 3.3 | 23.4 | 33.5 |
| Lithuania | 8.5 | 16.0 | 39.9 | 5.7 | 12.5 | 0.0 |
| Luxembourg | 8.9 | 12.7 | 13.3 | 0.0 | 0.0 | 0.0 |
| Latvia | 5.6 | 17.9 | 36.6 | 3.4 | 5.2 | 0.0 |
| Malta | 49.4 | 11.8 | 14.8 | 0.0 | 40.0 | 4.5 |
| Netherlands | 1.3 | 5.7 | 3.0 | 0.6 | 3.6 | 0.1 |
| Norway | 1.2 | 6.0 | 2.3 | 1.6 | 4.0 | 0.1 |
| Poland | 15.8 | 11.9 | 54.0 | 3.2 | 30.6 | 0.5 |
| Portugal | 46.8 | 16.1 | 25.0 | 3.8 | 16.3 | 3.4 |
| Romania | 57.2 | 26.8 | 49.8 | 26.8 | 30.0 | 24.7 |
| Sweden | 0.8 | 6.2 | 1.9 | 9.8 | 6.6 | 0.0 |
| Slovenia | 9.2 | 13.7 | 16.9 | 0.0 | 18.6 | 1.3 |
| Slovakia | 28.1 | 30.0 | 59.6 | 18.5 | 32.4 | 0.9 |
| United Kingdom | 10.8 | 11.3 | 4.2 | 0.3 | 6.9 | 0.4 |
| EU | 17.8 | 14.6 | 21.0 | 5.6 | 14.9 | 5.3 |
n.a.: not available.
Data: ECDC, EARS‐Net, 2015.
D.2. Secondary indicator: proportion of Klebsiella pneumoniae with combined resistance to aminoglycosides, fluoroquinolones and 3rd‐generation cephalosporins
Figure D.2.
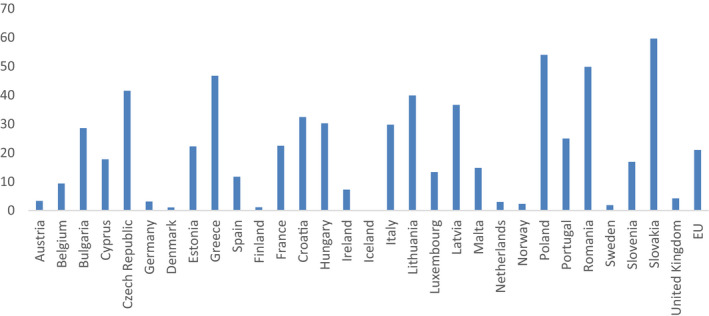
Secondary indicator: Proportion (%) of Klebsiella pneumoniae with combined resistance to aminoglycosides, fluoroquinolones and 3rd‐generation cephalosporins
D.3. Secondary indicator: proportion of penicillin‐resistant Streptococcus pneumoniae and macrolide‐resistant S. pneumoniae
Figure D.3.
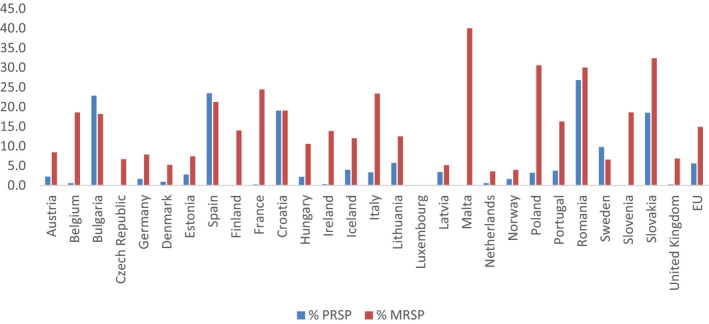
Secondary indicator: Proportion (%) of penicillin‐resistant Streptococcus pneumoniae and macrolide‐resistant Streptococcus pneumoniae
D.4. Secondary indicator: proportion of carbapenem‐resistant Klebsiella pneumoniae
Figure D.4.
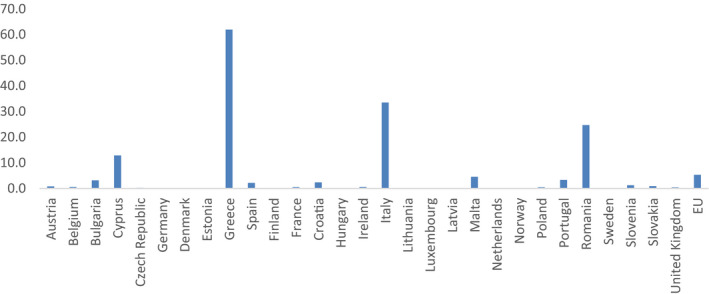
Secondary indicator: proportion (%) of carbapenem‐resistant Klebsiella pneumoniae
Appendix E – Example of calculation of indicators for AMC in food‐producing animals
1.
Population corrected sales (mg/PCU) are calculated as follows:
Example 1. Primary indicator, overall sales (in mg/PCU).
Sales of veterinary antimicrobials in a MS was 11.4 tonnes (tablets excluded) and estimated PCU of the population of food‐producing species 509,400 tonnes.
Example 2. Secondary indicator, sales of 3rd‐ and 4th‐generation cephalosporins (in mg/PCU).
Sales of these antimicrobials classes in a MS was 0.008 tonnes and estimated PCU as in example 1.
Detailed description of the methodology (including calculation of PCU) can be found in report ‘Trends in the sales of veterinary antimicrobial agents in nine European countries: 2005–2009’ (EMA/238630/2011)(EMA/ESVAC, 2011).
E.1. Availability of data on the primary indicator
Overall sales in mg/PCU are available in Table 6 and Figure 8 of the sixth ESVAC report (EMA/ESVAC, 2016). Trends from 2011 to 2014 by country are shown in Table 8 and Figure 55 of the mentioned report.
Figure E.1.
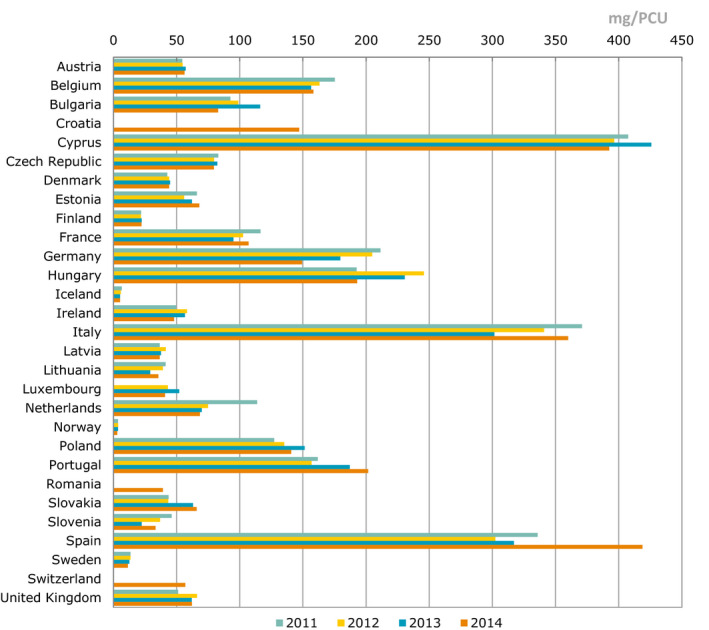
Overall sales of veterinary antimicrobial agents for food‐producing species, in mg/PCU, from 2011 to 2014, for 29 European countries
E.2. Availability of data for the secondary indicators
Sales of 3rd‐ and 4th‐generation cephalosporins, fluoroquinolones and polymyxins in mg/PCU are available in Table 7 and Figures A1, 61, 63 of the sixth ESVAC report (EMA/ESVAC, 2016). Detailed data for each country are available in section 2.8.2. In the seventh ESVAC report detailed figure on sales of polymyxins will be added to section 2.8.2. Proportion of fluoroquinolones vs. all quinolones can be calculated from Table A1 of the sixth ESVAC report.
E.3. Presentation of indicators on veterinary antimicrobial consumption
Figure E.2.
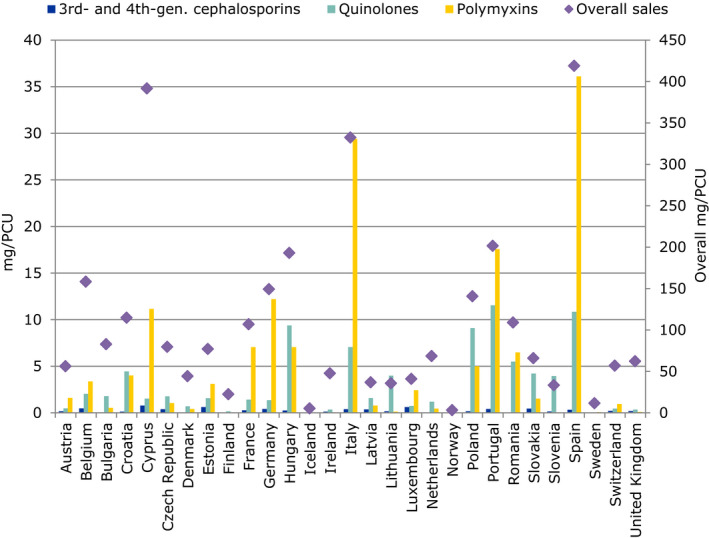
Sales of veterinary antimicrobial agents for food‐producing species, in mg/PCU, overall (right Y‐axis) and of 3rd‐ and 4th‐generation cephalosporins, quinolones and polymyxins (left Y‐axis), for 2014, for 29 European countries
- Different axis scale for overall sales and for HCIAs.
Figure E.3.
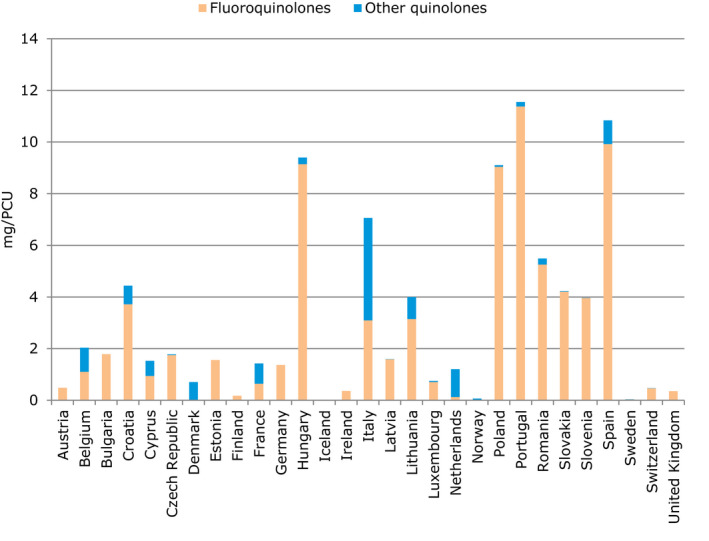
Sales of veterinary antimicrobial agents for food‐producing species, in mg/PCU, fluoroquinolones and other quinolones, for 2014, for 29 European countries
Table E.1.
Total sales of veterinary antimicrobial agents for food‐producing species, including horses, in mg/PCU, during 2014, for 29 European countries
| Country | Overall mg/PCU | 3rd‐ and 4th‐generation cephalosporins | All quinolones (proportion of fluoroquinolones vs all quinolones) | Polymyxins |
|---|---|---|---|---|
| Austria | 56.3 | 0.2 | 0.5 (100%) | 1.6 |
| Belgium | 158.3 | 0.5 | 2.0 (54%) | 3.4 |
| Bulgaria | 82.9 | 0.1 | 1.8 (100%) | 0.5 |
| Croatia | 114.8 | 0.1 | 4.4 (84%) | 4.0 |
| Cyprus | 391.5 | 0.8 | 1.5 (62%) | 11.2 |
| Czech Republic | 79.6 | 0.4 | 1.8 (99%) | 1.1 |
| Denmark | 44.2 | 0.02 | 0.7 (1%) | 0.4 |
| Estonia | 77.1 | 0.6 | 1.6 (100%) | 3.1 |
| Finland | 22.3 | 0.02 | 0.2 (100%) | 0 |
| France | 107.0 | 0.3 | 1.4 (45%) | 7.1 |
| Germany | 149.3 | 0.4 | 1.4 (100%) | 12.2 |
| Hungary | 193.1 | 0.3 | 9.4 (97%) | 7.1 |
| Iceland | 5.2 | 0.01 | <0.01 (100%) | 0 |
| Ireland | 47.6 | 0.1 | 0.4 (100%) | 0.1 |
| Italy | 332.4 | 0.4 | 7.1 (44%) | 29.4 |
| Latvia | 36.7 | 0.4 | 1.6 (99%) | 0.8 |
| Lithuania | 35.5 | 0.2 | 4.0 (79%) | 0.1 |
| Luxembourg | 40.9 | 0.6 | 0.7 (95%) | 2.5 |
| Netherlands | 68.4 | < 0.01 | 1.2 (11%) | 0.5 |
| Norway | 3.1 | < 0.01 | 0.1 (11%) | 0 |
| Poland | 140.8 | 0.2 | 9.1 (99%) | 5.0 |
| Portugal | 201.6 | 0.4 | 11.6 (98%) | 17.6 |
| Romania | 109.1 | 0.05 | 5.5 (96%) | 6.5 |
| Slovakia | 65.9 | 0.5 | 4.2 (99%) | 1.5 |
| Slovenia | 33.4 | 0.1 | 4.0 (100%) | 0.1 |
| Spain | 418.8 | 0.3 | 10.8 (92%) | 36.1 |
| Sweden | 11.5 | < 0.01 | 0.03 (99%) | 0.1 |
| Switzerland | 56.9 | 0.2 | 0.5 (100%) | 1.0 |
| United Kingdom | 62.1 | 0.2 | 0.4 (100%) | 0.1 |
E.4. Trends in sales of veterinary antimicrobials proposed for primary and secondary indicators
Table E.2 summarises results of the sixth ESVAC report on the variation of the overall sales and for those proposed as secondary indicators. For overall sales over a 100‐fold difference between countries is observed but for sales of (highly) critically important antimicrobials the differences between the highest and the lowest selling countries are even higher.
Table E.2.
Variation in sales for 25 countries in 2014 and observed changes from 2011 to 2014 in overall sales and sales of critically important antimicrobials (data (EMA/ESVAC, 2016)
| Range in 2014 (in mg/PCU) | Changes in sales 2011–2014 in individual countries) (in mg/PCU)a | No of countries where sales decreased 2011–2014a | No of countries where sales increased 2011–2014a | |
|---|---|---|---|---|
| Overall sales | 3.1–418.8 | From −62.23 to +82.97 | 14 | 11 |
| Sales of 3rd‐ and 4th‐generation cephalosporins | 0.0004–0.79 | From −0.2 to +0.62 | 10 | 15 |
| Sales of fluoroquinolones | 0.004–11.38 | From −3.17 to +2.99 | 11 | 14 |
| Sales of all quinolones | 0.004–11.55 | From −4.24 to +5.49 | 14 | 11 |
| Sales of polymyxinsb | 0.06–36.1 | From −2.67 to +9.67 | 13 | 9 |
Corrections in sales data and/or PCU data published in 2012 are described in Chapter 1.5 of the seventh ESVAC report.
PCU: population correction unit.
Only countries for which 2011–2014 data are available are included.
For polymyxins data is from 22 countries as polymyxins were not sold in three countries reporting in 2011–2014.
From 2011 to 2014, reported overall sales (in mg/PCU) decreased in 14 countries and sales of 3rd‐ and 4th‐generation cephalosporins and fluoroquinolones decreased in 10 and 11 countries, respectively. Decreases in sales of both overall, 3rd‐ and 4th‐generation cephalosporins and fluoroquinolones were observed in four countries. The sales of highest priority CIAs increased more often in countries that had high overall sales. In some cases, the changes are artificial as they derive from known methodological changes or represent fluctuations between the years.
The magnitude of changes in sales (in mg/PCU) from 2011 to 2014 for the categories listed below was greater than the sales of these classes in the lowest selling countries. If changes are explored in percentages compared to sales in 2011 the variation range is even more substantial. When changes in sales are presented as percentages compared to a certain reference year, the result is essentially dependent on the baseline of the given category in each country. Considering the different magnitude of population corrected sales in different countries, it is seen that the appropriate unit to explore the overall situation in ESVAC participating countries is the population corrected sales (mg/PCU) not proportions of sales.
Some countries have successfully set targets for reduction of use of antimicrobials in animals. Properly interpreted, the changes in overall sales (in mg/PCU) reflect the efficacy of actions taken in reporting countries. A substantial decline in the overall sales (in mg/PCU) observed in some countries indicates that there is potential for decrease also in other countries.
In order to evaluate the sales trends over the years values were analysed for those 25 countries (Austria, Belgium, Bulgaria, the Czech Republic, Cyprus, Denmark, Estonia, Finland, France, Germany, Hungary, Iceland, Ireland, Italy, Latvia, Lithuania, the Netherlands, Norway, Poland, Portugal, Slovakia, Slovenia, Spain, Sweden and the United Kingdom) which have delivered data during the study period, as also presented in Table E.2.
Appendix F – Test of indicators of AMR in food‐producing animals using 2014 and 2015 data
F.1. Tested indicators of AMR in food‐producing animals
The EFSA expert group identified seven candidate AMR indicators in food‐producing animals:
-
a)
The proportion of indicator Escherichia coli from broilers, fattening turkeys, fattening pigs and calves, weighted by PCU, fully susceptible to a predefined panel of antimicrobials11;
-
b)
The average proportion of indicator E. coli from broilers, fattening turkeys, fattening pigs and calves, weighted by PCU, resistant to individual antimicrobials included in a predefined panel of antimicrobials11;
-
c)
The proportion of samples positive for presumptive ESBL‐/AmpC‐producing indicator E. coli from broilers, fattening turkeys, fattening pigs and calves, weighted by PCU;
-
d)
The proportion of indicator E. coli from broilers, fattening turkeys, fattening pigs and calves, weighted by PCU, resistant to at least three antimicrobials from different classes included in a predefined panel of antimicrobials11;
-
e)
The proportion of indicator E. coli from broilers, fattening turkeys, fattening pigs and calves, weighted by PCU, resistant to ciprofloxacin;
-
f)
The proportion of indicator E. coli from broilers, fattening turkeys, fattening pigs and calves, weighted by PCU, resistant to colistin;
-
g)
The proportion of Campylobacter jejuni from broilers and fattening turkeys, weighted by PCU, resistant to erythromycin.
These indicators were calculated using the 2014 and 2015 data on AMR monitoring in food‐producing animals, to understand whether they allowed observing differences according to different AMR situations. Additionally, they were graphically displayed pairwise in scatterplots to determine potential correlations based on the data available. This identified a high degree of correlation between indicators a, b and d; in contrast, the correlation between indicator c and the other indicators was limited (Section F.4).
Based on this result, one of the three indicators a, b and d was selected as primary indicator, and indicator c was selected as an additional secondary indicator as it did not seem to be related to the other indicators. From the three related indicators, indicator a was chosen as primary indicator, while indicator d was retained as a secondary indicator. In addition, indicator e was retained as a secondary indicator. Indicators b, f and g were not retained in the list of selected indicators. The reasoning for these choices is explained in Section 3.5.5.
Section F.2 below reports the basic formula for the calculation of the indicators as point estimates based on the average AMR data in the different food‐producing animal species, presented annually in the ECDC and EFSA EUSR‐AMR. The value of the indicators as point estimates does not, however, take into account the variability and uncertainty that derive from the sampling. These values should be taken into account, and a confidence interval should be provided around the point estimate presented, especially when indicators would be further used to make comparisons between the values of indicators in the different MSs or for the different years within the same MS. Section F.3 explains the method and reports the results of the calculation of the four selected primary and secondary AMR indicators for food‐producing animals.
Section F.4 presents graphically the correlation between some of the potential indicators.
Finally, Section F.5 reports the R code used for the calculation of the indicators, including the weighting for PCU of the different animal species and accounting for variability and uncertainty in the calculation.
F.2. Basic formula for the calculation of the indicators
For a given country and antimicrobials, the proposed AMR indicators in food‐producing animals can be calculated as follows:
Given:
Ix: indicator being calculated
RBRy: proportion of resistance (or of susceptibility or of positive samples12) in broilers13 in the country in year y
RTKy: proportion of resistance (or of susceptibility or of positive samples12) in fattening turkeys13 in the country in year y
RPGy: proportion of resistance (or of susceptibility or of positive samples12) in fattening pigs13 in the country in year y
RCVy: proportion of resistance (or of susceptibility or of positive samples12) in calves13 in the country in year y
PCUBRy: PCU for broilers in the country in year y (see Appendix B for PCU calculation)
PCUTKy: PCU for fattening turkeys in the country in year y (see Appendix B for PCU calculation)
PCUPGy: PCU for fattening pigs in the country in year y (see Appendix B for PCU calculation)
PCUCVy: PCU for calves in the country in year y (see Appendix B for PCU calculation)
PCUy: total PCU for all animal populations with available AMR data in the country in year y (i.e. PCUy = PCUBRy + PCUTKy + PCUPGy + PCUCVy)14
As an example, the point estimate for the selected primary indicator for food‐producing animals for Austria, for years 2014 (broilers and turkeys) and 2015 (fattening pigs and calves) can be calculated starting from the following values:
RBRy = 0.21 (value extracted from 2014 EUSR‐AMR, table COMESCHEBR15)
RTKy = 0.34 (value extracted from 2014 EUSR‐AMR, table COMESCHETURK16)
RPGy = 0.48 (value extracted from 2015 EUSR‐AMR, table COMESCHEPIG17)
RCVy = no data available or no data collected according to Decision 2013/652/EU (value extracted from 2015 EUSR‐AMR, table COMESCHECALV[Link])
PCUBRy = 67190.5
PCUTKy = 10966.51
PCUPGy = 373804.18
PCUCVy = 8925
PCUy = 451961.2 (PCUCVy excluded from the sum since RCVy is not available)
The combined 2014‐2015 indicator would result:
Ix = 0.44
Since AMR data are not available every year for the four animal species, new indicators can be recalculated every year using the new data available for two of the species and the data from the previous year for the other two species.
F.3. Example of the calculation of AMR indicators for food‐producing animals, accounting for uncertainty
As discussed in Section 3.6.2, the point estimates provided by the indicator calculation must be supplemented, as appropriate, with the calculation of appropriate measures of uncertainty (standard errors): in this way interval estimation (in terms of confidence intervals) and hypothesis testing will be possible. This section illustrates an example of a methodology that can be used to take this into account when calculating the proposed AMR indicators in food‐producing animals, and the results obtained when applying such a methodology.
F.3.1. Method used
The method used is 100,000 Monte Carlo simulations from a binomial distribution with size and probability equal to the observed data, and divided by the size. These simulated data mimic the distribution of the outcomes, and allow computing uncertainty intervals. An R code has been designed for the application of this methodology (see Section F.5). The resulting distributions are displayed in the graphs in Section F.3.2. The R code also allows visualising them through boxplots showing median, interquartile range and whiskers.
F.3.2. Results of the calculation of the four selected primary and secondary AMR indicators
Figures F.1–F.4 show the results of the calculation of the four indicators, as computed with the R code reported above. The indicators have been calculated using the available data presented in the EUSR‐AMR reports for years 2014 and 2015, as explained in Sections 3.5.5 and F.1. The values obtained should not be used for comparing indicators in the different countries. This was not the purpose of the exercise, and the mandate for this opinion did not request indicators to be designed for such purpose. Additional standardisation should be done in the data to account for the demographics of the different food‐producing animal species in the different MSs before making between‐country comparisons.
Figure F.1.
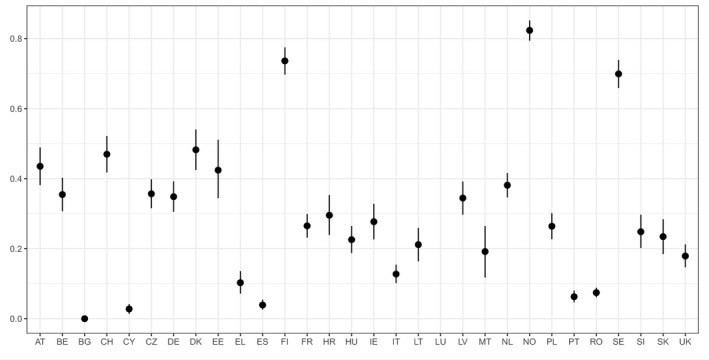
Results of the calculation of indicator ‘fully susceptible indicator E. coli’ (indicator for AMR in food‐producing animals), as computed with the R code reported in Section F.5
Figure F.4.
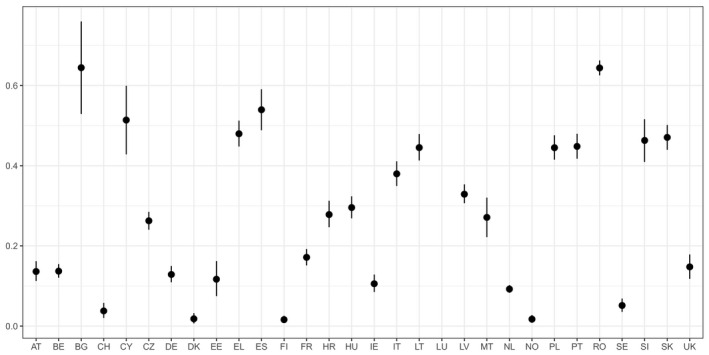
Results of the calculation of indicator ‘ciprofloxacin‐resistant indicator E. coli’ (indicator for AMR in food‐producing animals), as computed with the R code reported in Section F.5
Figure F.2.
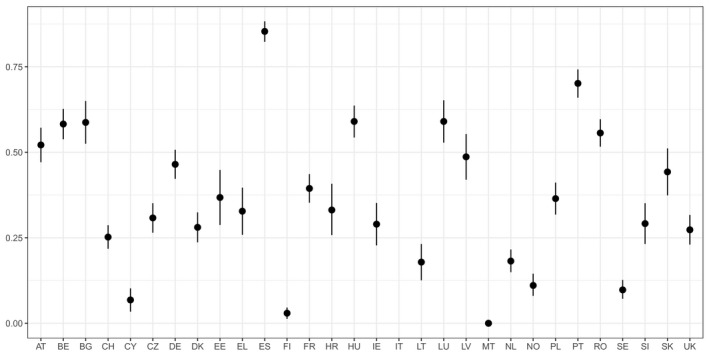
Results of the calculation of indicator ‘ESBL‐/AmpC‐producing indicator E. coli’ (indicator for AMR in food‐producing animals), as computed with the R code reported in Section F.5
- The graph shows median and 95% credibility interval. The indicators have been calculated using the available data presented in the EUSR‐AMR reports for year 2015 (EFSA and ECDC, 2017), and is therefore restricted to fattening pigs and calves, since in 2014 the specific monitoring for ESBL‐/AmpC‐producing E. coli was not mandatory, and prevalence data was submitted voluntarily by only one country (Italy). No data are shown for Italy (no data available).
Figure F.3.
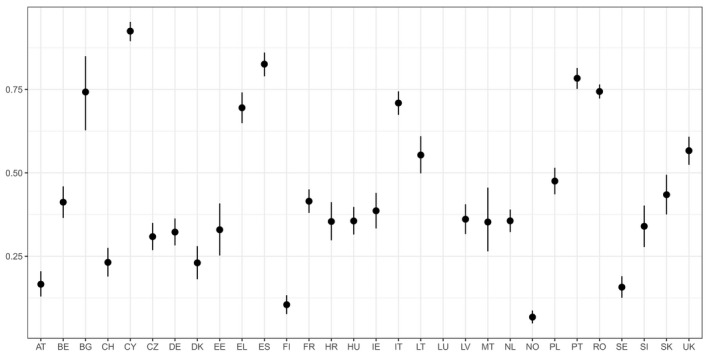
Results of the calculation of indicator ‘multi‐resistant indicator E. coli’ (indicator for AMR in food‐producing animals), as computed with the R code reported in Section F.5
F.4. Correlation between some of the candidate indicators
Figure F.5.
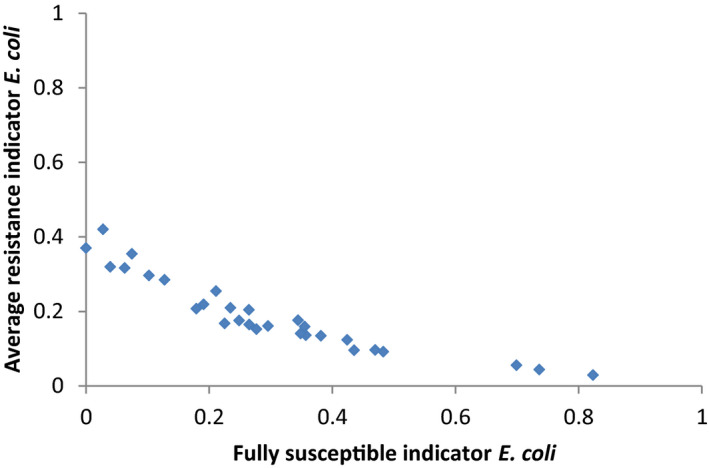
Correlation between possible indicators for AMR in food‐producing animals: selected indicator ‘fully susceptible indicator E. coli’ vs discarded indicator ‘average resistance indicator E. coli’
Figure F.6.
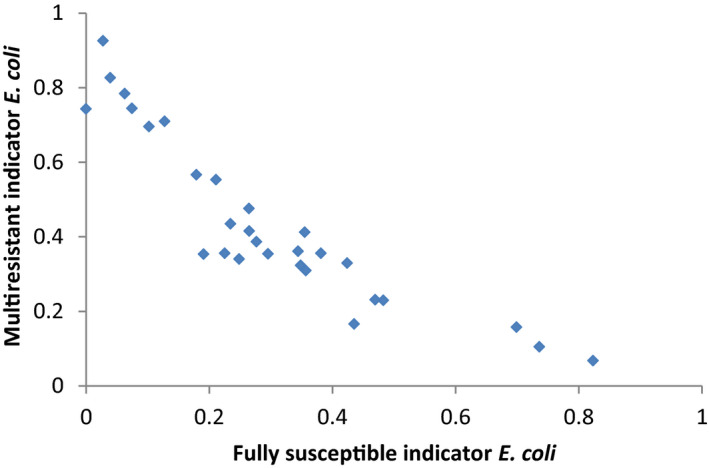
Correlation between possible indicators for AMR in food‐producing animals: selected indicator ‘fully susceptible indicator E. coli’ vs selected indicator ‘multi‐resistant indicator E. coli’
Figure F.7.
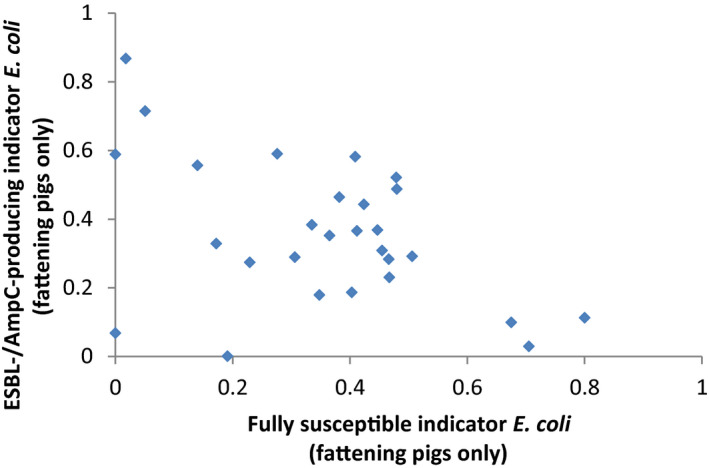
Correlation between possible indicators for AMR in food‐producing animals: selected indicator ‘fully susceptible indicator E. coli’ vs selected indicator ‘ESBL‐/AmpC‐producing indicator E. coli’
- The indicators have been calculated using the available data presented in the EUSR‐AMR reports for year 2015 (EFSA and ECDC, 2017). For the purpose of this graph, mean values of the indicators are considered. Since the indicator on ESBL‐/AmpC‐producing indicator E. coli can be calculated based on the data collected during 2015 only (fattening pigs and calves), and since data for calves is available for a limited number of countries, this graph shows the correlation between the two indicators (fully susceptible indicator E. coli vs ESBL‐/AmpC‐producing indicator E. coli) calculated only for fattening pigs. This allows investigating better the correlation between the two indicators.
Figure F.8.
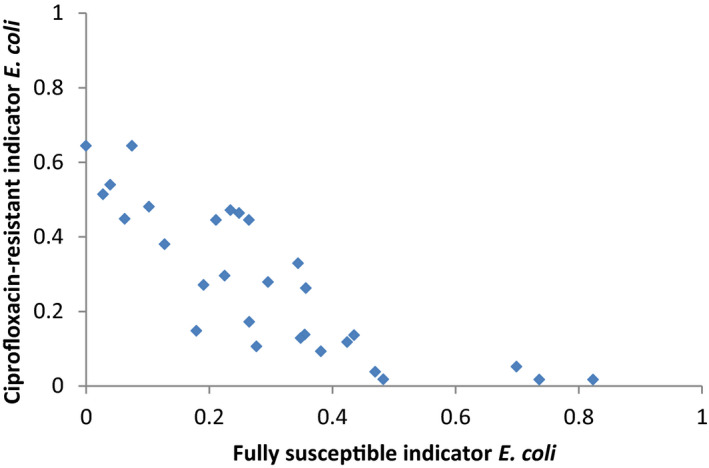
Correlation between possible indicators for AMR in food‐producing animals: selected indicator ‘fully susceptible indicator E. coli’ vs selected indicator ‘ciprofloxacin‐resistant indicator E. coli’
F.5. R18 code used in the calculation of indicators in food‐producing animals
#Settings


library(ggplot2)


library(knitr)


remove(list=ls()); getwd()


## helper functions


rbinom2 <-


function(n, x){


size <- x[1]


prob <- x[2] / 100


## derive number of positive samples


x <- round(size * prob)


## simulate Binomial values


out <- rbinom(n, size, x/size) / size


## replace NA values by 0


out[is.na(out)] <- 0


## return results


return(out)


}


summarize <-


function(x, dig = 4, ...) {


round(


digits = dig,


c(mean = mean(x, ...),


quantile(x, probs = c(0.5, 0.05, 0.95), ...)))


}


## main simulation function


simulate <-


function(df, n_sim) {


## simulate proportions for each matrix, by country


sim1 <- apply(df[, 2:3], 1, rbinom2, n = n_sim)


sim2 <- apply(df[, 4:5], 1, rbinom2, n = n_sim)


sim3 <- apply(df[, 6:7], 1, rbinom2, n = n_sim)


sim4 <- apply(df[, 8:9], 1, rbinom2, n = n_sim)


## calculate matrix weights


PCU <- apply(df[, 10:13], 2, function(x) gsub(",", ".", x, fixed = T))


PCU <- apply(PCU, 2, as.numeric)


PCU_prop <- apply(PCU, 1, prop.table)


## calculate weighted proportions


sim1w <- t(t(sim1) * PCU_prop[1, ])


sim2w <- t(t(sim2) * PCU_prop[2, ])


sim3w <- t(t(sim3) * PCU_prop[3, ])


sim4w <- t(t(sim4) * PCU_prop[4, ])


## sum weighted proportions to obtain indicator


ind <- sim1w + sim2w + sim3w + sim4w


}


## main wrapper


indicator <-


function(wb, rows, n_sim) {


df <- readWorksheet(wb, 1, endCol = 13,


startRow = rows[1], endRow = tail(rows, 1))


ind <- simulate(df, n_sim)


colnames(ind) <- df$Country


return(ind)


}


## pointrange plot


pointrange <-


function(x, ui = 0.90) {


p <- c(0, ui) + (1-ui)/2


df <- data.frame(country = colnames(x),


mean = apply(x, 2, mean, na.rm = TRUE),


lwr = apply(x, 2, quantile, probs = p[1], na.rm = TRUE),


upr = apply(x, 2, quantile, probs = p[2], na.rm = TRUE))


ggplot(df, aes(x = country, y = mean)) +


geom_pointrange(aes(ymin = lwr, ymax = upr)) +


theme_bw() +


scale_x_discrete(NULL) +


scale_y_continuous(NULL)


}


## import Excel file


wb <- loadWorkbook("2017-08-29-Test_AMR_indicators_final.xlsx")


## simulation settings


n_sim <- 1e5


set.seed(264)


#Indicators


#Primary indicator: fully susceptible indicator E. coli


ind1 <- indicator(wb, 2:32, n_sim)


par(mar = c(4, 4, 1, 1))


boxplot(ind1, outline = FALSE, cex.axis = .6, las = 1)


pointrange(ind1)


## Warning: Removed 1 rows containing missing values (geom_pointrange).


kable(t(apply(ind1, 2, summarize, na.rm = TRUE)))


#Secondary indicator: ESBL-/AmpC-producing indicator E. coli


ind3 <- indicator(wb, 70:100, n_sim)


par(mar = c(4, 4, 1, 1))


boxplot(ind3, outline = FALSE, cex.axis = .6, las = 1)


pointrange(ind3)


## Warning: Removed 1 rows containing missing values (geom_pointrange).


kable(t(apply(ind3, 2, summarize, na.rm = TRUE)))


#Secondary indicator: multi-resistant indicator E. coli


ind4 <- indicator(wb, 104:134, n_sim)


par(mar = c(4, 4, 1, 1))


boxplot(ind4, outline = FALSE, cex.axis = .6, las = 1)


pointrange(ind4)


## Warning: Removed 1 rows containing missing values (geom_pointrange).


kable(t(apply(ind4, 2, summarize, na.rm = TRUE)))


#Secondary indicator: ciprofloxacin-resistant indicator E. coli


ind7 <- indicator(wb, 176:206, n_sim)


par(mar = c(4, 4, 1, 1))


boxplot(ind7, outline = FALSE, cex.axis = .6, las = 1)


pointrange(ind7)


## Warning: Removed 1 rows containing missing values (geom_pointrange).


kable(t(apply(ind7, 2, summarize, na.rm = TRUE)))
Appendix G – Classification of critically important antimicrobials
1.
Antimicrobials have been ranked in accordance to their importance in human medicine (WHO, 2005, WHO, 2017) and veterinary medicine (OIE, 2007). The WHO list has been revised on a regular basis and certain antimicrobial classes have been further classified as ‘Highest Priority Critically Important Antimicrobials’ (HCIA) for human medicine.
In 2013, the European Commission requested advice from EMA on the impact of the use of antibiotics on public and animal health and measures to manage the possible risk to humans. The Antimicrobials Advice ad hoc Expert Group (AMEG) responses were published in 2014, and updated in 2016 following the discovery of a new colistin horizontally transferable resistance mechanism (EMA/AMEG, 2014, 2016).
As part of the advice, the AMEG placed the WHO critically important antimicrobials (CIAs) in three categories based on their degree of risk to man due to resistance development following use in animals: lower and higher risk (categories 1 and 2, respectively) and those not yet authorised in veterinary medicine (category 3). Antimicrobials used in veterinary medicine where the risk for public health was estimated higher (category 2) are listed in Table G.1 below alongside the WHO list of HCIA.
Table G.1.
WHO (2017) and AMEG (EMA/AMEG, 2014; EMA/AMEG, 2016) categorisation of critically important antimicrobials
| AMEG categorisation | WHO Highest Priority Critically Important Antimicrobials |
|---|---|
| Fluoroquinolones | Quinolones (fluoroquinolones and other quinolones) |
| The AMEG categorisation only includes fluoroquinolones under category 2 |
The recently published 5th revision of the WHO CIA list (WHO, 2017) includes all quinolones under the Highest Priority Critically Important Antimicrobials. Initial categorisations included the fluoroquinolones but not the quinolones under this category Quinolones are known to select for quinolone‐resistant Salmonella spp. and E. coli in animals. At the same time, quinolones are one of few available therapies for serious Salmonella spp. and E. coli infections. Given the high incidence of human disease due to Salmonella spp. and E. coli, the absolute number of serious cases is substantial |
| 3rd and 4th‐generation cephalosporins | Cephalosporins (3rd‐ and higher generation) |
| The AMEG includes under category 2 the 3rd‐ and 4th‐generation cephalosporins. No VMP that contains cephalosporins of generations higher than the 4th‐generation is approved for food‐producing animals in the EU/EEA countries | Cephalosporins (3rd‐ and higher generation) are known to select for cephalosporin‐resistant Salmonella spp. and E. coli in animals. At the same time, 3rd‐ and higher generation cephalosporins are one of few available therapies for serious Salmonella spp. and E. coli infections in humans, particularly in children. Given the high incidence of human disease due to Salmonella spp. and E. coli, the absolute number of serious cases is substantial |
| Macrolides and ketolides | Macrolides and ketolides |
|
Macrolides are included in category 1 of the AMEG (lower risk than category 2) as the risk for human and animal health was perceived as lower than that of the substances included in category 2 (AMEG report includes ketolides with macrolides in category 1; however, currently no products containing ketolides are authorised in the EU for animal use.) |
Macrolides and ketolides are known to select for macrolide‐resistant Campylobacter spp. in animals, especially Campylobacter jejuni in poultry. At the same time, macrolides are one of few available therapies for serious campylobacter infections in humans. Given the high incidence of human disease due to Campylobacter spp., especially Campylobacter jejuni, the absolute number of serious cases is substantial |
| Glycopeptides | Glycopeptides |
| Glycopeptides are included in AMEG category 3 as there is no VMP that contains glycopeptides approved for food‐producing animals in the EU/EEA countries | Glycopeptides are known to select for glycopeptide‐resistant Enterococcus spp. in food animals (e.g. when avoparcin was used as a growth promoter, vancomycin‐resistant enterococci (VRE) developed in food animals and were transmitted to people). At the same time, glycopeptides are one of the few available therapies for serious enterococcal infections in humans. Given the high number of cases, the previously documented occurrence of transmission of VRE to people from food animals, and the very serious consequences of treatment failures in such cases, glycopeptides are classified as being of the highest priority |
| Polymyxins | Polymyxins |
|
Due to the discovery of transferable resistance to polymyxins (e.g. colistin) use in both human and veterinary medicine must be rationalised and reserved for clinical conditions The EMA agreed that sales of colistin for use in animals should be reduced to the minimum feasible and the polymyxins were consequently added to category 2 of the AMEG classification (EMA/AMEG, 2016) |
Polymyxins (e.g. colistin) are known to select for plasmid mediated polymyxin‐resistant E. coli in food animals. At the same time, intravenous polymyxins are one of few available therapies for serious Enterobacteriaceae and Pseudomonas aeruginosa multiresistant infections in people in healthcare settings in many countries, especially in seriously ill patients in critical care. Given the high incidence of human disease due to Enterobacteriaceae, the absolute number of serious cases where colistin is needed can be considered substantial |
The scope of the classifications is different.
AMEG: Antimicrobial Advice Ad Hoc Expert Group; CIA: critically important antimicrobials; VMP: veterinary medicinal product.
The latest WHO update (2017) includes all quinolones under Highest Priority Critically Important Antimicrobials, not only fluoroquinolones. In the JIACRA II report, resistance development of indicator E. coli against fluoroquinolones and ‘other quinolones’ is examined together. So far, in the ESVAC reports, sales of fluoroquinolones and other quinolones have been reported separately. The similarity in the pattern of resistance caused by quinolones, however, would support their follow up as one group. In either case, it should be noted that other quinolones were sold in 17 of the 29 reporting countries in 2014. If sales of fluoroquinolones in a country are decreased, it should be achieved without increasing sales of other quinolones and vice versa.
Currently, macrolides are not included in AMEG category 2 but in the AMEG advice it is stated that there is a need for awareness as in the future certain macrolide‐resistant strains may be of concern. In case of new information on emerging resistance, the AMEG advice might need to be updated.
EMA has received a mandate to revise its AMEG categorisation.19
Suggested citation: ECDC (European Centre for Disease Prevention and Control), EFSA BIOHAZ Panel (European Food Safety Authority Panel on Biological Hazards) and CVMP (EMA Committee for Medicinal Products for Veterinary Use) , 2017. ECDC, EFSA and EMA Joint Scientific Opinion on a list of outcome indicators as regards surveillance of antimicrobial resistance and antimicrobial consumption in humans and food‐producing animals. EFSA Journal 2017;15(10):5017, 70 pp. 10.2903/j.efsa.2017.5017
Requestor: European Commission
Question number: EFSA‐Q‐2016‐00638
Authors:
ECDC: Martin Cormican, Susan Hopkins, Vincent Jarlier, Jacqui Reilly, Gunnar Skov Simonsen, Reinhild Strauss, Olivier Vandenberg, Dorota Zabicka, Peter Zarb, Mike Catchpole, Ole Heuer, Elias Iosifidis, Dominique Monnet, Diamantis Plachouras and Klaus Weist.
EFSA: Antonia Ricci, Ana Allende, Declan Bolton, Marianne Chemaly, Robert Davies, Pablo Salvador Fernandez Escamez, Rosina Girones, Lieve Herman, Kostas Koutsoumanis, Roland Lindqvist, Birgit Nørrung, Lucy Robertson, Giuseppe Ru, Moez Sanaa, Marion Simmons, Panagiotis Skandamis, Emma Snary, Niko Speybroeck, Benno Ter Kuile, John Threlfall, Helene Wahlström, Bernd‐Alois Tenhagen, Christopher Teale, Gertraud Schüepbach, Pierre‐Alexandre Beloeil, Ernesto Liebana and Pietro Stella.
EMA: David Murphy, Brigitte Hauser, Bruno Urbain, Emil Iliev Kozhuharov, Frane Božić, Alia Michaelidou‐Patsia, Jiří Bureš, Ellen‐Margrethe Vestergaard, Keith Baptiste, Toomas Tiirats, Martti Nevalainen, Jean‐Claude Rouby, Gesine Hahn, Wilhelm Schlumbohm, Ioannis Malemis, Gábor Kulcsár, Johann M. Lenhardsson, Jeremiah Gabriel Beechinor, Rory Breathnach, Paolo Pasquali, Zanda Auce, Petras Mačiulskis, Marc Schmit, Stephen Spiteri, Gerrit Johan Schefferlie, Peter Hekman, Hanne Bergendahl, Anna Wachnik‐Święcicka, João Pedro Duarte Da Silva, Lollita Sanda Camelia Taban, Judita Hederová, Katarina Straus, Cristina Muñoz Madero, Eva Lander Persson, Helen Jukes, Jason Weeks, Katariina Kivilahti‐Mäntylä, Gérard Moulin, Jürgen Wallmann, Kari Grave, Christina Greko, Cristina Muñoz, Damien Bouchard, Boudewijn Catry, Miguel A Moreno, Constança Pomba, Merja Rantala, Modestas Ruzauskas, Pascal Sanders, Christine Schwarz, Christopher Teale, Engeline van Duijkeren, Astrid Louise Wester, Kristine Ignate, Zoltan Kunsagi and Jordi Torren‐Edo.
Acknowledgements: ECDC, the EMA CVMP and the EFSA BIOHAZ Panel wish to thank the following for the support provided to this scientific opinion: the ECDC, EFSA and EMA members of the ad hoc Working Groups drafting this scientific opinion; the EMA sales Expert Advisory Group; the EMA Antimicrobials Working party; and the ECDC Advisory Forum members for their endorsement. ECDC, the EMA CVMP and the EFSA BIOHAZ Panel wish to acknowledge all the European competent institutions and the Member State bodies that provided data for this scientific opinion.
Adopted: 22 September 2017 (ECDC Advisory Forum), 14 September 2017 (EFSA BIOHAZ Panel), 6 September 2017 (EMA CVMP)
Reproduction of the images listed below is prohibited and permission must be sought directly from the copyright holder: © 2017 European Centre for Disease Prevention and Control, © European Medicines Agency and © European Food Safety Authority
Notes
Commission Implementing Decision of 12 November 2013 on the monitoring and reporting of antimicrobial resistance in zoonotic and commensal bacteria (2013/652/EU). OJ L 303, 14.11.2013, p. 26–39.
http://antibiotic.ecdc.europa.eu/en/eaad/antibiotics-get-informed/factsheets/Pages/factsheets.aspx
According to Decision 2013/652/EU.
Depending on the indicator being calculated.
Populations of broilers, fattening turkeys, fattening pigs, calves as defined in Decision 2012/653/EU.
PCU values for those species for which no AMR data are available are excluded from the sum. For example, if RCVy is not available, PCUy = PCUBRy + PCUTKy + PCUPGy.
R version 3.3.2 (2016‐10‐31).
References
- Adriaenssens N, Coenen S, Versporten A, Muller A, Vankerckhoven V, Goossens H and Grp EP, 2011. European Surveillance of Antimicrobial Consumption (ESAC): quality appraisal of antibiotic use in Europe. Journal of Antimicrobial Chemotherapy, 66, 71–77. 10.1093/jac/dkr459 [DOI] [PubMed] [Google Scholar]
- ANSES‐ANMV (French Agency for Food Environmental and Occupational Health & Safety, French Agency for Veterinary Medicinal Products), Méheust D, Chevance A and Moulin G 2016. Sales survey of veterinary medicinal products containing antimicrobials in France in 2015. French Agency for Food, Environmental and Occupational Health & Safety (ANSES) ‐ French Agency for Veterinary Medicinal Products (ANMV). 105 pp. Available online: https://www.anses.fr/en/system/files/ANMV-Ra-Antibiotiques2015EN.pdf
- Bosman AB, Wagenaar JA, Stegeman JA, Vernooij JCM and Mevius DJ, 2014. Antimicrobial resistance in commensal Escherichia coli in veal calves is associated with antimicrobial drug use. Epidemiology and Infection, 142, 1893–1904. 10.1017/s0950268813002665 [DOI] [PMC free article] [PubMed] [Google Scholar]
- Buyle FM, Metz‐Gercek S, Mechtler R, Kern WV, Robays H, Vogelaers D and Struelens MJ and Antibiotic Strategy International (ABS) Quality Indicators Team , 2013. Development and validation of potential structure indicators for evaluating antimicrobial stewardship programmes in European hospitals. European Journal of Clinical Microbiology and Infectious Diseases, 32, 1161–1170. 10.1007/s10096-013-1862-4 [DOI] [PubMed] [Google Scholar]
- Byrne FM and Wilcox MH, 2011. MRSA prevention strategies and current guidelines. Injury‐International Journal of the Care of the Injured, 42, S3–S6. [DOI] [PubMed] [Google Scholar]
- Carmo LP, Schupbach‐Regula G, Muntener C, Chevance A, Moulin G and Magouras I, 2017. Approaches for quantifying antimicrobial consumption per animal species based on national sales data: a Swiss example, 2006 to 2013. Eurosurveillance, 22, 10.2807/1560-7917.ES.2017.22.6.30458 [DOI] [PMC free article] [PubMed] [Google Scholar]
- Cavaco LM, Abatih E, Aarestrup FM and Guardabassi L, 2008. Selection and persistence of CTX‐M‐producing Escherichia coli in the intestinal flora of pigs treated with amoxicillin, ceftiofur, or cefquinome. Antimicrobial Agents and Chemotherapy, 52, 3612–3616. 10.1128/aac.00354-08 [DOI] [PMC free article] [PubMed] [Google Scholar]
- Chantziaras I, Boyen F, Callens B and Dewulf J, 2014. Correlation between veterinary antimicrobial use and antimicrobial resistance in food‐producing animals: a report on seven countries. Journal of Antimicrobial Chemotherapy, 69, 827–834. 10.1093/jac/dkt443 [DOI] [PubMed] [Google Scholar]
- Chong Y, Ito Y and Kamimura T, 2011. Genetic evolution and clinical impact in extended‐spectrum beta‐lactamase‐producing Escherichia coli and Klebsiella pneumoniae . Infection Genetics and Evolution, 11, 1499–1504. 10.1016/j.meegid.2011.06.001 [DOI] [PubMed] [Google Scholar]
- Cilloniz C, Ardanuy C, Vila J and Torres A, 2016. What is the clinical relevance of drug‐resistant pneumococcus? Current Opinion in Pulmonary Medicine, 22, 227–234. 10.1097/mcp.0000000000000262 [DOI] [PubMed] [Google Scholar]
- Coenen S, Ferech M, Haaijer‐Ruskamp FM, Butler CC, Stichele RHV, Verheij TJM, Monnet DL and Goossens PLH and ESAC Project Group , 2007. European Surveillance of antimicrobial consumption (ESAC): quality indicators for outpatient antibiotic use in Europe. Quality and Safety in Health Care, 16, 440–445. 10.1136/qshc.2006.021121 [DOI] [PMC free article] [PubMed] [Google Scholar]
- Collineau L, Belloc C, Stark KD, Hemonic A, Postma M, Dewulf J and Chauvin C, 2017. Guidance on the selection of appropriate indicators for quantification of antimicrobial usage in humans and animals. Zoonoses Public Health, 64, 165–184. 10.1111/zph.12298 [DOI] [PubMed] [Google Scholar]
- Crofts TS, Gasparrini AJ and Dantas G, 2017. Next‐generation approaches to understand and combat the antibiotic resistome. Nature Reviews. Microbiology, 15, 422–434. 10.1038/nrmicro.2017.28 [DOI] [PMC free article] [PubMed] [Google Scholar]
- ECDC (European Centre for Disease Prevention and Control), 2014. Surveillance of antimicrobial consumption in Europe 2012. Stockholm: ECDC. 82 pp. Available online: https://ecdc.europa.eu/sites/portal/files/media/en/publications/Publications/antimicrobial-consumption-europe-esac-net-2012.pdf
- ECDC (European Centre for Disease Prevention and Control), 2015. Best practices in ranking emerging infectious disease threats. A literature review. Stockholm: ECDC. 43 pp. Available online: https://ecdc.europa.eu/sites/portal/files/media/en/publications/Publications/emerging-infectious-disease-threats-best-practices-ranking.pdf [Google Scholar]
- ECDC (European Centre for Disease Prevention and Control), 2016. Summary of the latest data on antibiotic consumption in the European Union. ESAC‐Net surveillance data. November 2016. Stockholm: ECDC. 11 pp. Available online: https://ecdc.europa.eu/sites/portal/files/documents/antibiotics-ESAC-Net%20Summary%202016_0.pdf
- ECDC (European Centre for Disease Prevention and Control), 2017a. ECDC tool for the prioritisation of infectious disease threats – handbook and manual. Stockholm: ECDC. 27 pp. Available online: https://ecdc.europa.eu/sites/portal/files/documents/Tool-for-disease-priority-ranking_handbook_0_0.pdf
- ECDC (European Centre for Disease Prevention and Control), 2017b. Proposals for EU guidelines on the prudent use of antimicrobials in humans. Stockholm: ECDC. 22 pp. Available online: https://ecdc.europa.eu/sites/portal/files/media/en/publications/Publications/EU-guidelines-prudent-use-antimicrobials.pdf
- ECDC (European Centre for Disease Prevention and Control), 2017c. Antimicrobial resistance surveillance in Europe 2015. Annual Report of the European Antimicrobial Resistance Surveillance Network (EARS‐Net). Stockholm: ECDC. 120 pp. Available online: https://ecdc.europa.eu/sites/portal/files/media/en/publications/Publications/antimicrobial-resistance-europe-2015.pdf
- ECDC, EFSA and EMA (European Centre for Disease Prevention and Control, European Food Safety Authority and European Medicines Agency), 2015. ECDC/EFSA/EMA first joint report on the integrated analysis of the consumption of antimicrobial agents and occurrence of antimicrobial resistance in bacteria from humans and food‐producing animals. Stockholm/Parma/London: ECDC/EFSA/EMA, 2015. EFSA Journal 2015;13(1):4006, 114 pp. 10.2903/j.efsa.2015.4006 Available online: http://www.ema.europa.eu/docs/en_GB/document_library/Report/2015/01/WC500181485.pdf and http://onlinelibrary.wiley.com/doi/10.2903/j.efsa.2015.4006/full [DOI] [Google Scholar]
- ECDC, EFSA and EMA (European Centre for Disease Prevention and Control, European Food Safety Authority and European Medicines Agency), 2017. ECDC/EFSA/EMA second joint report on the integrated analysis of the consumption of antimicrobial agents and occurrence of antimicrobial resistance in bacteria from humans and food‐producing animals – Joint Interagency Antimicrobial Consumption and Resistance Analysis (JIACRA) Report. EFSA Journal 2017;15(7):4872, 135 pp. 10.2903/j.efsa.2017.4872 Available online: http://www.ema.europa.eu/docs/en_GB/document_library/Report/2015/01/WC500181485.pdf and http://onlinelibrary.wiley.com/enhanced/exportCitation/doi/10.2903/j.efsa.2017.4872 [DOI] [PMC free article] [PubMed] [Google Scholar]
- Economou V and Gousia P, 2015. Agriculture and food animals as a source of antimicrobial‐resistant bacteria. Infection and Drug Resistance, 8, 49–61. 10.2147/idr.s55778 [DOI] [PMC free article] [PubMed] [Google Scholar]
- EFSA (European Food Safety Authority), 2012a. Technical specifications on the harmonised monitoring and reporting of antimicrobial resistance in methicillin‐resistant Staphylococcus aureus in food‐producing animals and food. EFSA Journal 2012;10(10):2897, 56 pp. 10.2903/j.efsa.2012.2897 Available online: http://onlinelibrary.wiley.com/doi/10.2903/j.efsa.2012.2897/full [DOI] [Google Scholar]
- EFSA (European Food Safety Authority), 2012b. Technical specifications on the harmonised monitoring and reporting of antimicrobial resistance in Salmonella, Campylobacter and indicator Escherichia coli and Enterococcus spp. bacteria transmitted through food. EFSA Journal 2012;10(6):2742, 64 pp. 10.2903/j.efsa.2012.2742 Available online: http://onlinelibrary.wiley.com/doi/10.2903/j.efsa.2012.2742/full [DOI] [Google Scholar]
- EFSA BIOHAZ Panel (EFSA Panel on Biological Hazards), 2011. Scientific Opinion on the public health risks of bacterial strains producing extended‐spectrum β‐lactamases and/or AmpC β‐lactamases in food and food‐producing animals. EFSA Journal 2011;9(8):2322, 95 pp. 10.2903/j.efsa.2011.2322 Available online: http://onlinelibrary.wiley.com/doi/10.2903/j.efsa.2011.2322/full [DOI] [Google Scholar]
- EFSA and ECDC (European Food Safety Authority and European Centre for Disease Prevention and Control), 2016. The European Union summary report on antimicrobial resistance in zoonotic and indicator bacteria from humans, animals and food in 2014. EFSA Journal 2016;14(2):4380, 207 pp. 10.2903/j.efsa.2016.4380 Available online: http://onlinelibrary.wiley.com/doi/10.2903/j.efsa.2016.4380/full [DOI] [PMC free article] [PubMed] [Google Scholar]
- EFSA and ECDC (European Food Safety Authority and European Centre for Disease Prevention and Control), 2017. The European Union summary report on antimicrobial resistance in zoonotic and indicator bacteria from humans, animals and food in 2015. EFSA Journal 2017;15(2):4694, 212 pp. 10.2903/j.efsa.2017.4694 Available online: http://onlinelibrary.wiley.com/doi/10.2903/j.efsa.2017.4694/full [DOI] [PMC free article] [PubMed] [Google Scholar]
- EMA and EFSA (European Medicines Agency and European Food Safety Authority), 2017. EMA and EFSA Joint Scientific Opinion on measures to reduce the need to use antimicrobialagents in animal husbandry in the European Union, and the resulting impacts on food safety(RONAFA). [EMA/CVMP/570771/2015]. EFSA Journal 2017;15(1):4666, 245 pp 10.2903/j.efsa.2017.4666 Available online: http://onlinelibrary.wiley.com/doi/10.2903/j.efsa.2017.4666/full [DOI] [PMC free article] [PubMed] [Google Scholar]
- EMA/AMEG (European Medicines Agency/Antimicrobial Advice ad hoc Expert Group), 2014. Request for scientific advice on the impact on public health and animal health of the use of antibiotics in animals (AMEG) ‐ answer to the second, third and fourth request from the European Commission (EMA/381884/2014). 83 pp. Available online: http://www.ema.europa.eu/docs/en_GB/document_library/Other/2014/07/WC500170253.pdf
- EMA/AMEG (European Medicines Agency/Antimicrobial Advice Ad Hoc Expert Group), 2016. Updated advice on the use of colistin products in animals within the European Union: development of resistance and possible impact on human and animal health (EMA/CVMP/CHMP/231573/2016). 56 pp. Available online: http://www.ema.europa.eu/docs/en_GB/document_library/Scientific_guideline/2016/07/WC500211080.pdf
- EMA/CVMP (European Medicines Agency/Committee for Medicinal Products for Veterinary Use), 2016. CVMP strategy on antimicrobials 2016–2020 (EMA/CVMP/209189/2015). 16 pp. Available online: http://www.ema.europa.eu/docs/en_GB/document_library/Scientific_guideline/2016/10/WC500214901.pdf
- EMA/ESVAC (European Medicines Agency/European Surveillance of Veterinary Antimicrobial Consumption), 2011. Trends in the sales of veterinary antimicrobial agents in nine European countries. Reporting period: 2005–2009. First ESVAC report. 77 pp. Available online: http://www.ema.europa.eu/docs/en_GB/document_library/Report/2011/09/WC500112309.pdf
- EMA/ESVAC (European Medicines Agency/European Surveillance of Veterinary Antimicrobial Consumption), 2013. Revised ESVAC reflection paper on collecting data on consumption of antimicrobial agents per animal species, on technical units of measurement and indicators for reporting consumption of antimicrobial agents in animals (EMA/286416/2012‐Rev.1). 29 pp. Available online: http://www.ema.europa.eu/docs/en_GB/document_library/Scientific_guideline/2012/12/WC500136456.pdf
- EMA/ESVAC (European Medicines Agency/European Surveillance of Veterinary Antimicrobial Consumption), 2016. Sales of veterinary antimicrobial agents in 29 EU/EEA countries in 2014 (EMA/61769/2016). Trends from 2011 to 2014. Sixth ESVAC report. 176 pp. Available online: http://www.ema.europa.eu/docs/en_GB/document_library/Report/2016/10/WC500214217.pdf
- EMA/ESVAC (European Medicines Agency/Committee for Medicinal Products for Veterinary Use), 2017. Guidance on provision of data on antimicrobial use by animal species from national data collection systems (EMA/489035/2016). 36 pp. Available online: http://www.ema.europa.eu/docs/en_GB/document_library/Scientific_guideline/2017/03/WC500224492.pdf
- Falagas ME and Karageorgopoulos DE, 2009. Extended‐spectrum beta‐lactamase‐producing organisms. Journal of Hospital Infection, 73, 345–354. 10.1016/j.jhin.2009.02.021 [DOI] [PubMed] [Google Scholar]
- Fuzi M, 2016. Dissimilar fitness associated with resistance to fluoroquinolones influences clonal dynamics of various multiresistant bacteria. Frontiers in Microbiology, 7, 1017. 10.3389/fmicb.2016.01017 [DOI] [PMC free article] [PubMed] [Google Scholar]
- Hammerum AM, Larsen J, Andersen VD, Lester CH, Skytte TSS, Hansen F, Olsen SS, Mordhorst H, Skov RL, Aarestrup FM and Agerso Y, 2014. Characterization of extended‐spectrum beta‐lactamase (ESBL)‐producing Escherichia coli obtained from Danish pigs, pig farmers and their families from farms with high or no consumption of third‐or fourth‐generation cephalosporins. Journal of Antimicrobial Chemotherapy, 69, 2650–2657. 10.1093/jac/dku180 [DOI] [PubMed] [Google Scholar]
- Handel N, Schuurmans JM, Feng YF, Brul S and ter Kuile BH, 2014. Interaction between mutations and regulation of gene expression during development of De Novo antibiotic resistance. Antimicrobial Agents and Chemotherapy, 58, 4371–4379. 10.1128/aac.02892-14 [DOI] [PMC free article] [PubMed] [Google Scholar]
- Handel N, Otte S, Jonker M, Brul S and ter Kuile BH, 2015. Factors that affect transfer of the IncI1 beta‐lactam resistance plasmid pESBL‐283 between E. coli strains. PLoS ONE, 10, e0123039. 10.1371/journal.pone.0123039 [DOI] [PMC free article] [PubMed] [Google Scholar]
- Henderson DK, 2006. Managing methicillin‐resistant staphylococci: a paradigm for preventing nosocomial transmission of resistant organisms. American Journal of Infection Control, 34, S46–S54. 10.1016/j.ajic.2005.228 [DOI] [PubMed] [Google Scholar]
- Karam G, Chastre J, Wilcox MH and Vincent J‐L, 2016. Antibiotic strategies in the era of multidrug resistance. Critical Care, 20, 136. 10.1186/s13054-016-1320-7 [DOI] [PMC free article] [PubMed] [Google Scholar]
- Kim L, McGee L, Tomczyk S and Beall B, 2016. Biological and epidemiological features of antibiotic‐resistant streptococcus pneumoniae in pre‐ and post‐conjugate vaccine eras: a United States perspective. Clinical Microbiology Reviews, 29, 525–552. 10.1128/cmr.00058-15 [DOI] [PMC free article] [PubMed] [Google Scholar]
- Kourlaba G, Gkrania‐Klotsas E, Kourkouni E, Mavrogeorgos G and Zaoutis TE, 2016. Antibiotic prescribing and expenditures in outpatient adults in Greece, 2010 to 2013: evidence from real‐world practice. Eurosurveillance, 21, 20–28. 10.2807/1560-7917.es.2016.21.26.30266 [DOI] [PubMed] [Google Scholar]
- ter Kuile BH, Kraupner N and Brul S, 2016. The risk of low concentrations of antibiotics in agriculture for resistance in human health care. FEMS Microbiology Letters, 363, pii: fnw210. 10.1093/femsle/fnw210 [DOI] [PubMed] [Google Scholar]
- Lafaurie M, Porcher R, Donay J‐L, Touratier S and Molina J‐M, 2012. Reduction of fluoroquinolone use is associated with a decrease in methicillin‐resistant Staphylococcus aureus and fluoroquinolone‐resistant Pseudomonas aeruginosa isolation rates: a 10‐year study. Journal of Antimicrobial Chemotherapy, 67, 1010–1015. 10.1093/jac/dkr555 [DOI] [PubMed] [Google Scholar]
- Lam T, Jansen J and Wessels RJ, 2017. The RESET mindset model applied on decreasing antibiotic usage in dairy cattle in the Netherlands. Irish Veterinary Journal, 70, 5. 10.1186/s13620-017-0085-x [DOI] [PMC free article] [PubMed] [Google Scholar]
- Laxminarayan R and Klugman KP, 2011. Communicating trends in resistance using a drug resistance index. British Medical Journal Open, 1, e000135. 10.1136/bmjopen-2011-000135 [DOI] [PMC free article] [PubMed] [Google Scholar]
- MARAN (Monitoring of Antimicrobial Resistance and Antibiotic Usage in Animals in The Netherlands), 2016. MARAN 2016 ‐ monitoring of antimicrobial resistance and antibiotic usage in animals in the Netherlands in 2015. 218 pp. Available online: http://www.wur.nl/upload_mm/0/b/c/433ca2d5-c97f-4aa1-ad34-a45ad522df95_92416_008804_NethmapMaran2016+TG2.pdf
- Martinez JL, 2014. General principles of antibiotic resistance in bacteria. Drug Discovery Today. Technologies, 11, 33–39. 10.1016/j.ddtec.2014.02.001 [DOI] [PubMed] [Google Scholar]
- Maslikowska JA, Walker SAN, Elligsen M, Mittmann N, Palmay L, Daneman N and Simor A, 2016. Impact of infection with extended‐spectrum beta‐lactamase‐producing Escherichia coli or Klebsiella species on outcome and hospitalization costs. Journal of Hospital Infection, 92, 33–41. 10.1016/j.jhin.2015.10.001 [DOI] [PubMed] [Google Scholar]
- Moreira M, Castro O, Palmieri M, Efklidou S, Castagna S and Hoet B, 2017. A reflection on invasive pneumococcal disease and pneumococcal conjugate vaccination coverage in children in Southern Europe (2009–2016). Human Vaccines and Immunotherapeutics, 13, 1–12. 10.1080/21645515.2016.1263409 [DOI] [PMC free article] [PubMed] [Google Scholar]
- Moyaert H, de Jong A, Simjee S and Thomas V, 2014. Antimicrobial resistance monitoring projects for zoonotic and indicator bacteria of animal origin: common aspects and differences between EASSA and EFSA. Veterinary Microbiology, 171, 279–283. 10.1016/j.vetmic.2014.02.038 [DOI] [PubMed] [Google Scholar]
- OIE (World Organisation for Animal Health), 2007. OIE list of antimicrobials of veterinary importance. 9 pp. Available online: https://www.oie.int/doc/ged/D9840.pdf
- Oteo J, Miro E, Perez‐Vazquez M and Navarro F, 2014. Evolution of carbapenemase‐producing Enterobacteriaceae at the global and national level: what should be expected in the future? Enfermedades Infecciosas y Microbiología Clínica, 32(Suppl 4), 17–23. 10.1016/s0213-005x(14)70170-3 [DOI] [PubMed] [Google Scholar]
- Pebody RG, Leino T, Nohynek H, Hellenbrand W, Salmaso S and Ruutu P, 2005. Pneumococcal vaccination policy in Europe. Eurosurveillance, 10, 174–178. [PubMed] [Google Scholar]
- Pimenta AC, Fernandes R and Moreira IS, 2014. Evolution of drug resistance: insight on TEM beta‐lactamases structure and activity and beta‐lactam antibiotics. Mini Reviews in Medicinal Chemistry, 14, 111–122. [DOI] [PubMed] [Google Scholar]
- Pomba C, Rantala M, Greko C, Baptiste KE, Catry B, van Duijkeren E, Mateus A, Moreno MA, Pyorala S, Ruzauskas M, Sanders P, Teale C, Threlfall EJ, Kunsagi Z, Torren‐Edo J, Jukes H and Torneke K, 2017. Public health risk of antimicrobial resistance transfer from companion animals. Journal of Antimicrobial Chemotherapy, 72, 957–968. 10.1093/jac/dkw481 [DOI] [PubMed] [Google Scholar]
- Queenan K, Hasler B and Rushton J, 2016. A One Health approach to antimicrobial resistance surveillance: is there a business case for it? International Journal of Antimicrobial Agents, 48, 422–427. 10.1016/j.ijantimicag.2016.06.014 [DOI] [PubMed] [Google Scholar]
- Randall LP, Mueller‐Doblies D, Lemma FL, Horton RA, Teale CJ and Davies RH, 2013. Characteristics of ciprofloxacin and cephalosporin resistant Escherichia coli isolated from turkeys in Great Britain. British Poultry Science, 54, 96–105. 10.1080/00071668.2013.763902 [DOI] [PubMed] [Google Scholar]
- Savulescu C, Krizova P, Lepoutre A, Mereckiene J, Vestrheim DF, Ciruela P, Ordobas M, Guevara M, McDonald E, Morfeldt E, Kozakova J, Varon E, Cotter S, Winje BA, Munoz‐Almagro C, Garcia L, Castilla J, Smith A, Henriques‐Normark B, Celentano LP and Hanquet G and SpIDnet Group , 2017. Effect of high‐valency pneumococcal conjugate vaccines on invasive pneumococcal disease in children in SpIDnet countries: an observational multicentre study. Lancet Respiratory Medicine, 5, 648–656. 10.1016/s2213-2600(17)30110-8 [DOI] [PubMed] [Google Scholar]
- Seppala H, Klaukka T, VuopioVarkila J, Muotiala A, Helenius H, Lager K, Huovinen P, Kontiainen S, Eskola J, Korpela J, KostialaThompson A, Sarkkinen H, Schauman K, Sivonen A, Vaara M, Eerola E, Hiekkaniemi H, Jarvinen H, Klossner ML, Lehtonen OP, Meurman O, Oinonen S, Katila ML, Karkkainen P, Liimatainen O, Vuento R, Nissinen A, Hirvonen P, Kauppinen M, Kirsi O, Larinkari U, Ahonen E, Herva E, Jagerroos H, Koskela M, Lantto K and Ruuska P, 1997. The effect of changes in the consumption of macrolide antibiotics on erythromycin resistance in group a streptococci in Finland. New England Journal of Medicine, 337, 441–446. 10.1056/nejm199708143370701 [DOI] [PubMed] [Google Scholar]
- Shapiro DJ, Hicks LA, Pavia AT and Hersh AL, 2014. Antibiotic prescribing for adults in ambulatory care in the USA, 2007‐09. Journal of Antimicrobial Chemotherapy, 69, 234–240. 10.1093/jac/dkt301 [DOI] [PubMed] [Google Scholar]
- Smith DW, 1999. Decreased antimicrobial resistance after changes in antibiotic use. Pharmacotherapy, 19, 129S–132S. 10.1592/phco.19.12.129S.31584 [DOI] [PubMed] [Google Scholar]
- Torneke K, Torren‐Edo J, Grave K and Mackay DK, 2015. The management of risk arising from the use of antimicrobial agents in veterinary medicine in EU/EEA countries ‐ a review. Journal of Veterinary Pharmacology and Therapeutics, 38, 519–528. 10.1111/jvp.12226 [DOI] [PubMed] [Google Scholar]
- Tripathi V and Cytryn E, 2017. Impact of anthropogenic activities on the dissemination of antibiotic resistance across ecological boundaries. In: Venter H (ed.). Antimicrobial Resistance. Portland Press Limited on behalf of the Biochemical Society, pp. 11–21. [DOI] [PubMed] [Google Scholar]
- Valentin L, Sharp H, Hille K, Seibt U, Fischer J, Pfeifer Y, Michael GB, Nickel S, Schmiedel J, Falgenhauer L, Friese A, Bauerfeind R, Roesler U, Imirzalioglu C, Chakraborty T, Helmuth R, Valenza G, Werner G, Schwarz S, Guerra B, Appel B, Kreienbrock L and Käsbohrer A, 2014. Subgrouping of ESBL‐producing Escherichia coli from animal and human sources: an approach to quantify the distribution of ESBL types between different reservoirs. International Journal of Medical Microbiology, 304, 805–816. 10.1016/j.ijmm.2014.07.015 [DOI] [PubMed] [Google Scholar]
- Van Boeckel TP, Gandra S, Ashok A, Caudron Q, Grenfell BT, Levin SA and Laxminarayan R, 2014. Global antibiotic consumption 2000 to 2010: an analysis of Cross Mark 742 national pharmaceutical sales data. Lancet Infectious Diseases, 14, 742–750. 10.1016/s1473-3099(14)70780-7 [DOI] [PubMed] [Google Scholar]
- WHO (World Health Organization), 2005. Critically important antibacterial agents for human medicine for risk management strategies of non‐human use: report of a WHO working group consultation, 15 ‐ 18 February 2005. Canberra, Australia. Available online: http://apps.who.int/iris/bitstream/10665/43330/1/9241593601_eng.pdf?ua=1&ua=1
- WHO (World Health Organization), 2017. Critically important antimicrobials for human medicine ‐ 5th revision 2016. Ranking of antimicrobial agents for risk management of antimicrobial resistance due to non‐human use. 48 pp. Available online: http://apps.who.int/iris/bitstream/10665/255027/1/9789241512220-eng.pdf