

Abstract
The Panel on Food Additives and Nutrient Sources added to Food (ANS) provided a scientific opinion re‐evaluating the safety of potassium nitrite (E 249) and sodium nitrite (E 250) when used as food additives. The ADIs established by the SCF (1997) and by JECFA (2002) for nitrite were 0–0.06 and 0–0.07 mg/kg bw per day, respectively. The available information did not indicate in vivo genotoxic potential for sodium and potassium nitrite. Overall, an ADI for nitrite per se could be derived from the available repeated dose toxicity studies in animals, also considering the negative carcinogenicity results. The Panel concluded that an increased methaemoglobin level, observed in human and animals, was a relevant effect for the derivation of the ADI. The Panel, using a BMD approach, derived an ADI of 0.07 mg nitrite ion/kg bw per day. The exposure to nitrite resulting from its use as food additive did not exceed this ADI for the general population, except for a slight exceedance in children at the highest percentile. The Panel assessed the endogenous formation of nitrosamines from nitrites based on the theoretical calculation of the NDMA produced upon ingestion of nitrites at the ADI and estimated a MoE > 10,000. The Panel estimated the MoE to exogenous nitrosamines in meat products to be < 10,000 in all age groups at high level exposure. Based on the results of a systematic review, it was not possible to clearly discern nitrosamines produced from the nitrite added at the authorised levels, from those found in the food matrix without addition of external nitrite. In epidemiological studies there was some evidence to link (i) dietary nitrite and gastric cancers and (ii) the combination of nitrite plus nitrate from processed meat and colorectal cancers. There was evidence to link preformed NDMA and colorectal cancers.
Keywords: potassium nitrite, sodium nitrite, E 249, E 250, food additive, CAS Registry number 7632‐00‐0, CAS Registry number 7758‐09‐0
Summary
Following a request from the European Commission, the EFSA Panel on Food Additives and Nutrient Sources added to Food (ANS) was asked to re‐evaluate the safety of potassium nitrite (E 249) and sodium nitrite (E 250) when used as food additives.
Sodium (E 250) and potassium (E 249) nitrites are authorised as food additives in the European Union (EU) according to Annex II to Regulation (EC) No 1333/2008 on food additives and they were previously evaluated by the EU Scientific Committee for Food (SCF), the Joint FAO/WHO Expert Committee on Food Additives (JECFA) and the European Food Safety Authority (EFSA). The acceptable daily intake (ADIs) for sodium and potassium nitrite (expressed as nitrite ion) established by the SCF (1997) and by JECFA (2002, 1996) were 0–0.06 and 0–0.07 mg/kg body weight (bw) per day, respectively.
The Panel was not provided with a newly submitted dossier and based its evaluation on previous evaluations and reviews, additional literature that became available since then and the data provided following public calls for data. Not all original studies on which previous evaluations were based were available for re‐evaluation by the Panel.
Sodium and potassium salts of nitrite are commonly used in curing mixtures to develop and fix the colour of meat, to inhibit microbial growth and/or to develop characteristic flavours (IARC, 2010; Sindelar and Milkowski, 2012). Specific purity criteria on sodium and potassium nitrites are defined in Commission Regulation (EU) No 231/2012.
The studies of toxicokinetics of sodium nitrite in animals and humans showed that the substance was absorbed to a great extent (nearly 100%) and did not undergo first pass metabolism (Hunault et al., 2009). In humans, the volume of distribution was larger than the body water indicating that nitrites were distributed at higher concentrations in some tissues compared with the blood. Nearly, all of nitrite was converted to nitrate, which then was excreted in the urine. Further metabolites of nitrite were nitric oxide (NO) and reactive oxygen species which were also formed during the conversion of nitrite to minor metabolites. Small amounts of nitrite were found in the urine (0.02% of the administered dose). The most important source of nitrite raised from the consumption of food and water containing nitrate and the conversion of nitrate to nitrite in saliva by oral nitrate‐reducing bacteria (Witter and Balish, 1979; JECFA, 2003a). This conversion of nitrate to nitrite was estimated to range from 5% to 36% (Wagner et al., 1983; Bartholomew and Hill, 1984; Spiegelhalder et al., 1976; Bos et al., 1988; Granli et al., 1989; Shapiro et al., 1991; Jin et al., 2013; Bondonno et al., 2015; Woessner et al., 2016; Hohensin et al., 2016; Montenegro et al., 2017).
The available studies provided clear evidence of the genotoxic activity of sodium and potassium nitrite in vitro, with positive results in tests for gene mutations in bacteria and in tests for the induction of structural chromosomal aberrations, gene mutations, aneuploidy and cell transformation in mammalian cells. In vivo negative results were obtained in well‐performed micronucleus assays in mice and rats, with measurable systemic exposure, after acute and subchronic administration of sodium nitrite. Limited negative data were also available at the site of contact. Overall, the Panel concluded that the available information did not indicate an in vivo genotoxic potential for sodium and potassium nitrite, and thus did not preclude the possibility to establish a health‐based guidance value (ADI).
Acute toxicity effects of sodium and potassium nitrite included relaxation of smooth muscle, vasodilation, and consequently, lowering of blood pressure, and methaemoglobinaemia. The oral LD50 in experimental animals was in the range of 100–220 mg/kg bw. In humans, oral lethal nitrite doses have been reported to be in the same order of magnitude as in animals, however in a wider range, likely due to wide variabilities in individual sensitivity (Health Canada, 2013).
Short‐term, subchronic and chronic toxicity studies in rats and mice using sodium and potassium nitrite primarily confirmed that the main observed effect is the formation of methaemoglobin.
Methaemoglobin prevents normal oxygen delivery to the tissues, thus high concentrations of methaemoglobin can cause tissue hypoxia (Mensinga et al., 2003). The normal background concentration of methaemoglobin is 1–3% of total blood haemoglobin concentration (Goldsmith et al., 1976). Clinical signs of methaemoglobinaemia (methaemoglobin > 20%) are cyanosis and symptoms of hypoxia, such as lethargy, dyspnoea, headache and tachycardia. Methaemoglobin concentrations > 50% can cause major tissue hypoxia and may be fatal (Mensinga et al., 2003).
Additional effects reported during exposure to sodium nitrite were increased erythropoietic activity, and changes in haematological parameters considered by the Panel secondary to the formation of methaemoglobin and to a reduced capacity to transport oxygen to tissues. Other reported effects were reduced blood pressure and other cardial and bronchial effects in rats and decreased arterial blood pressure and vasodilation effects in humans. Additionally, IARC (2010) reported some epidemiological studies that were inconclusive with regards to an association between exposure to nitrite and type I diabetes mellitus. Overall, none of those additional effects could be considered as a basis on which to establish an ADI due to the lack of precise details on the exact doses tested, the lack of precise classification of lesions reported, of a plausible mechanism of action, too large dose‐spacing (sometimes 10 times apart) and the lack of full dose relationships.
Available carcinogenicity studies in mice and rats, generally meeting present requirements for toxicity testing, did not show evidence of carcinogenic potential for sodium nitrite. One long‐term study in mice showed a positive trend in the incidence of squamous cell papilloma and carcinoma (combined) of the forestomach and alveolar/bronchiolar adenoma or carcinoma (combined) in female mice. However, no statistical significant difference was reported in the incidence of these tumours and histopathological examination of the lesions showed a focal invasion of the squamous epithelium into the lamina propria with no infiltration of neoplastic cells through neither the serosa of the forestomach nor any sign of metastasis (NTP, 2001). In a 2‐year drinking water study in rats, no treatment‐related increase in tumours of any tissue examined up to a dose of 125 mg/kg bw per day was reported (Maekawa et al., 1982).
No reproductive toxicity was observed in the Reproductive assessment by continuous breeding (RACB) study in mice up to 437 mg sodium nitrite/kg bw per day for males and 412 mg sodium nitrite/kg bw per day for females (NTP, 1990). In a 14‐week study, sperm abnormalities were observed in mice at 345 mg sodium nitrite/kg bw per day (NTP, 2001). Developmental toxicity was tested in mice, rats and hamsters at doses up to 23, 10 and 23 mg sodium nitrite/kg bw per day (FDA, 1972a) and up to 32, 10 and 32 mg potassium nitrite/kg bw per day (FDA, 1972b). Only a slight effect (skeletal retardation) was observed at the high dose in rats treated with sodium and potassium nitrite.
Overall, the Panel considered that an ADI for nitrite per se could be derived from the available repeated dose toxicity studies in animals, based on the fact that negative carcinogenicity results in mice and rats were consistently obtained in studies meeting actual requirements for carcinogenicity testing.
The Panel noted that methaemoglobinaemia was the most common effect observed across experimental studies in animals, including those performed by NTP (2001), and its effect in humans, notably in infants (one of the most sensitive populations).
Human studies reviewed in this opinion also confirmed that exposure to nitrite could lead to the formation of methaemoglobin (Kortboyer et al., 1997; Chui et al., 2005; Bryk et al., 2007; Hunault et al., 2009; Harvey et al., 2010). The Panel considered elevated methaemoglobinaemia, indicating formation of methaemoglobin not compensated by the activity of cytochrome b5 reductase (which converts methaemoglobin back to haemoglobin), as a relevant effect for the derivation of a health‐based guidance value by the BMD approach.
From several animal studies reporting on methaemoglobin formation (Shuval and Gruener, 1972; Til et al., 1985a,b, 1990; Til and Kuper, 1995; NTP, 2001), the Panel selected the subchronic NTP study (2001) in rats as a key study because five doses had methaemoglobin levels higher than the control. In the other studies, only one of the doses had effect levels higher than the control, which rendered them unsuitable for the derivation of a health‐based guidance value.
The Panel considered that the preset default benchmark response (BMR) value for continuous data of 5% (EFSA Scientific Committee, 2017) would be fully within the normal physiological range for nitrite in the blood in the rat study and would thus not be biologically relevant. On the other hand, an increase in methaemoglobin of twofold of the mean background concentration of methaemoglobin (0.06 vs 0.03 g/100 mL) calculated based on within‐group variation would indicate disturbance of the steady state, whereas its effect size would still not be considered overtly adverse to health. Hence, the Panel used the experimental data and their biological variability to derive a BMR implying a doubling of the concentration as compared to the mean background concentration, considering a procedure proposed by Slob (2016). A normal distribution for measures of methaemoglobin in blood can be assumed based on the fact that standard errors are independently and identically distributed.
In the NTP study (2001), five dose groups with 10 animals per sex were treated at doses between 30 and 345 mg/kg bw per day. Methaemoglobin levels were measured at day 5, day 19 and week 14. BDM was performed for every time point. Only the data from week 14 resulted in acceptable modelling. BMD identified a lower bound (BMDL) of 9.63 mg/kg bw per day for males and 14.62 mg/kg bw per day for females.
Using the lowest BMDL of 9.63 mg/kg bw per day for males, and applying the default factor of 100, an ADI of 0.1 mg sodium nitrite/kg bw per day was calculated by the Panel, corresponding to 0.07 mg nitrite ion/kg bw per day. The Panel considered that there was no need to add a factor of 2 to the default factor of 100 for extrapolation from the subchronic to chronic study, because methaemoglobinaemia at similar levels was also the only observed effect in the 2‐year chronic rat study.
As noted previously while high levels of methaemoglobin are directly adverse, lower levels should be regarded as either precursors of such direct adversity or as markers of exposure which increase prior to clinical manifestation of adverse effects. The use of more sensitive markers as a basis for determining a reference point which ensures adversity does not occur is a long established approach (e.g. preneoplastic lesions) which is more protective than using adversity per se.
The Panel noted that there was considerable individual variation in methaemoglobin levels in the population as a whole. In choosing the magnitude of the increase in methaemoglobin level that should be used as the BMR, for deriving the reference point using the BMD approach, the Panel had to consider also the magnitude of the margin of exposure that would be derived for the potential nitrosamine formation from different levels of nitrite (using default assumptions on conversion rates).
In weighting the choices, the Panel concluded that greater weight should be given to ensuring that the estimated margin of exposure (MoE) for nitrosamine formation should be greater than 10,000 rather than observation of adversity due to methaemoglobinaemia. Based on both these considerations, the Panel decided that an increase of twofold of the background mean concentration of methaemoglobin level represented a measurable and consistent marker of exposure that was not associated with adversity and which resulted in a MoE larger than 10,000.
The Panel noted that the no observed adverse effect levels (NOAELs) identified in reproduction and developmental toxicity studies were higher than the BMDL related to the methaemoglobin end‐point, and therefore, the Panel considered that reproductive toxicity would be covered by the methaemoglobin‐derived BMDL.
Potential carcinogenicity of nitrate and nitrite in humans has been extensively reviewed by the IARC (2010), and the epidemiological studies discussed in the IARC report have therefore not been re‐assessed in this opinion. The interested reader is invited to consult the IARC report for details of all these studies. The overall conclusions of the Panel are based on the IARC evaluation of the epidemiological studies on nitrate, nitrite and cancer published until 2006 (IARC, 2010) and on the evaluation of epidemiological studies published subsequently.
The summary evidence for human cancer from these studies was categorised as follows: (a) there was no evidence for an association, if studies indicate no association with a specific cancer; (b) there was insufficient evidence, to link to a cancer (e.g. few studies, contradictory results); (c) there was some evidence, for an association with a specific cancer (e.g. inconsistent results between cohort and case–control studies); and (d) there was evidence, for an association with a specific cancer (e.g. consistent results from cohort and case–control studies).
The Panel concluded that there was no evidence for a positive association between estimated ingested nitrite and prostate cancer.
There was insufficient evidence for a positive association between: dietary nitrite and preformed (N‐nitrosodimethylamine (NDMA) and oesophageal squamous cell carcinomas (ESCC); dietary nitrite and breast cancer; dietary preformed NDMA and gastric non‐cardia adenocarcinoma (GNCA); nitrite and preformed nitroso compounds (NOCs) from processed meat and pancreatic cancer; dietary nitrite and preformed NDMA/NOC and lung cancer; dietary nitrite and non‐Hodgkin lymphoma (NHL); dietary nitrite and ovarian cancer; dietary nitrite and preformed NDMA/NOC and bladder cancer; dietary nitrite and thyroid cancer; dietary nitrite and preformed NDMA and adult glioma; nitrite from processed meat and childhood brain tumours; nitrite from processed meat and renal cell cancer; and nitrite from meat and advanced prostate cancer.
There was some evidence for a positive association between: dietary nitrite and gastric cancer or its subtypes gastric cardia adenocarcinoma (GCA) and GNCA; and the combination of nitrite plus nitrate from processed meat and colorectal cancer (CRC) or subtypes (colon or rectum) cancer.
There was evidence for a positive association between preformed NDMA and increased risk of CRC or its subtypes.
The findings on oesophageal, colorectal, lung, NHL and thyroid cancer are relatively new and still based on few cohort studies; more epidemiological studies are needed to confirm these findings.
There were insufficient data to draw conclusions on: nitrite, preformed NDMA and head–neck cancer (HNC); nitrite, preformed NDMA and liver cancer; and nitrite, preformed NDMA and leukaemia.
In conclusion, there was evidence that the intake of preformed NDMA was associated with increased risk of CRC or its subtypes and, there was some evidence to link the combination of nitrate plus nitrite from processed meat to colon cancer, and nitrite to gastric cancer. This is in line with the conclusion from the IARC Monograph 114 Meeting on red and processed meat in 2015, where it was concluded that ‘there is sufficient evidence in human beings for the carcinogenicity of consumption of processed meat’ (Bouvard et al., 2015). These findings could be possibly explained by the presence of preformed NOCs in processed meat, possibly due to the addition of nitrite. The Panel recommended that further large‐scale prospective studies be carried out on NDMA, nitrite and nitrate intake and risk of CRC and its subtypes, as well as on nitrite and gastric cancer subtypes. There is insufficient evidence for a positive association between nitrite alone in processed meat and other types of cancer.
The Panel selected the refined non‐brand loyal scenario as the most relevant exposure scenario for the safety evaluation of this food additive. Mean exposure to nitrites (expressed as nitrite ion) from their use as food additives (E 249 and E 250) ranged from < 0.01 mg/kg bw per day in infants, children, adolescents and the elderly to 0.03 mg/kg bw per day in toddlers. The 95th percentile of exposure to nitrites (expressed as nitrite ion) from their use as food additives (E 249 and E 250) ranged from < 0.01 mg/kg bw per day in infants to 0.08 mg/kg bw per day in children.
From the exposure scenario considering the exposure to nitrites (expressed as nitrite ion) from all sources (food additives, natural presence and contamination), mean exposure ranged from 0.03 mg/kg bw per day in adults and the elderly to 0.15 mg/kg bw per day in toddlers. The high exposure to nitrites ranged from 0.05 mg/kg bw per day in adults and the elderly to 0.2 mg/kg bw per day in children.
The Panel estimated that, when comparing all sources (food additives, natural presence and contamination), using the same refined exposure methodology (non‐brand‐loyal consumer scenario for general population), the contribution of nitrites (E 249 and E 250) from their use as food additives represented approximately 17% (range 1.5–36.0%) of the overall exposure to nitrites.
The Panel noted that if all sources of dietary nitrite exposure were considered the ADI would be exceeded for infants, toddlers and children at the mean and for all age groups at the highest exposure.
However, the exposure to nitrite resulting from its use as a food additive alone did not lead to an exceedance of the ADI (0.07 mg/kg bw per day as nitrite ion) for the general population except for a slight exceedance in the case of children at the highest percentile in accordance with the refined estimated exposure scenario (non‐brand loyal scenario).
As pointed out in Section 3.2, lower maximum levels for nitrites (E 249 and E 250) were used in Denmark.1 For this reason, the Panel carried out an ad hoc analysis on the analytical results from this country. On average, the limited number of products sampled in Denmark contained lower levels of nitrites (E 249 and E 250) than those from the other countries. Concerning the analytical results reported from Denmark for the food categories in which the use of nitrites (E 249 and E 250) was authorised, for non‐heat‐treated processed meat (FCS 08.3.1), the mean middle bound value reported by Denmark was 6.5 mg/kg (n = 10) and the reported mean value for the other EU Member States (MS) (excluding Denmark) was 11.3 mg/kg (n = 633). For heat‐treated processed meat (FCS 08.3.2), the mean middle bound value reported by Denmark was 5.6 mg/kg (n = 36) and the reported mean value for the other EU MS (excluding Denmark) was 11.6 mg/kg (n = 454). For traditional cured products (FCS 08.3.4), the mean middle bound value reported by Denmark was 11.1 mg/kg (n = 63) and the reported mean value for the other EU MS (excluding Denmark) was 15.7 mg/kg (n = 2,543). The Panel decided not to carry out an ad hoc exposure scenarios for this country. It was therefore expected that the exposure estimates for nitrites (E 249 and E 250) under the regulatory maximum level scenario were overestimated in the case of Denmark. On the other hand, the use of analytical results from a country applying lower maximum levels than the EU legislation could result in an underestimation of the estimates under the refined exposure assessment scenario for all other countries. However, this underestimation was expected to be negligible considering the limited number of analytical results available from Denmark with respect to those from other EU countries. In addition, analytical results reported from EU countries other than Demark were, on average below the limits applied in that country.
The Panel noted usage levels exceeding the legal limit have been reported by industry for non‐heat‐treated processed meat within the ad hoc survey commissioned by DG SANTE. Analytical results above the maximum permitted level (MPL) have been, as well, identified in the occurrence data reported to EFSA by MS. The fact that only data within the legal limits have been used in the exposure assessments presented in this opinion could therefore had led to an underestimation of exposure. However, this was expected to be minor considering the limited number of samples exceeding the MPL (approximately 0.2%).
The Panel tried to quantify the formation of endogenous nitrosamines (ENOCs) after intake of nitrite at the level of the proposed ADI for nitrite (0.07 mg/kg bw per day nitrite ion).
Several lines of evidence exist which make it plausible that exposure to ingested nitrite and nitrate is a factor in nitrosation. The Guideline for Canadian Drinking Water Quality used a simple mathematical model to estimate the amounts of nitrosamines endogenously formed after the intake of drinking water with nitrate concentrations (Health Canada, 2013). The Panel decided to apply the model described in the Canadian guideline to estimate the amounts of nitrosamines endogenously formed after nitrite intake at the level of the nitrite ADI (0.07 mg/kg bw per day equal to 0.0015 mmol/kg bw per day of nitrite ion).
In this assessment, the Panel decided to apply the MoE approach (EFSA, 2005; EFSA Scientific Committee, 2012b) to assess the ENOCs. The Panel selected NDMA as a representative ENOC as it occurs in mixtures and is high in the carcinogenic potency ranking provided by the Opinion on Nitrosamines and Secondary Amines in Cosmetic Products of the Scientific Committee on Consumer Safety (SCCS, 2011) with a BMDL10 of 0.027 mg/kg bw per day; only N‐nitrosodiethylamine (NDEA) has a slightly lower BMDL10 of 0.018 mg/kg bw per day and other considered ENOCs had higher BMDLs. Assuming that all ENOCs produced when adding nitrite would be NDMA is thus an appropriate approach.
The MoE was calculated to 4.2 × 10⁵. This is roughly 40‐fold higher than the value of 10,000 for which the Opinion of the Scientific Committee for substances which are both genotoxic and carcinogenic (EFSA, 2005; EFSA Scientific Committee, 2012b) considered as low concern.
The Panel noted that the basis for this calculation encompassed a number of conservative assumptions particularly the availability of sufficient amounts of nitrosable substrates and that all of the nitrite reacted with only these substrates to produce only carcinogenic ENOCs.
It was not possible to calculate the endogenous exposure to nitrosamides due to lack of sufficient information. However, the Panel noted that only trace amounts of methylnitrosourea or alkali‐labile methylating agents were formed from cured meat nitrosated in simulated gastric juice (Mende et al., 1991), suggesting that the contribution of nitrosamides to the overall exposure to ENOCs was small, if any.
Studies in raw cooked sausages in which all conditions were held constant and only the amount of nitrites has been changed showed some relationship between nitrite added and the increased formation of some non‐volatiles nitrosamines (N‐nitrosohydroxyproline (NHPRO), N‐nitrosoproline (NPRO), N‐nitroso‐thiazolidine‐4‐carboxylic acid (NTCA) and N‐nitroso‐2‐hydroxymethyl‐thiazolidine‐4‐carboxylic acid (NMTCA)). These NOCs are considered of low concern based on the data available and/or structure‐activity considerations (see Section 3.6.5.3).
The levels of volatile nitrosamines (NDMA and N‐nitrosopyrrolidine (NPYR)) were practically not affected, remaining at limit of quantification (LOQ) or lower (2 μg/kg). The Panel noted that further thermal treatment of the meat sausages (cooking, frying and baking) could lead to an increase in the volatile nitrosamine N‐nitrosopiperidine (NPIP) and in the non‐volatile NMTCA. When temperatures below 70°C are applied during processing of meat products, the effect of ingoing amounts of nitrite on the levels of volatile amines is low. Heating steps in the elaboration of raw cooked products could result in an increase in the volatile nitrosamine NDMA, at high temperatures (> 120°C) and amounts of nitrite > 120 mg/kg. The Panel noted that the increase in nitrite has a little impact in the amount of NDMA. In the case of NPIP, neither the temperature nor the amount of nitrite added had any effect on its formation. However, NPYR was detected in cooked products processed at 220°C.
The incorporation of antioxidants such as ascorbic acid, ascorbyl palmitate or erythorbic acid in the formulation of meat products can reduce the levels of nitrosamines except for the volatile nitrosamines NSAR, NDMA, NPYR and NPIP.
The presence of biogenic amines, particularly cadaverine and spermine in raw meat of low quality, mainly due to bacterial growth, has an impact on nitrosamine formation increasing the levels of NPIP. Some amino acids, such as proline, act as precursor of NPYR having a significant influence in its formation.
In raw cured fermented meat products, the formation of nitrosamines occur mainly at the beginning before fermentation and low amounts of the initially added nitrite is left. The Panel noted that the decrease in nitrite levels may be also due to other factors such as the presence of antioxidants or smoking of foodstuffs. Piperidine has a clear impact in the formation of NPIP. The Panel noted that black or white pepper is commonly used as an ingredient in the formulation of raw cured fermented products, and therefore, NPIP is also present.
Based on the results of the systematic review conducted to assess the relationship between nitrite added to meat products and the formation of the volatile NDMA and NDEA (which are of highest toxicological concern), the Panel concluded that it was not possible to clearly discern these NOCs produced from the nitrite added at the legal limits, from those produced already at the food matrix where nitrite has not been added.
Therefore, the Panel used the overall exposure figures to nitrosamines to estimate the margin of exposure although it does not relate only to the use of nitrite as food additive.
The Panel used the estimated exposure figures for individual NDMA and NDEA (and the sum of NDMA + NDEA) to estimate the long‐term risks related to chronic dietary exposure of nitrosamines in processed food. The Panel considered that, based on occurrence data and in view of the highest carcinogenic potency, these N‐nitrosamines would cover adequately the overall risk presented by NOCs in processed food.
At mean exposure for NDMA, MoE was > 10,000 in all age groups; at high exposure levels, MoE may be < 10,000 (depending on the survey data) in all age groups, except in the elderly.
Both at mean and high exposure levels for NDEA, the MoE was > 10,000 in all population groups.
The Panel also calculated the MoE for the total exposure to NDMA plus NDEA using the lowest BMDL10, i.e. the BMDL10 of NDEA. This resulted in a conservative estimate, as NDEA gives a relatively lower contribution to the overall exposure compared to NDMA. Under this assumption, at mean exposure the MoE was < 10,000 in toddlers, children and adolescents in some surveys. At high level exposure, the MoE was < 10,000 in all age groups.
The uncertainties considered and evaluated in assessing the toxicological database had minimal impact on the conclusions reached. The conservative assumptions made for the derivation of an ADI for nitrites (E 249 and E 250) resulted in a reference point and an ADI which were both conservative. For the exposure assessment, the Panel considered that the uncertainties identified would, in general, result in an overestimation of the exposure to nitrites (E 249 and E 250) as a food additive in European countries for the regulatory maximum level exposure scenario and for the refined scenario.
With regard to formation of nitrosamines following the use of nitrite as food additive, the uncertainties in the risk assessment for humans were high, however the impact of these uncertainties on the overall risk assessment of nitrites as a food additive was evaluated as low as the contribution of nitrite used as a food additive at the ADI to the overall exposure to nitrosamines was low compared to other sources of dietary nitrite.
The Panel recommended that further large‐scale prospective observational studies were done on NDMA, nitrite and nitrate intake and risk of colorectal cancer and its subtypes because the evidence of a positive association between preformed NDMA and CRC was based on only two cohort studies and one case–control study.
The Panel also recommended that further studies on the levels of nitroso compounds formed in different meat products with known ingoing amounts of nitrates/nitrites added, with appropriate controls and with specified levels of detection (LOD) and levels of quantification (LOQ) for potentially formed nitroso‐ compounds would be necessary.
Non‐volatile nitroso compounds were found to increase after nitrite addition. Even though non‐volatile nitrosamines are considered of lower toxicological concern based on their chemical structure, generation of experimental data will reduce the remaining uncertainty around a potential hazard posed by non‐volatile nitrosamines in cured meat.
In compliance with the EFSA Genotoxicity Testing Strategy (EFSA Scientific Committee, 2011), the Panel considered that a transgenic rodent mutation assay (OECD TG 488) on multiple organs, including the stomach, would provide useful supplementary information. The Panel noted that the repeated dose administration regimen in transgenic rodent mutation assays would also allow the assessment of clastogenic/aneugenic effects by the scoring micronuclei in peripheral blood erythrocytes.
1. Introduction
This opinion document deals with the re‐evaluation of potassium nitrite (E 249) and sodium nitrite (E 250) when used as food additives.
1.1. Background and Terms of Reference as provided by the European Commission
1.1.1. Background
Regulation (EC) No 1333/20082 of the European Parliament and of the Council on food additives requires that food additives are subject to a safety evaluation by the European Food Safety Authority (EFSA) before they are permitted for use in the European Union (EU). In addition, it is foreseen that food additives must be kept under continuous observation and must be re‐evaluated by EFSA.
For this purpose, a programme for the re‐evaluation of food additives that were already permitted in the European Union before 20 January 2009 has been set up under the Regulation (EU) No 257/20103. This Regulation also foresees that food additives are re‐evaluated whenever necessary in light of changing conditions of use and new scientific information. For efficiency and practical purposes, the re‐evaluation should, as far as possible, be conducted by group of food additives according to the main functional class to which they belong.
The order of priorities for the re‐evaluation of the currently approved food additives should be set on the basis of the following criteria: the time since the last evaluation of a food additive by the Scientific Committee on Food (SCF) or by EFSA, the availability of new scientific evidence, the extent of use of a food additive in food and the human exposure to the food additive taking also into account the outcome of the Report from the Commission on Dietary Food Additive Intake in the EU4 of 2001. The report ‘Food additives in Europe 20005’ submitted by the Nordic Council of Ministers to the Commission, provides additional information for the prioritisation of additives for re‐evaluation. As colours were among the first additives to be evaluated, these food additives should be re‐evaluated with a highest priority.
In 2003, the Commission already requested EFSA to start a systematic re‐evaluation of authorised food additives. However, as a result of adoption of Regulation (EU) 257/2010 the 2003 Terms of References are replaced by those below.
Denmark has notified, in accordance with Article 114 (4) of the Treaty of the Functioning of the European Union (TFEU) that it still wishes to maintain national provisions on the use of nitrite additives in meat products that differ from those in Regulation (EC) No 1333/2008 of the European Parliament and of the Council of 16 December 2008 on food additives.
The maximum amount that may be added according the EU legislation is 150 mg/kg for most meat products, in general, and 100 mg/kg for sterilised meat products. Denmark requested to maintain its own national provisions that are more stringent, with a maximum level of 60 mg/kg. Denmark considers that this lower amount is sufficient to protect against botulism and reduces the risk of formation of nitrosamines.
By means of Commission Decision 2010/561/EU of 25 May 2010, the Commission approved these national measures for a period of 5 years. During that period Denmark needed to systematically monitor the use of nitrites, the control of botulism and whether the application of the levels laid down is the EU legislation would lead to unacceptable risk to human health. With the Commission Decision (EU) 2015/826, the EU prolonged this period until 22 May 2018.
1.1.2. Terms of Reference
EFSA is currently re‐evaluating the safety of potassium and sodium nitrite (E 249 and E 250) and is expected to issue a scientific opinion by end 2015, in accordance with Regulation (EU) No 257/2010 setting up a programme for the re‐evaluation of approved food additives.
The Commission received from Denmark the results of their monitoring in which it is concluded that the health considerations that have been raised to date still apply and are in no way weakened by the results of the monitoring that has been carried out. The Commission asks EFSA to take into account the information provided by Denmark during this ongoing re‐evaluation.
1.1.3. Interpretation of Terms of Reference
EFSA has been asked in accordance with the Regulation (EU) No 257/2010, setting up a programme for the re‐evaluation of approved food additives, to re‐evaluate the safety of nitrates (E 251–252) and nitrites (E 249–250) as food additives. Delivery of the EFSA opinion was initially foreseen by 31 December 2015. During the re‐evaluation process, additional activities, listed below, have been initiated:
Within the frame of M‐2010‐0374, a call for the continuous collection of data on the occurrence of chemical contaminants in food and feed,6 the European Commission (EC) sent a request to EFSA (DATA and BIOCONTAM units) on 28 March 2014 for a scientific report on the occurrence of nitrates in leafy vegetables and exposure of the human population, including vulnerable groups. In addition, EC asked for the collection of data from an ad hoc study on the use of nitrites by the food industry in different categories of meat products, finalised (in SANCO/2014/E3/029) by January 2016. The Panel considered that the outcome of the exposure assessment considering all food sources and the information on the uses of nitrites by the industry is relevant in the frame of this opinion and the delivery of the opinion was aligned with these activities.
On 18 May 2015, the European Commission requested EFSA to consider additional information provided by Denmark on the safety of nitrite use during its re‐evaluation (EC Reference 1188419).
Therefore, a realistic deadline of 31 December 2016 for finalisation of the scientific opinions on the re‐evaluation of nitrates and nitrites has been considered by the ANS Panel.
1.2. Information on existing authorisations and evaluations
Sodium (E 250) and potassium (E 249) nitrites are authorised as food additives in the EU according to Annex II to Regulation (EC) No 1333/2008 on food additives. Specific purity criteria on sodium and potassium nitrites are defined in Commission Regulation (EU) No 231/2012.
The SCF reviewed nitrite on two occasions (SCF, 1992, 1997). The current acceptable daily intake (ADI) for sodium and potassium nitrite (expressed as nitrite ion) established by the SCF in 1997 is 0–0.06 mg/kg body weight (bw) per day.
In 1992, the SCF concluded that the ADI should be based on the levels of sodium nitrite that caused no toxicological effects in a 2‐year study in rats (~ 10 mg NaNO2/kg bw per day) and the no observed effect level (NOEL) identified from clinical use in humans (~ 1 mg/kg bw per day), with safety factors of 100 and 10 applied to the rat and human data, respectively. The derived ADI was 0–0.1 mg/kg bw per day (expressed as sodium nitrite) and was temporary, pending clarification on the mechanism of the adrenal effects observed in a subchronic rat study with potassium nitrite. The SCF stated that this ADI was not applicable to infants under 3 months of age. The SCF was not in a position to make a quantitative assessment of risks from all N‐nitroso compounds (NOCs) present in foods as eaten or formed by nitrosation in the human gastrointestinal (GI) tract.
In a later opinion, the SCF derived (SCF, 1997) an ADI of 0–0.06 mg/kg bw per day for the nitrite ion, applicable to all sources of dietary exposure, based on a NOEL of 5.4 mg nitrite ion/kg bw per day for effects on hypertrophy of the adrenal zona glomerulosa in subchronic studies in the most sensitive rat strain and a safety factor of 100. During its evaluation, the SCF also identified a NOEL from a 2‐year study in rats (10 mg NaNO2/kg bw equivalent to 6.7 mg NO2 −/kg bw) based on histological changes in lung and heart, similar to the one identified by JECFA (2002). However, the SCF considered that both NOELs were the same within the limits of uncertainty of the biological assay. The SCF also considered that, in relation to these biological end‐points, a single ADI for nitrite per se could be derived from data on both the sodium and potassium salts. The Committee reiterated its previous opinion, ‘that exposure to preformed nitrosamines in food should be minimised by appropriate technological practices such as lowering of the levels of nitrate and nitrite added to foods to the minimum required to achieve the necessary preservative effect and to ensure microbiological safety’.
The current ADI for sodium and potassium nitrite (expressed as nitrite ion) established by JECFA in 2002 is 0–0.07 mg/kg bw per day.
Nitrite was reviewed by JECFA on several occasions (JECFA, 1962, 1965, 1974, 1976, 1995, 1996, 2002). In 1996, JECFA noted that ‘although it has been shown in several controlled laboratory studies that, when both nitrite and N‐nitrosatable compounds are present together at high levels, N‐nitroso compounds are formed endogenously, there are quantitative data only on those N‐nitroso compounds which are readily formed endogenously, such as N‐nitrosoproline, which is not carcinogenic. As there was no quantitative evidence of the endogenous formation of carcinogenic N‐nitroso compounds at intake levels of nitrite and nitrosatable precursors achievable in the diet, a quantitative risk assessment of nitrite on the basis of endogenously formed N‐nitroso compounds was not considered to be appropriate’. Therefore, its safety evaluation was based on available conventional toxicity studies with nitrite and the ADI was based on the NOELs of 5.4 mg/kg bw per day (expressed as nitrite ion) identified in 90‐day studies in rats in which hypertrophy of the zona glomerulosa of the adrenal gland was observed (Til et al., 1988, 1990). During its evaluation, JECFA also mentioned that in a 2‐year toxicity study in rats, effects on the heart and lungs were observed and a dose of 6.7 mg/kg bw per day (expressed as nitrite ion) was identified as a NOEL (Shuval and Gruener, 1972). On the basis of these results, an ADI of 0–0.06 mg/kg bw per day (expressed as nitrite ion) was allocated by applying a safety factor of 100 (JECFA, 1995, 1996). JECFA evaluation further stated that ‘This ADI applies to all sources of intake. Nitrite should not be used as an additive in food for infants below the age of 3 months. The ADI does not apply to such infants’.
This ADI was modified slightly by JECFA in its most recent evaluation (JECFA, 2002). It was concluded ‘that the minimal hypertrophy reflected physiological adaptation to small fluctuations in blood pressure and should not be considered a direct toxic action on the adrenals. This conclusion implies that the safety evaluation should not be based upon the NOEL for minimal hypertrophy of the adrenal zona glomerulosa, used by the Committee at its forty‐fourth meeting, but on NOELs for other end‐points’. The JECFA thus ‘established an ADI of 0–0.07 mg/kg bw, expressed as nitrite ion, on the basis of the NOEL of 6.7 mg/kg bw per day for effects on the heart and lung in the 2‐year study in rats and a safety factor of 100’ (JECFA, 2002).
The International Agency for Research on Cancer (IARC) recently re‐evaluated data available on nitrates and nitrites (IARC, 2010), but did not comment on the ADI values set previously by other organisations. The IARC evaluation included a review of the effects of ingested nitrite in experimental animals and in humans arising from epidemiological studies. Concerning the animal experiments, IARC concluded that there was sufficient evidence in experimental animals for the carcinogenicity of nitrite in combination with amines or amides. Concerning the human data, IARC concluded that there was limited evidence in humans for the carcinogenicity of nitrite in food. Nitrite in food is associated with an increased incidence of stomach cancer. Overall, only ‘under conditions that result in endogenous nitrosation, ingested nitrate or nitrite, is probably carcinogenic to humans (Group 2A)’.
The Scientific Panel on Food Additives and Nutrient Sources added on Food (ANS Panel) issued a statement on nitrites in meat products considering data provided by the Danish authorities concluding that the data ‘do not provide a basis to revise the ADI of 0.07 mg/kg bw per day for nitrite’ (EFSA ANS Panel, 2010).
The EFSA Scientific Panel on Contaminants in the Food Chain (CONTAM Panel) has produced three opinions relevant to sodium and potassium nitrites (EFSA CONTAM Panel, 2008, 2009b, 2010b).
In its scientific opinion on nitrate in vegetables, EFSA concluded that ‘nitrite is also found in vegetables but generally at much lower concentrations than nitrate. These levels are not a major direct contributor to human exposure compared with endogenous formation from nitrate’, that ‘evidence that high intake of nitrite might be associated with increased cancer risk is equivocal’ and that ‘no new data were identified that would require a revision of the ADI values of 0–3.7 mg/kg body weight for nitrate and 0–0.07 mg/kg bw for nitrite as reconfirmed by Joint FAO/WHO Expert Committee on Food Additives in 2002’ (EFSA CONTAM Panel, 2008).
The 2009 EFSA opinion on nitrites as undesirable substances in animal feed concluded that ‘the typical daily human dietary exposure to nitrite from fresh animal products (e.g. milk, meat and eggs) is only (2.9%) of the total daily dietary exposure to nitrite. The CONTAM Panel concluded that ‘such low nitrite levels in fresh animal products do not raise any concern for human health’ (EFSA CONTAM Panel, 2009b).
In 2010, the CONTAM Panel of EFSA issued a statement on possible public health risks for infants and young children from the presence of nitrates in leafy vegetables. ‘Overall the CONTAM Panel concluded that the concentrations of nitrate in spinach have the potential to increase dietary nitrate exposure to levels at which a health concern cannot be excluded’. ‘Inappropriate storage of cooked vegetables can result in in situ conversion of nitrate to nitrite, leading to an increased potential for causing methaemoglobinaemia. The CONTAM Panel noted that infants and children with bacterial infections of the gastrointestinal tract are more sensitive to nitrate, and recommended against feeding spinach to such children (EFSA CONTAM Panel, 2010b).’
Another EFSA opinion by the EFSA Scientific Panel on Biological Hazards (BIOHAZ) (EFSA, 2003) discussed the effect of nitrites and nitrates on the microbiological safety of meat products and considered that the in‐going amount of nitrite added to those foods, rather than the residual amount, contributes to the inhibitory activity against Clostridium botulinum. Therefore, control of nitrite in cured meat products should be via the input levels rather than the residual amounts. The Panel concluded that ‘the amount of nitrite necessary to inhibit C. botulinum differs from product to product. With good hygiene, HACCP and realistically short storage times under good temperature control, some meat products can be produced without using nitrites, although these are not strictly “cured meat products”’ and that ‘in other products, especially those with a low salt content and having a prolonged shelf life, addition of between 50 and 150 mg/kg nitrite is necessary to inhibit the growth of C. botulinum’.
In the report by the Nordic Council of Ministers (TemaNord, 2002), it was concluded that the key adverse effects of nitrite are the formation of methaemoglobin, hypertrophy of the adrenal zona glomerulosa and genotoxicity, and that the ADI is not applicable to infants under 3 months of age. They also stated that although the no observed adverse effect levels (NOAELs) derived from clinical and experimental animal studies are in the same range, several groups of individuals are expected to be more sensitive to the methaemoglobin‐forming potential of nitrites. The Nordic Council identified these groups as including: pregnant women, individuals with metabolic disorders and adults with reduced gastric acidity.
Health Canada has published a document on nitrate and nitrite in drinking water (Health Canada, 2013), in addition to a more comprehensive report on the metabolite N‐nitrosodimethylamine (NDMA) (Health Canada, 2011).
The New Zealand Food Safety Authority has published a risk assessment on dietary nitrates and nitrites (Thomson, 2007). The Australian Food Safety Authority has published a report on nitrates and nitrites in 2011 (FSANZ, 2011).
The World Health Organization (WHO) produced a background document (WHO, 2007) for the development of WHO guidelines on drinking water quality for nitrate and nitrite. In this document, a provisional guideline value of 0.2 mg nitrite ion/L water was calculated based on the JECFA ADI of 0–0.07 mg/kg bw per day, assuming that a 60‐kg adult ingests 2 L per day of drinking water, and allocating a 10% contribution of drinking water to the ADI. The provisional status of the guideline was based on uncertainty with regard to the susceptibility of humans to nitrite toxicity when compared with experimental animals. In 2011, the WHO drinking water guidelines value for nitrite was set at 3 mg/L based on methaemoglobinaemia, which can be caused by doses as low as 0.4 mg/kg bw in infants. The guideline value was derived by assuming a body weight of 5 kg for infants and consumption of 0.75 L per day of drinking water (WHO, 2011).
A Screening Information Data Set (SIDS) initial assessment profile is available through the Organisation for Economic Co‐operation and Development (OECD) High Production Volume (HPV) Chemicals Program (OECD, 2005) for sodium nitrite.
The US Environmental Protection Agency7 set a reference dose (RfD) for infant chronic exposure to drinking water of 0.1 mg/kg bw per day for nitrite, based on an epidemiological study in infants routinely fed formula prepared from nitrate‐contaminated water. A NOEL was derived from this study (Walton, 1951) not showing methaemoglobinaemia in drinking water containing ≤ 10 ppm (10 mg/L) nitrate (nitrogen). Using the NOAEL of 10 ppm (10 mg/L in drinking water) and a modifying factor of 10, the RfD for nitrite for a 10 kg child drinking 1 L water per day was 0.1 mg/kg bw per day or 1 mg/day. No uncertainty factor was employed because the NOEL was of the critical toxic effect (i.e. methaemoglobinaemia) in the sensitive human population (i.e. infants). The length of exposure encompassed both the critical effect and the sensitive population. However, a modifying factor of 10 was applied because of the direct toxicity of nitrite. The IRIS document states that more recent studies supported Walton's 10 mg/L NOAEL for infant methaemoglobinaemia (Winton et al., 1971; National Academy of Sciences, 1977; Calabrese et al., 1983).
2. Data and methodologies
2.1. Data
The ANS Panel was not provided with a newly submitted dossier. EFSA launched public calls for data to collect information from interested parties.8 , 9
The Panel based its assessment on information submitted to EFSA following the public calls for data, information from previous evaluations and additional available literature up to 16 November 2016. Attempts were made to retrieve the relevant original study reports on which previous evaluations or reviews were based, however, these were not always available to the Panel.
The EFSA Comprehensive European Food Consumption Database (Comprehensive Database10) was used to estimate the dietary exposure.
The Mintel's Global New Products Database (GNPD) is an online resource listing food products and compulsory ingredient information that should be included in labelling. This database was used to verify the use of food additives (E 249 and E 250) in food products.
2.2. Methodologies
This opinion was formulated following the principles described in EFSA guidance on transparency with regard to scientific aspects of risk assessment (EFSA, 2009) and following the relevant existing guidance documents from the EFSA Scientific Committee.
The ANS Panel assessed the safety of sodium nitrite (E 249) and potassium nitrite (E 250) as food additives in line with the principles laid down in Regulation (EU) No 257/2010 and the relevant guidance documents: guidance on the submission for food additive evaluations by the SCF (2001) and taking into consideration the guidance for submission for food additive evaluations in 2012 (EFSA ANS Panel, 2012).
When the test substance was administered in feed or drinking water, but doses were not explicitly reported by the authors as mg/kg bw per day based on actual feed or water consumption, the daily intake was calculated by the Panel using the relevant default values as indicated in the EFSA Scientific Committee Guidance document (EFSA Scientific Committee, 2012a) for studies in rodents or, in the case of other animal species, by JECFA (2000). In these cases, the daily intake is expressed as equivalent. In human studies in adults (> 18 years), when the dose of the test substance administered was reported in mg/person per day, the dose in mg/kg bw per day was calculated by the Panel using a body weight of 70 kg as default for the adult population, as described in the EFSA Scientific Committee Guidance document (EFSA Scientific Committee, 2012a).
Dietary exposure to sodium nitrite (E 249) and potassium nitrite (E 250) from their use as food additives was estimated by combining the food consumption data available within the EFSA Comprehensive European Food Consumption Database with the maximum permitted levels according to Annex II to Regulation (EC) No 1333/200811, and/or the reported use levels and analytical data submitted to EFSA following a call for data. Different scenarios were used to calculate exposure (see Section 3.3.1). Uncertainties on the exposure assessment were identified and discussed.
Specific methodologies, applied to the following parts of the evaluation, are described in detail under the respective chapters:
3. Assessment
3.1. Technical data
3.1.1. Identity of the substance(s)
Potassium nitrite (E 249) has the molecular formula KNO2 and a molecular mass of 85.11 g/mol. The European Inventory of Existing Commercial Chemical Substances (EINECS) (or EC) number is 231‐832‐4. The chemical name is potassium nitrite and the Chemical Abstract Service (CAS) Registration number is 7758‐09‐0. Potassium nitrite is described as white or slightly yellow, deliquescent granules (Commission Regulation (EU) No 231/201212 laying down specifications for food additives). The melting point is reported to be 438°C (Haynes, 2010). At room temperature, potassium nitrite is freely soluble in water, slightly soluble in ethanol (JECFA, 2006a).
Sodium nitrite (E 250) has the molecular formula NaNO2 and a molecular mass of 69.00 g/mol. The EINECS (or EC) number is 231‐555‐9. The chemical name is sodium nitrite and the CAS Registration number is 7632‐00‐0. Sodium nitrite is described as a white crystalline powder or yellowish lumps (Commission Regulation (EU) No 231/2012). The melting point is 284°C, and it decomposes above 320°C (Haynes, 2010). At room temperature, sodium nitrite is freely soluble in water, sparingly soluble in ethanol (JECFA, 2006b).
3.1.2. Specifications
Specifications for potassium nitrite (E 249) and sodium nitrite (E 250) have been defined in Commission Regulation (EU) No 231/2012 and by JECFA (2006a,b) (Tables 1 and 2).
Table 1.
Specifications for potassium nitrite (E 249) according to Commission Regulation (EU) No 231/2012 and to JECFA (2006a)
| Commission Regulation (EU) No 231/2012 | JECFA (2006a) | |
|---|---|---|
| Definition | ||
| Molecular weight | 85.11 | |
| Assay | Content not less than 95% on the anhydrous basisa | Not less than 95.0% on the dried basis |
| Description | White or slightly yellow, deliquescent granules | Small, white or slightly yellow, deliquescent granules or rods |
| Identification | ||
| Test for nitrite | Passes test | Passes test |
| Test for potassium | Passes test | Passes test |
| pH | 6.0–9.0 (5% solution) | – |
| Solubility | – | Freely soluble in water, sparingly soluble in ethanol |
| Purity | ||
| Loss on drying | Not more than 3% (over silica gel, 4 h) | Not more than 3% (over silica gel, 4 h) |
| Arsenic | Not more than 3 mg/kg | – |
| Lead | Not more than 2 mg/kg | Not more than 2 mg/kg |
| Mercury | Not more than 1 mg/kg | – |
May only be sold in a mixture with salt or a salt substitute.
Table 2.
Specifications for sodium nitrite (E 250) according to Commission Regulation (EU) No 231/2012 and to JECFA (2006b)
| Commission Regulation (EU) No 231/2012 | JECFA (2006b) | |
|---|---|---|
| Definition | ||
| Molecular weight | 69.00 | |
| Assay | Content not less than 97% on the anhydrous basisa | Not less than 97.0% on the dried basis |
| Description | White crystalline powder or yellowish lumps | White or slightly yellow, hygroscopic and deliquescent granules, powder, or opaque, fused masses of sticks |
| Identification | ||
| Test for nitrite | Passes test | Passes test |
| Test for sodium | Passes test | Passes test |
| Solubility | – | Freely soluble in water, sparingly soluble in ethanol |
| Purity | ||
| Loss on drying | Not more than 0.25% (over silica gel, 4 h) | Not more than 0.25% (over silica gel, 4 h) |
| Arsenic | Not more than 3 mg/kg | – |
| Lead | Not more than 2 mg/kg | Not more than 2 mg/kg |
| Mercury | Not more than 1 mg/kg | – |
Nitrite may only be sold in a mixture with salt or a salt substitute.
The Panel noted that the JECFA specifications include the following functional uses for sodium nitrate and potassium nitrite: antimicrobial preservative, colour fixative (JECFA, 2006a,b).
Limits for arsenic or mercury were not included in the JECFA specifications.
The Panel also noted that, according to the EU specifications for potassium nitrite (E 249) and sodium nitrite (E 250), impurities of the toxic elements arsenic, lead and mercury are accepted up concentrations of 3, 2 and 1 mg/kg, respectively. Contamination at these levels might have a significant impact on exposure to these metals, for which intake is already close to the health‐based guidance values established by EFSA or benchmark doses (lower confidence limits) values established by the EFSA (EFSA CONTAM Panel, 2009a, 2010a, 2012a,b,c; 2014).
3.1.3. Manufacturing process
Sodium nitrite is made industrially via the absorption of waste gases from nitric acid production (containing nitrogen dioxide, NO2, and nitric oxide, NO) in sodium hydroxide or sodium carbonate solutions (Kirk‐Othmer, 2006). Gas absorption is typically carried out in absorption towers over which the sodium hydroxide or sodium carbonate is recirculated. Sodium nitrate is also formed. In the production of sodium nitrite, formation of sodium nitrate side product is minimised because excess nitrate can hinder the separation of pure sodium nitrite. The solid technical product is obtained by concentration of the solution from the absorption towers, followed by crystallisation; high purity products can be obtained by repeated crystallisations. Crystals are normally recovered from the mother liquor by centrifugation and subsequently dried. Dry sodium nitrite may be treated with an anticaking agent (e.g. silicon dioxide) to avoid lumping and caking during storage (‘free‐flowing’ products are also available food grade compliant); otherwise, the granular product can be turned into flakes or pellets.
No information on the production of potassium nitrite was located, but the above process could be adapted by using potassium hydroxide or potassium carbonate solutions.
3.1.4. Methods of analysis in food
Measurements of nitrite and nitrate ions in food are generally performed to determine the concentration of these chemical species in dietary components and, specifically, to assess their compliance with current regulations on additives and contaminants. The various applications are characterised by well‐defined requirements that the analyst has to take into consideration to demonstrate that the method is suitable for the purpose of the analysis.
Because of the difficulty in quantitating nitrite and nitrate ions, there is a need to improve the accuracy of the exposure estimate by detecting low levels of the chemicals in individual foods and diets, in addition to a need to study their fate in the body. These requirements are leading to the development of new analytical methods using a variety of detection techniques. EFSA CONTAM Panel (2009b) detailed several methods for the simultaneous quantitative determination of nitrate and nitrite in different food items, including chromatography (Stalikas et al., 2003; Butt et al., 2001; McMullen et al., 2005), amperometry, capillary electrophoresis (Öztekin et al., 1972a) and spectrophotometry (Andrade et al., 2003; Ensafi et al., 2004; Casanova et al., 2006). Methods intended for the quantitative determination of nitrite alone are: spectrophotometry with or without flow injection analysis (Ghasemi et al., 2004), chemiluminescence (Gao et al., 2005; He et al., 2007), fluorescence (Gao, 2002; Li et al., 2003), optical sensor technology (Kazemzadeh, 2005) and even dipstick technology (Fang et al., 2005).
The international standardisation bodies the European Committee on Standardisation (CEN) and the International Organization for Standardization (ISO) approved five analytical methods for the determination of nitrite in foodstuffs (meat products and milk products). The sensitivity, accuracy and reliability of these official methods are commonly good enough for regulatory enforcing purposes.
CEN (1997) described two methods for the determination of nitrite ion in meat products. In the first (CEN, 2005a), nitrite was extracted from a homogenised sample under alkaline conditions (pH 8–8.5). The extract was clarified with Carrez solutions 1 and 2 (150 g/L potassium hexacyanoferrate(II) solution and 230 g/L zinc acetate solution). Sulfanilamide was added to the clarified solution, followed by N‐(1‐naphthyl)‐ethylenediamine dihydrochloride (Griess reaction). This produced a red compound the concentration of which was determined spectrometrically at a wavelength of 540 nm. In the second method (CEN, 2005b), nitrite was extracted from the sample in hot water. Acetonitrile was used to remove interfering substances from the extract. Ion‐exchange chromatography was used to separate nitrite from nitrate, and both ions were quantified using ultraviolet (UV) detection at 205 nm. The limit of detection (LOD) of nitrite and nitrate was 1 and 10 mg/kg, respectively.
In addition, three analytical methods for the determination of nitrate and nitrite in milk and milk products (ISO, 2004a,b,c) were also described. All three used the very sensitive and widely used diazotisation‐coupling Griess reaction for the determination of nitrite. A reduction step involving cadmium was required to determine nitrate and nitrite ions separately in the presence of each other.
The Nordic Committee of Analysis of Food (NMKL, 2013) specified a spectrophotometric method for the determination of nitrate/nitrite content in foodstuffs and water after zinc reduction and Griess reaction. The method was validated in vegetables (lettuce), meat products, baby food, dairy product (milk) and surface water. The LOD of nitrite for surface water was 0.05 mg/L and for other matrices ranged from 2 to 5 mg/kg.
The Official Methods of Analysis of AOAC INTERNATIONAL give two photometric methods for the determination of nitrate/nitrite in meat and cured meat (AOAC, 2005). In the first method, nitrate ion was reacted with 2,4‐xylenol in sulfuric acid, steam‐distilled and measured at 450 nm. Nitrite was oxidised to nitrate with potassium permanganate and determined by difference. The second method was based on the diazotization‐coupling principle (Griess reaction) and read at 540 nm. This method was adopted as a Codex Reference method (Type II) for nitrite and potassium and/or sodium salts in canned corned beef and luncheon meat.
A report by the IARC (2010) included analytical methods for nitrates and nitrites. The majority of the methods were for analysis in water. Some of the methods included were for matrices relevant to the use of sodium and potassium nitrites as additives in foodstuffs – meat and meat products, cured meats and curing preparations. No limits of detection (LOD) or limits of quantification (LOQ) were given for these methods in the IARC Monograph (IARC, 2010).
The following are recent examples of the analysis of nitrite in foodstuffs, including some modifications to the standard methods described above.
Chung et al. (2011) analysed the levels of nitrate and nitrite in vegetables in Hong Kong. Samples were extracted with hot water and the extracts were cooled and filtered. For nitrite, the extract was buffered and analysed in a flow injection analysis system, involving in‐line dialysis with a cellulose acetate dialysis membrane to remove interferences. Nitrite ions passing the membrane reacted in the system with sulfanilamide and N‐(1‐naphthyl)‐ethylenediamine to form a reddish purple azo colour which was measured spectrophotometrically at 540 nm. The LOD was given as 0.8 mg/kg and the LOQ as 4 mg/kg.
Leth et al. (2008) analysed a range of meat products for their nitrate and nitrite contents. Samples were extracted with hot water; protein was precipitated by the addition of Carrez solutions I (150 g/L potassium hexacyanoferrate(II)) and II (300 g/L zinc sulfate). Following filtration, the sample was injected into a flow analysis system containing sulfanilamide and N‐(1‐naphthyl)‐ethylene diammonium chloride which reacted with nitrite to form a violet azo colour that was measured spectrophotometrically at 540 nm. The LOD was 3 mg/kg.
Lammarino et al. (2013) reported the results of 5 years of official control and monitoring of nitrate and nitrite in 1,785 samples of fresh meat products, shellfish, dairy products and leafy vegetables. Nitrate and nitrate were determined using an in‐house validated ion chromatographic method with electrochemical detection. All positive samples were confirmed using a different verified chromatographic method that uses the same procedure for sample preparation and a similar chromatographic system, but different ionic exchange mechanism. Acceptable agreement in the comparative performance of both methods was reported. The LOD was 1.5 mg/kg.
Croitoru (2012) developed a high‐performance liquid chromatography–ultraviolet/visible (HPLC–UV/VIS) method for the determination of low concentrations of nitrite and nitrate in vegetables and biological samples. The method combined simultaneous VIS detection of the nitrite‐related azo dye (Griess reaction), with simple UV detection of nitrate. The proposed method provided an alternative to overcome the poor detectability of nitrite due to the interference of UV‐absorbing substances that often masks the nitrite peak and makes UV/VIS detection in HPLC methods unreliable. The LOQ for nitrite in water, blood and vegetables juices was 2–6 μg/L.
3.1.5. Stability of the substance, and reaction and fate in food
The amount of nitrite added is reduced rapidly in meat products and therefore monitoring of residual levels of nitrite in the final product gives poor information on how much nitrite was added initially. The different rates of nitrite loss in products depend on several factors during processing, such as the heating process used, the pH of the product, the storage temperature and the addition of ascorbic acid or other reducing agents (EFSA, 2003). Under acidic conditions, nitrite is converted to the proximate nitrosating agent nitrous acid, from which various ultimate nitrosating agents are formed. Unprotonated amino groups at neutral pH are suitable substrates for nitrosation, resulting in the formation of NOCs. The reaction with secondary amines is of greater toxicological relevance because some of the resulting dialkyl or cyclic nitrosamines are highly genotoxic and carcinogenic.
The effects of different cooking methods: boiling (90°C, 30 min in water), pan frying (150°C, 5 min without oil), deep frying (150°C, 10 min in soybean oil) and microwaving (89°C surface temperature, 4 min‐700 W) on the contents, N‐nitrosamines (NAs), biogenic amines and residual nitrites, in dry‐cured sausage were investigated (Li et al., 2012). The LOD for the nitrosamines for the gas chromatography–mass spectrometry (GC–MS) method was 0.02–0.08 μg/mL. The results showed that the initial dry‐cured raw sausage contained 5.31 μg/kg of total N‐nitrosamines (N‐nitrosodimethylamine (NDMA), N‐nitrosodiethylamine (NDEA) and N‐nitrosopyrrolidine (NPYR)). Cooking by pan‐frying or deep‐frying resulted in products having the highest (p < 0.05) nitrosamine contents, 6.88 and 6.92 μg/kg, respectively, and a decrease in biogenic amines. However, boiling or microwaving did not change the total nitrosamine content compared with raw sample. Residual nitrite was significantly reduced in all cooking treatments. These results suggested that boiling and microwaving were more suitable methods for cured meat.
The high chemical reactivity of nitrite with food components and that of its intermediate active species suggest that initial concentrations of nitrite in food would diminish over time (Barbieri et al., 2013). The oxidation of nitrite to nitrate in meat explains why in meat products where only nitrite has been added, nitrate is found in considerable amounts in the final product. Therefore, it can be assumed that the concentration of nitrate in a sausage where only nitrite is used is related to the nitrite content (Honikel, 2008).
Honikel (2008) reported the effect of heating and storage on residual amounts of nitrate and nitrite in foods after addition of nitrite and/or nitrate during the production of meat products. In a study by Kudryashow (2003) (as reported in Honikel, 2008) in an emulsion‐type sausage, heating led to a loss of 65% of the initial nitrite amount, independent of the ingoing concentration. After 20 days of cold storage at 2°C, the concentration dropped to one‐third of its initial value. The reduction in nitrate during storage was slower at increasing pH. Dordevic et al. (1980) reported the effect of heat treatments at two different pH values in meat homogenates to which 100 mg/kg of nitrite was added. Higher sterilisation temperatures resulted in a greater loss of nitrite and a lower formation of nitrate. Refrigerated storage after 12 days at 2–4°C led to a further reduction of nitrite. Both compounds reacted with other ingredients. The addition of ascorbate and polyphosphate showed an increase in nitrite loss in a pork slurry (Gibson et al., 1984).
Under the appropriate conditions (pH and concentration of reactants), nitrites have been shown to form NOCs (nitrosamines and nitrosamides) from constituents in the food. The reactions involved in this process are generally described as nitrosation. The basic chemical reaction (nitrosation) that lead to nitrosamine formation in food have been described by several authors (Linjinsky, 1999; Scanlan, 2003) and recently more in detail (Pegg and Honikel, 2015). Nitrous anhydride (N2O3) can participate in nitrosamine formation in food via its formation from nitrite (NO2 –) in an acidic aqueous solution according to the following reaction:
where M and M[n]+ and M[n+1]+ represent transition metal ions such as Fe2+ and Fe3+. In the presence of molecular oxygen (when exposed to air), NO may be oxidised to NO2. This oxygen sequestering explains the antioxidant activity of nitrite in meat batters (Pegg and Honikel, 2015).
Following the above reactions, NO+ can react with unprotonated secondary amines through a nucleophilic substitution reaction to form N‐nitrosamines as described below:
Chemical nitrosation of secondary amines follows a second‐order reaction with respect to nitrite, whereas the chemical nitrosation of amides follows a first‐order reaction with respect to nitrous acid (Mirvish, 1975). No nitrosamines are formed directly from tertiary amines unless they are previously converted to secondary amines (Pegg and Honikel, 2015).
In the case of a second‐order reaction, the rate of nitrosation is pH dependent. For most secondary amines, the optimum pH is between 2.5 and 3.5 (due to the counteracting effects of the formation of nitrous anhydride and protonation of the amine) and is strongly dependent on the pK a value of the amine. In the case of a first‐order reaction, the rate increased steadily with decreasing pH. Although most foods have a pH > 2.5–3.5, some are sufficiently acidic for the reaction to proceed. This might be at a rate lower than the maximum, so that nitrosamines may be formed in foods at a slower pace. Heating of foods, above > 130°C, may also enhance nitrosamine formation. These conditions are favoured in cases such as frying bacon, grilling cured meats, frying cured meats or baking pizza (Pegg and Honikel, 2015). The Panel noted, however, that fresh meat has low amounts of amines, most of them being primary amines, which would render the spontaneous formation of nitrosamine derivatives in cured meat less probable under normal conditions (Honikel, 2008). The reason is that primary amines are immediately degraded to alcohol and nitrogen gas according to the following reaction (Pegg and Honikel, 2015):
Biogenic amines are present in living organisms and therefore naturally present in a variety of foods, but they can also be produced by microorganisms and their formation is dependent on the specific bacterial strain present, the level of decarboxylase activity and the availability of the amino acid substrate (Suzzi and Gardini, 2003; De las Rivas et al., 2008). The most common biogenic amines found in foods are histamine, tyramine, cadaverine, 2‐phenylethylamine, spermine, spermidine, putrescine, tryptamine and agmatine. In fish, meat and meat products, octopamine and dopamine have also been found (Hernández‐Jover et al., 1996). Polyamines, such as putrescine, cadaverine, agmatine, spermine and spermidine, are naturally present in food (Hernández‐Jover et al., 1997). Dry‐fermented sausages can be a source of biogenic amines due to the starter and non‐starter microorganisms in the different production steps.
Nitrites can also react with haem proteins and the components of smoke (Walters, 1992). Wood and liquid smokes used for the production of meat and meat products contain a large number of compounds, of which acids, phenols and carbonyls are the main components (Simko, 2011), together with other compounds such as formaldehyde (Sen et al., 1986). This and other aldehydes can condensate with cysteine resulting in the formation of nitrosamines. However, phenols may prevent nitrosamine formation. It has been reported that higher levels of the non‐volatile N‐nitroso‐thiazolidine‐4‐carboxylic acid (NTCA) are found in smoked meat compared with non‐smoked meat (Sen et al., 1986; Tricker and Kubacki, 1992). The levels of the volatile nitrosamines, NDMA and NPYR seem not to be affected by smoking of foodstuffs. Liquid smoke added to a meat product provides an acidic and antioxidant medium that favours the transformation of nitrite in nitrous acid and, consequently, the formation of red nitrosomyoglobin (NOMb), reducing the nitrite level (Girard, 1991). Theiler et al. (1984) reported that liquid smoke reduced the volatile nitrosamine NPYR in fried minced pork that was nitrite cured. Other authors reported that the antioxidant properties of some smoke flavouring components influence nitrite and nitrate stability, as the addition of the smoke flavouring preparations results in a more rapid depletion of nitrite and nitrate when they are incorporated in the meat products combined or separately (Perez Rodriguez et al., 1998).
The pigments responsible for the colour of meat are myoglobin and haemoglobin (Ledward, 1984), with myoglobin being the main component. Many ligands can bind to the iron atom in the haem ring in myoglobin and the resultant bonds are responsible for the various colours observed in meat. The most important myoglobin forms in fresh meat are red oxymyoglobin. In metmyoglobin, the iron is oxidised to Fe3+ and this causes a loss of the ability of myoglobin to reversibly bind with oxygen. In addition, NOMb is also an important derivative being responsible for the pink colour of uncooked, cured products (Millar et al., 1996).
The colour of cured meat products depends on the reaction of myoglobin with sodium chloride and curing salts (nitrates and/or nitrites). During fermentation in meat products, nitrites react with myoglobin to form NOMb, giving the product its characteristic colour, and metmyoglobin, reduced to NOMb, during the drying process (Chasco et al., 1996). In cooked cured products, the cooking heat processing denatures and separates the protein from the non‐protein haem and contributes to the visual colour change to the final pink of cooked cured meat because of the formation of the nitrosylhemochrome pigment. The system in all cured meats include sodium chloride in different amounts and nitrous acid reacts with the chloride ion to produce nitrosyl chloride (NOCl) which is a more active nitrosylating agent than N2O3 (Møller and Skibsted, 2002).
This means that chloride ions accelerate colour development in cured meat.
Nitrous acid can also react with the sulfhydryl groups in meat proteins to release nitric oxide in an oxidation–reduction reaction that results in a disulfide according to the following reaction (Pegg and Shahidi, 2004):
This contributes to the texture of meat because the cross‐linking between proteins may lead to an increase in firmness.
The application of heat to meat products containing nitrates and nitrites during processes, such as frying or baking, affects the levels of nitrosamines in processed meat (Drabik‐Markiewicz et al., 2009). In products heated to > 130°C, an increase in nitrosamines can be observed (Honikel, 2008). The presence of NDMA in heated meat products was only influenced by the nitrite, and not nitrate, concentration in the brine and temperatures > 120°C (Drabik‐Markiewicz et al., 2009). A further increase in the nitrosamines can be observed at even higher temperatures, e.g. the levels of NDMA and NPYR were affected by frying, with optimum formation at a temperature of 150–200°C (Drabik‐Markiewicz et al., 2009).
Of the several hundred NOCs identified chemically, only a few are likely to be found in food and most of them are nitrosamines. By contrast to nitrosamides, nitrosamines are stable. Nitrosamines are not found individually, but as mixtures of several types. Their concentration tends to increase over time and is enhanced by high temperatures and high acidity, whereas ascorbic acid and other antioxidants inhibit the formation of nitrosamines. NOCs can be volatiles or non‐volatiles and is worth noting that the chemical determination of volatile NOCs remains difficult (JECFA, 1996; Linjinsky, 1999; NTP, 2011). The most common nitrosamines identified were NDMA in food and NDEA in packaged food.
The list of nitrosamines that can be generated in processed meats, as reported in the recent literature cited below (Campillo et al., 2011; Fiddler et al., 1998; Herrmann et al., 2015a,b,c; Stuff et al., 2009) is given in Table 3.
Table 3.
List of nitrosamines that can be generated in processed meat
| Volatile nitrosamines | Non‐volatile nitrosamines |
|---|---|
| N‐nitrosodimethylamine (NDMA) | N‐nitrosohydroxyproline (NHPRO) |
| N‐nitrosomorpholine (NMOR) | N‐nitrosoproline (NPRO) |
| N‐nitrosomethylethylamine (NMEA) | N‐nitrososarcosine (NSAR) |
| N‐nitrosopyrrolidine (NPYR) | N‐nitrosomethylaniline (NMA) |
| N‐nitrosodiethylamine (NDEA) | |
| N‐nitrosopiperidine (NPIP) | N‐nitrosodiisobutylamine (NDiBA) |
| N‐nitroso‐di‐n‐propylamine (NDPA) | N‐nitrosodibenzylamine (NDBzA) |
| N‐nitrosodibutylamine (NDBA) | N‐nitroso‐2‐hydroxymethyl‐thiazolidine‐4‐carboxylic acid (NHMTCA) |
| N‐nitroso‐thiazolidine‐4‐carboxylic acid (NTCA) | |
| N‐nitroso‐2‐methyl‐thiazolidine 4‐carboxylic acid (NMTCA) | |
| N‐nitrosopipecolic acid (NPIC) |
Jakszyn et al. (2004a,b) compiled published data on the levels of nitrosamines in a range of foodstuffs from various countries as part of the European Prospective Investigation into Cancer and Nutrition (EPIC). The quality of information collected required a description of the analytical method, but no more restrictions were included. Authors did not specify a priori criteria of exclusion (Jakszyn et al., 2004a). Results for the nitrosamines NDMA, N‐nitrosopiperidine (NPIP) and N‐nitrosoproline (NPRO) in meat products like bacon, dry beef, frankfurter, cured or smoked ham and sausages were presented. NDMA was the nitrosamine reported most frequently in the analysis.
Nitrosamines were analysed in 101 fermented sausages available in the Belgian market (De Mey et al., 2013). A gas chromatograph coupled to a thermal energy analyser was used for the analysis. The LOD and LOQ values were reported for each nitrosamine. The total amount of nitrosamines remained below 5.5 μg/kg, except for one sample that was 12.3 μg/kg. Only NPIP and NMOR were detected in more samples (22% and 28% of samples, respectively). NPIP was above the LOQ value of 2.5 μg/kg in only 3% of the investigated sausages, whereas NMOR concentrations remained below the LOQ value of 1.5 μg/kg, except for one sample of chorizo that was 1.6 μg/kg. Some detectable amounts of NDMA above the LOD of 0.2 μg/kg were also detected and two samples (a Turkish sample and a ‘Light’ product) were above the LOQ value of 0.8 μg/kg. Further, two samples (saucisson d'Ardennes and chorizo) showed NDBA contamination above the LOD of 0.6 μg/kg, but below the LOQ of 2.0 μg/kg.
Meat and meat products were analysed in an Estonian market during 2001–2005 (Yurchenko and Mölder, 2007). In total, 386 samples of raw, fried, grilled, smoked, pickled and canned meat products were analysed for nitrosamines. The analysis was performed using GC with a mass selective detector and the LOD and LOQ were determined for each nitrosamine. The LOD and LOQ for nitrosamines were approximately 0.09 and 0.29 μg/kg, respectively, with ~ 85% recovery. The highest nitrosamine levels were found in samples of fried meat. NDMA was reported in > 88% of samples at a mean of 0.85 μg/kg, NDEA in 27% of samples at a mean of 0.36 μg/kg, NPYR in 90% of samples at a mean of 4.14 μg/kg, NPIP in 65% of samples at a mean of 0.98 μg/kg and NDBA in 33% of samples at a mean of 0.37 μg/kg. The level of total volatile nitrosamines was 3.97 μg/kg.
Volatile nitrosamines were analysed in 21 samples of processed meat products (ham, mortadella, frankfurters, dry‐cured sausages, blood sausage, foie gras paté and chicken meatballs) found on the Spanish market (Campillo et al., 2011). nitrosamines were extracted using microwave‐assisted extraction and analysed through dispersive liquid–liquid microextraction coupled with GC–MS. The LOD values were < 14 μg/mL. The following nitrosamines were reported: NDMA (range 1.5–5.7 μg/kg, not detected in two samples), NPYR (range 1.5–3.4 μg/kg, not detected in eight samples), NPIP (range 0.7–2.2 μg/kg, not detected in four samples), NDBA (range 1.2–3.4 μg/kg, not detected in 14 samples) and NDEA (range 1.9–3.6 μg/kg, not detected in 15 samples). NMEA was detected only in cured pork ham (2.5 μg/kg) and one foie gras sample (3.8 μg/kg). NDPA was detected only in mortadella (1.2 μg/kg), Frankfurt sausage (1.9 μg/kg) and dry‐cured sausage (1.0 μg/kg).
Volatile nitrosamines were also analysed in 22 meat products (sucuk, salami, sausage and doner kebab) available on the Turkish market (Ozel et al., 2010). A validated method consisting of comprehensive gas chromatography (GC × GC) and a fast responding element‐specific nitrogen chemiluminescence detector was used for the analysis. The LOD values using this method were between 1.66 and 3.86 μg/L, and the LOQ values were between 6.96 and 16.71 μg/L. The following nitrosamines were reported: NDMA (range 0.1–1.2 μg/kg, not detected in six samples), NPYR (range 0.1–7.7 μg/kg, not detected in four samples), NPIP (range 0.1–7.2 μg/kg, not detected in two samples), NDEA (range 0.1–1.7 μg/kg, not detected in four samples), NDPA (0.12–1.35, not detected in nine samples) and NDBA (0.10–0.56 μg/kg, not detected in 15 samples).
Volatile and non‐volatile nitrosamines were analysed in meat products (dry‐cured smoked ham, bacon, smoked ham medallion and Turkey salami) from local supermarkets in Belgium (Herrmann et al., 2014). Liquid chromatography with tandem mass spectrometry (LC–MS/MS) was used for the analysis. The results were: N‐nitrosohydroxyproline (NHPRO) (9.4 μg/kg), NPRO (5.52 μg/kg), NPYR (1.0 μg/kg), NTCA (171 μg/kg) and NMTCA (22 μg/kg) in dry‐cured smoked ham; NHPRO (2.0 μg/kg), NDMA (2.1 μg/kg), NPYR (1.3 μg/kg) and NTCA (41 μg/kg) in bacon; NDMA (1.8 μg/kg), NPYR (0.4 μg/kg), NTCA (448 μg/kg) and NMTCA (28 μg/kg) in smoked ham medallion; and NHPRO (3.9 μg/kg), NPRO (3.1 μg/kg), N‐nitrosomethylaniline (NMA) (0.6 μg/kg), NTCA (111 μg/kg) and NMTCA (39 μg/kg) in Turkey salami.
In another study, volatile and non‐volatile nitrosamines were analysed in 70 products on the Danish market and 20 products on the Belgian market (Herrmann et al., 2015a). LC–MS/MS was used for the analysis. The LOD values obtained with the described method were generally < 1 mg/kg although with some exceptions. The LOD values for NDBA and NTCA in Kassler were 1.7 and 2.1 mg/kg, respectively; for NDMA and NTCA in bacon were 3.3 and 4.9 mg/kg, respectively; and for NPYR, NTCA and NMTCA in salami were 17.1, 18.4 and 9.4 mg/kg, respectively. Relatively high LOD values were obtained for NTCA and NMTCA, because the ‘natural’ content in the unspiked salami samples was relatively high, i.e. 69 and 18 mg/kg, respectively.
The mean levels of the individual volatile nitrosamines in the Danish products were generally found to be low (≤ 0.8 μg/kg). Higher mean levels (≤ 1.5 μg/kg), although non‐significant, were found in samples taken from the Belgian market. The levels of NDMA ranged from not detectable to 4 μg/kg. The levels of NPYR ranged from not detectable to 13 μg/kg. NDMA > 5 μg/kg occurred in one Belgian sample. NPYR occurred at concentrations > 5 μg/kg in one Danish and one Belgian sample. Only three samples analysed in the survey contained > 10 μg/kg of volatile nitrosamines in total: one Danish sample of smoked filet contained 15 μg/kg and two Belgian samples of chorizo that contained 11.4 and 10.2 μg/kg of volatile nitrosamines.
By contrast, the mean levels of the individual non‐volatile nitrosamines were considerably higher (≤ 118 μg/kg and ≤ 270 μg/kg) than the mean levels of volatile nitrosamines (≤ 0.8 μg/kg and ≤ 1.5 μg/kg) in the Danish and Belgian markets respectively) (Herrmann et al., 2015a). The most frequently detected non‐volatile nitrosamines were NTCA and NMTCA. NTCA occurred at high levels, i.e. up to 2,000 μg/kg. Higher, even non‐significant, mean levels (≤ 270 μg/kg) were found in samples taken from the Belgian market. NSAR was detected in only a few samples and mostly at low levels, except for one smoked filet sample containing 82 μg/kg. This smoked filet sample also contained the highest levels of NPRO (30 μg/kg) and NPYR. NTCA was detected and quantified in all but one sample, i.e. a sample of flank pork. The highest NTCA content (2,000 μg/kg) was found in a sample of ham. NMTCA was detectable and quantifiable in all but seven samples, although at significantly lower levels than NTCA. NTCA also occurred in unsmoked but nitrite‐preserved meat products, although at low levels (18 μg/kg), i.e. in meat sausage (luncheon meat) and boiled ham. The highest level of NMTCA (39 μg/kg) occurred in a sample of salami.
Rywotycki (2002) examined the effects of selected additives and heat treatment on the formation of volatile nitrosamines in pork ham analysed chromatographically. Pork muscle joint samples were injected with brine containing all, some or none of sodium nitrite, sodium ascorbate and polyphosphates. The joints were massaged after injection for 8 h. Duplicate control samples (no injection) were analysed for each set of exposures (each different combination of additives). Nitrosamine concentrations found in the controls ranged from 11.59 to 15.22 μg/kg NDMA and from 11.81 to 15.03 μg/kg NDEA. The pork injected with NaCl, sodium ascorbate, polyphosphates and sodium nitrite presented mean values of 16.85 μg/kg NDMA and 15.49 μg/kg NDEA. The higher values were observed for the samples injected only with sodium nitrite, or in combination with polyphosphates (16.98 μg/kg NDMA, 16.74 μg/kg NDEA and 18.56 μg/kg NDMA, 19.16 μg/kg NDEA, respectively. The values presented show that under certain conditions when nitrites are added, Pasteurisation following the injection treatments reduced the nitrosamine concentrations. The values presented show that under certain conditions ascorbate alone can provide better protection against nitrosamine formation than in combination with polyphosphates. The rate of decrease in nitrite is significantly greater when ascorbate is present and this is even more pronounced in combination with high heat treatment (EFSA, 2003). Ascorbate is more reactive than ascorbic acid. The reactivity of ascorbic acid/ascorbate as a reductant increases with increasing pH (Pegg and Shahidi, 2004). So, the conversion of nitrite into NO, which can react with other meat ingredients, is accelerated in the presence of ascorbate, which can also sequester oxygen and retard the oxidation of NO to NO2 and thus reduce the generation of nitrate (Pegg and Honikel, 2015).
Considering nitrosamides, the Panel noted that nitrosamides, mainly N‐nitroso‐N‐methylurea (NMU), are unstable in aqueous solution, especially at pH > 5; therefore, it is unlikely that they could persist in foods in appreciable amounts. In addition, nitrosation reaction requires an amide precursor (e.g. methylurea or creatinine) and nitrite under high acidic conditions, e.g. those existing in the human stomach (pH 2) (Mende et al., 1991; Sen et al., 2000).
3.1.5.1. Results of systematic review on the types and levels of nitrosamines and nitrosamides in experimental studies with meat products upon addition of nitrates and nitrites (food additive grade)
The Panel considered it important to address the question of which nitrosamines and nitrosamides are produced in food products from the use of nitrates and nitrites as food additives and at which levels they can be found in those food products. Therefore, a systematic review has been performed (see Appendix I) with the objective to select reliable studies performed to identify the type of nitrosamines and nitrosamides and to measure their respective levels in food products found in the European market to which specified amounts of nitrates/nitrites have been added. Based on the search strategy, a total of 33 articles were identified and 10 of them have been evaluated as being of good quality. Out of these 10 articles, there were six studies on meat products with appropriate control samples in which nitrites at known amounts have been added under laboratory conditions which were considered by the Panel and they are summarised in the Annex A of the Appendix I. No relevant studies measuring nitrosamides in meat products were found.
The Panel noted on the basis of these experimental data that:
the compounds found in the meat products used in these studies were the volatile NDMA, NDEA, NDBA, NPIP and NPYR, and the non‐volatile NHPRO, NPRO, NTCA, NMTCA, NPIC and NSAR.
the formation of N‐nitrosamines in these meat products depended on different parameters associated with conditions of preparation (type of meat product, temperature, pH, additives and raw material), storage and thermal processing (cooking, roasting and frying).
the presence of substrates of the nitrosation reaction (free amino acids or biogenic amines) might also have an impact in the formation of NOCs.
studies in which all conditions were held constant and only the amount of nitrites has been changed showed some relationship between nitrites added and the increased formation of some non‐volatiles nitrosamines (NHPRO, NPRO, NTCA and NMTCA).
when nitrites were added at the authorised levels, the volatile nitrosamines NDMA and NDEA (which are of highest toxicological concern) were either not detected or their levels were at or close to the LOQ. They were also occasionally detected at these levels in the absence of nitrites added.
the volatile nitrosamines were more frequently detected and at higher amounts in meat products treated at elevated temperatures and when the nitrite added was much higher than the authorised levels.
3.1.5.2. Summarised concentration data on analytical levels to nitrosamines in meat products in Europe
In order to estimate the dietary exposure of European consumers to the most potent volatile nitrosamines, NDMA and NDEA, the Panel reviewed the available concentration data on analytical levels reported for processed meat products (FCS 8.3.1) where nitrites (E 249 and E 250) is authorised to be used in non‐heat‐treated processed meat (FCS 8.3.1) and in heat‐treated processed meat (FCS 8.3.2).
Recent publications (described in Section 3.1.5) reported analytical results for the volatile nitrosamines, NDMA and NDEA in several processed meat products from Spain (Campillo et al., 2011; n = 21 samples), Denmark (Herrmann et al., 2015a; n = 70 samples), Belgium (Herrmann et al., 2015a; n = 20 samples) and Estonia (Reinik, 2007; n = 175 samples). The mean concentrations (μg/kg) of NDMA and NDEA from these studies are reported in Table 4.
Table 4.
Mean content level of NDMA and NDEA (μg/kg) in meat products in Europe
| Publication | Number of samples | % of data < LOD | % of data < LOQ | Mean content level of NDMA (μg/kg) | Mean content level of NDEA (μg/kg) | Sum of the Mean content level of NDMA + NDEA (μg/kg) |
|---|---|---|---|---|---|---|
| Reinik (2007)a | 175 | NR | NR | NR | NR | 1.8 |
| Herrmann et al. (2015a)b | 70 (Danish market) |
NDMA (50%) NDEA (84%) |
NDMA (NR) NDEA (NR) |
0.7 | 0.04 | 0.7 |
| Herrmann et al. (2015a)b | 20 (Belgium market) |
NDMA (35%) NDEA (100%) |
NDMA (NR) NDEA (100%) |
1.3 | 0 | 1.3 |
| Campillo et al. (2011)c | 21 |
NDMA (9.5%) NDEA (71%) |
NDMA (9.5%) NDEA (71%) |
2.7 | 0.9 | 3.6 |
| Totald | 286 | 1.2 | 0.2 | 1.6 |
NDMA: N‐nitrosodimethylamine; NDEA: N‐nitrosodiethylamine; NR: none reported.
Treatment of data below LOD–LOQ are not described; it is extremely likely that mean contents are expressed on positive samples. LOQ: NDMA = 0.15 μg/kg, NDEA = 0.07 μg/kg; NDMA content ranged from < 10 to 4.0 μg/kg and NDEA content from < 0.07 to 2.7 μg/kg.
Mean calculated from all samples analysed, < LOQ set to LOQ, non‐detectable set to 0. LOD = < 1 μg/kg. NDMA content ranged from non‐detectable to 4 μg/kg and NDEA content ranged from non‐detectable to 0.3 μg/kg.
Estimated by the Panel assuming the middle bound scenario, LOD(Q) = LOD(Q)/2; LOD NDMA = 0.48 μg/kg; LOD NDEA = 0.52 μg/kg. NDMA content ranged from non‐detectable to 5.7 μg/kg and NDEA content ranged from non‐detectable to 3.6 μg/kg.
Sum of the mean content level of NDMA + NDEA calculated by the Panel.
Overall, the Panel noted that the estimates of the mean content of NDMA in European processed meat products ranged from 0.7 to 2.7 μg/kg. The mean content of NDEA ranged from 0.04 to 0.9 μg/kg and the sum of NDMA + NDEA ranged from 0.7 to 3.6 μg/kg.
3.1.6. Technological function
The curing of meat and poultry is one of the oldest forms of food preservation dating back to Roman times (Sindelar and Milkowski, 2012). Sodium and potassium salts of nitrite (as well as nitrate salts) are commonly used in curing mixtures to develop and fix the colour of meat, to inhibit microbial growth or to develop characteristic flavours (IARC, 2010; Sindelar and Milkowski, 2012).
Sensory evaluations indicate that nitrite contributes to the flavour of cured meat, apparently through its role as an antioxidant (Ramarathnam and Rubin, 1994). Nitrite also contributes to characteristic colour development through the formation of nitric oxide in meat, which can react with the haem‐containing compounds to form NOMb, the pigment responsible for the pink colour of cured meats (Honikel, 2008) (see Section 3.1.5).
Nitrites are used in cured meats for their antimicrobial properties. It is likely that the inhibitory mechanism involving nitrites on some bacteria differs among bacterial species and is not considered effective for controlling Gram‐negative enteric pathogens such as Salmonella and Escherichia coli. The antimicrobial mechanism of nitrite is unknown, but it has been suggested that acidified nitrite results in the generation of NO through the intermediate N2O3, as described above, which has potent antibacterial activity against a range of pathogens, including Salmonella, Yersinia and Sheila species, Helicobacter pylori and Pseudomonas aeruginosa (Lundberg et al., 2008). Clostridium botulinum is the most well‐known pathogen associated with the use of nitrite in cured meat products. The first C. botulinum‐controlling effect evoked for nitrites is the inhibition of vegetative cells emerging from surviving spores; a second effect would be the prevention of cell division in any vegetative cells (Pierson and Smooth, 1982). Evidence over the last 20 years shows that nitrites also contribute in the protection from other food‐borne pathogens, such as Listeria monocytogenes, E. coli O157:H7, Staphylococcus aureus and Bacillus cereus, alone or by improving the effectiveness of other antimicrobials (Sindelar and Milkowski, 2012).
It was reported by the SCF (1992) in its Opinion of 19 October 1990, as expressed in section 1.2 of the opinion, and later agreed by the BIOHAZ Panel (EFSA, 2003), that 50–100 mg of added nitrite (as sodium nitrite) per kg of meat product may suffice for many products. In other products, especially those with a low salt content and having a prolonged shelf life, addition of higher amounts up to 150 mg/kg nitrite (as sodium nitrite) is necessary to inhibit the growth of C. botulinum (Pegg and Honikel, 2015).
EFSA (2003) recommended setting in legislation levels of nitrite as an ‘added amount’ instead of the ‘residual amount’ considering that it is the ingoing amount that really contributes to the inhibitory activity against C. botulinum. The aim of this change was in the interest of keeping nitrosamine levels as low as possible and to ensure that the ADI is not exceeded. Furthermore, for control purposes the residual amount of nitrite may also be misleading because most of the initially added nitrite has disappeared to a greater or lesser extent depending on the processing conditions. In general, nitrite disappears at slower rate at higher pH.
3.2. Authorised uses and use levels
Maximum levels of nitrites (E 249 and E 250) have been defined in Annex II to Regulation (EC) No 1333/2008 on food additives, as amended. In this document, these levels are named maximum permitted levels (MPLs).
Currently, nitrites (E 249 and E 250) are authorised food additives in the EU at MPLs ranging from 50 to 180 mg/kg in 18 food categories (considering different restrictions/exceptions).
Table 5 summarises foods that are permitted to contain nitrites (E 249 and E 250) and the corresponding MPLs as set by Annex II to Regulation (EC) No 1333/2008.
Table 5.
MPLs of nitrites (E 249 and E 250) in foods according to the Annex II to Regulation (EC) No 1333/2008
| Food category number | Food category name | E‐number/group | Restrictions/exception | MPL (mg/L or mg/kg as appropriate) |
|---|---|---|---|---|
| 08.2 | Meat preparations as defined by Regulation (EC) No 853/2004 | Nitrites (E 249 and E 250) | Only lomo de cerdo adobado, pincho moruno, careta de cerdo adobada, costilla de cerdo adobada, Kasseler, Bräte, Surfleisch, toorvorst, šašlõkk, ahjupraad, kiełbasa surowa biała, kiełbasa surowa metka, and tatar wołowy (danie tatarskie) | 150a |
| 08.3.1 | Non‐heat‐treated processed meat | Nitrites (E 249 and E 250) | 150a | |
| 08.3.2 | Heat‐treated processed meat | Nitrites (E 249 and E 250) | Except sterilised meat products (Fo > 3.00) | 150a , b |
| 08.3.2 | Heat‐treated processed meat | Nitrites (E 249 and E 250) | Only sterilised meat products (Fo > 3.00) | 100a , b , c |
| 08.3.4.1 | Traditional immersion cured products (meat products cured by immersion in a curing solution containing nitrites and/or nitrates, salt and other components) | Nitrites (E 249 and E 250) | Only Wiltshire bacon and similar products: Meat is injected with curing solution followed by immersion curing for 3–10 days. The immersion brine solution also includes microbiological starter cultures | 175d |
| 08.3.4.1 | Traditional immersion cured products (meat products cured by immersion in a curing solution containing nitrites and/or nitrates, salt and other components) | Nitrites (E 249 and E 250) | Only Wiltshire ham and similar products: Meat is injected with curing solution followed by immersion curing for 3–10 days. The immersion brine solution also includes microbiological starter cultures | 100d |
| 08.3.4.1 | Traditional immersion cured products (meat products cured by immersion in a curing solution containing nitrites and/or nitrates, salt and other components) | Nitrites (E 249 and E 250) | Only Entremeada, entrecosto, chispe, orelheira e cabeca (salgados), toucinho fumado and similar products: Immersion cured for 3–5 days. Product is not heat‐treated and has a high water activity | 175d |
| 08.3.4.1 | Traditional immersion cured products (meat products cured by immersion in a curing solution containing nitrites and/or nitrates, salt and other components) | Nitrites (E 249 and E 250) | Only cured tongue: Immersion cured for at least 4 days and precooked | 50d |
| 08.3.4.1 | Traditional immersion cured products (meat products cured by immersion in a curing solution containing nitrites and/or nitrates, salt and other components) | Nitrites (E 249 and E 250) | Only kylmâsavustettu poronliha/kallrökt renkött: Meat is injected with curing solution followed by immersion curing. Curing time is 14–21 days followed by maturation in cold‐smoke for 4–5 weeks | 150a |
| 08.3.4.1 | Traditional immersion cured products (meat products cured by immersion in a curing solution containing nitrites and/or nitrates, salt and other components) | Nitrites (E 249 and E 250) | Only bacon, filet de bacon and similar products: Immersion cured for 4–5 days at 5–7°C, matured for typically 24–40 h at 22°C, possibly smoked for 24 hrs at 20–25°C and stored for 3–6 weeks at 12–14°C | 150a |
| 08.3.4.1 | Traditional immersion cured products (meat products cured by immersion in a curing solution containing nitrites and/or nitrates, salt and other components) | Nitrites (E 249 and E 250) | Only rohschinken, nassgepökelt and similar products: Curing time depends on the shape and weight of meat pieces for approximately 2 days/kg followed by stabilisation/maturation | 50d |
| 08.3.4.2 | Traditional dry cured products (dry curing process involves dry application of curing mixture containing nitrites and/or nitrates, salt and other components to the surface of the meat followed by a period of stabilisation/maturation) | Nitrites (E 249 and E 250) | Only dry cured bacon and similar products: Dry curing followed by maturation for at least 4 days | 175d |
| 08.3.4.2 | Traditional dry cured products (dry curing process involves dry application of curing mixture containing nitrites and/or nitrates, salt and other components to the surface of the meat followed by a period of stabilisation/maturation) | Nitrites (E 249 and E 250) | Only dry cured ham and similar products: Dry curing followed by maturation for at least 4 days | 100d |
| 08.3.4.2 | Traditional dry cured products (dry curing process involves dry application of curing mixture containing nitrites and/or nitrates, salt and other components to the surface of the meat followed by a period of stabilisation/maturation) | Nitrites (E 249 and E 250) | Only presunto, presunto da pa and paio do lombo and similar products: Dry curing for 10–15 days followed by a 30‐ to 45‐day stabilisation period and a maturation period of at least 2 month | 100d |
| 08.3.4.2 | Traditional dry cured products (dry curing process involves dry application of curing mixture containing nitrites and/or nitrates, salt and other components to the surface of the meat followed by a period of stabilisation/maturation) | Nitrites (E 249 and E 250) | Only rohschinken, trockengepökelt and similar products: Curing time depends on the shape and weight of meat pieces for approximately 10–14 days followed by stabilisation/maturation | 50d |
| 08.3.4.3 | Other traditionally cured products (immersion and dry cured processes used in combination or where nitrite and/or nitrate is included in a compound product or where the curing solution is injected into the product prior to cooking) | Nitrites (E 249 and E 250) | Only rohschinken, trocken‐/nasgepökelt and similar products: Dry curing and immersion curing used in combination (without injection of curing solution). Curing time depends on the shape and weight of meat pieces for approximately 14–35 days followed by stabilisation/maturation | 50d |
| 08.3.4.3 | Other traditionally cured products (immersion and dry cured processes used in combination or where nitrite and/or nitrate is included in a compound product or where the curing solution is injected into the product prior to cooking) | Nitrites (E 249 and E 250) | Only jellied veal and brisket: Injection of curing solution followed, after a minimum of 2 days, by cooking in boiling water for up to 3 h | 50d |
| 08.3.4.3 | Other traditionally cured products (immersion and dry cured processes used in combination or where nitrite and/or nitrate is included in a compound product or where the curing solution is injected into the product prior to cooking) | Nitrites (E 249 and E 250) | Only vysočina, selský salám, turistický trvanlivý salám, poličan, herkules, lovecký salám, dunjaská klobása, paprikás and similar products: Dried product cooked to 70°C followed by 8‐ to 12‐day drying and smoking process. Fermented product subject to 14‐ to 30‐day three‐stage fermentation process followed by smoking | 180a |
MPL: maximum permitted level.
Maximum amount that may be added during the manufacturing, expressed as NaNO2 or NaNO3.
Nitrates may be present in some heat‐treated meat products resulting from natural conversion of nitrites to nitrates in a low‐acid environment.
Fo‐value 3 is equivalent to 3 min heating at 121°C (reduction in the bacterial load of one billion spores in each 1,000 cans to one spore in a thousand cans).
Maximum residual amount, residue level at the end of the production process, expressed as NaNO2 or NaNO3.
Denmark notified in accordance with Article 114(4) of the Treaty on the Functioning of the European Union (TFEU) that it still wishes to maintain national provisions on the use of nitrite additives in meat products that differ from those in regulation (EC) No 1333/2008 of the European Parliament and of the Council of 16 December 2008 on food additives. In this way, Denmark requested to maintain its own national provisions that are more stringent than EU legislation, with a maximum level of 60 mg/kg. The Commission approved through the Commission Decision 2010/561/EU of 25 May 2010, the Danish national measures for a period of 5 years. With the Commission Decision (EU) 2015/826, the EU prolonged this period until 22 May 2018.
3.3. Exposure data
3.3.1. Reported use levels or data on analytical levels of nitrites (E 249 and E 250)
Most food additives in the EU are authorised at a specific MPL. However, a food additive may be used at a lower level than the MPL. Therefore, information on actual use levels is required for performing a more realistic exposure assessment.
In the framework of Regulation (EC) No 1333/2008 on food additives and of Commission Regulation (EU) No 257/2010 regarding the re‐evaluation of approved food additives, EFSA issued a public call13 for occurrence data (usage level and/or concentration data) on nitrites (E 249 and E 250). In response to this call, both types of data on nitrites (E 249 and E 250) were submitted to EFSA by industry and Member States, respectively.
In addition, analytical data on nitrites were collected through a call for annual collection of chemical contaminant occurrence data in food and feed issued by EFSA in December 2010 with a closing date of 1 October of each year.14
3.3.1.1. Summarised data on reported use levels in foods provided by industry
Industry provided EFSA with data on use levels (n = 16) of nitrites (E 249 and E 250) in foods for two out of 18 food categories in which nitrites (E 249 and E 250) are authorised. These use levels were reported as potassium nitrite (n = 6) and sodium nitrite (n = 10).
Updated information on the actual use levels of nitrites (E 249 and E 250) in foods was made available to EFSA by FoodDrinkEurope (FDE) for the following food categories of finished products: non‐heat‐treated processed meat (FCS 08.3.1) and heat‐treated processed meat (FCS 08.3.2).
The Panel noted that the reported usage levels were all identical (minimum, typical and maximum levels) and equal to the MPL for all food categories for which data has been reported.
Appendix A.1 provides data on the use levels of nitrites (E 249 and E 250) in foods as reported by industry.
In 2015, an ad‐hoc study on the monitoring of the implementation of Directive 2006/52/EC as regards the use of nitrites by industry in different categories of meat products was commissioned by Directorate General for Health and Food Safety (DG SANTE) of the European Commission in order to collect technological data about the need for nitrites and information on the use of nitrites in different types of meat products and meat preparations in the EU. The study covers the 28 EU Member States and a total of 108 respondents contributed to the survey, including organisations of food business operators/meat producers or processors (10 respondents), individual meat producers/processors (83 respondents) and respondents from research institutes/universities (nine respondents). For all types of meat preparations, the maximum reported values coincide with the authorised limit provided in the legislation. For non‐heat‐treated processed meat, the overall maximum levels reported go beyond the legal limit (180 mg/kg), while the median remains below. In addition, across all subcategories, the minimum level of nitrites used for the production of non‐heat‐treated processed meat products is 10 mg/kg. For sterilised heat‐treated processed meats, median typical amounts reported largely coincide with the limit provided in the legislation (100 mg/kg), the maxima of typical amounts are significantly higher than this limit. For non‐sterilised heat‐treated processed meat, the median of typical amounts reported lie below the limit provided in the legislation (150 mg/kg), but the overall maximum reported values for other heat‐treated processed meat exceed this limit.
3.3.1.2. Summarised data on concentration levels in food submitted by Member States
In total, 13,787 analytical results were reported to EFSA by 13 countries: Germany (n = 6,792), Hungary (n = 1,390), Ireland (n = 1,089), Slovakia (n = 1,075), Austria (n = 792), Spain (n = 721), Denmark (n = 637), the Czech Republic (n = 451), Belgium (n = 280), Poland (n = 189), Portugal (n = 171), Malta (n = 170) and Slovenia (n = 30). Out of these, 9,353 analytical results were related to foods that are permitted to contain nitrites (E 249 and E 250) as food additives and 4,434 analytical results as nitrites from other foods where nitrites have been considered to be naturally present or due to contamination.
The data on nitrites (E 249 and E 250) as food additives were mainly for non‐heat‐treated processed meat (FCS 08.3.1, n = 1,103), heat‐treated processed meat (FCS 08.3.2, n = 1,309) and traditionally cured meat products (FCS 08.3.4, n = 3,802). Foods were sampled between 2000 and 2014, and majority of them (98%) were analysed the year that they were collected.
The analytical data on nitrites from other sources (natural presence and contamination) were mainly for meat and meat products (n = 1,296), drinking water (n = 1,224), vegetables and vegetable products (n = 453), food for infants and small children (n = 434), and for starchy roots and tubers (n = 351). Foods were sampled between 2000 and 2015, and majority of them (98%) were analysed the year that they were collected. These analytical data were used only for the exposure scenario considering all sources (food additives, natural presence and contaminants) as described in Section 3.5.
Considering data on nitrites (E 249 and E 250), 18.6% analytical results were left‐censored: either not quantified (< LOQ) in 1,450 samples or not detected (< LOD) in 291 samples. Considering data on nitrites from other sources (natural presence and contamination), 50.9% analytical results were left‐censored: either not quantified (< LOQ) in 1,879 samples or not detected (< LOD) in 378 samples. Therefore, it should be noted that the use of middle‐bound (MB) LOD/LOQ values (half of LOD or LOQ) in the exposure assessment (Sections 3.4 and 3.5), may have resulted in either an overestimation, where nitrites (E 249 and E 250) or nitrites from other sources were not present, or underestimation, where the concentration was between the MB and LOQ/LOD value, but the analytical method was not able to detect or quantify it.
Regarding the sampling strategy, 872 data on nitrites (E 249 and E 250) and 635 data on nitrites from other sources (natural presence and contamination) were excluded due to not appropriate sampling strategy (e.g. suspect sampling).
Occurrence data sampled from 2000 to 2006 (4,880 records from Germany and Slovakia) were considered as obsolete and were removed from the assessment. Out of these, 4,208 results were on nitrites (E 249 and E 250) and 672 results were on nitrites from other sources (natural presence and contamination).
Complete information on the methods of analysis (e.g. validation) was not made available to EFSA, but the majority (95%) of samples were derived from accredited laboratories.
The Panel considered only exposure resulting from authorised uses with occurrence levels not exceeding the MPLs due to the fact that results over MPL is part of risk management measures, e.g. non‐compliance purpose. For this reason, such analytical results over the MPLs (n = 35) were not used in the present exposure assessment.
Overall, 7,365 analytical results, 4,600 results reported for nitrites (E 249 and E 250) and 2,765 results reported for nitrites from other sources (natural presence and contamination), were considered by the Panel in the present exposure assessment. For the scenario considering only nitrites (E 249 and E 250) as food additives, data were available for different meat products which correspond to 17 food categories out of 18 in which nitrites (E 249 and E 250) are authorised as food additives (Annex II to Regulation No 1333/2008).
As a part of analytical data was reported on salts, a conversion factor was applied to convert those data into nitrite ion: for sodium nitrite, the analytical results were divided by 1.5. No analytical data were reported as potassium nitrite.
Appendix A.2 shows the analytical results of nitrites (E 249 and E 250) and nitrites from other sources (natural presence or contamination) in foods as reported by Member States.
The Panel noted that in Denmark lower MPL of nitrites apply.15 On average, the limited number of products sampled in Denmark presented lower levels of nitrites (E 249 and E 250) than those from the other countries. Concerning the analytical results reported from Demark for the food categories in which the use of nitrites (E 249 and E 250) is authorised, for non‐heat‐treated processed meat (FCS 08.3.1), the mean middle bound (MB) value reported by Denmark was 6.5 mg/kg (n = 10) and the reported mean value for the other EU member states (MS) (excluding Denmark) was 11.3 mg/kg (n = 633). For heat‐treated processed meat (FCS 08.3.2), the mean MB value reported by Denmark was 5.6 mg/kg (n = 36) and the reported mean value for the other EU MS (excluding Denmark) was 11.6 mg/kg (n = 454). For traditional cured products (FCS 08.3.4), the mean MB value reported by Denmark was 11.1 mg/kg (n = 63) and the reported mean value for the other EU MS (excluding Denmark) was 15.7 mg/kg (n = 2,543).
3.3.1.3. Summarised data extracted from the Mintel's GNPD database
The GNPD is an online database which monitors product introductions in consumer packaged goods markets worldwide. It contains information of over 2 million food and beverage products of which more than 900,000 are or have been available on the European food market. Mintel started covering EU's food markets in 1996, currently having 20 out of its 28 member countries and Norway presented in the GNPD.16
For the purpose of this Scientific Opinion, the GNPD17 was used for checking the labelling of products containing nitrites (E 249 and E 250) within the EU's food products as GNPD shows the compulsory ingredient information presented in the labelling of products.
In the 20 EU countries, nitrites (E 249 and E 250) are labelled on products (n = 17,937) mainly of ‘Processed Fish, Meat & Egg Products’, ‘Meals & Meal Centers’, ‘Dairy’, ‘Snacks’, ‘Side Dishes’ and ‘Savoury Spreads’.
Appendix B presents the percentage of the food products labelled with nitrites (E 249 and E 250) within the last 5 years, out of the total number of food products per food subcategories according to the Mintel food classification.
3.3.2. Food consumption data used for exposure assessment
3.3.2.1. EFSA Comprehensive European Food Consumption Database
Since 2010, the EFSA Comprehensive European Food Consumption Database (Comprehensive Database) has been populated with national data on food consumption at a detailed level. Competent authorities in the European countries provide EFSA with data on the level of food consumption by the individual consumer from the most recent national dietary survey in their country (cf. Guidance of EFSA on the ‘Use of the EFSA Comprehensive European Food Consumption Database in Exposure Assessment’ (EFSA, 2011a). New consumption surveys recently18 added in the Comprehensive database were also taken into account in this assessment.9
The food consumption data gathered by EFSA were collected by different methodologies and thus direct country‐to‐country comparisons should be interpreted with caution. Depending on the food category and the level of detail used for exposure calculations, uncertainties could be introduced owing to possible subjects’ underreporting and/or misreporting of the consumption amounts. Nevertheless, the EFSA Comprehensive Database represents the best available source of food consumption data across Europe at present.
Food consumption data from the following population groups: infants, toddlers, children, adolescents, adults and the elderly were used for the exposure assessment. For the present assessment, food consumption data were available from 33 different dietary surveys carried out in 19 European countries (Table 6).
Table 6.
Population groups considered for the exposure estimates of nitrites (E 249 and E 250)
| Population | Age range | Countries with food consumption surveys covering more than 1 day |
|---|---|---|
| Infants | From more than 12 weeks up to and including 11 months of age | Bulgaria, Denmark, Finland, Germany, Italy, UK |
| Toddlers | From 12 months up to and including 35 months of age | Belgium, Bulgaria, Denmark, Finland, Germany, Italy, Netherlands, Spain, UK |
| Childrena | From 36 months up to and including 9 years of age | Austria, Belgium, Bulgaria, Czech Republic, Denmark, Finland, France, Germany, Greece, Italy, Latvia, Netherlands, Spain, Sweden, UK |
| Adolescents | From 10 years up to and including 17 years of age | Austria, Belgium, Cyprus, Czech Republic, Denmark, Finland, France, Germany, Italy, Latvia, Spain, Sweden, UK |
| Adults | From 18 years up to and including 64 years of age | Austria, Belgium, Czech Republic, Denmark, Finland, France, Germany, Hungary, Ireland, Italy, Latvia, Netherlands, Romania, Spain, Sweden, UK |
| The elderlya | From 65 years of age and older | Austria, Belgium, Denmark, Finland, France, Germany, Hungary, Ireland, Italy, Romania, Sweden, UK |
The terms ‘children’ and ‘the elderly’ correspond, respectively, to ‘other children’ and the merge of ‘elderly’ and ‘very elderly’ in the Guidance of EFSA on the ‘Use of the EFSA Comprehensive European Food Consumption Database in Exposure Assessment’ (EFSA, 2011a).
Consumption records were codified according to the FoodEx classification system (EFSA, 2011b). Nomenclature from the FoodEx classification system has been linked to the food categorisation system (FCS) as presented in Annex II of Regulation (EC) No 1333/2008, part D, to perform exposure estimates. In practice, FoodEx food codes were matched to the FCS food categories.
3.3.2.2. Food categories considered for the exposure assessment of nitrites (E 249 and E 250)
The food categories in which the use of nitrites (E 249 and E 250) is authorised were selected from the nomenclature of the EFSA Comprehensive Database (FoodEx classification system), at the most detailed level possible (up to FoodEx Level 4) (EFSA, 2011b).
Some food categories or their restrictions/exceptions are not referenced in the EFSA Comprehensive Database and could therefore not be taken into account in the present estimate. This may have resulted in an underestimation of the exposure. The food category which was not taken into account is described below:
08.2 Meat preparations as defined by Regulation (EC) No 853/2004, only lomo de cerdo adobado, pincho moruno, careta de cerdo adobada, costilla de cerdo adobada, Kasseler, Bräte, Surfleisch, toorvorst, šašlõkk, ahjupraad, kiełbasa surowa biała, kiełbasa surowa metka, and tatar wołowy (danie tatarskie).
For the following food categories, the restrictions/exceptions (or the food category as such, FCS 08.3.1) which apply to the use of nitrites (E 249 and E 250) could not be taken into account, and therefore, specific assumptions were applied and the whole food category was considered in the exposure assessment. This may have resulted in an overestimation of the exposure:
08.3.1 Non‐heat‐treated processed meat;
08.3.2 Heat‐treated processed meat, except sterilised meat products (Fo > 3.00);
08.3.2 Heat‐treated processed meat, only sterilised meat products (Fo > 3.00);
08.3.4.1 Traditional immersion cured products, only Wiltshire bacon and similar products;
08.3.4.1 Traditional immersion cured products, only Wiltshire ham and similar products;
08.3.4.1 Traditional immersion cured products, only Entremeada, entrecosto, chispe, orelheira e cabeca (salgados), toucinho fumado and similar products;
08.3.4.1 Traditional immersion cured products, only cured tongue;
08.3.4.1 Traditional immersion cured products, only kylmâsavustettu poronliha/kallrökt renkött;
08.3.4.1 Traditional immersion cured products, only bacon, filet de bacon and similar products;
08.3.4.1 Traditional immersion cured products, only rohschinken, nassgepökelt and similar products;
08.3.4.2 Traditional dry cured products, only dry cured bacon and similar products;
08.3.4.2 Traditional dry cured products, only dry cured ham and similar products;
08.3.4.2 Traditional dry cured products, only presunto, presunto da pa and paio do lombo and similar products;
08.3.4.2 Traditional dry cured products, only rohschinken, trockengepökelt and similar products;
08.3.4.3 Other traditionally cured products, only rohschinken, trocken‐/nasgepökelt and similar products;
08.3.4.3 Other traditionally cured products, only jellied veal and brisket;
08.3.4.3 Other traditionally cured products, only vysočina, selský salám, turistický trvanlivý salám, poličan, herkules, lovecký salám, dunjaská klobása, paprikás and similar products.
In particular, the following assumptions were applied:
the food category ‘non‐heat‐treated processed meat’ (FCS 08.3.1.) was linked to the FoodEx category ‘fresh and lightly cooked sausage’;
the food category ‘heat‐treated processed meat’ (FCS 08.3.2.) was linked to the FoodEx category ‘cooked sausage’;
the food categories within ‘traditionally cured meat products’ (FCS 08.3.4.) were linked to the FoodEx categories ‘uncooked smoked sausage’, ‘cooked smoked sausage’, ‘semi‐dry sausage’, ‘dry sausage’ and ‘preserved meat’.
For the scenarios considering nitrites (E 249 and E 250) as food additives, 17 food categories were considered in the exposure assessment without taking into account the restrictions/exceptions as set in Annex II to Regulation (EC) No 1333/2008. One food category was not taken into account in the exposure assessment because this is not referenced in the EFSA Comprehensive Database. Overall, for the regulatory maximum level exposure scenario, 17 food categories were considered in the present exposure assessment to nitrites (E 249 and E 250) (Appendix C.1).
For the scenario considering all sources (food additives, natural presence and contamination), besides the food categories in which nitrites (E 249 and E 250) are authorised as a food additive (Annex II to Regulation No 1333/2008), additional food commodities, in which nitrites occur naturally or as contaminants, were considered to perform exposure estimates (Section 3.4.1).
Also, in this case, some food commodities of the EFSA Comprehensive Database were not taken into account because no concentration data (or very few) were provided to EFSA, including alcoholic beverages (2 analytical results), animal and vegetable fats and oils (no data), eggs and egg products (no data), herbs, spices and condiments (1 analytical result on herbs and 23 analytical results for salts, seasonings and extracts), fruit and vegetable juices (2 analytical results), legumes, nuts and oilseeds (no data), non‐alcoholic beverages (except milk‐based beverages) (6 analytical results, 5 left‐censored), infant formulae and follow‐on formulae (4 analytical results), products for special nutritional use (no data), snacks, desserts and other foods (2 analytical results for ice and desserts and 51 analytical results for other foods (foods which cannot be included in any other group) including samples of ‘irrigation water through borehole’ or ‘brine solution’ or ‘service water’) and sugar and confectionary (2 analytical results).
In most cases, the FoodEx level 2 category were used to link occurrence and consumption data. Only in the case of drinking water, fish and other seafood, fruit and fruit products, grains and grain‐based products and starchy roots and tubers the FoodEx level 1 category was used. The FoodEx level 2 category for which limited or no occurrence data were available have been excluded from the assessment or the concentration level for the corresponding FoodEx level 1 category was used.
For the following FoodEx level 3 category, relatively high levels of nitrites were identified, and therefore, this FoodEx level was used to link occurrence and consumption data:
ready‐to‐eat meal for infants and young children;
livestock meat, preserved meat and sausages;
leaf vegetables.
Similarly, for the FoodEx level 3 category having limited or no occurrence data available, they were excluded from the assessment or the concentration value for the corresponding FoodEx level 2 category was used.
For specific FoodEx categories, ad hoc assumptions have been considered in order to overcome lack or poorness of data:
For specific FoodEx category ‘Composite food’, the concentration level assigned to food categories at the FoodEx level 2 was based on the levels related to the main ingredients (for example for potato‐based meals, the concentration level of nitrites in potatoes and potatoes products was used).
Limited information were available for infant formulae and follow‐on formulae (powder infant formulae: n = 2; powder follow‐on formulae: n = 2). Based on information from the literature (Hord et al., 2011), nitrites were considered as absent in infant formulae and follow‐on formulae, both liquid and powder.
The addition of nitrite (E 249 and E 250) is not authorised in fresh meat and fresh meat preparations, nevertheless, several analytical results reported to EFSA resulted as positive. In the present assessment, reported results on mean middle bound concentration for fresh meat ranged from 6.7 mg/kg for different types of livestock meat to 24.6 mg/kg for edible offal of farmed animals. In particular, based on the reported analytical results, the nitrite mean middle bound concentration level was 9.7 mg/kg for fresh pork/piglet meat (n = 5) and 11.6 mg/kg for poultry (n = 33). These values are higher than the mean values available in literature and are likely to be an overestimation of the nitrite concentration in fresh meat. In 2012, Iammarino et al. (2013), conducted an investigation on 200 samples of beef, pork, equine and chicken fresh meats from local markets of Foggia (Italy) to trace quantifiable concentrations of nitrite. The analyses were carried out by a validated ion chromatography with conductometric detection method. Nitrites resulted absent in all fresh meat samples (with concentration smaller than LOQ = 4.5 mg/kg). In addition, despite a careful check of the occurrence data, it cannot be excluded that some of the samples classified as fresh meat which resulted as positive to nitrite may, in reality, referred to as processed meat, especially for samples of pork meat and poultry. Indeed, initially, a wrong classification was identified for 361 analytical results of fresh meat that, on the basis of the information reported on food description and processing description, were reclassified mostly as ‘meat products’ (FCS 08.3). The levels of nitrite in fresh meat, and consequently, the exposure to nitrite from all sources, could therefore be overestimated.
3.4. Exposure to nitrites (E 249 and E 250) from their use as food additives
The Panel estimated chronic exposure to nitrites (E 249 and E 250) for the following population groups: infants, toddlers, children, adolescents, adults and the elderly. Dietary exposure to nitrites (E 249 and E 250) was calculated by multiplying nitrites (E 249 and E 250) concentrations for each food category (Appendix C.1) with their respective consumption amount per kilogram of body weight for each individual in the Comprehensive Database. The exposure per food category was subsequently added to derive an individual total exposure per day. These exposure estimates were averaged over the number of survey days, resulting in an individual average exposure per day for the survey period. Dietary surveys with only 1 day per subject were excluded as they are considered as not adequate to assess repeated exposure.
This was carried out for all individuals per survey and per population group, resulting in distributions of individual exposure per survey and population group (Table 6). On the basis of these distributions, the mean and 95th percentile of exposure were calculated per survey and per population group. The 95th percentile of exposure was only calculated for those population groups where the sample size was sufficiently large to allow this calculation (EFSA, 2011a). Therefore, in the present assessment, 95th percentile of exposure for infants from Italy and for toddlers from Belgium, Italy and Spain were not included.
Two exposure scenarios were defined and carried out by the ANS Panel regarding the concentration data of nitrites (E 249 and E 250) used: (1) MPLs as set down in the EU legislation (defined as the regulatory maximum level exposure assessment scenario); and (2) the reported analytical data (defined as the refined exposure assessment scenario). These two scenarios are discussed in detail below.
3.4.1. Regulatory maximum level exposure assessment scenario
The regulatory maximum level exposure assessment scenario is based on the MPLs as set in Annex II to Regulation (EC) No 1333/2008 and listed in Table 5.
Food categories were included in the exposure assessment without considering the restrictions/exceptions (as described in Section 3.2) as set in Annex II to Regulation (EC) No 1333/2008, and the highest MPL was considered for each subcategory in the exposure assessment. The Panel considers the exposure estimates derived following this scenario as the most conservative as it is assumed that the population groups will be exposed to nitrites (E 249 and E 250) present in food at the MPL over a longer period of time.
3.4.2. Refined exposure assessment scenario
The refined exposure assessment scenario was only based on analytical results reported by Member States since the Panel decided not to further consider use levels reported by the industry because, for each food category, they were all identical and equal to the MPL.
This exposure scenario can consider only food categories for which the above data were available to the Panel.
Appendix C.1 summarises the concentration levels of nitrites (E 249 and E 250) used in the refined exposure assessment scenario considering their use as food additives. Based on the available data set, the Panel calculated two refined exposure estimates based on different model populations:
-
The brand‐loyal consumer scenario: It was assumed that a consumer is exposed long‐term to nitrites (E 249 and E 250) present at the 95th percentile of reported analytical level for one food category. This exposure estimate was calculated as follows:
-
–
Combining food consumption with the 95th percentile of the analytical results for the main contributing food category at the individual level.
-
–
Using the mean of analytical results for the remaining food categories.
-
–
The non‐brand‐loyal consumer scenario: It was assumed that a consumer is exposed long‐term to nitrites (E 249 and E 250) present at the mean reported analytical levels in food. This exposure estimate was calculated using the mean of analytical results for all food categories.
In the two refined exposure assessment scenarios, the concentration levels considered by the Panel were extracted from the whole data set (i.e. analytical results). To consider left‐censored analytical data (i.e. analytical results < LOD or < LOQ), the substitution method as recommended in the ‘Principles and Methods for the Risk Assessment of Chemicals in Food’ (WHO, 2009) and the EFSA scientific report ‘Management of left‐censored data in dietary exposure assessment of chemical substances’ (EFSA, 2010) were used. In the present opinion, analytical data below LOD or LOQ were assigned half of LOD or LOQ, respectively (middle bound (MB)). Subsequently, per food category, the mean or median, whichever is highest, MB concentration was calculated.
3.4.3. Dietary exposure to nitrites (E 249 and E 250) from their use as food additives
Table 7 summarises the estimated exposure to nitrites (E 249 and E 250) from their use as food additives in six population groups (Table 6) according to the different exposure scenarios. Detailed results per population group and survey are presented in Appendix C.2.
Table 7.
Summary of dietary exposure to nitrites (expressed as nitrite ion) from their use only as food additives (E 249 and E 250) in the maximum level exposure assessment scenario and in the refined exposure scenarios, in six population groups (minimum–maximum across the dietary surveys in mg/kg bw per day)
| Infants (12 weeks–11 months) | Toddlers (12–35 months) | Children (3–9 years) | Adolescents (10–17 years) | Adults (18–64 years) | The elderly (≥ 65 years) | |||||||
|---|---|---|---|---|---|---|---|---|---|---|---|---|
| Min | Max | Min | Max | Min | Max | Min | Max | Min | Max | Min | Max | |
| Maximum level exposure assessment scenario | ||||||||||||
| Mean | 0.01 | 0.14 | 0.1 | 0.36 | 0.03 | 0.27 | 0.04 | 0.22 | 0.06 | 0.18 | 0.04 | 0.13 |
| 95th percentile | 0.06 | 0.6 | 0.41 | 0.85 | 0.15 | 0.8 | 0.14 | 0.65 | 0.18 | 0.55 | 0.14 | 0.34 |
| Refined estimated exposure assessment scenario | ||||||||||||
| Brand‐loyal scenario | ||||||||||||
| Mean | < 0.01 | 0.02 | 0.03 | 0.06 | 0.01 | 0.06 | 0.01 | 0.05 | 0.01 | 0.04 | 0.01 | 0.03 |
| 95th percentile | 0.01 | 0.09 | 0.11 | 0.15 | 0.04 | 0.16 | 0.04 | 0.14 | 0.03 | 0.11 | 0.03 | 0.08 |
| Non‐brand‐loyal scenario | ||||||||||||
| Mean | < 0.01 | 0.01 | 0.01 | 0.03 | < 0.01 | 0.02 | < 0.01 | 0.02 | 0.01 | 0.02 | < 0.01 | 0.01 |
| 95th percentile | < 0.01 | 0.04 | 0.04 | 0.07 | 0.01 | 0.08 | 0.01 | 0.07 | 0.01 | 0.05 | 0.01 | 0.03 |
From the regulatory maximum level exposure assessment scenario, mean exposure to nitrites (expressed as nitrite ion) from their use as food additives (E 249 and E 250) ranged from 0.01 mg/kg bw per day in infants to 0.36 mg/kg bw per day in toddlers. The 95th percentile of exposure to nitrites (expressed as nitrite ion) from their use as food additives (E 249 and E 250) ranged from 0.06 mg/kg bw per day in infants to 0.85 mg/kg bw per day in toddlers.
From the refined estimated exposure scenario, considering concentration levels not exceeding the MPLs for food categories listed under Annex II to Regulation No 1333/2008, in the brand‐loyal scenario, mean exposure to nitrites (expressed as nitrite ion) from their use as food additives (E 249 and E 250) ranged from < 0.01 mg/kg bw per day in infants to 0.06 mg/kg bw per day in toddlers and children. The high exposure to nitrites (expressed as nitrite ion) from their use as food additives (E 249 and E 250) ranged from 0.01 mg/kg bw per day in infants to 0.16 mg/kg bw per day in children. In the non‐brand‐loyal scenario, mean exposure to nitrites (expressed as nitrite ion) from their use as food additives (E 249 and E 250) ranged from < 0.01 mg/kg bw per day in infants, children, adolescents and the elderly to 0.03 mg/kg bw per day in toddlers. The 95th percentile of exposure to nitrites (expressed as nitrite ion) from their use as food additives (E 249 and E 250) ranged from < 0.01 mg/kg bw per day in infants to 0.08 mg/kg bw per day in children.
From all exposure scenarios considered for exposure assessment of nitrites (expressed as nitrite ion) from their use as food additives (E 249 and E 250), the most important contributors to the total mean exposure for all population groups were sausages and preserved meat, while pastes, pâtés and terrines and meat specialities contributed less. The food categories and their contribution to the exposure to nitrites (E 249 and E 250) are presented in Appendixes C.3 and C.4.
3.4.4. Uncertainty analysis
Uncertainties in the exposure assessment of nitrites (E 249 and E 250) have been discussed above. In accordance with the guidance provided in the EFSA opinion related to uncertainties in dietary exposure assessment (EFSA, 2007), the following sources of uncertainties have been considered and summarised in Table 8.
Table 8.
Qualitative evaluation of influence of uncertainties on the dietary exposure estimate
| Sources of uncertainties | Directiona |
|---|---|
| Consumption data: different methodologies/representativeness/underreporting/misreporting/no portion size standard | +/− |
| Use of data from food consumption survey of a few days to estimate long‐term (chronic) exposure for high percentiles (95th percentile) | + |
| Correspondence of analytical data to the food items in the EFSA Comprehensive Food Consumption Database: uncertainties to which types of food the levels refer to | +/− |
| Food categories selected for the exposure assessment: exclusion of food categories due to missing FoodEx linkage (n = 1/18 food categories) | − |
| Food categories selected for the exposure assessment: inclusion of food categories without considering the restriction/exception (n = 17 for the MPL and refined scenarios out of 18 food categories) | + |
|
Concentration data:
|
+/− |
|
Regulatory maximum level exposure assessment scenario:
|
+ |
|
Refined exposure assessment scenarios:
|
+/− |
| Uncertainty in possible national differences in use levels of food categories | +/− |
+, uncertainty with potential to cause overestimation of exposure; −, uncertainty with potential to cause underestimation of exposure.
Overall, the Panel considered that the uncertainties identified would, in general, result in an overestimation of the exposure to nitrites (E 249 and E 250) as food additives in European countries for the regulatory maximum level exposure scenario and for the refined scenario considering that it was not possible to include a number of restrictions.
3.5. Exposure to nitrites from all sources (food additives, natural presence and contamination)
The analytical levels provided by the Member States reflect the levels of nitrites in foods, whatever their origin (food additives, natural presence and contamination). In fact, numerous analytical data were reported on food categories in which nitrites (E 249 and E 250) are not authorised as food additives (Annex II to Regulation (EC) No 1333/2008).
The exposure estimated using all analytical data should reflect more closely what is ingested through the diet via all sources for which data are available and thus, should represent the exposure coming from all dietary sources. Therefore, the Panel calculated the exposure to nitrites from all sources in a separate scenario (defined as general population scenario all sources), considering besides the food categories in which nitrites (E 249 and E 250) are authorised as a food additive (Annex II to Regulation (EC) No 1333/2008), additional food commodities, in which nitrites occur as naturally or due to a contamination.
Appendix D.1 summarises the levels of nitrites used in the exposure assessment scenario considering all sources.
Table 9 summarises the estimated exposure to nitrites from all sources (food additives, natural presence and contamination) in six population groups (Table 6). Detailed results per population group and survey are presented in Appendix D.2.
Table 9.
Summary of dietary exposure to nitrites (expressed as nitrite ion) from all sources (food additives, natural presence and contamination) based on all analytical data using the refined exposure scenario (non‐brand‐loyal approach for general population) in six population groups (min–max across the dietary surveys in mg/kg bw per day and in mg/day)
| General population scenario all sources | ||||||||||||
|---|---|---|---|---|---|---|---|---|---|---|---|---|
| Infants (12 weeks–11 months) | Toddlers (12–35 months) | Children (3–9 years) | Adolescents (10–17 years) | Adults (18–64 years) | The elderly (≥ 65 years) | |||||||
| Min | Max | Min | Max | Min | Max | Min | Max | Min | Max | Min | Max | |
| Mean | 0.05 | 0.1 | 0.1 | 0.15 | 0.07 | 0.11 | 0.04 | 0.07 | 0.03 | 0.05 | 0.03 | 0.05 |
| 95th percentile | 0.1 | 0.18 | 0.16 | 0.19 | 0.12 | 0.2 | 0.07 | 0.14 | 0.05 | 0.1 | 0.05 | 0.08 |
From the exposure scenario considering the exposure to nitrites (expressed as nitrite ion) from all sources (food additives, natural presence and contamination), mean exposure ranged from 0.03 mg/kg bw per day in adults and the elderly to 0.15 mg/kg bw per day in toddlers. The high exposure to nitrites ranged from 0.05 mg/kg bw per day in adults and the elderly to 0.2 mg/kg bw per day in children.
In addition, the Panel calculated the contribution of the mean exposure to nitrites (expressed as nitrite ion) from their use as food additives (E 249 and E 250) to overall exposure to nitrites from all sources (food additives, natural presence and contamination) (Table 10).
Table 10.
Percentage of contribution of the mean exposure to nitrites (E 249 and E 250) from their use as food additives to overall exposure to nitrites from all sources (food additives, natural presence and contamination)
| General population scenario all sources | ||||||||||||
|---|---|---|---|---|---|---|---|---|---|---|---|---|
| Infants (12 weeks–11 months) | Toddlers (12–35 months) | Children (3–9 years) | Adolescents (10–17 years) | Adults (18–64 years) | The elderly (≥ 65 years) | |||||||
| % | % | % | % | % | % | |||||||
| Min | Max | Min | Max | Min | Max | Min | Max | Min | Max | Min | Max | |
| Contribution from their use as food additives | 1.5 | 12.2 | 8.9 | 27.0 | 3.2 | 25.8 | 7.6 | 30.8 | 12.6 | 36.0 | 8.7 | 27.2 |
The same uncertainties presented above (Section 3.4.4) for the refined exposure to nitrites (E 249 and E 250) from their use as food additives are as well valid for the refined exposure estimates to nitrites from all sources (food additives, natural presence and contamination). In addition, uncertainty is associated to the nitrite levels used for diverse food groups where nitrite is naturally present or as contamination, in particular, composite food, poultry and livestock meat.
The Panel estimated that, when comparing all sources (food additives, natural presence and contamination), using the same refined exposure methodology (non‐brand‐loyal consumer scenario for general population), the contribution of nitrites (E 249 and E 250) from their use as food additives may represent approximately 17% (range 1.5–36.0%) of the overall exposure to nitrites.
The main contributing food categories from the exposure scenario considering all sources (food additives, natural presence and contamination) were composite food, fruit and fruit products, poultry, livestock meat and cheese. In infants, also foods for infants and toddlers made an important contribution to the total mean exposure to nitrites from all sources.
The Panel noted that in all population groups, apart from infants, sausages and preserved meat, which were food categories considered to contain nitrites (E 249 and E 250) as food additives, were also important contributors to the total mean exposure to nitrites from all sources. Sausages contributed up to 23.6% (in adults) and preserved meat up to 15.2% (in the elderly) to the total mean exposure to nitrites from all sources.
The Panel noted that its exposure estimates from all sources were in line with results published in a French study (Menard et al., 2008). Major food contributors to exposure to nitrites identified in this study were ‘industrially prepared meat products’ and ‘meat products’. The study also highlighted that food items, for which the use of nitrite as food additives is allowed, were the major contributors as compared to other food items.
The food categories and their contribution to the exposure to nitrites from all sources (food additives, natural presence and contamination) are presented in detail in Appendixes D.3 and D.4.
3.5.1. Dietary exposure to volatiles nitrosamines (NDMA, NDEA and their sum) from the use of nitrites as a food additive
The Panel estimated the exposure of the individual to NDMA and NDEA and their sum combining a mean weighted content of 1.2, 0.2 and 1.6 μg/kg, respectively, from all publications, as described in Table 4 (Section 3.1.5) with chronic consumption data for consumers only of processed meat products (FCS 8.3.1) from the EFSA Comprehensive European Food Consumption Database.
The analysis results for processed meat products reported in the publications did not show major differences in the levels of NDMA + NDEA between the different products analysed; therefore, the Panel decided to calculate estimates for consumers only of processed meat products using the same FoodEx categories considered in the assessment of exposure to nitrites as a food additive.
Exposure scenarios for volatile nitrosamines (NDMA, NDEA and their sum) are presented in Table 11. Detailed results by population group and survey are given in Appendix E.
Table 11.
Estimated exposure of consumers only of processed meat products to volatiles nitrosamines (NDMA, NDEA and their sum in ng/kg bw per day) (number of surveys)
| Estimated exposure (ng/kg bw per day) | Infants (12 weeks–11 months) | Toddlers (12–35 months) | Children (3–9 years) | Adolescents (10–17 years) | Adults (18–64 years) | Elderly (≥ 65 years) |
|---|---|---|---|---|---|---|
| NDMA | ||||||
| Mean | 0.2–1.1 (6) | 0.9–2.6 (9) | 0.2–2.0 (18) | 0.3–1.6 (17) | 0.5–1.3 (17) | 0.4–0.9 (14) |
| High level | 0.4–4.4 (5) | 3.8–6.2 (7) | 1.2–5.5 (18) | 1.1–4.7 (17) | 1.4–3.8 (17) | 1.1–2.3 (14) |
| NDEA | ||||||
| Mean | 0.03–0.2 (6) | 0.2–0.4 (9) | 0.05–0.3 (18) | 0.05–0.3 (17) | 0.1–0.2 (17) | 0.1–0.2 (14) |
| High level | 0.3–0.7 (5) | 0.6–1.0 (7) | 0.2–0.9 (18) | 0.2–0.8 (17) | 0.2–0.6 (17) | 0.2–0.4 (14) |
| Sum NDMA + NDEA | ||||||
| Mean | 0.2–1.4 (6) | 1.2–3.5 (9) | 0.3–2.6 (18) | 0.4–2.1 (17) | 0.6–1.7 (17) | 0.5–1.2 (14) |
| High level | 0.5–5.8 (5) | 5.0–8.3 (7) | 1.6–7.3 (18) | 1.4–6.3 (17) | 1.9–5.1 (17) | 1.5–3.1 (14) |
NDMA: N‐nitrosodimethylamine; NDEA: N‐nitrosodiethylamine; bw: body weight.
The Panel noted that the mean estimated exposure of consumers only to the volatile nitrosamine NDMA in processed meat products, in which the use of nitrites as an additive is permitted, ranged from 0.2 ng/kg bw per day in infants to 2.6 ng/kg bw per day in toddlers. The high level exposure ranged from 0.4 ng/kg bw per day in infants to 6.2 ng/kg bw per day in toddlers.
The mean estimated exposure of consumers only to the volatiles nitrosamine NDEA in processed meat products in which the use of nitrites as an additive is permitted ranged from 0.03 ng/kg bw per day in infants to 0.4 ng/kg bw per day in toddlers. The high level exposure ranged from 0.2 ng/kg bw per day in children to 1.0 ng/kg bw per day in toddlers.
The mean estimated exposure of consumers only to volatile nitrosamines (sum of NDMA + NDEA) in processed meat products in which the use of nitrites as an additive is permitted ranged from 0.2 ng/kg bw per day in infants to 3.5 ng/kg bw per day in toddlers. The high level exposure ranged from 0.5 ng/kg bw per day in infants to 8.3 ng/kg bw per day in toddlers.
From these estimates, the Panel noted that NDMA is the main nitrosamine compound contributing to the mean and high level accounting for ~ 90% of exposure to volatile nitrosamines; NDEA accounts for around 10%.
The Panel also noted that, according to a review by Herrmann et al. (2015b) of papers published during 1990–2010 in three European countries (Finland, the Netherlands and Germany), mean estimates of exposure to volatile nitrosamines from all foods ranged from 1.0 ng/kg bw per day (NDMA only) to 12 ng/kg bw per day (sum of NDMA, NPYR, NPIP).
Mean exposure to volatile nitrosamines (sum of NDMA, NPYR) from the consumption of processed/cured meat products have been reported for Denmark and Germany (Herrmann et al., 2015b), Estonia (Reinik et al., 2007) and Spain (Campillo et al., 2011). Mean estimates from these studies ranged from 0.13 to 2.1 ng/kg bw per day in the adult population and from 0.45 to 3.2 ng/kg bw per day in children.
The Panel noted that the exposure estimates from Herrmann et al. (2015b) indicated that the classical volatile nitrosamines (NDMA, NPYR, NPIP, NDEA) accounted for approximately 90% of the total exposure to volatile nitrosamines from which NDMA and NPYR are contributing for 40–50%.
Moreover, the Panel noted that exposure estimates done in this opinion for European population groups consuming only processed meat products to volatiles nitrosamines (sum of NDMA + NDEA) were in the same range as that reported in the literature.
3.6. Biological and toxicological data
No new toxicokinetic or toxicological studies were submitted to EFSA following a public call for data. A literature search was conducted on the most commonly available online databases for toxicological and biological information (PubMed, Toxnet and Chemical Abstracts). The search was restricted to information published from 2002 onwards, the year before the last major review was conducted by JECFA (2003a,b,c).
The literature search revealed relevant toxicokinetic and toxicological studies that are included in the appropriate sections below, together with a summary of the current understanding with regard to the absorption, distribution, metabolism and excretion (ADME) of nitrite. In brief, the opinion reports key data discussed in previous major reviews by SCF (1992) and JECFA (2003b), but does not describe them in detail as the data have been extensively reviewed by these bodies, and their findings with regard to toxicology are comparable. Previously unavailable data published after 2002 has been described in detail, and the results discussed in relation to the existing findings from the major reviews.
The biochemistry and pharmacology of nitrite have been under active investigation for hundreds of years. In recent years, the biochemistry of nitrite has been shown to integrate a complex set of regulatory pathways implicating several important compounds such as NO, carbon dioxide, superoxide and hydrogen peroxide (IARC, 2010). Nitrite may even function partly as a storage system for NO and is considered to play a key role as mediator of NO signalling, especially in hypoxia (Vitturi and Patel, 2011). Furthermore, compounds such as those described above have been shown to be part of normal and abnormal physiological conditions related to various pathways such as neural signalling, blood pressure, inflammation and ischaemia (IARC, 2010).
3.6.1. Absorption, distribution, metabolism and excretion
The sodium and potassium cations arising from these food additives are expected to enter normal homeostatic processes, and are not expected to impact on the toxicity of the salts, which is determined by the nitrite ion; thus the properties of the cations are not discussed further.
3.6.1.1. Animal studies
Data on the absorption of nitrite from the GI tract following normal dietary intake are sparse. As noticed by Walker (1990), due to the reactivity of nitrite, studies on absorption following oral ingestion are complicated as a result of its reaction with food and endogenous compounds.
Nitrite is absorbed from the GI tract, but it is also synthesised endogenously in small amounts in many parts of the body (liver, brain, blood vessels, inflammation sites) by the conversion of arginine to NO and its reaction with other cellular constituents (IARC, 2010).
To study the toxicokinetics of sodium nitrite, a group of B6C3F1 mice (10 animals/sex) was exposed continuously to sodium nitrite in drinking water at concentrations of 750, 1,500 and 3,000 mg/L (equivalent to 60, 120 or 220 mg/kg bw per day for males and 45, 90 and 165 mg/kg bw per day for females) (NTP, 2001). Blood samples were taken at 2 weeks, 3 months and 12 months, in order to determine plasma nitrite and blood methaemoglobin concentrations. After 12 months of exposure, no nitrite was detected in the plasma of male mice in the control group, in the group fed 750 mg/L, or in any group of female mice. In the male mice in the 1,500 and 3,000 mg/L groups, an increase in plasma nitrite concentration was observed. There was no statistically significant change in blood methaemoglobin concentration among all exposed and control male and female groups.
In the same report, a second satellite group of 15 male and 15 female mice was given a single oral dose of sodium nitrite (62.5 mg/kg bw) by gavage and their plasma nitrite and blood methaemoglobin concentrations were measured in 18‐month‐old B6C3F1 male mice. Plasma nitrite and blood methaemoglobin concentrations were measured 2, 5, 10, 30 and 60 min after dosing. In male mice, plasma nitrite and methaemoglobin concentrations peaked 10 min after gavage dosing, then rapidly decreased. In female mice, plasma nitrite concentrations peaked 5 min after gavage dosing and decreased slowly up to 60 min; methaemoglobin concentrations continued to increase up to 60 min after dosing. Plasma nitrite and methaemoglobin concentrations were consistently higher in female mice at all time intervals measured (NTP, 2001).
13Nitrogen‐labelled nitrite was administered intratracheally to Balb/C mice and intravenously to the mice and to New Zealand White rabbits to study its metabolism and distribution in vivo (Parks et al., 1981). Dosage ranged between 10 and 100 ng nitrate/kg bw, was instilled to mice in a 15 μL volume (without carrier) and was injected into a tail vein (mice) or ear vein (rabbits). Between 10 and 12 mice were used for each route of administration and measurements were made at time intervals from 5 to 30 min between injection and the killing of the animal. Labelled nitrite was determined by gamma‐ray counting in the lungs, heart, kidneys, liver, stomach, small intestine, large intestine, bladder and carcass. Most of the labelling appeared in the plasma of mice and rabbits 10 min after administration. Distribution data were relatively constant in mice and rabbits within 5 min after injection and the kinetics were time dependent. Radiolabelling was evenly distributed throughout soft‐tissue organs. Only 2–3% of the labelled nitrogen appeared in the urinary bladder during the first 30–45 min after injection. Except for the lungs and carcass, the percentages of labelled nitrite per gram of tissue did not show any statistically significant difference between organs, irrespective of the route of administration. Being the site of instillation, the lungs presented higher percentages, whereas carcass showed low percentages, suggesting that labelled material was minimally taken up by the skeleton. The even distribution of labelled 13N material (nitrate or nitrite) indicated that it rapidly reaches a steady‐state concentration not higher than 2–3 nM in body fluids. The similar organ distribution between mice and rabbits is explained by the in vivo conversion of nitrite to nitrate. Chromatographic results from blood samples showed that, 10 min after instillation of 13NO2 −, ~ 70% of the 13N was converted to 13NO3 − in the plasma in mice and 51% in rabbits; one site of this conversion being the erythrocytes. By contrast, no indication of conversion of nitrate to nitrite was found in either species. Ten minutes after instillation of 13NO3 into mice or rabbits, 100% of the 13N was found as 13NO3 in all blood fractions. In summary, the similar distributions of labelled nitrite and nitrate observed in organs after instillation or injection were explained by the interconversion of 13NO2 − to 13NO3 − in blood.
Germ‐free and conventional flora Sprague–Dawley rats (between five and seven rats per group, 60–90 days old, sex not stated) were administered sodium nitrate or sodium nitrite in drinking water at a dose of 1 mg/mL for 48 h, and sections of the GI tract were then assessed for nitrate and nitrite contents (Witter and Balish, 1979). Germ‐free rats had detectable levels of nitrate only, in the stomach, small intestine, caecum and colon, whereas rats with conventional flora had both nitrate and nitrite in the stomach, but only nitrate in the small intestine and colon. When fed sodium nitrite, the germ‐free rats had both nitrate and nitrite in the entire GI tract, whereas conventional flora rats had both ions in the stomach and small intestine, but only nitrate in the large intestine. Control animals (germ‐free or conventional flora) that were not supplemented with sodium nitrate had only trace amounts of nitrate in their stomachs and bladders. Overall, it was concluded that conversion of nitrate to nitrite is a function of the normal flora, whereas nitrite oxidation to nitrate depends on the host.
In rats, nitrate is secreted by active transport mechanisms from the circulation into the gastric and intestinal compartments (Witter and Balish, 1979). Loss of nitrite from the stomach appears to be due to chemical reactions, such as oxidation to nitrate and binding to insoluble material in the gut, rather than absorption across the gastric mucosa. Conventional flora rats were able to convert nitrite to nitrate and vice versa in all parts of the GI tract and the bladder, but germ‐free rats did not convert nitrate to nitrite. In vitro studies results showed that the intestinal bacteria flora was responsible for the metabolism of nitrate to nitrite (Witter and Balish, 1979a,b).
Intravenous infusion over 5 min of sodium nitrite at concentrations of 0, 10, 30, 100, 300 or 1,000 μmol/kg bw to urethane‐anaesthetised male Wistar rats resulted in a dose‐dependent increase in plasma levels of nitrite and a rapid increase in nitrate plasma concentrations (Vleeming et al., 1997) (additional details of this study can be found in Section 3.6.3.2).
A group of F344/N rats (10 animals/sex) was exposed continuously to sodium nitrite in drinking water at concentrations of 750, 1,500 and 3,000 mg/L (equivalent to 35, 70 or 130 mg/kg bw per day for males and 40, 80 and 150 mg/kg bw per day for females), and blood samples were taken at 2 weeks, 3 months and 12 months, in order to determine plasma nitrite and blood methaemoglobin concentrations. After 3 months of exposure, male and female rats showed increased levels of plasma nitrite only at concentrations of 3,000 mg/L, the levels being highest at night when the rats were actively feeding and drinking, and low during the day, when the rats were less active. In male rats, blood methaemoglobin concentrations increased steadily, but became statistically significant only at the highest dose tested (3,000 mg/L) compared with controls. This pattern was less apparent in female rats, showing that methaemoglobin concentrations increase in blood, but without overall statistical significance compared with controls.
A second satellite group of 15 male and 15 female rats was given a single oral dose of sodium nitrite (40 mg/kg bw), and plasma nitrite and blood methaemoglobin concentrations were determined 2, 5, 10, 30 and 60 min after gavage dosing. In male rats, plasma nitrite and blood methaemoglobin concentrations peaked 30 min after the gavage dose, whereas in female rats, although the plasma nitrite concentrations were similar to those in males, blood methaemoglobin levels continued to increased up to 60 min after gavage (NTP, 2001).
Walker (1990) described (without much detail) that nitrite administered parenterally to pregnant rats and guinea‐pigs was detected in fetal blood ~ 20 min after administration, and that the blood concentrations in the fetus were lower than those of the dams (no further details on this study are available).
In developing a biologically based mathematical model, the kinetics of sodium nitrite in Fischer 344 rats (55 animals/sex/group) was investigated following a single oral gavage dose of 40 or 80 mg/kg bw (Kohn et al., 2002). Peak plasma concentrations (~ 7.75 and 11 mg/L in males and females, respectively for the low dose, and 15 and 20 mg/L, respectively, for the higher dose) of nitrite were achieved in males and females ~ 30 min after the oral dose had been given. Peak methaemoglobin concentrations were reached at least 100 min after dosing. The authors of the study estimated that 10% of the haemoglobin is oxidised to the ferric form following oral doses of 15.9 mg sodium nitrite/kg bw in male rats and 11 mg sodium nitrite/kg bw in female rats. The expected half‐life for recovery from methaemoglobinaemia was 90–100 min (male and female rats, respectively), and 100–120 min (male and female rats, respectively) after administration of oral doses of 40 and 80 mg/kg bw, respectively.
The NTP evaluation of sodium nitrite (NTP, 2001) summarised available ADME data from experimental animals as follows. Following gavage administration of 150 μg sodium nitrite in an aqueous solution, 85% of the dose disappeared from the stomach of ICR/Ha mice in 10 min, and 95% disappeared in 30 min (Friedman et al., 1972). In Wistar rats, 154 μg/g sodium nitrite mixed in 5 g of food persisted in the stomach for up to 5 h with a half‐life of 1.4 h (Mirvish et al., 1975). Sodium nitrate or nitrite injected intraperitoneally or intravenously showed a mean plasma half‐life of 1.54 h in mice (Veszelovsky et al., 1995). Nitrite is unstable in acid and spontaneously decomposes to nitrate and nitrogen dioxide. Under acidic conditions and in the presence of food, nitrite disappeared with a half‐life of 2.2 h at pH 4.5, 0.93 h at pH 3.5 and 0.42 h at pH 2.5 (Mirvish et al., 1975).
Overall, in animals, nitrite rapidly disappeared from blood or from the intestinal tract by conversion to nitrate most probably due to the intestinal microflora activity. The kinetics of sodium nitrite in rats showed plasma concentrations ~ 30 min after an oral dose had been given. In mice, a single oral dose resulted in peak plasma nitrite concentrations 5 min after gavage, decreasing slowly up to 60 min after dosing. Intratracheal and intravenous administration of radiolabelled 13N‐nitrite to mice and rabbits showed an even distribution throughout the soft tissues and organs within 5 min after injection, most of it in the form of nitrate.
3.6.1.2. Human studies
The most important source of endogenous nitrite to humans is considered to arise from the consumption of nitrate and its conversion to nitrite in the saliva by oral nitrate‐reducing bacteria established at the base of the tongue. The amount of nitrate secreted into the saliva is estimated to vary between 20% and 25% of the dose (Spiegelhalder et al., 1976; Bartholomew and Hill, 1984). In mouth, nitrate is metabolised to nitrite whereby bacteria in the mouth play an important role (Gangolli et al., 1994). The ratio of the nitrite concentration in saliva to nitrate concentration in saliva varies widely between the different authors and even in one individual. From this ratio, it can be calculated that 5% to 36% of the nitrate secreted into the saliva is converted to nitrite by bacterial metabolism in the mouth (e.g. Wagner et al., 1983; Bartholomew and Hill, 1984; Spiegelhalder et al., 1976; Bos et al., 1988; Granli et al., 1989; Shapiro et al., 1991; Jin et al., 2013; Bondonno et al., 2015; Woessner et al., 2016; Hohensin et al., 2016, Montenegro et al., 2017). Furthermore, when average adults are exposed to single and repeated doses of nitrate at its current ADI (0–3.7 mg/kg bw per day), physiologically based pharmacokinetic models predict that they would be exposed to 0.27–0.36 mg nitrite/kg bw per day. According to JECFA, between 31% and 41% of this exposure would originate from endogenously synthesised nitrite (JECFA, 2003a).
Absorption
In a study by the National Institute of Public Health and the Environment Bilthoven, the Netherlands, (Kortboyer et al., 1997), nitrite absorption was measured in nine healthy subjects by comparing the area under the curve (AUC) in plasma after oral doses with the AUC after intravenous administration of nitrite. The oral doses were 323 (290–360) mg sodium nitrite and 161 (140–190) mg sodium nitrite given in the fasting state. The intravenous dose was 323 (290–360) mg sodium nitrite. The absolute availability of nitrite was ~ 100% (70–116%).
The systemic availability of roughly 100% was also reported in a study on nine subjects by Hunault et al. (2009) in which the AUC of NaNO2 were calculated after a mean oral dose of 310 mg (range 290–380 mg) and a mean dose of 160 mg (range 140–190 mg) NaNO2 which were compared to the AUC after a mean intravenous NaNO2 dose of 310 mg (range 290–380 mg). All subjects were placed on a diet low in nitrates and nitrites 3 days prior to treatment and 4 and 9 h after treatment.
Distribution
The apparent volume of distribution was calculated in the study by Kortboyer et al. (1997) to be 93 L (64–124 L), indicating that nitrite is distributed at higher concentrations in some tissues compared with blood. The Panel calculated the volume of distribution from the data reported in Hunault et al. (2009) and confirmed the value given by Kortboyer et al. (1997).
Metabolism
Nitrite is converted to a variety of metabolites, the main one being nitrate. In the study of Hunault et al. (2009), nitrate concentrations were also measured and some kinetic parameters of nitrate were estimated. The clearance of nitrite was calculated by the Panel from the data of Kortboyer et al. (1997) and Hunault et al. (2009). The clearance was higher than the hepatic blood flow. The systemic availability of nitrite is ~ 100%, indicating no first pass. From this observation, it can be concluded that the intestine and the liver are not organs in which major steps of the metabolism of nitrite take place. The Panel noted that the AUC of nitrate was 135 mg/h per L (mean; range 110–280 mg/h per L) after intravenous administration of sodium nitrite (mean dose of 310 mg, corresponding to 4.49 mmol) (Hunault et al., 2009). After intravenous administration of sodium nitrate (mean dose of 365 mg, corresponding to 4.29 mmol) the AUC was 112 ± 20 mg/h per kg (van Velzen et al., 2008) showing that the nitrite is to a high extent converted to nitrate. Taking into account the almost identical doses on a molar basis, and that the studies were performed in a panel of different volunteers, the Panel concluded that the nitrate AUCs were similar, indicating that the main step is the metabolism/conversion of nitrite to nitrate. Figure 1 captures the metabolic pathways of nitrite indicating minor pathways to NO and the formation of reactive oxygen species. Several models have been proposed for NO formation and further nitrosylation of proteins from nitrite (reviewed by Vitturi and Patel, 2011).
Figure 1.
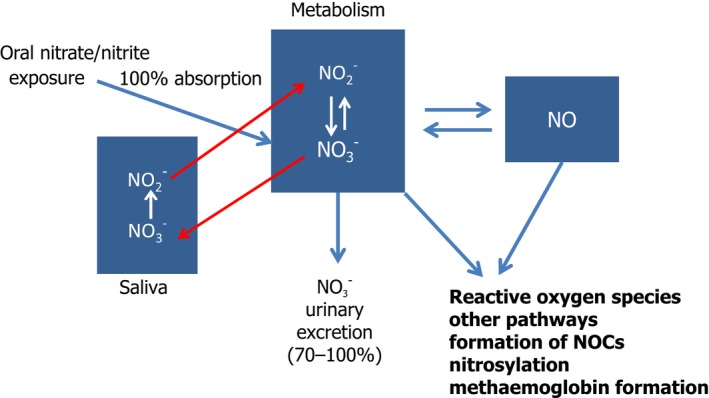
Fate of nitrate and nitrite in the body (NOCs comprise N‐nitrosamines and N‐nitrosamides)
Excretion
There seem to be no experimental studies in which nitrite excretion in the urine has been measured following the administration of nitrite. However, urinary nitrite excretion was measured in a study in which meals with high nitrate contents were given, the amount was ~ 0.02% of the nitrite content (calculated by the Panel) (Pannala et al., 2003). This indicates that renal excretion is an only minor pathway for the excretion of nitrite.
In humans, loss of nitrite from the stomach appears to be due to chemical reactions, such as oxidation to nitrate by the intestinal microflora, or to binding to insoluble material in the gut or formation of NOCs or absorption across the gastric mucosa.
Throughout the tissues and plasma, the nitrite ion appears to be in constant equilibrium with nitrate, being distributed throughout the body mostly as nitrate. Faecal and urinary excretion of nitrite itself appears to be negligible.
Overall, in humans, the systemic availability of nitrite when given in solution is ~ 100%, indicating no first pass. The volume of distribution is larger than the body water, indicating that nitrite is distributed at higher concentrations in some tissues compared with the blood. Nearly all of the nitrite is converted to nitrate, which is then excreted in the urine. Further metabolites of nitrite are NO and reactive oxygen species are also formed during the conversion of nitrite to minor metabolites. Small amounts of nitrite are found in the urine (0.02% of a dose).
Formation of nitrosamines and nitrosamides
A review of the formation of NOCs is given by Habermeyer et al. (2015). NOCs (N–nitrosamines and N‐nitrosamides) are formed when N–nitrosatable amino compounds present in food interact with nitrosating agents, here NO2 –. In the human body, this reaction takes place in the upper GI tract, preferably in the stomach due to the prevailing pH in this part of the GI tract when loaded with food (pH 2.5–3.0). With a pKa value of 3.3–3.4, about half of the nitrite in the gastric fluid is present in the protonated form. In the stomach, N2O3 is the nitrosating species for basic amines. It is formed under proton catalysis from two molecules of HNO2. Therefore, the nitrosation rate depends on the square of the nitrite concentration, and the reaction follows second‐order kinetics. It should be noted that only non‐protonated nitrogen atoms are available for nitrosation, hence, the N‐nitrosation rate is pH dependent and peak rates for N‐nitrosation are found at pH 3–4.
The formation of NOCs, some of which are known carcinogens, is of high impact in risk assessment. Several authors have tried to quantify the amount of, for example, NDMA after intake of a meal containing nitrate and/or nitrite (Vermeer et al., 1998). In this study, two N‐nitrosamines were detected in urine samples, NDMA and NPIP, the former correlating with urinary nitrate excretion, but not the latter. Zeilmaker et al. (2010) used a dynamic in vitro GI model and simulated NDMA formation in the stomach after a fish and vegetable meal. When using the experimental parameters and food consumption data from survey data in the Dutch population, the authors were able to predict the endogenous formation of NDMA in the population.
Mirvish et al. (2008) is an example of a study that has investigated the formation of NOCs following sodium nitrite intake. In this study, adult male Swiss mice were fed diets containing sodium nitrite for 7 days and faeces were collected for analysis of NOCs. It was found that feeding the mice 1 or 2 g/mL sodium nitrite in drinking water equivalent to 174 and 348 mg/mg kg per day, resulted in a 7.5‐ and 12.6‐fold increase in faecal NOC levels, respectively, compared with controls (p < 0.01). At lower doses of 63, 32 and 16 mg/L sodium nitrate in drinking water (equivalent to 11, 5.6 and 2.8 mg/mg kg per day), faecal NOCs were increased 3.5‐, 3.0‐ and 1.3‐fold compared with controls (p < 0.01). The effects of NOCs are mainly with regard to genotoxicity and human cancer, as discussed in more detail in Sections 3.6.4 and 3.6.8.
Overall, based on a review of the kinetics of NDMA, as an example of NOCs, animal data indicate the rapid and extensive absorption of preformed NOCs, with wide distribution. Clearance from blood is fast and dependent on hepatic as well as extra‐hepatic mechanisms. The metabolism of NDMA entails α‐hydroxylation or denitrosation. The denitrosation pathway results in the generation of methylamine and formaldehyde. Excretion of NDMA and its metabolites occurs via urine as well as via the exhalation as carbon.
Experimental studies showed that nitrosamides are formed in the presence of their precursors (e.g. creatinine or intermediate nitrosation compounds) present in meat, fish or seafood when ingested with additional sources of nitrate/nitrite such as residual amounts found in pretreated meat products (Mende et al., 1991 and Sen et al., 2000).
3.6.2. Acute toxicity
A literature search (conducted to retrieve new data produced from 2002 onwards) revealed two acute studies that have not been evaluated previously and are described below (Ohsawa et al., 2003; Dimitrova and Getova‐Spassova, 2006).
The acute toxicity effects of sodium and potassium nitrite include relaxation of smooth muscle, vasodilation and consequently lowering of blood pressure, and methaemoglobinaemia. The oral lethal dose (LD)50 identified in mice, rats and rabbits is in the range of 100–220 mg/kg bw (Walker, 1990; SCF, 1997; OECD, 2005; WHO, 2007).
In an acute oral toxicity study by Riemann (1950; as reported in OECD, 2005) in mice, the LD50 was 214 mg/kg for males and 216 mg/kg for females. Smyth et al. (1969) summarised the results of one acute oral toxicity study in male and female Wistar rats. The LD50 in that study was 180 mg/kg bw.
Ohsawa et al. (2003) determined the acute oral toxicity of sodium nitrite in mice. Only limited details are reported. Four to five animals (no strain or sex stated, although male ddY mice were used in the micronucleus assay reported by the same authors) were used and no deaths, morbidity or distinctive clinical and/or microscopic signs were observed at doses of 100 mg/kg bw. The LD50 was not reported.
Owing to the poor database on oral acute toxicity the following studies have been included. Although they are of limited use due to the route of exposure used, they do add to the database on acute toxicity.
In humans, a wide range of oral lethal nitrite doses have been reported, likely due to wide variabilities in individual sensitivity (Health Canada, 2013). As reported by Health Canada (2013): ‘The estimated oral lethal dose of nitrite for humans ranges from 1.6 to 9.5 g (Gowans, 1990; Mirvish, 1991) and from 33 to 250 mg/kg bw, the lower doses applying to children, the elderly and people with a deficiency in reduced nicotinamide adenine dinucleotide (NADH)–cytochrome b5– methaemoglobin reductase (Boink et al., 1999)’.
In summary, the reported effects of acute toxicity of sodium and potassium nitrite included relaxation of smooth muscle, vasodilation and consequently lowering of blood pressure, and methaemoglobinaemia. The oral LD50 in experimental animals is in the range 100–220 mg/kg bw (Walker, 1990; SCF, 1997; OECD, 2005; WHO, 2007). In humans, oral lethal nitrite doses have been reported to be in the same order of magnitude as in animals, however in a wider range, likely due to wide variabilities in individual sensitivity (Health Canada, 2013).
3.6.3. Short‐term and subchronic toxicity
The literature search (conducted as described in Section 3.6) did not reveal any standard short‐term or subchronic toxicity studies. However, four studies identified through the literature search have been included as in these the experimental animals were dosed over a relevant period (Hassan et al., 2009, 2010; Okasaki et al., 2006; Montenegro et al., 2011). Reviews from existing evaluations of the toxicological data relevant to sodium and potassium nitrite cite a number of subchronic studies, many of which are common to some or all of the reviews. These studies are summarised here; in particular, the studies conducted by the NTP (2001) are cited in reviews and opinions by JECFA (2003a), EFSA CONTAM Panel (2008) and the IARC (2010).
A summary of animal studies reviewed in the main text was included in Annex G.
3.6.3.1. Mice
The toxicity of sodium nitrite administered in drinking water was investigated by the NTP (2001) in a 14‐week study conducted according to the NTP standard protocol for a study of this length and to good laboratory practices (GLP). In this study, B6C3F1 mice (10 animals/sex/dose) were given free access to drinking water that contained sodium nitrite at a concentration of 375, 750, 1,500, 3,000 or 5,000 mg/L, which equates to approximate average doses of 90, 190, 345, 650 and 990 mg/kg bw per day for males and 120, 240, 445, 840 and 1,230 mg/kg bw per day for females. In addition to heart, kidney, liver, lung and spleen, sperm motility and spermatid measurements, as well as oestrus cyclicity were investigated for all groups exposed to sodium nitrite. There were no clinical signs of toxicity, including cyanosis. Final body weight and body weight gain were statistically significantly reduced in the 5,000 mg/L group males compared with control animals. Only in the males of the highest dose group was the effect on body weight toxicologically significant, as it was only in this group that the reduction in final weight reached 10% relative to the control group. These effects were restrained to male mice; female mice did not show any effect on body weight and body weight gain at any dose. In the 5,000 mg/L group (corresponding to 990 and 1,230 mg/kg bw per day in males and females, respectively) relative (to body weight) and absolute spleen weights were statistically significantly increased in males and females compared with respective control groups. The male mice had statistically significant increases in relative heart, kidney and testes weights in the highest dose group only. Female mice had a statistically significant increase in absolute and relative liver and heart weights when exposed to the highest concentration of sodium nitrite. There was also a statistically significant increase in absolute heart weights in the 3,000 mg/L group females. Absolute kidney weights were increased in female mice in the 5,000 and 3,000 mg/L groups and relative kidney weights were increased in the 5,000 mg/L group females only. Histopathological findings in the forestomach of male and female mice in the 5,000 mg/L group showed minimal to mild focal squamous cell hyperplasia. This lesion was characterised by a focal increase in the thickness of all cell layers of the squamous epithelium, and was associated with minimal hyperkeratosis. In general, this effect was not dose related and it is not possible to extrapolate to the human situation considering the lack of a forestomach in humans. In the spleen, there was a statistically significantly increased incidence of extramedullary haematopoiesis in the 3,000 and 5,000 mg/L male mice, and 1,500, 3,000 and 5,000 mg/L females compared with the control groups. The severity of this lesion was minimal to mild and was characterised by larger and more numerous clusters of small, dark haematopoietic cells in the red pulp. Effects on the reproductive parameters are reported in Section 3.6.6. The authors noted that ‘since the spleen is an erythropoietically active tissue in adult mice…, the splenic extramedullary haematopoiesis observed in mice would be consistent with methaemoglobin formation and tissue hypoxia’. The Panel considers that tissue hypoxia due to methaemoglobin formation is a strong signal to elicit extramedullary haematopoiesis. Based on extramedullary haematopoiesis in the spleen consistent with methaemoglobin formation, a NOAEL of 1,500 mg/L sodium nitrite in drinking water (345 mg/kg bw per day) for males and 750 mg/L sodium nitrite in drinking water (240 mg/kg bw per day) for females was identified by the Panel.
3.6.3.2. Rats
Two Wistar male rats implanted with a transmitter to measure mean systolic blood pressure, diastolic blood pressure and heart rate were administered drinking water with added potassium nitrite or potassium chloride at concentrations of 36 mM/L (equivalent to 2,344 mg/L potassium nitrite and 2,684 mg/L potassium chloride) for 11 days (Vleeming et al., 1997). On days 1–3, rats received untreated drinking water, on days 4–5 potassium chloride was added to drinking water, on days 6–8 potassium nitrite was added, and on days 9–11 potassium chloride was added again. Systolic blood pressure, diastolic blood pressure and heart rate were measured throughout the 11‐day exposure period. The rats’ activity phase is during the night and their resting phase during the day. In general, blood pressures were higher at night during the activity phase than during the day (statistical significance not clear from details reported). Potassium nitrite reduced blood pressures during the activity phase, but not during the resting phase. Potassium chloride did not affect blood pressure at all. A reflex tachycardia accompanied the reduced blood pressure following treatment with potassium nitrite. The authors of the study concluded that this is because the rats consume most of their water during the activity phase. The authors of the study hypothesised that this initial nitrite‐induced decrease in blood pressure might be responsible for activation of the renin–angiotensin system and subsequent increases in plasma angiotensin and hypertrophy of the adrenal zona glomerulosa.
A number of publications by Til et al. (1988, 1990, 1997); Til and Kuper, 1995), were cited in the reviews by JECFA, SCF and EFSA. Although the existence of these publications is acknowledged, as indicated previously only the most recent is included in this opinion. Til et al. (1988, 1990) could not establish a NOAEL for potassium nitrite in their previous studies because histopathological changes in the zona glomerulosa of the adrenal glands were observed at all doses tested. Thus, the following study (Til et al., 1997) was designed to define a NOEL by testing lower doses of potassium nitrite to the rats of the same strain as used in previous studies. In addition, sodium nitrite was included to rule out the possibility that the changes in the zona glomerulosa observed previously were rather related to potassium exposure. Potassium nitrite at doses of 0, 12.5, 25, 50, 100 or 3,000 mg/L (equivalent to ~ 0, 1.1, 2.2, 4.5, 9 or 270 mg/kg bw per day) and sodium nitrite at doses of 0, 81 or 2,432 mg/L (equivalent to ~ 0, 7.3 or 219 mg/kg bw per day) were administered separately to Wistar rats (10 animals/sex per dose) via their drinking water for 13 weeks (Til et al., 1997). The nitrite content of the two sodium nitrite doses was equal to that of the 100 and 3,000 mg/L potassium nitrite groups (1.17 and 35.25 mmol nitrite ion, respectively). The potassium and sodium concentrations in the test solutions were equalised by addition of potassium chloride or sodium chloride to the respective solutions (all concentrations equalised to that in the highest nitrite dose groups). One control group received tap water supplemented with potassium chloride and another sodium chloride, with potassium and sodium concentrations of 2,630 and 2,062 mg/L, respectively. These concentrations were equal to those in the highest dose nitrite groups. Thus, the potential for potassium or sodium cations to cause observed adverse effects could be determined. General condition, body weight, food consumption and water consumption were all determined for the control and treated groups. Systolic blood pressure was monitored once prior to the start of the treatment period, and on treatment days 1 or 3, 15 or 17 and 79 or 80 for males, and on days 2 or 4 and 79 or 80 for females. In weeks 4 and 12, haematology (haemoglobin, packed cell volume, red blood cell count, methaemoglobin, white blood cell count, reticulocyte count and thrombocyte count), clinical chemistry (creatinine, urea, potassium, sodium, aldosterone and corticosterone) and urinalysis (sodium and potassium concentrations) were conducted on all rats. Adrenals, kidneys, liver, heart and spleen were weighed from all surviving animals. Extensive histopathological examinations were conducted on rats from the control and highest dose nitrite groups; special attention was paid to adrenal gland histopathology. No clinical signs of toxicity were observed in any of the groups nor were there any statistically significant differences in food consumption or systolic blood pressure between the nitrite‐treated groups and the controls at any stage in the study.
Over the exposure period, water consumption (measured as per rat per day) was statistically significantly reduced in males and females of the highest sodium nitrite groups compared with the control group, and there was a corresponding reduction in urine volume in these rats. Females that received the highest dose of potassium nitrite also had statistically significantly reduced water consumption, compared with the control group over the duration of exposure. According to the publication, methaemoglobin concentration was statistically significantly increased in both high dose nitrite groups (sodium and potassium), in males and females, in weeks 4 and 12. In week 12, it is reported that female rats that received 3,000 mg/L potassium nitrite had also increased haemoglobin, packed cell volume, mean corpuscular and mean corpuscular haemoglobin volumes. Mean corpuscular volume was also increased in the 3,000 mg potassium nitrite/L group in males and in the 2,432 mg sodium nitrate/L group in females. In week 4, plasma aldosterone and corticosterone concentrations were decreased in males from the high‐dose sodium nitrite group and plasma corticosterone concentrations were decreased in females from the high‐dose potassium nitrite group compared with the control group. Relative kidney weights in male and female rats were statistically significantly higher in the high‐dose nitrite groups; this was also the case in females from the high‐dose sodium nitrate group. Animals in these groups also showed a markedly reduced mean liquid intake during the experimentation period.
Microscopic examination revealed an increase in large (hypertrophic) cells with vacuolated cytoplasm in the outer part of the zona glomerulosa of adrenal glands showing higher severity and incidences in females treated with the highest dose of potassium nitrite and sodium nitrate. No effects were observed with the lowest doses, except a slight hypertrophy in one group (100 mg KNO2/L). According to the description of the lesions, varying numbers of cells showed vacuoles containing heterogeneously lipid and droplets and mitochondria with tubular cristae. The hypertrophy of the adrenal glands could not be attributed to disequilibrium of the K/Na because hypertrophy was not observed in the potassium chloride or sodium chloride groups. The authors estimated that there was no relationship between these electron microscopy observations and the treatment. Heart and aorta as well as steroid hormone production or systolic blood pressure did not show any changes related to the treatment. Nevertheless, the authors considered that hypertrophy of the zona glomerulosa of the adrenal gland is a treatment‐related indirect effect of nitrite and therefore should not be ignored in hazard identification. The authors concluded that the effect on the adrenals glands is the most sensitive end‐point in the study resulting in a NOEL of 50 mg/L for potassium nitrite, according to the authors calculated to ~ 5.4 mg potassium nitrite/kg bw per day (Til et al., 1997) (equivalent to 5.9 mg/kg bw per day).
On these effects, JECFA (2003a) concluded that ‘… the minimal hypertrophy reflected physiological adaptation to small fluctuations in blood pressure and should not be considered a direct toxic action of nitrite on the adrenal glands.’ Other authors, such as Boink et al. (1995, 1999), previously came to the same conclusion, estimating that this specific effect was due to repeated activation of the renin–angiotensin–aldosterone axis. The Panel estimated that the effects identified by Til et al. (1997) on the adrenals glands are adaptive rather than direct nitrite toxicity and that the lack of effect of potassium or sodium nitrite on steroid hormone production or on systolic blood pressure in the study does not support the vasodilation hypothesis put forward by Til et al. (1997). The Panel concluded that effects related to the adrenal glands are considered non‐adverse, therefore the NOAEL in the study by Til et al. (1997) is 100 mg/L for potassium nitrite (equivalent to ~ 9 mg potassium nitrite/kg bw per day) based on increased formation of methaemoglobin and other effects on haematological parameters, at the next highest dose of 3,000 mg/kg bw per day. The same rational can be applied to the sodium nitrite experiment for which a NOAEL of 81 mg/L in males and females (equivalent to 7.3 mg sodium nitrite/kg bw per day) can be derived from this study.
The toxicity of sodium nitrite administered in drinking water was investigated by the NTP (2001) in a 14‐week study conducted according to the NTP standard protocol for a study of this length and GLP. In this study, F344/N rats (10 animals/sex per dose) were given free access to drinking water that contained sodium nitrite at a concentration of 0, 375, 750, 1,500, 3,000 or 5,000 mg/L, which according to the authors was equivalent to ~ 0, 30, 55, 115, 200 and 310 mg/kg bw per day for males and 0, 40, 80, 130, 225 and 345 mg/kg bw per day for females. These rats formed the ‘core’ study group. Additional ‘clinical pathology’ study groups (15 animals/sex per dose) were treated with the same concentrations of sodium nitrite in drinking water for 70 and 71 days, respectively. Clinical signs of toxicity were brown discolouration in the eyes and cyanosis of the mouth, tongue, ears and feet of males exposed to the two highest concentrations of sodium nitrite and females exposed to doses ≥ 1,500 mg/L. Males in the highest dose group were generally hypoactive, and some of the female rats at all doses developed alopecia. Final body weight and body weight gain were statistically significantly reduced in the 5,000 mg/L and the 3,000 mg/L group males compared with the control animals. In female rats, the final weight and weight gain was statistically significantly reduced only in the highest dose group compared with the control group. In females from the 3,000 mg/L group, the weight gain was also reduced. Females from the two highest dose groups consumed much less water at week 14 than animals from other doses or males (~ 39% g per day less). Extensive haematology and clinical chemistry investigations revealed treatment‐related changes. In male and female rats, methaemoglobin concentrations were dose‐dependently increased (see Appendix F for detailed data description) in all exposed groups throughout the study. Only male animals in the 375 mg/L group showed unchanged methaemoglobin concentrations on days 5 and 19, but they increased significantly at the end of week 14. Besides increased methaemoglobin, at the end of the study, male animals showed markedly increased levels of haemoglobin, reticulocytes, mean cell volume and mean cell haemoglobin, essentially in the 3,000 and 5,000 mg/L groups. Small increases were also observed in some parameters in males and females from the 750 and 1,500 mg/L groups. Female animals in the 3,000 and 5,000 mg/L groups also showed, at the end of the study, increased levels of haematocrit, haemoglobin, mean cell volume and mean cell haemoglobin. Erythrocytes and reticulocytes levels were increased only in females from the 5,000 mg/L group, whereas mean cell volume and mean cell haemoglobin was also increased in the 1,500 mg/L group.
The authors of the study noted that, in general, female rats had higher methaemoglobin concentrations than male rats, which might be related to the higher sodium nitrite consumption by the females.
The increased mean cell volume and mean cell haemoglobin values observed in week 14 are consistent with reticulocytosis. However, the authors noted that the mean cell volumes and mean cell haemoglobin values should also have increased in affected animals on days 5 and 19. This did not happen, and the mean cell volume and mean cell haemoglobin values for the 5,000 mg/L animals decreased on day 19. This suggests that more than one mechanism affected red blood cell size, that the factor(s) resulting in small cells had more influence at the early time points, and that this effect abated with time. Additionally, although the magnitude of methaemoglobinaemia remained fairly constant for the 5,000 ppm groups, the magnitude of the erythropoietic response appeared to diminish over time. The mechanism for this amelioration is unknown, but may reflect an acclimation of the animals to lower tissue oxygen concentrations. Heinz bodies, representing a marker of oxidative red blood cell damage (including methaemoglobinaemia), were observed in male and female rats on day 5 in the highest dose group only. Urea nitrogen was increased in males in all exposed groups and in females in the 1,500, 3,000 and 5,000 mg/L groups. Creatinine concentrations, another indicator of kidney function, was unchanged by week 14 in female and males from all exposed groups. Alkaline phosphatase activity was decreased in only one female from the 5,000 mg/L group. The Panel considered that increased urea nitrogen was not an indicator of kidney damage because all other kidney‐related parameters were unchanged.
Relative kidney weight was statistically significantly increased in males at all doses and in females at 3,000 and 5,000 mg/L; however, no concurrent adverse histopathological findings were observed in the kidney. Relative spleen weight was also significantly increased in males at most doses, except 375 mg/kg bw per day. In females, absolute and relative spleen weights were increased at the two highest doses. No concurrent adverse histopathological findings were observed in either organ. These findings together cast doubt on the toxicological significance of the increased plasma concentrations of creatinine and urea nitrogen. Microscopic examination of the bone marrow showed increased erythropoietic activity in males and females consistent with the haematology findings of regenerative anaemia. Rats in the highest dose group showed minimal (males) to mild (females) squamous cell hyperplasia of the forestomach, characterised by thickening of the squamous epithelium and hyperkeratosis. These effects were focal and observed near the limiting ridge between the forestomach and the glandular stomach. Effects on the reproductive parameters are reported in Section 3.2.5 (NTP, 2001).
The Panel considered the methaemoglobin increases in male and females rats to be a relevant effect. Therefore, the Panel used data on methaemoglobin formation from this study to perform benchmark dose modelling (BMD) (see Appendix F) as a basis for deriving an ADI given the clear dose–response relationship and the adequacy of the dose‐spacing which was not the case for other animal studies (Shuval and Gruener, 1972; Til et al., 1985a,b, 1990; Til and Kuper, 1995).
Overall, formation of methaemoglobin is the most widely reported effect of nitrite in this type of studies.
3.6.3.3. Other studies
Six weeks of administration of increasing concentrations of nitrite as a source of nitric oxide (NO) to 2K1C induced hypertensive male Wistar rats showed inhibition of vascular NADPH oxidase activity and reduced systolic blood pressure (SBP) in a dose‐dependent manner (Montenegro et al., 2011). Sodium nitrite concentrations of 0.5, 5 and 50 mM were administered in drinking water to four groups of twelve 2K1C‐operated rats, the calculated mean daily sodium nitrite intake was ~ 5.6, 61 and 85 mg/kg bw, respectively. 2K1C‐operated rats were also treated with the vehicle for use as controls and groups of 12 sham‐operated rats were treated similarly. Except for sham‐treated and 2K1C‐operated rats receiving 50 mM sodium nitrite, no significant differences in body weight were reported for the animals during the 6‐week follow‐up period. 2K1C‐operated rats receiving vehicle showed increased SBP after the first week of treatment, peaking at week 4. Conversely, 2K1C‐operated rats treated with increasing concentrations of sodium nitrite showed significant dose‐dependent decreases in SBP. Nitrite treatment induced a dose‐dependent increase in NO levels in 2K1C‐hypertensive rats, lower lipid peroxide and 8‐isoprostane levels in liver tissue indicative of antioxidant status and attenuated the production of reactive oxygen species in aortic slides from the animals. Sham‐ and 2K1C nitrite‐treated rats showed significant decreases in NADPH oxidase activity in aortic rings prepared from experimental animals, a pro‐oxidant enzyme, especially in hypertension.
Hassan et al. (2009, 2010) investigated the protective effects of garlic oil against the oxidative stress and neurotoxicity induced by sodium nitrite. In the first study (Hassan et al., 2009), a single dose of 80 mg sodium nitrite/kg bw per day was given by gavage to four groups (n = 6) of male albino rats for a period of 3 months. In the second study (Hassan et al., 2010), a similar treatment protocol was given by gavage to four groups (n = 6) of male Sprague–Dawley rats for a period of 3 months. In the first study, biochemical analysis of plasma from sodium nitrite‐treated animals showed increased serum glucose, aspartate aminotransferase, alanine aminotransferase and alkaline phosphatase activities, bilirubin, urea and creatinine. Decreased total serum protein was reported. In liver, only alkaline phosphatase activity was increased, the rest of the parameters mentioned above were decreased. In kidney, urea, creatinine and total protein contents were decreased. The measured antioxidative stress parameters showed that, in liver, only thiobarbituric acid reactive substances (the products of lipid peroxidation) were increased, whereas glutathione and catalase activities were decreased. In kidney, only malondialdehyde levels were increased, glutathione and catalase activities were reduced. In all cases, concurrent supplementation with garlic oil reduced the effects reported with sodium nitrite. In the second study, biochemical analyses reported results similar to those of the first study; supplementation with garlic oil reduced the reported effects of sodium nitrite. Brain and plasma acetylcholinesterase activities in this study were decrease by sodium nitrite treatment (80 mg/kg bw per day) and recovered after garlic oil treatment (5 mL/kg bw).
F344 male rats, 6 months of age, were divided in four groups of nine animals each and treated as follows: group 1, basal diet; group 2, 1.0% ascorbic acid in the diet (equivalent to ~ 900 mg/kg bw per day); group 3, 0.2% sodium nitrite in the drinking water (equivalent to 240 mg/kg bw per day); and group 4, 1.0% ascorbic acid plus 0.2% sodium nitrite. Subgroups of three animals each were euthanised after 1, 3 and 7 days of treatment. Stomachs (glandular and forestomach) were excised and analysed histopathologically (Okasaki et al., 2006). The authors report that microscopically, the forestomach of animals in group 4 showed necrotic or eroded squamous epithelium accompanied by inflammatory changes showing oedema in the submucosa. These changes became stronger with days of treatment, reaching signs of regenerative hyperplasia on day 7. No apparent changes were noticed in animals from groups 2 and 3. Glandular stomach did not show signs of toxicity in any of the groups.
Overall, in livestock and companion animal species, lowest observed adverse effect levels (LOAELs) and NOAEL values of 9.9–75 mg nitrite/kg bw per day (LOAEL) and 0.1–25 mg nitrite/kg bw per day (NOAEL) have been gathered (Cockburn et al., 2013).
3.6.4. Genotoxicity
Genotoxicity data on nitrite has been briefly reviewed by the SCF (1997), TemaNord (2002), JECFA (2003a) and EFSA CONTAM Panel (2008), and discussed in more detail by the IARC in 2010.
The IARC (2010) evaluation concluded that ‘sodium nitrite gave generally positive results in the Salmonella mutagenicity assay, but was negative in the SOS chromotest. It did not induce mutations in bacteria recovered in the host‐mediated assay from rats or mice of various strains. In a single study, sodium nitrite induced somatic mutations in the wing‐spot test in Drosophila melanogaster. It gave a positive response in several assays for chromosomal aberrations and micronucleus formation, both in vitro and in vivo. In several in vitro studies, sodium nitrite was consistently positive in inducing aneuploidy, cell transformation, 8‐azaguanine‐resistant mutations, 6‐thioguanine‐resistant mutations and ouabain‐resistant mutations. Similarly, sodium nitrite induced 8‐azaguanine‐resistant mutations, ouabain‐resistant mutations and morphological transformation in cells of hamster embryos after transplacental exposure, but did not induce chromosomal aberrations or micronuclei in this assay. It was also positive in the mouse sperm‐head abnormality test.’
In this section, genotoxicity data reviewed in the IARC publication are briefly summarised, and discussed, together with findings from more recent studies published after preparation of the IARC monograph or not included in it.
3.6.4.1. In vitro
Tests in bacteria
Nitrite (and nitrate) salts have been extensively tested in bacterial reversion assays, using the set of Salmonella Typhimurium strains developed by B.N. Ames (i.e. in the so‐called Ames tests). In this assay, sodium and potassium nitrite tested positive, with and without exogenous metabolic activation, in strains sensitive to base pair substitution at GC sites, i.e. TA1530, TA1535, TA1950 and TA100; negative results were obtained with TA97, TA98 and TA102 (Balimandawa et al., 1994; Ishidate et al., 1984; Brams et al., 1987; Rubenchick et al., 1990; Prival et al., 1991; Zeiger et al., 1992; also reported in NTP, 2001).
The mutagenicity of sodium nitrite was also evaluated in the E. coli WP2 uvrA/pkM101 (mutM+) strain and its homologous YG5190 (mutM–) lacking functional 8‐hydroxy‐deoxyguanosine glycosylase (Kuroiwa et al., 2007). At the single dose tested (100 μg/plate), sodium nitrite was ineffective in both strains. When tested in combination with ascorbic acid, it was slightly mutagenic in the mutM+ strain, and clearly genotoxic in YG5190 (mutM–), pointing to the generation of nitric oxide from NaNO2 in the presence of ascorbic acid.
In DNA damage/repair tests, negative or borderline positive results were reported in the SOS chromotest in E. coli (Brams et al., 1987) and in the umu test in S. Typhimurium (Nakamura et al., 1987).
Tests in mammalian cells
In tests in cultured mammalian cells, all performed without metabolic activation, sodium nitrite induced chromosomal aberrations in various cell systems: mouse mammary carcinoma cells, at 3.2 mM (Kodama et al., 1976); Syrian hamster embryo cells, at 20 mM (Tsuda and Kato, 1977); Chinese hamster fibroblasts, at 0.25 mg/mL (Ishidate et al., 1984); monkey fetal liver cells and HeLa cells, at 0.265 mg/mL (Luca et al., 1987).
Positive results were also obtained in forward mutation tests in V79 cells (induction of 6‐thioguanine resistance, at 0.05%) (Budayová, 1985) and in mouse mammary carcinoma cells (8‐azaguanine resistance, at 1 mM) (Kodama et al., 1976).
Conversely, no evidence of the induction of DNA single‐strand breaks was provided by alkaline elution in V79 cells (highest tested concentration, 1 mM) (Görsdorf et al., 1990), or by analysis of the sedimentation pattern in mouse mammary carcinoma cells treated with high doses (100 mM) of sodium nitrite (Kodawa et al., 1976). The Panel noted the low sensitivity – compared with current techniques – of the experimental methods applied in these early studies to detect DNA single‐strand breaks.
Positive results were also obtained with sodium nitrite in tests for aneuploidy and morphological transformation in Syrian hamster embryo cells, at 50 and 100 mM (Tsuda et al., 1976), and BALB/c3T3 cells, at 10 mM (Tsuda and Hasegawa, 1990). The Panel noted that, although some cell transformation assays are considered predictive for carcinogenicity and a useful complement to genotoxicity assays in batteries of short‐term tests for the prescreening of carcinogens, they are not directly informative regarding the genotoxic potential of a substance.
In a more recent study, the alkaline comet assay was used to investigate the effect of sodium nitrite in isolated lymphocytes from Asian and Caucasian patients with and without diabetes in the presence of hydrogen peroxide (Wyatt et al., 2006). A preliminary examination of lymphocytes (from two individuals) exposed in vitro for 30 min at 37°C to 0, 1, 10, 25, 50 and 75 mM sodium nitrite (equivalent to 0, 69, 690, 1,725, 3,450 and 5,175 mg sodium nitrite) did not show any significant change at any dose tested. Only when 50 μM of hydrogen peroxide was added was a significant and dose‐related increase in mean tail moment observed. The Panel noted that this study was designed to investigate the interrelationships between reactive oxygen species formation and nitrate exposure in diabetes, and thus has limited relevance for genotoxicity assessment.
Clemons et al. (2007) investigated the potential for NO produced from nitrite under acidic conditions to induce double‐strand breaks in oesophageal cells in vitro. Transformed and primary Barrett's oesophagus and adenocarcinoma cells were exposed to NO generated from acidification of nitrite in the presence of ascorbic acid. Phosphorylation of histone γH2AX (a marker of DNA double‐strand breaks) was used to detect DNA damage and the neutral comet assay was used as a confirmation test. Under acidic conditions (pH 3.5), 600 μM nitrite (producing 70 μM NO according to the authors) increased γH2AX phosphorylation and double‐strand breaks compared with cells treated at neutral pH (7.4). The Panel noted that this study primarily concerns the genotoxic effect of NO rather than nitrite, and has indirect relevance for hazard characterisation of nitrite.
3.6.4.2. In vivo
Host‐mediated assays
The genotoxicity of orally administered sodium nitrite was evaluated in host‐mediated assays in mice using S. Typhimurium strains G46 and TA1530 as indicator organisms. No increase in mutants was observed in bacteria recovered from the peritoneal cavity and liver of treated mice (Couch and Friedman, 1975; Edwards et al., 1979; Whong et al., 1979). Negative results were also obtained in a E. coli K12 uvrB/recA DNA repair host‐mediated assay (Hellmer and Bolcfoldi, 1992). The Panel noted that host‐mediated assays have not been validated as in vivo genotoxicity assays, and considered the results from these studies of limited relevance for risk assessment.
Drosophila
Positive results were obtained in the somatic mutation and recombination wing spot test in D. melanogaster after feeding of larvae with sodium nitrite at 72.5 mM in growth medium (Graf et al., 1989). In another study using the same test system, a dose‐related increase in the frequency of small and large wing spots was observed in emerging flies when larvae were fed with 50 mM sodium or potassium nitrite (Sarikaya and Cakir, 2005). The Panel noted that the SMART test in Drosophila has not been validated for risk assessment, nor is recommended in current testing strategies.
Mammals
Inui et al. (1979) examined the transplacental effect of sodium nitrite on Syrian hamster embryo cells. With this aim, pregnant females were treated per os with 125, 250 and 500 mg sodium nitrite/kg bw on days 11 and 12 of pregnancy and embryos isolated 24 h after. Primary cultures of embryo cells were set up for the detection of induced gene mutations, cytogenetic abnormalities and morphological transformation. For the induction of resistant mutants, cells were grown 72 h before selection; chromosomal aberrations were evaluated in metaphases harvested after 24 h of culture, and micronuclei in interphase nuclei after 30 h of culture; cell transformation was evaluated after 3–5 days of culture. Clear cut (> 10‐fold) and dose‐dependent increases in 8‐azaguanine‐ and ouabain‐resistant mutants, micronuclei and transformation were observed in embryonic cells exposed in utero. However, no increase in structural chromosomal aberrations was observed. The positive control dimethylnitrosamine caused effects of similar extent, including however also chromosomal aberrations. No genotoxic effect was observed following administration of sodium nitrate (500 mg/kg bw) (Inui et al., 1979). The Panel noted that the methods applied in this study have not been further validated and therefore their results cannot be used for risk assessment.
In a screening of food additives, Hayashi et al. (1988) evaluated sodium nitrite in the bone marrow micronucleus test in male ddY mice. The test chemical was administered once, either intraperitoneally at 12.5, 25, 50, 100 or 200 mg/kg bw or per os at 25, 50, 100, 200 or 400 mg/kg bw. The highest oral dose (400 mg/kg bw) was lethal; no increase of micronuclei in polychromatic erythrocytes (PCE) was observed in any of the other treatment groups. The positive control mitomycin C elicited a clear positive effect. The Panel noted that no significant alteration in the percentage of immature cells (PCEs) was observed in nitrite‐treated mice. Thus, even though the lethal effects recorded at high doses can indicate systemic exposure of the animal to the test chemical, direct evidence of exposure of the target tissue (bone marrow) is missing. This condition is considered mandatory for clearly negative results (OECD, 2014), and thus the results from these studies are regarded as inconclusive for genotoxicity assessment.
Luca et al. (1987) evaluated the cytogenetic effects of sodium nitrite in male rats and mice treated per os, twice 24 h apart, with 1.72, 5.18, 15.55 and 46.66 mg/kg; the same daily doses were given to rabbits in drinking water for 3 months (no further details given). Twenty‐four hours after the last treatment, chromosomal aberrations were evaluated in bone marrow cells of all species, and micronuclei in mice only (sacrificed 6 h after last treatment). The Panel noted the unusual design of the subchronic study, using rabbits as target species, and the limited protocols of the chromosomal aberration studies in mice and rats, with less than recommended scored cells (50/animal), no use of spindle arresting chemical, beyond the improper statistical analysis, using cells instead of animals as statistical units, the lack of positive controls and historical control data. Overall, the Panel concluded that this study cannot be considered for risk assessment.
Shimada (1989) treated pregnant imprinting control region (ICR) mice with drinking water containing sodium nitrite at either 100 or 1,000 mg/L on days 7–18 of gestation. At the end of treatment, animals were sacrificed and chromosomal aberrations scored in bone marrow of treated dams (five per dose) and in fetal liver cells. No increase in chromosomal aberrations was observed. The Panel noted that the cytogenetic analysis of fetal cells is not a standard test method and, given the absence of a positive control, it is not possible to evaluate the sensitivity of the method applied and the reliability of the results. The Panel concluded that this study should not be considered for risk assessment.
A similar protocol was applied in another study in rats, in which sodium nitrite was administered in drinking water at 1.25 g/L (estimated to correspond to ~ 210 mg/kg bw) on gestational days 5–18 (el Nahas et al., 1984). At the end of treatment, chromosomal aberrations were scored in bone marrow of adults and in the liver of transplacentally exposed embryos. A significant increase in metaphases with aberrations (excluding gaps) was observed both in bone marrow (about threefold) and fetal liver (about fivefold) of treated animals. The Panel noted that only aggregated data were presented, and thus the reproducibility of the effect in different animals or embryos could not be evaluated, and that less metaphases than recommended were scored (50 for each animal and embryo instead of 200). Based on these considerations, the Panel concluded that the findings reported from this study have limited reliability and should be considered with caution for risk assessment.
The effect of oral administration of sodium nitrite (60 and 120 mg/kg, highest tolerated dose) for 14 days on mouse germ cells was investigated by Alavantič et al. (1988a). No induction of heritable translocations, and no sperm abnormalities or morphological changes, were observed in the progeny of treated males. In the latter, a significant increase in sex‐chromosomal univalency at diakinesis, and sperm‐head abnormalities, were observed after treatment of differentiating spermatogonia. The Panel noted that sex‐chromosomal univalency and sperm abnormalities are not considered reliable indicators of genotoxicity.
The same research group evaluated the effect of oral administration of sodium nitrite on unscheduled DNA synthesis (UDS) and sperm abnormalities in mice following the treatment of spermatids (Alavantič et al., 1988b). To this aim, sodium nitrite was given for 3 days at 60 and 120 mg/kg, and UDS and morphological head abnormalities were evaluated in sperm 17 days after the last treatment. No induction of UDS was observed in nitrite‐treated animals, whereas the positive control elicited a strong response. The incidence of morphological sperm‐head abnormalities was slightly increased at the highest tested dose.
Sodium nitrite was tested in micronucleus assays in B6C3F1 mice and Fisher 344 rats in the framework of the carcinogenicity studies performed by the NTP (2001). Male rats and mice (five per dose) were injected intraperitoneally three times at 24 h intervals with sodium nitrite (6.26–200 mg/kg to rats and 7.81–250 mg/kg to mice) and sacrificed 24 h after the third injection. Micronuclei were examined in bone marrow scoring 2,000 polychromatic erythrocytes per animal. In addition, a peripheral blood micronucleus test was performed with male and female mice (five per dose) administered with sodium nitrite (375–5,000 mg/L in drinking water) for 14 weeks, scoring 2,000 normochromatic erythrocytes (NCE) at sacrifice. In the acute study, the highest tested dose was lethal in both mice and rats, and no increase in micronucleated PCE was observed at the other tested doses (up to 100 and 125 mg/kg bw in rats and mice, respectively). No increase in micronuclei either was observed in NCE of mice at the end of the subchronic study. The Panel noted that no measurement of the PCE/NCE ratio in bone marrow was performed, and thus it is not possible to assess whether treatment determined a significant toxicity, and hence exposure, of the erythropoietic tissue. However, the Panel also noted that blood nitrite determinations performed within the framework of the same study highlighted the systemic exposure of treated animals both after single administration (6.26 mg/kg, in rats) and exposure to nitrite via drinking water (from 1,500 mg/L onwards, in mice). Overall, despite the intraperitoneal route is usually considered not relevant for the assessment of genotoxic hazard related to oral exposure, as by‐pass of first‐pass metabolism may result in an irrelevant high internal exposure, the Panel noted that this study could be considered as a worst case in a weight of evidence evaluation of the genotoxicity of nitrite.
Another mouse bone marrow micronucleus test was performed to evaluate the possible inhibitory effect of chlorophyllin on the genotoxicity of sodium nitrite (Diaz‐Barriga Arceo et al., 2002). With this aim, male mice were treated orally with sodium nitrite (10, 15 and 20 mg/kg) for 4 days, with or without chlorophyllin, and sacrificed 24 h after the last treatment. Blood smears were prepared from blood samples taken from the tail at t 0 (before first treatment) and at sacrifice. The authors report a threefold increase in the incidence of micronuclei in PCE at sacrifice compared with the first sampling, and in treated animals compared with vehicle controls. The Panel noted that the experimental procedure applied in this work, i.e. the staining of smears with Giemsa stain, is not appropriate for peripheral blood, in that it does not allow identification of the small fraction of reticulocytes, which are the only cells competent to express genetic damage after a 4‐day treatment period. The Panel thus concluded that the effect reported cannot be related to treatment and that this study should not be considered for risk assessment.
Another in vivo study was performed to evaluate the genotoxic effects of the endogenous formation of NOCs after oral administration of sodium nitrite and nitrosable precursors (Ohsawa et al., 2003). Four male ddY mice (8 weeks old) were fasted overnight before intragastric treatment with 2,000 mg/kg bw secondary amines (dimethylamine, proline or morpholine) and/or sodium nitrite at up to 100 mg/kg bw. Three or 24 h after treatment, stomach, colon, liver, kidney, urinary bladder, lung, brain and bone marrow were excised and analysed by alkaline comet assay. Following administration of sodium nitrite or the amines alone no statistically significant increase in DNA migration was reported for any of the organs tested. Following simultaneous administration of sodium nitrite with the secondary amines, statistically significant increases in DNA migration were reported for morpholine, mainly in the liver and kidney, and for dimethylamine mainly in the liver. For proline, no particular pattern of increase was observed. DNA migration was considered by the authors to be due to the endogenous formation of nitrosamines within the acid conditions of the stomach. In the same study, ascorbic acid, tea polyphenols, and fresh apple, grape and orange juices reduced the hepatic DNA migration induced by morpholine and sodium nitrite. The Panel noted that the higher dose levels of sodium nitrite applied were lower than the maximum recommended. The Panel further noted that no indication of genotoxicity of nitrite was observed in this study and that the potential formation of genotoxic NOCs by nitrite and nitrosable precursors has been well‐established and is discussed below.
Within an investigation on the promoting effect of nitrite on gastric cancer, no statistically significant increase in 8‐hydroxydeoxyguanosine was observed in rat forestomach epithelium 4 h after administration of 0.2% sodium nitrite in drinking water (Okasaki et al., 2006). Similar results, i.e. a slight, non‐significant increase in 8‐hydroxydeoxyguanosine, were obtained in another study with similar design in which oxidative DNA damage was evaluated in rat forestomach epithelium 6 h, 24 h and 2 weeks after the 12 week administration of 0.2% sodium nitrite in drinking water (Kuroiwa et al., 2007). The Panel noted that these studies were designed to investigate the possible promoting effect of nitrite in stomach cancer, and thus have limited relevance for genotoxicity assessment.
Koohdani and Mehdipour (2011) investigated the effect of sodium nitrite on the micronucleus index. Male rats (six animals/group) were either given two intragastric doses of sodium nitrite (~ 5.2 mg/kg bw) in distilled water 24 h apart, or an intragastric dose of sodium chloride (1 mL saturated) 24 h before the two intragastric doses of nitrite; the control group remained untreated. The animals were sacrificed 24 h after the second dose of nitrite, and the femurs were used for bone marrow preparation. Treatment with sodium nitrite alone did not increase micronuclei above the control group, whereas exposure to sodium nitrite plus sodium chloride was reported to induce a significant increase. The Panel noted some inconsistencies in the reporting of this study, which is described as having been conducted using rats, even though all tables and figures refer to mice, and limitations in the study design, and concluded that it cannot be used for risk assessment.
Özen et al. (2014), evaluated the toxic and genotoxic effects of long‐term dietary exposure to sodium nitrite in Swiss albino mice given NaNO2 (0, 10 and 20 mg/kg bw per day) in feed for 8 months. At the end of treatments, animals were sacrificed and selected organs were processed for histopathological, immunohistochemical, biochemical and genotoxic investigations. Mild to moderate degenerative changes were observed in liver, kidney, intestine, lung and spleen of mice given NaNO2. Biochemical markers of nitrosative stress (inducible nitric oxide synthase and nitrotyrosine), lipid peroxidation (liver malondialdehyde), cell proliferation (liver proliferating cell nuclear antigen (PCNA)), and apoptosis were increased in NaNO2‐treated mice. In bone marrow, increased numbers of chromosome and chromatid breaks, chromatid association and polyploidy, and a decreased mitotic index, were observed in NaNO2‐treated mice, indicating that long‐term oral administration of low doses of sodium nitrite may elicit a genotoxic effect in vivo (Özen et al., 2014). However, the Panel noted that the reported experimental results are difficult to evaluate as only aggregated data (i.e. the sum of aberrations in the whole experimental group) are shown, with no consideration to the animal as statistical unit; finally, examination of the single microscopy image showing ‘typical’ aberration figures raises concern about the quality of the microscopy preparations and scoring criteria, as all the highlighted aberrations are actually barely discernible. Based on these considerations, the Panel concluded that the genotoxicity test results reported in this work should have limited weight in sodium nitrite risk assessment.
The available studies provide clear evidence of the genotoxic activity of sodium and potassium nitrite in vitro, with positive results in tests for gene mutations in bacteria and in tests for the induction of structural chromosomal aberrations, gene mutations, aneuploidy and cell transformation in mammalian cells. Sodium nitrite was also positive in a somatic mutation/recombination test in D. melanogaster.
In vivo negative results were obtained in well‐performed micronucleus assays in mice and rats, with measurable systemic exposure, after acute and subchronic administration of sodium nitrite. Lack of genotoxicity is also indicated by more limited data at the site of contact (stomach): these include a negative comet assay by gavage, although at a dose lower than the maximum recommended (Ohsawa et al., 2003), the absence of oxidative DNA damage in forestomach epithelium following dietary exposure to nitrite (Okazaki et al., 2006), and the lack of tumour‐initiating activity in two‐stage stomach cancer model (Kuroiwa et al., 2007).
Overall, the Panel concluded that the available information described above does not indicate an in vivo genotoxic potential for sodium and potassium nitrite, and therefore, it is possible to establish a health‐based reference limit (ADI).
3.6.4.3. Nitrosamines and nitrosamides
Genotoxicity studies on NOCs have been extensively reviewed by other bodies (IARC, 1978, 1998, 2010; NTP, 2016; SCF, 1997). No relevant new data were identified following a literature search conducted to retrieve data produced from 2002 onwards. The main findings reported in the most recent IARC publication (2010) are briefly summarised below.
Nitrosamines are not directly reactive towards DNA, but need to be metabolically activated to chemically reactive species. The main pathway of bioactivation for nitrosamines requires as a first step the oxidation by cytochrome P450 enzymes, forming α‐hydroxynitrosamines that rapidly rearrange and decompose to aldehydes and electrophilic diazohydroxides. The latter can react with nucleophilic sites in DNA, forming premutagenic DNA lesions such as O6‐alkylguanine, a miscoding adduct which at DNA replication leads to a G:C→A:T transition, a mutation frequently identified in NOC‐induced animal and human tumours.
Nitrosation of N‐alkylamides yields N‐nitrosamides, which do not require metabolic activation and are spontaneously converted in vivo to ultimate reactive electrophilic species. Basically, a similar pattern of modified DNA bases is formed by nitrosamides and nitrosamines. However, their organ specificity in carcinogenicity may differ as nitrosamines primarily target the site of their metabolic activation, whereas the directly reactive nitrosamides are mainly carcinogenic at the site of first contact.
Despite the remarkably high genotoxic and carcinogenic activity of some volatile nitrosamines, not all of them share the same toxicological properties. The key step in the metabolic activation of N‐nitrosamines to electrophilic genotoxic species is α‐hydroxylation. Because the presence of an α–hydrogen is needed, substitution(s) that replace the α‐hydrogen in dialkylnitrosamines can lead to reduction or elimination of the genotoxic and carcinogenic potential. Accordingly, the relative carcinogenic potency of a series of dialkylnitrosamines follows the order: ethyl (with two α‐hydrogens) >> sec‐propyl (only one α–hydrogen) >> tert‐butyl (with no α‐hydrogen). Other substituents that can reduce or eliminate the genotoxic and carcinogenic potential of N–nitrosamines include branched, bulky or unmetabolisable groups at or in the vicinity of the α‐carbon (Benigni, 2005).
The evidence and/or prediction of genotoxic and carcinogenic properties of nitrosamines found in cured meat are summarised in Table 12. In general, all volatile N‐nitrosamines studied display genotoxic and carcinogenic properties, as predicted by structural considerations, even though their relative carcinogenic potencies vary widely. More limited evidence of genotoxicity is available for non‐volatile nitrosamines, which are mainly predicted as being of low or moderate concern for carcinogenicity (with the exception of the dialkyl substituted N‐nitrosodibutylamine). In particular, low concern is attributed to the cyclic nitrosamines NMTCA and NTCA for the presence of substitent(s) other than good leaving group on the α‐carbon.
Table 12.
Carcinogenicity and genotoxicity of nitrosamines generated in cured meat
| Substance | CAS no. | Carcinogenicity | Genotoxicityd | ||
|---|---|---|---|---|---|
| IARC Groupa | BMDL10 b (mg/kg bw per day) | EPA Predictionc | |||
| Volatile nitrosamines | |||||
| NDMA (N‐nitrosodimethylamine) | 62‐75‐9 | 2A (probably carcinogenic to humans) | 0.027 | Highly likely to be a potent carcinogen | Genotoxic in vitro and in vivo |
| NMOR (N‐nitrosomorpholine) | 58‐89‐2 | 2B (possibly carcinogenic to humans) | 0.7 | Highly likely to be a moderately active carcinogen | Genotoxic in vitro and in vivo |
| NMEA (N‐nitrosomethylethylamine) | 10595‐95‐6 | 2B | – | Highly likely to be a moderately active carcinogen | Positive in vitro (DNA binding) |
| NPYR (N‐nitrosopyrrolidine) | 930‐55‐2 | 2B | 0.16 | Likely to be a moderately active carcinogen | Genotoxic in vitro and in vivo |
| NDEA (N‐nitrosodiethylamine) | 55‐18‐5 | 2A | 0.018 | Highly likely to be a potent carcinogen | Genotoxic in vitro and in vivo |
| NPIP (N‐nitrosopiperidine) | 100‐75‐4 | 2B | – | Highly likely to be a moderately active carcinogen | Genotoxic in vitro |
| NDPA (N‐nitrosodi‐n‐propylamine) | 621‐64‐7 | 2B | – | Highly likely to be a potent carcinogen | Genotoxic in vitro |
| Non‐volatile nitrosamines | |||||
| NHPRO (N‐nitrosohydroxyproline | 30310‐80‐6 | 3 (not classifiable as to its carcinogenicity to humans) | – | Unlikely to be carcinogenic | No data |
| NPRO (N‐nitrosoproline) | 7519‐36‐0 | 3 | – | Unlikely to be carcinogenic | Limited negative data (Ames test) |
| NSAR (N‐nitrososarcosine) | 13256‐22‐9 | 2B | – | Likely to be weakly carcinogenic | Limited negative data (host‐mediated assay) |
| NMA (N‐nitrosomethylaniline) | 614‐00‐6 | – | – | Not applicable | Limited positive data in vitro (Ames test) |
| NDBA (N‐nitrosodibutylamine) | 924‐16‐3 | 2B | – | Highly likely to be a moderately active carcinogen | Genotoxic in vitro and in vivo (Ames test, V79/hprt, in vivo comet and SCE) |
| NDiBA (N‐nitrosodiisobutylamine) | 997‐95‐5 | – | – | Not available | Limited positive data in vitro (Ames, V79/hprt) |
| NDBzA (N‐nitrosodibenzylamine) | 5336‐53‐8 | – | – | Likely to be weakly carcinogenic | Limited positive data in vitro (Ames test) |
| NHMTCA (N‐nitroso‐2‐hydroxymethyl‐thiazolidine‐4‐carboxylic acid) | 99452‐46‐7 | – | – | Unlikely to be carcinogenic | No data |
| NTCA (N‐Nitroso‐thiazolidine‐4‐carboxylic acid) | 88381‐44‐6 | – | – | Unlikely to be carcinogenic | No data |
| NMTCA (N‐Nitroso‐2‐methyl‐thiazolidine 4‐carboxylic acid) | 103659‐08‐1 | – | – | Unlikely to be carcinogenic | No data |
| NPIC (N‐nitrosopipecolic acid) | 4515‐18‐8 | – | – | Not applicable | No data |
IARC Monographs supplement 7, 1987 (http://www.iarc.fr/en/publications/list/monographs/index.php).
SCCS, 2012 Opinion on Nitrosamines and Secondary Amines in Cosmetic Products (http://ec.europa.eu/health/scientific_committees/consumer_safety/docs/sccs_o_072.pdf).
According to EPA expert system OncoLogic™ 8.0 (2015).
Hazardous Substances Data Bank (http://toxnet.nlm.nih.gov/newtoxnet/hsdb.htm).
3.6.5. Chronic toxicity and carcinogenicity
3.6.5.1. Animal studies
A literature search was conducted (as described in Section 3.6) and all newly identified studies on nitrite were reviewed and none was excluded from evaluation in this opinion. However, only three new studies were identified by the literature search (Furukawa et al., 2000; Okasaki et al., 2006. Kuroiwa et al., 2007). Previously reviewed toxicity studies in existing evaluations that have been considered by the Panel to be ‘key studies’ are also discussed together with the newly available data.
Mice
Greenblatt and Mirvish (1973) tested 18 groups of 40 male strain A mice, aged 7–9 weeks, given between 0.05 and 2.0 g/L sodium nitrite in drinking water (equivalent to 9–360 mg/kg bw per day) alone or in combination with 0.69–18.75 g piperazine/kg food for 20–25 weeks, with a recovery period of 13 weeks. Untreated controls received food and tap water only. Treatments did not affect survival rates (> 90%). The presence of adenomas at the surface of the lungs was counted and histopathological observations (one‐fifth of the mice) served as confirmation. Body weights at the end of the study did not differ significantly compared with controls; an exception was the group with the highest piperazine level plus nitrite, in which mice showed lower body weights and poor general condition. Sodium nitrite given alone did not increase lung adenoma yield compared with controls. Sodium nitrite in combination with piperazine in food significantly increased lung adenoma yields in all groups, except the group given the lowest dose of sodium nitrite (0.05 g/L). The mean number of adenomas per mouse increased steadily with higher piperazine doses at a constant level of sodium nitrite (1.0 g/L). The inverse was found at constant levels of piperazine (6.25 g/kg food). The authors could not propose a clear mechanism of action to explain their results.
B6C3F1 mice (50 animals/sex per dose) were given sodium nitrite in drinking water at concentrations of 0, 750, 1,500 and 3,000 mg/L for 104–105 weeks (resulting in average daily doses of ~ 0, 60, 120 and 220 mg/kg bw in males and 0, 45, 90 and 165 mg/kg bw in females) (NTP, 2001). The study was carried out under GLP conditions and meeting recent NTP guidelines for 2‐year studies (NTP, 2010). No haematological, full clinical chemistry or urinalysis examinations were conducted, although plasma nitrite and blood methaemoglobin concentrations were assessed at 12 months in all males for 1 day at 6, 12, 21 and 24 h intervals. In females, only blood methaemoglobin concentrations were measured as before.
Two‐year survival for the treated and control groups, either males or females, did not differ statistically. Mean body weight values for the females and males were reported and did not show statistically significant modifications. Although some changes in body weight were observed, the mean weights reported were usually within 5% of the control values, and the reduction was never more than 9% of the mean control value. Water consumption was reported as being reduced in animals from the exposed groups, although statistically significant reductions were not reported. Plasma nitrite peaked around midnight in animals treated at the two highest doses, specially the 3,000 mg/L group. Blood methaemoglobin concentrations did not differ statistically among treated and control groups.
Upon histopathological examination, a positive trend in the incidence of squamous cell papilloma and carcinoma (combined) of the forestomach were reported in female mice of the 3,000 mg/L group only (50 animals: three cases of papilloma and two cases of carcinoma) compared with controls (50 animals: one case of papilloma and no carcinomas) and exceeded historical NTP controls (all routes). However, no statistical significance was reported for the findings of this long‐term study. Carcinomas showed focal invasion of the squamous epithelium into the lamina propria; however, no infiltration of neoplastic cells through the serosa of the forestomach was reported nor were there any sign of metastasis. Hyperplasia of the forestomach squamous epithelium was also observed more frequently in the 3,000 mg/L females group, compared with controls, but again no statistical significance was reported. Hyperplasia was generally mild, affecting the squamous epithelium of the limiting ridge at the junction of the forestomach and glandular stomach. The incidence of epithelial hyperplasia in the glandular stomach was statistically significantly increased in the 3,000 mg/L male mice only, but no neoplasms were observed. Hyperplastic areas showed gastric glands with reduced mucus‐secreting cells with parietal cells being composed of smaller, elongated, basophilic cells with vesiculated, fusiform nuclei and relatively scant cytoplasm. In all treated female groups, the incidences of alveolar/bronchiolar adenoma or carcinoma (combined) were slightly greater than in the control group. No statistical significance or dose relationship was reported for these lesions, furthermore they were not accompanied by increased incidences of preneoplastic lesions and the incidences were within the historical range for controls (all routes) of NTP. In females, incidences of fibrosarcoma in mammary gland were increased in the 750 mg/L group, but not in the others groups. The combined incidence of fibroma and fibrosarcoma fell within the historical range for NTP. No other treatment‐related adverse effects were observed. The authors concluded that under the conditions of the study there was ‘no evidence of carcinogenic activity’ of sodium nitrite in male B6C3F1 mice and that there was ‘equivocal evidence of carcinogenic activity’ in female B6C3F1 mice exposed to sodium nitrite based on the positive trend observed in the incidences of squamous cell papilloma or carcinoma (combined) of the forestomach.
The Panel noted that: (a) the incidence of squamous cell papilloma or carcinoma (combined) of the forestomach was observed mainly in females from the highest dose tested (3,000 mg/L), (b) there was no statistical significance observed on these effects, and (c) the average severity grade of the lesions did not differ between untreated and treated animals at all doses. Thus the Panel identifies a NOAEL of 220 mg/kg bw per day in males and 165 mg/kg bw per day in females, the highest dose tested.
Rats
In a 14‐month study, male rats (12 per group, strain not identified) received a dose of 0 or 2,000 mg/L (equivalent to 100 mg/kg bw per day) of sodium nitrite in drinking water (Chow and Hong, 1980). There were statistical significant differences in the methaemoglobin blood levels between the groups. Animals receiving nitrite showed methaemoglobin average values from 1% to 35% as compared to less than 2% in controls. The methaemoglobin values fluctuated from time to time in treated animals. The average GSH (Blood reduced glutathione) levels in red blood cells (19% higher) and vitamin E levels in plasma (57% lower) differed significantly as compared to controls. High incidence of chronic pneumonitis was reported in the nitrite group as well as lower liver weights.
Five groups of male rats (strain not stated; eight animals/group), received either normal tap water (control) or 100, 1,000, 2,000 or 3,000 mg/L sodium nitrite in drinking water (Shuval and Gruener, 1972). Rats were weighed monthly and samples of blood taken to determine haemoglobin and methaemoglobin levels. After 24 months, the animals were sacrificed and gross pathological and histopathological examinations conducted. In summary, there were no treatment‐related deaths or effects on animal growth. There were no significant differences in plasma haemoglobin concentrations between the control and treated groups. Methaemoglobin concentrations were increased in a dose‐dependent manner in the three highest dose groups (average 5%, 12% and 22%, respectively, throughout the study). In the low‐dose group, the methaemoglobin concentration increased for the first 60 days only, remaining identical to controls values thereafter. Blood levels of glucose, pyruvate and lactate did not change among the groups. Histopathology was performed on tissues from the heart, lungs, kidneys, liver, spleen, pancreas, adrenals and some brains, the last three organs showing no pathological findings in any of the groups. Necropsy examinations revealed frequent congestion of the liver and spleen, and the kidneys were reported to sometimes show focal inflammatory and degenerative changes (no doses stated). No carcinogenicity potential was reported.
The main pathological findings were in the lungs and heart and were succinctly described as follows: ‘In the lungs bronchi were frequently dilated, their walls infiltrated with lymphocytes, while the mucosa and muscle were often atrophied. Frankly purulent bronchial exudate also occurred. Interstitial round cells and fibrosis were sometimes encountered, emphysema was the rule. These changes, while present in one or two rats of the control group and in group B (100 mg/L NO2), were found with increasing frequency and severity in the last three groups treated with higher NO2 doses (no more details). In the heart, there were small foci of degenerative cells and fibrosis in some animals, while a more diffuse interstitial cellularity with pronounced degenerative foci was frequent in the highest NO2 groups only. The oil red O stain showed no increased lipid deposits in the hearts of the experimental animals.’ In most of the control animals, the blood vessels were reported showing some degree of thickening and often even a marked hypertrophy and narrowing. In the experimental groups, and especially in group E, which received ~ 250–300 mg/kg of NaNO2 for 2 years, the coronaries were reported as thin and dilated, their appearance ‘not what is usually seen in animals of advanced age’ (no more details were available on the precise classification of lesions). The authors suggested that the findings in the lungs and heart, although non‐specific, might be directly related to the treatment, but did not excluded the influence of intercurrent aetiological factors (Shuval and Gruener, 1972).
The Panel considered that due to the lack of details on the doses in this study and on the histopathological details, these findings cannot be applied to conduct a risk assessment for the following reasons: (a) the study's results are reported only as a summary without details, the authors considered it only as a pre‐test for full‐scale chronic toxicity experiments that were in progress (not available); (b) as reported, only eight male animals per dose of an unknown rat strain were tested and no females were included; (c) details of the exact doses tested are lacking in the publication, the authors only stated that the highest dosed animals (3,000 mg/L) ‘received about 250–350 mg/kg sodium nitrite’ (according to the default values proposed by EFSA Scientific Committee (2012a,b) the 3,000 mg/L dose would correspond to 150 mg/kg bw per day); and (d) the observed effects in the lungs (bronchi frequently dilated with lymphocyte infiltrations and purulent bronchial exudates) and in the hearts (coronaries thin and dilated ‘not what is usually seen in animals of advanced age’) were not confirmed in any other more recent long‐term toxicity study conducted in rats or mice. Furthermore, the Panel noted that the authors themselves suggested that it cannot be discarded that the effects might be related to an intercurrent aetiological factor (i.e. infectious state of the animals) rather than to a direct mechanism of toxicity involving nitrite. In this study, the Panel noted that methaemoglobin concentrations increased in a dose‐dependent manner in the three highest dose groups tested. However, given the lack of details on the exact doses tested and the low number of animals per group, the Panel could not derive a NOAEL from the study.
Maekawa et al. (1982) investigated the carcinogenic potential of sodium nitrite in a 2‐year drinking water study (sodium nitrite was administered in drinking water as it was demonstrated to have poor stability in the diet). F344 rats (50 animals/sex/group) were given 20 mL of 0, 0.125% (1,250 mg/L) or 0.25% (2,500 mg/L) sodium nitrite per rat per day in their drinking water for 2 years (120 weeks). These doses are equivalent to 62.5 and 125 mg/kg bw per day, respectively. The concentration of nitrite‐containing water consumed was monitored daily. Treatment was stopped at week 104 and the rats were given untreated drinking water until week 120 (the point at which survival in one group fell below 20%), at which point they were killed. Male rats treated with sodium nitrite showed reduced mean body weights compared with the control rats starting at week 80, whereas female rats showed reduced mean body weights starting at week 50. The difference was < 10% in males throughout the study and > 10% in females, although no statistically significant difference was reported by the authors between the groups for this parameter. Treatment with sodium nitrite did not have an adverse effect on survival. Both male and female controls groups showed the lowest number of survivors overall. Diet and water consumption were similar in all groups throughout the study. The total tumour incidence at the end of the study was high in all groups: 92% and 100% in female and male controls, respectively; 85% and 100% in female and male animals from the 0.125% group, respectively; 73% and 100% in female and male animals from the 0.25% group, respectively. Females exposed to 0.25% sodium nitrite have a statistically significant lower total tumour incidence than controls. The most commonly observed tumour in males was in the testis (interstitial cell), with the control, low‐ and high‐dose groups having 100%, 94% and 96% of animals developing this tumour, respectively. Tumours were also observed in the mammary gland, adrenal gland and liver in males of treated and control animals. There was a reverse dose–response relationship in the incidence of total tumours in females. Tumours of the mammary gland, pituitary gland, uterus and adrenal gland were the most commonly observed in females of treated and control animals. There were no statistically significant increases in any specific tumour in females, but a statistically significant reduction in the tumour incidence of the mammary gland compared with controls was observed in female rats from the 0.25% treated group. The time to first tumour did not differ significantly in either of the treated groups (males and females) compared with the controls. Interestingly, there was a difference in the incidence of leukaemias. There was a statistically significant reduction in mononuclear cell leukaemias in both treated groups compared with controls, the authors suggested that the slight atrophy of the haematopoietic organs such as the spleen and lymph nodes, observed in treated animals, may be important in the reduction of leukaemia incidence. The Panel noted the high tumour incidences in all groups of this study and therefore considered it not sensitive enough to detect any treatment‐related cancer effects.
F344/N rats (50 animals/sex per dose) were given sodium nitrite in drinking water at concentrations of 0, 750, 1,500 and 3,000 mg/L (mg/L) for 104–105 weeks (NTP, 2001). Based on the drinking water consumption data, the doses of sodium nitrite were calculated by the authors to be 0, 35, 70 or 130 mg/kg bw per day for males and 0, 40, 80 and 150 mg/kg bw per day for females. Water consumption was reduced in males and females exposed to 3,000 mg/L sodium nitrite compared with controls throughout the study. Other exposed groups generally had reduced water consumption after week 14. Survival rates for the treated and control groups were similar. Mean body weights of males and females exposed to 3,000 mg/L sodium nitrite were somehow lower than those of the control groups (mean 6–10% of controls) throughout the exposure period but no statistical significance was reported. No major clinical signs of toxicity were reported. At 3 months of treatment determination of blood plasma nitrite and blood methaemoglobin concentration showed that plasma nitrite concentration tended to increase in animals of the 3,000 mg/L group. Blood methaemoglobin concentrations only differ statistically between controls and the 3,000 mg/L treated animals. Upon histopathological examination, no significant changes were reported in the respiratory system, comprising lungs, nose and trachea. The incidence of hyperplasia of the forestomach was statistically significantly increased in males and females exposed to the highest dose 3,000 mg/L. Hyperplasia was generally of minimal grade affecting the epithelium of the limiting ridge at the junction of the forestomach and glandular stomach. It was characterised by variable degrees of folding of the squamous epithelium and usually accompanied by a variable degree of thickening of the keratin layer (hyperkeratosis). However, no forestomach neoplasms were reported in animals from this or the other exposed groups. Incidences of fibroadenomas of the mammary gland were significantly increased in females from the 750, 1,500 and 3,000 mg/L groups, exceeding the historical range for NTP controls (all sources). The incidences in controls were also equal to the highest incidence in the NTP historical control database. When combined with adenomas, no statistically significant increases were reported. The incidences of carcinomas of the mammary gland were not increased in any of the exposed groups. The incidences of fibroadenomas were higher in females exposed to 750 and 1,500 mg/L sodium nitrite. However, the authors considered that fibroadenomas of the mammary gland are the most common benign neoplasms that occur in female F344/N rats and they are generally considered to represent an end‐stage lesion for which progression to carcinoma is rare. The Panel agrees with the authors’ interpretation. Significant increased incidences of minor chronic active inflammation of the liver were reported in males from the 1,500 and 3,000 mg/L groups. The authors considered that chronic active inflammation of the liver, being a common spontaneous lesion in F344/N rats and showing marginally increased incidences, was not related to nitrite exposure. Similarly, a marginal increase in nephropathy in females from the 3,000 mg/L group was reported, but also being a common spontaneous renal lesion in F344/N rats, the authors were unclear whether it was related to treatment. Fibroma incidences of the skin were also reported to increase in males from the 1500 mg/L group. However, the lack of a dose–response, the lack of a significant increase in the incidences of fibrosarcomas of the skin and the fact that their combined incidences were within the historical range for NTP controls, led the authors to consider that they were not related to the treatment. The incidence of mononuclear cell leukaemia showed a statistically significant reduction for males and females of the mid‐ and high‐dose groups compared with controls from the study and historical NTP controls. The authors concluded that, under the conditions of the study, there was ‘no evidence of carcinogenic activity’ of sodium nitrite in male or female F344/N rats. The Panel identified a NOAEL of 1500 mg sodium nitrite/L (equivalent to 70 mg/kg bw per day in males and 80 mg/kg bw per day in females) based on the increased levels of methaemoglobin reported.
3.6.5.2. Other studies
Furukawa et al. (2000) investigated the carcinogenic potential of consumption for 104 weeks of a fish meal alone or together with a sodium nitrite solution. Six‐week‐old F344 rats (50 animals/sex/group) were allocated to groups 1–3 (males) and 7–9 (females) and were fed diets supplemented with 64%, 32% or 8% (basal diet) fish meal and simultaneously given 0.12% sodium nitrite in their drinking water. The sodium nitrite dose was equivalent to ~ 6 mg/kg bw per day. Groups 4–6 (males) and 10–12 (females) were, respectively, fed diets supplemented with 64%, 32% or 8% (basal diet) fish meal and tap water (controls). At the end of week 104, all animals were killed. Male and female rats, but particularly females, fed the highest doses of fish meal, had reduced weight gain, irrespective of whether they also received sodium nitrite. Final survival in groups fed diets containing the highest (64%) fish meal (groups 1, 4, 7 and 10) was reduced to 50%, 14%, 50% and 30%, respectively, compared with the other groups (survival 72–84%). Upon histopathological examination in males fed the diet containing the highest fish meal (64%) together with sodium nitrite (0.12%), the incidence of atypical renal tubules was the only statistically significant increase compared with their respective controls. In the group fed 32% fish meal and sodium nitrite, renal atypical tubules, adenomas and adenocarcinomas showed a statistically significant increase compared with their respective controls. In the group fed 8% fish meal and sodium nitrite, the incidences of renal atypical tubules, adenoma or adenocarcinomas were not significantly increased. In females, only among those animals fed the highest fish meal (64%) with sodium nitrite, the incidence of atypical tubules and adenomas was statistically significantly increased compared with their respective controls. No other statistically significant increase in tumour incidence was reported upon microscopy examination of thyroid, adrenal gland, haematopoietic system, lung, liver and testis or uterus tissue. Dimethylnitrosamine was detected in the stomach contents of rats from all groups. The levels found were: rats fed 64% fish meal + sodium nitrite > rats fed 8% +sodium nitrite > 8% fish meal alone > 64% fish meal alone. Dimethylnitrosamine was not detected in the serum of any of the groups. No other nitrosamines were detected in stomach or blood samples.
A study by Okazaki et al. (2006) was carried out to investigate the promoting activity of a combined treatment with sodium nitrite and ascorbic acid in a two‐stage gastric carcinogenicity assay. Six‐week‐old F344 male rats (15 rats per group) were given 0.01% N‐methyl‐N’‐nitro‐N‐nitrosoguanidine (MNNG) in their drinking water for 10 weeks to initiate carcinogenesis in the glandular stomach, and a single intragastric administration of 100 mg/kg/bw of MNNG by stomach tube at week 9 to initiate carcinogenesis in the forestomach. From week 11, rats received either drinking water containing 0.05%, 0.1% or 0.2% sodium nitrite (equivalent to 45, 90 or 180 mg/kg bw per day) and a diet supplemented with 0.1% or 0.2% ascorbic acid in combination, or each individual chemical alone or a basal diet until the end of week 42. All surviving animals were sacrificed at the end of week 42. The liver, kidneys, oesophagus, stomach and intestines were excised, and the liver and kidneys were weighed. The oesophagus, stomach and intestines were prepared for histopathological examination. Rats treated with sodium nitrite + ascorbic acid had reduced body weights compared with the basal diet group. Body weights were also reduced in groups receiving combined treatment compared with the respective ascorbic acid only and sodium nitrite only groups. Incidences of squamous cell carcinomas in the forestomach were significantly increased by the combined treatment with sodium nitrite and ascorbic acid in a dose‐dependent manner, but sodium nitrite or ascorbic acid alone had no effect. Forestomach hyperplasia was dramatically increased by the combined treatment with sodium nitrite and ascorbic acid. Moderate forestomach hyperplasia was also induced by treatment with 0.1% or 0.2% sodium nitrite alone, but not with 0.05%. A slight increase in the 8‐hydroxy‐deoxyguanosine levels in the forestomach epithelium was observed 4 h after treatment with 1.0% ascorbic acid + 0.2% sodium nitrite, albeit without statistical significance. No increase in oxidative DNA damage was observed in the forestomach epithelium of rats treated with sodium nitrite alone (Okazaki et al., 2006). Effects reported in the forestomach were generally not dose related and the Panel did not considered the results pivotal as it is not possible to extrapolate to the human situation given the lack of a forestomach in humans.
The study of Kuroiwa et al. (2007) was carried out by the same research group to investigate whether tumour‐initiating activity through oxidative DNA damage participated in forestomach carcinogenesis induced by the combination of sodium nitrite and ascorbic acid. Five groups of F344 male rats (n = 25/group) were treated for 12 weeks with basal diet (group 1), 1% ascorbic acid (group 2), 0.2% sodium nitrite (group 3) or 1% ascorbic acid + 0.2% sodium nitrite (group 4). An extra group (group 5) of animals was treated with 100 mg MNNG/kg bw in the first week as positive control. After an interval of 2 weeks, all animals were given (1%) butylated hydroxyanisole in the diet for 52 weeks as tumour promoter. At necropsy, the stomachs and forestomachs of the animals were collected and histopathologically examined. No change in food consumption among all groups was noticed but body weights were lower in all sodium nitrite‐treated groups. Average daily intakes of ascorbic acid and sodium nitrite were calculated to be 646 and 623 mg/kg bw per day in groups 2 and 3, respectively. No tumour initiation potential was detected in this study for ascorbic acid and sodium nitrite alone (groups 2 and 3) or in combination (group 4). No statistically significant changes in the incidences of squamous cell carcinoma or papillomas of the forestomach were reported among the groups, contrary to the incidences observed in the positive controls (group 5). Hyperplasia was detected in all groups (control and treated) with comparable incidence and severity (Kuroiwa et al., 2007). The Panel considered initiation–promotion studies not directly relevant for the risk assessment. A summary of the toxicological studies reviewed can be found in Appendix G. Overall, there was no evidence of carcinogenicity in long term and carcinogenicity studies. The Panel noted the only consistently observed effect in chronic toxicity studies was an increase in methaemoglobin levels.
3.6.5.3. Endogenous N‐nitroso compounds (ENOC) formation
Zeilmaker et al. (2010) used an artificial GI experimental model (composed of stomach, duodenum, jejunum and ileum compartments) to assess NDMA formed endogenously after a fish‐with‐vegetable meal was put into ‘dynamic contact’ with a nitrite source. The nitrite source was infused in vitro and varied between 0.1 and 10 times the current nitrate ADI. The authors reported that ‘the tuning of the in vitro nitrite infusion to the in vivo transport of nitrite with saliva resulting from nitrate intake was based on a toxicokinetic model for nitrate and nitrite in humans’. It was not feasible for the Panel to apply results from the reported study to evaluate the formation of NOCs in vivo. Further results from research projects are mentioned in the Guidelines for Canadian Drinking Water Quality in the Guideline (Health Canada, 2013).
Animal data
Davis et al. (2012) tested whether feeding apparent NOCs, defined as volatile nitrosamines and other compounds measured together, derived in laboratory conditions from hot dogs could induce aberrant crypts (ABC) and mucin‐depleted foci (MDF) in the mouse colon. Apparent NOCs (ANC) were derived by nitrosation of ANC precursors chemically extracted and purified from hot dogs. Nitrosation was carried out under laboratory conditions in the presence of sodium nitrite under acidified conditions, saturated by sulfamic acid. One kilogram of mice diet was mixed with the solution to give a final ANC concentration of 85 nmol/g diet. Four‐week‐old A/J female mice (6, 11, 12 or 23 animals depending on the group) were fed this mixture daily for up to 38 weeks (< 10 months). Control mice received the same diets, but without added ANC mixture. Initially, three types of diets were to be tested, the so‐called standard diet, high‐fat diet and high‐fat stress diet. The authors stating that the latter diet had been used to mimic human Western‐style diets in studies on the mouse colon, causing hyperproliferation of epithelial cells in the colonic crypts. However, due to methodological problems only two diets were finally tested, the standard and the high‐fat stress diet. Azoxymethane was used as a positive control in an additional group of mice. In the main experiment, 23 female mice were fed a diet containing ANC at 85 nmol/g diet for 38 weeks. In the control group (12 female mice), the median exposure time was 39 weeks. At sacrifice, the distal portion of the colon was excised, prepared and examined and the number of aberrant crypt foci recorded. The median number of aberrant crypts per 2 cm of colon was statistically significant higher in those animals fed high‐fat stress diet containing ANC compared with controls fed standard diet only. No tumours were detected in any of these animals. The incidence of MDF was not statistically significantly different.
Matsubara et al. (2012) investigated the effects of administering 1‐nitrosoindole‐3‐acetonitrile (NIAN), an N‐nitroso‐substituted compound formed by the reaction of indole‐3–acetonitrile with nitrite under acidic conditions, to investigate its cancerogenic potential in Mongolian gerbils infected with H. pylori. Formation of DNA adducts in the glandular stomach was induced by administering 0.5 mL NIAN in 50% dimethyl sulfoxide (100 mg/kg bw per day) by gavage to three male gerbils two times per week (total length not specified). Two control gerbils received the solvent only. In addition, four groups of male Mongolian gerbils (number not stated) were then administered NIAN at different concentrations by gavage twice a week for 3 weeks. One week after treatment, two groups of animals were given a gavage dose of H. pylori. All surviving animals were sacrificed 104 weeks after H. pylori infection. A small increase in adduct formation in the glandular stomach was reported (three adduct spots – 1.6 adducts/108 nucleotides in total), but interpretation of results was difficult from autoradiograms in the publication and furthermore their chemical structure was not determined. The authors reported an increase in glandular stomach adenocarcinoma in the presence of both H. pylori and NIAN.
As part of a carcinogenicity study (Maekawa et al., 1982), the presence of nitrosamines was determined in the basic diet, drinking water containing nitrite and stomach contents of F344 rats (10 animals/sex per group) exposed to 0.125% and 0.25% sodium nitrite in the drinking water (equivalent to ~ 62 and 125 mg/kg bw per day, respectively). After 1 week of treatment, animals were sacrificed and stomach contents were analysed. Results showed that the basic diet already contained NDMA, but the content was almost doubled on addition of sodium nitrite, independent of the dose. Only traces of NDMA were detected in the stomach contents of male animals exposed to 0.125% sodium nitrite, the levels increasing when exposed to 0.25%. In female rats, an increase in NDMA gastric content was detected with dose. No NDMA was detected in the gastric contents of control animals. The authors observed that the appearance of NDMA at low levels in gastric contents was not related to an increased incidence of liver and kidney tumours (the main target organs of NDMA in rats) in the carcinogenicity study that tested doses of up to 5% sodium nitrite in drinking water. Furthermore, no other NOCs were detected in gastric contents.
Data in humans
It is not the object of this opinion to conduct a full review of the mechanism of ENOC formation as their relevant risk to humans has been the subject of substantial research and debate over several decades. However, a literature search has been conducted to retrieve new data produced from 2002 onwards (as described in Section 3.6), in order to update current understanding in this area.
Several models have been proposed for the NO formation and further nitrosylation of proteins from nitrite (reviewed by Vitturi and Patel, 2011). A review on the formation of NOCs is given by Habermeyer et al. (2015) and the main mechanisms are described in Section 3.3.1. As an example, the study of Lundberg and Govoni (2004) investigated the effect of ingested nitrate on systemic levels of nitrite and S‐nitrosothiols. Nine healthy people (five male and four female) between the ages of 26 and 46 years participated in the study. All had fasted overnight, prior to ingestion of 10 mg/kg bw sodium nitrate. Blood and saliva samples were taken 30 min before and 15, 30, 60 and 90 min after administration of the test substance. Urine samples were obtained immediately before and 1, 2 and 3 h following dosing. When concentrations were compared with baseline values measured 30 min before sodium nitrate administration, an increase in salivary nitrate, nitrite and S‐nitrosothiols was observed within 30 min of ingestion. Plasma nitrate and nitrite also showed an increase within 30 min of ingestion; however, plasma S‐nitrosothiol concentrations were not significantly altered. Urinary nitrate and nitrite levels are reported to increase in urine after ingestion of nitrite. In four participants, a parallel experiment was run on a separate day to determine whether salivary nitrate was a source of plasma nitrate and nitrite, by avoiding swallowing for the first hour post dosing with 10 mg/kg sodium nitrate. Under these conditions, an increase in plasma and urinary nitrite was not observed, thus illustrating the salivary origin of nitrite following nitrate ingestion.
In a publication by Vermeer et al. (1998), the formation of volatile N‐nitrosamines after nitrate intake at the ADI level and consumption of an amine‐rich diet (fish meal) was studied in volunteers. Twenty‐five women participating in the study (aged 18–46 years) received a dinner low in nitrate and containing fish (cod, salmon, shrimp, pollack) in combination with 277 mg of potassium nitrate in 100 mL distilled water, corresponding to 170 mg of nitrate ion. The nitrate dose was at the nitrate ion ADI level for a 60 kg bw; the authors assumed that a conservative nitrate intake from the meal of 50 mg/day would result in a total nitrate intake of 220 mg/day. The study lasted 3 weeks: week 1 was a control period, week 2 was the experimental period and week 3 was a final control period. As reported by the authors, during the control periods, volunteers refrained from consuming high nitrate‐food items and a 2 mL saliva sample (2 h after dinner) and 24 h urine sample were collected. On days 3 and 7 of the experimental period, 2 mL saliva samples were collected at 1, 2, 5 and 23 h after nitrate intake and 24 h urine was collected every day for analysis. The reported results show that the nitrate content of the meals was higher at the beginning of the study compared meals taken during days 4–7. Nitrate and nitrite concentrations increased significantly in saliva and peak levels were observed 1 h after intake of the nitrate solution. Twenty‐three hours after nitrate intake salivary nitrate and nitrite levels decreased to baseline levels. In urine, nitrate increased significantly during the experimental week compared with controls weeks, whereas nitrite was not detected in these samples. Two N‐nitrosamines were detected in urine samples, NDMA and NPIP. Mean concentrations of NDMA increased two‐ to threefold compared with control weeks (287 ± 223, 871 ± 430 to 640 ± 227, 383 ± 168 ng/24 h, respectively). Mean concentrations of NPIP increased slightly compared with the first control week, but did not increase significantly compared with the second control week (69 ± 36, 86 ± 49 to 94 ± 57, 104 ± 55 ng/24 h, respectively). Linear regression analysis of the data showed a correlation between urinary nitrate excretion and urinary NDMA levels but no correlation was demonstrated with NPIP levels. No linear regression results were published on salivary nitrate and nitrite concentrations and urinary NDMA levels. Three other N‐nitrosoamines analysed (NMA, NDEA, N‐nitrosomorpholine (NMor)) were not detected in the urine samples under the conditions of the study.
The IARC (2010) report summarised three observational studies in which urine levels of NPRO, a non‐carcinogenic NOC, correlated with exposure to nitrate through drinking water or food in combination with intake of relatively high amounts of the amino acid proline (500 mg). In these studies, concomitant intake of vitamin C inhibited the formation of NPRO.
3.6.6. Reproductive and developmental toxicity
A literature search was conducted (as described in Section 3.6) and all newly identified studies on nitrite were reviewed. An EFSA public call for data did not indicate that any new relevant data are available on the reproductive and developmental toxicity of sodium and potassium nitrite. However, one study not previously referenced (NTP, 1990) and reproductive parameters not previously considered from subchronic toxicity studies (NTP, 2001) have been reviewed in this section. Previously reviewed toxicity studies in existing evaluations that has been considered by the Panel to be ‘key studies’ are also discussed below.
3.6.6.1. Reproductive toxicity studies
Mice
The potential effects of sodium nitrite on the reproductive function of mice were investigated by Anderson et al. (1978). In a preliminary study, Swiss CD‐1 mice (10 females) were administered sodium nitrite in their drinking water at a concentration of 1 g/L (equivalent to 180 mg/kg bw per day) for 10 weeks. Control animals received untreated drinking water. At the end of the 10 week exposure period the treated female mice were mated with untreated males. ‘Reproductive success’ was judged by the number of females with surviving litters and the total number of offspring at weaning. There was a significant reduction in the number of offspring in the nitrite treated group compared with the controls (p < 0.01). An additional study was conducted, in which Swiss CD‐1 mice (20 females) were administered sodium nitrite in their drinking water at a concentration as in the preliminary study, 1 g/L (equivalent to 180 mg/kg bw per day). After 75 days of treatment, the mice were mated with untreated males. Preconception gain weight was similar in all groups. No statistically significant differences were observed between nitrite treated groups and controls on water consumption, conception time, litter size, rates of stillbirth and neonatal death, weanings weights and sex ratios of the offspring, perinatal survival, and on histopathology of the major organs of dead pups. At weaning, the only statistically significant finding was reduced average body weight in male offspring (p < 0.005). There was no evidence of a teratogenic effect. The Panel noted that only one dose was tested in this study and thus no dose relationship can be established.
A study on sodium nitrite conducted according to the ‘Reproductive Assessment by Continuous Breeding (RACB)’ protocol was done in Crl:Swiss CD‐1 albino mice (NTP, 1990; Chapin and Sloane, 1997). Forty Swiss CD‐1 mice/sex in the control group and 20/sex in the treatment groups were supplied with 0, 0.06, 0.12 and 0.24% (w/v) sodium nitrite in drinking water (equal 0, 131, 273 and 437 mg/kg bw for males and 0, 123, 254 and 412 mg/kg bw for females). Control animals were given untreated deionised drinking water. The animals were administered with the drinking water 7 days before cohabitation and a 98‐day cohabitation period. Nine animals (4 males and 5 females) died during the study. During the study, water consumption was statistically significant reduced by 10–17% in the F0 animals given the highest dose of sodium nitrite except at week 10. There was no statistically significant effect on body weights or changes in mortality or ‘clinical signs’ at any of the tested doses in males and females. There were no statistically significant changes reported in fertility rates of breeding pairs at any dose tested. Reproductive performance of fertile pairs during continuous breeding did not show any statistically significant change. Average litter per pairs, live pups per litter, proportion of pups born alive, sex of pups born alive and live pup's weight were unaffected by the treatment with up to 0.24% sodium nitrite. Cumulative days to litter, dam weights at delivery and at final litter were also unchanged compared to controls. The proportion of F1 pups born alive and of pup survival was unchanged.
At weaning, 20 F1 pups/sex from the control and 0.24% (w/v) sodium nitrite in drinking water (equal to 433 mg/kg bw for males and 556 mg/kg bw for females) were selected to study the reproductive performance. After 3 weeks, administration of the deionised or nitrate containing water the animals were mated and allowed to litter. In the F1 generation, breeding pair's reproductive performance was unaffected as compared to controls. All experimental animals were necropsied and vaginal smears were prepared for 12 consecutive days prior to necropsy. Male's body to organ weight were unchanged. No significant histopathology differences were reported in male liver, kidneys, epididymis, prostate, seminal vehicles and right testis weights. Epididymal sperm motility, sperm count and percentage of abnormal sperm were not affected by treatment. In female mice, body and absolute liver, kidneys and ovary weights were unaffected. A small increase in body to kidney weight ratio was noted. There were no apparent effects reported on oestrus cyclicity or the average oestrous cycle length in treated females. Kidneys and livers from 10 randomly selected F1 animals of each sex were evaluated histopathologically; the incidence and severity of lesions were similar between controls and 0.24% sodium nitrite treated animals. The F1 generation (males and females) showed a statistically significant decrease in average pup weights at the only dose tested (0.24%). In this group, lower average pup weight was reported at 7 days of age until 21 days of age. According to the authors, it is not clear if this effect represents a direct toxic effect of sodium nitrite or if it is secondary to maternal dehydration (decreased water consumption of 17%). However, the authors supposed that higher concentrations would have compromised more severely pup growth or survival and propose this dose as the maximal tolerable dose (MTD). In this RACB study, no reproductive and developmental effects were observed up to 437 mg/kg bw per day for males and 412 mg/kg bw per day for females. The Panel considered the effects on pup weight in the F2 generation animals secondary to the decreased maternal water consumption but noted that at higher doses an effect cannot be excluded.
3.6.6.2. Developmental toxicity studies
JECFA (2003a) referred to several prenatal developmental toxicity studies with sodium nitrite and potassium nitrite were conducted in CD1 mice, Wistar rats, Golden hamsters and Dutch belted rabbits (FDA, 1972a,b). Animals were administered different doses of sodium or potassium nitrite by gavage; the control groups were vehicle treated (vehicle not specified). Body weights were recorded at regular intervals during gestation and all animals were observed daily for appearance and behaviour. All dams were subjected to caesarean section, and the numbers of implantation sites, resorption sites, live and dead fetuses, and body weight of live fetuses were recorded. All fetuses were examined grossly for external abnormalities, one‐third underwent detailed visceral examinations and two‐thirds were stained and examined for skeletal defects.
Mice
Groups of 20–22 pregnant albino CD‐1 mice were dosed via gavage with 0, 0.2, 1.1, 5.0 or 23.0 mg sodium nitrite/kg bw per day from gestational days (GD) 6–15 (FDA, 1972a). Body weights were recorded on GD 0, 6, 11, 15 and at necropsy on GD 17. For both dams and fetuses, no adverse effects were noted at doses of up to 23 mg/kg bw per day.
Groups of 20–23 pregnant albino CD‐1 mice were dosed via gavage with 0, 0.3, 1.5, 7.0 or 32.0 mg potassium nitrite/kg bw per day from GD 6–15 (FDA, 1972b). Body weights were recorded on GD 0, 6, 11, 15, and at necropsy on GD 17. For both dams and fetuses, no adverse effects were noted at doses of up to 32 mg/kg bw per day.
Rats
Groups of 21–23 pregnant albino Wistar rats were dosed via gavage with 0, 0.1, 0.5, 3.0 and 10.0 mg sodium nitrite/kg bw per day from GD 6–15 (FDA, 1972a). Body weights were recorded on days 0, 6, 11, 15 and at necropsy on GD 20. Dams and fetuses were examined as described in the above study with mice. The highest dose induced a slight effect on skeletal retardation. No other adverse effects for both dams and fetuses were noted at doses of up to 10 mg/kg bw per day.
Groups of 20–23 pregnant albino Wistar rats were dosed via gavage with 0, 0.1, 0.5, 3.0 or 10.0 mg potassium nitrite/kg bw per day from GD 6–15 (FDA, 1972b). Body weights were recorded on days 0, 6, 11, 15 and at necropsy on GD 20. Dams and fetuses were examined as described in the above study with mice. The highest dose induced a slight effect on skeletal retardation. No other adverse effects for both dams and fetuses were noted at doses of up to 10 mg/kg bw per day.
Hamster
Groups of 21–23 pregnant Golden hamsters were dosed via gavage with 0, 0.2, 1.1, 5.0 or 23.0 mg sodium nitrite/kg bw per day from GD 6–10 (FDA, 1972a). Body weights were recorded on days 0, 8, 10 and at necropsy on GD 14. Dams and fetuses were examined as described in the above study with mice. No adverse effects for both dams and fetuses were noted at doses of up to 23 mg/kg bw per day.
Groups of 21–25 pregnant Golden hamsters were dosed via gavage with 0, 0.3, 1.5, 7.0 or 32.0 mg potassium nitrite/kg bw per day from GD 6–10 (FDA, 1972b). Body weights were recorded on days 0, 8, 10 and at necropsy on GD 14. Dams and fetuses were examined as described in the above study with mice. No adverse effects for both dams and fetuses were noted at doses of up to 32 mg/kg bw per day.
Rabbits
Groups of 15 Dutch belted rabbits were dosed once daily via gavage with 0, 0.2, 1.1, 5.0 or 23.0 mg sodium nitrite/kg bw per day from GD 6–18 (FDA, 1972a). A caesarean section was performed on GD 29. Live litters were observed in 4, 5, 8, 5 or 6 dams of the 0, 0.2, 1.1, 5.0 or 23.0 mg sodium nitrite/kg bw per day groups, respectively. The incidences of corpora lutea, implantations, live and dead fetuses and resorptions in dams were within the normal range. In fetuses, there were no increased incidences of external, visceral and skeletal abnormalities and also fetal weights were not affected. Due to the low number of dams with live litters, the Panel considered this study not relevant for risk assessment.
Groups of 15 Dutch belted rabbits were dosed once daily via gavage with 0, 0.2, 1.1, 5.0 or 23.0 mg g potassium nitrite/kg bw per day from GD 6–18 (FDA, 1972b). A caesarean section was performed on GD 29. Live litters were observed in 4, 6, 7, 6 or 76 dams of the 0, 0.2, 1.1, 5.0 or 23.0 mg potassium nitrite/kg bw per day groups, respectively. The incidences of corpora lutea, implantations, live and dead fetuses and resorptions in dams were within the normal range. In fetuses, there were no increased incidences of external, visceral and skeletal abnormalities and also fetal weights were not affected. Due to the low number of dams with live litters and high mortality, the Panel considered this study not relevant for risk assessment.
3.6.6.3. Other studies on reproductive endpoints
In a 14‐week study conducted by the NTP on sodium nitrite (NTP, 2001; full study details in Section 3.6.3), male and female B6C3F1 mice exposed to sodium nitrite in the drinking water at concentrations of 0, 375, 750, 1,500 or 5,000 mg/L (equal to 0, 90, 190, 345 and 990 mg/kg bw per day for males, and 0, 120, 240, 445 and 1,230 mg/kg bw per day for females) were examined on potential effects pertaining to reproductive toxicity. At the end of the 14‐week study, samples were collected for sperm motility and vaginal cytology evaluations. The left cauda, epididymis, and testis were weighted and the following parameters were evaluated in males: spermatid heads per gram testis, spermatid heads per testis, spermatid counts, motility and concentration. In females, vaginal samples were collected for cytology evaluations for up to 12 consecutive days prior to the end of the study. The length of the oestrous cycle and the length of time spent in each stage of the cycle were also evaluated. In male mice, there were no statistically significant changes reported in most of the parameters examined, excepted a reduction in sperm motility in animals from the 5,000 mg/L group, the highest sodium nitrite dose tested. Interestingly, in the core 14‐week study, increased incidences of testis degeneration were also reported in 3,000 and 5,000 mg/L male mice. This degeneration was categorised as minimal to mild and was characterised by an increase in the size of residual bodies within the lumen of seminiferous tubules. The residual bodies were generally reported as large and spherical with glassy, eosinophilic staining and a smudged, basophilic core in contrast to controls in which the residual bodies were generally small, dark‐stained cytoplasmic fragments. The significance of the observed testicular degeneration was uncertain to the authors as« degeneration may have been the result of a Sertoli cell defect in the processing of residual bodies ». The Panel agreed that the significance of the testis degenerative finding in the 14 week‐study is uncertain being also observed in concomitant controls, albeit with a different staining pattern, but also considering that no degenerative findings in seminal vesicles were identified in the 2‐year toxicity study with sodium nitrite encompassing doses of up to 3,000 mg/L. In female mice, the oestrous cycle length was statistically significantly increased in animals from the 1,500 and 5,000 mg/L groups compared to controls, although the increased represented only a fraction of a day (~ 4.2, 4.7 and 4.8 days, respectively) and therefore this effect was not considered as adverse by the Panel. Based on the effect on sperm motility, the Panel considered the NOAEL for reproductive effects in this study, mg/L sodium nitrite in drinking water (345 mg/kg bw per day).
Overall, no effects on reproductive toxicity were observed in the RACB study in mice up to 437 mg sodium nitrite/kg bw per day for males and 412 mg sodium nitrite/kg bw per day for females (NTP, 1990). In a 14‐week study sperm abnormalities were observed in mice at 345 mg sodium nitrite per day (NTP, 2001). Developmental toxicity was tested in mice, rats and hamsters at doses up to 23, 10 and 23 mg sodium nitrite/kg bw per day (FDA, 1972a) and up to 32, 10 and 32 mg potassium nitrite/kg bw per day (FDA, 1972b). Only a slight effect on skeletal retardation was observed at the high dose in rats treated with sodium and potassium nitrite.
A summary of the toxicological studies reviewed can be found in Appendix G.
3.6.7. Other studies in humans
3.6.7.1. Cardiovascular system and haematology
In a randomised, three‐arm cross‐over study reported by Hunault et al. (2009), cited in Section 3.6.1.2, seven women and two men (mean age 23 ± 1.5 years and mean weight 68 ± 3.3 kg) received the following treatment in random order: (a) 0.12 mmol sodium nitrite/mmol Hb as an intravenous dose, (b) 0.12 mmol sodium nitrite/mmol Hb as an oral dose in drinking water, and (c) 0.06 mmol sodium nitrite/mmol Hb as an oral dose in drinking water. Only minor adverse effects were reported by all the participants (nausea or mild headache). Intravenous administration of sodium nitrite decreased median arterial blood pressure, which was accompanied by a compensatory increase in heart rate; similar but less pronounced changes were reported after oral administration of sodium nitrite. These changes occurred simultaneously with the increase in plasma nitrite concentrations and lasted for about 1.5 h, returning to baseline values when plasma nitrite concentration decreased.
To study the role of blood circulating S‐nitrosothiols and nitrite vs regional endothelium‐derived NO in the regulation of regional basal vascular tone during normal and forearm exercise conditions, forearm arterial and venous plasma levels of nitrate and nitrite, low and high molecular mass S‐nitrosothiols and red cell S–nitrosothiol‐haemoglobin levels were measured in healthy volunteers (Gladwin et al., 2000). The volunteers, seven men and three women (mean age 42 years), were placed under fasting conditions the night before and during the study day, five of them been placed on a nitrate‐low diet (< 15 mg/day) 3 days before the assay. Additionally, forearm blood flow was measured in the presence of a NO synthesis inhibitor (NG‐monomethyl‐l‐arginine). Results showed that mean forearm blood flow was reduced in the presence of NO inhibitor, but increased during exercise. This response was coincided with increased levels of nitrite in circulating whole blood, although nitrate blood levels did not change significantly. The levels of circulating S‐nitrosothiols were not changed, whereas those of S‐nitrosothiol‐haemoglobin decreased during exercise in the presence of NO synthesis inhibitor. The authors concluded that results provided evidence that circulating nitrite acts as a pool of bioavailable intravascular NO. The hypothesis that nitrite is a pool of NO has been also developed by the same authors in other reports (Gladwin et al., 2005; Gladwin and Kim‐Shapiro, 2008).
The influence of plasma nitrite on systemic and pulmonary blood flow circulation was investigated in healthy volunteers during stable hypoxia conditions and during normoxic conditions (Ingram et al., 2010). In total, 18 healthy volunteers (mean age 24 years) were asked to refrain from consuming foods high in nitrite, alcohol and caffeine 12 h before the trial. Hypoxic conditions were obtained in an environmental chamber containing an inert, nitrogen‐rich, hypoxic gas mixture (not identified); whereas normoxic conditions were performed breathing air in a temperature‐controlled room. Forearm systemic arterial blood flow was measured and venous blood samples were taken in all volunteers to assess blood NO metabolites. Transthoracic echocardiography was performed to assess pulmonary arterial blood pressure. Exposure of all subjects to nitrite was achieved by intravenous infusion over 30 min of a solution of sodium nitrite at a rate of 1 μmol/min (30 μmol total) before peak infusion measurements were taken. Saline solution (0.9% NaCl) was infused under the same conditions as a control. Three separated physiological protocols were investigated: hypoxia/nitrite protocol (12 subjects), hypoxia/saline protocol (six subjects) and normoxic/nitrite protocol (six of the 12 subjects investigated in the first protocol). In the first protocol, arterial oxygen saturation fell as expected when the oxygen content of the environmental chamber was reduced, heart rate and cardiac output increased. Systemic arterial blood pressure was not altered during this protocol, suggesting to the authors that hypoxia produced systemic arterial vasodilation. Under these conditions, a measurable isovolumic relaxation time of the right ventricle was noticed, which according to the authors was secondary to hypoxic pulmonary arterial vasoconstriction. Pre‐infusion plasma nitrite levels did not differ between the two hypoxia groups. The baseline plasma nitrite levels and the pre‐infusion samples of all 18 subjects who underwent hypoxia‐equilibration period did not differ either. A difference was observed between baseline nitrite levels taken in room air in the hypoxia/nitrite protocol and the normoxic/nitrite protocol in the six subjects that underwent both protocols. According to the authors, these findings show that the difference in plasma nitrite observed between the two hypoxia condition protocols and the normoxic protocol cannot be attributed to hypoxia alone. The levels are those expected within the normal range and day‐to‐day variation in plasma nitrite concentration. No difference in the infused‐associated increase in plasma nitrite concentration was observed between the hypoxia/nitrite and normoxia/nitrite subjects. No significant changes in plasma nitrite were observed during the whole hypoxia/saline protocol. The systemic arterial response to nitrite increased when nitrite was infused during hypoxia conditions, but not during normoxia conditions or when saline solution was infused during hypoxia. However, the systemic arterial response fell to baseline levels 1 h after infusion of nitrite during hypoxia. The increased systemic arterial blood pressure response during hypoxia correlated with the peak plasma nitrite, whereas it did not during normoxia conditions. Changes in the pulmonary arterial blood pressure almost doubled in response to hypoxia, the infusion of nitrite reduced this effect by 16% and lasted after plasma nitrite returned to normal. A similar response was noticed under hypoxia conditions in the hypoxia/saline protocol, but no changes were observed during saline infusion. Arterial blood pressure was unchanged during the normoxia/saline protocol. During the normoxic/nitrite protocol, no changes in heart rate, stoke volume or cardiac output were observed after nitrite infusion. The authors concluded that nitrite is a pulmonary vasodilator whose effect is prolonged.
As a result of bioconversion to NO the influence of dietary nitrate, via beetroot juice consumption, on arterial blood pressure, on supplement endothelial function during ischaemia (measured by flow‐mediated dilatation), and on inhibition of platelet aggregation was investigated in 14 healthy volunteers (no information on age and sex given) (Webb et al., 2008). Volunteers were randomly assigned to drink 500 mL of either beetroot juice or water (control) within a 30‐min period. Blood pressure was measured every 15 min for 1 h pre ingestion and 3 h post‐ingestion of either drink, then hourly until 6 h post‐ingestion, followed by a final reading at 24 h (a mean of three readings per individual was calculated for each time interval). Blood samples were collected every 30 min for 2 h, and then hourly up to 6 h, with a final sample collected at 24 h, to determine plasma nitrate and nitrite concentrations. The effect of spitting out all saliva during, and for 3 h following juice ingestion on blood pressure and changes in plasma nitrate/nitrite concentrations was also investigated. The mean concentration of nitrate in the beetroot juice was 45.0 ± 2.6 mM/L (2.79 g/L; initial study) and 34.0 ± 0.1 mM/L (2.11 g/L; spitting study). Nitrite concentrations in the juice were below the LOD (< 50 nM/L). Plasma nitrite concentrations increased twofold and reached a peak at 3 h post‐ingestion of beetroot juice (actual concentrations were not stated). They remained at this level until 5 h after beetroot juice ingestion. By 24 h, the concentrations were back to baseline levels. In volunteers receiving beetroot juice, blood pressure began to significantly decrease (compared with controls) 1 h after juice ingestion, with peak reductions occurring at 2.5–3 h. Blood pressure began to decrease 1 h after ingestion of the juice compared with the controls, the peak difference in SBP was reached at 2.5 h after ingestion, whereas the peak difference in diastolic blood pressure was reached 3 h after ingestion. Mean heart rate was not altered significantly over the 1–6 h period following ingestion of beetroot juice or water. The changes to blood pressure were related to plasma nitrite concentrations, as shown by an inverse correlation between the change in plasma nitrite concentration and the change in SBP from baseline. No significant correlation was observed between plasma nitrate and SBP. Interrupting the enterosalivary circulation by spitting out all saliva blocked the rise in plasma nitrite concentration, and reduced the observed effects on blood pressure. Beetroot did not alter pre‐ischaemic branchial artery dilatation but it protected against ischaemic–reperfusion‐induced depression of the flow‐mediated dilatation response. According to the authors the functional effects of an acute dietary nitrate load are attributable to nitrite conversion and nitrite‐derived NO production.
3.6.7.2. Methaemoglobinaemia
The formation of methaemoglobin involves oxidation of the ferrous iron of the haemoglobin haem group to the ferric form by nitrite and its corresponding conversion to nitrate. Methaemoglobin prevents normal oxygen delivery to tissues, thus high concentrations of methaemoglobin can cause tissue hypoxia (Mensinga et al., 2003).
A number of factors are critical to methaemoglobin formation including the presence of increased nitrite, intestinal infection together with inflammation of the stomach endothelium and the activity of cytochrome b5 reductase (which converts methaemoglobin back to haemoglobin). Methaemoglobin is produced normally with background levels of 1–3% of total blood haemoglobin concentration (Goldsmith et al., 1976). In experimental conditions, the background levels of methaemoglobin were found to be below 1% (Kortboyer et al., 1997). Levels of 10% or more have been shown clinically to reduce oxygen transport. At levels > 20%, cyanosis and hypoxia can occur and an increase to 50% methaemoglobin can prove fatal (Mensinga et al., 2003). The specific sensitivity of infants below 16 weeks of age to methaemoglobinaemia can be explained by differences in the activity of cytochrome b5 reductase, which is 40–50% lower than in the adults (Bartos and Desforges, 1966; Wright et al., 1999). In addition, these infants have a large proportion of fetal haemoglobin still present in their blood, which has been shown to form twice as much methaemoglobin than adult haemoglobin under in vitro conditions (Wind and Stern, 1977; WHO, 2007).
Case studies
A 6‐month‐old otherwise healthy infant was admitted to hospital with perioral cyanosis 3 h after eating a refrigerated mixed‐vegetable puree that had been prepared 5 days earlier (Bryk et al., 2007). Supraventricular tachycardia developed and the patient had a heart rate of 230 beats/min. Chemical analysis of the blood detected a methaemoglobin level of 25%. By 8 h, methaemoglobin was reduced to 1%, and the arrhythmias resolved spontaneously. The authors noted the risks of long‐term refrigeration/storage of vegetables, particularly those that are to be fed to young infants.
A 41‐year‐old woman with a history of hypertension, showed symptoms of bluish skin colour and dizziness 5 min after self‐medication with a Chinese herbal medicine. At examination she was also diagnosed with tachycardia, but there were no other remarkable clinical findings apart from disorientation. The patient was transferred to the intensive care unit where her condition improved. Haematology analysis lead to the diagnosis of methaemoglobinaemia, and sodium nitrite, which had been incorrectly incorporated into the formulation, was identified as a major component of the herbal medicine in laboratory tests (Chui et al., 2005).
A report is available on fatal methaemoglobinaemia induced by self‐poisoning with sodium nitrite by a 76‐year‐old man (Harvey et al., 2010). The patient could state he had ingested an unknown amount of crystalline sodium nitrite, collapsed and quickly developed brady‐asystolic cardiac arrest within 25 min of the attempted suicide. His haemoglobin concentration on arrival to emergency department was 110 g/L, arterial methaemoglobin 82.6% and serum lactate 9.6 mmol/L, and despite efforts of resuscitation, the patient died.
3.6.8. Epidemiological studies on cancer
Potential carcinogenicity of nitrate and nitrite in humans has been extensively reviewed by the IARC (2010), and the epidemiological studies discussed in the IARC report have therefore not been discussed in this opinion. The interested reader is invited to consult the IARC report for details of all these studies. The overall evaluation of the IARC (2010) was that ‘there is limited evidence in humans for the carcinogenicity of nitrite in foods. Nitrite in food is associated with an increased incidence of stomach cancer’. The overall conclusions of the Panel are based on IARC evaluation of the epidemiological studies on nitrate, nitrite and cancer published until 2006 (IARC, 2010) and on the evaluation of epidemiological studies published subsequently. Only original studies that have data on nitrates or dietary NOCs intake (reviews were not included) and studies that have not been included in the IARC (2010) report were reviewed, retrieved according to the protocol agreed by the Panel presented in Appendix H. It was found that a paper already described in the IARC (2010) review of Knekt et al. (1999) (on head–neck cancer (HNC), CRC), was not described in terms of NDMA results, thus it appears in the current review as well.
The epidemiological studies per cancer site, were ranked according to study design as follows: cohort, case–control and ecological studies. Study descriptions were extended with information on processed meat items or specific animal foods, if possible. The evaluation of cancer in the different organs follows the ordering of the International Classification of Diseases (ICD‐10, WHO): head–neck, oesophagus, stomach, colorectal, liver, pancreas, lung, breast, ovarian, prostate, renal, bladder, urinary tract, thyroid, non‐Hodgkin lymphoma, leukaemia and brain/glioma.
The evidence for human cancer from these studies was categorised as follows: (a) there was no evidence for an association, if studies indicate no association with a specific cancer; (b) there was insufficient evidence, to link to a cancer (e.g. few studies, contradictory results); (c) there was some evidence, for an association with a specific cancer (e.g. inconsistent results between cohort studies and case–control studies); and (d) there was evidence, for an association with a specific cancer (e.g. consistent results from cohort studies and case–control studies).
In the protocol, all necessary items to for the risk assessment (causal inference) were listed to be included in the description of studies. In brief, while evaluating the studies it was taken into consideration the type of study (ecological, case–control, cohort), giving more weight to cohort studies; the quality of the exposure assessment, the power of the study, the presence of dose‐response (e.g. by evaluating P for trend) and the good control for confounding factors. Study‐specific limitations were also taken into account in the evaluation. For cohort studies, the number of cases identified during the follow‐up and the time of follow‐up and number of participants lost to follow‐up were also considered.
From the literature search, 95 studies on nitrate, nitrite and/or NOCs intake by oral route and head–neck, oesophageal, stomach, colorectal, liver, pancreatic, lung, breast, ovarian, prostate, renal, bladder, urinary tract, thyroid, non‐Hodgkin lymphoma, leukaemia, brain/glioma and total cancer were selected and screened for detailed evaluation. Thirty‐two published epidemiological studies on dietary nitrite and cancer were excluded. In total, 46 epidemiological studies were critically reviewed on nitrite and/or NOCs.
3.6.8.1. Head–neck cancer
Cohort studies
Knekt et al. (1999) investigated the risk of HNC following exposure to nitrite, nitrates and NDMA, using a cohort of 9985 healthy adult Finnish men and women (age not presented) in the Finnish Mobile Clinic survey. Intakes of nitrate, nitrite and NDMA were estimated using food consumption data from a 1‐year dietary history interview, which covered the total diet of the volunteers. Mean daily intake was 77 mg for nitrates (standard deviation (SD) not presented), 5.3 mg for nitrites, and 0.052 μg of NDMA from the diet and 0.071 μg from beer. During the 24‐year follow‐up, 48 HNC cancer cases were diagnosed in the cohort. After adjustment for sex, age, municipality, smoking and energy intake in Cox proportional hazards (PH) models, no significant associations were observed between risk of HNC cancer and nitrate intake (relative risk (RR) Q4 vs Q1 (cut‐offs or medians not presented): 0.84; 95% confidence intervals (CI): 0.39–1.81; ptrend = 0.95), nitrite intake (RR Q4 vs Q1: 0.83; 95% CI: 0.36–1.88; ptrend = 0.77), or NDMA intake (RR Q4 vs Q1: 1.37; 95% CI: 0.50–3.74; ptrend = 0.43). The study had low power.
Summary
One cohort study has investigated the association between intake of nitrite and NDMA and risk of HNC (Knekt et al., 1999; NDMA results were not described in IARC 2010 review).
Overall, the Panel considered that no significant associations were seen for nitrite or NDMA, but the power of the study was low since there were only 48 incident head–neck cancer cases.
3.6.8.2. Oesophageal cancer
Cohort studies
Cross et al. (2011) studied the relationship between intake of meat, meat components and meat cooking by‐products and risk of oesophageal cancer subtypes. The National Institutes of Health–American Association of Retired Persons (NIH–AARP) Diet and Health Study recruited men and women, aged 50–71 years, from six states in the USA. At baseline (1995–1996) participants completed self‐administered demographic and lifestyle questionnaires, including a 124 item food‐frequency questionnaire (FFQ). Approximately 6 months later, cancer‐free participants were mailed a risk factor questionnaire, which elicited detailed information on meat intake and cooking preferences. A total of 566,402 participants returned the baseline questionnaire and 337,074 of these also returned the risk factor questionnaire. They estimated nitrate and nitrite intake from processed meats using a database of measured values from 10 types of processed meats (bacon, red meat sausage, poultry sausage, red and white luncheon meats, red and white cold cuts, ham, hot dogs), which represent 90% of processed meats consumed in the USA; these meats were also measured for NOCs, but they were all below the detectable limit. After excluding prevalent cancer cases, and those with implausible nutrient values, the baseline analytical cohort consisted of 494,979 people (295,305 men and 199,674 women), and the risk factor questionnaire cohort consisted of 303,156 people (176,842 men and 126,314 women). During 10 years of follow‐up, they accrued 215 oesophageal squamous cell carcinomas (ESCC), 630 oesophageal adenocarcinomas (EAC). In the subcohort of participants who returned the risk factor questionnaire (126,314 females and 176,842 males), there were 128 incident cases of ESCC and 377 EAC. Cox PH modelling was used as analysis technique. After controlling for age, race, total energy intake, smoking, family history of cancer, family history of diabetes, body mass index (BMI), physical activity, alcohol, saturated fat, fruits and vegetables intake, red meat intake was positively associated with ESCC (RR Q5 vs Q1: 1.79; 95% CI: 1.07–3.01; ptrend = 0.019), but not with EAC. The malignancies investigated in this study were not found to be associated with white or processed meat. Heterocyclic amine intake was seen to be positively associated with malignancies. An increased risk for EAC, although not statistically significant, was identified, for those in the high quintile intake of heterocyclic amines (hazard ratio (HR) = 1.35; 95% CI: 0.97–1.89; HR: 1.45; 95% CI: 0.99–2.12; ptrend = 0.463, respectively). However a significant dose response was observed (ptrend = 0.022). A positive association was also present for haem iron intake and EAC (HR for top vs bottom quintile = 1.47; 95% CI: 0.99–2.2; ptrend = 0.063). No association was found between nitrate or nitrite intake from meat and oesophageal cancer subtypes. Comparing the highest vs the lowest quintile of intake, the results for nitrate from meat and ESCC risk were (RR Q5 (median 0.298 mg/1,000 kcal) vs Q1 (0.024): 1.30; 95% CI: 0.72–2.35; ptrend = 0.153), for nitrate and for EAC were (RR: 1.10; 95% CI: 0.75–1.60; ptrend = 0.350). Comparing highest vs lowest quintile of intake, the results for nitrite from meat and ESCC risk were (RR Q5 (median 0.199 mg/1,000 kcal) vs Q1 (0.012): 1.21; 95% CI: 0.67–2.20; ptrend = 0.651), and for nitrite and EAC were (RR: 1.19; 95% CI: 0.84–1.68; ptrend = 0.029). None of the quintile HR estimates were significantly different from one, nor were continuous analyses. Strengths of the study include the large size enabling the investigation of tumour subtypes. The study lacked information on nitrate and nitrite intake from other foods, and nitrate intake from drinking water.
Keszei et al. (2013) studied the relationship between risks of oesophageal cancer subtypes and intake of NDMA, ENOC formation, haem iron, nitrite and nitrate in the Netherlands Cohort Study (NLCS). This prospective cohort study started in September 1986; at baseline, 58,279 men and 62,573 women aged 55–69 years were recruited from 204 municipal population registries throughout The Netherlands. At baseline (1986), a self‐administered questionnaire was completed by study participants on dietary habits and other risk factors of cancer. The dietary part consisted of a validated 150‐item FFQ. The cohort was followed for 16.3 years, and 110 ESCC and 151 EAC were analysed, along with 4,032 subcohort members in a case‐cohort analysis. To calculate intakes, food composition values for nitrate and nitrite were obtained from analyses conducted by Dutch institutes in the period 1984–1989. Information about nitrate content in drinking water from all pumping stations in the Netherlands in 1986 was used to determine the nitrate concentration in drinking water for each home address by postcode, and calculate nitrate intake from water (in fact water, coffee, tea and soup combined). Nitrite intake was assessed solely on the intake of processed meat, as the nitrite content of vegetables and cheese was considered negligible in comparison with processed meat. Considered processed meat items were: all types of sausages, bacon, ham, cold cuts, croquettes and frankfurters. NDMA values in food items were initially extracted from published measurements in Dutch foods in the 1970s and 1980s. Food items for which NDMA values were not available from Dutch sources, but non‐zero content was indicated in a comprehensive food composition database of nitrosamines (Jakszyn et al., 2004a,b), measurements made in food sources from Western or Northern Europe in the 1980s were used. An index of ENOC formation was calculated, as previously determined by Jakszyn et al. (2006), based on the haem iron intake. The correlation between ENOC and haem iron was 0.97.
In the sex‐specific statistical analyses, Cox PH modelling was used, controlling for age, smoking, BMI, educational level, energy intake, vegetable and fruit intake, and total alcohol intake; in NDMA analyses, adjustment was made for alcoholic beverages excluding beer, as beer was an important source of NDMA. The estimated mean (SD) values of intake in the subcohort (a random sample of the NLCS) were for men and women, respectively: nitrate, 108 (SD 45) and 106 (44) mg/day; nitrite, 0.12 (0.16) and 0.08 (0.12) mg/day; NDMA (median), 0.084 and 0.044 μg/day; ENOC, 102 (25) and 93 (23) μg/day. When comparing men in the highest vs lowest tertile of intake, the results for nitrite and ESCC risk were (HR T3 (median 0.28 mg/day) vs T1 (0.03): 1.92; 95% CI: 0.94–3.89; ptrend = 0.06), and for nitrite and EAC were (HR: 0.74; 95% CI: 0.43–1.28; ptrend = 0.30). Although none of the tertile HR estimates were significantly different from one, nor were any tests for trend, in continuous analyses there was a significant association between nitrite and ESCC (HR: 1.19; 95% CI: 1.05–1.36, per 0.1 mg/day increment). In nitrite analyses in women, none of the tertile HR estimates were significantly different from one, nor were any tests for trend, or continuous analyses. For nitrate, in both men and women, none of the tertile HR estimates were significantly different from one, nor were any tests for trend, or continuous analyses. For NDMA intake, when comparing men in the highest vs lowest tertile of intake, the results for ESCC risk were (HR T3 (median 0.25 μg/day) vs T1 (0.04): 2.43; 95% CI: 1.13–5.23; ptrend = 0.01), for NDMA and EAC were (HR: 0.87; 95% CI: 0.52–1.45; ptrend = 0.63). For ESCC, HR estimates were significant in continuous analyses (HR: 1.15; 95% CI: 1.05–1.25, per 0.1 μg/day increment). In women, when comparing the highest vs lowest tertile of NDMA intake, the results for ESCC risk were (HR T3 (0.07 μg/day) vs T1 (0.03): 1.21; 95% CI: 0.56–2.62; ptrend = 0.57), and for NDMA and EAC were (HR: 0.92; 95% CI: 0.40–2.14; ptrend = 0.90). For ESCC, there was a significant association with NDMA in continuous analyses (HR: 1.34; 95% CI: 1.04–1.71, per 0.1 μg/day increment). A combined analysis of men and women showed a significant positive association with ESCC (HR T3 vs T1: 1.76; 95% CI: 1.07–2.90; ptrend = 0.01). Haem iron intake, and thus ENOC because of the high correlation, was also positively associated with ESCC in men (HR T3 vs T1: 2.23; 95% CI: 1.05–4.75; ptrend = 0.03), but not in women (HR T3 vs T1: 0.71; 95% CI: 0.34–1.51; ptrend = 0.40). For other cancer subsites, no significant associations were seen in men or women in multivariate analyses.
These results suggest that NOCs may influence the risk of ESCC, especially in men, but there are no clear associations for EAC. Strengths of the study include the large size and long follow‐up enabling the investigation of tumour subtypes. Nitrite intake was assessed solely on the intake of processed meat, but nitrite content of vegetables and cheese was considered negligible in comparison with processed meat.
Case–control studies
Ward et al. (2008) conducted a population‐based case–control study of adenocarcinoma of the oesophagus in Nebraska, USA. Cases were white men and women aged 21 years or older, newly diagnosed between 1988 and 1993, identified from the Nebraska Cancer Registry and confirmed by histological review. Controls were selected from a previous population‐based case–control study of lymphatic and haematopoietic cancers in Nebraska, and were re‐interviewed at the time of this study (1992–1994). Response rates were between 79% and 88%. Telephone interviews were conducted with subjects or their proxies for those who were deceased or too ill to participate. Proxy interviews were conducted for 76%, and 61% of oesophagus cancer cases and controls, respectively. Nitrate concentrations in public drinking water supplies were linked to residential water source histories. Among those using private wells at the time of the interview, they measured nitrate levels in water samples from wells. Dietary nitrate and nitrite were estimated from a FFQ (SHHQ). They estimated odds ratios (OR) and 95% CI using unconditional logistic regression, adjusting for gender, year of birth and risk factors for oesophagus cancer (smoking, alcohol, BMI). Among those who primarily used public water supplies (84 oesophagus cancer cases, 321 controls), average nitrate levels were not associated with risk (highest vs lowest quartile: oesophagus OR: 1.3; 95% CI: 0.6–3.1; ptrend = 0.519). Increasing intake of nitrate plus nitrite from animal sources (details NA) was associated significantly with oesophagus cancer (OR Q4 (> 8.3 mg) vs Q1 (< 3.8): 2.2; 95% CI: 0.9–5.7; ptrend = 0.015), but not with nitrite from plant sources (median intake 0.52 mg/day). Increasing intake of nitrate from plant sources (median intake NO3: 116.1 mg/day) was not associated with oesophagus cancer (OR Q4 (> 171.9 mg) vs Q1 (< 74.9): 0.8; 95% CI: 0.3–1.8; ptrend = 0.121). The number of cases is small in this study. Although there was a relatively high response rate, percentage of proxy interviews is high, which could have led to information bias.
Navarro‐Silveira et al. (2011) conducted a population case–control study on 1,839 individuals aged 30–79 years in three geographic areas of the USA (Connecticut, New Jersey, Washington State) to study dietary and lifestyle factors in relation to risk of oesophageal and gastric cancer. The response rate for EAC and GCA cases was 80.6% and 74.1% for ESCC and GNCA, and 70.2% for controls. In the dietary analysis, 687 controls and 282 cases of EAC, 206 cases of ESCC and 352 cases of non‐cardia gastric adenocarcinoma were included. Proxy interviews were conducted for 31% of EAC, 26% of GCA, 35% of ESCC, 30% of GNCA and 3.4% of controls. Principal component analysis (PCA) was conducted to identify dietary patterns (e.g. meat/nitrite, fruit/vegetable) associated with the risk of oesophageal and gastric cancer. In the PCA procedure, 19 food groups, BMI, GERD symptoms, smoking, consumption of beer, wine and liquor, intake of fibre, vitamin C (mg/day) and nitrite (mg/day) were included. Principal component scores were generated. Scores were then categorised into quartiles and used in multivariate unconditional logistic regression analysis to calculate OR and 95% CI. All models were adjusted simultaneously for all principal components and age, gender, education, income, race, residence and energy intake. The first patterns loaded heavily on nitrite, high nitrite meats and red meats and was termed meat/nitrite patterns. Statistically significant positive associations were found for the highest vs lowest quartile of the meat/nitrite principal component for both gastric cancer (OGA) (OR: 2.40; 95% CI: 1.25–4.62; ptrend = 0.001) and EAC (OR: 5.61; 95% CI: 2.81–11.20; ptrend < 0.001). The main limitation of the study was the use of a dietary pattern (meat/nitrite) and not nitrite levels alone (mg/day) to study the relation between nitrite and gastric cancer. Another possible limitation of the study was the high number of proxy interviews, which may lead to information bias. The study lacked information on nitrate intake from drinking water.
Ecological studies
Zhang et al. (2012) investigated, in China, the association between nitrogen compounds in drinking water and the incidence of ESCC in an ecological study by geographical spatial analysis. The incidence of ESCC is high in Shexian county, China. The study focused on three nitrogen compounds in drinking water, namely nitrates, nitrites and ammonia, all of which are derived mainly from domestic garbage and agricultural fertiliser. The study surveyed 48 villages in the Shexian area with a total population of 54,716 (661 ESCC cases). Logistic regression analysis was used to detect risk factors for ESCC incidence. Most areas with high concentrations of nitrate nitrogen in drinking water had high incidence of ESCC. Correlation analysis revealed a significant relationship between nitrate concentration and ESCC (r = 0.38; p = 0.01), but not with nitrite.
Summary
In a previous review that considered publications until 2006 (IARC, 2010), two case–control studies were described (Rogers et al., 1995; Mayne et al., 2001) in which no significant association was found for nitrite with overall oesophageal cancer or with the histological subtypes ESCC and EAC. However, positive associations were found for subjects with a low intake of vitamin C in both studies. Since then, no new cohort studies, one case–control and one ecological study have been published, often on oesophageal cancer subtypes. The cohort studies generally used multivariable analyses to adjust for confounders.
Two cohort studies looked into histological subtypes. For ESCC and EAC, no significant associations were found with total nitrite intake (Keszei et al., 2013), or with nitrite intake from meat (Cross et al., 2011). However, a significant positive association was found with nitrite intake in men, and with NDMA intake in men and women, but not for EAC (Keszei et al., 2013). In a cohort study directed at total cancer, subgroup results for oesophageal cancer indicated non‐significant positive associations with dietary nitrite or NDMA intake, but this was only based on 55 cases (Loh et al., 2011). In the case–control study, a significantly positive association, with a dose–response, was found between nitrate plus nitrite from animal sources (Ward et al., 2008). In the study of Navarro‐Silveira et al. (2011), a dietary profile characterised by high consumption of meat and nitrite was associated with an increased risk of oesophageal cancer.
The ecological study in China (Zhang et al., 2012) found no significant association between ESCC incidence and nitrite levels in drinking water.
Overall, the Panel considered that the information was still sparse for oesophageal cancer, but its provisional conclusions based on the stronger study designs was that:
there was insufficient evidence that dietary nitrite is related to oesophageal squamous cell carcinoma (ESCC) risk, but not oesophageal adenocarcinoma (EAC), because this is only seen in men in one study;
there was insufficient evidence that preformed N‐nitrosodimethylamine in the diet is associated with increased risk of ESCC, but not EAC because this is based only on one large cohort study.
3.6.8.3. Gastric cancer
Cohort studies
Jakszyn et al. (2006) investigated the association between the estimated dietary intake of NDMA and the ENOC formation in relation to gastric cancer risk. Epidemiological data were obtained from the large European Prospective Investigation into Cancer and Nutrition. Within the cohort of 521,457 participants (368,010 women and 153,447 men), 314 incident gastric cancer cases confirmed as adenocarcinoma were included and were follow‐up for a period of 6.6 years. The diet and lifestyle of all recruited individuals in the previous 12 months prior to study were assessed using validated diet and lifestyle questionnaires at the beginning of the study. Dietary intake of nitrites and NDMA was estimated by correlating food items identified in the questionnaires with a food database of potential carcinogens (Jakszyn et al., 2004a). An index for exposure to ENOC was estimated using iron intake data based on an estimate of meat intake as reported in the questionnaires, and faecal apparent total ENOC from the published literature. Plasma vitamin C levels and antibodies to H. pylori were determined in a subsample of cases and matched controls included in a nested case–control within the cohort. Mean (SD) exposure (in controls) to NDMA was 0.19 (0.31) μg/day, and 84.46 (30.71) μg for ENOC. Gastric cancer cases had higher H. pylori infection rates and lower plasma vitamin C levels than controls. Cox PH models were adjusted for age, sex, height, weight, educational level, alcohol intake, status of smoking, daily cigarette smoking, work physical activity, leisure physical activity, energy intake, consumption of total vegetables, fresh fruit, citrus fruit and nitrites intake. There was no association between NDMA intake and GC risk overall (HR per 1 μg/day increase: 1.00; 95% CI: 0.7–1.43; ptrend = 0.96), or for cardia (HR: 0.68; 95% CI: 0.34–1.37; ptrend = 0.29) or GNCA (HR: 1.09; 95% CI: 0.65–1.81; ptrend = 0.75). ENOC was significantly associated with non‐cardia cancer risk (HR: 1.42; 95% CI: 1.14–1.78 for an increase in 40 mg/day), but not with cardia cancer (HR: 0.96; 95% CI: 0.69–1.33) or total GC risk (HR: 1.18; 95% CI: 0.99–1.39). This association between ENOC and GNCA was found in H. pylori‐infected subjects, whereas uninfected subjects did not show any association; however, the test for interaction was not statistically significant (p = 0.09). This association between ENOC and GNCA was found in subjects in the lower half of plasma vitamin C; no association was found among subjects with high levels of plasma vitamin C, with a statistically significant test for interaction (p = 0.02). According to the authors, ENOC formation may account for the previously reported association between red and processed meat consumption and gastric cancer risk. Strengths of the study include the size, follow‐up, detailed NDMA and ENOC calculations, and availability of plasma measures.
In a prospective study, Larsson et al. (2006) investigated the associations between intake of red meat, poultry and fish, processed meat (bacon or side pork, sausage or hotdogs, and ham or salami), NDMA and risk of stomach cancer. Data was obtained from the Swedish Mammography Cohort composed of a population of women, between the ages of 58 and 92 years, with an 18‐year follow‐up and repeated assessment of diet. For the analysis, after exclusions, data for 61,433 women was retained for the analysis. Dietary exposure was assessed through a 67‐item FFQ at baseline between 1987 and 1990 (repeated with an expanded 96‐item FFQ in 1997) administered to each participant and the NDMA content of food items on the Swedish market was determined from the literature. Specific processed products used for to estimate NDMA intake were meat products (bacon, side pork, sausages, ham), smoked fish, caviar and roe, alcoholic beverages and chocolate. One hundred and fifty‐six cases of stomach cancer (of 61,433 women) were ascertained during the follow‐up period. In Cox PH models, adjustment was made for age, education, BMI and intake of total energy, alcohol, fruits and vegetables. High consumption of processed meat by these women was statistically significantly associated with increased stomach cancer risk, (RR T3 vs T1: 1.66; 95% CI: 1.13–2.45; ptrend = 0.01). When individual processed meat items were analysed, all were positively associated with gastric cancer risk. There were no positive associations for red meat, poultry and fish consumption. A statistically significant association was reported between NDMA estimated intake (median 0.098 μg/day) and stomach cancer risk (RR Q5 (> 0.194 μg/day) vs Q1 (< 0.041): 1.96; 95% CI: 1.08–3.58; ptrend = 0.02). The association between processed meat or NDMA and gastric cancer did not differ according to level of vitamin C or vitamin E intake. Apart from the size, a strength of the study is the repeated assessment of diet, the response rate to the repeated assessment of diet was 70%. The Panel noted that the authors did not provide estimates of the relationship between nitrite intake levels alone (mg/day) and gastric cancer. In addition, the study lacked information on nitrate intake from drinking water.
Cross et al. (2011) studied the relationship between intake of meat, meat components and meat cooking by‐products and risk of gastric cancer subtypes. The NIH–AARP Diet and Health Study recruited men and women, aged 50–71 years, from six states in the USA. At baseline (1995–1996), participants completed self‐administered demographic and lifestyle questionnaires, including a 124 item FFQ. Approximately 6 months later, cancer‐free participants were mailed a risk factor questionnaire, which elicited detailed information on meat intake and cooking preferences. A total of 566,402 participants returned the baseline questionnaire and 337,074 of these also returned the risk factor questionnaire. They estimated nitrate and nitrite intake from processed meats using a database of measured values from 10 types of processed meats (bacon, red meat sausage, poultry sausage, red and white luncheon meats, red and white cold cuts, ham and hot dogs), which represent 90% of processed meats consumed in the USA; these meats were also measured for NOCs, but they were all below the detectable limit. After excluding prevalent cancer cases, and those with implausible nutrient values, the baseline analytical cohort consisted of 494,979 participants (295,305 men and 199,674 women), and the risk factor questionnaire cohort consisted of 303,156 participants (176,842 men and 126,314 women). During 10 years of follow‐up, they accrued 454 GCAs and 501 GNCAs. In the subcohort of participants who returned the risk factor questionnaire (126,314 females and 176,842 males), there were 255 gastric cardia cancers and 277 gastric non‐cardia cancers. Cox PH modelling was used as analysis technique. After controlling for age, race, total energy intake, smoking, family history of cancer, family history of diabetes, BMI, physical activity, alcohol, saturated fat, fruits and vegetables intake, red meat intake was not associated with gastric (cardia or non‐cardia) cancer. The malignancies investigated in this study were not found to be associated with white or processed meat. Heterocyclic amine intake was seen to be positively associated with malignancies; when individuals in the high quintile were compared with the low quintile, an increased risk for cardia cancer (HR: 1.44; 95% CI: 1.01–2.07) was found. No association was found between nitrate or nitrite intake from meat and gastric cancer subtypes. Comparing highest vs lowest quintile of intake, the results for nitrate from meat and GCA were (RR Q5 (median 0.298 mg/1,000 kcal) vs Q1 (0.024): 0.81; 95% CI: 0.52–1.25; ptrend = 0.259), and for nitrate and GNCA were (RR: 1.04; 95% CI: 0.69–1.55; ptrend = 0.578). Comparing highest vs lowest quintile of intake, the results for nitrite from meat and GCA were (RR: 0.71; 95% CI: 0.47–1.08; ptrend = 0.250), and for nitrite and GNCA were (RR Q5 (median 0.199 mg/1,000 kcal) vs Q1 (0.012): 0.93; 95% CI: 0.63–1.37; ptrend = 0.615). None of the quintile HR estimates were significantly different from one, nor were any tests for trend, or continuous analyses. Strengths of the study include the large size enabling the investigation of tumour subtypes. The study lacked information on nitrate and nitrite intake from other foods, and nitrate intake from drinking water.
Keszei et al. (2013) studied the relationship between risks of gastric cancer subtypes and intake of NDMA, formation of ENOC, haem iron, nitrite and nitrate in the NLCS. This prospective cohort study started in September 1986; at baseline 58,279 men and 62,573 women aged 55–69 years were recruited from 204 municipal population registries throughout The Netherlands. At baseline (1986) a self‐administered questionnaire was completed by study participants on dietary habits and other risk factors of cancer. The dietary part consisted of a validated 150‐item FFQ. The cohort was followed for 16.3 years, and 166 GCA and 497 GNCA cases were analysed along with 4032 subcohort members in a case–cohort analysis. To calculate intakes, food composition values for nitrate and nitrite were obtained from analyses conducted by Dutch institutes in the period 1984–1989. Information about nitrate content in drinking water from all pumping stations in The Netherlands in 1986 was used to determine the nitrate concentration in drinking water for each home address by postcode, and calculate nitrate intake from water (in fact water, coffee, tea and soup combined). Nitrite intake was assessed solely on the intake of processed meat, because the nitrite content of vegetables and cheese was considered negligible in comparison with processed meat. Considered processed meat items were: all types of sausages, bacon, ham, cold cuts, croquettes and frankfurters. NDMA values in food items were initially extracted from published measurements in Dutch foods in the 1970s and 1980s. Food items for which NDMA values were not available from Dutch sources, but non‐zero content was indicated in a comprehensive food composition database of nitrosamines (Jakszyn et al., 2004a), measurements made in food sources from Western or Northern Europe in the 1980s were used. An index of ENOC formation was calculated, as previously determined by Jakszyn et al. (2006), based on the haem iron intake. The correlation between ENOC and haem iron was 0.97.
In the sex‐specific statistical analyses, Cox PH modelling was used, controlling for age, smoking, BMI, educational level, energy intake, vegetable and fruit intake, and total alcohol intake; in NDMA analyses, adjustment was made for alcoholic beverages excluding beer, because beer was an important source of NDMA. The estimated mean (SD) values of intake in the subcohort (a random sample of the NLCS) were for men and women, respectively: nitrate, 108 (SD 45) and 106 (44) mg/day; nitrite, 0.12 (0.16) and 0.08 (0.12) mg/day; NDMA (median), 0.084 and 0.044 μg/day; ENOC, 102 (25) and 93 (23) μg/day. When comparing men in the highest vs lowest tertile of intake, the results for nitrite and GCA were (HR T3 (median 0.28 mg/day) vs T1 (0.03): 1.18; 95% CI: 0.75–1.86; ptrend = 0.34), and for nitrite and GNCA were (HR: 1.23; 95% CI: 0.89–1.70; ptrend = 0.20). None of the tertile HR estimates were significantly different from one, nor were any tests for trend, or continuous analyses. In nitrite analyses in women, none of the tertile HR estimates were significantly different from one, nor were any tests for trend, or continuous analyses. For nitrate, in both men and women, none of the tertile HR estimates were significantly different from one, nor were any tests for trend, or continuous analyses. For NDMA intake, when comparing men in the highest vs lowest tertile of intake, the results for NDMA and GCA were (HR T3 (median 0.25 μg/day) vs T1 (0.04): 0.94; 95% CI: 0.59–1.49; ptrend = 0.75), and for NDMA and GNCA were (HR: 1.31; 95% CI: 0.95–1.81; ptrend = 0.09). For GNCA, HR estimates were significant in continuous analyses (HR: 1.06; 95% CI: 1.01–1.10, per 0.1 μg/day NDMA increment). In women, when comparing the highest vs lowest tertile of NDMA intake, the results for GCA were (HR T3 (0.07 μg/day) vs T1 (0.03): 1.02; 95% CI: 0.33–3.14; ptrend = 0.96), and for NDMA and GNCA these were (HR: 0.90; 95% CI: 0.58–1.42; ptrend = 0.49). For gastric cancer subsites, no significant associations were seen with haem iron or ENOC in men or women in multivariate analyses. These results suggest that NOCs may influence the risk of GNCA in men, but there are no clear associations for GCA. Strengths of the study include the large size and long follow‐up enabling the investigation of tumour subtypes. Nitrite intake was assessed solely on the intake of processed meat, but nitrite content of vegetables and cheese was considered negligible in comparison to processed meat.
Case–control studies
Ward et al. (2008) conducted a population‐based case–control study of adenocarcinoma of the distal stomach in Nebraska, USA. Cases were white men and women aged 21 years or older, newly diagnosed between 1988 and 1993, identified from the Nebraska Cancer Registry and confirmed by histological review. Controls were selected from a previous population‐based case–control study of lymphatic and haematopoietic cancers in Nebraska, and were re‐interviewed at the time of this study (1992–1994). Response rates were between 79% and 88%. Telephone interviews were conducted with subjects or their proxies for those who were deceased or too ill to participate. Proxy interviews were conducted for 80%, and 61% of stomach cancer cases and controls, respectively. Nitrate concentrations in public drinking water supplies were linked to residential water source histories. Among those using private wells at the time of the interview, they measured nitrate levels in water samples from wells. Dietary nitrate and nitrite were estimated from a FFQ (SHHQ). They estimated OR and 95% CI using unconditional logistic regression, adjusted for gender, year of birth and risk factors for oesophagus cancer (smoking, alcohol, BMI). Among those who primarily used public water supplies (79 distal stomach cancer cases, 321 controls), average nitrate levels were not associated with risk (highest vs lowest quartile, stomach OR: 1.2; 95% CI: 0.5–2.7; ptrend = 0.946). They observed the highest ORs for distal stomach cancer among those with higher water nitrate ingestion and higher intake of processed meat compared with low intakes of both; however, the test for positive interaction was not significant (p = 0.213). Increased intake of nitrate plus nitrite from animal sources (details not available) was associated with elevated ORs for stomach cancer, but not significantly (OR Q4 (> 8.3 mg) vs Q1 (< 3.8): 1.6; 95% CI: 0.7–3.7; ptrend = 0.352), and not with nitrite from plant sources (median intake 0.52 mg/day). Increased intake of nitrate from plant sources (median intake NO3: 116.1 mg/day) was not associated with stomach cancer (OR Q4 (> 171.9 mg) vs Q1 (< 74.9): 1.6; 95% CI: 0.7–3.6; ptrend = 0.266). The number of cases is small in this study. Although there was a relatively high response rate, percentage of proxy interviews is high, which could have led to information bias.
Hernández‐Ramírez et al. (2009) conducted a case–control study in Mexico on gastric cancer in relation to the individual and combined consumption of polyphenols and NOC precursors (nitrate and nitrite). A population‐based case–control study was carried out in Mexico City from 2004 to 2005 including 257 histologically confirmed gastric cancer cases and 478 controls, who were at least 20 years old. Cases were recruited in nine of the main tertiary care hospitals in Mexico City, where 60% of the gastric cancer cases are diagnosed; the response rate was 97.7%. For each case, up to two healthy controls without a history of cancer, who resided in the same geographic area as the cases, were selected and matched to the cases by age (± 5 years) and gender; response rate was 94.3%. Intake of polyphenols, nitrate and nitrite were estimated using a 127‐item FFQ. The nitrate and nitrite contents of foods in this study were obtained from several non‐Mexican sources (Europe, Korea). OR and 95% CI were estimated using unconditional logistic regression analysis, adjusting for age, gender, energy, schooling, H. pylori CagA (cytotoxin‐associated gene A) status, chilli consumption, salt consumption, alcohol intake, and in additional models vitamin C, vitamin E, fruits and vegetables, and polyphenols. Total nitrate was significantly inversely associated with gastric cancer risk (OR T3 (> 141.7 mg/day) vs T1 (< 90.4): 0.61; 95% CI: 0.39–0.96; ptrend = 0.035). Total nitrite was associated with gastric cancer risk (OR T3 (> 1.2 mg/day) vs T1 (< 1.0): 1.52; 95% CI: 0.99–2.34; ptrend = 0.052), however not statistically significant. However, both nitrate from animal (not specified) sources (OR T3 (> 3.9 mg/day) vs T1 (< 1.7): 1.92; 95% CI: 1.23–3.20; ptrend = 0.004) and nitrite from animal (details not available) sources (OR T3 (> 0.4 mg/day) vs T1 (< 0.2): 1.56; 95% CI: 1.02–2.4; ptrend = 0.030) were positively associated with gastric cancer risk. OR around twofold were observed among individuals with both low intake of cinnamic acids, secoisolariciresinol or coumestrol and high intake of animal‐derived nitrate or nitrite, compared with high intake of the polyphenols and low animal nitrate or nitrite intake, respectively. Results were similar for both the intestinal and diffuse types of gastric cancer. The response rates among cases and controls are high, but the study lacked information on nitrate and nitrite in Mexican foods, and lacked information on nitrate from water, and did not present information on which animal foods the nitrate and nitrite estimates are based on.
De Stefani (1998) conducted a case–control study in Uruguay to assess the role of dietary nitrosamines, heterocyclic amines and gastric cancer. In the period 1993–1996, 340 cases and 698 controls (age 25–85 years) were enrolled. The response rate of cases and controls were 94.2% and 91.5%, respectively. A short FFQ was used for exposure assessment (29 items). Dietary NDMA intake (highest (≥ 0.27 units NA, presumably μg per day) vs lowest quartiles (< 0.14)) was significantly associated with an increased risk of gastric cancer (OR: 3.62; 95% CI: 2.38–5.51), after controlling for age, sex, residence, urban/rural status, tobacco duration, total alcohol consumption and maté drinking. When all nutrients were entered as continuous variables and adjusted simultaneously for each other, NDMA intake remained statistically significantly associated (OR: 1.58; 95% CI: 1.25–2.0). Nitrite intake was not associated with gastric risk in this study. Although there was a high response rate, the use of a very short FFQ might have led to information bias. The study lacked information on nitrate intake from drinking water. The study also does not specify the units for NDMA intake.
Navarro‐Silveira et al. (2011) conducted a population case–control study on 1839 individuals aged 30–79 years in three geographic areas of the USA (Connecticut, New Jersey, Washington State) to study dietary and lifestyle factors in relation to risk of oesophageal and gastric cancer. The response rate for EAC and GCA cases was 80.6% and 74.1% for ESCC and non‐cardia gastric adenocarcinoma (OGA) and 70.2% for controls. In the dietary analysis, 687 controls and 282 cases of EAC, 206 cases of ESCC and 352 cases of non‐cardia gastric adenocarcinoma were included. Proxy interviews were conducted for 31% of EAC, 26% for GCA, 35% for ESCC, 30% for OGA and 3.4% for controls. PCA was conducted to identify dietary patterns (e.g. meat/nitrite, fruit/vegetable) associated with the risk of oesophageal and gastric cancer. In the PCA procedure, 19 food groups, BMI, GERD symptoms, smoking, consumption of beer, wine and liquor, intake of fibre, vitamin C (mg/day) and nitrite (mg/day) were included. Principal component scores were generated. Scores were then categorised into quartiles and used in multivariate unconditional logistic regression analysis to calculate odds ratio and 95% CI. All models were adjusted simultaneously for all principal component and age, gender, education, income, race, residence and energy intake. The first patterns loaded heavily on nitrite, high nitrite meats and red meats and was termed meat/nitrite patterns. Statistically significant positive associations were found for the highest vs lowest quartile of meat/nitrite principal component for both gastric cancer (OGA) (OR: 2.40; 95% CI: 1.25–4.62; ptrend = 0.001) and EAC (OR: 5.61; 95% CI: 2.81–11.20; ptrend < 0.001). The main limitation of the study was the use of a dietary pattern (meat/nitrite) and not nitrite levels alone (mg/day) to study the relation between nitrite and gastric cancer. Another limitation of the study was the high number of proxy interviews, which may lead to information bias. The study lacked information on nitrate intake from drinking water.
Ecological studies
No studies.
Summary
In a previous review, which considered publications until 2006 (IARC, 2010), 11 case–control and two cohort studies on ingested nitrite and stomach cancer risk were described. As summarised in the IARC monograph (IARC, 2010), the evaluation of the evidence for an association between dietary nitrite and gastric cancer ‘was based on seven well designed case–control studies and two cohort studies’. Six of the seven case–control studies showed a positive association, but this was significant in only four.
Since then, four new cohort studies and two case–control studies have been published, often on gastric cancer subtypes. The cohort and case–control studies generally used multivariable analyses to adjust for confounders. Three cohort studies looked into histological subtypes. For GCA and GNCA, no significant associations were found with total nitrite intake (Keszei et al., 2013; total 663 cases), nor with nitrite intake from meat (Cross et al., 2011; total 955 cases). NDMA intake was significantly positively associated with overall gastric cancer risk in a Swedish cohort study among women (156 cases), with no effect modification by vitamin C or E (Larsson et al., 2006). The Panel noted that the authors did not provide estimates of the relationship between nitrite intake levels alone (mg/day) and gastric cancer. In the EPIC cohort study, no association was found between NDMA and overall gastric cancer risk (314 cases) in men and women, or for GCA or GNCA (Jakszyn et al., 2006). However, these authors found a significant positive association between ENOC and GNCA (and not in GCA), which was limited to H. pylori‐infected subjects, and there was an interaction with vitamin C status. Keszei et al. (2013) found a statistically significant positive association with NDMA intake for GNCA, in men (but not in women) in a Dutch cohort study, but not for GCA. No significant association was found with ENOC. In a cohort study directed at total cancer, subgroup results for gastric cancer indicated a non‐significant inverse association with dietary nitrite and a non‐significant positive association with NDMA intake, but this was only based on 64 cases (Loh et al., 2011).
De Stefani (1998), found no association between gastric cancer and nitrite intake and a significant positive association with NDMA intake. Although one case–control study in the USA found no association between distal stomach cancer and nitrite (Ward et al., 2008), a Mexican case–control study reported significant positive associations with nitrite from animal foods (Hernández‐Ramírez et al., 2009); these foods were not specified therefore it is difficult to interpret this association. In the study of Navarro‐Silveira et al. (2011), a dietary profile characterised by high consumption of meat and nitrite was associated with an increased risk for gastric cancer.
Overall, the Panel concluded that:
there was some evidence for association between dietary nitrites and stomach cancer (no significant association from cohort studies and significant association from case–control studies).
there was insufficient evidence that preformed N‐nitrosodimethylamine is associated with increased risk of gastric non‐cardia adenocarcinoma.
3.6.8.4. Colorectal cancer
Cohort studies
Knekt et al. (1999) investigated the risk of colorectal (CRC) and other GI cancers following exposure to nitrites, nitrates and NDMA, using a cohort of 9985 healthy adult Finnish men and women (age not given) in the Finnish Mobile Clinic survey. Intakes of nitrate, nitrite and NDMA were estimated using food consumption data from a 1‐year dietary history interview, which covered the total diet of the volunteers. Mean daily intake was 77 mg for nitrates (SD not presented), 5.3 mg for nitrites, and 0.052 μg for NDMA from the diet and 0.071 μg from beer. During the 24‐year follow‐up period, 189 GI cancer cases were diagnosed in the cohort, of which 73 were CRC. After adjustment for sex, age, municipality, smoking and energy intake in Cox PH models, a significant positive association was observed between intake of NDMA and subsequent occurrence of colorectal cancer: RR between the highest and lowest quartiles of intake (RR: 2.12; 95% CI: 1.04–4.33; ptrend = 0.47). Of the various sources of NOCs, intake of smoked and salted fish was significantly (RR: 2.58; 95% CI: 1.21–5.51) and intake of cured meat was non‐significantly associated (RR: 1.84; 95% CI: 0.98–3.47) with risk of CRC. No similar association was observed for intake of other fish or other meat. No significant associations were observed between CRC and nitrate intake (RR Q4 vs Q1 (cut‐offs or medians not presented): 1.04; 95% CI: 0.54–2.02; ptrend = 0.64) or nitrite intake (RR Q4 vs Q1: 0.74; 95% CI: 0.34–1.63; ptrend = 0.45). The authors noted that NDMA represents only a small proportion of NOCs detected in foods and derived from other environmental factors and endogenous synthesis. The study lacked information on nitrate intake from drinking water.
Cross et al. (2010) conducted a large prospective study on CRC risk and meat consumption, investigating several underlying mechanisms. The NIH–AARP Diet and Health Study recruited men and women, aged 50–71 years, from six states in the USA. At baseline (1995–1996), participants completed self‐administered demographic and lifestyle questionnaires, including a 124‐item FFQ. Approximately 6 months later, cancer‐free participants were mailed a risk factor questionnaire, which elicited detailed information on meat intake and cooking preferences. A total of 566,402 participants returned the baseline questionnaire and 337,074 of these also returned the risk factor questionnaire. After excluding prevalent cancer cases, and those with implausible nutrient values, the baseline analytical cohort consisted of 494,979 participants (295,305 men and 199,674 women), and the risk factor questionnaire cohort consisted of 303,156 participants (175,369 men and 125,579 women). The meat and CRC study was limited to the latter group. With the FFQ, meat type (white/red/processed), meat cooking methods and doneness levels were monitored and recorded. Nitrate and nitrite intake from processed meats was estimated based on a database of previously measured content, representing 90% of available processed meats in the USA (bacon, red meat sausage, poultry sausage, red and white luncheon meats, red and white cold cuts, ham, hot dogs). A follow‐up period of 7.2 years identified 2,719 incident cases of CRC. In Cox PH models, adjustment was made for gender, education, BMI, smoking, and intake of total energy, fibre and dietary calcium. Risk of CRC was positively related to intake of red meat (HR: Q5 vs Q1: 1.24; 95% CI: 1.09–1.42; ptrend < 0.001) and processed meat (1.16; 95% CI: 1.01–1.32; ptrend = 0.017), but inversely related to white meat (HR: Q5 vs Q1: 0.85; 95% CI: 0.76–0.97; ptrend = 0.017). Furthermore, nitrate intake from processed meats had a significant positive association with CRC (HR: Q5 (median 289.2 μg/1,000 kcal) vs Q1 (23.9): 1.16; 95% CI: 1.02–1.32; ptrend = 0.001), whereas nitrite from processed meats did not (HR: Q5 (median 194.1 μg/1,000 kcal) vs Q1 (11.9): 1.11; 95% CI: 0.97–1.25; ptrend = 0.055). Assessment of combined intake of nitrate and nitrite from processed meat was associated with a higher risk for CRC (1.14; 95% CI: 1–1.3, p = 0.019), but data were not shown. Total dietary nitrate intake revealed an inverse association in the highest quintile (data not shown) of dietary nitrate (HR: 0.82; 95% CI: 0.71–0.95; ptrend = 0.111) but no association for total nitrite (HR: 1.05; 95% CI: 0.92–1.21; ptrend = 0.316) and CRC.
Ferrucci et al. (2012) investigated the relationship between meat consumption and the risk of incident distal colon and rectal adenoma in the USA. Among male and female participants in the screening arm of the Prostate, Lung, Colorectal, and Ovarian Cancer Screening Trial who underwent baseline and follow‐up sigmoidoscopy (n = 17,072), they identified 1,008 individuals with incident distal colorectal adenoma. All participants completed a self‐administered baseline questionnaire on demographics, personal and family cancer history, medical history and lifestyle habits. Participants in the screening arm also completed a 137‐item FFQ on usual intake of foods and beverages during the past year. Nitrate and nitrite intake from processed meats was calculated using a database of laboratory‐measured values of these compounds in 10 types of processed meats representing 90% of processed meats assessed by a typical FFQ in the USA (bacon, red meat sausage, poultry sausage, red and white luncheon meats, red and white cold cuts, ham, hot dogs). They calculated ORs and 95% CIs for associations between meat and meat‐related components and incident distal colorectal adenoma using multivariate logistic regression, controlling for age at baseline, study centre, gender, ethnicity, education, family history of CRC, BMI, use of non‐steroidal anti‐inflammatory drugs, physical activity, smoking status, and intakes of alcohol, dietary calcium, supplemental calcium, dietary fibre and total energy. They observed suggestive positive associations for red meat, processed meat, haem iron and nitrate/nitrite with distal colorectal adenoma. Comparing the highest intake of nitrate plus nitrite from processed meat compared with the lowest, they observed a non‐significant positive association (OR Q4 (median 0.84 mg/1,000 kcal) vs Q1 (0.06): 1.22; 95% CI: 0.94–1.53; ptrend = 0.14). This is one of the few studies on colorectal adenoma, but total dietary intake of nitrate and nitrite was not evaluated, and the study lacked information on nitrate from water.
DellaValle et al. (2014) investigated the association between dietary nitrate and nitrite intake and risk of CRC in the Shanghai Women's Health Study, a cohort of 73,118 women aged 40–70 years, residing in Shanghai. Nitrate, nitrite and other dietary intakes were estimated from a 77‐item FFQ administered at baseline. Over a mean of 11 years of follow‐up, they identified 619 CRC cases (383 colon and 236 rectum). HR and 95% CI were estimated using Cox PH regression, adjusting for age, total energy intake, education, physical activity, dietary vitamin C intake, carotene and folate. The median daily intakes of dietary nitrate and nitrite were 300.7 mg (interquartile range (IQR): 214.5–412.5 mg) and 1.4 mg (IQR: 1.1–1.8 mg), respectively. The majority of dietary nitrate intake (median 298.6 mg/day) and nitrite intake (median 1.2 mg/day) was from plant sources. Total nitrate intake was not associated with CRC risk (Q5 (median 313.2 mg/day) vs Q1 (98.7), HR: 1.08; 95% CI: 0.73–1.59; p trend = 0.39). Also, total nitrite intake was not associated with CRC risk (Q5 (median 1.23 mg/day) vs Q1 (0.56), HR: 1.05; 95% CI: 0.77–1.42; p trend = 0.78). However, among women with a vitamin C intake below the median (83.9 mg/day) and hence higher potential exposure to NOCs, risk of CRC increased with increasing quintiles of nitrate intake (Q5 vs Q1, HR: 2.45; 95% CI: 1.15–5.18; ptrend = 0.02). There was no association with nitrate among women with a higher vitamin C intake (Q5 vs Q1, HR: 0.93; 95% CI: 0.44–1.96; p trend = 0.69). The study found no association between nitrite intake and risk of CRC overall or by intake level of vitamin C. The findings suggest that high dietary nitrate intake among subgroups expected to have higher exposure to endogenously formed NOCs increases risk of CRC. This Chinese population seems to be exposed to much higher nitrate intake levels than in Europe or North America. Nitrate intake from drinking water sources was not considered in their assessment of exposure because they determined that exposures from tap water in Shanghai were low.
Case–control studies
Ward et al. (2007a) studied the associations of processed meat intake and associated compounds and risk of colorectal adenoma. They conducted a case–control study of 146 cases of colorectal adenoma, diagnosed at sigmoidoscopy or colonoscopy, and 228 polyp‐free controls in Maryland. Response rates were 84% for cases and 74% for controls. Using unconditional logistic regression (adjusting for age, gender, pack‐years of smoking and total calorie intake), they calculated ORs and found a positive association with processed meat (bacon, breakfast sausage, hot dogs/other sausage, ham steaks/pork chops, ham, bologna, salami and other luncheon meats and liverwurst) intake (OR Q4 vs Q1: 2.0; 95% CI: 1.0–4.0; no p trend). They estimated nitrate and nitrite intake from meat using published data from the literature as well as from actual measurements of meats analysed recently. No significant associations were found for nitrite from meats (OR Q4 (> 0.16 mg/day) vs Q1 (< 0.02): 1.7; 95% CI: 0.9–3.2; no p trend), but for nitrite plus nitrate from meats it reached significance (OR Q4 (> 0.48 mg/day) vs Q1 (< 0.09): 2.0; 95% CI: 1.0–3.9; no p trend). Additional adjustment for the heterocyclic amine (HCA) 2‐amino‐3,8‐dimethylimidazo[4,5‐f]quinoxaline (MeIQx) attenuated the association (OR: 1.6; 95% CI: 0.8–3.2), but other HCA and polycyclic aromatic hydrocarbons (PAH) had minimal effect. Higher CYP2A6 activity was not associated with risk and there was no evidence of an interaction of CYP2A6 activity with nitrate and nitrite intake. According to the authors, the results suggest that nitrite and nitrate intake from processed meat intake increases the risk of colorectal adenoma after accounting for HCA and PAH. Response rates for cases and controls were relatively high, reducing the likelihood of selection bias. However, retrospective information was used for dietary intake. The study lacked information on total nitrate and nitrite intake from food, and the consumption volume of water was also not known in this study.
Miller et al. (2013) studied associations between meat‐related compounds and CRC risk by subsite in a population‐based case–control study in Pennsylvania. All new cases, identified within 15 months of diagnosis, with histologically confirmed colon or rectal cancers were identified between June 2007 and May 2011 from the Pennsylvania State Cancer Registry. Controls residing in the same 19 county regions were identified by random digit dialling. Of those contacted, 57% of eligible cases and 51% of eligible controls participated in the study. Participants (989 cases/1033 healthy controls) completed a 137‐item FFQ with a meat‐specific module. Within this module, the processed red meat category included bacon, sausage, cold cuts (ham, bologna, salami, pepperoni, beef luncheon meat, dried or chipped beef), beef jerky, corned beef, hot dogs, ham, and processed meat added to mixed dishes such as pizza. Multivariable logistic regression was used to examine associations between meat variables and colorectal cancer, adjusting for age, sex, total energy intake, BMI, fruit and vegetable intake, and past regular non‐steroidal anti‐inflammatory drug use. Among other compounds (meat mutagens), significant positive associations were observed for intake of nitrites plus nitrates and proximal colon cancer (OR Q5 (> 496.6 μg/1,000 kcal) vs Q1 (< 114.6): 1.57; 95% CI: 1.06–2.34; p trend = 0.023). For CRC, this was not significant (OR Q5 vs Q1: 1.19; 95% CI: 0.87–1.61; p trend = 0.189), nor for total colon, rectal and distal rectal cancer. The response rates among case and controls were low, total dietary intake of nitrate and nitrite was not evaluated, the study lacked information on nitrate from water, and no separate data on nitrate and nitrite are presented. Retrospective information was used for dietary intake, increasing the likelihood of recall bias.
Zhu et al. (2014) examined the association between NOC intake and CRC risk and possible effect modification by vitamins C and E and protein in case–control study carried out in Newfoundland and Labrador and Ontario, Canada. Cases (identified from familial CRC registries in Newfoundland and Ontario) were diagnosed from 1999 to 2003 and were aged 20–74 years. Controls consisted of a random sample of each provincial population aged between 20 and 74 years and were selected using random digit dialling. Controls were frequency matched with cases on sex and 5‐year age strata. The overall response rates for the study were 65.0% for cases and 53.5% for controls. A total of 1,760 cases with pathologically confirmed adenocarcinoma and 2481 population controls were asked to complete a 170‐item self‐administered FFQ to evaluate their dietary intakes 1 year before diagnosis (for cases) or interview (for controls). Median daily intake (among controls) was 124.8 mg nitrate, 1.12 mg nitrite, and 0.20 μg NDMA. Adjusted OR and 95% CI were calculated across the quintiles of nitrate, nitrite and NDMA intake and relevant food items using unconditional logistic regression. Multivariate adjustment was made for age, sex, total energy intake, BMI, cigarette smoking, alcohol consumption, physical activity, education attainment, household income, reported colon screening procedure, non‐steroidal anti‐inflammatory drug use, multivitamin supplement use, folate supplement use and province of residence. NDMA intake was found to be associated with a higher risk of CRC (OR Q5 (median 2.29 μg/day) vs Q1 (0.03): 1.42; 95% CI: 1.03–1.96; p trend = 0.005), specifically for rectal carcinoma (OR Q5 vs Q1: 1.61; 95% CI: 1.11–2.35; p trend = 0·01). Nitrate intake was not associated with CRC (OR Q5 (median 264.14 mg/day) vs Q1 (56.94): 0.89; 95% CI: 0.68–1.16; p trend = 0.43), nor was nitrite (OR Q5 (median 1.92 mg/day) vs Q1 (0.65): 1.09; 95% CI: 0.77–1.54; p trend = 0.66), or with subsites. There was evidence of effect modification between dietary vitamin E and NDMA. Individuals with high NDMA and low vitamin E intakes had a significantly higher risk than those with both low NDMA and low vitamin E intakes (OR: 3.01; 95% CI: 1.43–6.51; p for interaction = 0.017). There was no interaction with vitamin C. The results support the hypothesis that NOC intake may be positively associated with CRC risk in humans. Vitamin E, which inhibits nitrosation, might modify the effect of NDMA on CRC risk. The response rates among controls were low, the study lacked information on nitrate from water. Retrospective information was used for dietary intake, increasing the likelihood of recall bias.
Summary
In a previous review of IARC, one cohort study (Knekt et al., 1999) and one case–control study (De Roos et al., 2003) on nitrite and colorectal cancer were described. A positive association was found with colon and rectal cancer in the case–control study, but no association was seen in the cohort study.
Since then, four new cohort studies and three case–control studies have been published on CRC or adenoma. The cohort and case–control studies generally used multivariable analyses to adjust for confounders. One US cohort study (Cross et al., 2010) found that total dietary nitrite intake was not associated with colorectal cancer risk. Nitrite from processed meats was not associated with CRC risk. Nitrate plus nitrite from processed meat was associated with a dose–response with colon cancer. Dietary nitrite was not associated with colon or rectal cancer in a UK cohort study (Loh et al., 2011). In a cohort study among women from China, total nitrite intake (mainly from pant source) was not associated with CRC risk. A non‐statistically significant positive association was found for nitrate plus nitrite from processed meat (DellaValle et al., 2014). In a US cohort study on risk of colorectal adenoma, a non‐statistically significant positive association was found with nitrate plus nitrite from processed meat (Ferrucci et al., 2012). For total dietary nitrite, no association with CRC risk was seen in a case–control study (Zhu et al., 2014). One case–control study reported a significant positive association between proximal colon cancer and nitrate plus nitrite from meats, but not for other subsites (Miller et al., 2013). One case–control study reported a significant positive association between colorectal adenoma and nitrate plus nitrite from meats, but not for nitrite from meats (Ward, 2007).
Regarding intake of preformed NDMA, one cohort study reported a significant positive association with CRC risk (Knekt et al., 1999). This was also seen in a more recent cohort study for rectum cancer but not for colon cancer (Loh et al., 2011). Statistically significant positive associations were also observed in a case–control study on CRC and colon and rectum subsites (Zhu et al., 2014).
Overall, the Panel concluded that there was insufficient evidence to link dietary nitrite and colon cancer, there was some evidence to link nitrate plus nitrite from processed meat and colon cancer and there was evidence that the estimated intake of preformed N‐nitrosodimethylamine is associated with increased risk of colorectal cancer (CRC) or its subtypes.
3.6.8.5. Liver cancer
Cohort studies
Freedman et al. (2010) investigated the relationship between meat and associated exposures with hepatocellular carcinoma (HCC) incidence (n = 338) in 495,006 participants in the NIH–AARP Diet and Health Study (295,332 men and 199,674 women). At baseline (1995–1996), participants completed self‐administered demographic and lifestyle questionnaires, including a 124‐item FFQ. Approximately 6 months later, cancer‐free participants were mailed a risk factor questionnaire, which elicited detailed information on meat intake and cooking preferences. A total of 566,402 participants returned the baseline questionnaire and 337,074 of these also returned the risk factor questionnaire. Follow‐up ended on 31 December 2003. The authors estimated nitrate and nitrite intake from processed meats using a database of measured values from 10 types of processed meats, which represent 90% of processed meats consumed in the USA (bacon, red meat sausage, poultry sausage, red and white luncheon meats, red and white cold cuts, ham, hot dogs). HRs and 95% CIs for the fifth (Q5) vs the first (Q1) quintile were estimated from multivariable adjusted Cox PH regression models, adjusting for age, sex, total energy, BMI, education, ethnicity, alcohol, cigarette smoking, diabetes, physical activity, and fruit and vegetable intake. The study reported inverse associations between white meat and risk of HCC (Q5 vs Q1, HR: 0.52; 95% CI: 0.36–0.77; p trend < 0.001). Red meat was associated with higher risk of HCC (Q5 vs Q1, HR: 1.74; 95% CI: 1.16–2.61; p trend = 0.024). Nitrate intake from meat was not associated with risk of HCC (Q5 (> 0.22 mg/kcal) vs Q1 (< 0.05), HR: 1.11; 95% CI: 0.67–1.84; p trend = 0.81), nor was nitrite from meat (Q5 (> 0.14 mg/1,000 kcal) vs Q1 (< 0.02), HR: 0.93; 95% CI: 0.55–1.71; p trend = 0.15). Strengths of the study include the large size enabling the investigation of liver cancer as one of the very few cohorts. The study lacked information on nitrate and nitrite intake from other foods, and nitrate intake from drinking water.
Summary
In the IARC report, no case–control or cohort evaluated the association between dietary nitrite and liver cancer. After 2006, one cohort study has investigated the association between intake of nitrate and nitrite from processed meats and risk of hepatocellular carcinoma (Freedman et al., 2010). No significant associations were seen for both nitrate and nitrite in this large study with 338 HCC cases. The study lacked information on nitrate and nitrite intake from other foods, and nitrate intake from drinking water; thus, no definitive conclusions can be drawn because of lack of data.
Overall, the Panel concluded that there was no evidence for an association of liver cancer with nitrate or nitrite from case–control and cohort studies.
3.6.8.6. Pancreatic cancer
Cohort studies
Aschebrook‐Kilfoy et al. (2011) investigated dietary exposure to nitrate and nitrite in relation to risk of pancreatic cancer in a prospective cohort study (NIH–AARP Diet and Health Study). Participants with no previous diagnosis of cancer (303,156), aged 50–71 years, completed a 124‐item FFQ. In addition to the main questionnaire, after 6 months, a risk factor questionnaire, that elicited information on intake of meat, meat products and food rich in vitamin C, was mailed to participants. Intake of processed meat during adolescence (at ages 12–13 years) was also queried. Portion sizes were estimated from national dietary data from the 1965–1966 Household Food Consumption Survey that was performed closest to the calendar time when cohort members were aged 12–13 years. After a follow‐up of 10 years, 1,728 incidence cases were identified via linkage to state cancer registries. The mean dietary nitrate intake in the cohort was 88 mg/day (SD = 65), and the mean nitrite intake was 1.2 mg/day (SD = 0.6). After controlling for age, race, total energy intake, smoking, family history of cancer, family history of diabetes, BMI, saturated fat, folate and vitamin C, no association was found for total intake of nitrate (Q5 (median 94.8 mg/1,000 kcal) vs Q1 (19.3), HR: 1.01; 95% CI: 0.85–1.20; p trend = 0.58) and nitrite (Q5 (median 0.90 mg/1,000 kcal) vs Q1 (0.45), HR: 0.92; 95% CI: 0.78–1.08; p trend = 0.31) and pancreatic cancer in both men and women. However, among men, an increased risk was observed for nitrate plus nitrite intake from processed meat sources (Q5 (median 1.43 mg/1,000 kcal) vs Q1 (0.11), HR: 1.18; 95% CI: 0.95–1.47; p trend = 0.11), although it did not reach statistical significance. Because vitamins C and E and red meat intake affect the ENOCs formation, a stratified analysis by vitamin C intake was conducted in men in the highest quintile of nitrate and nitrite from processed meat who also had a low vitamin C intake. They had a higher risk of pancreatic cancer than those with a higher vitamin C intake, although these associations were not statistically significant (HR: 1.29; 95% CI: 0.92, 1.80) and (HR: 1.12; 95% CI: 0.83–1.51), respectively. When the analysis was conducted separately for dietary sources, no increased risk was observed for plant (Q5 (median 0.68 mg/1,000 kcal) vs Q1 (0.25), HR: 0.91; 95% CI: 0.76–1.09; p trend = 0.32) and animal sources (Q5 (median 0.36 mg/1,000 kcal) vs Q1 (0.10), HR: 0.96; 95% CI: 0.82–1.13; p trend = 0.41). In a sensitivity analyses, participants who resided in areas with high nitrate levels in the drinking water (≥ 10 mg/L) were excluded from the analysis (2.4% of the study population) and the results did not change. Regarding nitrate plus nitrite intake during adolescence an increased risk was found for Q2 (median = 0.65 mg/1,000 kcal) (HR: 1.39; 95% CI: 1.10–1.76), Q3 (HR: 1.25; 95% CI: 0.97–1.60), Q4 (HR: 1.46; 95% CI: 1.13–1.87) and Q5 (median = 3.33 mg/1,000 kcal; HR: 1.32; 95% CI: 0.99–1.76; p trend = 0.11) vs Q1 = 0.21 mg/1,000 kcal. The strength of the study is the good control for confounding factors and the subdivision of nitrates and nitrites by sources (animal and plants) and the limitations of the study are the high levels of missing information for meat exposure during adolescence leading to information bias (61%). Of the 1,728 pancreatic cases identified, only 658 men of 1,055 cases and 397 women of 625 cases completed a risk factor questionnaire. This could be another limitation of the study.
Nöthlings et al. (2005) conducted a multi‐ethnic cohort study in Hawaii and Los Angeles (215,000 participants aged 45–75 years) to investigate the association between intake of meat, other animal products, fat, and cholesterol and pancreatic cancer. After exclusions, 190,545 people participated in the study (extreme high diets and ethnic groups not belonging to the following: African American, Latino, Japanese American, Native Hawaiian, Caucasian). After 7 years of follow‐up, 482 incident pancreatic cancers occurred. Incident pancreatic cancer cases were identified by record linkages to the Hawaii Tumor Registry, the Cancer Surveillance Program for Los Angeles County and the California State Cancer Registry. A quantitative FFQ based on eight or nine categories, and amount, based on three portion sizes per food item were used in the study. Intakes of pork and of total red meat were both associated with a 50% increase in risk (Q5 vs Q1; both p trend < 0.01). However, the strongest association was found for processed meat (Q5 (18.1 g/1,000 kcal daily) vs Q1 (1.7), HR: 1.68; 95% CI: 1.35–2.07; p trend < 0.01) after adjusting for sex and time on study and adjusted for age at cohort entry, ethnicity, history of diabetes mellitus, family history of pancreatic cancer, smoking status and energy intake. An analysis based on estimated intake of NA from processed meat, showed an increased risk for pancreatic cancer for high NA intake (HR: 1.26; 95% CI: 1.01–1.56; p trend = 0.29). The strength of the study is the good control for confounding factors and the limitation of the study is the lack of information regarding median and high values for nitrosamines as well as values for nitrates and nitrites.
Summary
In a previous report (IARC, 2010), one case–control study conducted in Iowa that investigated the relation between nitrate and nitrite and pancreatic cancer was examined. A positive non‐statistically significant association between nitrite and pancreatic cancer was found for both men and women. However, when animal sources of nitrite were evaluated separately, a positive association with a trend in risk across quartiles was found (Coss et al., 2004). After the IARC review, two cohort studies were conducted. In a cohort study conducted in the USA, no association was observed for nitrite from animal sources. However, a non‐statistically significant positive association was found among men for nitrate plus nitrite intake from processed meat sources (Aschebrook‐Kilfoy et al., 2011). In the multiethnic cohort study conducted in Hawaii and Los Angeles a positive association was found for high nitrosamine intake from processed meat, however there was no consistent increase risk with increasing exposure (Nöthlings et al., 2005).
Overall, the Panel concluded that there was insufficient evidence to link dietary nitrite intake and/or nitrosamines and pancreatic cancer.
3.6.8.7. Lung cancer
Case–control studies
De Stefani et al. (2009) undertook a case–control study on meat and related mutagens and the risk of lung cancer. The case–control study was conducted among Uruguayan males over the period 1996–2004. The study included 846 cases (response rate 97.7%) and 846 controls, frequency matched on age and residence. Both series were drawn from the four major public hospitals in Montevideo, Uruguay. Controls were patients with non‐neoplastic diseases not related to tobacco smoking, alcohol consumption and without recent changes in their diets (response rate 97.3%). Both cases and controls were administered a structured questionnaire by two trained social workers, with a FFQ that queried the usual intake of 64 food items 1 year prior to diagnosis. Mutagen intake (among which, ‘nitrosamines’, not further specified) was assessed using a Spanish database. Unconditional logistic regression was used to estimate ORs and 95% CIs of lung cancer by quartiles of meat intake and mutagens, adjusting for age, residence, education, family history of lung cancer, BMI, detailed smoking index, age at start smoking, total energy intake, total vegetables and fruits, reduced glutathione, and non‐meat fatty foods. The highest vs the lowest quartile of intake of total meat (OR: 2.04; 95% CI: 1.42–2.92), red meat (OR: 2.33; 95% CI: 1.63–3.32), and processed (bacon, sausage, mortadella, salami, saucisson, hot dog, ham, salted meat) meat (OR: 1.79; 95% CI: 1.22–2.65) was associated with increased risk of lung cancer, whereas intake of total white meat, poultry and fish was not. Heterocyclic amines (IQ, MeIQx, 2‐amino‐1‐methyl‐6‐phenylimidazo [4,5‐b]pyridine (PhIP)), NAs and benzo[a]pyrene (B[a]P) from meat were directly associated with the risk of lung cancer (OR for NAs, > 12.2 vs < 5.4 ng/100 g meat: 1.89; 95% CI: 1.30–2.73; p trend = 0.0002). Moreover, red meat, but not NAs, displayed higher risks among former smokers compared with current smokers.
Summary
Before 2006, there were two case–control studies on nitrite or NDMA and lung cancer, in the USA and in Uruguay. Significant positive associations with nitrite were found for men, but not women (Goodman et al., 1992). A significantly positive association with NDMA intake was reported in 1996 (De Stefani et al., 1996). In a new case–control study conducted since then, the same authors found a statistically significant positive association with nitrosamines from meat (De Stefani et al., 2009). In a cohort study directed at total cancer, subgroup results for lung cancer (235 cases) indicated no significant associations with dietary nitrite or NDMA intake (Loh et al., 2011).
Overall, the Panel could conclude that there was insufficient evidence that nitrite intake and/or NDMA are associated with increased lung cancer risk, because this is only seen in case–control studies, not in cohort studies.
3.6.8.8. Breast cancer
Cohort studies
In a prospective cohort study (22 years), Inoue‐Choi et al. (2012) evaluated the interaction of dietary and water nitrate intake with total folate intake on breast cancer risk in the Iowa Women's Health Study. A self‐administered FFQ (127 items) and a health and lifestyle questionnaire were completed by 34,388 postmenopausal women (mean age 61.6 years, SD = 4.2 years). Nitrate intake from public water was assessed using a historical database on Iowa municipal water supplies. The study identified 2,875 incident breast cancers by record linkage with the State Health Cancer Registry of Iowa. The average dietary intakes of nitrate and nitrite were 123.5 and 1.2 mg/day, respectively. No increased risk was found for nitrate (Q5 ≥ 165.6 vs ≤ 65.2 mg/day, HR: 0.86; 95% CI: 0.74–1.01; p trend = 0.31) or nitrite intake (Q5 ≥ 1.5 vs ≤ 0.8 mg/day, HR: 1.05; 95% CI: 0.86–1.29; p trend = 0.28) and cancer risk. A protective effect was found for nitrate–folate ratio (Q5 ≥ 0.47 vs ≤ 0.17 mg/day, HR: 0.87; 95% CI: 0.74–1.03; p trend = 0.04) and cancer risk, after controlling for age, total energy intake, education, BMI, waist‐to‐hip ratio, smoking, physical activity, alcohol intake, family history of breast cancer, age of menopause, age at first live birth, oestrogen use, total folate intake (except for nitrate–folate ratio), vitamin C, vitamin E, flavonoids, intake of cruciferous and red meat. A statistical interaction was seen between water nitrate intake and total folate intake (p = 0.05). Among women with adequate or higher total folate intake (≥ 400 μg/day), breast cancer risk was statistically significantly increased in women using public water with the highest quintile of nitrate (Q5 (≥ 33.5 mg/L) vs Q1 (≤ 2.8 mg/day), HR: 1.40; 95% CI: 1.05–1.87; p trend = 0.04) and in those using private wells (HR: 1.38; 95% CI: 1.05–1.82) compared with those using public water with the lowest quintile of water nitrate intake; whereas, such an association was not observed among women with low total folate intake (< 400 μg/day). A major strength of this study is the large sample size and the number of confounding factors taken into account in the analysis. Limitations are the lack of data regarding individual water consumption and the fact that total folate was given by the summed of diet plus vitamins supplements (70% of people used dietary supplementation).
Inoue‐Choi et al. (2016) conducted a 12‐year cohort study with 193,742 postmenopausal women in the NIH–AARP Diet and Health Study and identified 9,305 incident breast cancers. A self‐administered FFQ (124 items) and a health and lifestyle questionnaire were completed by participants (mean age 62.0 years, SD = 5.3 years). Primary breast cancers were identified through linkage to the eight cancer registries. Nitrite intakes from all animal sources (Q5 ≥ 0.34 vs ≤ 0.09 mg/1,000 kcal, HR: 0.99; 95% CI: 0.92–1.05), nitrites from processed meats (Q5 ≥ 0.15 vs ≤ 0.01 mg/1,000 kcal, HR: 0.98; 95% CI: 0.91–1.06) and processed red meat (Q5 ≥ 0.13 vs ≤ 0.005 mg/1,000 kcal, HR: 0.99; 95% CI: 0.92–1.06) were not associated with overall risk of breast cancer. However, nitrite from processed meats (Q5 ≥ 0.15 vs ≤ 0.01 mg/1,000 kcal, HR: 1.16; 95% CI: 1.02–1.31; p trend = 0.01) and nitrite from processed red meat (Q5 ≥ 0.13 vs ≤ 0.005 mg/1,000 kcal, HR: 1.23; 95% CI: 1.09–1.39; p trend < 0.0001) were statistically positively associated with localised breast cancer after controlling for age, race, education, BMI, height, waist‐to‐hip ratio, smoking, physical activity, alcohol intake, family history of breast cancer, age of menarche, age of menopause, age at first live birth, hormone use, oral contraceptive use, total calorie intake, number of previous biopsy, fat and fibre intake. Total red meat intake was positively associated with regional/distant breast cancer (p trend = 0.03). Higher processed red meat intake was also associated with a 27% higher risk of localised breast cancer. Haem iron intake was positively associated with breast cancer risk overall and all cancer stages. A major strength of this study is the large sample size and the number of confounding factors taken into account in the analysis. Limitations are the lack of data on nitrate in drinking water.
Summary
In a previous report (IARC 2010), no study was reviewed in relation to breast cancer and intake of nitrite. Since then, two large cohort studies have been conducted (Inoue‐Choi et al., 2012, 2016). In the Iowa Women's Health Study that investigated the association between dietary nitrate and nitrate from drinking water and dietary nitrite intake and breast cancer, no association was found for both nitrate and nitrite intake (Inoue‐Choi et al., 2012). In the second study, nitrite intakes from all animal sources, processed meats and processed red meat were not associated with overall risk of breast cancer. However, nitrites from processed meats and nitrites from processed red meat were statistically positively associated with localised breast cancer. In a cohort study, in which the outcome was total cancer incidence, NDMA and nitrites were not associated with breast cancer (432 cases) (Loh et al., 2011).
Overall, the Panel concluded that there was insufficient evidence for an association between dietary nitrite and breast cancer.
3.6.8.9. Ovarian cancer
Cohort studies
Aschebrook‐Kilfoy et al. (2012b) conducted a large US cohort study (NIH–AARP Diet and Health Study) among 617,119 women aged 50–71 years to investigate dietary nitrate and nitrite and epithelial ovarian cancer. After exclusions, 151,316 participants were included in the study. A total of 709 epithelial ovarian cancer cases were identified through cancer registries during a 10‐year follow‐up. A baseline questionnaire and a FFQ that included 124 food items, was mailed to all participants. At baseline, the mean dietary intake of nitrate and nitrite was 91.9 mg/day (SD = 68.6 mg/day) and 1.1 mg/day (SD = 0.5 mg/day), respectively. Women in the highest intake quintile of dietary nitrate had an increased risk (Q5 (median 126.5 mg/1,000 kcal) vs Q1 (22.2), HR: 1.31; 95% CI: 1.01–1.68; p trend = 0.06) of epithelial ovarian cancer, after controlling for age, education, total energy intake, cigarette smoking status, race, family history of cancer, BMI, parity, menopausal status, age at menarche and vitamin C intake. Although total nitrite intake was not associated with risk (Q5 median 0.93 vs 0.47 mg/1,000 kcal, HR: 0.93; 95% CI: 1.50–1.18; p trend = 0.31), a positive association between high nitrite from animal sources and epithelial ovarian cancer risk was observed (Q5 median 0.33 vs 0.09 mg/1,000 kcal, HR: 1.34; 95% CI: 1.05–1.69; p trend = 0.02). By contrast, neither nitrite from plants (Q5 median 0.73 vs 0.27 mg/1,000 kcal, HR: 1.03; 95% CI: 0.81–1.32; ptrend = 0.93) nor processed meat sources (Q5 (median 0.14 mg/1,000 kcal) vs Q1 (0.01), HR: 0.97; 95% CI: 0.76–1.23; ptrend = 0.63) was associated with ovarian cancer risk. Residential nitrate estimates for drinking water were also taken into account in the analysis, but the results did not change. The strength of the study is its prospective design and control of many possible confounders. The limitation of the study is the lack of control for family history of ovarian cancer.
Inoue‐Choi et al. (2015) conducted a study to evaluate the association between nitrate and nitrite intake and postmenopausal ovarian cancer risk in the Iowa Women's Health Study among 28,555 postmenopausal women. After 14 years of follow‐up, 315 epithelial ovarian cancers were identified through the State Health Registry. However, only 190 cases were included in the water nitrate analysis (145 using public water supplies and 45 using private wells). Dietary intake at baseline was assessed using a FFQ (126 food items). Nitrate nitrogen (NO3‐N) and total trihalomethane levels for Iowa public water utilities were linked to residences and average levels were computed based on each woman's duration at the residence. Median NO3‐N level for women drinking from public water supplies was 1.08 mg/L (range: 0.01–25.34 mg/L). Mean (SD) dietary nitrate and nitrite intake was 123.3 (83.4) mg/day and 1.2 (0.5) mg/day, respectively. After adjusting for age, BMI, family history of ovarian cancer, number of live births, age at menarche, age at menopause, age at first live, oral contraceptive use, oestrogen use and history of unilateral oophorectomy and trihalomethane levels, an increased risk was found for ovarian cancer among women with high exposure to NO3‐N (≥ 2.98 vs ≤ 0.472 mg/L, HR: 2.03; 95% CI: 1.22–3.38; ptrend = 0.003) from public drinking water. The risk associated with high nitrate levels was lower among women with high vitamin C intake. Higher dietary nitrate intake was associated with lower ovarian cancer risk (Q5 ≥ 165.54 vs Q1 ≤ 65.43 mg/day, HR: 0.61; 95% CI: 0.40–0.95; ptrend = 0.02), whereas dietary nitrite intake was not associated with ovarian cancer risk (Q5 (≥ 1.537 mg/day) vs Q1 (≤ 0.80), HR: 1.03; 95% CI: 0.58–1.84; ptrend = 0.50). However, an increased, although not statistically significant, risk was found for high nitrite intake from processed meats (Q5 (≥ 0.2 mg/day) vs Q1 (0), HR: 1.65; 95% CI: 0.93–2.94; ptrend = 0.04). The strength of the study is its prospective design and control of many possible confounders. The limitation of the study is the small number of cancer cases included in the analysis (after exclusions) that could have led to selection bias.
Summary
In a previous report (IARC, 2010), no epidemiological study was considered in relation to ovarian cancer and nitrite intake. Later, two large US cohort studies were conducted to investigate dietary nitrate and nitrite and epithelial ovarian cancer. In the NIH–AARP Diet and Health Study, total nitrite intake was not associated with risk. However, a positive association, with a trend in risk across quartiles, was observed for high intake of nitrite from animal sources (Aschebrook‐Kilfoy et al., 2012a,b). In contrast, neither nitrite from plants nor nitrite from processed meat sources were positively associated with risk. In the second cohort study (Iowa Women's Health Study), total nitrite intake was not associated with ovarian cancer risk. However, a non‐statistically significant positive association with a trend in risk across quartiles, was found for high nitrite intake from processed meats (Inoue‐Choi et al., 2015). In a cohort study, in which the outcome was total cancer incidence, dietary NDMA and nitrite were not associated with ovarian cancer (Loh et al., 2011). Information is still sparse for ovarian cancer and further epidemiological studies are necessary.
Overall, the Panel concluded that there was insufficient evidence to link dietary nitrites and ovarian cancer.
3.6.8.10. Prostate cancer
Cohort studies
Jakszyn et al. (2012) investigated the association between NDMA and ENOC and haem iron and the risk of prostate cancer among men, recruited in eight European countries within the EPIC. A lifestyle questionnaire was used to collect information about sociodemographic characteristics, lifestyle factors and medical history. After a follow‐up of 11 years, 4,606 prostate cancer cases were identified through population‐based cancer registries and a combination of methods including health insurance records, cancer and pathology hospital registries and active follow‐up. Country‐specific FFQs containing up to 260 food items were used to assess usual diet over the previous 12 months. Of the 148,016 men in the original data, 139,005 were available for analysis. After adjusting for age, and centre, education, marital status, BMI, protein from dairy, smoking and total energy intake, no association between prostate cancer risk and NDMA (Q5 (0.87 μg per day) vs Q1 (0.045), HR: 1.04; 95% CI: 0.92–1.18; ptrend = 0.95) and ENOC (Q5 (142.85 μg per day) vs Q1 (54.27), HR: 0.91; 95% CI: 0.81–1.03; ptrend = 0.04) and haem iron intake (Q5 2.74 mg/day, HR: 0.91; 95% CI: 0.82–1.02 ptrend = 0.03) was found. Iron intake has been suggested to promote NOC formation and catalyse free radical formation. No increased risk was found for stage or grade. The strength of this study is its large size and the inclusion of many different countries. The limitation of this study is the lack of a clear method of data adjustment for confounders. No adjustments were done by important risk factors such as family history of prostate cancer, fruits, vegetables and meat intake.
Sinha et al. (2009) investigated the relationship between meat consumption, PAHs, haem iron, nitrite, nitrate and the risk of prostate cancer in a cohort of 175,343 US men aged 50–71 years. Self‐administrated risk factor questionnaires, including a FFQ (124 items) and information on cooking methods used for different meats, were mailed to 196,851 participants. After 9 years of follow‐up, 10,313 incident cases and 419 fatal cases of prostate cancer were identified through cancer registries. Levels of heterocyclic amines (2‐amino‐3,4,8 trimethylimidazo[4,5‐f]quinoxaline (DiMeIQx), MeIQx, and PhIP), levels of B[a]P and mutagenic activity (a measure of total mutagenic potential incorporating all meat‐related mutagens) were measured from meats with known cooking details. After adjusting for age, total energy intake, ethnicity, education, marital status, family history of prostate cancer, undergoing prostate‐specific antigen testing in the past 3 years, history of diabetes, BMI, smoking history, physical activity, alcohol, calcium, tomatoes, α‐linolenic acid, vitamin E, zinc and selenium, elevated risks were associated with red meat (Q5 median: 66.1 g/1,000 kcal, HR: 1.12; 95% CI: 1.04–1.21; ptrend = 0.002) and processed meat (Q5 median: 24.6 g/1,000 kcal, HR: 1.07; 95% CI: 1.00–1.14; ptrend = 0.040) and haem iron (Q5 median = 336.8 μg/1,000 kcal, HR: 1.09; 95% CI: 1.02–1.17; ptrend = 0.003). No increased risks were found for nitrite (Q5 (median 0.215 mg/1,000 kcal) vs Q1 (median 0.017), HR: 1.05; 95% CI: 0.99–1.12; ptrend = 0.14) and nitrate from meat (Q5 median 0.314 vs 0.032 mg/1,000 kcal, HR: 1.06; 95% CI: 0.99–1.13; ptrend = 0.11). However elevated risks were observed for advanced prostate cancer for both high nitrite (HR: 1.24; 95% CI: 1.02–1.51; ptrend = 0.03) and nitrate intake (HR: 1.31; 95% CI: 1.07–1.61; ptrend = 0.03), haem iron (HR: 1.28; 95% CI: 1.03–1.58; ptrend = 0.02) and red meat intake (HR: 1.31; 95% CI: 1.05–1.65; ptrend = 0.04). The strength of the study is the prospective design and the large sample size. The limitation of the study is the lack of adjustments for other dietary factors (nitrosation inhibitors) that may also influence the risk of prostate cancer.
Summary
In a previous report (IARC 2010), no study on nitrite and prostate cancer was reported. After the IARC report, two cohort studies (Jakszyn et al., 2012; Sinha et al., 2009) investigated the association between NDMA and ENOC and haem iron and the risk of prostate cancer, recruited in eight European countries within the EPIC. No association was found between NDMA and prostate cancer risk. Sinha et al. (2009) investigated the relation between meat consumption, PAHs, haem iron, nitrite, nitrate and the risk of prostate cancer in a cohort of 175,343 US men and found no association. However, they observed positive associations, with a statistically significant trend in risk, for advanced prostate cancer, across quintiles of nitrite from meat. In a cohort study in which the outcome was total cancer incidence. no association was found between with NDMA, nitrites and prostate cancer (461 cases) (Loh et al., 2011).
Overall, the Panel concluded that there was insufficient evidence for an association between nitrites and prostate cancer and there was no evidence for an association between nitrosamines and prostate cancer. Further epidemiological studies should be conducted to confirm the findings of Sinha and colleagues in relation to advanced prostate cancer.
3.6.8.11. Renal cancer
Cohort studies
Daniel et al. (2012a) investigated the risk of renal cell cancer (RCC) in relation to meat, nitrate, nitrite and meat mutagens intake such as HCAs and PAHs, in a prospective study (NIH–AARP Diet and Health study). Participants (n = 492,186) completed a self‐administered questionnaire about demographics, diet and lifestyle. A 124‐item FFQ was used to assess dietary intake. Cancer cases were ascertained through linkage with the cancer registries. After 6 months, a second self‐administrated questionnaire with queries for meat cooking methods and doneness levels was sent to all participants. Meat cooked by methods such as grilling or pan‐frying results in the formation of HCA and PAHs (e.g. PhIP, B[a]P). Haem iron (pro‐oxidant involved in carcinogenesis) in red and processed meats may further increase ENOC. After a mean follow‐up of 9 years, a total of 1,814 cases of RCC were identified. In the multivariable analysis, an increased risk was observed for participants in the highest compared with the lowest quintiles of total red meat intake (Q5 median = 62.2 g/1,000 kcal, HR: 1.19; 95% CI: 1.01, 1.40; ptrend = 0.06). No association was identified between combined nitrate and nitrite intake and risk of RCC (Q5 median = 0.29 mg/1,000 kcal; HR: 0.93; 95% CI: 0.78–1.12) after adjusting for age, sex, total energy intake, other types of meat intake, education, marital status, family history of cancer, race, BMI, smoking status, history of diabetes, history of hypertension, and intakes of alcohol, fruit, and vegetables. Meat intake was significantly correlated with intake of haem iron (r = 0.82), PhIP (r = 0.42), MeIQx (r = 0.52) and B[a]P (r = 0.36). Intake of B[a]P (Q5 median =44 ng/1/000 kcal, HR: 1.23; 95% CI: 1.01, 1.48; ptrend = 0.03) and PhIP (Q5 median = 123.6 ng/1,000 kcal; HR: 1.30; 95% CI: 1.07, 1.58; ptrend = 0.04) was associated with elevated risk of RCC. The strength of the study was the large sample and the assessment of other known carcinogens present in meat. The limitation of the study is that the intake of nitrates and nitrites were combined and based on estimates from only 10 types of processed meats (e.g. bacon, cold cuts, ham, hot dogs and sausage) instead of the whole diet including fresh meat and milk and milk products. The latter could have led to a possible information bias.
DellaValle et al. (2013) prospectively investigated the association between nitrate and nitrite intake from dietary sources and the risk of RCC within the NIH–AARP Diet and Health Study. Among 491,841 participants (293,248 men and 198,593 women, mean age 50–71 years), 1,816 RCC cases were identified after a mean follow‐up of 9 years. The study was an expansion of that conducted by Daniel and colleagues (2012) to include nitrate and nitrite from a variety of dietary sources (e.g. fresh meat and dairy products). RCC cases were identified via linkage with state cancer registries. Nitrate and nitrite intake was estimated from a semiquantitative 124‐item FFQ and intake was calculated for animal and plant sources separately. Daily mean dietary nitrate intake in the study population was 51.0 (SD = 36.3) mg/1,000 kcal. Mean daily dietary nitrite intake was 0.7 (SD = 0.2) mg/1,000 kcal. Nitrite from animal sources accounted for 33% of daily mean intake of nitrite (0.2 mg/1,000 kcal), with the remainder of nitrite intake derived from plant sources. Approximately 40% of nitrite from animal sources was derived from processed meats (0.1 mg/1,000 kcal). The daily average combined nitrate and nitrite intake from processed meat sources was 0.7 mg/1,000 kcal. No increased risk was found for total nitrate (Q5 (≥ 70.94 mg/1,000 kcal) vs Q1 (≤ 24.9), HR: 0.98; 95% CI: 0.84–1.14; ptrend = 0.98) and nitrite intake (Q5 (≥ 0.82 mg/1,000 kcal) vs Q1 (≤ 0.52), HR: 1.02; 95% CI: 0.87–1.19; ptrend = 0.47). No increased risk was found for nitrate from plant sources (Q5 (≥ 0.58 mg/1,000 kcal) vs Q1 (≤ 30), HR: 0.89; 95% CI: 0.76–1.04; ptrend = 0.44). An increased risk (Q5 (≥ 0.31 mg/1,000 kcal) vs Q1 (≤ 0.13), HR: 1.28; 95% CI: 1.10–1.49; ptrend < 0.01) of RCC among participants was found for the highest quintile of nitrite from animal sources intake compared with those in the lowest quintile after controlling for age, sex, calorie intake, race, smoking status, family history of cancer, BMI, alcohol intake, education, history of hypertension and history of diabetes. Similar associations were observed with nitrite from processed meat (Q5 (≥ 0.16 mg/1,000 kcal) vs Q1 (≤ 0.03), HR: 1.16; 95% CI: 1.00–1.35; ptrend = 0.04) and nitrite from other animal sources excluding processed meat (Q5 (≥ 0.19 mg/1,000 kcal) vs Q1 (≤ 0.08), HR: 1.23; 95% CI: 1.06–1.43; ptrend = 0.02). A sensitivity analysis that excluded participants who resided in areas with high nitrate levels was conducted, but the risk did not change. No association was observed between nitrite intake from plant sources or total nitrite intake and risk of total RCC. No statistical interaction was observed for vitamin C and/or vitamin E. The strength of the study is the large sample and the good control for confounding factors and the number of stratified analysis conducted.
Case–control studies
Ward et al. (2007a,b) conducted a population‐based case–control study (201 cases; 1,244 controls) to evaluate drinking water and dietary sources of nitrate and nitrite as risk factors for RCC. Eligible cases were white residents of Iowa aged 40–85 years who were newly diagnosed with histologically confirmed RCC. Of 463 eligible RCC cases, only 201 participated and had complete information on nitrates from drinking water and diet. Controls were frequency matched by gender, race and 5‐year age groups to the distribution of the six cancers combined (bladder, brain, colon, kidney, rectum and pancreas), resulting in a matching ratio for the RCC cases of ~ 6:1. The mailed questionnaire assessed major RCC risk factors including demographics, height and weight, smoking history, and questions about physician‐diagnosed hypertension and bladder or kidney infections. Dietary intake was assessed by a 55‐item FFQ. No association was found between RCC and nitrate levels in drinking water from public supplies (> 2.78 vs < 0.62 mg/L, OR: 0.89; 95% CI: 0.57–1.39) after controlling for age, gender, BMI, and average population size. No increased risk was found for neither high intake of dietary nitrate (Q4 ≥ 122.01 vs Q1 < 59.32 mg/day, OR: 0.41; 95% CI: 0.28–0.60) nor high intake of nitrites (Q4 ≥ 1.26 vs Q1 < 0.70 mg/day, OR: 0.82; 95% CI: 0.50–1.33) after controlling for age, sex, sodium and total calories. High intake of nitrites from animal source was also not associated with an increased risk (Q4 ≥ 0.48 vs Q1 < 0.18 mg/day, OR: 1.00; 95% CI: 0.63–1.59) after controlling for age, sex, sodium and total fat. However, high nitrate exposure from water (> 5 mg/L) was associated with an increased risk among subgroups with above the median red meat intake (≥ 1.2 vs < 1.2 servings per day, OR: 1.91; 95% CI: 1.04–3.51) or below the median vitamin C intake (OR: 1.90; 95% CI: 1.01–3.56) after controlling for age, gender, average population size of residences, BMI and total calories. The strength of the study was the information regarding individual consumption of drinking water plus nitrates and nitrites from dietary sources. The limitation of the study is the high number of subjects excluded from the analysis such as subjects with 10 mg/L of nitrate and with more than five missing food items. The imputation method they used for missing information on foods or levels of nitrate may be also a limitation.
Summary
In a previous report (IARC 2010), only one case–control study was described in relation to nitrite and nitrosamines and lower urinary tract, including renal cancer (7%) (Wilkens et al., 1996). After the IARC report, one case–control study (Ward et al., 2007a,b) and two cohort studies (Daniel et al., 2012a,b; DellaValle et al., 2013) were reported. Ward et al. (2007a,b) conducted a population‐based case–control study and showed no increased risk for high intake of nitrites (Ward et al., 2007a,b). Both cohort studies showed no association between total nitrite alone and renal cancer (Daniel et al., 2012a,b) and nitrate and nitrite combined (DellaValle et al., 2013). However, a positive association with a trend in risk across quintiles was found for nitrite from animal sources and nitrite from processed meat and nitrite (DellaValle et al., 2013). Information is limited and more studies are needed to investigate the link between nitrites from animal source and nitrite from processed meat and renal cancer.
Overall, the Panel concluded that there was insufficient evidence to link nitrites and renal cancer.
3.6.8.12. Bladder cancer
Cohort studies
Ferrucci et al. (2010) investigated the association between meat and meat components (nitrates, nitrites, HCAs and PAH) and bladder cancer, within a large prospective NIH–AARP Diet and Health Study (n = 300,933). At baseline, each participant completed a self‐administrated questionnaire on demographic, lifestyle, including a 124‐item FFQ, and medical data. Six months after the baseline questionnaire, a total of 125,574 women and 175,359 men (aged 50–71 years) completed a mailed risk factor questionnaire with questions on meat cooking methods (grilled, pan‐fried, microwaved and broiled) and doneness levels (well done/very well done and medium/rare). Computerized Heterocyclic Amines Resource for Research in Epidemiology of Disease (CHARRED) was used to estimate HCAs: DiMeIQx, MeIQx and PhIP. B[a]P, a marker of overall PAH exposure, was also estimated for each participant. After 8 years of follow‐up, 854 bladder cancers were identified through record linkage with state cancer registries. An increased, although not statistically significant, risk (Q5 (median 61.6 g/1,000 kcal) vs Q1 (9.5), HR: 1.22; 95% CI: 0.96–1.54; ptrend = 0.07), was observed for high consumption of red meat, after controlling for age, sex, smoking, intake of fruits, vegetables, beverages and total energy intake. High nitrate intake (Q5 median 95.4 vs 19.7 mg/1,000 kcal, HR: 0.80; 95% CI: 0.58–1.10; ptrend = 0.28) was not associated with an increased risk of bladder cancer. An 28% increased risk (Q5 (median 0.91 mg/1,000 kcal) vs Q1 (0.46), HR: 1.28; 95% CI: 1.02–1.61; ptrend = 0.06) was observed for high nitrite intake. When divided by dietary sources, no increased risk was found for nitrites from animal (Q5 (median 0.36 mg/1,000 kcal) vs Q1 (0.10), HR: 1.09; 95% CI: 0.87–1.36; ptrend = 0.21) or plant sources (Q5 (median 0.69 mg/1,000 kcal) vs Q1 (0.25), HR: 1.16; 95% CI: 0.90–1.50; ptrend = 0.18) or (Q5 (median 0.19 mg/1,000 kcal) vs Q1 (0.10), HR: 1.07; 95% CI: 0.85–1.36; ptrend = 0.79). Nevertheless, an increased risk was also observed for combined nitrate and nitrite levels from processed meat (Q5 (median 0.95 mg/1,000 kcal) vs Q1 (0.06), HR: 1.29; 95% CI: 1.00–1.67; ptrend = 0.11) but not for nitrite alone (HR: 1.07; 95% CI: 0.85–1.36; ptrend = 0.79). A suggestive increased risk was seen for nitrate from processed meat (Q5 (median 0.29 mg/1,000 kcal) vs Q1 (0.02), HR: 1.20; 95% CI: 0.95–1.51; ptrend = 0.06), although it did not reach statistical significance. Adjustment for other possible confounders and excluding individuals who may high nitrate intake from drinking, did not alter risk estimates. DiMeIQx, MeIQx and B[a]P were not associated with bladder cancer. However, an increased, although not statistical significant, risk was observed for high levels of PhIP (HR: 1.19; 95% CI: 0.95–1.48; ptrend = 0.06). No association was seen for doneness and white meat. The strength of this study is its large size and the good control for confounders. No values for mean nitrates or nitrites in the population were provided.
Jakszyn et al. (2011) investigated the association between red meat consumption, dietary nitrosamines and haem iron, and the risk of bladder cancer among participants in the EPIC study that involved 23 centres among 10 European countries (n = 481,419). A lifestyle questionnaire was used to collect information about sociodemographic characteristics, lifestyle factors and medical history. Follow‐up was based on population‐based cancer registries in seven of the participating countries: Denmark, Italy, the Netherlands, Spain, Sweden, United Kingdom and Norway. In France, Germany and Greece, a combination of methods was used, including health insurance records, cancer and pathology hospital registries and active follow‐up. Country‐specific semiquantitative FFQs containing up to 260 food items were used to assess usual diet over the previous 12 months. After a mean follow‐up of 8.7 years, 1,001 participants were diagnosed with bladder cancer. HRs were estimated accounting for age, gender, total energy intake, smoking status, age at recruitment, educational level and BMI. No statistically significant associations were found between ENOC (Q4 ≥ 98.46 vs Q1 40.52 μg/day, HR: 1.12; 95% CI: 0.89–1.42; ptrend = 0.30), NDMA (Q4≥ 0.19 vs Q1 0.05 μg/day, HR: 1.12; 95% CI: 0.88–1.44; ptrend = 0.49) and red and processed meat (HR: 1.15; 95% CI: 0.90–1.45; ptrend = 0.49) and haem iron (HR: 1.10; 95% CI: 0.88–1.39; ptrend = 0.39). In a stratified analysis among non‐smokers, an increased (1.36; 95% CI: 0.83–2.21), although not statistically significant risk was found for ENOC and bladder cancer after controlling for potential confounders including occupational exposure. The strength of this study is its large size and the inclusion of potential confounders. The limitations are the lack of control for both fruits and vegetables intake and the lack of mean levels of nitrosamines in the population.
Catsburg et al. (2014) examined the role of dietary sources of NOCs and NOC precursors as potential bladder cancer risk factors using data from the Los Angeles Bladder Cancer Study, a population‐based case–control study (1,660 bladder cancer cases and 1,586 controls). Bladder cancer cases were identified through the Los Angeles County Cancer Surveillance Program, the population‐based Surveillance, Epidemiology and End Results cancer registry of Los Angeles County. Controls were frequency matched by age (within 5 years), gender and race/ethnicity (non‐Hispanic white, Hispanic, African American). In‐person structured interviews were conducted in participants’ homes. The questionnaire included information on demographic characteristics, height, weight, lifetime use of tobacco and alcohol, usual adult dietary habits, lifetime occupational history, prior medical conditions and prior use of medications. Forty food groups were included in the dietary section of the structured questionnaire. Mean age of cases and controls were aged 54.4 years. In the multivariate analysis, weekly intake of salami/pastrami/corned beef (rich in amines and nitrosamines) was associated with a 30% increased risk (OR: 1.33; 95% CI: 1.02–1.74; ptrend = 0.008) of risk of bladder cancer after adjusting for smoking, race, BMI, education, food servings, history of diabetes, vegetable intake and intake of vitamin A, vitamin C and carotenoid. Among non‐smokers the risk was even stronger (OR: 1.95; 95% CI: 1.10–3.46; ptrend = 0.006). No association was found for nitrate intake (Q5 ≥ 148.4 vs Q1 ≤ 64.3 mg/day, OR: 0.90; 95% CI: 0.60–1.35; ptrend = 0.598) or nitrite intake (Q5 ≥ 533 vs Q1 ≤ 234 μg/day, OR: 0.89; 95% CI: 0.66–1.20; ptrend = 0.921) or nitrosamine (Q5 ≥ 54.5 vs Q1 14.6 ng per day, OR: 1.03; 95% CI: 0.78–1.36; ptrend = 0.984). An increased, although not statistically significant risk was found for nitrites (OR: 1.56; 95% CI: 0.85–2.87; ptrend = 0.063) and nitrosamine (OR: 1.52; 95% CI: 0.86–2.66; ptrend = 0.281) among non‐smokers. No increased risk was found for nitrates (OR: 0.96; 95% CI: 0.60–1.54; ptrend = 0.759), nitrites (OR: 0.77; 95% CI: 0.54–1.08; ptrend = 0.341) and nitrosamines (OR: 0.96; 95% CI: 0.69–1.33; ptrend = 0.701) in ever smokers. High intake of haem iron (≥ 5.2 mg) was also associated with an increased risk of bladder cancer among non‐smokers (OR: 1.97; 95% CI: 1.16–3.33; ptrend = 0.010). When considering NOC precursors, risk was consistently higher among subjects with concurrent high intake of nitrate (≥ 103 mg/day) and high intake of the different meats, known as sources of amines and nitrosamines, such as liver, (OR: 1.48; 95% CI: 1.09–2.01; ptrend = 0.001), salami/pastrami/corned beef (OR: 1.37; 95% CI: 0.94–2.00; ptrend = 0.035) and hot dogs/Polish sausage (OR: 1.36; 0.91–2.04; ptrend = 0.06). The strength of this study is the study design: a population case–control study with the control of many confounders. No data regarding the response rate among controls was provided.
Summary
In a previous report (IARC 2010), two case–control studies of dietary intake of nitrite and cancer of the urinary bladder were reviewed (Wilkens et al., 1996; Ward et al., 2003). In the two case–control studies, non‐statistically significant positive associations were found between nitrite intake and bladder cancer, particularly among men. After the IARC report, two cohort studies (Ferrucci et al., 2010; Jakszyn et al., 2011) and one case–control study were conducted (Catsburg et al., 2014). A positive association between high nitrite intake and the combination of nitrate and nitrite from processed meat were found in the NIH–AARP Diet and Health Study. However, there was no clear evidence of a trend in risk across quintiles (Ferrucci et al., 2010). Within the EPIC study, which involved 23 centres among 10 European countries, Jakszyn et al. (2011) investigated the association between red meat consumption and dietary nitrosamines and bladder cancer. Positive non‐statistically significant associations were found, particularly among non‐smokers for ENOC, NDMA and nitrites and bladder cancer (Jakszyn et al., 2011). Later, a population case–control study examined the role of dietary sources of NOCs on bladder cancer and found no association (Catsburg et al., 2014).
Overall, the Panel concluded that there was insufficient evidence to link dietary nitrite and nitrosamines and bladder cancer.
3.6.8.13. Thyroid cancer
Cohort studies
Aschebrook‐Kilfoy et al. (2013a) evaluated nitrate and nitrite intake and the risk of thyroid cancer in the Shanghai Women's Health Study (n = 73,317 women, aged 40–70 years). In‐person interviews were used to collect information on demographic characteristics, medical information, lifetime residential and occupational history, lifestyle and dietary habits. Dietary intake was assessed using a FFQ (77 food items). After ~ 11 years of follow‐up, 164 incident thyroid cancer cases were identified through the Shanghai Cancer Registry. The mean age was 52.0 years, median daily nitrate intake was 309 mg and median daily nitrite intake 1.4 mg. Nitrate intake was not associated with thyroid cancer risk (Q4 (median = 251 mg/1,000 kcal) vs Q1 (109), HR: 0.93; 95% CI: 0.42–2.07; ptrend = 0.40). A two‐fold increased risk was found for total dietary nitrite intake (Q4 (median 1.1 mg/1,000 kcal) vs Q1 (0.6), HR: 2.05; 95% CI: 1.20–3.51; ptrend = 0.36), after adjusting for age, education, history of thyroid diseases, vitamin C, carrot and folate intake. An increased risk was found for nitrite from animal sources (Q4 median 0.2 mg/1,000 kcal) vs Q1 (0.1), HR: 1.59; 95% CI: 1.00–2.52; ptrend = 0.02). An increased, although not statistical significant risk was seen for nitrite from plant sources (Q4 (median 1.0 mg/1,000 kcal) vs Q1 (0.5), HR: 1.30; 95% CI: 0.76–2.4; ptrend = 0.7). The risk was stronger for nitrite from processed meats (Q4 (median 0.1 mg/1,000 kcal) vs Q1 (0.0), HR: 1.96; 95% CI: 1.28–2.99; ptrend < 0.01). To evaluate the consistency of the results regarding total nitrate and nitrite the authors stratified by age, BMI, education, red meat intake and vitamin C. However, no interaction was seen and the results did not change. The strength of the study is the nature of the study (cohort), the high level of complete baseline and the completeness of follow‐up (92% of the initial sample). Although they controlled for many confounders, data on smoking were collected but not considered while running the models and that could be a great limitation.
Kilfoy et al. (2011) conducted a cohort (NIH–AARP) diet and health study and evaluated dietary nitrate and nitrite intake and thyroid cancer risk overall and for subtypes. A total of 490,194 men and women aged 50–71 years were included in the study. During an average of 7 years of follow‐up, 370 incident cases were identified through cancer registries and the US National Death Index Plus. A baseline questionnaire ascertained information on possible risk factors including dietary intake (FFQ of 124 items and use of individual and multivitamin supplements). Mean dietary intake was 88 (SD =65) mg/day nitrate and 1.2 (SD = 0.6) mg/day nitrite. An interaction between nitrate intake and sex was observed. Among men, a twofold increased risk was observed in the highest quintile of nitrate intake (Q5 (median 94.8 mg/day) vs Q1 (19.4), RR: 2.28; 95% CI: 1.29–4.04; ptrend < 0.01). An increased, although not statistically significant risk was found for nitrite intake among men (Q5 (median 0.9 mg/day) vs Q1 (0.5), RR: 1.36; 95% CI: 0.78–2.37; ptrend = 0.26), after controlling for age, smoking status, race, calories, alcohol, family history cancer, physical activity, education, BMI, vitamin C, β‐carotene and folate consumption. Among women, nitrate intake was not associated with thyroid risk (Q5 (median 94.8 mg/day) vs Q1 (19.4), RR: 0.69; 95% CI: 0.42–1.15; ptrend = 0.61), but an increased, although not statistical significant risk was found for nitrite (Q5 (median 0.9 mg/day) vs Q1 (0.5), RR: 1.19; 95% CI: 0.71–1.98; ptrend = 0.40). The strength of the study is the prospective design, the large sample size and the high number of confounding factors taken into consideration. The limitation is the lack of information of nitrites by different dietary sources and the lack of control for other potential environmental and dietary risk factors for thyroid cancer.
Summary
In a previous report (IARC, 2010), no study was reported on nitrite and thyroid cancer. After the IARC report two cohort studies were published. Kilfoy et al. (2011) conducted a cohort (NIH–AARP) diet and health study and evaluated dietary nitrate and nitrite intake and thyroid cancer risk overall and for subtypes. A non‐statistically significant positive association was found for nitrite intake and thyroid cancer. The Shangai Women's Health Study investigated nitrate and nitrite intake and the risk of thyroid cancer. A positive association was found between total dietary nitrite intake, nitrite from animal sources, nitrites from processed meats and thyroid cancer (Aschebrook‐Kilfoy et al., 2013a,b).
Overall, the Panel concluded that there was insufficient evidence to unequivocally link nitrites and thyroid cancer. Further cohort studies with large sample size and with a good control for confounding factors, including radiation exposure, are warranted.
3.6.8.14. Non‐Hodgkin lymphoma
Cohort studies
Daniel et al. (2012a,b) investigated meat intake in relation to non‐Hodgkin lymphoma (NHL) risk in a large US cohort (NIH–AARP Diet and Health Study, n = 567,169). Participants completed a FFQ (124 items) and a lifestyle questionnaire (n = 492,186), and a subcohort (n = 302,162) also completed a questionnaire on meat cooking methods and doneness levels. Over a mean of 9 years of follow‐up, 3,611 incident cases of NHL were identified through original state cancer registries. Intake of nitrate and nitrite was estimated by using a database of measured values from 10 types of processed meat, constituting 90% of the processed meat types consumed in the USA. Nitrates and nitrites intake from processed meat sources were not associated with total NHL risk, after controlling for age, sex, education, family history of any cancer, race, BMI, smoking status, physical activity, intake of alcohol, fruit and vegetables, and total energy (Q5 (median 0.47 mg/1,000 kcal) vs Q1 (0.04), HR: 1.02; 95% CI: 0.88–1.18; ptrend = 0.68). Haem iron, HCAs and PAH compounds were not associated with an increased risk of NHL. The strength of the study is the large sample and the assessment of other known carcinogens present in meat. The limitation of the study is the estimates of nitrites and nitrates that were based only on processed meat instead of the whole diet including fresh meat and milk and milk products.
Aschebrook‐Kilfoy et al. (2012a,b) conducted a prospective study among 832 cases of NHL in women identified between 1996 and 2000 through the Connecticut Tumor Registry to test the hypothesis that nitrate and nitrite intake affects NHL survival. After exclusions for missing data, 568 patients (mean age 61.6 years) with NHL were included in the study and followed‐up until 2008 (mean follow‐up 4.06 years). The median daily intake of nitrate (95.9 mg/day) and nitrite (1.1 mg/day) were used as the cut‐off points for high and low intake. During the follow‐up, 250 patients died. A FFQ (120 foods) was used to assess dietary intake. No association was found for high nitrates intake (Q4 ≥ 141.0 vs Q1 < 62.8 mg/day, HR: 1.0; 95% CI: 0.7–1.5; ptrend = 0.88) and NHL mortality and nitrites (Q4 ≥ 1.4 vs Q1< 0.8 mg/day, HR: 1.0; 95% CI: 0.6–1.6; ptrend = 0.69) and NHL mortality, after controlling for age, calorie intake, family history of cancer and vitamin C. The limitation of the study was the study design that does not allow assessing whether there was a true exposure–outcome relationship. There is a lack of control for important confounders in the multivariate analysis such as staging, co‐morbidities and therapy.
Case–control studies
Kilfoy et al. (2010) investigated the association between nitrate and nitrite intake and the risk of NHL in a population case–control study of women from Connecticut. Of 832 eligible patients, 594 histologically confirmed NHL cases, aged 21–84 years (mean age 62 years) were included in the study. Population‐based controls (710 individuals) from the same area were recruited, and matched by age (± 5 years). In‐person interviews were conducted to assess health behaviour and history, and all participants were sent a 120‐item FFQ to assess dietary intake. Intake of nitrate and nitrite was divided into high and low according to median consumption. The median intake in their study was similar to the NCI‐Surveillance, Epidemiology and End Results (Ward et al., 2003) (median nitrate intake = 114 mg/day, median nitrite intake = 0.91 mg/day). The mean nitrate intake among cases and controls were 116.5 (SE = 83.0) and 112.1 (SE = 75.1) mg/day, and the mean dietary nitrite was 1.2 (SE = 0.6) and 1.1 (SE = 0.5) mg/day, respectively. An increased risk of NHL was found for higher dietary nitrite intake (OR: 1.37; 95% CI: 1.04–1.79) after adjusting for age, family history of NHL, total daily energy intake, vitamin C, vitamin E and protein intake. No association was found between dietary nitrate and NHL risk, after controlling for potential confounders (OR: 1.09; 95% CI: 0.86–1.39). After stratifying for NHL histological type, a particular increased risk was observed for T‐cell lymphoma (OR: 2.38; 95% CI: 1.12–5.06) and nitrites. After stratification by sources of nitrites, the increased risk remained only for nitrites from animal sources (OR: 1.35; 95% CI: 1.05–1.75), but not from nitrites from plants (OR: 1.11; 95% CI: 0.86–1.44). No effect modification was observed for vitamin C, vitamin E and protein intake and risk of overall NHL. The strength of the study was the sample size. The limitation of the study is the low response rate among cases (71%) and controls (69% < 65 years and 47% for subjects of ≥ 65 years) and the lack of control for other potential confounding factors. Low and high nitrates and nitrites levels of intake were based on median consumption however the median values were not given in the manuscript.
Aschebrook‐Kilfoy et al. (2013a,b) conducted a case–control study (348 cases and 470 controls) in Nebraska to investigate the association between dietary nitrate and nitrite intake and risk of NHL. Information on demographic, medical, environmental and lifestyle factors was collected by telephone interviews. A self‐administrate FFQ was sent by post (117 food items). The mean nitrate intake among cases was 100.3 (SD = 70.6) mg/day and the mean nitrite intake was 1.4 (SD = 0.70 mg/day. The mean nitrate intake among controls was 103.0 (SD = 68.0) mg/day and the mean nitrite intake was 1.3 (SD = 0.6) mg/day. No increased risk of NHL was found for high intake of total nitrates (Q4 (median 88.3 mg/1,000 kcal) vs Q1 (22.2), OR: 0.8; 95% CI: 0.5–1.3; ptrend = 0.6). A non‐significant increased risk of NHL was found for high intake of total nitrite (Q4 (median 0.86 mg/1,000 kcal) vs Q1 (22.2), OR: 1.3; 95% CI: 0.8–1.9; ptrend = 0.4) and the increased risk seems to be related to nitrites from animal sources (Q4 (median 0.41 mg/1,000 kcal) vs Q1 (0.16), OR: 1.3; 95% CI: 0.8–1.9; ptrend = 0.3), but not from plant sources (Q4 (median 0.53 mg/1,000 kcal) vs Q1 (0.26), OR: 0.9; 95% CI: 0.6–1.4; ptrend = 0.9). Among women, but not men, a statistically significant increased risk was observed for high intake of nitrites from animal sources (Q4 (median 0.41 vs 0.16 mg/1,000 kcal, OR: 1.9; 95% CI: 1.0–3.4), after controlling for age, BMI, education, family history of cancer, vitamin C and total daily energy intake. No increased risk was found for either nitrite (Q4 (median 0.21 mg/1,000 kcal) vs Q1 (0.02), OR: 1.0; 95% CI: 0.6–1.5; ptrend = 0.9) or nitrite plus nitrate (Q4 (median 1.51 mg/1,000 kcal) vs Q1 (0.14), OR: 1.0; 95% CI: 0.7–1.6; ptrend = 0.9) from processed meats. Other potential confounding factors (farming status, physical activity, alcohol consumption and the use of hair dyes), were also taken into consideration in the analysis but they did not change risk estimates. The response rate among cases and controls was 73.2% and 76.8%, respectively. No significant associations were observed for nitrate or nitrite by NHL subtype. The limitation of the study is the low response rate among cases and controls and the strength of the study is the good control for confounding factors and the risk estimates shown by different dietary sources.
Summary
In a previous report (IARC, 2010), the relation between nitrite intake and NHL was reported in two case–control studies conducted in USA (Ward et al., 1996, 2006). A positive association between NHL and dietary nitrite was found in one of the studies (Ward et al., 1996). After the IARC evaluation, two cohort studies and two case–control studies were conducted in the USA to investigate the association between nitrite and NHL (Aschebrook‐Kilfoy et al., 2012a,b; Daniel et al., 2012a,b). Daniel et al. (2012a,b) investigated meat intake in relation to NHL in a large US cohort (NIH–AARP Diet and Health Study); total nitrate and nitrite intake from processed meat sources were not associated with NHL risk. Aschebrook‐Kilfoy et al. (2012a,b) conducted a small prospective study and showed that nitrite intake was not associated with NHL survival. Kilfoy et al. (2010) conducted a population case–control study in Connecticut and showed a positive association between nitrite and NHL, particularly among nitrites derived from animal sources. Aschebrook‐Kilfoy et al. (2013a,b) conducted a case–control study in Nebraska and found no association between nitrite and NHL.
Overall, the Panel concluded that there was insufficient evidence for an association between dietary nitrite intake and non‐Hodgkin lymphoma. Further studies should be conducted to confirm the findings of Kilfoy and colleagues (2010).
3.6.8.15. Leukaemia
No studies have evaluated nitrite and the risk for leukaemia.
3.6.8.16. Brain cancer
Adult glioma
Cohort studies
Michaud et al. (2009) conducted a prospective study of meat intake and dietary nitrates, nitrites and nitrosamines and risk of adult glioma in the USA. They examined the relation between intake of meats, nitrate, nitrite and two nitrosamines (NDMA and NPYR) and glioma risk in a prospective analysis. Data from three US prospective cohort studies (Nurses’ Health Study (NHS) I, NHS II, and male Health Professionals Follow‐Up Study (HPFS)) were combined for this analysis. In total, 335 glioma cases were diagnosed during 24 years of follow‐up. Habitual dietary intake was assessed with FFQ; these were initially collected in 1986 for 49,935 men (HPFS), in 1980 for 92,468 women (NHS I), and in 1991 for 95,391 women (NHS II); diet was generally updated every 4 years. For the NHS I, they used a 61‐item semiquantitative FFQ (including dietary items and vitamin use) at baseline in 1980, which was expanded to 130 items (including food, beverages, and vitamin use) in 1984, 1986 and every 4 years thereafter. For the HPFS and NHS II cohorts, baseline dietary intake was assessed by using a 131‐item FFQ. Questions on meat intake (other than fish) were very similar on the 61‐item FFQ and the 131‐item FFQ; both had the same number of questions with similar meat items included in each. Considered processed meat items were: bacon, hot dogs, sausage, salami bologna. Nitrate, nitrite and nitrosamine values were calculated based on published values of these nutrients in various foods over different periods, preferably from US data, otherwise from European data. The median daily intake of nitrate was around 150 mg in HPFS, 96 mg in NHS I and 137 mg in NHS II. The median daily intake of nitrite was around 1.6 mg in HPFS, 1.4 mg in NHS I and 2.0 mg in NHS II. The median daily intake of NDMA was around 0.07 μg in HPFS, 0.06 μg in NHS I and 0.06 μg in NHS II. Cox PH models were used to estimate incidence RR and 95% CI. Estimates from each cohort were pooled by using a random effects model, and only combined effects were presented. After controlling for age, calendar period, and calorie intake (and additionally vitamin C and E, coffee and tea), risk of glioma was not elevated among individuals in the highest intake category of red meat (RR: 1.09; 95% CI: 0.62–1.93; ptrend = 0.57), total processed meats (RR: 0.92; 95% CI: 0.48–1.77; ptrend = 0.99), nitrate (RR, Q5 vs Q1 (cut‐offs are not presented because these vary for the three cohorts): 1.02; 95% CI: 0.66–1.58; ptrend = 0.81), nitrite (RR Q5 vs Q1: 1.26; 95% CI: 0.89–1.79; ptrend = 0.23), NDMA (RR Q5 vs Q1: 0.88; 95% CI: 0.57–1.36; ptrend = 0.73) or NPYR (RR T3 vs T1: 0.81; 95% CI: 0.62–1.05; ptrend = 0.93) compared with the lowest category. No effect modification was observed by intake of vitamins C or E or other antioxidant measures. The authors concluded there was no suggestion that intake of meat, nitrate, nitrite or nitrosamines is related to the risk of glioma. Other factors typically considered as potential confounders in cancer analyses (e.g. smoking, BMI, and fruit and vegetable intake) were not included in the models because they are not risk factors for glioma in these cohorts, according to the authors. Strengths of this study are the inclusion of three large prospective cohort studies among men and women, with multiple measurements of dietary intake per person, coupled with a long follow‐up. The study lacked information on nitrate intake from drinking water.
Dubrow et al. (2010) studied adult glioma risk relative to endogenous NOC (ENOC) formation in the prospective NIH–AARP Diet and Health Study. The NIH–AARP Diet and Health Study recruited men and women, aged 50–71 years, from six states in the USA. At baseline (1995 to 1996) participants completed self‐administered demographic and lifestyle questionnaires, including a 124‐item FFQ. A total of 566,402 participants returned the baseline questionnaire. After excluding prevalent brain cancer cases, those who had questionnaires completed by proxy respondents and those with implausible nutrient values, the final analytical cohort consisted of 545,770 participants (322,347 men and 223,423 women). The FFQ was used in association with published information (from the USA and Canada preferably) on nitrate content of various foods to estimate daily nitrate intake. Daily median intake was as 40.95 mg/1,000 kcal for nitrate and 0.65 mg/1,000 kcal for nitrite. Daily intake of vitamins C and E was also estimated. After a mean follow‐up of 7.2 years, 585 incident glioma cases were identified. Cox PH models were used. After controlling for age, race, total energy intake, education, height and family history of cancer (smoking was not associated with glioma), significant positive trends were found for nitrite intake from plant sources (Q5 (median 0.68 mg/1,000 kcal) vs Q1 (0.25), HR: 1.59; 95% CI: 1.20–2.10; ptrend = 0.028) and total nitrite intake (Q5 (median 0.90mg/1,000 kcal) vs Q1 (0.45), HR: 1.32; 95% CI: 1.01–1.71; ptrend = 0.089) and, unexpectedly, for fruit and vegetable intake (HR: 1.42; 95% CI: 1.08–1.86; ptrend = 0.0081). Processed meat consisted of red and white meat sources of bacon, sausage, luncheon meats, cold cuts, ham and hot dogs. No significant trend in glioma risk for consumption of processed red meat (HR: 1.05; 95% CI: 0.80–1.37; ptrend = 0.44), nitrate (Q5 (94.85 mg/1,000 kcal) vs Q1 (19.35), HR: 1.28; 95% CI: 0.97–1.70; ptrend = 0.14) or vitamin C or E was detected. Examination of interactions between dietary intakes (e.g. nitrite and vitamin C) and a limited analysis of diet at ages 12–13 years provided no support for the NOC hypothesis. According to the authors, the study suggests that consumption of processed or red meat, nitrite or nitrate does not meaningfully increase adult glioma risk and that consumption of fruit and vegetables, fruit and vegetable subgroups, vitamin C or vitamin E does not meaningfully protect against adult glioma risk. Strength of this study is the inclusion of a large cohort of men and women. The study lacked information on nitrate intake from drinking water.
Summary
In the IARC (2010) report, seven case–control studies on adult brain cancer (often glioma) and dietary nitrite were reviewed. Dietary nitrite results were inconsistent with no clear evidence of an association. Since then, two cohort studies were published. Michaud et al. (2009) found no significant associations with adult glioma (335 incident cases) in three cohorts of men and women with dietary nitrite, NDMA and NPYR, with no effect modification by vitamin C or E or other antioxidants. In the other cohort study (with 585 incident cases), total nitrite intake (and nitrite from plant sources) was significantly positively associated with glioma risk (Dubrow et al., 2010). There are doubts about the content of nitrite from plant sources and its stability. According to Dubrow et al. (2010), their study suggests that consumption of processed or red meat and nitrite does not meaningfully increase adult glioma risk.
Overall, the Panel concluded that there was insufficient evidence that the intake of nitrite or NDMA was associated with increased glioma risk in adults.
Childhood brain tumours
In a previous review, which considered publications until 2006 (IARC, 2010), five case–control studies on childhood brain tumours and dietary nitrite were reviewed. For total dietary nitrite, most studies found no associations, but the largest case–control study found a positive association with nitrite from cured meat; other studies did not consider that. Since then, no new studies have been reported.
Overall, the Panel concluded that there was insufficient evidence that nitrite intake from cured meat is associated with increased risk of childhood brain tumours.
3.6.8.17. Total cancer
Cohort studies
Loh et al. (2011) studied the relationship between dietary NOCs (measured as NDMA), ENOC index, dietary nitrite and total cancer incidence, as well as some specific cancer sites. The EPIC–Norfolk prospective cohort study comprised 23,363 participants (10,783 men and 12,580 women) aged 40–79 years. In total, 3268 incident cancer cases (1,671 men and 1,597 women) were identified within a mean follow‐up of 11.4 years. An assessment of baseline diet was carried out using a 131‐item FFQ. The NDMA and nitrite content of food items were obtained from the EPIC‐EURGAST study published in the literature. For food items without analysed values, the value of the nearest comparable food was assigned, whereas an average was assigned for foods with several suitable values analysed. For ENOC exposure, the ENOC index was determined by using the estimated iron content from meat intake and faecal apparent total NOCs formation from several human controlled‐diet studies. The estimated mean intake of nitrite in the non‐cases was 1.48 mg/day, for NDMA it was 57 ng per day and for ENOC exposure it was 72.3 μg/day. Overall, greater proportions of cancer cases were noticed with current and former smokers and lower plasma vitamin C concentrations. Multivariate Cox PH models were used in survival analyses, adjusting for age, sex, BMI, cigarette smoking status, alcohol intake, energy intake, physical activity status, educational level and menopausal status (in women). For the specific cancer site analyses, cases were defined on the basis of the primary cancer diagnosed. These cancers included oesophagus, stomach, colon, rectum, breast, prostate, lung, and ovarian cancers. The rest of cancers in the study population were categorised as ‘others’. Cancers of the oesophagus, stomach, colon and rectum were grouped under GI cancers.
For total cancer, when comparing the highest quartile of exposure to the lowest quartile, no significant association was reported in cancer risk across quartiles for dietary nitrite (HR Q4 (cut‐off NA) vs Q1: 1.02; 95% CI: 0.90–1.14; ptrend = 0.91) and ENOC (HR Q4 (cut‐off NA) vs Q1: 0.95; 95% CI: 0.85–1.05; ptrend = 0.19). For NDMA intake, an elevated cancer risk was found after adjustment for age and sex, but not after the multivariate adjustment (Q4 (mean 0.126 μg/day) vs Q1 (0.017), HR: 1.10; 95% CI: 0.97–1.24; ptrend = 0.22). When men and women were analysed separately, this association remained significant in multivariate analyses only in men (HR: 1.18; 95% CI: 1.00–1.40; ptrend = 0.08), and not in women (HR: 1.05; 95% CI: 0.86–1.29; ptrend = 0.83). There were significant interactive effects between plasma vitamin C concentrations and dietary NDMA intake on cancer risk in simple age‐ and sex‐adjusted and multivariate models. Similar findings were observed for ENOC but only in the age‐ and sex‐adjusted model (p for interaction = 0.009). There was no evidence for any interaction in the case of nitrite (data not shown).
For GI cancer (532 cases), NDMA intake (as continuous variable) was associated with increased risk (HR per 1 SD of NDMA: 1.13; 95% CI: 1.00–1.28), and specifically rectum cancer (137 cases) (HR per 1 SD: 1.46; 95% CI: 1.16–1.84). This was not the case for dietary nitrite and GI cancer (HR per 1 SD of nitrite: 0.99; 95% CI: 0.89–1.10) or rectum cancer (HR: 1.18 (0.97, 1.44)). For colon cancer (276 cases), there was no significant association with NDMA (HR per 1 SD: 0.99; 95% CI: 0.83–1.18) or nitrite (HR per 1 SD: 0.89; 95% CI: 0.77, 1.04). For oesophageal cancer (55 cases), there was no significant association with NDMA (HR per 1 SD: 1.13; 95% CI: 0.77–1.68) or nitrite (1.14 (0.84–1.54)). For gastric cancer (64 cases), there was no significant association with NDMA (HR per 1 SD: 1.13; 95% CI: 0.81–1.57) or nitrite (0.86 (0.63–1.19)). For lung cancer (235 cases), there was no significant association with NDMA (HR per 1 SD: 1.05; 95% CI: 0.88–1.24) or nitrite (0.97 (0.83–1.14)). For prostate cancer (461 cases), there was no significant association with NDMA (HR per 1 SD: 1.01; 95% CI: 0.90–1.13) or nitrite (0.90 (0.81, 1.01)). For breast cancer (432 cases), there was no significant association with NDMA (HR per 1 SD: 1.01; 95% CI: 0.84–1.20) or nitrite (1.08 (0.96, 1.22)). For ovarian cancer (80 cases), there was no significant association with NDMA (HR per 1 SD: 0.96; 95% CI: 0.60–1.53) or nitrite (0.79 (0.58, 1.07)). NDMA intake (as continuous variable) was associated with increased risk of ‘other cancers’ (HR per 1 SD of NDMA: 1.11; 95% CI: 1.03–1.19). The sites contributing most to this group were: malignant melanoma of skin, malignant neoplasms of bladder, corpus uteri, pancreas and kidney (except for renal pelvis) cancers. The ENOC index was not significantly associated with risk of the considered specific cancers. This is the only study so far looking at total cancer; a limitation is the small number of cases of some sites, notably oesophageal and gastric cancers.
Summary
Overall, the Panel considered that there was only one study that investigated the link between dietary N‐nitroso compounds (N‐nitrosodimethylamine), the ENOC index, and dietary nitrite and total cancer incidence and found no association.
3.6.9. Mode of Action for induction of methaemoglobinaemia by nitrite
Nitrite exposure may lead to increased methaemoglobin levels due to its ability to oxidise Fe2+ in haemoglobin into Fe3+. Methaemoglobinaemia is an adverse effect which can be life threatening due to under‐oxygenation of the tissues.
3.6.9.1. Key events
Haemoglobin, a component of the red blood cells, is a molecule consisting of four globin chain subunits which bind iron. The ferrous iron of haemoglobin reversibly binds O2, thus providing the tissues with O2. Oxidation of iron by nitrite switches it from the ferrous to the ferric state, and impedes its ability of haemoglobin to carry oxygen. In order for haemoglobin to function properly, oxidised ferric haem (Fe3+, methaemoglobin) must be reduced back to its non‐oxidised, ferrous (Fe2+) state (haemoglobin). Under normal physiologic conditions, methaemoglobin (MetHb) is reduced back to haemoglobin via cytochrome b5 reductase through an NADH‐dependent reaction. Hence, there is an equilibrium (homoeostasis) between the formation of methaemoglobin and the reduction back to haemoglobin. When either the formation is increased or the reduction is decreased, methaemoglobin levels will increase. Methaemoglobin is unable to reversibly bind oxygen.
3.6.9.2. Concordance of dose–response relationship
Methaemoglobin is a normal constituent of red blood cells of animals and man. Background levels of methaemoglobin in F344/N rats have been reported to be 0.043 ± 0.026 g/100 mL (mean ± SD) (NTP, 2001) and in humans 0.46 ± 0.21% (mean ± SD) of haemoglobin (corresponding to 0.062 ± 0.028 g/100 mL) (Kortboyer et al., 1997). In experimental animals, exposure to nitrite induced increased levels of methaemoglobin in blood. In a 90‐day study with F344/N rats, sodium nitrite concentrations of 0, 375, 750, 1,500, 3,000 or 5,000 mg/L in drinking water induced at week 14 dose‐dependently mean methaemoglobin concentrations in male of 0.03, 0.08, 0.12, 0.25, 0.71 and 3.38 g/100 mL and female rats of 0.06, 0.14, 0.16, 0.48, 0.99 and 2.27 g/100 mL (NTP, 2001; Appendix F). In other studies with different animal species or rat strains, methaemoglobinaemia was the most widely reported effect upon nitrite administration. Available human studies also confirmed that exposure to nitrite lead to the formation of methaemoglobin. In a study with nine healthy volunteers receiving two different mean oral doses of nitrite (160 and 310 mg/person) methaemoglobin concentration was increased from 3.4% to 4.5% and 7.7% to 10.9% at the two doses tested as compared to the baseline (Kortboyer et al., 1997). An increase in MetHb levels will occur when the capacity of cytochrome b5 reductase to reduce the level of MetHb to normal levels is exceeded. Reduction of MetHb back to Hb leads to considerable energy expenditure. Decreased levels of Hb could result in hypoxia of tissues and induces secretion of erythropoietin, stimulation of erythropoiesis and production of reticulocytes. Thus, an increase of MetHb concentration induced by nitrite could be considered an unwanted effect. In fact, a relative MetHb level in humans exceeding 20% of the haemoglobin (corresponding to 2.7 g/100 mL) will result in tissue hypoxia and hypoxia related adverse effects which are considered a clear indication of toxicity requiring acute treatment. (Edwards and Uymae, 1995)
3.6.9.3. Temporal Association
The key event, methaemoglobinaemia, is observed without a temporal delay; a clear temporal relationship exists between internal exposure to nitrite and increased blood methaemoglobin levels (see human kinetic studies, e.g. Kortboyer et al., 1997).
3.6.9.4. Strength, Consistency, and Specificity of Association of Toxicological Response with Key Events
There are no alternative pathways mechanistically linking the nitrites exposure with methaemoglobin levels besides oxidation of Fe2+ to Fe3+ in haemoglobin which is well established. However, it is plausible that changes in methaemoglobin levels are sensitive markers to nitrite exposure occurring at lower doses before other effects can be detected. A MetHb concentration which is exceeding the (mean/median) concentration to a certain extent, which takes into account the variability in the data, should be regarded as an indicator that the normal variation of MetHb concentration in the population is exceeded. This would indicate an influence of nitrite, which exceeded the regenerative capacity of NADH‐cytochrome b 5 methaemoglobin reductase.
3.6.9.5. Biological Plausibility and Coherence
There are demonstrable increases in methaemoglobin following nitrite exposure which occur at low levels and increase with increasing nitrite concentrations. There are some data showing increases following acute exposures in a dose dependent manner. There is less clear cut evidence from longer term studies. There are data on the adverse effects of persistent chronic increases of methaemoglobin levels in animals but limited evidence in humans. In contrast to higher acute increases which of themselves are adverse, some animal studies suggest that continuous increased levels of methaemoglobin in blood could indirectly lead to extramedullary haematopoiesis and decreased blood pressure.
3.6.9.6. Uncertainties, Inconsistencies and Data gaps
The induction of methaemoglobin formation following exposure to nitrites is well established. Clear dose responses have been reported in rats and mice exposed to nitrite and also in some human studies.
3.6.9.7. Assessment of mode of action
The Panel evaluated the plausibility and human relevance of the proposed mode of action using the criteria developed by Boobis et al. (2008). Changes in methaemoglobin levels reflect an exposure to nitrite and increases in methaemoglobin levels can become adverse when above background levels of 1–3% of total blood haemoglobin concentration (Goldsmith et al., 1976). An increase in methaemoglobin levels can be considered a sensitive endpoint (but potentially oversensitive) and a marker for other effects. While choosing a small increase in the methaemoglobin level following nitrite exposure would encompass levels that could still occur within the normal range, the net effect will be to move the inflection point of the dose response curve to the left which results in an increased factor to cover uncertainty.
The Panel used data from animals to derive the reference point to establish the ADI. In doing so, the Panel took into account that changes in methaemoglobin levels occur in animals and humans following nitrite exposure and that methaemoglobinaemia occurs in humans and animals following increases in nitrite plasma levels. The Panel thus considered methaemoglobin formation in rats of human relevance. Young infants (up to 4 months) are more sensitive than adults to methaemoglobinaemia because of the lower activity of the reduced level of cytochrome b5 reductase (60% of the adult) and the two fold higher affinity of fetal haemoglobin to form MetHb.
3.6.9.8. Specific susceptible population groups
Increased methaemoglobinaemia is reported to occur in patients with a genetic defect of cytochrome b5 reductase types 1 and 2 (Percy and Lappin, 2008; Lorenzo et al., 2011) and in patients with hereditary methaemoglobinaemia, an autosomal dominant disorder caused by mutations in the globin chains, called haemoglobin M (Hb M) disease with at least 10 known mutations, occurring in either the a, b, or g globin genes (Marks et al., 2013). Neonates and infants have a reduced level of cytochrome b5 reductase (about 50–60% of the adult level) (Ross, 1963; Bartos and Desforges, 1966). Due to different properties of fetal globin chains (compared to adult globin chains), when fetal haemoglobin is exposed to oxidising agents in vitro, not only nitrites, there is a higher (about twofold) formation of methaemoglobin (Wind and Stern, 1977).
3.7. Discussion
Curing of meat and poultry is one of the oldest forms of food preservation (Sindelar and Milkowski, 2012). Sodium and potassium salts of nitrite are commonly used in curing mixtures to develop and fix the colour of meat, to inhibit microbial growth and/or to develop characteristics flavours (IARC, 2010; Sindelar and Milkowski, 2012). Information located on the stability of nitrite in food, in terms of changes in the levels of nitrite over time, relates mainly to nitrite in vegetables, rather than to the amounts resulting from addition to meat products. However, the high chemical reactivity of nitrite with food components and that of its intermediate active species suggests that initial concentrations of nitrite in food would diminish over time.
Sodium and potassium nitrite are dissociated into their respective sodium/potassium and nitrite ions. The sodium and potassium ions are expected to enter normal homoeostatic processes and are not expected to impact on the toxicity of the nitrite salts.
The studies on toxicokinetics of sodium nitrite in animals and humans showed that the substance was absorbed to a great extent (nearly 100%) and did not undergo first pass metabolism (Hunault et al., 2009).
In humans, the volume of distribution was larger than the body water indicating that nitrites were distributed at higher concentrations in some tissues compared with the blood. Nearly, all of nitrite was converted to nitrate, which then was excreted in the urine. Further metabolites of nitrite were nitric oxide (NO) and reactive oxygen species which were also formed during the conversion of nitrite to minor metabolites. Small amounts of nitrite were found in the urine (0.02% of a the administered dose).
In humans, the most important source of nitrite arises from the consumption of food and water containing nitrate and its conversion to nitrite in saliva by oral nitrate‐reducing bacteria (Witter and Balish, 1979; JECFA, 2003a). This conversion of nitrate to nitrite was estimated to range from 5% to 36% (Wagner et al., 1983; Bartholomew and Hill, 1984; Spiegelhalder et al., 1976; Bos et al., 1988; Granli et al., 1989; Shapiro et al., 1991; Jin et al., 2013; Bondonno et al., 2015; Woessner et al., 2016; Hohensin et al., 2016, Montenegro et al., 2017).
The available studies provided clear evidence of the genotoxic activity of sodium and potassium nitrite in vitro, with positive results in tests for gene mutations in bacteria and in tests for the induction of structural chromosomal aberrations, gene mutations, aneuploidy and cell transformation in mammalian cells. In vivo, negative results were obtained in well‐performed micronucleus assays in mice and rats, with measurable systemic exposure, after acute and subchronic administration of sodium nitrite. Limited negative data were also available at the site of contact.
Overall, the Panel concluded that the available information did not indicate an in vivo genotoxic potential for sodium and potassium nitrite, and thus did not preclude the possibility to establish a health‐based guidance value (ADI).
Acute toxicity effects of sodium and potassium nitrite included relaxation of smooth muscle, vasodilation, and consequently, lowering of blood pressure and methaemoglobinaemia. The oral LD50 in experimental animals was in the range of 100–220 mg/kg bw. In humans, oral lethal nitrite doses have been reported to be in the same order of magnitude as in animals, however in a wider range, likely due to wide variabilities in individual sensitivity (Health Canada, 2013).
Short‐term, subchronic and chronic toxicity studies in rats and mice using sodium and potassium nitrite primarily confirmed that the main observed effect is the formation of methaemoglobin. Methaemoglobin prevents normal oxygen delivery to the tissues, thus high concentrations of methaemoglobin can cause tissue hypoxia (Mensinga et al., 2003). The normal background concentration of methaemoglobin is 1–3% of total blood haemoglobin concentration (Goldsmith et al., 1976). Clinical signs of methaemoglobinaemia (methaemoglobin > 20%) are cyanosis and symptoms of hypoxia, such as lethargy, dyspnoea, headache and tachycardia. Methaemoglobin concentrations > 50% can cause major tissue hypoxia and may be fatal (Mensinga et al., 2003).
Additional effects reported during exposure to sodium nitrite were increased erythropoietic activity, such as splenic extramedullary haematopoiesis in mice (Boink et al., 1995; 1999; Til, 1997), and changes in haematological parameters such as haemoglobin, mean cell volume and mean cell haemoglobin and reticulocyte count in rats (NTP, 2001); these effects were considered by the Panel to be secondary to the formation of methaemoglobin and to a reduced capacity to transport oxygen to tissues (Boink et al., 1995, 1999; JECFA, 2003c). Other reported effects were reduced blood pressure during the activity phase of rats but not during the resting phase (Vleeming et al., 1997); lymphocyte infiltrations with purulent bronchial exudates and sometimes interstitial round cells and fibrosis as well as, intramural coronary arteries in rats with thin and dilated intramural coronary arteries reported as having ‘some degree of thickening’ (Shuval and Gruener, 1972); decreased arterial blood pressure in humans (Hunault et al., 2009) related to NO metabolite production (Gladwin et al., 2000; Gladwin and Kim‐Shapiro, 2008; Gladwin et al., 2005; Webb et al., 2008); vasodilation effects in humans (Ingram et al., 2010). Additionally, IARC (2010) reported on some epidemiological studies that were inconclusive with regards to an association between exposure to nitrite and type I diabetes mellitus.
Overall, none of those additional effects could be considered as a basis on which to establish an ADI due to the lack of precise details on the exact doses tested, the lack of precise classification of lesions reported, of a plausible mechanism of action, too large dose‐spacing (sometimes 10 times apart) and the lack of full dose relationships.
Available carcinogenicity studies in mice and rats, generally meeting present requirements for toxicity testing, did not show evidence of carcinogenic potential for sodium nitrite. One long‐term study in mice showed a positive trend in the incidence of squamous cell papilloma and carcinoma (combined) of the forestomach and alveolar/bronchiolar adenoma or carcinoma (combined) in female mice. However, no statistically significant difference was reported in the incidence of these tumours and histopathological examination of the lesions showed a focal invasion of the squamous epithelium into the lamina propria with no infiltration of neoplastic cells through neither the serosa of the forestomach nor any sign of metastasis (NTP, 2001). In a 2‐year water drinking study in rats, no treatment‐related increase in tumours of any tissue examined up to a dose of 125 mg/kg bw per day was reported (Maekawa et al., 1982).
No reproductive toxicity was observed in the RACB study in mice up to 437 mg sodium nitrite/kg bw per day for males and 412 mg sodium nitrite/kg bw per day for females (NTP, 1990). In a 14‐week study, sperm abnormalities were observed in mice at 345 mg sodium nitrite/kg bw per day (NTP, 2001). Developmental toxicity was tested in mice, rats and hamsters at doses up to 23, 10 and 23 mg sodium nitrite/kg bw per day (FDA, 1972a) and up to 32, 10 and 32 mg potassium nitrite/kg bw per day (FDA, 1972b). Only a slight effect (skeletal retardation) was observed at the high dose in rats treated with sodium and potassium nitrite.
Overall, the Panel considered that an ADI for nitrite per se could be derived from the available repeated dose toxicity studies in animals, based on the fact that negative carcinogenicity results in mice and rats were consistently obtained in studies meeting actual requirements for carcinogenicity testing.
The current ADIs for sodium and potassium nitrite (expressed as nitrite ion) established by JECFA (2002) and the SCF (1997) are close, at 0–0.07 and 0–0.06 mg/kg bw per day, respectively.
The SCF derived an ADI based on hypertrophy of the adrenal zona glomerulosa reported by Til et al. (1988, 1997) in subchronic studies in the most sensitive rat strain and applying a safety factor of 100. The Panel considered, as JECFA (2003b), that these effects observed by Til et al. reflected a physiological adaptation induced by nitrite exposure, rather than a direct effect of nitrite on the adrenal glands. Therefore, these results could not be used to identify a reference point to derive an ADI. Furthermore, only the high‐dose‐treated animals (270 mg potassium nitrite/kg bw day and 219 mg sodium nitrite/kg bw per day) showed a statistically significant increase in hypertrophy of the zona glomerulosa. The Panel noted that at the high doses methaemoglobin levels were also increased (4.6 times as compared to the control in females, Til et al., 1988).
JECFA derived an ADI apparently from effects on the heart and lungs observed in a 2‐year study in rats (Shuval and Gruener, 1972; Gruener and Shuval, 1973; study summarised in Shuval and Gruener, 1972). The Panel noted that the Shuval and Gruener (1972) study was considered by the authors as a pretest for a ‘full scale chronic toxicity experiment’. The Panel could not identify the full‐scale experiment in the available literature and therefore only commented on the available publication. From the Shuval and Gruener publication, the main pathological findings appeared in the lungs and heart of experimental rats exposed to sodium nitrite. Similar changes were also reported in control animals but with less frequency, although the publication did not show the statistical analysis conducted. The Panel considered that more precise distinction in the severities of the lesions between controls and treated animals was important to appreciate the relevance of these findings, but no clear information on the lesion severities was presented. Overall, the Panel considered that due to the lack of precise details and of a possible mechanism for toxicity related to oral sodium nitrite exposure, the available results of the Shuval and Gruener (1972) study could not be used for risk assessment.
The Panel noted that methaemoglobinaemia was the most common effect observed across experimental studies in animals, including those performed by NTP (2001), and its effect in humans, notably in infants (one of the most sensitive populations), due to the presence of nitrate in drinking water. Infant methaemoglobinaemia risk has been used as the basis of drinking water guideline values set by the WHO (2011) and the US EPA (1997).
Methaemoglobin can be increased in animals upon exposure to sodium or potassium nitrites. Human studies reviewed in this opinion also confirmed that exposure to nitrite can lead to the formation of methaemoglobin (Kortboyer et al., 1997; Chui et al., 2005; Bryk et al., 2007; Hunault et al., 2009; Harvey et al., 2010). As pointed out earlier, endogenously formed NO, which plays a role in several physiological regulatory pathways, is another source for the formation of methaemoglobin physiologically present in the blood. The Panel considered elevated methaemoglobinaemia, indicating formation of methaemoglobin not compensated by the activity of cytochrome b5 reductase (which converts methaemoglobin back to haemoglobin), as a relevant effect for the derivation of a health‐based guidance value by the BMD approach.
From several animal studies reporting on methaemoglobin formation (Shuval and Gruener, 1972; Til et al., 1985a,b, 1990; Til and Kuper, 1995; NTP 2001), the Panel selected the subchronic NTP study (2001) in rats as a key study because five doses had methaemoglobin levels higher than the control. In the other studies, only one of the doses had effect levels higher than the control, which rendered them unsuitable for the derivation of a health‐based guidance value. The Panel decided to identify a benchmark dose modelling lower confidence limit (BMDL) as the reference point to derive a health‐based guidance level for nitrites as food additives from the 2001 NTP study in rats.
The Panel considered that the preset default benchmark response (BMR) value for continuous data of 5% (EFSA Scientific Committee, 2017) would be fully within the normal physiological range for nitrite in the blood in the rat study and would thus not be biologically relevant. On the other hand, an increase in methaemoglobin of two fold of the mean background concentration of MetHb (0.06 vs 0.03 g/100 mL) calculated based on within‐group variation would indicate disturbance of the steady state, whereas its effect size would still not be considered overtly adverse to health. Hence, the Panel used the experimental data and their biological variability to derive a BMR implying a doubling of the concentration as compared to the mean background concentration, considering a procedure proposed by Slob (2016) (Appendix F). A normal distribution for measures of methaemoglobin in blood can be assumed based on the fact that standard errors are independently and identically distributed.
In the NTP study (2001), five dose groups with 10 animals per sex were treated at doses between 30 and 345 mg/kg bw per day. Methaemoglobin levels were measured at day 5, day 19 and week 14. BDM was performed for every time point. Only the data from week 14 resulted in acceptable modelling. BMD identified a lower bound (BMDL) of 9.63 mg/kg bw per day for males and 14.62 mg/kg bw per day for females (Appendix F).
Using the lowest BMDL of 9.63 mg/kg bw per day for males, and applying the default factor of 100, an ADI of 0.1 mg sodium nitrite/kg bw per day was calculated by the Panel, corresponding to 0.07 mg nitrite ion/kg bw per day. The Panel considered that there was no need to add a factor of 2 to the default factor of 100 for extrapolation from the subchronic to chronic study, because methaemoglobinaemia at similar levels was also the only observed effect in the 2‐year chronic rat study.
As noted previously while high levels of methaemoglobin are directly adverse, lower levels should be regarded as either precursors of such direct adversity or as markers of exposure which increase prior to clinical manifestation of adverse effects. The use of more sensitive markers as a basis for determining a reference point which ensures adversity does not occur is a long established approach (e.g. preneoplastic lesions) which is more protective than using adversity per se.
The Panel noted that there was considerable individual variation in methaemoglobin levels in the population as a whole. In choosing the magnitude of the increase in methaemoglobin level that should be used as the BMR, for deriving the reference point using the BMD approach, the Panel had to consider also the magnitude of the margin of exposure that would be derived for the potential nitrosamine formation from different levels of nitrite (using default assumptions on conversion rates).
In weighting the choices, the Panel concluded that greater weight should be given to ensuring that the estimated MoE for nitrosamine formation should be greater than 10,000 rather than observation of adversity due to methaemoglobinaemia. Based on both these considerations, the Panel decided that an increase of twofold of the background mean concentration of MetHb level represented a measurable and consistent marker of exposure that was not associated with adversity and which resulted in a MoE larger than 10,000.
The Panel noted that the NOAELs identified in reproduction and developmental toxicity studies were higher than the BMDL related to the methaemoglobin end‐point, and therefore, the Panel considered that reproductive toxicity would be covered by the methaemoglobin‐derived BMDL.
Intravenous administration of sodium nitrite to human volunteers decreased the median arterial blood pressure and increased heart rate, as a compensatory mechanism (Hunault et al., 2009), presumably through the regulation of intravascular NO derived from nitrite, as suggested previously (Gladwin et al., 2000, 2005; Gladwin and Kim‐Shapiro, 2008; Webb et al., 2008; Ingram et al., 2010). However, the Panel did not consider these studies for the derivation of an ADI, since in addition to intravenous administration, the doses tested and the variability in the data did not allow reliable dose responses to be established.
Potential carcinogenicity of nitrate and nitrite in humans has been extensively reviewed by IARC (2010), and the epidemiological studies discussed in the IARC report have therefore not been discussed in this opinion. The interested reader is invited to consult the IARC report for details of all these studies. The overall conclusions of the Panel are based on the IARC evaluation of the epidemiological studies on nitrate, nitrite and cancer published until 2006 (IARC, 2010) and on the evaluation of epidemiological studies published subsequently.
The summary evidence for human cancer from these studies was categorised as follows: (a) there was no evidence for an association, if studies indicate no association with a specific cancer; (b) there was insufficient evidence, to link to a cancer (e.g. few studies, contradictory results); (c) there was some evidence, for an association with a specific cancer (e.g. inconsistent results between cohort and case–control studies); and (d) there was evidence, for an association with a specific cancer (e.g. consistent results from cohort and case–control studies).
The Panel concluded that there was no evidence for a positive association between estimated ingested nitrite and prostate cancer.
There was insufficient evidence for a positive association between: dietary nitrite and preformed N‐nitrosodimethylamine (NDMA) and oesophageal squamous cell carcinomas (ESCC); dietary nitrite and breast cancer; dietary preformed NDMA and non‐cardia adenocarcinoma (GNCA); nitrite and preformed nitroso compounds (NOCs) from processed meat and pancreatic cancer; dietary nitrite and preformed NDMA/NOC and lung cancer; dietary nitrite and non‐Hodgkin lymphoma (NHL); dietary nitrite and ovarian cancer; dietary nitrite and preformed NDMA/NOC and bladder cancer; dietary nitrite and thyroid cancer; dietary nitrite and preformed NDMA and adult glioma; nitrite from processed meat and childhood brain tumours; nitrite from processed meat and renal cell cancer; and nitrite from meat and advanced prostate cancer.
There was some evidence for a positive association between: dietary nitrite and gastric cancer or its subtypes gastric cardia adenocarcinoma (GCA) and gastric non‐cardia adenocarcinoma (GNCA); and the combination of nitrite plus nitrate from processed meat and colorectal cancer or subtypes (colon or rectum) cancer.
There was evidence for a positive association between preformed NDMA and increased risk of colorectal cancer (CRC) or its subtypes.
The findings on oesophageal, colorectal, lung, NHL and thyroid cancer are relatively new and still based on few cohort studies; more epidemiological studies are needed to confirm these findings.
There were insufficient data to draw conclusions on: nitrite, preformed NDMA and head–neck cancer (HNC); nitrite, preformed NDMA and liver cancer; and nitrite, preformed NDMA and leukaemia.
In conclusion, there was evidence that the intake of preformed NDMA was associated with increased risk of colorectal cancer (CRC) or its subtypes and, there was some evidence to link the combination of nitrate plus nitrite from processed meat to colon cancer, and nitrite to gastric cancer. This is in line with the conclusion from the IARC Monograph 114 Meeting on red and processed meat in 2015, where it was concluded that ‘there is sufficient evidence in human beings for the carcinogenicity of consumption of processed meat’ (Bouvard et al., 2015). These findings could be possibly explained by the presence of preformed NOCs in processed meat, possibly due to the addition of nitrite. The Panel recommended that further large‐scale prospective studies be carried out on NDMA, nitrite and nitrate intake and risk of CRC and its subtypes, as well as on nitrite and gastric cancer subtypes. There is insufficient evidence for a positive association between nitrite alone in processed meat and other types of cancer.
The Panel noted that nitrites (E 249 and E 250) are authorised to be used in a wide range of foods and it is therefore not expected that brand loyalty will result in higher exposure in the general population. The Panel therefore selected the refined non‐brand loyal scenario as the most relevant exposure scenario for the safety evaluation of this food additive.
From its refined estimated exposure scenario, considering concentration levels not exceeding the MPLs for food categories listed under Annex II to Regulation No 1333/2008, in the non‐brand‐loyal scenario, mean exposure to nitrites (expressed as nitrite ion) from their use as food additives (E 249 and E 250) ranged from < 0.01 mg/kg bw per day in infants, children, adolescents and the elderly to 0.03 mg/kg bw per day in toddlers. The 95th percentile of exposure to nitrites (expressed as nitrite ion) from their use as food additives (E 249 and E 250) ranged from < 0.01 mg/kg bw per day in infants to 0.08 mg/kg bw per day in children.
From all exposure scenarios considered for exposure assessment of nitrites (expressed as nitrite ion) from their use as food additives (E 249 and E 250), the most important contributors to the total mean exposure for all population groups were sausages and preserved meat, while pastes, pâtés and terrines and meat specialities contributed less.
From the exposure scenario considering the exposure to nitrites (expressed as nitrite ion) from all sources (food additives, natural presence and contamination), mean exposure ranged from 0.03 mg/kg bw per day in adults and the elderly to 0.15 mg/kg bw per day in toddlers. The high exposure to nitrites ranged from 0.05 mg/kg bw per day in adults and the elderly to 0.2 mg/kg bw per day in children.
The main contributing food categories from the exposure scenario considering all sources (food additives, natural presence and contamination across surveys and population groups, range min–max) were composite food (0–28%), fruit and fruit products (8–34%), poultry (2–29%), livestock meat (1–26%) and cheese (1–24%). In infants, also foods for infants and toddlers (2–31%) made an important contribution to the total mean exposure to nitrites from all sources.
The Panel noted that in all population groups, apart from infants, sausages and preserved meat, which were food categories considered to contain nitrites (E 249 and E 250) as food additives, were also important contributors to the total mean exposure to nitrites from all sources. Sausages contributed up to 23.6% (in adults) and preserved meat up to 15.2% (in the elderly) to the total mean exposure to nitrites from all sources.
The Panel estimated that, when comparing all sources (food additives, natural presence and contamination), using the same refined exposure methodology (non‐brand‐loyal consumer scenario for general population), the contribution of nitrites (E 249 and E 250) from their use as food additives represented approximately 17% (range 1.5–36.0%) of the overall exposure to nitrites.
Overall, the Panel considered that the uncertainties identified would, in general, result in an overestimation of the exposure to nitrites (E 249 and E 250) as a food additive in European countries for the regulatory maximum level exposure scenario and for the refined scenario considering that it was not possible to include a number of restrictions.
The Panel noted that if all sources of dietary nitrite exposure were considered the ADI would be exceeded for infants, toddlers and children at the mean and for all age groups at the highest exposure.
However, the exposure to nitrite resulting from its use as a food additive alone did not lead to an exceedance of the ADI (0.07 mg/kg bw per day as nitrite ion) for the general population except for a slight exceedance in the case of children at the highest percentile in accordance with the refined estimated exposure scenario (non‐brand loyal scenario).
As pointed out in Section 3.2, lower maximum levels for nitrites (E 249 and E 250) were used in Denmark.[1] For this reason, the Panel carried out an ad hoc analysis on the analytical results from this country. On average, the limited number of products sampled in Denmark contained lower levels of nitrites (E 249 and E 250) than those from the other countries. Concerning the analytical results reported from Denmark for the food categories in which the use of nitrites (E 249 and E 250) was authorised, for non‐heat‐treated processed meat (FCS 08.3.1), the mean middle bound value reported by Denmark was 6.5 mg/kg (n = 10) and the reported mean value for the other EU MS (excluding Denmark) was 11.3 mg/kg (n = 633). For heat‐treated processed meat (FCS 08.3.2), the mean middle bound value reported by Denmark was 5.6 mg/kg (n = 36) and the reported mean value for the other EU MS (excluding Denmark) was 11.6 mg/kg (n = 454). For traditional cured products (FCS 08.3.4), the mean middle bound value reported by Denmark was 11.1 mg/kg (n = 63) and the reported mean value for the other EU MS (excluding Denmark) was 15.7 mg/kg (n = 2,543). The Panel decided not to carry out an ad hoc exposure scenarios for this country. It was therefore expected that the exposure estimates for nitrites (E 249 and E 250) under the regulatory maximum level scenario were overestimated in the case of Denmark. On the other hand, the use of analytical results from a country applying lower maximum levels than the EU legislation could result in an underestimation of the estimates under the refined exposure assessment scenario for all other countries. However, this underestimation was expected to be negligible considering the limited number of analytical results available from Denmark with respect to those from other EU countries. In addition, analytical results reported from EU countries other than Demark were, on average, as well below the limits applied in that country.
The Panel noted usage levels exceeding the legal limit have been reported by industry for non‐heat‐treated processed meat within the ad hoc survey commissioned by DG SANTE (see Section 3.3.1). Analytical results above the MPL have been, as well, identified in the occurrence data reported to EFSA by Member States. The fact that only data within the legal limits have been used in the exposure assessments presented in this opinion could therefore had led to an underestimation of exposure. However, this was expected to be minor considering the limited number of samples exceeding the MPL (approximately 0.2%).
3.7.1. N‐Nitroso compounds
Scarcely available animal studies intended to reproduce in vivo conditions considered propitious to the induction of NOCs, and thus promote tumour formation, have failed to demonstrate increased cancer risk under experimental conditions (Maekawa et al., 1982; Furukawa et al., 2000; Okazaki et al., 2006; Davis et al., 2012).
Of the several hundred NOCs identified chemically only a few are likely to be found in food and most of these belong to the nitrosamine type. Concerning the endogenous NOCs (ENOCs) formation, as pointed out by JECFA (1996), several factors such as the variety of nitrosating agents and nitrosation pathways, as well as their inherent instability combined with their variable availability and that of nitrosable compounds present in the diet, enormously complicates drawing an acceptable predictable picture of NOCs formation following nitrite intake under normal dietary conditions. Furthermore, kinetics studies on in vivo nitrosation, using the NPRO test, have suggested that individuals vary widely in their capacity to form NPRO even when kept on a standard diet, in part due to interindividual differences in oral nitrite reduction (Janzowski and Eisenbrand, 1995).
However, the Panel is also conscious of the need to manage the potential presence of exogenously formed NOCs in foods following the use of nitrite as a food additive. The Panel proposes to manage this important aspect by applying the MoE approach. The underlying basis for this proposal is that in the Opinion of the Scientific Committee of EFSA on the risk assessment of substances both genotoxic and carcinogenic (EFSA, 2005; EFSA Scientific Committee, 2012b), one of the most difficult issues in food safety is to advise on potential risk to human health when substances that are both carcinogenic and genotoxic are present in food and their presence cannot be readily eliminated or avoided. Those undesirable substances occur in food (e.g. as an inherent natural constituent in the food or as contaminant through their presence in the environment, through fungal contamination or through preparation process). Therefore, the Panel considered that the prerequired conditions to apply MoE approach are met to the specific assessment of undesirable NOCs substances, which are both carcinogenic and genotoxic, and cannot be readily eliminated or avoided during the shrine preparation process of meats.
3.7.2. Endogenously produced N‐nitroso compounds (ENOCs)
Because common NOCs found in foods are considered genotoxic and are reasonably anticipated to be human carcinogens (NTP, 2011), previous risk assessments have considered that nitrite ingestion leading to the formation of ENOCs is probably carcinogenic to humans (SCF, 1997; IARC, 2010). However, the underlying concept within this consideration is that if no formation of ENOCs occurs then nitrite ingestion would not be carcinogenic to humans. Thus, formation of ENOCs is a key step when considering the carcinogenic risk of nitrite.
The Panel took those considerations into account and tried to quantify the formation of ENOCs after intake of nitrite at the level of the proposed ADI for nitrite (0.07 mg/kg bw per day nitrite ion).
Several lines of evidence exist which make it plausible that exposure to ingested nitrite and nitrate is a factor in nitrosation. In the Guideline for Canadian Drinking Water Quality, it is mentioned that quantitative endogenous nitrosamine formation is dependent on mainly three variables: the amount of nitrite ingested or formed from nitrate; the amount of nitrosable substances ingested; and the rate of in vivo nitrosation. Although there was no experimental proof that in vivo carcinogenic ENOCs are produced from exposure to nitrite in normal diet conditions, at present, there are two approaches to quantifying the potential amounts of ENOCs that could be formed from intake of nitrite. Using these results, a MoE was determined (Zeilmaker et al., 2010) and a cancer risk estimation was derived (Health Canada, 2013).
Zeilmaker et al. (2010) simulated the formation of NDMA in an in vitro model of the GI tract after a meal containing fish plus vegetables (as a source of nitrosable amines and nitrite/nitrate, respectively). Using the results in this model combined with statistical modelling on consumption data in the Dutch population, the long‐term exposure to endogenously formed NDMA in the 95th percentile population was estimated at around 4 ng/kg bw per day in young children and 0.4 ng/kg bw per day in adults. Combining this exposure with a benchmark dose lower bound 10 (BMDL10) relationship applying the linearised multistage model to liver cancer incidence data in rats (Peto et al., 1991a,b), the lowest BMDL10 being 0.029 mg/kg bw per day, a MoE was calculated at 7,000 for young children and 73,000 for adults.
The Guideline for Canadian Drinking Water Quality used a simple mathematical model to estimate the amounts of nitrosamines endogenously formed after the intake of drinking water with nitrate concentrations (Health Canada, 2013). The Panel decided to apply the model described in the Canadian guideline to estimate the amounts of nitrosamines endogenously formed after nitrite intake at the level of the nitrite ADI (0.07 mg/kg bw per day equal to 0.0015 mmol/kg bw per day of nitrite ion).
Estimation of gastric nitrite concentration was performed in analogy to formula [2] in the Guideline for Canadian Drinking Water Quality: Nitrate and Nitrite Guideline Technical Document, 2013.
[NO2 −] = NO2 − ADI mmol/kg bw × body weight/V s
where [NO2 −] is the concentration of NO2 − in the stomach, body weight is the default body weight for the adult population is 70 kg and V s is the volume of the stomach is assumed to be 0.5 L for the region relevant for nitrosation.
[NO2 −] = 0.0015 mmol/kg bw per day × 70 kg/0.5 L = 0.21 mmol/L per day= 2.1 × 10⁻⁴ mol/L per day
The Panel used the estimated daily intake of the precursor amine dimethylamine (DMA) for the formation of NDMA presented in the Guideline for Canadian Drinking Water Quality (2010) which is
1.91 × 10⁻⁴ moles per day and the empirically derived equation [1] from the same guideline:
DDnitros = ([NO2 −]2 × DIDMA × K am × 3600 × MWnitros)/body weight
where DDnitros is the daily dose of a specific nitrosamine (mg/kg bw per day); [NO2 −] is the concentration of NO2 − in the stomach of 2.1 × 10⁻⁴ mol/L per day (see above); DIDMA is the estimated daily intake of the precursor amine DMA in moles per day; K am is the nitrosability rate constant of 0.002 ((mol/L)−2 · s−1); 3,600 is an estimation of the time during which the concentrations of amine and nitrite precursors would remain constant through the oesophageal/cardia region, measured in sec; MW is molecular weight of the specific nitrosamine (mg/mol), 74 × 103 for NDMA; and the body weight 70 kg.
DDNDMA = [2.1 × 10⁻⁴]2 × 1.91 × 10−4 × 0.002 × 3600 × 74 × 103/70 = 0.64 × 10⁻⁷ mg/kg bw per day.
In this assessment, the Panel decided to apply the MoE approach (EFSA, 2005; EFSA Scientific Committee, 2012b) for assessing the ENOCs. The Panel selected NDMA as a representative ENOC as it occurs in mixtures and is high in the carcinogenic potency ranking provided by the Opinion on Nitrosamines and Secondary Amines in Cosmetic Products of the Scientific Committee on Consumer Safety (SCCS, 2011) with a BMDL10 of 0.027 mg/kg bw per day; only NDEA has a slightly lower BMDL10 of 0.018 mg/kg bw per day and other considered NOCs had higher BMDLs. Assuming that all NOCs produced when adding nitrite would be NDMA is thus an appropriate approach.
The MoE is 4.2 × 10⁵ (0.027 mg/kg bw per day/0.64 × 10−7 mg/kg bw per day).
This is roughly 40‐fold higher than the value of 10,000 for which the Opinion of the Scientific Committee for substances which are both genotoxic and carcinogenic (EFSA, 2005; EFSA Scientific Committee, 2012b) considered as low concern.
The Panel noted that the basis for this calculation encompassed a number of conservative assumptions particularly the availability of sufficient amounts of nitrosable substrates and that all of the nitrite reacted with only these substrates to produce only carcinogenic ENOCs.
It was not possible to calculate the endogenous exposure to nitrosamides due to lack of sufficient information. However, the Panel noted that only trace amounts of methylnitrosourea or alkali‐labile methylating agents were formed from cured meat nitrosated in simulated gastric juice (Mende et al., 1991), suggesting that the contribution of nitrosamides to the overall exposure to ENOCs was small, if any.
3.7.3. N‐nitroso compounds (NOCs) present in meat products
Studies in raw cooked sausages in which all conditions were held constant and only the amount of nitrites has been changed showed some relationship between nitrite added and the increased formation of some non‐volatiles nitrosamines (NHPRO, NPRO, NTCA and NMTCA). These NOCs are considered of low concern based on the data available and/or structure‐activity considerations (see Section 3.6.4.3).
The levels of volatile nitrosamines (NDMA and NPYR) were practically not affected, remaining at LOQ or lower (2 μg/kg). The Panel noted that further thermal treatment of the meat sausages (cooking, frying and baking) could lead to an increase in the volatile nitrosamine NPIP and in the non‐volatile NMTCA. When temperatures below 70°C are applied during processing of meat products, the effect of ingoing amounts of nitrite on the levels of volatile amines is low. Heating steps in the elaboration of raw cooked products, could result in an increase in the volatile nitrosamine NDMA, at high temperatures (> 120°C) and amounts of nitrite > 120 mg/kg. The Panel noted that the increase in nitrite has a little impact in the amount of NDMA. In the case of NPIP, neither the temperature nor the amount of nitrite added had any effect on its formation. However, NPYR was detected in cooked products processed at 220°C.
The incorporation of antioxidants such as ascorbic acid, ascorbyl palmitate or erythorbic acid in the formulation of meat products can reduce the levels of nitrosamines except for the volatile nitrosamines NSAR, NDMA, NPYR and NPIP.
The presence of biogenic amines, particularly cadaverine and spermine in raw meat of low quality, mainly due to bacterial growth, has an impact on nitrosamine formation increasing the levels of NPIP. Some amino acids, such as proline, act as precursor of NPYR having a significant influence in its formation.
In raw cured fermented meat products, the formation of nitrosamines occur mainly at the beginning before fermentation and low amounts of the initially added nitrite is left. The Panel noted that the decrease in nitrite levels may be also due to other factors such as the presence of antioxidants or smoking of foodstuffs. Piperidine has a clear impact in the formation of NPIP. The Panel noted that black or white pepper are commonly used as an ingredient in the formulation of raw cured fermented products, and therefore NPIP is also present.
Based on the results of the systematic review conducted to assess the relationship between nitrite added to meat products and the formation of the volatile NDMA and NDEA (which are of highest toxicological concern), the Panel concluded that it was not possible to clearly discern these NOCs produced from the nitrite added at the legal limits, from those produced already at the food matrix where nitrite has not been added.
Therefore, the Panel used the overall exposure figures to nitrosamines to estimate the margin of exposure although it does not relate only to the use of nitrite as food additive.
The Panel used the estimated exposure figures for individual NDMA and NDEA (and the sum of NDMA + NDEA) reported in Table 11 (Section 3.5) to estimate the long‐term risks related to chronic dietary exposure of nitrosamines in processed food. The Panel considered that, based on occurrence data and in view of the highest carcinogenic potency, these N‐nitrosamines would cover adequately the overall risk presented by NOCs in processed food.
These estimates of the exposure were calculated by combining the mean weighted contents of processed meat products from all publications, as described in Table 4 (Section 3.1.5) with chronic consumption data for consumers only of processed meat products (FCS 8.3.1) from the EFSA Comprehensive European Food Consumption Database.
The analysis results for processed meat products reported in the publications did not show major differences in the levels of NDMA + NDEA between the different products analysed; therefore, the Panel decided to calculate estimates for consumers only of processed meat products using the same FoodEx categories considered in the assessment of exposure to nitrites as a food additive.
According to the indication of the EFSA Scientific Committee, a MoE approach (EFSA, 2005; EFSA Scientific Committee, 2012b) was used also to evaluate the risk of exogenously formed nitrosamines, which are present as undesirable by‐products in processed food.
The range of figures of MoE for NDMA, NDEA and for the sum NDMA + NDEA in the various age classes, resulting from the estimated exposure figures, is given below (Tables 13,14 and 15).
Table 13.
Dietary exposure to volatile nitrosamines (NDMA, expressed in ng/kg bw per day) from processed meat with estimation of MoE* , a
| NDMA | Infants (12 weeks–11 months) | Toddlers (12–35 months) | Children (3–9 years) | Adolescents (10–17 years) | Adults (18–64 years) | The elderly (≥ 65 years) |
|---|---|---|---|---|---|---|
| Mean exposure | 0.2–1.1 | 0.9–2.6 | 0.2–2.0 | 0.3–1.6 | 0.5–1.3 | 0.4–0.9 |
| MoE | 24,500–135,000 | 10,400–30,000 | 13,500–135,000 | 16,900–90,000 | 20,800–54,000 | 30,000–67,500 |
| High level exposure | 0.4–4.4 | 3.8–6.2 | 1.2–5.5 | 1.1–4.7 | 1.4–3.8 | 1.1–2.3 |
| MoE | 6,100–67,500 | 4400–7,100 | 4,900–22,500 | 5,700–24,500 | 7,100–19,300 | 11,700–24,500 |
* Based on a BMDL10 of 0.027 mg/kg bw for NDEA.
Table 14.
Dietary exposure to volatile nitrosamines (NDEA, expressed in ng/kg bw per day) from processed meat with estimation of MoE* , a
| NDEA | Infants (12 weeks–11 months) | Toddlers (12–35 months) | Children (3–9 years) | Adolescents (10–17 years) | Adults (18–64 years) | The elderly (≥ 65 years) |
|---|---|---|---|---|---|---|
| Mean exposure | 0.03–0.2 | 0.2–0.4 | 0.05–0.3 | 0.05–0.3 | 0.1–0.2 | 0.1–0.2 |
| MoE | 90,000–600,000 | 45,000–90,000 | 60,000–360,000 | 60,000–360,000 | 90,000–180,000 | 90,000–180,000 |
| High level exposure | 0.3–0.7 | 0.6–1.0 | 0.2–0.9 | 0.2–0.8 | 0.2–0.6 | 0.2–0.4 |
| MoE | 25,700–60,000 | 18,000–30,000 | 20,000–90,000 | 22,500–90,000 | 30,000–90,000 | 45,000–90,000 |
* Based on a BMDL10 of 0.018 mg/kg bw for NDEA).
Table 15.
Dietary exposure to volatile nitrosamines (NDMA + NDEA, expressed in ng/kg bw per day) from processed meat with estimation of MoE* , a
| NDMA + NDEA | Infants (12 weeks–11 months) | Toddlers (12–35 months) | Children (3–9 years) | Adolescents (10–17 years) | Adults (18–64 years) | The elderly (≥ 65 years) |
|---|---|---|---|---|---|---|
| Mean exposure | 0.2–1.4 | 1.2–3.5 | 0.3–2.6 | 0.4–2.1 | 0.6–1.7 | 0.5–1.2 |
| MoE | 12,800–90,000 | 5,100–15,000 | 6,900–60,000 | 8,600–45,000 | 10,600–30,000 | 15,000–36,000 |
| High level exposure | 0.5–5.8 | 5.0–8.3 | 1.6–7.3 | 1.4–6.3 | 1.9–5.1 | 1.5–3.1 |
| MoE | 3,100–36,000 | 2,200–3,600 | 2,500–11,200 | 2,800–12,800 | 3,500–9,500 | 5,800–12,000 |
* Based on a BMDL10 of 0.018 mg/kg bw (for NDEA).
At mean exposure for NDMA, MoE was > 10,000 in all age groups; at high exposure levels, MoE may be < 10,000 (depending on the survey data) in all age groups, except in the elderly.
Both at mean and high exposure levels for NDEA the MoE was > 10,000 in all population groups.
The Panel also calculated the MoE for the total exposure to NDMA plus NDEA using the lowest BMDL10, i.e. the BMDL10 of NDEA. This resulted in a conservative estimate, as NDEA gives a relatively lower contribution to the overall exposure compared to NDMA. Under this assumption, at mean exposure the MoE was < 10,000 in toddlers, children and adolescents in some surveys. At high level exposure, the MoE was < 10,000 in all age groups.
4. Uncertainty evaluation
In assessing the data, a number of uncertainties were identified. Many of these were addressed by assumptions made in the risk assessment. These uncertainties are presented below together with other uncertainties not addressed by assumptions.
The following uncertainties were considered and evaluated in assessing the toxicological database:
Even though the majority of studies had some limitations, the one used to derive the ADI was robust and performed according to GLP.
There were few limitations and discrepancies in the genotoxicity database, but overall the evidence supports the conclusion that orally administrated nitrite is not genotoxic in vivo.
The MetHb levels in the control groups differ in several studies in rats.
Although the efficiency of formation of MetHb from nitrite in rats and humans could be different, the mechanism by which MetHb after nitrite intake is formed in animal and humans is identical, and therefore, the animal is a relevant model for hazard characterisation. Therefore, the use of the dose response, based on animal data, to derive a reference point for an ADI is appropriate.
The ADI was derived from a 14‐week study showing adequate data to define BMDL as the reference point. However, the same effects were observed in longer term studies, and therefore, there was no need to introduce an additional uncertainty factor for time extrapolation from subchronic to chronic.
The default uncertainty factor (UF) of 100 is likely to be conservative but the Panel considers the database not sufficient to derive a Chemical‐Specific Adjustment Factor (CSAF) with confidence because of the low number of volunteers in the human kinetic study and of the few studies for the derivation of intraspecies and interspecies uncertainty factor respectively. The Panel recognised that the UF could be decreased if calculated from these studies; however, the Panel considered the data base as too limited to allow full coverage of the variability within group/population and the interspecies differences.
Overall, the uncertainties addressed had minimal impact on the conclusions reached. The conservative assumptions made for the derivation of an ADI for nitrites (E 249 and E 250) result in a reference point and an ADI which are both conservative. For the exposure assessment, the Panel considered that the uncertainties identified would, in general, result in an overestimation of the exposure to nitrites (E 249 and E 250) as a food additive in European countries for the regulatory maximum level exposure scenario and for the refined scenario.
With regard to formation of nitrosamines following the use of nitrite as food additive, the following uncertainties in the risk assessment for humans were considered and evaluated:
The mechanism of nitrosamine formation (both in food matrices before consumption and in vivo after ingestion) is known and scientifically accepted. There is uncertainty around the rate and extent of formation of N‐nitrosamines in meat products following the addition of nitrites. This may emanate from the fact that their formation is dependent on different parameters associated with composition and conditions of preparation, storage and thermal processing.
The calculation of the amount of endogenous formation of nitrosamines following ingestion of nitrite. The calculation was based on nitrite intake at the ADI, using a simplified model. Conservative assumptions were made ensuring that the calculated values were on the protective side. The potent carcinogenic nitrosamine (NDMA) was used as a representative compound for the calculation of the risk due to the endogenous formation of nitrosamines. This would lead to an overestimation rather than an underestimation of the risk.
The possible endogenous formation of nitrosamides, beyond nitrosamines, but the weight of this uncertainty is low as studies indicate that only trace amounts of nitrosamides are formed from cured meat in simulated gastric juice.
Limited information on the occurrence of preformed genotoxic and carcinogenic nitrosamines in food items treated with nitrites, was available and therefore there are uncertainties in the derivation of their MoEs.
Overall, while the uncertainties surrounding nitrosamine formation from nitrite were high, the impact of these uncertainties on the overall risk assessment of nitrites as a food additive was evaluated as low as the contribution of nitrite used as a food additive at the ADI to the overall exposure to nitrosamines was low compared to other sources of dietary nitrite.
5. Conclusions
The available information did not indicate in vivo genotoxic potential for sodium and potassium nitrite. Furthermore, carcinogenicity studies in mice and rats were negative. Therefore, the Panel concluded that an ADI for nitrite per se could be derived from general toxicity data.
The Panel concluded that in epidemiological studies there was some evidence for a positive association between: dietary nitrite and gastric cancer or its subtypes gastric cardia adenocarcinoma (GCA) and gastric non‐cardia adenocarcinoma (GNCA), and the combination of nitrite plus nitrate from processed meat and colorectal cancer (CRC) or subtypes (colon or rectum).
Based on the mode of action (MoA) analysis of methaemoglobin formation following nitrite intake, the Panel concluded that an increased methaemoglobin level was a relevant effect for derivation of the ADI.
When selecting the BMR, the Panel discussed several options considering also the formation of endogenous N‐nitroso compounds (ENOCs). The Panel decided that a BMR of 0.06 mg/100 mL corresponding to a two fold increase of methaemoglobin over the mean control level was appropriate. A BMDL based on increase in methaemoglobin levels was used as the reference point to derive a health‐based guidance value for nitrite. Using the lowest BMDL of 9.63 mg/kg bw per day, and applying the default UF of 100, the Panel derived an ADI of 0.1 mg sodium nitrite/kg bw per day, corresponding to 0.07 mg nitrite ion/kg bw per day.
The Panel concluded that exposure to nitrite resulting from its use as food additive does not lead to an exceedance of the ADI (0.07 mg/kg bw per day as nitrite ion) for the general population except for a slight exceedance in children at the highest percentile in accordance with the refined estimated exposure scenario (non‐brand loyal scenario). However, if all sources of dietary nitrite exposure were considered together (food additives, natural presence and contamination), the ADI would be exceeded in infants, toddlers and children at the mean and for all age groups at highest exposure.
Noting that nitrite contributes to the formation of nitrosamines, endogenously upon ingestion and in food matrices prior to consumption, the Panel decided to assess both issues.
In the case of endogenous formation of nitrosamines, the Panel quantified the theoretical amount of N‐nitroso‐dimethylamine (NDMA) upon ingestion at the level of the ADI (0.07 mg/kg bw nitrite ion per day). Applying a number of conservative assumptions, the Panel estimated the daily dose of NDMA produced under these conditions to be 0.64 × 10⁻⁷ mg/kg bw per day. Given that the BMDL10 for NDMA is 0.027 mg/kg bw per day, the Panel concluded that the MoE would be 4.2 × 10⁵, which is greater than 10,000 considered to be of low concern (EFSA, 2005; EFSA Scientific Committee, 2012b).
In epidemiological studies, there was evidence for a positive association between preformed NDMA and increased risk of CRC or its subtypes.
The Panel estimated the risk from exposure to N‐nitroso compounds (NDMA and N‐Nitrosodiethylamine (NDEA)‐ both separately and as a sum‐present in meat products) and calculated the MoE for the total exposure to NDMA plus NDEA using the lowest BMDL10, i.e. the BMDL10 of NDEA. This resulted in a conservative estimate, as NDEA gives a relatively lower contribution to the overall exposure compared to NDMA. Under this assumption, the Panel concluded that at mean exposure the MoE was < 10,000 in toddlers, children and adolescents in some surveys. At high level exposure, the MoE was < 10,000 in all age groups.
However, based on the results of a systematic review, the Panel concluded that it was not possible to clearly discern these NOCs produced from the nitrite added at the authorised levels, from those produced already in the food matrix where nitrite has not been added.
6. Recommendations
The Panel recommended that further large‐scale prospective observational studies were done on NDMA, nitrite and nitrate intake and risk of colorectal cancer and its subtypes because the evidence on a positive association between preformed NDMA and colorectal cancer (CRC) has been based on only two cohort studies and one case–control study.
The Panel recommended that further studies on the levels of nitroso compounds formed in different meat products with known ingoing amounts of nitrates/nitrites added, with appropriate controls and with specified levels of detection (LOD) and levels of quantification (LOQ) for potentially formed nitroso‐ compounds would be necessary.
Non‐volatile nitroso compounds were found to increase after nitrite addition. Even though non‐volatile nitrosamines are considered of lower toxicological concern based on their chemical structure, generation of experimental data will reduce the remaining uncertainty around a potential hazard posed by non‐volatile nitrosamines in cured meat.
In compliance with the EFSA Genotoxicity Testing Strategy (EFSA Scientific Committee, 2011), the Panel considered that a transgenic rodent mutation assay (OECD TG 488) on multiple organs, including the stomach, would provide useful supplementary information. The Panel noted that the repeated dose administration regimen in transgenic rodent mutation assays would also allow the assessment of clastogenic/aneugenic effects by the scoring micronuclei in peripheral blood erythrocytes.
The Panel recommended that the European Commission considers lowering the current limits for toxic elements (lead, mercury and arsenic) in the EU specifications for nitrates (E 251 and E 252) in order to ensure that nitrites (E 249 and E 251) as a food additive will not be a significant source of exposure to those toxic elements in food.
Documentation provided to EFSA
BASF, 2010. Characterisation and particle size distribution of Natriumnitrit E250 mit SiO2. June 2010.
FDA, 2010. Potassium Nitrite PAFA.
FDA, 2010. Sodium Nitrite PAFA.
FDA, 2010. FAP3T2840.
FDE (FoodDrinkEurope), 2013. Data on usage levels of nitrites (E 249–E 250) in foods in response to the EFSA call for food additives usage level and/or concentration data in food and beverages intended for human consumption (2013). Submitted to EFSA on 29 November 2013.
Glossary [and/or] Abbreviations
Glossary: an alphabetical list of words relating to a specific subject with explanations; a brief dictionary.
Abbreviation: a shortened form of a word or phrase (such as Mr, Prof). It also includes acronyms (a group of initial letters used as an abbreviation for a name or expression, each letter being pronounced separately – such as DVD, FDA – or as a single word – such as EFSA, NATO).
- AARP
American Association of Retired Persons
- ABC
aberrant crypts
- ADI
acceptable daily intake
- ADME
absorption, distribution, metabolism and excretion
- AIC
Akaike information criterion
- ALP
alkaline phosphatase
- ALT
alanine aminotransferase
- ANC
apparent N‐nitroso compounds
- ANS
Scientific Panel on Food Additives and Nutrient Sources added to Food
- AST
aspartate aminotransferase
- AUC
area under the curve
- B[a]P
benzo[a]pyrene
- BMD
benchmark dose modelling
- BMDL
benchmark dose modelling lower confidence limit
- BMI
body mass index
- BMR
benchmark dose–response
- bw
body weight
- CAS
Chemical Abstract Service
- CagA
cytotoxin‐associated gene A
- CEN
European Committee on Standardisation
- CHARRED
Computerized Heterocyclic Amines Resource for Research in Epidemiology of Disease
- CI
confidence interval
- CONTAM
The EFSA Scientific Panel on Contaminants in the Food Chain
- CRC
colorectal cancer
- CSAF
Chemical‐Specific Adjustment Factor
- DiMeIQx
2‐amino‐3,4,8 trimethylimidazo[4,5‐f]quinoxaline
- DMA
dimethylamine
- DNA
deoxyribonucleic acid
- EAC
oesophageal adenocarcinoma
- EINECS
European Inventory of Existing Commercial Chemical Substances
- ENOC
endogenous N‐nitroso compounds
- EPIC
European Prospective Investigation into Cancer and Nutrition
- EPIC‐EURGAST
European Prospective Investigation into Cancer and Nutrition
- ESCC
oesophageal squamous cell carcinomas
- FDA
US Food and Drug Administration
- FFQ
food‐frequency questionnaire
- FSANZ
Food Standards Australia New Zealand
- GC
gas chromatography
- GCA
gastric cardia adenocarcinoma
- GD
gestational day
- GI
gastrointestinal
- GLP
Good laboratory practice
- GNCA
gastric non‐cardia adenocarcinoma
- GSH
Blood reduced glutathione
- Hb
haemoglobin
- Hb M
haemoglobin M
- HCA
heterocyclic amine
- HCC
hepatocellular carcinoma
- HNC
head–neck cancer
- HPFS
Health Professionals Follow‐up Study
- HPLC
high‐performance liquid chromatography
- HPV
high production volume
- HR
hazard ratio
- IARC
International Agency for Research on Cancer
- ICR
imprinting Control Region
- IQR
interquartile range
- IRIS
Integrated Risk Information System
- ISO
International Organization for Standardization
- JECFA
Joint FAO/WHO Expert Committee on Food Additives
- LD50
lethal dose, 50%, i.e. dose that causes death among 50% of treated animals
- LOAEL
lowest observed adverse effect level
- LOD
limit of detection
- LOQ
limit of quantification
- MDF
mucin‐depleted foci
- MeIQx
2‐amino‐3,8‐dimethylimidazo[4,5‐f]quinoxaline
- MetHb
methaemoglobin
- MNNG
N‐methyl‐N’‐nitro‐N–nitrosoguanidine
- MoA
mode of action
- MoE
margin of exposure
- MPL
maximum permitted level
- MTD
maximal tolerable dose
- NA
nitrosamine
- NADH
nicotinamide adenine dinucleotide
- NADPH
nictotinamide adenine dinucleotide phosphate
- NCE
normochromatic erythrocytes
- NDBA
N‐nitrosodibutylamine
- NDEA
N‐nitrosodiethylamine
- NDMA
N‐nitrosodimethylamine
- NHL
non‐Hodgkin lymphoma
- NIAN
1‐nitrosoindole‐3‐acetonitrile
- NIH
National Institutes of Health
- NLCS
Netherlands Cohort Study
- NMKL
Nordic Committee of Analysis of Food
- NMOR
N‐nitrosomorpholine
- NMTCA
N‐nitroso‐2‐methyl‐thiazolidine 4‐carboxylic acid
- NO
nitric oxide
- NOAEL
no observed adverse effect level
- NOC
N‐nitroso compound
- NOCl
nitrosyl chloride
- NOEL
no observed effect level
- NPIP
N‐nitrosopiperidine
- NPRO
N‐nitrosoproline
- NPYR
N‐nitrosopyrrolidine
- NSAR
N‐nitrososarcosine
- NTCA
N‐nitroso‐thiazolidine‐4‐carboxylic acid
- NTHZ
N‐nitrosothiazolidine
- NTP
National Toxicology Program
- OECD
Organisation for Economic Co‐operation and Development
- PAH
polycyclic aromatic hydrocarbons
- PCA
principal component analysis
- PCNA
proliferating cell nuclear antigen
- PCE
polychromatic erythrocytes
- PH
proportional hazards
- PhIP
2‐amino‐1‐methyl‐6‐phenylimidazo [4,5‐b]pyridine
- RACB
Reproductive assessment by continuous breeding
- RCC
renal cell carcinoma
- REACH
Registration, Evaluation, Authorisation and restriction of Chemicals
- RfD
reference dose
- RIVM
National Institute of Public Health and the Environment
- RR
relative risk
- SBP
systolic blood pressure
- SCF
Scientific Committee for Food
- SD
standard deviation
- SIDS
Screening Information Data Set
- TemaNord
Nordic Council of Ministers
- UF
uncertainty factor
- UV
ultraviolet
- VIS
visible light
- WHO
World Health Organization
Appendix A – Summary of the reported use levels (mg/kg or mg/L as appropriate) of potassium and sodium nitrite (E 249–250) provided by industry and of analytical results (mg/kg) of potassium and sodium nitrite (E 249–250) provided by Members States
Appendix A can be found in the online version of this output (‘Supporting information’ section): https://doi.org/10.2903/j.efsa.2017.4786
Appendix B – Number and percentage of food products labelled with nitrites (E 249–250) out of the total number of food products present in Mintel GNPD per food sub‐category between 2011 and 2015
Appendix B can be found in the online version of this output (‘Supporting information’ section): https://doi.org/10.2903/j.efsa.2017.4786
Appendix C – Concentration levels of potassium and sodium nitrite (E 249‐250) used in the refined exposure scenarios (mg/kg or mL/kg as appropriate)
Appendix C can be found in the online version of this output (‘Supporting information’ section): https://doi.org/10.2903/j.efsa.2017.4786
Appendix D – Summary of total estimated exposure to potassium and sodium nitrite (E 249‐250) from its use in the maximum level exposure scenario and the refined exposure assessment scenarios per population group and survey: mean and 95th percentile (mg/kg bw per day)
Appendix D can be found in the online version of this output (‘Supporting information’ section): https://doi.org/10.2903/j.efsa.2017.4786
Appendix E – Summary of total estimated exposure of consumers of processed meat products only to volatile nitrosamines (NDMA and NDEA, and the sum of NDMA + NDEA) from the use of nitrites as food additives per population group and survey: mean and high level in ng/kg bw per day
| Population group | Country | Survey | Number of subjects | Mean exposure (NDMA) | P95 exposure (NDMA) | Mean exposure (NDEA) | P95 exposure (NDEA) | Mean exposure (Sum NDMA + NDEA) | P95 exposure (NDMA + NDEA) |
|---|---|---|---|---|---|---|---|---|---|
| Infants | Bulgaria | NUTRICHILD | 659 | 0.2 | 0.4 | 0.03 | 0.06 | 0.2 | 0.5 |
| Infants | Germany | VELS | 159 | 0.5 | 2.6 | 0.08 | 0.44 | 0.6 | 3.5 |
| Infants | Denmark | IAT 2006_07 | 826 | 1.1 | 4.4 | 0.18 | 0.73 | 1.4 | 5.8 |
| Infants | Finland | DIPP_2001_2009 | 500 | 0.5 | 2.0 | 0.08 | 0.33 | 0.6 | 2.6 |
| Infants | United Kingdom | DNSIYC_2011 | 1,369 | 0.3 | 2.0 | 0.05 | 0.33 | 0.4 | 2.6 |
| Infants | Italy | INRAN_SCAI_2005_06 | 12 | 0.2 | 0.0 | 0.03 | 0.00 | 0.2 | 0 |
| Toddlers | Belgium | Regional_Flanders | 36 | 1.5 | 0.0 | 0.25 | 0.00 | 2 | 0 |
| Toddlers | Bulgaria | NUTRICHILD | 428 | 0.9 | 3.8 | 0.15 | 0.63 | 1.2 | 5 |
| Toddlers | Germany | VELS | 348 | 1.9 | 5.1 | 0.31 | 0.85 | 2.5 | 6.8 |
| Toddlers | Denmark | IAT 2006_07 | 917 | 2.6 | 6.2 | 0.44 | 1.04 | 3.5 | 8.3 |
| Toddlers | Spain | enKid | 17 | 2.1 | 0.0 | 0.35 | 0.00 | 2.8 | 0 |
| Toddlers | Finland | DIPP_2001_2009 | 500 | 1.0 | 4.0 | 0.16 | 0.66 | 1.3 | 5.3 |
| Toddlers | United Kingdom | NDNS‐RollingProgrammeYears1‐3 | 185 | 1.4 | 4.8 | 0.23 | 0.80 | 1.8 | 6.4 |
| Toddlers | United Kingdom | DNSIYC_2011 | 1,314 | 1.0 | 3.9 | 0.16 | 0.65 | 1.3 | 5.2 |
| Toddlers | Italy | INRAN_SCAI_2005_06 | 36 | 1.1 | 0.0 | 0.19 | 0.00 | 1.5 | 0 |
| Toddlers | Netherlands | VCP_kids | 322 | 1.7 | 4.9 | 0.28 | 0.81 | 2.2 | 6.5 |
| Children | Austria | ASNS_Children | 128 | 1.7 | 4.0 | 0.28 | 0.66 | 2.2 | 5.3 |
| Children | Belgium | Regional_Flanders | 625 | 1.4 | 4.1 | 0.23 | 0.69 | 1.8 | 5.5 |
| Children | Bulgaria | NUTRICHILD | 433 | 1.4 | 5.5 | 0.24 | 0.91 | 1.9 | 7.3 |
| Children | Czech Republic | SISP04 | 389 | 1.6 | 4.9 | 0.26 | 0.81 | 2.1 | 6.5 |
| Children | Germany | EsKiMo | 835 | 1.7 | 4.8 | 0.29 | 0.80 | 2.3 | 6.4 |
| Children | Germany | VELS | 293 | 1.8 | 4.1 | 0.30 | 0.68 | 2.4 | 5.4 |
| Children | Denmark | DANSDA 2005‐08 | 298 | 1.7 | 3.6 | 0.29 | 0.60 | 2.3 | 4.8 |
| Children | Spain | enKid | 156 | 2.0 | 5.3 | 0.33 | 0.88 | 2.6 | 7 |
| Children | Spain | NUT_INK05 | 399 | 1.9 | 4.8 | 0.31 | 0.80 | 2.5 | 6.4 |
| Children | Finland | DIPP_2001_2009 | 750 | 1.9 | 5.0 | 0.31 | 0.83 | 2.5 | 6.6 |
| Children | France | INCA2 | 482 | 1.4 | 3.5 | 0.24 | 0.59 | 1.9 | 4.7 |
| Children | United Kingdom | NDNS‐RollingProgrammeYears1‐3 | 651 | 1.3 | 3.9 | 0.21 | 0.65 | 1.7 | 5.2 |
| Children | Greece | Regional_Crete | 838 | 0.2 | 1.2 | 0.04 | 0.20 | 0.3 | 1.6 |
| Children | Italy | INRAN_SCAI_2005_06 | 193 | 1.1 | 3.6 | 0.19 | 0.60 | 1.5 | 4.8 |
| Children | Latvia | EFSA_TEST | 187 | 1.3 | 4.5 | 0.21 | 0.75 | 1.7 | 6 |
| Children | Netherlands | VCP_kids | 957 | 1.4 | 4.2 | 0.23 | 0.70 | 1.8 | 5.6 |
| Children | Netherlands | VCPBasis_AVL2007_2010 | 447 | 1.2 | 3.7 | 0.20 | 0.61 | 1.6 | 4.9 |
| Children | Sweden | NFA | 1,473 | 1.7 | 4.4 | 0.28 | 0.73 | 2.2 | 5.8 |
| Adolescents | Austria | ASNS_Children | 237 | 1.0 | 2.9 | 0.16 | 0.48 | 1.3 | 3.8 |
| Adolescents | Belgium | Diet_National_2004 | 576 | 0.7 | 2.0 | 0.11 | 0.34 | 0.9 | 2.7 |
| Adolescents | Cyprus | Childhealth | 303 | 0.3 | 1.1 | 0.05 | 0.18 | 0.4 | 1.4 |
| Adolescents | Czech Republic | SISP04 | 298 | 1.6 | 4.7 | 0.26 | 0.79 | 2.1 | 6.3 |
| Adolescents | Germany | National_Nutrition_Survey_II | 1,011 | 0.8 | 2.7 | 0.14 | 0.45 | 1.1 | 3.6 |
| Adolescents | Germany | EsKiMo | 393 | 1.4 | 3.9 | 0.23 | 0.65 | 1.8 | 5.2 |
| Adolescents | Denmark | DANSDA 2005‐08 | 377 | 0.7 | 1.9 | 0.11 | 0.31 | 0.9 | 2.5 |
| Adolescents | Spain | AESAN_FIAB | 86 | 1.1 | 2.6 | 0.19 | 0.44 | 1.5 | 3.5 |
| Adolescents | Spain | enKid | 209 | 1.4 | 3.6 | 0.24 | 0.60 | 1.9 | 4.8 |
| Adolescents | Spain | NUT_INK05 | 651 | 1.2 | 3.4 | 0.20 | 0.56 | 1.6 | 4.5 |
| Adolescents | Finland | NWSSP07_08 | 306 | 0.7 | 2.0 | 0.11 | 0.33 | 0.9 | 2.6 |
| Adolescents | France | INCA2 | 973 | 0.8 | 1.9 | 0.13 | 0.31 | 1 | 2.5 |
| Adolescents | United Kingdom | NDNS‐RollingProgrammeYears1‐3 | 666 | 0.7 | 2.3 | 0.11 | 0.38 | 0.9 | 3 |
| Adolescents | Italy | INRAN_SCAI_2005_06 | 247 | 0.8 | 2.3 | 0.14 | 0.38 | 1.1 | 3 |
| Adolescents | Latvia | EFSA_TEST | 453 | 1.1 | 3.2 | 0.18 | 0.54 | 1.4 | 4.3 |
| Adolescents | Netherlands | VCPBasis_AVL2007_2010 | 1,142 | 0.8 | 2.6 | 0.14 | 0.43 | 1.1 | 3.4 |
| Adolescents | Sweden | NFA | 1,018 | 1.1 | 2.6 | 0.18 | 0.44 | 1.4 | 3.5 |
| Adults | Austria | ASNS_Adults | 308 | 0.5 | 2.0 | 0.09 | 0.33 | 0.7 | 2.6 |
| Adults | Belgium | Diet_National_2004 | 1,292 | 0.6 | 2.0 | 0.10 | 0.34 | 0.8 | 2.7 |
| Adults | Czech Republic | SISP04 | 1,666 | 1.3 | 3.8 | 0.21 | 0.64 | 1.7 | 5.1 |
| Adults | Germany | National_Nutrition_Survey_II | 10,419 | 0.8 | 2.3 | 0.13 | 0.39 | 1 | 3.1 |
| Adults | Denmark | DANSDA 2005‐08 | 1,739 | 0.5 | 1.4 | 0.09 | 0.24 | 0.7 | 1.9 |
| Adults | Spain | AESAN | 410 | 0.8 | 2.7 | 0.14 | 0.45 | 1.1 | 3.6 |
| Adults | Spain | AESAN_FIAB | 981 | 0.9 | 2.2 | 0.15 | 0.36 | 1.2 | 2.9 |
| Adults | Finland | FINDIET2012 | 1,295 | 0.7 | 2.4 | 0.11 | 0.40 | 0.9 | 3.2 |
| Adults | France | INCA2 | 2,276 | 0.7 | 1.6 | 0.11 | 0.26 | 0.9 | 2.1 |
| Adults | United Kingdom | NDNS‐Rolling ProgrammeYears 1–3 | 1,266 | 0.5 | 1.6 | 0.08 | 0.26 | 0.6 | 2.1 |
| Adults | Hungary | National_Repr_Surv | 1,074 | 1.2 | 3.0 | 0.20 | 0.50 | 1.6 | 4 |
| Adults | Ireland | NANS_2012 | 1,274 | 0.7 | 2.0 | 0.11 | 0.34 | 0.9 | 2.7 |
| Adults | Italy | INRAN_SCAI_2005_06 | 2,313 | 0.5 | 1.5 | 0.09 | 0.25 | 0.7 | 2 |
| Adults | Latvia | EFSA_TEST | 1,271 | 0.8 | 2.4 | 0.13 | 0.40 | 1 | 3.2 |
| Adults | Netherlands | VCPBasis_AVL2007_2010 | 2,057 | 0.6 | 1.9 | 0.10 | 0.31 | 0.8 | 2.5 |
| Adults | Romania | Dieta_Pilot_Adults | 1,254 | 0.8 | 2.0 | 0.13 | 0.34 | 1 | 2.7 |
| Adults | Sweden | Riksmaten 2010 | 1,430 | 0.7 | 1.9 | 0.11 | 0.31 | 0.9 | 2.5 |
| Elderly and very elderly | Austria | ASNS_Adults | 92 | 0.5 | 1.4 | 0.08 | 0.23 | 0.6 | 1.8 |
| Elderly and very elderly | Belgium | Diet_National_2004 | 1,215 | 0.6 | 1.8 | 0.10 | 0.30 | 0.8 | 2.4 |
| Elderly and very elderly | Germany | National_Nutrition_Survey_II | 2,496 | 0.7 | 2.0 | 0.11 | 0.33 | 0.9 | 2.6 |
| Elderly and very elderly | Denmark | DANSDA 2005‐08 | 286 | 0.5 | 1.1 | 0.08 | 0.19 | 0.6 | 1.5 |
| Elderly and very elderly | Finland | FINDIET2012 | 413 | 0.5 | 2.0 | 0.09 | 0.33 | 0.7 | 2.6 |
| Elderly and very elderly | France | INCA2 | 348 | 0.5 | 1.4 | 0.09 | 0.24 | 0.7 | 1.9 |
| Elderly and very elderly | United Kingdom | NDNS‐RollingProgrammeYears1‐3 | 305 | 0.4 | 1.4 | 0.06 | 0.23 | 0.5 | 1.8 |
| Elderly and very elderly | Hungary | National_Repr_Surv | 286 | 0.9 | 2.3 | 0.15 | 0.39 | 1.2 | 3.1 |
| Elderly and very elderly | Ireland | NANS_2012 | 226 | 0.7 | 2.2 | 0.11 | 0.36 | 0.9 | 2.9 |
| Elderly and very elderly | Italy | INRAN_SCAI_2005_06 | 518 | 0.4 | 1.1 | 0.06 | 0.19 | 0.5 | 1.5 |
| Elderly and very elderly | Netherlands | VCPBasis_AVL2007_2010 | 173 | 0.6 | 2.0 | 0.10 | 0.33 | 0.8 | 2.6 |
| Elderly and very elderly | Netherlands | VCP‐Elderly | 739 | 0.5 | 1.4 | 0.08 | 0.24 | 0.6 | 1.9 |
| Elderly and very elderly | Romania | Dieta_Pilot_Adults | 128 | 0.6 | 1.8 | 0.10 | 0.30 | 0.8 | 2.4 |
| Elderly and very elderly | Sweden | Riksmaten 2010 | 367 | 0.6 | 1.7 | 0.10 | 0.29 | 0.8 | 2.3 |
Appendix F – Report on BMD analysis
F.1. Data description
The Panel considered which end‐point would be the most relevant for assessing the toxicity of nitrite. The Panel decided that formation of methaemoglobin, which is also formed endogenously (see MOA Annex 1), is the main toxicological end‐point. Methaemoglobin is formed after administration of nitrite and the increase can be measured in animals, as well as in humans. Hence, the Panel decided to use increases in the concentration of endogenously formed methaemoglobin above the background level to derive the health‐based guidance level using the BMDL as the reference point.
Concerning end‐point methaemoglobin, there have been several animal studies and one human study in which methaemoglobin concentration was measured under controlled conditions after the administration of nitrite. These studies were assessed whether the data would be suitable to derive a health‐based guidance value (Kortboyer et al., 1997).
Table F.1.
Dataset (NTP, 2001, table 6, pp. 39, 41)
| Dose (mg/kg bw per day) | Methaemoglobin (g/dL) Day 5 (mean) | SD | N | Methaemoglobin (g/dL) Day 19 (mean) | SD | N | Methaemoglobin (g/dL) Week 14 (mean) | SD | N | Covariates (gender) |
|---|---|---|---|---|---|---|---|---|---|---|
| 0 | 0.03 | 0.06 | 9 | 0.09 | 0.15 | 10 | 0.03 | 0.03 | 10 | M |
| 30 | 0.04 | 0.07 | 6 | 0.06 | 0.19 | 10 | 0.08 | 0.03 | 10 | M |
| 55 | 4.36 | 2.46 | 10 | 0.28 | 0.36 | 9 | 0.12 | 0.06 | 10 | M |
| 115 | 0.08 | 0.08 | 7 | 0.38 | 0.38 | 10 | 0.25 | 0.21 | 9 | M |
| 200 | 1.37 | 1.15 | 8 | 1.25 | 1.17 | 10 | 0.71 | 0.63 | 10 | M |
| 310 | 3.97 | 2.25 | 9 | 3.26 | 1.08 | 9 | 3.38 | 2.52 | 10 | M |
| 0 | 0.02 | 0.03 | 9 | 0.03 | 0.03 | 10 | 0.06 | 0.06 | 10 | F |
| 40 | 0.10 | 0.14 | 8 | 0.11 | 0.09 | 10 | 0.14 | 0.06 | 10 | F |
| 80 | 0.05 | 0.03 | 9 | 0.18 | 0.14 | 10 | 0.16 | 0.06 | 10 | F |
| 130 | 0.21 | 0.24 | 9 | 2.01 | 2.49 | 10 | 0.48 | 0.16 | 10 | F |
| 225 | 2.41 | 2.15 | 8 | 3.78 | 1.17 | 10 | 0.99 | 0.60 | 9 | F |
| 345 | 4.95 | 2.76 | 9 | 6.66 | 1.14 | 10 | 2.27 | 1.71 | 10 | F |
The human study was that by Kortboyer et al. (1997) in which data on nitrite concentrations in plasma and the concentration of methaemoglobin were measured in nine healthy volunteers after two different oral doses and one intravenous dose of sodium nitrite in a cross‐over design (see Section 3.6.1). When trying to model the maximum methaemoglobin concentrations (Cmax) vs the doses and establishing a BMDL with a BMR, as derived from information on the background concentrations, it turned out that the data could not be used. First, the data could not be fitted with the existing BMD models and second, even if a linear model was used to fit the data, the lower confidence interval of the dose for the BMR was negative, indicating high variability and because of the low numbers of subjects, a high level of uncertainty in the data.
Therefore, the Panel decided to base the derivation of the health‐based guidance value on animal data. In the animal studies (Shuval and Gruener, 1972; Til et al., 1985a,b, 1990; Til and Kuper, 1995; NTP, 2001), only one of the doses employed elicited methaemoglobin levels higher than those in controls, which renders them unsuitable for BMD. In the NTP study, all doses elicited methaemoglobin levels higher than in the control. In this study, 30 animals per sex were treated in five dose groups (doses between 30 and 345 mg/kg bw per day) and one control group. At day 9, day 19 and week 14, ten animals per dose group and sex were sacrificed and methaemoglobin levels were measured. BMD was performed for every time point.
F.2. Selection of the BMR
The benchmark dose–response (BMR) is a specific value of the effect size selected for estimating the associated BMD. For continuous data, BMR is defined as a per cent change in the mean response compared with the background response. Although a BMR of 5% for continuous data is recommended as a default, it might be modified based on toxicological or statistical considerations (EFSA Scientific Committee, 2017). The Panel considered that a 5% change from the mean in the observed data would mean that the BMR would be a very small per cent change compared with the observed variation. The Panel decided to derive a BMR considering the procedure proposed in Slob (2016). A recently published mathematical procedure on how to derive a BMR from the variation in the data is given by Slob (2016) and it is used in this opinion for the derivation of the BMR. The procedure uses the within group variation of the study under consideration. In order to estimate the within‐group variation, the reported standard errors were transformed to SD and subsequently to variances which were then averaged (S 2). The within‐group variance was calculated considering log‐normality, for which the mean response value across time, doses and genders was also needed (μ), then using the following formula:
The within‐group variance () obtained was 0.637. Following the procedure proposed by Slob (2016), calculation of the appropriate BMR for studies with a small effect size mimicking a 5% change would be:
The BMR would imply a two‐fold increase of the background mean concentration of MetHb (0.03 g/dL) in this particular case.
F.3. Software used
The software used was PROAST version 61.3 and R version 3.2.3 (10‐12‐2015). The graphical user interface function of the package was used (g.proast()).
F.4. Specification of deviations from default assumption
The BMD approach was used for days 9 and 19, the results obtained indicates that for all models fitted the AIC values were larger than that obtained for the FULL model (AICMin > AICFULL+2), for which here we focused only on the results obtained for week 14.
The Hill model did not fit the data for all potential models, but this model was not fitting the data as well as the Full model, for which it was considered not a viable option. The exponential family produces a model in which the fit complies with the criteria mentioned above (AICMin > AICFULL+2).
F.5. Procedure for selection of BMDL
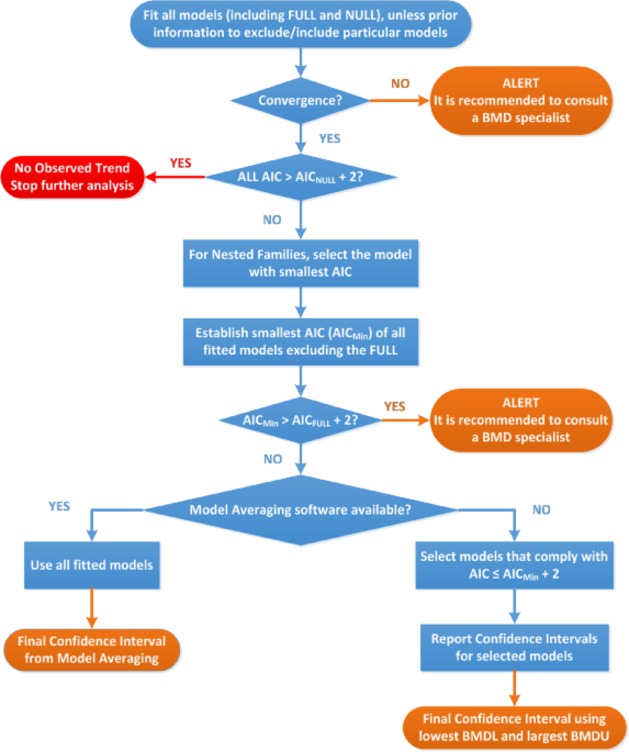
F.6. Results
Three different BMD models were fitted, for day 5, day 19 and at week 14. The BMD fitted for day 5 considers a potential outlying observation at a dose of 55 mg/kg bw per day, as well as without that specific dose.
The 90% lower confidence level of the Benchmark dose (BMDL) was 9.63 mg/kg bw per day for males and 14.62 mg/kg bw per day for females when the BMR is considered to be a two‐fold percentage change (BMR: 1).
Table F.2.
Results of the models fitted for the data of week 14
| Model | Gendera | No. parameters | Log‐likelihood | AIC | BMDL | BMDU |
|---|---|---|---|---|---|---|
| Null | 3 | –218.12 | 442.24 | |||
| Full | 13 | –104.98 | 235.96 | |||
| Exp Model 3‐ab | Male | 6 | –110.84 | 233.68 | 9.63 | 25.38 |
| Exp Model 3‐ab | Female | 6 | –110.84 | 233.68 | 14.62 | 36.52 |
| Exp Model 3‐a | 5 | –115.23 | 240.46 | 10.94 | 28.27 | |
| Exp Model 3‐b | Male | 5 | –116.73 | 243.46 | 10.94 | 28.60 |
| Exp Model 3‐b | Female | 5 | –116.73 | 243.46 | 11.05 | 29.53 |
| Exp Model 3 | 4 | –116.75 | 241.5 | 11.05 | 28.61 | |
| Exp Model 5‐ab | Male | 7 | –117.78 | 249.56 | 16.92 | 37.39 |
| Exp Model 5‐ab | Female | 7 | –117.78 | 249.56 | 26.51 | 54.91 |
| Exp Model 5‐a | 6 | –119.65 | 251.30 | 22.06 | 43.81 | |
| Exp Model 5‐b | Male | 6 | –120.75 | 253.50 | 22.58 | 45.22 |
| Exp Model 5‐b | Female | 6 | –120.75 | 253.50 | 21.13 | 43.05 |
| Exp Model 5 | Female | 5 | –120.92 | 251.84 | 22.21 | 43.91 |
| Hill Model 5‐ab | Male | 7 | –117.78 | 249.56 | 16.92 | 37.39 |
| Hill Model 5‐ab | Female | 7 | –117.78 | 249.56 | 26.51 | 54.92 |
| Hill Model 5‐a | 6 | –119.65 | 251.30 | 22.06 | 43.82 | |
| Hill Model 5‐b | Male | 6 | –120.75 | 253.50 | 22.58 | 45.22 |
| Hill Model 5‐b | Female | 6 | –120.75 | 253.50 | 21.13 | 43.05 |
| Hill Model 5 | 5 | –120.92 | 251.84 | 22.19 | 43.90 |
Models fitted using covariate, thus Females and males in the same data and model together considering some parameters in the model depending on the covariate (gender), that is why results are shown in one table.
Conclusions
The models were fitted for 9‐, 19‐ and 98‐day evaluations, alerts were obtained when fitting the models for days 9 and 19 for which none of the models considered provide and AIC value that satisfies the condition to be smaller than AICFULL + 2. Models for evaluations performed after week 14 (98 days) provided AIC values that satisfy this condition, although the Hill model considering three parameters produced errors when it was used. The analysis performed is presented and the resulting confidence intervals are reported only when evaluation was carried out after 14 weeks (Figure F.1). The BMR used for the assessment was derived considering a procedure proposed by Slob (2016) being a two‐fold increase, producing a lower bound (BMDL) of 9.63 mg/kg bw per day for males and 14.62 mg/kg bw per day for females.
Figure F.1.
Plot of the selected model for males (triangles) and females (circles) y axis is the effect size and x axis is the dose of nitrite
Reference
Slob, W. (2016). A general theory of effect size, and its consequences for defining the Benchmark response (BMR) for continuous endpoints. Critical Reviews in Toxicology, 1–10.
Appendix G – Summary of toxicological studies reviewed
| Compound | Strain | Duration | Equivalent doses of sodium or potassium nitrite | NOAEL | Main observed effects | Reference |
|---|---|---|---|---|---|---|
| Subchronic toxicity studies | ||||||
| Sodium nitrite and potassium nitrite | Wistar rats | 13 weeks |
Sodium nitrite = 7.3, 219 mg/kg bw per day Potassium nitrite = 1.1, 2.2, 4.5, 9, 270 mg/kg bw per day |
Sodium nitrite = 7.3 mg/kg bw per day Potassium nitrite = 9 mg/kg bw per day |
♂ ➚ Methaemoglobin ♀ Hypertrophy zona glomerulosa adrenal glands ➘ Plasma aldosterone and corticosterone ♀ ➚ Methaemoglobin |
Til et al. (1997) |
| Sodium nitrite | B6C3F1 mice | 14 weeks |
90, 190, 345, 650, 990 mg/kg bw per day ♂ 120, 240, 445, 840, 1,230 mg/kg bw per day♀ |
345 mg/kg bw per day ♂ 240 mg/kg bw per day ♀ |
♂ ➚ Extramedullary haematopoiesis ♀➚ Extramedullary haematopoiesis |
NTP (2001) |
| Sodium nitrite | F344/N rats | 14 weeks |
30, 55, 115, 200, 310 mg/kg bw per day ♂ 40, 80, 130, 225, 345 mg/kg bw per day ♀ |
115 mg/kg bw per day ♂ 130 mg/kg bw per day ♀ |
♂➚ Methaemoglobin, reticulocytes, cell volume, cell haemoglobin ♀➚ Methaemoglobin, hematocrit, cell volume, cell haemoglobin |
NTP (2001) |
| Potassium nitrate | Wistar rats | 11 days | 211 mg/kg bw per day ♂ | NI | ➘ Blood pressure | Vleeming et al., 1997 |
| Sodium nitrite | 2K1C Wistar rats | 6 weeks | 5.6, 61, 85 mg/kg bw per day ♂ | NI | ➘ Systolic blood pressure, ➚ NO levels | Montenegro et al. (2011) |
| Sodium nitrite | Albino rats | 3 months | 80 mg/kg bw per day ♂ | NI | ➚ Plasma glucose, AST, ALT, ALP, bilirubin, urea, creatinine;➘ total protein | Hassan et al. (2009, 2010) |
| Sodium nitrite | F344 rats | 7 days | 240 mg/kg bw per day ♂ | NI | Okasaki et al. (2006) | |
| Chronic toxicity and carcinogenicity studies | ||||||
| Sodium nitrite | Male rats (strain not specified) | 14 months | 100 mg/kg bw | NI | ➚ Methaemoglobin,➚ GSH in red blood cells,;➘plasma vitamin E | Chow and Hong (1980) |
| Sodium nitrite | F344 rats | 104 weeks treatment (120 weeks follow‐up) | 62.5, 125 mg/kg bw per day♂, ♀ | 125 mg/kg bw per day | No statistically significant effects | Maekawa et al. (1982) |
| Sodium nitrite | B6C3F1 mice | 104–105 weeks |
60, 120, 220 mg/kg bw per day ♂ 45, 90, 165 mg/kg bw per day ♀ |
220 mg/kg bw per day ♂ 165 mg/kg bw per day ♀ |
No statistically significant effects | NTP (2001) |
| Sodium nitrite | F344/N rats | 104–105 weeks |
35, 70, 130 mg/kg bw per day ♂ 40, 80, 150 mg/kg bw per day ♀ |
130 mg/kg bw per day ♂ 150 mg/kg bw per day ♀ |
♂♀➚ Methaemoglobin; blood plasma nitrite at highest dose ♂♀➚ incidence of minimal stomach hyperplasia at highest dose tested |
NTP (2001) |
| Sodium nitrite | Rats (strain not specified) | 104 weeks treatment (120 weeks follow‐up) | NI | NI | ➚ Methaemoglobin; dilated bronchi infiltrated with lymphocytes; foci and fibrosis in heart coronaries thin and dilated | Shuval and Gruener (1972) |
| Others studies | ||||||
| Sodium nitrite + fish meal | F344 rats | 104 weeks | 6 mg/kg bw per day ♀, ♂ | NI | ➚ Incidence of atypical renal tubules at the highest fish meal tested | Furukawa et al. (2000) |
| Sodium nitrite + ascorbic acid + butylated hydroxyanisole | F344 rats ♂ | 42 weeks | 45, 90, 180 mg/kg bw per day | NI | ➚ Incidence of squamous cell carcinomas and forestomach hyperplasia when given together with ascorbic acid. No statistically significant effects alone | Okasaki et al. (2006) |
| Sodium nitrite + ascorbic acid + MNNG | F344 rats | 12 weeks | 240 mg/kg bw per day ♂ | NI | No statistically significant effects | Kuroiwa et al. (2007) |
| Reproduction toxicity studies | ||||||
| Sodium nitrite | CD‐1 mice | 10 weeks | 180 mg/kg bw per day | NI |
Significant reduction in offspring numbers No effects observed on reproductive parameters measured |
Anderson et al. (1978) |
| Sodium nitrite | CD‐1 mice | RACB (two generation – reproduction toxicity study) |
Task 1 = 20, 40, 70, 140, 260 mg/kg bw per day Task 2 = 131, 273, 437 mg/kg bw per day ♂; 123, 254, 412 mg/kg bw per day ♀ Task 4 = 433 mg/kg bw per day ♂; 556 mg/kg bw per day ♀ |
Task 1: 260 mg/kg bw per day Task 2: 437 mg/kg bw per day ♂; 412 mg/kg bw per day♀ Task 4: 433 mg/kg bw per day♂ 556 mg/kg bw per day ♀ |
No statistically significant effects | NTP (1990) |
| Reproduction end‐points examined in subchronic toxicity studies | ||||||
| Sodium nitrite | B6C3F1 mice | 90, 190, 345, 990 mg/kg bw per day ♂; 120, 240, 445, 1230 mg/kg bw per day ♀ | 14 weeks | 990 mg/kg bw per day ♂; 240 mg/kg bw per day ♀ |
♂➚ testicular degeneration ♀ ➚ oestrous cycle length |
NTP (2001) |
| Sodium nitrite | F344/N | 30, 115, 310 mg/kg bw per day ♂; 40, 130, 345 mg/kg bw per day ♀ | 14 weeks | 30 mg/kg bw per day ♂; 345 mg/kg bw per day ♀ | ♂ ➘ sperm motility at two highest doses | NTP (2001) |
| Developmental toxicity studies | ||||||
| Sodium nitrite | Pregnant albino CD‐1 mice | From (GD) 6–15 | Via gavage with 0, 0.2, 1.1, 5.0 or 23.0 mg sodium nitrite/kg bw per day | Highest dose tested | No adverse effects for dams and fetuses | FDA (1972a) |
| Potassium nitrite | Pregnant albino CD‐1 mice | From (GD) 6–15 | Via gavage with 0, 0.3, 1.5, 7.0 or 32.0 mg potassium nitrite/kg bw per day | Highest dose tested | No adverse effects for dams and fetuses | FDA (1972b) |
| Sodium nitrite | Pregnant albino Wistar rats | From (GD) 6–15 | via gavage with 0, 0.1, 0.5, 3.0, 10.0 mg sodium nitrite/kg bw per day | 3.0 mg/kg bw per day | Slight effect on skeletal retardation | FDA (1972a) |
| Potassium nitrite | Pregnant albino Wistar rats | From (GD) 6–15 | via gavage with 0, 0.1, 0.5, 3.0, 10.0 mg sodium nitrite/kg bw per day | 3.0 mg/kg bw per day | Slight effect on skeletal retardation | FDA (1972b) |
| Sodium nitrite | Pregnant Golden hamsters | From (GD) 6–10 | via gavage 0, 0.2, 1.1, 5.0 or 23.0 mg sodium nitrite/kg bw per day | Highest dose tested | No adverse effects for dams and fetuses | FDA (1972a) |
| Potassium nitrite | Pregnant Golden hamsters | From (GD) 6 – 10 | via gavage with 0, 0.3, 1.5, 7.0 or 32.0 mg potassium nitrite/kg bw per day | Highest dose tested | No adverse effects for dams and fetuses | FDA (1972b) |
| Sodium nitrite | Dutch belted rabbits | From (GD) 6–18 | via gavage with 0, 0.2, 1.1, 5.0 or 23.0 mg sodium nitrite/kg bw per day | High mortality rates (not relevant for risk assessment) | FDA (1972a) | |
| Potassium nitrite | Dutch belted rabbits | From (GD) 6–18 | via gavage with 0, 0.2, 1.1, 5.0 or 23.0 mg sodium nitrite/kg bw per day | High mortality rates (not relevant for risk assessment) | FDA (1972b) | |
AST, aspartate aminotransferase; ALT, alanine aminotransferase; ALP, alkaline phosphatase.
Appendix H – Report on the selection of epidemiological studies
Objective
To assess, if any, the association between nitrates, nitrites and NO compounds and cancer.
Methods
1.
1.1.
1.1.1.
Types of studies and participants
All observational studies (cohort, case–control and ecological) that investigated the association between nitrates, nitrites and their compounds in diet (including drinking water) and cancer were included published up to December 2014. Studies conducted before 2005 were excluded because they were already included in the IARC report of 2010. Studies that were not included in the IARC report but were considered informative were included. Additional articles were identified after December 2014 by PubMed and by searching in the reference lists from recent reviews (last search April 2016).
Types of outcome measures included
Primary outcome
Incidence
Search strategy and data extraction
Electronic searches
Relevant studies were located by searching PubMed. A PRISMA flow diagram (Moher et al., 2009) helped manage the search strategy and data extraction. We systematically searched from 1980 to December 2014. No language restriction was applied.
(“nitrates”[MeSH Terms] OR “nitrates”[All Fields]) AND (“neoplasms”[MeSH Terms] OR “neoplasms”[All Fields] OR “cancer”[All Fields])
(“nitrates”[MeSH Terms] OR “nitrates”[All Fields]) AND (“neoplasms”[MeSH Terms] OR “neoplasms”[All Fields] OR “cancer”[All Fields]) AND cohort [All Fields]
(“nitrates”[MeSH Terms] OR “nitrates”[All Fields]) AND (“neoplasms”[MeSH Terms] OR “neoplasms”[All Fields] OR “cancer”[All Fields]) AND case–control [All Fields]
(“nitrates”[MeSH Terms] OR “nitrates”[All Fields]) AND (“neoplasms”[MeSH Terms] OR “neoplasms”[All Fields] OR “cancer”[All Fields]) AND ecological [All Fields]
AND
(“nitrites”[MeSH Terms] OR “nitrites”[All Fields] OR “nitrite”[All Fields]) AND (“neoplasms”[MeSH Terms] OR “neoplasms”[All Fields] OR “cancer”[All Fields])
(“nitrites”[MeSH Terms] OR “nitrites”[All Fields]) AND (“neoplasms”[MeSH Terms] OR “neoplasms”[All Fields] OR “cancer”[All Fields]) AND cohort [All Fields]
AND
(“nitrites”[MeSH Terms] OR “nitrites”[All Fields]) AND (“neoplasms”[MeSH Terms] OR “neoplasms”[All Fields] OR “cancer”[All Fields]) AND case–control [All Fields]
AND
(“nitrites”[MeSH Terms] OR “nitrites”[All Fields]) AND (“neoplasms”[MeSH Terms] OR “neoplasms”[All Fields] OR “cancer”[All Fields]) AND ecological[All Fields]
AND
noc[All Fields] AND (“neoplasms”[MeSH Terms] OR “neoplasms”[All Fields] OR “cancer”[All Fields]) AND cohort[All Fields]
AND
noc [All Fields] AND (“neoplasms”[MeSH Terms] OR “neoplasms”[All Fields] OR “cancer”[All Fields]) AND case–control[All Fields]
noc [All Fields] AND (“neoplasms”[MeSH Terms] OR “neoplasms”[All Fields] OR “cancer”[All Fields]) AND ecological[All Fields]
Study selection, data extraction and assessment of methodology quality (bias)
Two epidemiologists identified potential studies to be added in the opinion provided by EFSA. Full‐text study reports/publications were provided by EFSA. The two epidemiologists screened the full texts and identify studies for inclusion, and identified and recorded reasons for exclusion of the ineligible studies. Disagreements were solved through discussion or, if required, through consultation with the working group. Duplicate records were identified and excluded.
The reviewers assessed the quality of a study in a narrative way. Any discrepancies were addressed by a joint re‐evaluation of the original article by the epidemiologist group.
All studies were described and appeared in the text following the ICD‐10 coding ordering. Description of studies was initiated by the name of the first author and year of publication.
The following items were included while describing each study:
1. Type of study (case–control/cohort/ecological).
2. Characteristics of the population and setting (e.g. age, sex, sample size, cases, controls).
3. Objective of the study.
4. Exposure (type of dietary questionnaire and mode of assessment).
5. Type of outcome (incidence/mortality).
6. Number of cases identified during the follow‐up (cohort).
7. Time of follow‐up and number of lost to follow‐up.
8. Results of the main findings:
8.1 ORs or HRs, with their 95% CI and p for trend if present, and cut‐off values associated with the risk of cancer;
8.2 Confounding factors considered by the authors (main risk factors for the specific cancer) and included in the multivariate analysis (e.g. age, sex, smoking, Helicobacter pylori (for gastric cancer), BMI, total energy intake).
9. Subgroup analysis if conducted (e.g. sex and factors that may potentially affect nitrosation such as vitamin C and vitamin E).
10. Strength and limitation of each study.
References
Higgins JPT, Green S and Cochrane Collaboration, 2008. Cochrane handbook for systematic reviews of interventions. Wiley‐Blackwell, Chichester, UK.
IARC, 2010. Working Group on the Evaluation of Carcinogenic Risks to Humans. Lyon, 14–21 June 2006.
Moher D, Liberati A, Tetzlaff J, Altman DG and Group P, 2009. Preferred reporting items for systematic reviews and meta‐analyses: the PRISMA statement. BMJ, 339, b2535. https://doi.org/10.1136/bmj.b2535 http://apps.who.int/classifications/icd10/browse/2015/en#/INeoplasms (C00‐D48)
Annex 1: Articles selection and studies described

Appendix I – Report on the systematic review on the types and levels of nitrosamines and nitrosamides produced in food products from the use of nitrates and nitrites as food additives
Objective of the Report
This report illustrates the results obtained from the Systematic Review conducted in order to gather evidence on nitrosamines and nitrosamides types and levels in EU authorised products containing nitrates and/or nitrites.
The systematic review process has been already described in detail in the Protocol (see Annex A of this report).
Review question
The objective of this systematic review was to select reliable studies performed to identify the type of nitrosamines and nitrosamides and to measure their respective levels in food products found in the European market to which specified amounts of nitrates/nitrites have been added with the aim to investigate any quantitative relation between such nitrosamine and nitrosamide formation and the levels of nitrate and nitrite added.
I.1. Search strings
Two different search strings were developed for the systematic review (please see details in the Protocol in Annex A and in Table I.1).
Table I.1.
Search strings for conducting the systematic review
| N° | *Search strategy details |
|---|---|
| (1) |
NDMA OR DMNA OR “N‐nitrosodimethylamine$” OR “Dimethylnitrosamine$” OR NMOR OR “N‐nitrosomorpholine$” OR NMEA OR “N‐nitrosomethylethylamine$” OR “N‐Methyl‐N‐nitrosoethanamin$” OR “1‐Ethyl‐1‐methyl‐2‐oxohydrazine$” OR “Methylaethylnitrosamin$” OR “N‐ethyl‐N‐methyl‐nitrous$” OR NPYR OR “N‐nitrosopyrrolidine$” OR NDEA OR DENA OR “N‐nitrosodiethylamine$” OR “diethyl‐2‐oxohydrazine$” OR “N‐Ethyl‐N‐nitrosoethanamin$” OR NPIP OR “N‐nitrosopiperidine$” OR NDPA OR “N‐nitrosodi‐n‐propylamine$” OR “N‐Nitroso‐N‐propyl‐1‐propanamin” OR Oryzalin OR NHPRO OR “N‐nitrosohydroxyproline$” OR NPRO OR “N‐nitrosoproline$” OR NSAR OR “N‐nitrososarcosine$” OR “N‐Nitrosomethylglycine” OR NMA OR “N‐nitrosomethylaniline$” OR “Phenylmethylnitrosamine” OR NDBA OR DBNA OR “N‐nitrosodibutylamine$” OR NDiBA OR “N‐nitrosodiisobutylamine$” OR NDBzA OR “N‐nitrosodibenzylamine$” OR NHMTCA OR “N‐nitroso‐2‐hydroxymethyl‐thiazolidine‐4‐carboxylic$” OR NTCA OR “N‐Nitroso‐thiazolidine‐4‐carboxylic$” OR NMTCA OR “N‐Nitroso‐2‐methyl‐thiazolidine‐4‐carboxylic$” OR NDPhA OR “N‐nitrosodiphenylamine$” OR NPIC OR “N‐nitrosopipecolic$” OR nitrosamine$ OR nitrosamide$ OR NOC$ AND (Lomo OR “cerdo adobado” OR “Pincho moruno” OR “Careta” OR “cerdo adobada” OR “Castilla” OR “cerdo adobada” OR Kasseler OR Bräte OR Surfleisch OR Toorvorst OR Šašlõkk OR Ahjupraad OR “Kiełbasa surowa biała” OR “Kiełbasa surowa metka” OR “Tatar wołowy” OR “danie tatarskie” OR “Dried ham” OR “dried sausage” OR salami OR “Cooked ham” OR “Emulsified sausages” OR “Filet d Ardenne” OR “Swedish Christmas Ham” OR Papillotes OR “Blinde vink” OR meat OR fish OR cheese OR “non‐heat treated processed meat” OR “heat‐treated processed meat” OR “Filet d Ardenne” OR “ripened cheese” OR “whey cheese” OR “beverage whiteners” OR “Wiltshire bacon” OR “Wiltshire ham” OR Entremeada OR entrecosto OR chispe OR orelheira OR cabeca OR salgados OR “toucinho fumado” OR “cured tongue” OR kylmâsavustettu poronliha OR “kallrökt renkött” OR bacon OR “filet” OR “bacon” OR rohschinken OR nassgepökelt OR “dry cured bacon” OR “dry cured ham” OR “jamon curado” OR “paleta curada” OR “lomo embuchado” OR cecina OR presunto OR “jambon” OR rohschinken OR trockengepökelt OR saucisson* OR salchichon OR chorizo OR curacion OR rohwürste OR salami OR kantwurst OR brisket OR rohschinken OR trockennassgepökelt OR nassgepökelt OR meat OR cheese OR fish OR dairy OR “pickled herring” OR sprat OR offal OR pâtés OR terrine OR poultry OR game animals OR milk OR whey) |
| (2) | (Nitrate$ OR Nitrite$) AND (nitrosamine$) OR (nitrosamide$) OR (NOC$) AND (meat OR cheese OR fish OR dairy OR milk OR whey) |
I.2. Results from literature searches and screening of papers
Inclusion and exclusion criteria predefined in the Protocol were used to select and screen papers. In total, 1,861 papers were retrieved from literature searches. After screening process, 33 papers were selected for data extraction and critical appraisal.
-
a
Results from the different steps of literature searches and screening
-
b
Results from the different steps of literature searches and screening including the number of excluding papers
I.3. Results from data extraction and critical appraisal of studies
The data extraction form contained 124 questions (see Protocol Annex A). The results from the critical appraisal of studies are presented in Table I.2.
Table I.2.
Results from the implementation of a Critical Appraisal Tool
| Ref ID | Does the treatment described in the text reflect the recent practises used to prepare meat products as available on the European market?a | Were appropriate control samples used?b | Were the methods used for the measurement of nitrates/nitrites and nitrosamines appropriate?c | Was the design of experiments and the methodology adequately reported? | Were important additional factors considered? | Was the variability reported? |
|---|---|---|---|---|---|---|
| 3672 | Yes | Yes | Yes | Yes | Yes | Yes |
| 3722 | No | Yes | Yes | No | Yes | Yes |
| 3784 | Yes | Yes | Yes | Yes | Yes | Yes |
| 3816 | No | No | Yes | Yes | Yes | Yes |
| 3843 | No | No | Yes | No | Yes | Yes |
| 3919 | No | No | Yes | Yes | Yes | Yes |
| 3936 | Yes | Yes | Yes | Yes | Yes | Yes |
| 4080 | Yes | Yes | Yes | Yes | Yes | Yes |
| 4089 | No | No | No | No | Yes | Yes |
| 4170 | No | Yes | Yes | Yes | Yes | No |
| 4220 | Yes | Yes | Yes | Yes | No | No |
| 4272 | No | No | Yes | Yes | Yes | No |
| 4283 | No | No | Yes | Yes | Yes | No |
| 4333 | No | No | Yes | Yes | Yes | No |
| 4355 | No | Yes | No | No | Yes | No |
| 4378 | Yes | No | Yes | Yes | Yes | No |
| 4385 | No | No | No | No | Yes | No |
| 4386 | Yes | Yes | No | No | Yes | Yes |
| 4440 | Yes | Yes | No | No | Yes | Yes |
| 4516 | Yes | Yes | Yes | Yes | Yes | Yes |
| 4574 | Yes | Yes | Yes | Yes | No | Yes |
| 4637 | No | No | Yes | No | Yes | No |
| 4666 | No | No | No | Yes | Yes | No |
| 4727 | Yes | Yes | Yes | Yes | Yes | No |
| 4731 | Yes | Yes | Yes | No | Yes | Yes |
| 4750 | No | No | No | No | Yes | Yes |
| 4776 | No | No | Yes | Yes | No | Yes |
| 4796 | No | No | Yes | No | Yes | Yes |
| 4820 | No | No | Yes | No | No | Yes |
| 4864 | No | No | No | No | Yes | Yes |
| 4870 | Yes | No | Yes | No | No | No |
| 4872 | Yes | No | No | Yes | Yes | Yes |
| 5809 | Yes | Yes | Yes | Yes | Yes | Yes |
In this question, ‘treatment/s’ refer to sample preparation appropriateness including sample manipulation and addition of compounds such as nitrates, salt and others.
Although the use of controls in the studies was not an inclusion criterion, the use of controls in experimental studies was considered important for the quality assessment of the studies included in the review.
Although the reference to LOD in the studies was an inclusion criterion, studies suggesting the availability of LOD were also considered.
a,b,c These criteria have been considered important for the selection of acceptable quality studies.
The system for the classification of selected papers into ‘tiers of reliability’ (presented in the Protocol) was designed as follows:
Tier 1 – ‘good quality’ papers – the answers to the first three questions were yes. These questions have been considered as crucial in order to retrieve studies of good quality.
Tier 2 – ‘low quality’ papers – one or more of the answers to the first three questions was/were no.
Out of 33 articles, 23 of them were considered of ‘low quality’ (tier 2) and 10 papers were considered ‘good quality’ papers (tier 1). The papers included in tier 1 were used to produce data synthesis and conclusions for the Opinion.
I.4. Studies selected for narrative appraisal
Meat products
Regarding studies on meat products six articles were identified fulfilling the criteria a, b and c, e.g. using appropriate meat products, including appropriate controls and presenting limit of quantitation (LOQ) values. Below, there is the detailed narrative appraisal of these studies. In these studies, added amounts of nitrites are reported. None of them included the addition of nitrates in the meat products.
De Mey et al. (2014)
This study was made in raw fermented sausage for the determination of the N‐nitrosopiperidine (NPIP) formation, in relation to the addition of nitrite, ascorbic acid, biogenic amine (cadaverine) and its precursor (piperidine). The effect of pH in on NPIP formation has been also investigated.
The ingredients were pork meat, pepper and salt and nitrite, ascorbic acid, piperidine and cadaverine, depending on the experiment. The raw fermented sausages were produced with a standard process consisting in a fermentation during 3 days at 24°C and 94% relative humidity (RH) of the mixed ingredients stuffed in casings, followed by a ripening during 21 days at 15°C and 85% RH. During fermentation, the sausages were smoked. The reported limit of detection (LOD) and LOQ were 0.9 μg/kg DM and 2.7 μg/kg DM, respectively, for NPIP analysis and 2 mg/kg and 10 mg/kg for nitrite determination. The amount of nitrite added was 150 mg/kg. When sodium ascorbate was added (500 mg/kg), the concentration of nitrite decreased immediately after stuffing under the LOQ. When ascorbic acid was not added, an average concentration of nitrite detected was 37 mg/kg after stuffing, meaning that only a 10% of the nitrite added was left in this initial step before fermentation. It was also demonstrated that NPIP formation was not affected by pH difference and that cadaverine, the biogenic amine added as a precursor for NPIP formation, did not have any effect. Only for the formulation with added PIP, the maximum level of NPIP reported was 2.9. It was also observed that the formation of nitrosamines occur mainly at the beginning of the production before fermentation.
The Panel noted that for control samples with or without nitrite added, NPIP was not detected except for the samples with nitrite added with maximum level reported of 1.2 μg/kg that is below the quantification level. It is also noted that the basic formulation contained white pepper (2 g/kg) and eventually PIP is also present. The levels of NPIP in the final product are very low and in most cases below the LOQ even when piperidine is added. The Panel indicates that only minimum and maximum data are reported. No mean values are provided and the smoking process is not described. Given the properties of the smoke as an antioxidant due to its phenolic content, it is not clear if the observed effect of nitrate reduction at the beginning could be due in part to this treatment.
Drabik‐Markievicz et al. (2011)
The study has been made in a meat model corresponding to the raw cooked meat product type. The nitrosamines analysed were N‐nitrosodimethylamine (NDMA) and N‐nitrosopyrrolidine (NPYR). The effect of temperature and of the amount of nitrate and some biogenic amines (putrescine, cadaverine, spermidine and spermine) in the nitrosamines formation has been studied. The LOD and LOQ were 0.125–0.136 μg/mL (add LOD in μg/kg) and 0.375–0.408 μg/mL, respectively. There is a clear increasing effect of temperature only for NDMA, when the amount of nitrite is > 120 mg/kg and temperatures > 120°C. The maximum levels of NDMA reported are 0.375 μg/mL for 220°C when 120 mg/kg of nitrite is added. The Panel noted that when the amount of nitrite added is 300% higher (480 mg/kg), there is no proportional increase in NDMA because there is an increase of only 18%. The type of biogenic amine present in food has an influence on the final amount of nitrosamines. Among several biogenic amines added, only the addition of spermidine, resulted in higher amounts of NDMA formed, under conditions in which amounts above the legal limits of nitrite are added.
In the case of NPIP, the nitrite and high temperatures had no role in the formation of this nitrosamine, with levels found below the LOQ with the higher temperatures. However, biogenic amines caused a significant increase in the concentration of NPIP reaching values of 0.491 μg/mL and 0.747 μg/mL when cadaverine and spermidine were added, respectively.
De Mey et al. (2009)
The study reports the impact of heating on nitrosamine formation in a lean meat model corresponding to the ‘raw cooked meat products’ category. The impact of a biogenic amine, cadaverine, has been also studied. Cadaverine can be present in fresh meat and could be very high in low quality meat due to the growth of bacteria.
The heat treatments simulated were pasteurisation (85°C), sterilisation (120°C), baking and roasting (160 and 220°C). The levels of NDMA, N‐nitrosodiethylamine (NDEA), N‐nitrosodibutylamine (NDBA), NPIP and NPYR were measured.
The amounts of nitrite used in the experiments were 120 and 480 mg/kg, with appropriate controls included without nitrite.
The LODs and LOQs were reported for each of the nitrosamines analysed (Table provided). NDEA and N‐nitrosodibutylamine (NDBA) were not detected and NPIP was only found when cadaverine was added. NPYR was detected in meat products processed at 220°C. Cadaverine had no impact on NPYR. NDMA was only detected above LOQ (0.2 μg/kg) when amounts of nitrite above the legal limits were added (480 mg/kg) and meat samples processed at 220°C.
Shahidi et al. (1994)
In this research, an alternative to the use of nitrite is tested to avoid the formation of nitrosamines. The raw materials used were pork, cod and cod surimi and mixtures of pork with 15% or 50% of cod or surimi have been also tested with (156 mg/kg NaNO2) and without the addition on nitrites. The samples were heat treated (85°C).
The only nitrosamine measured was NDMA, and it was not found in any meat sample even those with 156 mg/kg NaNO2 added. Only in cod, levels of NDMA were reported from 0 to 9 μg/kg and when mixtures were used, but levels were 0–3 μg/kg when nitrite was added in pork and cod mixtures, for the others 0–2 μg/kg. The LOD reported was 2 μg/mL. LOQ was not provided.
The Panel commented that
fish products have higher contents of biogenic amines that are necessary as substrates for the formation of nitrosamines.
ascorbate is present in all samples as an additive. This means that ascorbate could have an influence as nitrite or N‐nitrosamine scavenger modifying the results.
the levels of nitrate or nitrites in control samples should have been measured. Also, the residual levels in the final product.
comminuted mixtures of meat and fish are used for the production of some types of sausages, in which the nitrites might be present due to their permission in meat. In these products, the risk of formation of nitrosamines is higher due to the higher content of biogenic amines that are the N‐nitrosamines precursors.
the treatment temperature (85°C) is very low for N‐nitrosamines formation. In other studies where temperatures up to 220°C are required for the formation of NOCs even with very high amounts of nitrite added (ca 400 mg/kg), for raw cooked products.
biogenic amines are formed from amino acids. Surimi can be a source of biogenic amines.
if we consider LOQ three times the LOD, then only the levels of 9 μg/kg reported are above the LOQ.
Drabik‐Markievicz et al. (2010)
In this research, the influence of pyrrolidine on N‐nitrosamine formation in a raw cooked meat product and the effect of processing temperatures were studied and controls with the presence and absence of nitrites were included. The LOD for a solution containing NAs was 0.125 μg/mL and the LOQ was 0.375 μg/mL. The volatile nitrosamines measured were NDMA and NPYR.
Different amounts of nitrate were added (0, 120 and 480 mg/kg). Proline or hydroxyproline (1,000 mg/kg) or pyrrolidine (10 mg/kg) have also been added.
Temperatures applied were 85°C (pasteurisation), 120°C (sterilisation) and 120–220°C (baking and roasting).
For levels of nitrite of 480 mg/kg and temperatures up to 220°C, NDMA and NPYR were detected in the highest amounts (0.441 and 0.523 μg/mL for NDMA and NPYR, respectively).
It was found that addition of proline did not affect the formation of NDMA, but had a significant influence in the formation of NPYR. This is not the case of hydroxyproline, which is one of the main constituents of collagen.
Herrmann et al. (2015a)
The research in this study is focused on the effect of the amount of nitrite, storage conditions (after preparation, after drying and refrigerated at 5°C for 24 h) and frying (10 min, internal temperature of 100°C) on the formation of volatile and non‐volatile nitrosamines in raw cooked sausages. The influence of water‐soluble (erythorbic acid) and fat‐soluble (ascorbyl palmitate) antioxidants, fat content, tripolyphosphate, black pepper, haem iron and calcium carbonate were also reported.
The cooked pork sausages were prepared with 67% of meat, potato flour (4%), black pepper (0.125% or 0.5%), paprika (0.5%), sodium chloride (2%) and nitrite (0, 60, 100, 150, 250 and 350 mg/kg), filled into sheep casings and dried for 50 min at 70°C in an oven or drying cabinet. For other experimental setups, the sausages were prepared with 150 mg/kg of sodium nitrite, erythorbic acid (250 or 1,000 mg/kg), ascorbyl palmitate (0 or 250 mg/kg), fat content (12 or 25%), black pepper (1.25 or 5 g/kg), myoglobin (0 or 1.5 mg/kg), iron (III) sulfate hydrate (0 or 36 mg/kg, calcium carbonate (0 or 6 g/kg) and tripolyphosphate (0 or 5 g/kg). Different combinations of the two antioxidants were also tested.
The levels of non‐volatile (N‐nitrosohydroxyproline (NHPRO), N‐nitrosoproline (NPRO), N‐nitroso‐thiazolidine‐4‐carboxylic acid (NTCA), N‐nitroso‐2‐hydroxymethyl‐thiazolidine‐4‐carboxylic acid (NMTCA)) and volatile (N‐nitrososarcosine (NSAR), NDMA, NPYR, N‐nitrosopipecolic acid (NPIC), NPIP) nitrosamines were measured. An increase in the level of non‐volatile nitrosamines was reported with increasing ingoing amounts of nitrite, and particularly the levels of NMTCA for concentrations of nitrite > 150 mg/kg. Regarding the volatile nitrosamines, NSAR was only detected for nitrite > 150 mg/kg, and the levels of NDMA and NPYR were practically not affected by the level of nitrite and remained at or below the LOQ.
For the other factors studied, the increasing levels of antioxidants, diminished the levels of nitrosamines, except for the volatile nitrosamines (NSAR, NDMA and NPYR) that were at the LOD and NPIP that was also not reduced. When both antioxidants are added, erythorbic acid presented the higher effect on the reduction in nitrosamine levels, with an increase in the inhibition of nitrosamine formation with increasing levels of erythorbic acid. This effect has been found to be counteracted with the addition of Fe(III) that could act as a prooxidant. For different fat contents, no significant differences were found in the levels of nitrosamines. The level of NPIP increased from 0.1 to 0.4 μg/kg with increasing amount of black pepper, and the difference was significant when the products were stored four days at 5°C (data not shown). This study indicates that NPIP could partly originate from black pepper and that the levels of NPIP when no antioxidants were added were from 2 to 2.7 μg/kg. The use of tripolyphosphate had not any significant effect. No significant effect was observed for the supplementation with myoglobin indicating that haem is not a catalyst for the formation of nitrosamines in meat products.
The Panel noted that there is a clear positive correlation between the amount of nitrite added in raw cooked sausages and the levels of non volatile nitrosamines.
The Panel further noted that with thermal treatments > 120°C to the meat products, there was an increase in the levels of NPIP and NMTCA (2, 6 and 80 μg/kg respectively), while only a slight increase was observed for NDMA and NPYR.
Dairy products
Regarding studies on dairy products four articles were identified fulfilling the criteria a, b and c, e.g. using appropriate dairy products (cheeses), including appropriate controls and presenting LOQ values. The detailed narrative appraisal of these studies is described below. In these studies, added amounts of nitrates were reported.
Stasiuk and Prybylowski (2006)
In this study, the effect of ingoing amounts of potassium nitrate on the formation of volatile nitrosamines in Gouda cheese has been reported. The experimental approach consisted on cheese prepared without the addition of KNO3 and immersed in brine for 48 h in different concentrations (0.05%, 0.10% and 0.15%) of nitrate after pressing step, and cheese made with milk containing 0.02% KNO3. These cheeses were then ripened for 6 weeks at 10–12°C and 80–90% relative humidity. The levels of NDMA and NDEA were measured. The LOD was 0.01 μg/kg. The results demonstrated that the addition of nitrate to brine instead of milk did not have any impact on the levels of nitrosamines in cheese, with values up to 0.55 μg/kg for NDMA and 1.44 μg/kg for NDEA.
It was found that there was no relationship between the level of nitrate and the amount of NDMA and NDEA formed in Gouda cheese after ripening.
Bouchikhi et al. (1999)
The effect of the addition of nitrate to milk for the production of fresh semihard cheese (Saint‐Paulin) on the formation of volatile nitrosamines has been reported. The cheese was made with pasteurised milk with rennet and 20 g KNO3/100 mL. A mixture of lactobacilli and streptococci was added for the elaboration of the cheese. The period of ripening was 8 weeks and samples were taken at 20, 40 and 60 days. It was observed that a significant decrease (56%) in the levels of NO3 during the first 20 days of ripening; this could be explained by the reduction of some NO3 − to NO2 −. All the cheeses with and without added nitrate had the same nitrate levels at the end of ripening. The levels of NDMA were very low during the ripening period in controls and experimental cheeses, and therefore, any influence of the amount of nitrate added could not be demonstrated.
Glória et al. (1997)
The influence of nitrate added on volatile nitrosamine content (NDMA and NDEA) in Gruyère cheese has been studied. It should be noted that nitrate was detected in cheese where not nitrate was added and that nitrite was in much smaller amounts than nitrate. Certain strains of lactobacilli can have a reducing activity. There was no correlation between residual nitrite levels and nitrate levels added or nitrate detected in Gruyère.
Even though the nitrate levels used in the experiments are much higher than the permitted legal levels, the levels of NDMA and NDEA formed are very low.
Smiechowska et al. (1994)
The formation of volatile nitrosamines (NDMA, NDEA, NDPA, NDBA, NPYR, NPIP, NMOR) in different types of cheese (Zulaw, Gouda and Edam) has been investigated. Cheeses were made with pasteurised milk. Different amounts of KNO3 were added to milk (0%, 0.01% and 0.02%). The cheeses were ripened for 14, 28 and 42 days. NDMA was found in almost all samples, with amounts ranging from 18.94 to 168.80 μg/kg in some samples of Gouda and Edam cheeses. It should be noted that volatile nitrosamines can be formed in cheese produced without addition of KNO3, but containing native nitrates. The results showed a significant influence of ripening time on the amount of NDMA in Zulaw cheese. However, the nitrate added to milk did not influence the level of NDMA (0.04–3.79 μg/kg). NDPA was not found in all the samples. NDEA only appears in some samples after 4 or 6 weeks of ripening in Zulaw cheese and it was occasionally found in Gouda and Edam cheese.
It should be noted that the formation of volatile nitrosamines is not related with KNO3 but with the degree of ripeness.
Fish products
Regarding studies on fish products, no articles were identified fulfilling the criteria a, b and c, e.g. using appropriate fish products, including appropriate controls and presenting LOQ values.
Annex A – Protocol for the systematic review on the types and levels of nitrosamines and nitrosamides produced in food products from the use of nitrates and nitrites as food additives
Background
Nitrate/nitrites are naturally occurring compounds in foods, especially foods of plant origin and vegetables, and are also used as food additives, mainly in meat products. Nitrites amounts are reduced rapidly in meat products and monitoring residual levels of nitrite in the final product are much lower that the nitrites amount initially added.
Under the appropriate conditions (pH, concentration of reactants), nitrites have been shown to form N‐nitroso compounds (nitrosamines and nitrosamides) from constituents in the food. Some nitrosamines are among important potential carcinogens found in the usual diet of Western populations. Diet is a main source of exposure to these compounds, although there are other main sources of exposure, such as smoking and environmental pollution. Although there is extensive evidence of their carcinogenic effects in experimental studies in animals, there are inadequate data of their concentrations in food and of exposure in human populations. The concentration of these compounds in foods is associated with preparation, preservation and cooking methods.
Therefore, during the re‐evaluation of the nitrites and nitrates as food additives, it was considered important to address the question of which nitrosamines and nitrosamides are produced in food products from the use of nitrates and nitrites as food additives and at which levels they can be found in those food products.
Review question
Which nitrosamines and nitrosamides are produced in food products from the use of nitrates and nitrites as food additives and at which levels they can be found in those food products.
Objectives of the review
The objective of this systematic review is to select reliable studies performed to identify the type of nitrosamines and nitrosamides and to measure their respective levels in food products found in the European market to which nitrates/nitrites have been added with the aim to investigate any quantitative relation between such nitrosamine and nitrosamides formation and the levels of nitrate and nitrite added.
Eligibility Criteria for the selection of relevant studies
The criteria that will be applied to select the studies that are to be included in or excluded from the review are described in Table A.1.
Table A.1.
Eligibility (inclusion) criteria for studies
| # | Studies will be included in the review if presenting the following characteristics |
|---|---|
| 1. |
Time frame 1.1.1990 until 31.12.2015 |
| 2. |
Type of studies Experimental studies assessing the levels of nitrosamines and nitrosamides in food products to which nitrites or nitrates have been added. Survey and reviews will be saved for comparison and source of additional literature |
| 3. |
Languages Studies in English, French, Italian, Spanish, Portuguese, Dutch and German for papers extracted from electronic databases |
| 4. |
Population Studies that include food products to which nitrates and nitrites have been added in specified amounts consumed in the European market (food could originate from EU or outside EU), including fish, cheese, whey, meat preparations, non‐heat treated processed meat, heat treated processed meat sterilised and non‐sterilised, other meat products) |
| 5. |
Intervention Studies where nitrates and nitrites have been added to the products in specified amounts |
| 6. |
Outcome Studies reporting the types of nitrosamines and nitrosamides and their measured levels (nitrosamines and nitrosamides), individually or as a combination in food products found in the European market |
Main exclusion criteria
Studies before 1.1.1990.
Languages excluded: non‐European Union languages and European languages which cannot be dealt with by the reviewers.
Compounds excluded: N‐nitroso compounds other than nitrosamines and nitrosamides.
Studies lacking data on quality of the measurements e.g. LOD or LOQ will be excluded.
Nitrates/nitrites amounts added per unit of weight not specified.
Method foreseen for performing the systematic review
Searching for relevant studies
The search process will aim at retrieving primary and secondary research studies relevant to the review question as described above.
Search strategy: The search strategy is displayed in Table A.2.
Table A.2.
Bibliographic databases and search strategy to be applied
| Name | Timespan of the database | Search strategy to be applied* |
|---|---|---|
| Web of ScienceTM Core Collection (Editions=SCI‐EXPANDED, SSCI. Interface= Web of Science) | 1975–present | (1) |
| Current Contents Connect® (Editions= all. Interface= Web of Science) | 1998–present | (1) |
| CABI: CAB Abstracts® (Interface= Web of Science) | 1910–present | (1) |
| FSTA® – the food science resource (Interface= Web of Science) | 1969–present | (1) |
| Medline® – (Interface= Web of Science) | 1946–present | (1) |
| Système Universitaire de Documentation (SUDOC) http://www.sudoc.abes.fr | 18xx–present | (2) |
| Trove http://trove.nla.gov.au | Not specified | (2) |
| Global ETD search http://search.ndltd.org/ | 1900–present | (2) |
| OpenGREY http://www.opengrey.eu/ | 1990–present | (2) |
| N° | *Search strategy details | |
| (1) |
NDMA OR DMNA OR “N‐nitrosodimethylamine$” OR “Dimethylnitrosamine$” OR NMOR OR “N‐nitrosomorpholine$” OR NMEA OR “N‐nitrosomethylethylamine$” OR “N‐Methyl‐N‐nitrosoethanamin$” OR “1‐Ethyl‐1‐methyl‐2‐oxohydrazine$” OR “Methylaethylnitrosamin$” OR “N‐ethyl‐N‐methyl‐nitrous$” OR NPYR OR “N‐nitrosopyrrolidine$” OR NDEA OR DENA OR “N‐nitrosodiethylamine$” OR “diethyl‐2‐oxohydrazine$” OR “N‐Ethyl‐N‐nitrosoethanamin$” OR NPIP OR “N‐nitrosopiperidine$” OR NDPA OR “N‐nitrosodi‐n‐propylamine$” OR “N‐Nitroso‐N‐propyl‐1‐propanamin” OR Oryzalin OR NHPRO OR “N‐nitrosohydroxyproline$” OR NPRO OR “N‐nitrosoproline$” OR NSAR OR “N‐nitrososarcosine$” OR “N‐Nitrosomethylglycine” OR NMA OR “N‐nitrosomethylaniline$” OR “Phenylmethylnitrosamine” OR NDBA OR DBNA OR “N‐nitrosodibutylamine$” OR NDiBA OR “N‐nitrosodiisobutylamine$” OR NDBzA OR “N‐nitrosodibenzylamine$” OR NHMTCA OR “N‐nitroso‐2‐hydroxymethyl‐thiazolidine‐4‐carboxylic$” OR NTCA OR “N‐Nitroso‐thiazolidine‐4‐carboxylic$” OR NMTCA OR “N‐Nitroso‐2‐methyl‐thiazolidine‐4‐carboxylic$” OR NDPhA OR “N‐nitrosodiphenylamine$” OR NPIC OR “N‐nitrosopipecolic$” OR nitrosamine$ OR nitrosamide$ OR NOC$ AND (Lomo OR “cerdo adobado” OR “Pincho moruno” OR “Careta” OR “cerdo adobada” OR “Castilla” OR “cerdo adobada” OR Kasseler OR Bräte OR Surfleisch OR Toorvorst OR Šašlõkk OR Ahjupraad OR “Kiełbasa surowa biała” OR “Kiełbasa surowa metka” OR “Tatar wołowy” OR “danie tatarskie” OR “Dried ham” OR “dried sausage” OR salami OR “Cooked ham” OR “Emulsified sausages” OR “Filet d Ardenne” OR “Swedish Christmas Ham” OR Papillotes OR “Blinde vink” OR meat OR fish OR cheese OR “non‐heat treated processed meat” OR “heat‐treated processed meat” OR “Filet d Ardenne” OR “ripened cheese” OR “whey cheese” OR “beverage whiteners” OR “Wiltshire bacon” OR “Wiltshire ham” OR Entremeada OR entrecosto OR chispe OR orelheira OR cabeca OR salgados OR “toucinho fumado” OR “cured tongue” OR kylmâsavustettu poronliha OR “kallrökt renkött” OR bacon OR “filet” OR “bacon” OR rohschinken OR nassgepökelt OR “dry cured bacon” OR “dry cured ham” OR “jamon curado” OR “paleta curada” OR “lomo embuchado” OR cecina OR presunto OR “jambon” OR rohschinken OR trockengepökelt OR saucisson* OR salchichon OR chorizo OR curacion OR rohwürste OR salami OR kantwurst OR brisket OR rohschinken OR trockennassgepökelt OR nassgepökelt OR meat OR cheese OR fish OR dairy OR “pickled herring” OR sprat OR offal OR pâtés OR terrine OR poultry OR game animals OR milk OR whey) |
|
| (2) | (Nitrate$ OR Nitrite$) AND (nitrosamine$) OR (nitrosamide$) OR (NOC$) AND (meat OR cheese OR fish OR dairy OR milk OR whey) | |
Information sources:
Published reviewed scientific literature will be searched using the following two bibliographic databases: Web of Science (WoS) and PubMed.
Grey literature will be searched using the following databases: Système Universitaire de Documentation (SUDOC), Trove, Global ETD search and OpenGREY.
Due to the limited time and resources information, sources other than the above‐mentioned will not be searched.
The search will be performed by EFSA staff who will then merge the search results using appropriate reference management software (i.e. EndNote®) and remove duplicate records.
The possible studies retrieved from grey literature or received from the EU MS will be inserted into the reference management software by EFSA staff (FIP unit).
Selecting the studies
The study selection/screening process, data extraction and appraisal of the selected studies will be performed using the systematic review system DistillerSR (Evidence Partners, Ottawa, Canada).
The stepwise selection process and related responsibilities are described in Table A.3.
Table A.3.
Study selection process
| # | WHAT | WHO |
|---|---|---|
| First screening step (title and abstract screening) | Examine titles and abstracts to remove obviously irrelevant citations (reviewers must be over‐inclusive at this stage). In cases when the reviewer cannot make a decision (‘Cannot tell’ in the Distiller form) and/or in case of disagreements, the paper will proceed to full text screening | In parallel by two mutually independent reviewers per reference (by two EFSA staff) |
| Second screening step (full text screening) |
Retrieve full‐text documents of the potentially relevant citations. If within 15 days from the beginning of the search, the full text is not found the paper will be marked as not available The full‐text documents will be screened for exclusion criteria, relevance and for nitrate and nitrite measurements and estimations in food products consumed in EU Disagreements will be solved by discussion between the reviewers. In the case where an agreement between reviewers cannot be reached, the opinion of one or more experts from the WG will be sought |
FIP staff, in case the paper is not available under current EFSA subscription, a request will be sent to the EFSA Library to obtain the article Screening done by two reviewers (two FIP staff) |
Additional information on how the study selection process will be undertaken:
Reviewers will be domain experts and experts with broader expertise in food safety.
The records will not be blinded, for example, author's names, journal, etc. The study selection will be performed in parallel by two mutually independent reviewers per paper (two FIP EFSA staff).
Extracting data from included studies
The methodology that will be applied for the data extraction process is summarised as follows:
-
3.1
The data that will be extracted from the included studies are illustrated in Table A.4.
-
3.2
The data extraction will be performed in parallel by three mutually independent reviewers (three EFSA staff, one of them acting as overall reviewer).
-
3.3
Disagreements will be solved by discussion between the reviewers. In case of doubts, the paper will be put to the attention of the ANS Panel working group in charge of the assessment that will decide on the data to be extracted.
-
3.4
Full‐text documents written in a language not readable by the reviewers will be excluded.
-
3.5
Studies published more than once in multiple reports will be identified and included only once in the final review.
Table A.4.
Data to extract from the included studies
| Question | Type |
|---|---|
| 1 | Experiment setting (laboratory or other type) |
| 2 | Food/s category/ies? |
| 3 | Meat categories |
| 4 | Meat product origin |
| 5 | Fish categories |
| 6 | Fish treatment |
| 7 | Dairy product |
| 8 | Whey product |
| 9 | Whey product description |
| 10 | Meat product name |
| 11 | Meat product description |
| 12 | Cheese product name |
| 13 | Cheese product description |
| 14 | Method of nitrate addition in cheese |
| 15 | Time in brine |
| 16 | Time units |
| 17 | Cheese ripening |
| 18 | Humidity |
| 19 | Temperature of ripening °C |
| 20 | Time of ripening |
| 21 | Time units |
| 22 | Curing of the meat product |
| 23 | Description of the salt preparation |
| 24 | Humidity |
| 25 | Temperature of curing °C |
| 26 | Time of curing |
| 27 | Time units |
| 28 | Precooking of the meat product |
| 29 | Temperature of precooking °C |
| 30 | Time of precooking |
| 31 | Time units |
| 32 | Heat processing of the meat product |
| 33 | Temperature of heating °C |
| 34 | Type of heating |
| 35 | Time of heating |
| 36 | Time units |
| 37 | Fermentation of the meat product |
| 38 | Fermentation mix |
| 39 | Humidity |
| 40 | Temperature of fermentation °C |
| 41 | Time of fermentation |
| 42 | Time units |
| 43 | Smoking of the meat product |
| 44 | Smoking mix |
| 45 | Temperature of smoking °C |
| 46 | Time of smoking |
| 47 | Time units |
| 48 | Drying of meat product |
| 49 | Humidity |
| 50 | Temperature of drying °C |
| 51 | Time of drying |
| 52 | Time units |
| 53 | Ripening of meat product |
| 54 | Humidity |
| 55 | Temperature of ripening °C |
| 56 | Time of ripening |
| 57 | Time units |
| 58 | Other type of processing of meat product |
| 59 | Humidity |
| 60 | Temperature of other process °C |
| 61 | Time of other process |
| 62 | Time units |
| 63 | Preservation before analysis |
| 64 | pH of the product |
| 65 | Packaging |
| 66 | Time of storage in hours |
| 67 | Temperature of storage in °C |
| 68 | Other conditions of storage |
| 69 | Amount of ascorbates |
| 70 | Units as reported in the paper |
| 71 | Amount of erythorbates |
| 72 | Units as reported in the paper |
| 73 | Amount of polyphosphates |
| 74 | Units as reported in the paper |
| 75 | Amount of pepper |
| 76 | Units as reported in the paper |
| 77 | Amount of paprika |
| 78 | Units as reported in the paper |
| 79 | Amount of tocopherol |
| 80 | Units as reported in the paper |
| 81 | Amount of other_old |
| 82 | Amount of other_old |
| 83 | Units as reported in the paper |
| 84 | Other |
| 85 | Amount of other |
| 86 | Units as reported in the paper |
| 87 | Amount of other |
| 88 | Units as reported in the paper |
| 89 | Amount of nitrates added |
| 90 | Units as reported in the paper |
| 91 | Amount of nitrites added |
| 92 | Units as reported in the paper |
| 93 | Were residual nitrates/nitrites levels measured? |
| 94 | Extraction method used for nitrates/nitrites |
| 95 | Detection method used for nitrates/nitrites |
| 96 | LOD for nitrates/nitrites |
| 97 | LOQ for nitrates and nitrites |
| 98 | Levels of nitrates |
| 99 | Please indicate if this is the mean, median, other for the level of nitrates |
| 100 | Variability levels of nitrates |
| 101 | Measurement of variability levels of nitrates |
| 102 | Units as reported in the paper |
| 103 | Levels of nitrites |
| 104 | Please indicate if this is the mean, median, other for the level of nitrites |
| 105 | Variability level of nitrites |
| 106 | Measurement of variability levels of nitrites |
| 107 | Units as reported in the paper |
| 108 | Number of NOCs measured |
| 109 | Extraction method used for NOC |
| 110 | Detection method for NOC |
| 111 | LOD for NOC |
| 112 | LOQ for NOC |
| 113 | Number of NOC |
| 114 | Outcome: type of NOCs |
| 115 | Outcome: type of NOC SHORT NAME |
| 116 | Outcome: level of NOCs |
| 117 | Please indicate if this is the mean, median, other for the level of NOCs |
| 118 | Min value for NOCs |
| 119 | Max value for NOCs |
| 120 | Units as reported in the paper |
| 121 | Variability levels of NOCs |
| 122 | Measurement of variability levels of NOCs |
| 123 | Number of repetitions from sample/s |
| 124 | Comments |
Assessing the methodological quality of the included studies
The aim of this step is to appraise the internal validity (i.e. risk of bias) of the studies included in the review.
The criteria that will be applied for the assessment of the methodological quality of selected papers is summarised as follows:
Full‐text documents that pass the eligibility criteria will be assessed using the Critical Appraisal Form illustrated in Figure A.1.
The methodological quality assessment will be performed by three mutually independent reviewers (three FIP unit staff) with one of them acting as overall reviewer and a WG expert will supervise the work.
Disagreements will be solved by discussion between the reviewers. In case of doubts, the paper will be put to the attention of the ANS Panel working group in charge of the assessment that will decide on the appraisal.
A system for categorising selected studies based on the final quality assessment will be in place. Studies will be assigned to one of 2 ‘tiers of reliability’. The decision regarding which studies to include for data synthesis (all or some of them, e.g. considered of higher quality) will be taken by the WG.
Figure A.1.
Critical Appraisal Form which includes key questions to critically appraise and to assess the internal validity of the studies included in the systematic review
System for the classification of selected publications into “tiers of reliability”
Selected papers will be classified into different ‘tiers of reliability’ as follows:
Tier 1‐ ‘good quality’ papers – the answers to the first three questions were yes. These questions have been considered as crucial in order to retrieve studies of good quality.
Tier 2‐ ‘low quality’ papers – one or more of the answers to the first three questions was/were no.
Synthesising the data from the included studies and weight of evidence
For this systematic review, a meta‐analysis of the results of the experimental studies might be feasible and, therefore, the decision for a meta‐analysis or a narrative synthesis of the evidence will not be taken a priori. In the case that a meta‐analysis will not be feasible, the results will be synthesised using tables, graphical methods (forest plot) and/or textual description. The following are proposed outcomes for analysis: types of N‐nitroso compounds most likely to be formed in the different food products and their estimated levels reported in the literature.
The studies could be grouped (for data synthesis) based on study designs, type of compounds and/or ‘tiers of reliability’.
Supporting information
Summary of the reported use levels (mg/kg or mg/L as appropriate) of potassium and sodium nitrite (E 249–250) provided by industry and of analytical results (mg/kg) of potassium and sodium nitrite (E 249–250) provided by Members States
Number and percentage of food products labelled with nitrites (E 249–250) out of the total number of food products present in Mintel GNPD per food sub‐category between 2011 and 2015
Concentration levels of potassium and sodium nitrite (E 249‐250) used in the refined exposure scenarios (mg/kg or mL/kg as appropriate)
Summary of total estimated exposure to potassium and sodium nitrite (E 249‐250) from its use in the maximum level exposure scenario and the refined exposure assessment scenarios per population group and survey: mean and 95th percentile (mg/kg bw per day)
Suggested citation: EFSA ANS Panel (EFSA Panel on Food Additives and Nutrient Sources added to Food) , Mortensen A, Aguilar F, Crebelli R, Di Domenico A, Dusemund B, Frutos MJ, Galtier P, Gott D, Gundert‐Remy U, Lambré C, Leblanc J‐C, Lindtner O, Moldeus P, Mosesso P, Oskarsson A, Parent‐Massin D, Stankovic I, Waalkens‐Berendsen I, Woutersen RA, Wright M, van den Brandt P, Fortes C, Merino L, Toldrà F, Arcella D, Christodoulidou A, Cortinas Abrahantes J, Barrucci F, Garcia A, Pizzo F, Battacchi D and Younes M, 2017. Scientific Opinion on the re‐evaluation of potassium nitrite (E 249) and sodium nitrite (E 250) as food additives. EFSA Journal 2017;15(6):4786, 157 pp. 10.2903/j.efsa.2017.4786
Requestor: European Commission
Question numbers: EFSA‐Q‐2011‐00460; EFSA‐Q‐2011‐00461
Panel members: Fernando Aguilar, Riccardo Crebelli, Alessandro Di Domenico, Birgit Dusemund, Maria Jose Frutos, Pierre Galtier, David Gott, Ursula Gundert‐Remy, Claude Lambré, Jean‐Charles Leblanc, Oliver Lindtner, Peter Moldeus, Alicja Mortensen, Pasquale Mosesso, Agneta Oskarsson, Dominique Parent‐Massin, Ivan Stankovic, Ine Waalkens‐Berendsen, Rudolf Antonius Woutersen, Matthew Wright and Maged Younes.
Acknowledgements: The Panel wishes to thank the following for the support provided to this scientific output: The hearing experts from the Scientific Committee: Josef Schlatter and Thorhallur Halldorsson; the hearing experts from the CONTAM Panel: Helle Knutsen and Jan Alexander and the members of the CONTAM Panel: Lars Barregard and the EFSA staff members Andea Bau, Petra Gergelova, Gilles Guillot, Laura Martino and Jose Gomez Ruiz for the support provided to this scientific output. The Panel wishes to acknowledge all European competent institutions, Member State bodies and other organisations that provided data for this scientific output.
Adopted: 5 April 2017
Amended: 13 February 2019
Notes
Commission Decision 2010/561/EU
Regulation (EC) No 1333/2008 of the European Parliament and of the Council of 16 December 2008 on food additives. OJ L 354, 31.12.2008, p. 16–33.
Commission Regulation (EU) No 257/2010 of 25 March 2010 setting up a programme for the re‐evaluation of approved food additives in accordance with Regulation (EC) No 1333/2008 of the European Parliament and of the Council on food additives. OJ L 80, 26.3.2010, p. 19–27.
COM(2001) 542 final.
Food Additives in Europe 2000, Status of safety assessments of food additives presently permitted in the EU, Nordic Council of Ministers, TemaNord 2002, 560.
Call for scientific data on food additives permitted in the EU and belonging to the functional classes of preservatives and antioxidants. Published: 23 November 2009. Available online: http://www.efsa.europa.eu/en/dataclosed/call/ans091123
Call for scientific data on selected food additives permitted in the EU‐ Extended deadline: 1 September 2014 (batch A), 1 November 2014 (batch B). Available online: http://www.efsa.europa.eu/en/dataclosed/call/140324.htm
Available online: http://www.efsa.europa.eu/en/datexfoodcdb/datexfooddb.htm
Commission Regulation (EC) No 1333/2008 of the European Parliament and of the Council of 16 December 2008 on food additives. OJ L 354, 31.12.2008, p. 16.
Commission Regulation (EU) No 231/2012 of 9 March 2012 laying down specifications for food additives listed in Annexes II and III to Regulation (EC) No 1333/2008 of the European Parliament and of the Council. OJ L 83, 22.3.2012, p. 1–295.
Call for food additives usage level and/or concentration data in food and beverages intended for human consumption. Published 27 March 2013. http://www.efsa.europa.eu/en/dataclosed/call/130327.htm.
Call for continuous collection of chemical contaminants occurrence data in food and feed. Published: 16 December 2010. http://www.efsa.europa.eu/en/data/call/datex101217
Commission Decision 2010/561/EU.
Missing Bulgaria, Cyprus, Estonia, Latvia, Lithuania, Luxembourg, Malta and Slovenia.
http://www.gnpd.com/sinatra/home/ accessed on 07/07/2016.
Available online: http://www.efsa.europa.eu/en/press/news/150428.htm
References
- Anderson LM, Giner‐Sorolla A and Ebeling D, 1978. Effects of imipramine, nitrite, and dimethylnitrosamine on reproduction in mice. Research Communications in Chemical Pathology and Pharmacology, 19, 311–327. [PubMed] [Google Scholar]
- Andrade R, Viana CO, Guadagnin SG, Reyes FGR and Rath S, 2003. A flow‐injection spectrophotometric method for nitrate and nitrite determination through nitric oxide generation. Food Chemistry, 80, 597–602. [Google Scholar]
- Alavantić D, Šunjevarić I, Pečevski J, Boźin D and Cerović G, 1988a. In vivo genotoxicity of nitrates and nitrites in germ cells of male mice. I. Evidence for gonadal exposure and lack of heritable effects. Mutation Research/Genetic Toxicology, 204, 689–695. [DOI] [PubMed] [Google Scholar]
- Alavantić D, Sunjevarić I, Cerović G, Bozin D and Pecevski J, 1988b. In vivo genotoxicity of nitrates and nitrites in germ cells of male mice. II. Unscheduled DNA synthesis and sperm abnormality after treatment of spermatids. Mutation Research, 204, 697–701. [DOI] [PubMed] [Google Scholar]
- AOAC , 2005. Official Methods of Analysis of AOAC International, 17th. AOAC International, Gaithersburg, MD. [Google Scholar]
- Aschebrook‐Kilfoy B, Cross AJ, Stolzenberg‐Solomon RZ, Schatzkin A, Hollenbeck AR and Sinha R, 2011. Pancreatic cancer and exposure to dietary nitrate and nitrite in the NIH–AARP Diet and Health Study. American Journal of Epidemiology, 174, 305–315. [DOI] [PMC free article] [PubMed] [Google Scholar]
- Aschebrook‐Kilfoy B, Ward MH, Gierach GL, Schatzkin A, Hollenbeck AR and Sinha R, 2012a. Epithelial ovarian cancer and exposure to dietary nitrate and nitrite in the NIH–AARP Diet and Health Study. European Journal of Cancer Prevention, 21, 65–72. [DOI] [PMC free article] [PubMed] [Google Scholar]
- Aschebrook‐Kilfoy B, Ward MH, Zheng T, Holford TR, Boyle P and Leaderer B, 2012b. Dietary nitrate and nitrite intake and non‐Hodgkin lymphoma survival. Nutrition and Cancer, 64, 488–492. [DOI] [PMC free article] [PubMed] [Google Scholar]
- Aschebrook‐Kilfoy B, Shu X‐O, Gao Y‐T, Ji B‐T, Yang G and Li HL, 2013a. Thyroid cancer risk and dietary nitrate and nitrite intake in the Shanghai Women's Health Study. International Journal of Cancer, 132, 897–904. [DOI] [PMC free article] [PubMed] [Google Scholar]
- Aschebrook‐Kilfoy B, Ward MH, Dave BJ, Smith SM, Weisenburger DD and Chiu BC, 2013b. Dietary nitrate and nitrite intake and risk of non‐Hodgkin lymphoma. Leukemia and Lymphoma, 54, 945–950. [DOI] [PMC free article] [PubMed] [Google Scholar]
- Balimandawa M, de Meester C and Léonard A, 1994. The mutagenicity of nitrite in the Salmonella/microsome test system. Mutation Research, 321, 7–11. 10.1016/0165-1218(94)90114-7 [DOI] [PubMed] [Google Scholar]
- Barbieri G, Bergamaschi M and Franceschini M, 2013. Kinetics of nitrite evaluated in a meat product. Meat Science, 93, 282–286. [DOI] [PubMed] [Google Scholar]
- Bartholomew B and Hill MJ, 1984. The pharmacology of dietary nitrate and the origin of urinary nitrate. Food and Chemical Toxicology, 22, 789–795. [DOI] [PubMed] [Google Scholar]
- Bartos HR and Desforges JF, 1966. Red blood cells DPNH‐dependent diaphorase levels in infants. Pediatrics, 37, 991–993. [PubMed] [Google Scholar]
- Benigni R, 2005. Structure–activity relationship studies of chemical mutagens and carcinogens: mechanistic investigations and prediction approaches. Chemical Reviews, 105, 1767–1800. [DOI] [PubMed] [Google Scholar]
- Boink ABTJ, Dormans JAMA and Speijers GJA, 1995. The Role of Nitrite and/or Nitrate in the Etiology of the Hypertrophy of the Adrenal Zona Glomerulosa of Rats. Council of Europe Press, Strasbourg: pp. 213–227. [Google Scholar]
- Boink ABTJ, Dormans JAMA, Speijers GJA and Vleeming W, 1999. Effects of nitrates and nitrites in experimental animals In: Wilson WS, Ball AS. and Hinton RS. (eds.). Managing Risks of Nitrates to Humans and the Environment. Royal Society of Chemistry (Great Britain), Cambridge: pp. 317–326. [Google Scholar]
- Bondonno CP, Liu AH, Croft KD, Ward NC, Puddey IB, Woodman RJ and Hodgson JM, 2015. Short‐term effects of a high nitrate diet on nitrate metabolism in healthy individuals. Nutrients, 7, 1906–1915. [DOI] [PMC free article] [PubMed] [Google Scholar]
- Boobis AR, Doe JE, Heinrich‐Hirsch B, Meek ME, Munn S, Ruchirawat M, Schlatter J, Seed J and Vickers C, 2008. IPCS framework for analyzing the relevance of a noncancer mode of action for humans. Critical Reviews in Toxicology, 38, 87–96. [DOI] [PubMed] [Google Scholar]
- Bos PMJ, Van Den Brandt PA, Wedel M and Ockhuizen T, 1988. The reproducibility of the conversion of nitrate to nitrite in human saliva after a nitrate load. Food and Chemical Toxicology, 26, 93–97. [DOI] [PubMed] [Google Scholar]
- Bouchikhi B, Mavelle T and Debry G, 1999. Effect of the addition of nitrate to milk on the formation of volatile N‐nitrosamines and apparent total N‐nitroso compounds. European Food Research and Technology, 209, 88–92. [Google Scholar]
- Bouvard V, Loomis D, Guyton KZ, Grosse Y, Ghissassi FE, Benbrahim‐Tallaa L, Guha N, Mattock H and Straif K, 2015. International Agency for Research on Cancer Monograph Working Group Carcinogenicity of consumption of red and processed meat. Lancet Oncology, 1599–1600. 10.1016/S1470-2045(15)0044 [DOI] [PubMed] [Google Scholar]
- Brams A, Buchet JP, Crutzen‐Fayt MC, De Meester C, Lauwerys R and Léonard A, 1987. A comparative study, with 40 chemicals, of the efficiency of the Salmonella assay and the SOS chromotest (kit procedure). Toxicology Letters, 38, 123–133. [DOI] [PubMed] [Google Scholar]
- Bryk T, Zalzstein E and Lifshitz M, 2007. Methemoglobinemia induced by refrigerated vegetable puree in conjunction with supraventricular tachycardia. Acta Paediatrica, 92, 1214–1215. [DOI] [PubMed] [Google Scholar]
- Budayová E, 1985. Effects of sodium nitrite and potassium sorbate on in vitro cultured mammalian cells. Neoplasma, 32, 341–350. [PubMed] [Google Scholar]
- Butt SB, Riaz M and Iqbal MZ, 2001. Simultaneous determination of nitrite and nitrate by normal phase ion‐pair liquid chromatography. Talanta 55, 789–797. [DOI] [PubMed] [Google Scholar]
- Calabrese EJ, Moore GS and McCarthy MS, 1983. The effect of ascorbic acid on nitrite‐induced methemoglobin formation in rats, sheep, and normal human erythrocytes. Regulatory Toxicology and Pharmacology, 3, 184–188. [DOI] [PubMed] [Google Scholar]
- Campillo N, Viñas P, Martínez‐Castillo N and Hernández‐Córdoba M, 2011. Determination of volatile nitrosamines in meat products by microwave‐assisted extraction and dispersive liquid–liquid microextraction coupled to gas chromatography‐mass spectrometry. Journal of Chromatography A, 1218, 1815–1821. [DOI] [PubMed] [Google Scholar]
- Catsburg CE, Gago‐Dominguez M, Yuan JM, Castelao JE, Cortessis VK and Pike MC, 2014. Dietary sources of N‐nitroso compounds and bladder cancer risk: findings from the Los Angeles bladder cancer study. International Journal of Cancer, 134, 125–135. [DOI] [PubMed] [Google Scholar]
- Casanova JA, Gross LK, Mcmullen SE and Schenck FJ, 2006. Use of Griess reagent containing vanadium(III) for post‐column derivatization and simultaneous determination of nitrite and nitrate in baby food. Journal of AOAC International, 89, 447–451. [PubMed] [Google Scholar]
- CEN (European Committee for Standardization), 1997. Foodstuffs – determination of nitrate and/or nitrite content. Part 1: General considerations. EN 12014‐1:1997.
- CEN (European Committee on Standardisation), 2005a. Foodstuffs – determination of nitrate and/or nitrite content. Part 3: Spectrometric determination of nitrate and nitrite content of meat products after enzymatic reduction of nitrate to nitrite. EN 12014‐3:2005.
- CEN (European Committee on Standardisation), 2005b. Foodstuffs – determination of nitrate and/or nitrite content. Part 4: Ion‐exchange chromatographic (IC) method for the determination of nitrate and nitrite content of meat products. EN 12014‐4:2005.
- Chapin RE and Sloane RA, 1997. Reproductive assessment by continuous breeding: evolving study design and summaries of eighty‐eight studies. Environmental Health Perspectives, 105 (Supplement 1), 199–205. [DOI] [PMC free article] [PubMed] [Google Scholar]
- Chasco J, Lizaso G and Beriain MJ, 1996. Cured colour development during sausage processing. Meat Science, 44, 203–211. [DOI] [PubMed] [Google Scholar]
- Chow CK and Hong CB, 2002. Dietary vitamin E and selenium and toxicity of nitrite and nitrate. Toxicology, 180, 195–207. [DOI] [PubMed] [Google Scholar]
- Chui JSW, Poon WT, Chan KC, Chan AYW and Buckley TA, 2005. Case Report. Nitrite‐induced methaemoglobinaemia – aetiology, diagnosis and treatment. Anaesthesia, 60, 496–500. [DOI] [PubMed] [Google Scholar]
- Chung SWC, Tran JCH, Tong KSK, Chen MYY, Xiao Y and Ho YY, 2011. Nitrate and nitrite levels in commonly consumed vegetables in Hong Kong. Food Additives and Contaminants, 4, 34–41. [DOI] [PubMed] [Google Scholar]
- Clemons NJ, McColl KE and Fitzgerald RC, 2007. Nitric oxide and acid induce double‐strand DNA breaks in Barrett's oesophagus carcinogenesis via distinct mechanisms. Gastroenterology, 133, 1198–1209. [DOI] [PubMed] [Google Scholar]
- Cockburn A, Brambilla G, Fernández M‐L, Arcella D, Bordajandi LR and Cottrill B, 2013. Nitrite in feed: from animal health to human health. Toxicology and Applied Pharmacology, 270, 209–217. [DOI] [PubMed] [Google Scholar]
- Coss A, Cantor KP, Reif JS, Lynch CF and Ward MH, 2004. Pancreatic cancer and drinking water and dietary sources of nitrate and nitrite. American Journal of Epidemiology, 159, 693–701. [DOI] [PubMed] [Google Scholar]
- Couch DB and Friedman MA, 1975. Interactive mutagenicity of sodium nitrite, dimethylamine, methylurea and ethylurea. Mutation Research/Environmental Mutagenesis and Related Subjects, 31, 109–114. [DOI] [PubMed] [Google Scholar]
- Croitoru MD, 2012. Nitrite and nitrate can be accurately measured in samples of vegetal and animal origin using an HPLC‐UV/VIS technique. Journal of Chromatography B, 911, 154–161. [DOI] [PubMed] [Google Scholar]
- Cross AJ, Ferrucci LM, Risch A, Graubard BI, Ward MH and Park Y, 2010. A large prospective study of meat consumption and colorectal cancer risk: an investigation of potential mechanisms underlying this association. Cancer Research, 70, 2406–2414. [DOI] [PMC free article] [PubMed] [Google Scholar]
- Cross AJ, Freedman ND, Ren J, Ward MH, Hollenbeck AR and Schatzkin A, 2011. Meat consumption and risk of oesophageal and gastric cancer in a large prospective study. American Journal of Gastroenterology, 106, 432–442. [DOI] [PMC free article] [PubMed] [Google Scholar]
- Daniel CR, Cross AJ, Graubard BI, Park Y, Ward MH and Rothman N, 2012a. Large prospective investigation of meat intake, related mutagens, and risk of renal cell carcinoma. American Journal of Clinical Nutrition, 95, 155–162. [DOI] [PMC free article] [PubMed] [Google Scholar]
- Daniel CR, Sinha R, Park Y, Graubard BI, Hollenbeck AM and Morton LM, 2012b. Meat intake is not associated with risk of non‐Hodgkin lymphoma in a large prospective cohort of U.S. men and women. Journal of Nutrition, 142, 1074–1080. [DOI] [PMC free article] [PubMed] [Google Scholar]
- Davis ME, Lisowyj MP, Zhou L, Wisecarver JL, Gulizia JM and Shostrom VK, 2012. Induction of colonic aberrant crypts in mice by feeding apparent N‐nitroso compounds derived from hot dogs. Nutrion and Cancer, 64, 342–349. [DOI] [PMC free article] [PubMed] [Google Scholar]
- De las Rivas B, Ruiz‐Capillas C, Carrascosa AV, Curiel JA, Jiménez‐Colmenero F and Muñoz R, 2008. Biogenic amine production by Gram‐positive bacteria isolated from Spanish dry‐cured “chorizo” sausage treated with high pressure and kept in chilled storage. Meat science, 80, 272–277. [DOI] [PubMed] [Google Scholar]
- De Mey E, Drabik‐Markiewicz G, Peeters C, Derdelinckx G, Paelinck H and Impens S, 2009. Impact of cadaverine in volatile N‐nitrosamine formation during the heating of a lean meat model. In Communications in agricultural and applied biological sciences (Vol. 4, No. 74, pp. 127‐132). Universiteit Gent. [PubMed]
- De Mey E, De Klerck K, De Maere H, Dewulf L, Derdelinckx G and Peeters MC, 2013. The occurrence of N‐nitrosamines, residual nitrite and biogenic amines in commercial dry fermented sausages and evaluation of their occasional relation. Meat Science, 96, 821–828. [DOI] [PubMed] [Google Scholar]
- De Mey E, De Maere H, Goemaere O, Steen L, Peeters MC, Derdelinckx G, Paelinck H and Fraeye I, 2014. Evaluation of N‐nitrosopiperidine formation from biogenic amines during the production of dry fermented sausages. Food and Bioprocess Technology, 7, 1269–1280. [Google Scholar]
- De Roos AJ, Ward MH, Lynch CF and Cantor KP, 2003. Nitrate in public water supplies and the risk of colon and rectum cancers. Epidemiology, 14, 640–649. 10.1097/01.ede.0000091605.01334.d3 [DOI] [PubMed] [Google Scholar]
- De Stefani E, Deneo‐Pellegrini H and Carzoglio JC, 1996. Dietary nitrosodimethylamine and the risk of lung cancer: a case–control study from Uruguay. Cancer Epidemiology, Biomarkers and Prevention, 5, 679–682. [PubMed] [Google Scholar]
- De Stefani E, Boffetta P, Mendilaharsu M, Carzoglio J and Deneo‐Pellegrini H, 1998. Dietary nitrosamines, heterocyclic amines, and risk of gastric cancer: a case‐control study in Uruguay. [DOI] [PubMed]
- De Stefani E, Boffetta P, Deneo‐Pellegrini H, Ronco AL, Aune D and Acosta G, 2009. Meat intake, meat mutagens and risk of lung cancer in Uruguayan men. Cancer Causes and Control, 20, 1635–1643. [DOI] [PubMed] [Google Scholar]
- DellaValle CT, Daniel CR, Aschebrook‐Kilfoy B, Hollenbeck AR, Cross AJ and Sinha R, 2013. Dietary intake of nitrate and nitrite and risk of renal cell carcinoma in the NIH–AARP Diet and Health Study. British Journal of Cancer, 108, 205–212. [DOI] [PMC free article] [PubMed] [Google Scholar]
- DellaValle CT, Xiao Q, Yang G, Shu XO, Aschebrook‐Kilfoy B and Zheng W, 2014. Dietary nitrate and nitrite intake and risk of colorectal cancer in the Shanghai Women's Health Study. International Journal of Cancer, 134, 2917–2926. [DOI] [PMC free article] [PubMed] [Google Scholar]
- Diaz‐Barriga Arceo S, Hernandez‐Ceruelos A, Madrigal‐Bujaidar E and Chamorro G, 2002. Inhibitory effect of chlorophyllin on the frequency of micronuclei induced by sodium nitrite in mice. Phytotherapy Research, 16, 754–757. [DOI] [PubMed] [Google Scholar]
- Dimitrova DS and Getova‐Spassova DP, 2006. Effects of galantamine and donepezil on active and passive avoidance tests in rats with induced hypoxia. Journal of Pharmacological Sciences, 101, 199–204. [DOI] [PubMed] [Google Scholar]
- Dordevic V, Vuksan B, Radetic P, Durdica H and Mitkovic M, 1980. Prilog ispitivanju uticaja pojedinih faktora na promene sadrzˇaja nitrita u mesu. Tehnologija mesa, 21, 287–290. [Google Scholar]
- Drabik‐Markiewicz G, Van den Maagdenberg K, De Mey E, Deprez S, Kowalska T and Paelinck H, 2009. Role of proline and hydroxyproline in N‐nitrosamine formation during heating in cured meat. Meat Science, 81, 479–486. [DOI] [PubMed] [Google Scholar]
- Drabik‐Markiewicz G, Dejaegher B, De Mey E, Impens S, Kowalska T, Paelinck H and Vander Heyden Y, 2010. Evaluation of the influence of proline, hydroxyproline or pyrrolidine in the presence of sodium nitrite on N‐nitrosamine formation when heating cured meat. Analytica chimica acta, 657, 123–130. [DOI] [PubMed] [Google Scholar]
- Drabik‐Markiewicz G, Dejaegher B, De Mey E, Kowalska T, Paelinck H and Vander Heyden Y, 2011. Influence of putrescine, cadaverine, spermidine or spermine on the formation of N‐nitrosamine in heated cured pork meat. Food chemistry, 126, 1539–1545. [DOI] [PubMed] [Google Scholar]
- Dubrow R, Darefsky AS, Park Y, Mayne ST, Moore SC and Kilfoy B, 2010. Dietary components related to N‐nitroso compound formation: a prospective study of adult glioma. Cancer Epidemiology, Biomarkers and Prevention, 19, 1709–1722. [DOI] [PMC free article] [PubMed] [Google Scholar]
- Edwards RJ and Uymae J, 1995. Extreme methaemoglobinaemia secondary to recreational use of amyl nitrite. Journal of Accident and Emergency Medicine, 12, 138–142. [DOI] [PMC free article] [PubMed] [Google Scholar]
- Edwards G, Whong WZ and Speciner N, 1979. Intrahepatic mutagenesis assay: a sensitive method for detecting N‐nitrosomorpholine and in vivo nitrosation of morpholine. Mutation Research, 64, 415–423. [DOI] [PubMed] [Google Scholar]
- EFSA (European Food Safety Authority), 2003. The effects of nitrites/nitrates on the microbiological safety of meat products BIOHAZ Panel. EFSA Journal 2003;2(3):14, 1–31 pp. 10.2903/j.efsa.2004.14 [DOI] [Google Scholar]
- EFSA (European Food Safety Authority), 2005. Opinion of the Scientific Committee on a request from EFSA related to harmonised approach for risk assessment of substances which are both genotoxic and carcinogenic. EFSA Journal 2005;3(10):282, 1–31 pp. 10.2903/j.efsa.2005.282 [DOI] [Google Scholar]
- EFSA (European Food Safety Authority), 2007. Scientific opinion of the Scientific Committee related to uncertainties in dietary exposure assessment. EFSA Journal 2007;5(1):438, 54 pp. http://10.2903/j.efsa.2007.438 [Google Scholar]
- EFSA (European Food Safety Authority), 2009. Guidance of the Scientific Committee on transparency in the scientific aspects of risk assessments carried out by EFSA. Part 2: general principles. EFSA Journal 2009;7(5): 1051, 1–22 pp. 10.2903/j.efsa.2009.1051 [DOI] [Google Scholar]
- EFSA (European Food Safety Authority), 2010. Management of left‐censored data in dietary exposure assessment of chemical substances. EFSA Journal 2010;8(3):1557, 96 pp. 10.2903/j.efsa.2010.1557. Available online: http://www.efsa.europa.eu [DOI] [Google Scholar]
- EFSA (European Food Safety Authority), 2011a. Use of the EFSA Comprehensive European Food Consumption Database in Exposure Assessment. EFSA Journal, 2011;9(3):2097, 34 pp. 10.2903/j.efsa.2011.2097 [DOI] [Google Scholar]
- EFSA (European Food Safety Authority), 2011b. Evaluation of the FoodEx, the food classification system applied to the development of the EFSA Comprehensive European Food Consumption Database. EFSA Journal 2011;9(3):1970, 27 pp. 10.2903/j.efsa.2011.1970 [DOI] [Google Scholar]
- EFSA ANS Panel (EFSA Panel on Food Additives and Nutrient Sources added to Food), 2010. Scientific Opinion. Statement on nitrites in meat products. EFSA Journal 2010;8(5):1538, 1–12, pp. 10.2903/j.efsa.2010.1538 [DOI] [Google Scholar]
- EFSA ANS Panel (EFSA Panel on Food Additives and Nutrient Sources added to Food), 2012. Guidance for submission for food additive evaluations. EFSA Journal 2012;10(7):2760, 60 pp. 10.2903/j.efsa.2012.2760 [DOI] [Google Scholar]
- EFSA CONTAM Panel (EFSA Panel on Contaminants in the Food Chain), 2008. Scientific opinion nitrates in vegetables. EFSA Journal 2008;6(6):689, 1–79 pp. 10.2903/j.efsa.2008.689 [DOI] [Google Scholar]
- EFSA CONTAM Panel (EFSA Panel on Contaminants in the Food Chain), 2009a. Scientific Opinion on arsenic in food. EFSA Journal 2009;7(10):1351, 199 pp. 10.2903/j.efsa.2009.1351 [DOI] [Google Scholar]
- EFSA CONTAM Panel (EFSA Panel on Contaminants in the Food Chain), 2009b. Scientific opinion on nitrite as undesirable substances in animal feed. EFSA Journal 2009;7(4):1017, 1–47 pp. 10.2903/j.efsa.2009.1017 [DOI] [Google Scholar]
- EFSA CONTAM Panel (EFSA Panel on Contaminants in the Food Chain), 2010a. Scientific Opinion on lead in food. EFSA Journal 2010;8(4):1570, 151 pp. 10.2903/j.efsa.2010.1570 [DOI] [Google Scholar]
- EFSA CONTAM Panel (EFSA Panel on Contaminants in the Food Chain), 2010b. Statement on possible public health risks for infants and young children from the presence of nitrates in leafy vegetables. EFSA Journal 2010;8(12):1935, 1–42 pp. 10.2903/j.efsa.2010.1935 [DOI] [Google Scholar]
- EFSA CONTAM Panel (EFSA Panel on Contaminants in the Food Chain), 2012a. Scientific Opinion on the risk for public health related to the presence of mercury and methylmercury in food. EFSA Journal 2012;10(12):2985, 241 pp. 10.2903/j.efsa.2012.2985 [DOI] [Google Scholar]
- EFSA CONTAM Panel (EFSA Panel on Contaminants in the Food Chain), 2012b. Scientific Opinion on lead dietary exposure in the European population. EFSA Journal 2012;10(7):2831, 59 pp. 10.2903/j.efsa.2012.2831 [DOI] [Google Scholar]
- EFSA CONTAM Panel (EFSA Panel on Contaminants in the Food Chain), 2012c. Scientific Opinion on cadmium dietary exposure in the European population. EFSA Journal 2012;10(1):2551, 59 pp. 10.2903/j.efsa.2012.2831 [DOI] [Google Scholar]
- EFSA CONTAM Panel (EFSA Panel on Contaminants in the Food Chain), 2014. Scientific Opinion on dietary exposure to inorganic arsenic in the European population. EFSA Journal 2014;12(3):3597, 68 pp. 10.2903/j.efsa.2014.3597 [DOI] [Google Scholar]
- EFSA Scientific Committee , 2009. Guidance of the Scientific Committee on Transparency in the Scientific Aspects of Risk Assessments carried out by EFSA. Part 2: general Principles. EFSA Journal 2009;7(7):1051, 22 pp. 10.2903/j.efsa.2009.1051 [DOI] [Google Scholar]
- EFSA Scientific Committee , 2011. Scientific Opinion on genotoxicity testing strategies applicable to food and feed safety assessment. EFSA Journal 2011;9(9):2379, 69 pp. http://10.2903/j.efsa.2011.2379 [Google Scholar]
- EFSA Scientific Committee , 2012a. Guidance on selected default values to be used by the EFSA Scientific Committee, Scientific Panels and Units in the absence of actual measured data. EFSA Journal 2012;10(3): 2579, 32 pp. 10.2903/j.efsa.2012.2579. Available online: http://www.efsa.europa.eu [DOI] [Google Scholar]
- EFSA Scientific Committee , 2012b. Scientific Opinion on the applicability of the Margin of Exposure approach for the safety assessment of impurities which are both genotoxic and carcinogenic in substances added to food/feed. EFSA Journal 2012;10(3):2578, 5 pp. 10.2903/j.efsa.2012.2578. Available online: http://www.efsa.europa.eu/efsajournal [DOI] [Google Scholar]
- EFSA Scientific Committee , Hardy A, Benford D, Halldorsson T, Jeger MJ, Knutsen KH, Mo re S, Mortensen A, Naegeli H, Noteborn H, Ockleford C, Ricci A, Rychen G, Silano V, Solecki R, Turck D, Aerts M, Bodin L, Davis A, Edler L, Gundert‐Remy U, Sand S, Slob W, Bottex B, Abrahantes JC, Marques DC, Kass G and Schlatter JR, 2017. Update: guidance on the use of the benchmark dose approach in risk assessment. EFSA Journal 2017;15(1):4658, 41 pp. 10.2903/j.efsa.2017.4658 [DOI] [PMC free article] [PubMed] [Google Scholar]
- Ensafi AA, Reazei B and Nouroozi S, 2004. Simultaneous spectrophotometric determination of nitrite and nitrate by flow injection analysis. Analytical Sciences, 20, 1749–1753. [DOI] [PubMed] [Google Scholar]
- Fang YJ, Gao ZX, Yan SL, Wang HY and Zhou HY, 2005. A dip‐and‐read test strip for the determination of nitrite in food samples for the field screening. Analytical Letters, 38, 1803–1811. [Google Scholar]
- FDA (Food and Drug Administration), 1972a. Teratologic evaluation of FDA 71‐9 (sodium nitrite). Report nr. FDABF‐GRAS‐061. Maspeth, NY: Food and Drug Research Laboratories, Inc. [Google Scholar]
- FDA (Food and Drug Administration), 1972b. Teratologic evaluation of FDA 71‐10 (potassium nitrite). Report nr. FDABF‐GRAS‐065. Maspeth, NY: Food and Drug Research Laboratories, Inc. [Google Scholar]
- Ferrucci LM, Sinha R, Ward MH, Graubard BI, Hollenbeck AR and Kilfoy BA, 2010. Meat and components of meat and the risk of bladder cancer in the NIH–AARP Diet and Health Study. Cancer, 116, 4345–4353. [DOI] [PMC free article] [PubMed] [Google Scholar]
- Ferrucci LM, Sinha R, Huang WY, Berndt SI, Katki HA and Schoen RE, 2012. Meat consumption and the risk of incident distal colon and rectal adenoma. British Journal of Cancer, 106, 608–616. [DOI] [PMC free article] [PubMed] [Google Scholar]
- Fiddler W, Pensabene JW, Gates RA and Adam R, 1998. Nitrosamine formation in processed hams as related to reformulated elastic rubber netting. Journal of Food Science, 63, 276–278. [Google Scholar]
- Freedman ND, Cross AJ, McGlynn KA, Abnet CC, Park Y and Hollenbeck AR, 2010. Association of meat and fat intake with liver disease and hepatocellular carcinoma in the NIH–AARP cohort. Journal of the National Cancer Institute, 102, 1354–1365. [DOI] [PMC free article] [PubMed] [Google Scholar]
- Friedman MA, Greene EJ and Epstein SS, 1972. Rapid gastric absorption of sodium nitrite in mice. Journal of Pharmaceutical Sciences, 61, 1492–1494 (as referenced by NTP, 2001). [DOI] [PubMed] [Google Scholar]
- FSANZ (Food Standards Australia New Zealand), 2011. Survey of nitrates and nitrites in food and beverages in Australia. FSANZ.
- Furukawa F, Nishikawa A, Ishiwata H, Takahashi M, Hayashi Y and Hirose M, 2000. Renal carcinogenicity of concurrently administered fish meal and sodium nitrite in F344 rats. Japanese Journal of Cancer Research, 91, 139–147. [DOI] [PMC free article] [PubMed] [Google Scholar]
- Gangolli SD, Van Den Brandt PA, Feron VJ, Janzowsky C, Koeman JH, Speijers GJ and Wishnok JS, 1994. Nitrate, nitrite and N‐nitroso compounds. European Journal of Pharmacology: Environmental Toxicology and Pharmacology, 292, 1–38. [DOI] [PubMed] [Google Scholar]
- Gao F, Zhang L, Wang L, Shike She S and Zhu C, 2005. Ultrasensitive and selective determination of trace amounts of nitrite ion with a novel fluorescence probe mono[6‐N(2‐carboxy‐phenyl)]‐b‐cyclodextrin. Analytica Chimica Acta, 533, 25–29. [Google Scholar]
- Gao Q, 2002. Uric acid‐hexacyanoferrate (III)‐luminol chemiluminescence system for the determination of trace nitrite. Chinese Journal of Analytical Chemistry, 30, 812–814. [Google Scholar]
- Gibson AM, Roberts TA and Robinson A, 1984. Factors controlling the growth of Clostridium botulinum types A and B in pasteurized cured meats VI. Nitrite monitoring during storage of pasteurized pork slurries. Journal of Food Technology, 19, 29–44. [Google Scholar]
- Girard JP, 1991. El ahumado In: Girard JP. (ed.). Tecnologiu de la came y de 10s productos crirnicos. Zaragoza, Acribia: pp. 183–229. [Google Scholar]
- Gladwin MT, Shelhamer JH, Schechter AN, Pease‐Fye ME, Waclawiw MA and Panza JA, 2000. Role of circulating nitrite and S‐nitrosohemoglobin in the regulation of regional blood flow in humans. Proceedings of the National Academy of Sciences of the United States of America, 97, 11482–11487. [DOI] [PMC free article] [PubMed] [Google Scholar]
- Gladwin MT, Schechter AN, Kim‐Shapiro DB, Patel RP, Hogg N and Shiva S, 2005. The emerging biology of the nitrite ion. Nature Chemical Biology, 1, 308–314. [DOI] [PubMed] [Google Scholar]
- Gladwin MT and Kim‐Shapiro DB, 2008. The functional nitrite reductase activity of the heme‐globins. Blood, 112, 2636–2647. [DOI] [PMC free article] [PubMed] [Google Scholar]
- Glória MBA, Vale SR, Vargas OL, Barbour JF and Scanlan RA, 1997. Influence of nitrate levels added to cheesemilk on nitrate, nitrite, and volatile nitrosamine contents in Gruyere cheese. Journal of agricultural and food chemistry, 45, 3577–3579. [Google Scholar]
- Ghasemi J, Jabbari A, Amini A, Oskoei AG and Abdolahi B, 2004. Kinetic spectrophotometric determination of nitrite based on its catalytic effect on the oxidation of methyl red by bromate. Analytical Letters, 37, 2205–2214. [Google Scholar]
- Goldsmith JR, Rokaw SN and Shearer LA, 1976. Distributions of percentage methaemoglobin in several population groups in California. International Journal of Epidemiology, 4, 207–212. [DOI] [PubMed] [Google Scholar]
- Goodman MT, Hankin JH, Wilkens LR and Kolonel LN, 1992. High‐fat foods and the risk of lung cancer. Epidemiology, 3, 288–299. 10.1097/00001648-199207000-00004 [DOI] [PubMed] [Google Scholar]
- Görsdorf S, Appel KE, Engeholm C and Obe G, 1990. Nitrogen dioxide induces DNA single‐strand breaks in cultured Chinese hamster cells. Carcinogenesis, 11, 37–41. [DOI] [PubMed] [Google Scholar]
- Gowans WJ, 1990. Fatal methaemogloginaemia in a dental nurse. A case of sodium nitrite poisoning. British Journal of General Practice, 40, 470–471 (as referenced by Health Canada, 2013). [PMC free article] [PubMed] [Google Scholar]
- Graf U, Frei H, Kägi A, Katz AJ and Würgler FE, 1989. Thirty compounds tested in the Drosophila wing spot test. Mutation Research/Genetic Toxicology, 222, 359–373. [DOI] [PubMed] [Google Scholar]
- Granli T, Dahl R, Brodin P and Bockman OC, 1989. Nitrate and nitrite concentrations in human saliva: variations with salivary flow‐rate. Food and Chemical Toxicology, 27, 675–680. [DOI] [PubMed] [Google Scholar]
- Greenblatt M and Mirvish SS, 1973. Dose–response studies with concurrent administration of piperazine and sodium nitrite to strain A mice. Journal of the National Cancer Institute, 50, 119–124. [DOI] [PubMed] [Google Scholar]
- Gruener N and Shuval H, 1973. Health implications of environmental exposure to nitrates. Harefuah, 85, 30–32. [PubMed] [Google Scholar]
- Habermeyer M, Roth A, Guth S, Diel P, Engel KH and Epe B, 2015. Nitrate and nitrite in the diet: how to assess their benefit and risk for human health. Molecular Nutrition and Food Research, 59, 106–128. [DOI] [PubMed] [Google Scholar]
- Harvey M, Cave G and Chanwai G, 2010. Fatal methaemoglobinaemia induced by self‐poisoning with sodium nitrite. Emergency Medicine Australasia, 22, 463–465. [DOI] [PubMed] [Google Scholar]
- Hassan HA, El‐Agmy SM, Gaur RL, Fernando A, Raj MH and Ouhtit A, 2009. In vivo evidence of hepato‐ and reno‐protective effect of garlic oil against sodium nitrite‐induced oxidative stress. International Journal of Biological Sciences, 5, 249–255. [DOI] [PMC free article] [PubMed] [Google Scholar]
- Hassan HA, Hafez HS and Zeghebar FE, 2010. Garlic oil as a modulating agent for oxidative stress and neurotoxicity induced by sodium nitrite in male albino rats. Food and Chemical Toxicology, 48, 1980–1985. [DOI] [PubMed] [Google Scholar]
- Hayashi M, Kishi M, Sofuni T and Ishidate M Jr, 1988. Micronucleus tests in mice on 39 food additives and eight miscellaneous chemicals. Food and Chemical Toxicology, 26, 487–500. 10.1016/0278-6915(88)90001-4 [DOI] [PubMed] [Google Scholar]
- Haynes WM, 2010. CRC Handbook of Chemistry and Physics. 91st Edition. CRC Press, Boca Raton, FL, pp. 4–83, 4–90. [Google Scholar]
- He D, Zhang ZW, Huang Y and Hu Y, 2007. Chemiluminescence microflow injection analysis system on a chip for the determination of nitrite in food. Food Chemistry, 101, 667–672. [DOI] [PubMed] [Google Scholar]
- Health Canada , 2011. Guidelines for Canadian Drinking Water Quality. Guideline technical document. N‐Nitrosodimethylamine (NDMA). [Google Scholar]
- Health Canada , 2013. Nitrate and nitrite in drinking water. Document for public comment. Prepared by the Federal–Provincial–Territorial Committee on drinking water. Consultation period ends February 27, 2013.
- Hellmér L and Bolcsfoldi G, 1992. An evaluation of the E. coli K‐12 uvrB/recA DNA repair hostmediated assay. II. In vivo results for 36 compounds tested in the mouse. Mutation Research, 272, 161–173. [DOI] [PubMed] [Google Scholar]
- Hernández‐Jover T, Izquierdo‐Pulido M, Veciana‐Nogués MT and Vidal‐Carou MC, 1996. Biogenic amine sources in cooked cured shoulder pork. Journal of Agricultural and Food Chemistry, 44, 3097–3101. [Google Scholar]
- Hernández‐Jover T, Izquierdo‐Pulido M, Veciana‐Nogués MT, Mariné‐Font A and Vidal‐Carou MC, 1997. Biogenic amine and polyamine contents in meat and meat products. Journal of Agricultural and Food Chemistry, 45, 2098–2102. [Google Scholar]
- Hernández‐Ramírez RU, Galvan‐Portillo MV, Ward MH, Agudo A, González CA and Onate‐Ocana LF, 2009. Dietary intake of polyphenols, nitrate and nitrite and gastric cancer risk in Mexico City. International Journal of Cancer, 125, 1424–1430. [DOI] [PMC free article] [PubMed] [Google Scholar]
- Herrmann SS, Duedahl‐Olesen L and Granby K, 2014. Simultaneous determination of volatile and non‐volatile nitrosamines in processed meat products by liquid chromatography tandem mass spectrometry using atmospheric pressure chemical ionisation and electrospray ionisation. Journal of Chromatography A, 1330, 20–29. [DOI] [PubMed] [Google Scholar]
- Herrmann SS, Duedahl‐Olesen L and Granby K, 2015a. Occurrence of volatile and non‐volatile N‐nitrosamines in processed meat products and the role of heat treatment. Food Control, 48, 163–169. [Google Scholar]
- Herrmann SS, Duedahl‐Olesen L, Christensen T, Olesen PT and Granby K, 2015b. Dietary exposure to volatile and non‐volatile N‐nitrosamines from processed meat products in Denmark. Food and Chemical Toxicology, 80, 137–143. [DOI] [PubMed] [Google Scholar]
- Herrmann SS, Granby K and Duedahl‐Olesen L, 2015c. Formation and mitigation of N‐nitrosamines in nitrite preserved cooked sausages. Food Chemistry, 174, 516–526. [DOI] [PubMed] [Google Scholar]
- Hohensinn B, Haselgrübler R, Müller U, Stadlbauer V, Lanzerstorfer P, Lirk G, Höglinger O and Weghuber J, 2016. Sustaining elevated levels of nitrite in the oral cavity through consumption of nitrate‐rich beetroot juice in young healthy adults reduces salivary pH. Nitric Oxide, 60, 10–15. [DOI] [PubMed] [Google Scholar]
- Honikel K‐O, 2008. The use and control of nitrate and nitrite for the processing of meat products. Meat Science, 78, 68–76. [DOI] [PubMed] [Google Scholar]
- Hord NG, Tang Y and Bryan NS, 2009. Food sources of nitrates and nitrites: the physiologic context for potential health benefits. American Journal of Clinical Nutrition, 90, 1–10. [DOI] [PubMed] [Google Scholar]
- Hord NG, Ghannam JS, Garg HK, Berens PD and Bryan NS, 2011. Nitrate and nitrite content of human, formula, bovine, and soy milks: implications for dietary nitrite and nitrate recommendations. Breastfeeding Medicine, 6, 393–399. [DOI] [PMC free article] [PubMed] [Google Scholar]
- Hunault CC, van Velzen AG, Sips AJ, Schothorst RC and Meulenbelt J, 2009. Bioavailability of sodium nitrite from an aqueous solution in healthy adults. Toxicology Letters, 190, 48–53. [DOI] [PubMed] [Google Scholar]
- Iammarino M, Di Taranto A and Cristino M, 2013. Endogenous levels of nitrites and nitrates in wide consumption foodstuffs: results of five years of official controls and monitoring. Food chemistry, 140, 763–771. [DOI] [PubMed] [Google Scholar]
- IARC (International Agency for Research on Cancer), 1978. Some aromatic amines, hydrazine and related substances, N‐nitroso compounds and miscellaneous alkylating agents. IARC Monographs on the Evaluation of Carcinogenic Risks to Humans. Volume 4. Lyon, France.
- IARC (International Agency for Research on Cancer), 1998. Some N‐nitroso compounds. IARC Monographs on the Evaluation of Carcinogenic Risks to Humans. Volume 17. Lyon, France.
- IARC (International Agency for Research on Cancer), 2010. Ingested nitrate and nitrite, and cyanobacterial peptide toxins. IARC Monographs on the Evaluation of Carcinogenic Risks to Humans, 94, v–vii, 1–412. [PMC free article] [PubMed]
- Ingram TE, Pinder AG, Bailey DM, Fraser AG and James PE, 2010. Low‐dose sodium nitrite vasodilates hypoxic human pulmonary vasculature by a means that is not dependent on a simultaneous elevation in plasma nitrite. American Journal of Physiology – Heart and Circulatory Physiology, 298, H331–H339. [DOI] [PMC free article] [PubMed] [Google Scholar]
- Inoue‐Choi M, Ward MH, Cerhan JR, Weyer PJ, Anderson KE and Robien K, 2012. Interaction of nitrate and folate on the risk of breast cancer among postmenopausal women. Nutrition and Cancer, 64, 685–694. [DOI] [PMC free article] [PubMed] [Google Scholar]
- Inoue‐Choi M, Jones RR, Anderson KE, Cantor KP, Cerhan JR and Krasner S, 2015. Nitrate and nitrite ingestion and risk of ovarian cancer among postmenopausal women in Iowa. International Journal of Cancer, 137, 173–182. [DOI] [PMC free article] [PubMed] [Google Scholar]
- Inoue‐Choi M, Sinha R, Gierach GL and Ward MH, 2016. Red and processed meat, nitrite, and heme iron intakes and postmenopausal breast cancer risk in the NIH‐AARP Diet and Health Study. International Journal of Cancer, 138, 1609–1618. [DOI] [PMC free article] [PubMed] [Google Scholar]
- Inui N, Nishi Y, Taketomi M and Mori M, 1979. Transplacental action of sodium nitrite on embryonic cells of Syrian golden hamster. Mutation Research, 66, 149–158. 10.1016/0165-1218(79)90060-0 [DOI] [PubMed] [Google Scholar]
- Ishidate M Jr, Sofuni T, Yoshikawa K, Hayashi M, Nohmi T and Sawada M, 1984. Primary mutagenicity screening of food additives currently used in Japan. Food and Chemical Toxicology, 22, 623–636. [DOI] [PubMed] [Google Scholar]
- ISO (International Organization for Standardization), 2004a. Milk and milk products — determination of nitrate and nitrite contents – Part 1: method using cadmium reduction and spectrometry. EN ISO 14673–1:2004. ISO, Geneva.
- ISO (International Organization for Standardization), 2004b. Milk and milk products — determination of nitrate and nitrite contents — Part 2: method using segmented flow analysis (routine method). EN 14673‐2:2004. ISO, Geneva.
- ISO (International Organization for Standardization), 2004c. Milk and milk products — determination of nitrate and nitrite contents — Part 3: method using cadmium reduction and flow injection analysis with in‐line dialysis (routine method). EN 14673‐3:2004. ISO, Geneva.
- Jakszyn P, Agudo A, Ibáñez R, García‐Closas R, Pera G and Amiano P, 2004a. Development of a food database of nitrosamines, heterocyclic amines, and polycyclic aromatic hydrocarbons. Journal of Nutrition, 134, 2011–2014. [DOI] [PubMed] [Google Scholar]
- Jakszyn P, Ibáñez R, Pera G, Agudo A, García‐Closas R and Amiano P, 2004b. Food Content of Potential Carcinogens. Catalan Institute of Oncology, Barcelona. [Google Scholar]
- Jakszyn P, Bingham S, Pera G, Agudo A, Luben R and Welch A, 2006. Endogenous versus exogenous exposure to N‐nitroso compounds and gastric cancer risk in the European Prospective Investigation into Cancer and Nutrition (EPIC‐EURGAST) study. Carcinogenesis, 27, 1497–1501. [DOI] [PubMed] [Google Scholar]
- Jakszyn P, González CA, Lujan‐Barroso L, Ros MM, Bueno‐de‐Mesquita HB and Roswall N, 2011. Red meat, dietary nitrosamines, and heme iron and risk of bladder cancer in the European Prospective Investigation into Cancer and Nutrition (EPIC). Cancer Epidemiology, Biomarkers and Prevention, 20, 555–559. [DOI] [PubMed] [Google Scholar]
- Jakszyn PG, Allen NE, Lujan‐Barroso L, González CA, Key TJ and Fonseca‐Nunes A, 2012. Nitrosamines and heme iron and risk of prostate cancer in the European prospective investigation into cancer and nutrition. Cancer Epidemiology, Biomarkers and Prevention, 21, 547–551. [DOI] [PubMed] [Google Scholar]
- Janzowski C and Eisenbrand G, 1995. Aspects to be considered for risk assessment concerning endogenously formed N‐nitroso compounds. Proceedings of the International Workshop on Health aspects of nitrate and its metabolites (particularly nitrite), Bilthoven (Netherlands), 8–10 November 1994. Council of Europe Press, Strasbourg.
- JECFA (Joint FAO, WHO Expert Committee on Food Additives), 1962. Evaluation of the toxicity of a number of antimicrobials and antioxidants. Sixth report of JECFA, WHO Technical Report Series No 228. [Google Scholar]
- JECFA (Joint FAO, WHO Expert Committee on Food Additives), 1965. Specifications for the identity and purity of food addtives and their toxicological evaluation: food colours and some antimicrobials and antioxidants. Eighth report of JECFA, WHO Technical Report Series No 309. [PubMed] [Google Scholar]
- JECFA (Joint FAO/WHO Expert Committee on Food Additives), 1974. Toxicological evaluation of certain food additives with a review of general principles and of specifications. Seventeenth report of JECFA. WHO Technical Report Series No. 539. FAO Nutrition Meetings Report Series No. 53. [PubMed]
- JECFA (Joint FAO/WHO Expert Committee on Food Additives), 1976. Evaluation of certain food additives. Twentieth report of JECFA. WHO Technical Report Series No. 599. FAO Food and Nutrition Series No. 1.
- JECFA (Joint FAO, WHO Expert Committee on Food Additives), 1995. Evaluation of certain food additives and contaminants. Forty‐fourth report of JECFA, WHO Technical Report Series No 859. [Google Scholar]
- JECFA (Joint FAO/WHO Expert Committee on Food Additives), 1996. Nitrite (and potential endogenous formation of N‐nitroso compounds). WHO Food Additives Series No. 35.
- JECFA (Joint FAO/WHO Expert Committee on Food Additives), 2000. Guidelines for the preparation of toxicological working papers for the Joint FAO/WHO Expert Committee on Food Additives. Geneva, Switzerland.
- JECFA (Joint FAO/WHO Expert Committee on Food Additives), 2002. Evaluation of certain food additives and contaminants. Fifty‐ninth report of JECFA. Joint FAO/WHO Expert Committee on Food Additives, WHO Technical Reports Series No. 913, pp. 20–32. Available online: http://whqlibdoc.who.int/trs/WHO_TRS_913.pdf
- JECFA (Joint FAO/WHO Expert Committee on Food Additives), 2003a. Nitrate (and potential endogenous formation of N‐nitroso compounds). WHO Food Additives Series No. 50.
- JECFA (Joint FAO/WHO Expert Committee on Food Additives), 2003b. Nitrite (and potential endogenous formation of N‐nitroso compounds). WHO Food Additives Series, No. 50. Available online: http://www.inchem.org/documents/jecfa/jecmono/v50je05.htm
- JECFA (Joint FAO/WHO Expert Committee on Food Additives), 2006a. Potassium nitrite. Joint FAO/WHO ExpertCommittee on Food Additives. Available online: http://www.fao.org/ag/agn/jecfa-additives/specs/Monograph1/Additive-344.pdf
- JECFA (Joint FAO/WHO Expert Committee on Food Additives), 2006b. Sodium nitrite. Joint FAO/WHO ExpertCommittee on Food Additives. Available online: http://www.fao.org/ag/agn/jecfa-additives/specs/Monograph1/Additive-417.pdf
- Jin L, Qin L, Xia D, Liu X, Fan Z, Zhang C, Gu L, He J, Ambudkar I, Deng D and Wang S, 2013. Active secretion and protective effect of salivary nitrate against stress in human volunteers and rats. Free Radical Biology and Medicine, 57, 61–67. [DOI] [PMC free article] [PubMed] [Google Scholar]
- Kazemzadeh A, 2005. Development of new optical nitrite detector. Asian Journal of Chemistry, 17, 767–773. [Google Scholar]
- Keszei AP, Goldbohm RA, Schouten LJ, Jakszym P and van den Brandt PA, 2013. Dietary N‐nitroso compounds, endogenous nitrosation, and the risk of oesophageal and gastric cancer subtypes in the Netherlands Cohort Study. American Journal of Clinical Nutrition, 97, 135–146. [DOI] [PubMed] [Google Scholar]
- Kilfoy BA, Ward MH, Zheng T, Holford TR, Boyle P and Zhao P, 2010. Risk of non‐Hodgkin lymphoma and nitrate and nitrite from the diet in Connecticut women. Cancer Causes and Control, 21, 889–896. [DOI] [PMC free article] [PubMed] [Google Scholar]
- Kilfoy BA, Zhang Y, Park Y, Holford TR, Schatzkin A and Hollenbeck A, 2011. Dietary nitrate and nitrite and the risk of thyroid cancer in the NIH–AARP Diet and Health Study. International Journal of Cancer, 129, 160–172. [DOI] [PMC free article] [PubMed] [Google Scholar]
- Kirk‐Othmer , 2006. Encyclopedia of Chemical Technology, 5th Edition, Volume 20, John Wiley and Sons, Inc., New York. pp. 939–950. [potassium nitrate]. [Google Scholar]
- Knekt P, Jarvinen R, Dich J and Hakulinen T, 1999. Risk of colorectal and other gastro‐intestinal cancers after exposure to nitrate, nitrite and N‐nitroso compounds: a follow‐up study. International Journal of Cancer, 80, 852–856. [DOI] [PubMed] [Google Scholar]
- Kodama F, Umeda M and Tsutsui T, 1976. Mutagenic effect of sodium nitrite on cultured mouse cells. Mutation Research, 40, 119–124. 10.1016/0165-1218(76)90006-9 [DOI] [PubMed] [Google Scholar]
- Kohn MC, Melnick RL, Ye F and Portier CJ, 2002. Pharmacokinetics of sodium nitrite‐induced methemoglobinemia in the rat. Drug Metabolism and Disposition, 30, 676–683. [DOI] [PubMed] [Google Scholar]
- Koohdani F and Mehdipour P, 2011. Micronucleus index of rats treated with sodium nitrite can be amplified by sodium chloride. Journal of Experimental Therapeutics and Oncology, 9, 75–79. [PubMed] [Google Scholar]
- Kortboyer JM, Olling M, Zeilmaker MJ, Slob W, Boink ABTJ and Schothorst RC, 1997. The oral bioavailability of sodium nitrite investigated in healthy adult volunteers. Report No. 235802007 from the National Institute of Public Health and Environment (RIVM), Bilthoven, The Netherlands.
- Kuroiwa Y, Ishii Y, Umemura T, Kanki K, Mitsumori K and Nishikawa A, 2007. Combined treatment with green tea catechins and sodium nitrite selectively promotes rat forestomach carcinogenesis after initiation with N‐methyl‐N’‐nitro‐N‐nitrosoguanidine. Cancer Science, 98, 949–957. [DOI] [PMC free article] [PubMed] [Google Scholar]
- Lammarino M, Di Taranto A and Cristino M, 2013. Endogenous levels of nitrites and nitrates in wide consumption foodstuffs: results of five years of official controls and monitoring. Food Chemistry, 140, 763–771. [DOI] [PubMed] [Google Scholar]
- Larsson SC, Bergkvist L and Wolk A, 2006. Processed meat consumption, dietary nitrosamines and stomach cancer risk in a cohort of Swedish women. International Journal of Cancer, 119, 915–919. [DOI] [PubMed] [Google Scholar]
- Ledward DA, 1984. Haemoproteins in meat and meat products. Cap. 2 In: Hudson JB.(ed.). Developments in Food Proteins III. Elsevier Appl. Sci. Publishers Co., New York. [Google Scholar]
- Leth T, Fagt S, Nielsen S and Andersen R, 2008. Nitrite and nitrate content in meat products and estimated intake in Denmark from 1998 to 2006. Food Additives and Contaminants, 25, 1237–1245. [DOI] [PubMed] [Google Scholar]
- Li JS, Wang H, Zhang X and Zhang HS, 2003. Spectrofluorimetric determination of total amount of nitrite and nitrate in biological sample with a new fluorescent probe 1,3,5,7‐tetramethyl‐8‐(3’,4’‐diaminophenyl)‐difluoroboradiaza‐s‐indacence. Talanta, 61, 797–802. [DOI] [PubMed] [Google Scholar]
- Li L, Wang P, Xu X and Zhou G, 2012. Influence of various cooking methods on the concentrations of volatile N‐nitrosamines and biogenic amines in dry‐cured sausages. Journal of Food Science, 77, 560–565. [DOI] [PubMed] [Google Scholar]
- Linjinsky W, 1999. N‐nitroso compounds in the diet. Mutation Research, 443, 129–138. [DOI] [PubMed] [Google Scholar]
- Loh YH, Jakszyn P, Luben RN, Mulligan AA, Mitrou PN and Khaw KT, 2011. N‐Nitroso compounds and cancer incidence: the European Prospective Investigation into Cancer and Nutrition (EPIC)‐Norfolk Study. American Journal of Clinical Nutrition, 93, 1053–1061. [DOI] [PubMed] [Google Scholar]
- Lorenzo FR, Phillips JD and Nussenzveig R, 2011. Molecular basis of two novel mutations found in type Imethemoglobinemia. Blood Cells, Molecules, and Diseases, 46, 277–281. [DOI] [PMC free article] [PubMed] [Google Scholar]
- Luca D, Luca V, Cotor F and Răileanu L, 1987. In vivo and in vitro cytogenetic damage induced by sodium nitrite. Mutation Research, 189, 333–339. [DOI] [PubMed] [Google Scholar]
- Lundberg JO and Govoni M, 2004. Inorganic nitrate is a possible source for systemic generation of nitric oxide. Free Radicals in Biology and Medicine, 37, 395–400. [DOI] [PubMed] [Google Scholar]
- Lundberg JO, Weitzberg E and Gladwin MT, 2008. The nitrate–nitrite–nitric oxide pathway in physiology and therapeutics. Nature Reviews Drug Discovery, 7, 156–167. [DOI] [PubMed] [Google Scholar]
- Maekawa A, Ogiu T, Onodera H, Furuta K, Matsuoka C and Ohno Y, 1982. Carcinogenicity studies of sodium nitrite and sodium nitrate in F–344 rats. Food and Chemical Toxicology, 20, 25–33. [DOI] [PubMed] [Google Scholar]
- Marks A, Luo H‐Y, Chui DHK and Greenberg J, 2013. Hemoglobin shady grove: a novel fetal methemoglobin variant. Pediatric Blood and Cancer, 60, E55–E56. [DOI] [PubMed] [Google Scholar]
- Matsubara S, Takasu S, Tsukamoto T, Mutoh M, Masuda S and Sugimura T, 2012. Induction of glandular stomach cancers in Helicobacter pylori‐infected Mongolian gerbils by 1‐nitrosoindole‐3‐acetonitrile. International Journal of Cancer, 130, 259–266. [DOI] [PubMed] [Google Scholar]
- Mayne ST, Risch HA and Dubrow R, 2001. Nutrient intake and risk of subtypes of esophageal and gastric cancer. Cancer Epidemiology, Biomarkers and Prevention, 10, 1055–1062. [PubMed] [Google Scholar]
- McMullen SE, Casanova JA, Gross LK and Schenck FJ, 2005. Ion chromatographic determination of nitrate and nitrite in vegetable and fruit baby foods. Journal of AOAC International, 88, 1793–1796. [PubMed] [Google Scholar]
- Menard C, Heraud F, Volatier J‐L and Leblanc J‐C, 2008. Assessment of dietary exposure of nitrate and nitrite in France. Food Additives and Contaminants, 25, 971–988. [DOI] [PubMed] [Google Scholar]
- Mende P, Spiegelhalder B and Preussmann R, 1991. Trace analysis of nitrosated foodstuffs for nitrosamides. Food and chemical toxicology, 29, 167–172. [DOI] [PubMed] [Google Scholar]
- Mensinga TT, Speijers GJA and Meulenbelt J, 2003. Health implications of exposure to environmental nitrogenous compounds. Toxicological Reviews, 22, 41–51. [DOI] [PubMed] [Google Scholar]
- Michaud DS, Holick CN, Batchelor TT, Giovannucci E and Hunter DJ, 2009. Prospective study of meat intake and dietary nitrates, nitrites, and nitrosamines and risk of adult glioma. American Journal of Clinical Nutrition, 90, 570–577. [DOI] [PMC free article] [PubMed] [Google Scholar]
- Millar SJ, Moss BW and Stevenson MH, 1996. Some observations on the absorption spectra of various myoglobin derivatives fond in meat. Meat Science, 42, 277–288. [DOI] [PubMed] [Google Scholar]
- Miller PE, Lazarus P, Lesko SM, Cross AJ, Sinha R and Laio J, 2013. Meat‐related compounds and colorectal cancer risk by anatomical subsite. Nutrition and Cancer, 65, 202–226. [DOI] [PMC free article] [PubMed] [Google Scholar]
- Mirvish SM, 1975. Formation of N‐nitroso compounds: chemistry, kinetics and in vivo occurrence. Toxicology and Applied Pharmacology, 31, 325–351. [DOI] [PubMed] [Google Scholar]
- Mirvish SS, 1991. The significance for human health of nitrate, nitrite and N‐nitroso compounds In: Bogárdi I, Kuzelka RD, Ennenga WG. (eds.). Nitrate Contamination Exposure, Consequence, and Control. Springer, New York: pp. 253–266 (as referenced by Health Canada, 2013). [Google Scholar]
- Mirvish SS, Davis ME, Lisowyj MP and Gaikwad NW, 2008. Effect of feeding nitrite, ascorbate, hemin, and omeprazole on excretion of fecal total apparent N‐nitroso compounds in mice. Chemical Research in Toxicology, 21, 2344–2351. [DOI] [PubMed] [Google Scholar]
- Møller JK and Skibsted LH, 2002. Nitric oxide and myoglobins. Chemical Reviews, 102, 1167–1178. [DOI] [PubMed] [Google Scholar]
- Montenegro MF, Sundqvist ML, Larsen FJ, Zhuge Z, Carlström M, Weitzberg E and Lundberg JO, 2017. Blood pressure‐lowering effect of orally ingested nitrite is abolished by a proton pump inhibitornovelty and significance. Hypertension, 69, 23–31. [DOI] [PubMed] [Google Scholar]
- Montenegro MF, Amaral JH, Pinheiro LC, Sakamoto EK, Ferreira GC and Reis RI, 2011. Sodium nitrite downregulates vascular NADPH oxidase and exerts antihypertensive effects in hypertension. Free Radicals in Biology and Medicine, 51, 144–152. [DOI] [PubMed] [Google Scholar]
- el Nahas SM, Globus M and Vethamany‐Globus S, 1984. Chromosomal aberrations induced by sodium nitrite in bone marrow of adult rats and liver cells of transplacentally exposed embryos. Journal of Toxicology and Environmental Health, 13, 643–647. [DOI] [PubMed] [Google Scholar]
- Nakamura SI, Oda Y, Shimada T, Oki I and Sugimoto K, 1987. SOS‐inducing activity of chemical carcinogens and mutagens in Salmonella typhimurium TA1535/pSK1002: examination with 151 chemicals. Mutation Research, 192, 239–246. [DOI] [PubMed] [Google Scholar]
- National Academy of Sciences , 1977. Drinking Water and Health. National Academy of Sciences, Washington, DC. [Google Scholar]
- Navarro‐Silvera SA, Mayne ST, Risch HA, Gammon MD, Vaughan T and Chow HW, 2011. Principal component analysis of dietary and lifestyle patterns in relation to risk of subtypes of oesophageal and gastric cancer. Annals of Epidemiology, 21, 543–550. [DOI] [PMC free article] [PubMed] [Google Scholar]
- NMKL (Nordic Committee on Food Analysis), 2013. Determination of nitrate and/or nitrite in foodstuffs and water by spectrophotometry after zinc reduction and Griess reaction. NMKL No. 194.
- Nöthlings U, Wilkens LR, Murphy SP, Hankin JH, Henderson BE and Kolonel LN, 2005. Meat and fat intake as risk factors for pancreatic cancer: the multiethnic cohort study. Journal of the National Cancer Institute, 97, 1458–1465. [DOI] [PubMed] [Google Scholar]
- NTP (National Toxicology Program), 1990. Final report on the reproductive toxicity of sodium nitrite (CAS NO. 7632‐00‐0) in CD‐1‐Swiss mice.
- NTP (National Toxicology Program), 2001. NTP Technical Report on the Toxicology and Carcinogenesis Studies of Sodium Nitrite (CAS No. 7632‐00‐0) in F344/N Rats and B6C3F1 Mice (drinking water studies). [PubMed]
- NTP (National Toxicology Program), 2010. 2‐Year study protocol. Available online: http://ntp.niehs.nih.gov/?objectid=36305D16-F1F6-975E-79776DAD38EC101E
- NTP (National Toxicology Program), 2011. Report on Carcinogens. 12th Edition. Available online: http://ntp.niehs.nih.gov/go/roc12
- NTP (National Toxicology Program), 2016. Report on Carcinogens, 14th Edition Research Triangle Park, NC: U.S. Department of Health and Human Services, Public Health Service; Available online: http://ntp.niehs.nih.gov/go/roc14/ [Google Scholar]
- OECD (Organisation for Economic Co‐operation and Development), 2005. OECD SIDS dossier for sodium nitrite (CAS No. 7632‐00‐0) UNEP.
- OECD Test Guideline TG‐474, 2014. http://www.oecd.org/env/ehs/testing/draft_tg474_second_commenting_round.pdf. Accessed 13 May 2016.
- Öztekin N, Nutku MS and Erim FB, 2002. Simultaneous determination of nitrite and nitrate in meat products and vegetables by capillary electrophoresis. Food Chemistry, 76, 103–106. [Google Scholar]
- Ohsawa K, Nakagawa SY, Kimura M, Shimada C, Tsuda S and Kabasawa K, 2003. Detection of in vivo genotoxicity of endogenously formed N‐nitroso compounds and suppression by ascorbic acid, teas and fruit juices. Mutation Research, 539, 65–76. [DOI] [PubMed] [Google Scholar]
- Okazaki K, Ishii Y, Kitamura Y, Maruyama S, Umemura T, Miyauchi M and Nakazawa H, 2006. Dose‐dependent promotion of rat forestomach carcinogenesis by combined treatment with sodium nitrite and ascorbic acid after initiation with N‐methyl‐N′‐nitro‐N‐nitrosoguanidine: possible contribution of nitric oxide‐associated oxidative DNA damage. Cancer Science, 97, 175–182. [DOI] [PMC free article] [PubMed] [Google Scholar]
- Ozel MZ, Gogus F, Yagci S, Hamilton JF and Lewis AC, 2010. Determination of volatile nitrosamines in various meat products using comprehensive gas chromatography–nitrogen chemiluminescence detection. Food and Chemical Toxicology, 48, 3268–3273. [DOI] [PubMed] [Google Scholar]
- Özen H, Kamber U, Karaman M, Gül S, Atakişi E and Özcan K, 2014. Histopathologic, biochemical and genotoxic investigations on chronic sodium nitrite toxicity in mice. Experimental and Toxicologic Pathology, 66, 367–375. [DOI] [PubMed] [Google Scholar]
- Pannala AS, Mani AR, Spencer JP, Skinner V, Bruckdorfer KR, Moore KP and Rice‐Evans CA, 2003. The effect of dietary nitrate on salivary, plasma, and urinary nitrate metabolism in humans. Free Radical Biology and Medicine, 34, 576–584. [DOI] [PubMed] [Google Scholar]
- Parks NJ, Krohn KJ, Mathis CA, Chasko JH, Geiger KR and Gregor ME, 1981. Nitrogen‐13‐labeled nitrite and nitrate: distribution and metabolism after intratracheal administration. Science, 212, 58–60. [DOI] [PubMed] [Google Scholar]
- Pegg RB and Shahidi F, 2004. Introduction, in Nitrite Curing of Meat: The N‐Nitrosamine Problem and Nitrite Alternatives, Food & Nutrition Press, Inc., Trumbull, Connecticut, USA. 10.1002/9780470385081.ch1. [DOI]
- Pegg RB and Honikel KO, 2015. Principles of Curing. Handbook of Fermented Meat and Poultry, 19–30. [Google Scholar]
- Percy MJ and Lappin TR, 2008. Recessive congenital methaemoglobinaemia: cytochrome b reductase deficiency. British Journal of Haematology, 141, 298–308. [DOI] [PubMed] [Google Scholar]
- Perez Rodriguez ML, Garcia Mata M and Bosch‐Bosch N, 1998. Effect of adding smoke flavouring to frankfurters on nitrite and nitrate levels. Food Chemistry, 62, 201–205. [Google Scholar]
- Peto R, Gray R, Brantom P and Grasso P, 1991a. Dose and time relationships for tumor induction in the liver and esophagus of 4080 inbred rats by chronic ingestion of N‐nitrosodiethylamine or N‐nitrosodimethylamine. Cancer Research, 51(23 Pt 2), 6452–6469. [PubMed] [Google Scholar]
- Peto R, Gray R, Brantom P and Grasso P, 1991b. Effects on 4080 rats of chronic ingestion of N‐nitrosodiethylamine or N‐nitrosodimethylamine: a detailed dose–response study. Cancer Research, 51(23 Pt 2), 6415–6451. [PubMed] [Google Scholar]
- Pierson MD and Smooth LA, 1982. Nitrite, nitrite alternatives, and the control of Clostridium botulinum in cured meats. Critical Reviews in Food Science and Nutrition, 17, 141–187. [DOI] [PubMed] [Google Scholar]
- Prival MJ, Simmon VF and Mortelmans KE, 1991. Bacterial mutagenicity testing of 49 food ingredients gives very few positive results. Mutation Research, 260, 321–329. [DOI] [PubMed] [Google Scholar]
- Ramarathnam N and Rubin LJ, 1994. The flavour of cured meat In: Shahidi F. (ed.). Flavor of Meat and Meat Products. Blackie, London: pp. 174–198. [Google Scholar]
- Reinik M, 2007. Nitrates, nitrites, N‐nitrosamines and polycyclic aromatic hydrocarbons in food: analytical methods, occurrence and dietary intake.
- Riemann H, 1950. On the toxicity of hydroxylamine. Acta Pharmacologica, 6, 285–292. [DOI] [PubMed] [Google Scholar]
- Rogers MA, Vaughan TL, Davis S and Thomas DB, 1995. Consumption of nitrate, nitrite, and nitrosodimethylamine and the risk of upper aerodigestive tract cancer. Cancer Epidemiology, Biomarkers and Prevention, 4, 29–36. [PubMed] [Google Scholar]
- Ross JD, 1963. Deficient activity of DPNH‐dependent methemoglobin diaphorase in cord blood red blood cells. Blood, 21, 51–62. [PubMed] [Google Scholar]
- Rubenchik BL, Osinkovskaya ND, Mikhailenko VM, Furman MA and Boim TM, 1990. The carcinogenic danger of nitrie pollution of the environment. Journal of Environmental Pathology, Toxicology and Oncology, 10, 290–296. [PubMed] [Google Scholar]
- Rywotycki R, 2002. The effect of selected functional additives and heat treatment on nitrosamine content in pasteurized pork ham. Meat Science, 60, 335–339. [DOI] [PubMed] [Google Scholar]
- Sarikaya R and Cakir S, 2005. Genotoxicity testing of four food preservatives and their combinations in the Drosophila wing spot test. Environmental Toxicology and Pharmacology, 20, 424–430. [DOI] [PubMed] [Google Scholar]
- Scanlan RA, 2003. Nitrosamines In: Trugo L. and Finglas PM. (eds.). Encyclopedia of Food Sciences and Nutrition, 2nd Edition Academic Press, Amsterdam: pp. 4142–4147. [Google Scholar]
- SCCS (Scientific Committee on Consumer Safety), 2011. Opinion on nitrosamines and secondary amines in cosmetic products. European Commission. Health & Consumer Protection. SCCS/1458/11. ISSN 1831‐4767
- SCF (Scientific Committee for Food), 1992. Food – science and techniques. Reports of the Scientific Committee for Food (Twenty‐sixth series). Nitrates and nitrites (opinion expressed on 19 October 1990).
- SCF (Scientific Committee for Food), 1997. Reports of the Scientific Committee for Food (Thirty‐eighth series). Opinions of the Scientific Committee for Food on: nitrates and nitrite, draft Commission Directive laying down specific purity criteria on food additives other than colours and sweeteners, cyclamic acid and its sodium and calcium salts, the safety in use of 1,1,1,2‐tetrafluoroethane as a solvent for flavour extraction and bovine spongiform encephalopathy. Opinion on nitrates and nitrite expressed on 22 September 1995) report dated 1997.
- SCF (Scientific Committee for Food), 2001. Guidance on Submissions for Food Additive Evaluations by the Scientific Committee on Food, opinion expressed on 11 July 2001, SCF/CS/ADD/GEN/26 Final.
- Sen NP, Baddoo PA and Seaman SW, 1986. N‐Nitrosothiazolidine and N‐nitrosothiazolidine‐ 4‐carboxylic acid in smoked meats and fish. Journal of Food Science, 51, 821–825. [Google Scholar]
- Sen NP, Seaman SW, Burgess C, Baddoo PA and Weber D, 2000. Investigation on the possible formation of N‐nitroso‐N‐methylurea by nitrosation of creatinine in model systems and in cured meats at gastric pH. Journal of agricultural and food chemistry, 48, 5088–5096. [DOI] [PubMed] [Google Scholar]
- Shahidi F, Pegg RB and Sen NP, 1994. Absence of volatile N‐nitrosamines in cooked nitrite‐free cured muscle foods. Meat Science, 37, 327–336. [DOI] [PubMed] [Google Scholar]
- Shapiro KB, Hotchkiss JH and Roe DA, 1991. Quantitative relationship between oral nitrate‐reducing activity and the endogenous formation of N‐nitrosoamino acids in humans. Food and Chemical Toxicology, 29, 751–755. 10.1016/0278-6915(91)90183-8 [DOI] [PubMed] [Google Scholar]
- Shimada T, 1989. Lack of teratogenic and mutagenic effects of nitrite on mouse fetuses. Archives of Environmental Health, 44, 59–63. [DOI] [PubMed] [Google Scholar]
- Shuval HI and Gruener N, 1972. Epidemiological and toxicological aspects of nitrates and nitrites in the environment. American Journal of Public Health, 62, 1045–1052. [DOI] [PMC free article] [PubMed] [Google Scholar]
- Simko P, 2011. Heat and processing generated contaminants in processed meats In: Kerry JP. and Kerry JF. (eds.). Processed Meats – Improving Safety, Nutrition and Quality. Woodhead Publishing, Cambridge, UK: pp. 488–491. [Google Scholar]
- Sindelar JJ and Milkowski AL, 2012. Human safety controversies surrounding nitrate and nitrite in the diet. Nitric Oxide, 26, 259–266. [DOI] [PubMed] [Google Scholar]
- Sinha R, Park Y, Graubard BI, Leitzmann MF, Hollenbeck A and Schatzkin A, 2009. Meat and meat‐related compounds and risk of prostate cancer in a large prospective cohort study in the United States. American Journal of Epidemiology, 170, 1165–1177. [DOI] [PMC free article] [PubMed] [Google Scholar]
- Slob W, 2016. A general theory of effect size, and its consequences for defining the Benchmark response (BMR) for continuous endpoints. Critical Reviews in Toxicology, 1–10. [DOI] [PubMed] [Google Scholar]
- Smiechowska M, Przybylowski P and Kowalski B, 1994. Study of formation of volatile N‐nitrosamines in Zulaw, Gouda and Edam cheese. Polish Journal of Food and Nutrition Sciences, 3 pp, 71–80. [Google Scholar]
- Smyth HF, Carpenter CP, Weil CS, Pozzani U, Striegel JA and Nycum JS, 1969. Range‐finding toxicity data: list VII. American Industrial Hygiene Association Journal, 30, 470–476. [DOI] [PubMed] [Google Scholar]
- Spiegelhalder B, Eisenbrand G and Preussmann R, 1976. Influence of dietary nitrate on nitrite content of human saliva: possible relevance to in vivo formation of N‐nitroso compounds. Food and Cosmetics Toxicology, 14, 545–548. [DOI] [PubMed] [Google Scholar]
- Stalikas CD, Konidari CN and Nanos CG, 2003. Ion chromatographic method for the simultaneous determination of nitrite and nitrate by post‐column indirect fluorescence detection. Journal of Chromatography A, 1002, 237–241. [DOI] [PubMed] [Google Scholar]
- Stasiuk E and Przybyłowski P, 2006. The impact of the modified method of using KNO3 on the formation of volatile N‐nitrosamines in Gouda cheese. Bromatologia i Chemia Toksykologiczna, 39. [Google Scholar]
- Stuff JE, Goh ET, Barrera SL, Bondy ML and Forman MR, 2009. Construction of an N‐nitroso database for assessing dietary intake. Journal of Food Composition and Analysis, 22, S42–S47. [DOI] [PMC free article] [PubMed] [Google Scholar]
- Suzzi G and Gardini F, 2003. Biogenic amines in dry fermented sausages: a review. International Journal of Food Microbiology, 88, 41–54. [DOI] [PubMed] [Google Scholar]
- TemaNord , 2002. Food Additives in Europe 2000 – Status of Safety Assessments of Food Additives Presently Permitted in the EU. Nordic Council of Ministers, Copenhagen. [Google Scholar]
- Theiler R, Sato K, Aspelund T and Miller A, 1984. Inhibition of N‐nitrosamine formation in a cured ground pork belly model system. Journal of Food Science, 49, 341–344. [Google Scholar]
- Til HP and Kuper CF, 1995. Sub‐chronic toxicity experiments with potassium nitrite in rats. Proceedings of the International Workshop on Health Aspects of Nitrate and its Metabolites (Particularly Nitrite), Bilthoven, The Netherlands, 8–10 November 1994. Council of Europe Press, Strasbourg.
- Til HP, Kuper CF and Falke HE, 1985a. Short‐term (4 week) oral toxicity in rats with nitrate added to a cereal basal diet. Interim Report V85.288/250458.
- Til HP, Kuper CF and Falke HE, 1985b. Short‐term (4 week) oral toxicity in rats with nitrate added to a semi‐purified basal diet. Interim Report V85.289/250458.
- Til HP, Kuper CF and Falke HE, 1988. Evaluation of the oral toxicity of potassium nitrite in a week drinking water study in rats. Food and Chemical Toxicology, 26, 851–859. [DOI] [PubMed] [Google Scholar]
- Til HP, Falke HE and Kuper CF, 1990. Supplementary subchronic (90–day) toxicity study of nitrite administered to rats in the drinking water. TNO Report, V90.271, Zeist.
- Til HP, Kuper CF and Falke HE, 1997. Nitrite‐induced adrenal effects in rats and the consequences for the no‐observed‐effect level. Food and Chemical Toxicology, 35, 349–355. [DOI] [PubMed] [Google Scholar]
- Thomson BM, Nokes CJ and Cressey PJ, 2007. Intake and risk assessment of nitrate and nitrite from New Zealand foods and drinking water. Food Additives and Contaminants, 24, 113–121. 10.1080/02652030600934206 [DOI] [PubMed] [Google Scholar]
- Tricker AR and Kubacki SJ, 1992. Review of the occurrence and formation of non‐volatile N‐nitroso compounds in foods. Food Additives and Contaminants, 9, 39–69. [DOI] [PubMed] [Google Scholar]
- Tsuda H and Hasegawa M, 1990. Malignant transformation of mouse BALB/c3T3 cells induced by NaNO2. Carcinogenesis, 11, 595–597. [DOI] [PubMed] [Google Scholar]
- Tsuda H, Inui N and Takayama S, 1976. In vitro transformation of newborn hamster cells induced by sodium nitrite. Gann, 67, 165–173. [PubMed] [Google Scholar]
- Tsuda H and Kato K, 1977. High rate of endoreduplications and chromosomal aberrations in hamster cells treated with sodium nitrite in vitro. Mutation Research/Fundamental and Molecular Mechanisms of Mutagenesis, 56, 69–73. [DOI] [PubMed] [Google Scholar]
- Van Velzen AG, Sips AJ, Schothorst RC, Lambers AC and Meulenbelt J, 2008. The oral bioavailability of nitrate from nitrate‐rich vegetables in humans. Toxicology Letters, 181, 177–181. [DOI] [PubMed] [Google Scholar]
- Vermeer ITM, Pachen DMFA, Dallinga JW, Kleinjans JCS and van Maanen JMS, 1998. Volatile N‐nitrosamine formation after intake of nitrate at the ADI levels in combination with an amine‐rich diet. Environmental Health Perspectives, 106, 459–463. [DOI] [PMC free article] [PubMed] [Google Scholar]
- Veszelovsky E, Holford NH, Thomsen LL, Knowles RG and Baguley BC, 1995. Plasma nitrate clearance in mice: modeling of the systemic production of nitrate following the induction nitric oxide synthesis. Cancer Chemotherapy and Pharmacology, 36, 155–159 (as referenced by NTP, 2001). [DOI] [PubMed] [Google Scholar]
- Vitturi DA and Patel RP, 2011. Current perspectives and challenges in understanding the role of nitrite as an integral player in nitric oxide biology and therapy. Free Radicals in Biology and Medicine, 51, 805–812. [DOI] [PMC free article] [PubMed] [Google Scholar]
- Vleeming W, van de Kuil A, te Biesebeek JD, Meulenbelt J and Boink ABTJ, 1997. Effect of nitrite on blood pressure in anaesthetised and free‐moving rats. Food and Chemical Toxicology, 35, 615–619. [DOI] [PubMed] [Google Scholar]
- Wagner DA, Schultz DS, Deen WM, Young VR and Tannenbaum SR, 1983. Metabolic fate of an oral dose of 15N‐labeled nitrate in humans: effect of diet supplementation with ascorbic acid. Cancer Research, 43, 1921–1925. [PubMed] [Google Scholar]
- Walker NJ, 1990. Nitrates, nitrites and N‐nitrosocompounds: a review of the occurrence in food and diet and the toxicological implications. Food Additives and Contaminants, 7, 717–768. [DOI] [PubMed] [Google Scholar]
- Walters CL, 1992. Reactions of nitrate and nitrite in foods with special reference to the determination of N‐nitroso compounds. Food Additives and Contaminants, 9, 441–447. [DOI] [PubMed] [Google Scholar]
- Walton G, 1951. Survey of literature relating to infant methemoglobinemia due to nitrate‐contaminated water. American Journal of Public Health, 41, 986–996. [DOI] [PMC free article] [PubMed] [Google Scholar]
- Ward MH, Mark SD, Cantor KP, Weisenburger DD, CorreaVillasenor A and Zahm SH, 1996. Drinking water nitrate and the risk of non‐Hodgkin's lymphoma. Epidemiology, 7, 375–382. [PubMed] [Google Scholar]
- Ward MH, Cantor KP, Riley D, Merkle S and Lynch CF, 2003. Nitrate in public water supplies and risk of bladder cancer. Epidemiology, 14, 183–190. [DOI] [PubMed] [Google Scholar]
- Ward MH, Cerhan JR, Colt JS and Hartge P, 2006. Risk of non‐Hodgkin lymphoma and nitrate and nitrite from drinking water and diet. Epidemiology, 17, 375–382. [DOI] [PubMed] [Google Scholar]
- Ward MH, Cross AJ, Divan H, Kulldorff M, Nowell‐Kadlubar S and Kadlubar FF, 2007a. Processed meat intake, CYP2A6 activity and risk of colorectal adenoma. Carcinogenesis, 28, 1210–1216. [DOI] [PubMed] [Google Scholar]
- Ward MH, Rusiecki JA, Lynch CF and Cantor KP, 2007b. Nitrate in public water supplies and the risk of renal cell carcinoma. Cancer Causes and Control, 18, 1141–1151. [DOI] [PubMed] [Google Scholar]
- Ward MH, Heineman EF, Markin RS and Weisenburger DD, 2008. Adenocarcinoma of the stomach and oesophagus and drinking water and dietary sources of nitrate and nitrite. International Journal of Occupational and Environmental Health, 14, 193–197. [DOI] [PMC free article] [PubMed] [Google Scholar]
- Webb AJ, Patel N, Loukogeorgakis S, Okorie M, Aboud Z and Misra S, 2008. Acute blood pressure lowering, vasoprotective, and antiplatelet properties of dietary nitrate via bioconversion to nitrite. Hypertension, 51, 784–790. [DOI] [PMC free article] [PubMed] [Google Scholar]
- WHO (World Health Organization), 2007. Nitrate and nitrite in drinking water. Background document for development of WHO Guidelines for Drinking Water Quality. WHO/SDE/WSH/07.01/16.
- WHO (World Health Organization), 2009. Dietary Exposure Assessment of Chemicals in Food. http://apps.who.int/iris/bitstream/10665/44065/9/WHO_EHC_240_9_eng_Chapter6.pdf
- WHO (World Health Organization), 2011. Guidelines for Drinking Water Quality v4. World Health Organization.
- Whong WZ, Speciner ND and Edwards GS, 1979. Mutagenicity detection of in vivo nitrosation of dimethylamine by nitrite. Environmental Mutagenesis, 1, 277–282. [DOI] [PubMed] [Google Scholar]
- Wilkens LR, Kadir MM, Kolonel LN, Nomura AM and Hankin JH, 1996. Risk factors for lower urinary tract cancer: the role of total fluid consumption, nitrites and nitrosamines, and selected foods. Cancer Epidemiology and Prevention Biomarkers, 5, 161–166. [PubMed] [Google Scholar]
- Wind M and Stern A, 1977. Comparison of human adult and fetal hemoglobin: aminophenol‐induced methemoglobin formation. Experientia, 33, 1500–1501. [DOI] [PubMed] [Google Scholar]
- Winton EF, Tardiff EG and McCabe LJ, 1971. Nitrate in drinking water. Journal – American Water Works Association, 63, 95–98. [Google Scholar]
- Witter JP and Balish E, 1979a. The health effects of nitrate, nitrite, and N‐nitroso compounds. Part 1 of a 2‐part study by the Committee on Nitrite and Alternative Curing Agents in Food. Assembly of Life Sciences.
- Witter JP and Balish E, 1979. Distribution and metabolism of ingested NO3 and NO2 in germ free and conventional‐flora rats. Applied and Environmental Microbiology, 38, 861–869. [DOI] [PMC free article] [PubMed] [Google Scholar]
- Woessner M, Smoliga JM, Tarzia B, Stabler T, Van Bruggen M and Allen JD, 2016. A stepwise reduction in plasma and salivary nitrite with increasing strengths of mouthwash following a dietary nitrate load. Nitric Oxide, 54, 1–7. [DOI] [PubMed] [Google Scholar]
- Wright RO, Lewander WJ and Woolf AD, 1999. Methemoglobinemia: etiology, pharmacology, and clinical management. Annals of Emergency Medicine, 34, 646–656. [DOI] [PubMed] [Google Scholar]
- Wyatt N, Kelly C, Fontana V, Merlo DF, Whitelaw D and Anderson D, 2006. The responses of lymphocytes from Asian and Caucasian diabetic patients and non‐diabetics to hydrogen peroxide and sodium nitrite in the Comet assay. Mutation Research, 609, 154–164. [DOI] [PubMed] [Google Scholar]
- Yurchenko S and Mölder U, 2007. The occurrence of volatile N‐nitrosamines in Estonian meat products. Food Chemistry, 100, 1713–1721. [Google Scholar]
- Zeiger E, Anderson B, Haworth S, Lawlor T and Mortelmans K, 1992. Salmonella mutagenicity tests: V. Results from the testing of 311 chemicals. Environmental and Molecular Mutagenesis, 19(Suppl. 21), 2–141. [DOI] [PubMed] [Google Scholar]
- Zeilmaker MJ, Bakker MI, Schothorst R and Slob W, 2010. Risk assessment of N‐nitrosodimethylamine formed endogenously after fish‐with‐vegetable meals. Toxicological Sciences, 116, 323–335. [DOI] [PubMed] [Google Scholar]
- Zhang N, Yu C, Wen D, Chen J, Ling Y and Terajima K, 2012. Association of nitrogen compounds in drinking water with incidence of oesophageal squamous cell carcinoma in Shexian, China. The Tohoku Journal of Experimental Medicine, 226, 11–17. [DOI] [PubMed] [Google Scholar]
- Zhu Y, Wang PP, Zhao J, Green R, Sun Z and Roebothan B, 2014. Dietary N‐nitroso compounds and risk of colorectal cancer: a case–control study in Newfoundland and Labrador and Ontario, Canada. British Journal of Nutrition, 111, 1109–1117. [DOI] [PMC free article] [PubMed] [Google Scholar]
Associated Data
This section collects any data citations, data availability statements, or supplementary materials included in this article.
Supplementary Materials
Summary of the reported use levels (mg/kg or mg/L as appropriate) of potassium and sodium nitrite (E 249–250) provided by industry and of analytical results (mg/kg) of potassium and sodium nitrite (E 249–250) provided by Members States
Number and percentage of food products labelled with nitrites (E 249–250) out of the total number of food products present in Mintel GNPD per food sub‐category between 2011 and 2015
Concentration levels of potassium and sodium nitrite (E 249‐250) used in the refined exposure scenarios (mg/kg or mL/kg as appropriate)
Summary of total estimated exposure to potassium and sodium nitrite (E 249‐250) from its use in the maximum level exposure scenario and the refined exposure assessment scenarios per population group and survey: mean and 95th percentile (mg/kg bw per day)