

Abstract
The ergot alkaloids (EAs) are mycotoxins produced by several species of fungi in the genus Claviceps. In Europe, Claviceps purpurea is the most widespread species and it commonly affects cereals such as rye, wheat, triticale, barley, millets and oats. Food and feed samples used to estimate human and animal dietary exposure were analysed for the 12 main C. purpurea EAs: ergometrine, ergosine, ergocornine, ergotamine, ergocristine, ergocryptine (α‐ and β‐isomers) and their corresponding –inine (S)‐epimers. The highest levels of EAs were reported in rye and rye‐containing commodities. In humans, mean chronic dietary exposure was highest in ‘Toddlers’ and ‘Other children’ with maximum UB estimates of 0.47 and 0.46 μg/kg bw per day, respectively. The 95th percentile exposure was highest in ‘Toddlers’ with a maximum UB estimate of 0.86 μg/kg bw per day. UB estimations were on average fourfold higher than LB estimations. Average acute exposure (MB estimations) ranged from 0.02 μg/kg bw per day in ‘Infants’ up to 0.32 μg/kg bw per day estimated in ‘Other children’. For the 95th percentile acute exposure, the highest estimate was for a dietary survey within the age class ‘Other children’ (0.98 μg/kg bw per day). Dietary exposure estimates for animals, assuming a mean concentration scenario, varied between 0.31–0.46 μg/kg bw per day in beef cattle and 6.82–8.07 μg/kg bw per day (LB–UB) in piglets, while exposure estimates assuming a high concentration scenario (95th percentile) varied between 1.43–1.45 μg/kg bw per day and 16.38–16.61 μg/kg bw per day (LB–UB) in the same species. A statistically significant linear relationship between the content of sclerotia and the levels of EAs quantified was observed in different crops (barley, oats, rye, triticale and wheat grains). However, the absence of sclerotia cannot exclude the presence of EAs as samples with no sclerotia identified showed measurable levels of EAs (‘false negatives’).
Keywords: ergot alkaloids, food, feed, dietary exposure, sclerotia
Summary
The ergot alkaloids (EAs) are mycotoxins produced by several species of fungi in the genus Claviceps. In Europe, Claviceps purpurea is the most widespread and it commonly affects cereals such as rye, wheat, triticale, barley, millets and oats. The toxicity of EAs is well known and has been characterised. The EFSA Panel on Contaminants in the Food Chain (CONTAM) concluded in 2012 that the vasoconstrictive effect represented by tail muscular atrophy in rats was the critical effect for hazard characterisation and derivation of the health‐based guidance values (HBGVs). A benchmark dose at 10 % extra risk (BMDL10) of 0.33 mg/kg body weight (bw) per day was calculated. A group acute reference dose (ARfD) of 1 μg/kg bw and a group tolerable daily intake (TDI) of 0.6 μg/kg bw per day were derived for the sum of the EAs covered in the opinion. Equal relative potency for all EAs was assumed as the available data did not allow determination of relative potencies (EFSA CONTAM Panel, 2012).
In an official request from the European Commission in September 2016, the EFSA Evidence Management Unit (DATA unit) was asked to estimate chronic and acute dietary exposure to EAs in humans and animals. A total of 4,528 food samples, and 654 feed samples plus 1,235 samples on grains initially reported as ‘Grain as crops’, were available to estimate dietary exposure. For food, this number represents more than four times the number of samples used for exposure estimates in the 2012 EFSA opinion. In 97% of the samples, the analysis included all 12 main C.purpurea EAs: ergometrine, ergosine, ergocornine, ergotamine, ergocristine, ergocryptine (α‐ and β‐isomers) and their corresponding –inine (S)‐epimers. The total content of EAs in each sample was estimated by summing the reported concentrations for each of the individual alkaloids.
The food samples were collected between 2011 and 2016 in 15 different European countries, with more than 50% coming from the Netherlands and around 28% from Germany. The highest levels of EAs were reported in rye and rye‐containing commodities, in particular in raw agricultural or minimally processed commodities (e.g. ‘Rye milling products, 198–239 μg/kg, lower bound (LB)–upper bound (UB), n = 394). Among processed foods, the highest levels of EAs were found in ‘Mixed wheat and rye bread and rolls’ (33–82 μg/kg, n = 201), ‘Rye bread and rolls’ (29–67 μg/kg, n = 181) and ‘Rye flakes’ (35–83 μg/kg, n = 15), always for LB–UB scenarios. EA contamination also affects other cereal grains such as wheat, spelt, oats and corn and their derived processed products; in general, the mean values were lower than those reported for rye and rye‐based products, although the UB scenario was clearly affected by the left‐censored data. In more than three quarters of the food samples (3,463 samples, 76%) all EAs analysed were unquantified. Among these analytical results reported as left‐censored, 74% were reported as below the limit of quantification (LOQ) and the rest as below the limit of detection (LOD). Only 11% of the analytical results on food were quantified. The highest average contributors to the total concentration in each food sample were four EAs, ergotamine (18%), ergocristine (15%), ergosine (12%) and ergometrine (11%). During processing, the ratio between the average contribution of the epimeric forms (‐ine and ‐inine) shifts towards the –inine (S)‐epimers (from 23.1% to 41.3%).
A total of 654 feed samples were available in the final data set. The samples were collected in five different countries, the Czech Republic, Croatia, Slovenia, the Netherlands and the United Kingdom between 2011 and 2016. In more than half of these samples, not a single EA was found above the LOQ (n = 352). The EAs most commonly quantified were ergotamine and ergosine (~ 38% of the samples), with ergometrine and its –inine (S)‐epimer only quantified in 22% and 19% of cases, respectively. Overall, only 28% of the analytical results were quantified.
Data for several samples of rye, barley, wheat, oats and triticale grains (n = 1,235) initially reported as ‘Grain as crops’ (samples of unprocessed grains of unknown end‐use) were also available. Around 80% of the samples contained at least one EA above the LOQ, which is a greater proportion than found for feed samples. When looking at the samples where all 12 EAs were analysed and at least one EA was quantified (n = 954), the three predominant EAs in terms of average contribution were ergotamine (23%), ergosine (19%) and ergocristine (17%). The –ine (R)‐epimers represented on average 75% of the total EA content in each sample, slightly higher than observed in the feed samples (69%).
Since ‘Grain as crops’ contained higher EA levels as compared to the same grains reported as feed, the 1,235 samples of ‘Grain as crops’ were combined with the feed samples to cover worst‐case situations and assuming that the samples of ‘Grain as crops’ could end up entering in the feed chain. In the merged data set most of the samples were unprocessed, mainly cereal grains, although a few samples of ‘Compound feed’ were also available. The highest EA levels were reported for rye grains (LB–UB = 3,019–3,066 μg/kg, n = 192), followed by triticale and wheat grains with LB–UB = 284–309 μg/kg (n = 115) and LB–UB = 240–265 μg/kg (n = 760), respectively.
The only analytical method reported was liquid chromatography (LC), predominantly with tandem mass spectrometry (MS/MS) as detection method. Fluorescence detection (FD) was also used in a minority of cases. The lowest LOQ reported was 0.1 μg/kg but many analytical methods reported higher LOQs, which had a significant impact on the UB due to the amount of left‐censored data and despite the exclusion of results with LOQs higher than 20 μg/kg.
In humans, mean chronic dietary exposure was highest in ‘Toddlers’ and ‘Other children’ with maximum UB estimates of 0.47 and 0.46 μg/kg bw per day, respectively. The 95th percentile dietary exposure was highest in ‘Toddlers’ with a maximum UB estimate of 0.86 μg/kg bw per day. Overall, chronic dietary exposure to EAs in the young population (‘Infants’, ‘Toddlers’, and ‘Other children’) was 2–3 times higher than that estimated for the adult population (‘Adults’, ‘Elderly’, and ‘Very elderly’). UB estimations were on average 4‐fold higher than LB estimations. Among processed foods, the main contributors to the dietary exposure to EAs were different types of bread and rolls, in particular those containing or made exclusively of rye, representing up to 84% (middle bound, MB) of the total exposure to EAs. Average acute exposure (MB) ranged from a minimum of 0.02 μg/kg bw per day estimated in ‘Infants’ up to a maximum of 0.32 μg/kg bw per day estimated in ‘Other children’. For the 95th percentile acute dietary exposure, the highest estimates were for a dietary survey within the age class ‘Other children’ (0.98 μg/kg bw per day). For cereal‐based processed commodities, the most relevant foods in terms of acute exposure to EAs were ‘Mixed wheat and rye bread and rolls’ and ‘Rye bread and rolls’. For high consumers, a single consumption of ‘Mixed wheat and rye bread and rolls’ can lead to acute exposure estimates up to 0.74 (95% CI = 0.59–0.93) μg/kg bw per day and up to 0.64 (95% CI = 0.60–0.69) μg/kg bw per day in the case of ‘Rye bread and rolls’. When compared to the 2012 EFSA opinion, a higher number of food commodities was available, in particular for processed foods. This wider range of products probably resulted in higher chronic dietary exposure estimates in comparison to those from 2012, although also the overall EA content seems to be slightly higher in the food samples used for the current assessment. Highest acute dietary exposure estimates were similar to those reported in 2012.
In animal nutrition, compound feeds (complementary or complete feeds) represent a large amount of the feed consumed by the farmed animals, but the available data on the occurrence of EAs in these commodities were scarce and did not allow a reliable exposure estimate to be made. Therefore, only the occurrence data on grain cereals and on forages and roughage were used to calculate animal exposure. Animal dietary exposure varied according to animal species and productive category. The exposure considering a mean concentration scenario varied between 0.31–0.46 μg/kg bw per day in beef cattle and 6.82–8.07 μg/kg bw per day (LB–UB) in piglets, while a high concentration scenario (95th percentile) resulted in estimates that varied between 1.43–1.45 μg/kg bw per day and 16.38–16.61 μg/kg bw per day (LB–UB) in the same species. When rye is included in the diets, the exposure of the relevant species would increase up to levels of 25.71–26.47 μg/kg bw per day in the mean concentration scenario, and up to 67.19–67.26 μg/kg bw per day (LB–UB) in the high concentration scenario in pigs for fattening, the species with the highest exposure level.
Dietary exposure estimates for EAs have uncertainty related to how representative the food and feed samples are from across Europe, in particular for feed since data came primarily from a few countries. The large proportion of left‐censored data also gives rise to some uncertainty; this is particularly relevant for EAs as the final content in the samples results from the sum of up to 12 individual compounds, and even more in food samples, where only 11% of the analytical results were quantified. Uncertainties related to the consumption data mainly refer to eating occasions reported as raw agricultural/minimally processed commodities derived from consumption data on processed foods that were disaggregated. The disaggregated consumption data in these dietary surveys do not specify the original consumed processed commodity (e.g. cake, bread, etc.) which makes it impossible to apply any factor to return to the processed commodities. These consumption data were linked to EA levels in raw agricultural/minimally processed commodities with no factors applied to cover the possible elimination of EAs during processing. As a result, the dietary exposure estimations obtained for these dietary surveys are likely overestimated. Related to feed, the use of samples of ‘Grain as crops’ as feed may imply overestimation of the animal exposure as these samples were reported with relatively high EA content and their use as feed is not confirmed. Overall, LB estimations of chronic exposure to EAs most likely underestimated the exposure levels of the European population, while middle‐ and, above all, UB exposure are most likely overestimated. Similarly, acute exposure estimates to EAs are likely overestimated by using the MB scenario.
Two data providers submitted information on the content of ergot sclerotia in different crops (2,546 results on ergot sclerotia). In total, 638 samples were analysed for both the 12 EAs and the presence of sclerotia, in most of the cases following sclerotia identification. In all crops assessed (barley, oats, rye, triticale and wheat grains), there was a strong and statistically significant (p‐value < 0.0001) linear relationship between the content of sclerotia and the levels of EAs analysed, with Pearson correlation coefficients ranging between 0.806 for rye grains and 0.972 for triticale grains. It can be concluded that, in general, the presence of ergot sclerotia is a good indicator for the presence of EAs in grain samples, with only 14% of samples with sclerotia identified showing no quantified levels of EAs (‘false positives’). However, the absence of sclerotia does not exclude the presence of EAs, since there were several samples with no sclerotia detected that showed measurable levels of EAs (‘false negatives’).
Efforts should continue to collect analytical data on EAs in relevant food and feed commodities with special attention to processed foods. Likewise, simultaneous collection of data on the presence of ergot sclerotia and on the EA content in different food and feed commodities should continue to help better understand the relationship between these two variables. As the EA pattern of occurrence seems to depend on many different factors (crop, epimerisation during processing and/or analysis, etc.), it is recommended to continue monitoring at least the EAs already listed in Commission Recommendation 2012/154/EU.
1. Introduction
The ergot alkaloids (EAs) are mycotoxins produced by several species of fungi in the genus Claviceps. In Europe, Claviceps purpurea is the most widespread and it commonly affects cereals such as rye, wheat, triticale, barley, millets and oats. The fungus has been traditionally associated with rye, where it forms sclerotia, characteristic dark‐coloured crescent‐shaped bodies in the ears as a final stage of the plant disease (Krska and Crews, 2008; Mulder et al., 2015).
Figure 1 shows the most important structural features of EAs. This class of alkaloids is characterised by the presence of a tetracyclic ergoline ring system and can be classified into four major groups based on the substitution at C‐8: (a) clavine alkaloids and 6,7‐secoergolenes (Figure 2), simple lysergic acid derivatives (Figure 3), ergopeptine alkaloids – cyclol EAs (Figure 4), and ergopeptam alkaloids – lactam EAs (Figure 5).
Figure 1.

Ergoline ring system including numbering and assignment of rings
Figure 2.

Structures exemplifying clavine alkaloids and 6,7 secoergolenes (Figure taken from EFSA CONTAM Panel 2012)
Figure 3.

Structures exemplifying simple lysergic acid alkaloids (Figure taken from EFSA CONTAM Panel 2012)
Figure 4.

Structures exemplifying the (cyclol) ergotamine subclass: ergotamine and ergotaminine. Amino acids involved in the cyclic tripeptide part are shown (Figure taken from EFSA CONTAM Panel 2012)
Figure 5.

Structures exemplifying the (non‐cyclol) ergotamam subclass: ergotamam, ergotaminam and for comparison ergotamine from the cyclol‐subclass of ergotamines (Figure taken from EFSA CONTAM Panel, 2012)
In July 2012, the EFSA Panel on Contaminants in the Food Chain (CONTAM Panel) published a scientific opinion on EAs in food and feed. This opinion was based on the EAs identified in sclerotia of C. purpurea: ergometrine, ergotamine, ergosine, ergocristine, ergocryptine (which is a mixture of α‐ and β‐isomers), ergocornine, and the corresponding –inine epimers. These EAs are all ergopeptine alkaloids (Figure 4), except the lysergic acid derivative ergometrine (Figure 3). The ‐inine forms are described to be biologically inactive, but interconversion can occur under various conditions, and thus the CONTAM Panel based its risk assessment on both forms (‐ine and ‐inine) of ergometrine, ergotamine, ergosine, ergocristine, α‐ and β‐ergocryptine, and ergocornine.
At the time of the evaluation, only limited occurrence data were available. Around 60% of the food samples collected were from one Member State and 60% of the samples were left‐censored, i.e. below limit of detection (LOD) or limit of quantification (LOQ). Occurrence data on feed were also limited, with 50% of the data collected in a single Member State and 75% were left censored. The highest concentrations of EAs were reported for rye grains, rye milling products and rye by‐products (EFSA CONTAM Panel, 2012).
Both chronic and acute exposures for various age groups across European countries were performed by the CONTAM Panel in 2012. The chronic dietary exposure in the adult population varied between 0.007 and 0.08 μg/kg body weight (bw) per day for average consumers, and 0.014 and 0.19 μg/kg bw per day for high consumers. The acute dietary exposure in the adult population ranged between 0.02 and 0.23 μg/kg bw per day for average consumers, and between 0.06 and 0.73 μg/kg bw per day for high consumers. The highest chronic exposure to EAs in ‘Toddlers’ and ‘Other children’ ranged between 0.03 and 0.17 μg/kg bw per day in ‘Toddlers’, and between 0.02 and 0.17 μg/kg bw per day in ‘Other children’. For high consumers, estimated chronic exposure values in ‘Toddlers’ ranged between 0.07 and 0.34 μg/kg bw per day, and for ‘Other children’ between 0.03 and 0.30 μg/kg bw per day. ‘Toddlers’ and ‘Other children’ showed the highest acute exposure to EAs. For average consumers, the estimated acute exposure in ‘Toddlers’ ranged between 0.08 and 0.42 μg/kg bw per day, and between 0.05 and 0.36 μg/kg bw per day in ‘Other children’. For high consumers, estimated acute exposure values in ‘Toddlers’ ranged between 0.21 and 1.03 μg/kg bw per day, and for ‘Other children’ between 0.12 and 0.82 μg/kg bw per day. Differences in dietary exposures to EAs were identified among countries, with highest both dietary chronic and acute exposures across the different age groups in countries with high consumption of rye bread and rolls (EFSA CONTAM Panel, 2012).
The toxicity of EAs is well known and characterised from various outbreaks of human poisoning by grain crops contaminated with sclerotia of fungal species within the genus Claviceps, in particular C. purpurea (WHO‐IPCS, 1990), and the therapeutic use of ergotamine and ergometrine salts. Acute toxicity, as reflected in the LD50s determined in mice, rats and rabbits by intravenous (i.v.) or oral exposure for EAs was reviewed by the European Food Safety Authority (EFSA) (EFSA, 2005; EFSA CONTAM Panel, 2012). No‐observed‐adverse‐effect levels (NOAELs) of 0.22–0.60 mg/kg bw per day were identified for the toxicity of ergotamine, ergometrine and α‐ergocryptine from repeat dose rat studies. At the doses tested, EAs exhibit moderate oral acute exposure. The acute/short‐term toxicity induces signs of neurotoxicity, including restlessness, miosis or mydriasis, muscular weakness, tremor and rigidity. EAs act on a number of neurotransmitter receptors, particularly adrenergic, dopaminergic and serotonergic receptors. The interaction of EAs with neurotransmitter receptors could result in acute as well as longer term effects. The CONTAM Panel concluded in 2012 that the vasoconstrictive effect represented by tail muscular atrophy in rats (Speijers et al., 1993) was the critical effect for hazard characterisation and derivation of the health‐based guidance values (HBGVs). A BMDL10 of 0.33 mg/kg bw per day was calculated for the incidence of tail muscular atrophy in a 13‐week rat feeding study of ergotamine. This effect was considered representative of the vasoconstrictive effects of EAs and provided a suitable reference point for establishment of a group acute reference dose (ARfD) of 1 μg/kg bw and a group tolerable daily intake (TDI) of 0.6 μg/kg bw per day for the sum of the EAs covered in the opinion. Equal relative potency for all EAs was assumed as the available data did not allow determination of relative potencies (EFSA CONTAM Panel, 2012).
The Panel concluded that the available data did not indicate a human health concern for any population subgroup. However, it was noted that the dietary exposure estimates related to a limited number of food groups, and a possible unknown contribution from other foods could not be discounted.
Concerning EAs and animal health, EFSA published in 2005 a scientific opinion related to ergot as undesirable substance in animal feed. A NOAEL of 0.15 mg EAs/kg feed for piglets and NOAEL of 1.4 mg EAs/kg feed for poultry were observed (EFSA, 2005). In the 2012 opinion, animal exposure to EAs was calculated by combining feed consumption based on example diets with EAs occurrence levels in cereal grain data collected by EFSA. However, within the European Union (EU), rye, sorghum and millet are not widely used as livestock feeds, although where grown commercially, these feeds may be used more extensively in livestock rations. Furthermore, the risk of ergotism in livestock as a result of consuming contaminated cereal grains, or compound feeds manufactured from them, is reduced when appropriate seed cleaning is carried out. Therefore, the Panel concluded that under normal conditions, the risk of animal health to EAs toxicosis was considered low (EFSA CONTAM Panel, 2012).
EAs as such are not regulated within the EU. A maximum level of 1,000 mg/kg of rye ergot sclerotia (Claviceps purpurea) in all feed containing unground cereals was set by Directive 2002/32/EC.1 For food, Commission Regulation (EU) 2015/19402 amended Regulation (EC) No 1881/20063 as regards maximum levels of ergot sclerotia in certain unprocessed cereals, established a maximum level of 0.5 g/kg of ergot sclerotia for unprocessed cereals with the exception of corn and rice intended for human consumption.
In order to generate more occurrence data on the presence of EAs in feed and food, the Commission adopted Recommendation 2012/154/EU4 on the monitoring of the presence of EAs in feed and food. This monitoring should focus on the six predominant EAs, i.e. ergometrine, ergotamine, ergosine, ergocristine, ergocryptine and ergocornine and their related –inines. Member States should measure wherever possible the sclerotia content in the sample in order to improve knowledge with respect to the relationship between the EAs contained in the sclerotia and in the whole grain.
In September 2016, EFSA received a mandate from the European Commission to perform updated chronic and acute animal and human exposure assessments to EAs. Furthermore, the Commission asked to assess the possible relationship between the content of the sclerotia in the samples and the EA content.
1.1. Background and Terms of Reference as provided by the requestor
BACKGROUND AS PROVIDED BY THE EUROPEAN COMMISSION
Following the outcome of EFSA's scientific opinion related to ergot as undesirable substance in animal feed in 20055 and the opinion on ergot alkaloids in food and feed in 2012,6 the Commission adopted on 15 March 2012 Commission Recommendation 2012/154/EU on the monitoring of the presence of ergot alkaloids in feed and food4 to collect more occurrence data on ergot alkaloids in feed and food and to determine, whenever possible, simultaneously the sclerotia content in the sample in order to improve the knowledge on the relation between the content of sclerotia and of the level of individual ergot alkaloids.
A maximum level of 1,000 mg/kg of rye ergot (Claviceps purpurea) sclerotia has been established for feed containing unground cereals by Directive 2002/32/EC of the European Parliament and of the Council of 7 May 2002 on undesirable substances in animal feed.1 A maximum level of 0.5 g/kg of ergot sclerotia has been established for unprocessed cereals with the exception of corn and rice intended for human consumption by Commission Regulation (EC) No 1881/2006 of 19 December 2006 setting maximum levels for certain contaminants in foodstuffs.7
The setting of appropriate and achievable maximum levels for ergot alkaloids, providing a high level of animal and human health protection shall be considered before 1 July 2017. It is therefore appropriate to perform an updated chronic and acute animal and human exposure assessment taking into account the available occurrence data. Furthermore, it is appropriate to assess if there is a relationship between the content of sclerotia and the level of individual (or sum of) ergot alkaloids.
TERMS OF REFERENCE
In accordance with Article 31 (1) of Regulation (EC) No 178/2002, the Commission asks EFSA for an updated chronic and acute animal and human exposure assessment to EAs taking into account the occurrence data available in the EFSA database. In addition, EFSA is requested to assess if there is a relationship between the content of sclerotia and the level of individual (or sum of) EAs.
2. Data and methodologies
2.1. Data
2.1.1. Occurrence data (food and feed)
2.1.1.1. Data collection and validation
The analytical results on EAs referred to the main Claviceps purpurea EAs that cover a total of 14 different EAs: ergometrine (ergonovine), ergosine, ergocornine, ergotamine, ergocristine, α‐ergocryptine, β‐ergocryptine, and the corresponding ‐inine (S)‐epimers (ergometrinine, ergosinine, ergocorninine, ergotaminine, ergocristinine, α‐ergocryptinine and β‐ergocryptinine). Analytical data on the two isomers (α‐ and β‐) of ergocryptine/ergocryptinine were reported either as individual results or as the sum of both isomers.
At the moment of the closure of the data collection (December 2016), a total of 123,367 analytical results on EAs were available in the EFSA database (12,675 samples, food and feed). Analytical data obtained through an Article 36 grant (CFP/EFSA/CONTAM/2010/01) awarded to Ghent University and already used in the 2012 EFSA opinion were also included (Diana Di Mavungu et al., 2011). In addition to the data on EAs, a total of 2,546 results on ergot sclerotia were submitted by two different data providers.
The data were submitted to EFSA following the requirements of the EFSA Guidance on Standard Sample Description for Food and Feed (EFSA, 2010a).
2.1.1.2. Data analysis
To guarantee an appropriate quality of the data used in the exposure assessment, the initial data set was carefully evaluated by applying several data cleaning and validation steps, including a comprehensive check of the units and how the results were expressed (e.g. fresh weight/dry weight). Special attention was paid to the codification of food samples under the FoodEx classification (EFSA, 2011a) and according to the catalogue of feed materials described in Commission Regulation 68/20138 for the feed samples. The outcome of the data analysis is shown in section 3.
The left‐censored data were treated by the substitution method as recommended in the ‘Principles and Methods for the Risk Assessment of Chemicals in Food’ (WHO/IPCS, 2009). The same method is indicated in the EFSA scientific report ‘Management of left‐censored data in dietary exposure assessment of chemical substances’ (EFSA, 2010b) as an option in the treatment of left‐censored data. The guidance suggests that the lower‐bound (LB) and upper‐bound (UB) approach should be used for chemicals likely to be present in food (e.g. naturally occurring contaminants, nutrients and mycotoxins). At the LB, results below the LOQ and LOD were replaced by zero; at the UB, the results below the LOD were replaced by the LOD and those below the LOQ were replaced by the value reported as LOQ. Additionally, as a point estimate between the two extremes, the middle‐bound (MB) scenario was calculated by assigning a value of LOD/2 or LOQ/2 to the left‐censored data.
2.1.2. Human consumption data
The EFSA Comprehensive European Food Consumption Database (Comprehensive Database) provides a compilation of national information on food consumption at individual level. It was first built in 2010 (EFSA, 2011b; Huybrechts et al., 2011; Merten et al., 2011). Details on how the Comprehensive Database is used are published in the Guidance of EFSA (EFSA, 2011b). The latest version of the Comprehensive Database9 contains results from a total of 51 different dietary surveys carried out in 23 different Member States covering 94,532 individuals.
Within the dietary studies, subjects are classified in different age classes as described in Table 1; two additional surveys provided information on specific population groups: ‘Pregnant women’ (Latvia) and ‘Lactating women’ (Greece).
Table 1.
Age classes considered in the EFSA Comprehensive European Food Consumption Database
| Age range | |
|---|---|
| Infants | < 12 months old |
| Toddlers | ≥ 12 months to < 36 months old |
| Other children | ≥ 36 months to < 10 years old |
| Adolescents | ≥ 10 years to < 18 years old |
| Adults | ≥ 18 years to < 65 years old |
| Elderly | ≥ 65 years to < 75 years old |
| Very elderly | ≥ 75 years old |
Overall, the food consumption data in the Comprehensive Database are the most complete and detailed data currently available at EU level. Consumption data were collected using single or repeated 24‐ or 48‐h dietary recalls, and dietary records covering from 3 to 7 days per subject. Owing to the differences in the methods used for data collection, direct country‐to‐country comparisons can be misleading.
Detailed information on the different dietary surveys used in this report is shown in Appendix A, including the number of subjects and days available for each age class.
2.1.3. Animal consumption data
The feeds consumed (and the feed intake) by the most relevant farm livestock and companion animals can only be based on estimates, since no comprehensive feed consumption database exists. The animal species and categories considered were: (i) ruminants (dairy cows (producing approximately 40 kg milk/day)), beef cattle (reared on silage and non‐forage feed or cereal based diets), lactating sheep, milking and fattening goat); (ii) pigs (piglets, fattening pigs and lactating sows); (iii) poultry (broilers, laying hens, turkeys for fattening and duck for fattening); (iv) rabbits; (v) farmed fish; (vi) companion animals (dogs, cats and horses).
The average feed intakes used to calculate animals’ exposure to EAs are described in Appendix B. They were derived from information extensively described by the CONTAM Panel in two different Scientific Opinions on the risks for animal and public health, one on T‐2 and HT‐2 toxin in food and feed (EFSA CONTAM Panel, 2011), and the other on EAs in food and feed (EFSA CONTAM Panel, 2012). The estimated feed intakes are based on published guidelines on nutrition and feeding (AFRC, 1993; Carabano and Piquer, 1998; NRC, 2006, 2007a,b; Leeson and Summers, 2008; EFSA, 2009a).
2.1.4. Food classification
Data on human consumption and food occurrence were classified according to the FoodEx classification system (EFSA, 2011a). FoodEx is a food classification system developed by EFSA in 2009 with the objective of simplifying the linkage between occurrence and food consumption data when assessing the exposure to hazardous substances. It contains 20 main food groups (first level), which are further divided into subgroups having 140 items at the second level, 1,261 items at the third level and reaching about 1,800 end‐points (food names or generic food names) at the fourth level.
2.1.5. Feed classification
Feed samples were classified according to the Catalogue of feed materials as described in Commission Regulation No 68/201310
2.2. Methodologies
2.2.1. Human dietary exposure assessment
Based on the outcome of the EFSA 2012 CONTAM opinion, both chronic and acute dietary exposure to EAs were assessed (EFSA CONTAM Panel, 2012). In Appendix A, the number of available days for each age class used in the acute exposure assessment is described beside the number of subjects available for the chronic exposure assessment.
As suggested by the EFSA Working Group on Food Consumption and Exposure, dietary surveys with only 1 day per subject were considered only for acute exposure as they are not adequate to assess repeated exposure (EFSA, 2011b). Similarly, subjects who participated only 1 day in the dietary studies, when the protocol prescribed more reporting days per individual, were also excluded for the chronic exposure assessment.
For chronic exposure assessment, food consumption data and body weight were used from 35 different and most recent dietary surveys carried out in 19 different European countries present in the latest version of the Comprehensive Database. Occurrence data and consumption data were linked at the lowest FoodEx level possible. The mean and the high (95th percentile) chronic dietary exposures were calculated by combining EA mean occurrence values with the average daily consumption for each food at individual level in each dietary survey. Exposure estimates were calculated for each dietary survey and age class. In addition, the different food commodities were grouped within each food category to better explain their contribution to the total dietary exposure to EAs.
Acute dietary exposure to EAs was estimated using a probabilistic approach. A total of 41 most recent dietary surveys carried out in 23 different European countries were used. Acute exposure was assessed for each reporting day by multiplying the total daily consumption amount for each food by one occurrence level randomly drawn among the individual results available for that type of food. Respective exposures from the different foods consumed that day were then summed and finally divided by the individual's body weight. This process was iterated 1,000 times for each reporting day. For the calculations, the MB approach for the occurrence data was used. For each of these endpoints, the 95% confidence interval was defined as the 2.5th and 97.5th percentiles obtained from the 1,000 iterations.
2.2.2. Animal dietary exposure assessment
Estimated example diets for each animal species and category were used to calculate the exposure to EAs. The diets, already presented and extensively described by the CONTAM Panel in the Scientific Opinion on T‐2 and HT‐2 toxin in food and feed (EFSA CONTAM Panel, 2011), are summarised in the Appendix B. Different scenarios were proposed for ruminant animals: high‐yielding dairy cows are represented by animals with a milk production level of approximately 40 kg/day, with 40% of the dairy ration as non‐forage feed (about 12 kg). Regarding beef cattle, two feeding systems were used one based on cereals and one on forages.
The cereal grain with the highest probability to be contaminated by EAs is rye. Rye is used in animal nutrition, even if not in routine like other cereal grains (barley, wheat, maize). Therefore, diets consisting of rye up to the maximum recommended levels were considered for those species in which its use is relevant (fattening pigs, lactating sows, laying hens, dairy cows and beef cattle).
2.2.3. Sclerotia content and ergot alkaloid concentration
A correlation analysis was carried out to quantify the strength of a potential linear relationship between the content of sclerotia and the levels of EAs; a Pearson product‐moment correlation coefficient or Pearson's correlation was used with a significance level (α) of 0.05%.
All analyses were run using the SAS Statistical Software (SAS enterprise guide 5.1), including the modelling of the probabilistic acute exposure.
3. Assessment
3.1. Occurrence data on ergot alkaloids
The initial data set with 12,675 samples representing 123,367 analytical results on EAs were collected between 2004 and 2016 in 22 different European countries: Austria, Belgium, Bulgaria, Croatia, the Czech Republic, Denmark, Estonia, Finland, France, Germany, Hungary, Ireland, Italy, Lithuania, Luxembourg, Malta, Poland, Slovenia, Sweden, Switzerland, the Netherlands, and the United Kingdom. Although most of the data were submitted by national competent authorities (78%), data were also reported by academia (Ghent University, 9%) and other providers such as Campden BRI (7%) and Arvalis ‐ Institut du vegetal (6%).
As a first step, 36 grain samples (432 analytical results) were excluded following information submitted by the data provider on the fact that, due to the high EA levels detected, the samples had been directed away from the food chain. Likewise, 228 samples (2,686 analytical results) initially codified as ‘Bread and rolls’/‘Fine bakery wares’ without further information (FoodEx level 2) were also excluded following confirmation from the data provider that they referred to baking mixtures and were not ready‐to‐eat.
Only data collected in the last five years were considered. This mainly referred to samples collected from 2011 to 2015, since only a limited amount of data from samples collected in 2016 were submitted. Based on this, 2,822 samples (26,331 analytical results) collected between 2004 and 2010 were excluded. A total of 450 analytical results, reporting a value for the generic term ‘Ergot alkaloids’, were also excluded. There were a total of 376 analytical results for which neither LOQ nor LOD were submitted, which accounted for a total of 35 samples that were excluded from the final data set. Based on the Standard Sample Description (SSD) data element ‘Sampling strategy’, 1,037 analytical results (107 samples) reported as ‘Suspect sampling’ were excluded since it was considered that they did not represent random sampling and they could bias the exposure estimates.
The total content of EAs in each sample was estimated by summing the reported amount for each of the individual alkaloids reported. Considering the large amount of left‐censored data present in the data set (86%), the presence of relatively high LODs/LOQs may have a significant influence on the UB scenario. In order to minimise this impact, a careful evaluation was done for each alkaloid reported, looking at the distribution of the left‐censoring limits. A value of 20 μg/kg was selected as a LOQ cut‐off for each of the individual EAs, permitting the exclusion of those samples analysed by methods with poor sensitivity but without compromising excessively the number of available samples. In total, 8,150 analytical results were excluded (101 quantified, ~ 1%) that accounted for a total of 1,071 samples.
After this first evaluation of the data, a total of 77,301 analytical results was available, corresponding to 6,458 samples (food and feed). In addition to reporting the generic name ‘Ergot alkaloid’, the 14 EAs covered in this scientific report were reported in 17 different ways, considering that the two isomers of ergocryptine/ergocryptinine (α‐ and β‐) can be either reported as individual results or as the sum of both isomers, and that ergometrine was also reported as ergonovine. Based on literature, it seems that the two isomers of ergocryptinine are not always separated (Crews, 2015). In fact, in most of the cases, the two isomers were reported as the sum not only for ergocryptinine but also for ergocryptine. In the very few occasions that both isomers were submitted separately, the sums for ergocryptine and ergocryptinine were calculated. Likewise, when only one isomer was reported the analytical result was considered as the sum of both epimers.
To compute the number of EAs reported in each sample, each of the sums of the two isomers were considered as just one EA, so 12 was considered as the maximum number of ergots reported per sample: ergometrine, ergosine, ergocornine, ergotamine, ergocristine, ergocryptine (α‐ and β‐ isomers), and their corresponding ‐inine (S)‐epimers. The vast majority of the samples were reported as analysed for 12 EAs, specifically 6,255 samples (97%), as a consequence, most probably, of the Commission Recommendation 2012/154/EU4 that recommended the monitoring of at least the 12 main C. purpurea EAs (see Section 2.1.1.1). For the remaining ~ 3% of the samples, the number of EAs analysed varied between 4 and 11.
The contribution of the different alkaloids to the total concentration in each sample was assessed in those samples with all the 12 EAs reported and at least one quantified (1,941 samples). Overall, the average contribution of the –ine (R)‐epimers was much higher than that of the –inine (S)‐epimers (72% and 28%). To avoid any potential underestimation in particular food categories by including the samples that did not report the 12 EAs (3%), only those analysed for at least all –ine (R)‐epimers were included in the final data set. At the end, 6,417 samples of food and feed were available to estimate dietary exposure. The food samples included 1,235 of samples reported as ‘Grain as crops’ (FoodEx level 2) referring to samples of unprocessed grains of unknown end‐use. As later explained in Section 3.1.2, these samples were treated separately from the food samples.
3.1.1. Occurrence data on food
A total of 4,528 food samples were available in the final data set, collected between 2011 and 2016, with almost 70% sampled between 2014 and 2015 (Figure 6). They were collected in 15 different European countries, with more than 50% in the Netherlands and around 28% in Germany. Figure 7 shows the distribution by sampling country.
Figure 6.

Distribution of the food samples included in the final data set across sampling years
Figure 7.

Distribution of the food samples included in the final data set across sampling countries
The distribution of the number of EAs analysed per sample in the different foods is shown in Figure 8A. Most of the samples were analysed for the 12 EAs (97%), with a few samples analysed for 6, 10 and 11 EAs. Figure 8B shows the number of times each ergot alkaloid was reported as quantified/non quantified in each of the 4,528 food samples. Ergotamine, ergocristine and ergosine were quantified in around 15% of the occasions, while, on the other side, for ergometrinine and ergocorninine quantified values were only reported in 6% and 8% of the occasions, respectively. Overall in the food samples, only 11% of the analytical results were quantified.
Figure 8.

(A) Distribution of the number of EAs quantified per sample in the final data set for food; (B) Number of times each ergot alkaloid was reported as quantified/non quantified in the final data set of food samples
In more than three quarters of the food samples (3,463 samples, 76%), all EAs analysed were unquantified. Among these analytical results reported as left‐censored, 74% were reported as below the LOQ and the rest as below the LOD. All samples reported their analytical results expressed as whole weight.
Among the food samples (excluding samples codified as ‘Grain as crops’, see Section 3.1.2) with all 12 EAs and at least one quantified (n = 987), the highest average contributions to the total concentration in each food sample corresponded to four EAs, namely ergotamine (18%), ergocristine (15%), ergosine (12%) and ergometrine (11%). When looking separately to unprocessed and processed foods, some differences were observed. During processing, the ratio between the average contribution of the epimeric forms (‐ine and ‐inine) shifts towards the –inine (S)‐epimers (from 23.1% to 41.3%). A shift in the epimeric ratio towards the –inine forms during baking has been elsewhere reported in the literature (Baumann et al., 1985; Wolff et al., 1988; Franzmann et al., 2010; Merkel et al., 2012). Other relevant differences referred, for instance, to the individual contribution of particular EAs, with ergometrine and ergometrinine significantly increasing their average contribution in processed food (Table 2). For ergometrinine, a detailed evaluation of the processed foods identified 27 samples where this EA was the only one quantified. These samples included rye bread and rolls and mixed wheat and rye bread and rolls, with also one sample of wheat rolls. Since the samples, unprocessed and processed, come from different origins, it is difficult to establish a conclusive relationship between EA composition in the grain and in the processed product. There are numerous studies in the literature describing the strong influence of many different factors (environmental conditions, type of cereal grain, location) on the concentration and the relative proportion of individual alkaloids in cereals (Miedaner and Geiger, 2015, Coufal‐Majewski et al., 2016).
Table 2.
Average contribution of the different EAs to the total concentration in unprocessed and processed food samples with all the 12 EAs reported and at least one quantified
| n = 987 | n = 379 | n = 608 | |
|---|---|---|---|
| Food samplesb | Processed foods | Unprocessed foodsb | |
| Ergometrine | 10.9 | 16.1 | 7.6 |
| Ergosine a | 11.6 | 9.5 | 12.8 |
| Ergocornine a | 7.1 | 4.9 | 8.4 |
| Ergotamine a | 18.2 | 14.9 | 20.3 |
| Ergocristine a | 15.3 | 8.1 | 19.7 |
| Ergometrinine | 6.1 | 13.3 | 1.6 |
| Ergosinine | 3.5 | 2.9 | 3.9 |
| Ergocorninine | 3.3 | 3.8 | 3.0 |
| Ergotaminine | 5.1 | 5.8 | 4.8 |
| Ergocristinine | 6.9 | 8.0 | 6.2 |
| Ergocryptine | 6.9 | 5.0 | 8.0 |
| Ergocryptinine | 5.1 | 7.5 | 3.6 |
| ‐ine (R)‐epimers | 72.7 | 58.5 | 77.1 |
| ‐inine (S)‐epimers | 27.3 | 41.3 | 23.1 |
| Four selected ergots a | 57.2 | 37.4 | 63.3 |
Four ergot alkaloids, ergotamine, ergocristine, ergosine and ergocornine indicated in the 2012 EFSA opinion as the most abundant among the Claviceps purpurea EAs (EFSA CONTAM Panel, 2012).
Samples reported as ‘Grains as crops’ (samples of unprocessed grains of unknown end‐use) are not included.
For 19% of the food samples, no information was provided on the analytical method used to analyse EAs. Where information was submitted, the separation method was always LC with several detection methods being used (Figure 9). The predominant detection method was tandem mass spectrometry (MS/MS), either reported without information (LC–MS/MS) or with information on the analyser used (triple‐quadrupole, QqQ) and reported as LC–MS–MS (QqQ). Considering just MS/MS, this detection method was used for 79% of the samples analysed. The use of single quadrupole mass spectrometry coupled to LC (LC–MS) was also reported by one data provider (n = 23). For 48 samples, FD was used, and for 20 samples, only information on the separation method was provided (LC) without further details on the detection technique.
Figure 9.

Information on the analytical methods used for the analysis of EAs in the food samples
Since most of the analytical results reported as left‐censored were submitted as below the LOQ, the focus was put on this left‐censored limit when describing the sensitivity of the analytical methods. Table 3 shows the distribution of the reported LOQs in food commodities relevant for the dietary exposure to EAs. The lowest LOQs (0.1 μg/kg) were reported for both grains and processed grain‐based products such as ‘Grain milling products’, ‘Cereal‐based food for infants and young children’, and ‘Breakfast cereals’, using in all cases LC–MS/MS. Although the reported highest sensitivities are in line with those described in recent literature (Di Mavungu et al., 2012; Crews, 2015), many analytical methods still reported relatively high LOQs. This has a significant impact on the UB estimations when dealing with left‐censored data, even if this influence on the UB estimations was reduced by excluding those samples that reported LOQs above 20 μg/kg.
Table 3.
Distribution of the reported LOQs in the analysis of EAs in selected food commodities (FoodEx level 2)
| Percentiles (μg/kg) | |||||||||
|---|---|---|---|---|---|---|---|---|---|
| Number of samplesa | Number of observationsb | Min | P5 | P25 | Med | P75 | P95 | Max | |
| Beer and beer‐like beverage | 118 | 996 | 2 | 20 | 20 | 20 | 20 | 20 | 20 |
| Bread and rolls | 583 | 6,492 | 0.5 | 0.8 | 2 | 5 | 10 | 12.5 | 20 |
| Breakfast cereals | 208 | 2,487 | 0.1 | 2 | 5 | 10 | 20 | 20 | 20 |
| Cereal‐based food for infants and young children | 94 | 1,229 | 0.1 | 0.1 | 0.1 | 0.1 | 0.1 | 2 | 20 |
| Fine bakery wares | 46 | 548 | 1 | 1 | 1 | 1 | 2 | 10 | 10 |
| Grain milling products | 940 | 11,256 | 0.1 | 1 | 1 | 10 | 15 | 20 | 20 |
| Grains and grain‐based products | 9 | 107 | 1 | 2 | 12.5 | 12.5 | 15 | 20 | 20 |
| Grains for human consumption | 770 | 9,064 | 0.1 | 0.5 | 2 | 12.5 | 15 | 20 | 20 |
| Pasta (Raw) | 118 | 1,416 | 2 | 2 | 20 | 20 | 20 | 20 | 20 |
| Snack food | 3 | 35 | 2 | 2 | 2 | 2 | 2 | 2 | 2 |
Number of samples analysed.
Number of observations refers to the individual ergot alkaloids analysed in the food samples.
Detailed information is provided in Appendix C on the reported LOQs for each ergot alkaloid in processed and unprocessed food samples, divided by analytical method; for a better interpretation of the results the analytical results reported as LC–MS–MS (QqQ) and LC‐MS–MS were all considered as LC‐MS–MS. Differences in sensitivity were related to the analytical method rather than to the ergot alkaloid analysed.
Table 4 shows the food samples and their mean EA concentrations used to estimate chronic dietary exposure once the food groups with only left‐censored data were excluded. These samples were excluded to avoid biasing the exposure estimation by including food categories where EAs are not expected (e.g. ‘Legumes, nuts and oilseeds’ n = 848, ‘Fruit and fruit products’ n = 437, ‘Fruit and vegetable juices’ n = 74, ‘Wine’ n = 116) or the reported samples consistently indicate the absence of ergots (e.g. ‘Beer’ n = 83, ‘Pasta’ n = 118, ‘Muesli’ n = 92). Occurrence data were grouped at the most appropriate level (Food group) based on EA concentration and number of samples available. Complete information on the levels of EAs with all the food samples available in the final data set (4,528 samples), including those eventually excluded, is given in Appendix D.
Table 4.
Mean and 95th percentile concentration (μg/kg) of ergot alkaloids in different food samples as used to estimate chronic dietary exposure (food groups with all analytical data reported as left‐censored are not included)
| Mean concentration (μg/kg) | 95th percentile concentration (μg/kg)b , c | |||||||||
|---|---|---|---|---|---|---|---|---|---|---|
| FoodEx level 1 | FoodEx level 2 | Food groupa | N | %LCf | LB | MB | UB | LB | MB | UB |
| Grains and grain‐based products | Grains and grain‐based products | Grains and grain‐based products unspecified | 9 | 33 | 245.5 | 277.2 | 308.9 | – | – | – |
| Grains for human consumption | Wheat grain | 248 | 81 | 20.0 | 76.4 | 132.8 | 90.3 | 134.0 | 240.0 | |
| Barley grain | 48 | 79 | 38.1 | 46.9 | 55.8 | – | – | – | ||
| Rye grain | 321 | 47 | 148.7 | 175.9 | 203.1 | 538.4 | 552.4 | 579.4 | ||
| Spelt grain | 20 | 85 | 28.0 | 104.2 | 180.5 | – | – | – | ||
| Oats, grain | 29 | 55 | 32.7 | 51.7 | 70.8 | – | – | – | ||
| Grain milling products | Grain milling products unspecified | 18 | 94 | 12.2 | 87.2 | 162.1 | – | – | – | |
| Wheat milling products | 293 | 62 | 12.0 | 49.6 | 87.2 | 56.9 | 120.0 | 240.0 | ||
| Rye milling products | 394 | 25 | 198.0 | 218.7 | 239.4 | 818.0 | 844.0 | 844.0 | ||
| Corn milling products | 132 | 99 | 0.3 | 114.1 | 227.9 | 0.0 | 120.0 | 240.0 | ||
| Oat milling products | 14 | 93 | 1.9 | 37.3 | 72.7 | – | – | – | ||
| Spelt milling products | 26 | 77 | 34.0 | 91.4 | 148.8 | – | – | – | ||
| Other milling products | 35 | 97 | 3.3 | 84.9 | 166.5 | – | – | – | ||
| Bread and rolls | Bread and rolls unspecifiedd | 583 | 42 | 24.2 | 46.1 | 67.9 | 104.3 | 126.0 | 161.8 | |
| Wheat bread and rolls | 19 | 68 | 5.9 | 17.6 | 29.3 | – | – | – | ||
| Rye bread and rolls | 181 | 43 | 29.2 | 48.0 | 66.8 | 134.3 | 154.5 | 185.1 | ||
| Mixed wheat and rye bread and rolls | 201 | 35 | 32.8 | 57.4 | 82.0 | 134.2 | 143.1 | 171.0 | ||
| Multigrain bread and rolls | 51 | 33 | 10.5 | 18.2 | 25.9 | – | – | – | ||
| Unleavened bread, crisp bread and rusk | 6 | 50 | 15.7 | 41.9 | 68.1 | – | – | – | ||
| Crisp bread, rye wholemeal | 32 | 53 | 10.2 | 30.3 | 50.4 | – | – | – | ||
| Crisp bread, rye, light | 62 | 45 | 12.9 | 47.8 | 82.7 | 36.7 | 101.2 | 159.7 | ||
| Other bread | 22 | 50 | 14.0 | 40.8 | 67.6 | – | – | – | ||
| Bread products | 1 | 0 | 34.5 | 73.5 | 112.4 | – | – | – | ||
| Breakfast cereals | Cereal flakes unspecifiedd | 88 | 86 | 8.3 | 46.9 | 85.6 | 43.0 | 120.0 | 151.6 | |
| Mixed cereal flakes | 3 | 0 | 19.2 | 19.5 | 19.8 | – | – | – | ||
| Oat flakes e | 52 | 92 | 2.9 | 51.5 | 100.1 | – | – | – | ||
| Rye flakes e | 15 | 73 | 34.6 | 59.0 | 83.4 | – | – | – | ||
| Wheat flakes e | 8 | 88 | 1.1 | 34.6 | 68.1 | – | – | – | ||
| Fine bakery wares | Biscuits (cookies) | 39 | 67 | 2.9 | 9.8 | 16.7 | – | – | – | |
| Food for infants and small children | Cereal‐based food for infants and young children | Cereal‐based food for infants and young children unspecified | 13 | 92 | 0.7 | 20.2 | 39.8 | – | – | – |
| Simple cereals which are or have to be reconstituted with milk or other appropriate nutritious liquids | 49 | 65 | 6.7 | 8.4 | 10.2 | – | – | – | ||
| Cereals with an added high protein food which are or have to be reconstituted with water or other protein‐free liquid | 10 | 80 | 0.3 | 3.2 | 6.1 | – | – | – | ||
| Biscuits, rusks and cookies for children | 22 | 50 | 11.2 | 11.6 | 12.1 | – | – | – | ||
N: number of samples; %LC: percentage of left‐censored samples; LB: lower bound; MB: middle bound; UB: upper bound.
The different food commodities were grouped at different levels before estimating dietary exposure: FoodEx level 2 (underlined), FoodEx level 3 (normal), FoodEx level 4 (italics).
Estimation of 95th percentile is not reliable when less than 60 observations are available.
The 95th percentile estimates equals zero because less than 5% of the samples were quantified.
Two food categories, ‘Bread and rolls unspecified’ at FoodEx level 2 and ‘Cereal flakes’ at FoodEx level 3 were created using all the samples available within each food group to account for unspecified consumption of these commodities.
The food groups ‘Wheat flakes’, ‘Oat flakes’, ‘Rye flakes’ were created considering all types of flakes reported within each cereal (e.g. ‘Oat flakes’ is made up of samples reported as ‘Oat flakes’ (n = 46), Oat flakes with fruits’ (n = 2), Oat flakes instant’ (n = 2), Oat flakes, whole meal’ (n = 2)).
A sample was considered as left‐censored when not a single EA was quantified.
Nearly all samples used in the exposure estimations belonged to the food group ‘Grains and grain‐based products’ (FoodEx level 1) with only few samples available for the food group ‘Food for infants and small children’ (Table 4). More than half of the samples referred to raw agricultural commodities (RAC), in particular grains and minimally processed commodities (i.e. grain milling products). However, around 800 samples of different grain‐based processed products were also available for exposure estimations, among them ‘Bread and rolls’, ‘Breakfast cereals’, ‘Fine bakery wares’ and ‘Cereal‐based food for infants and young children’. In addition, and as commented above, some other processed commodities that could be susceptible to contain EAs were excluded as all reported data were left‐censored (e.g. ‘Beer’ n = 83, ‘Pasta’ n = 118, ‘Muesli’ n = 92).
Taking into account the available number of grain‐based processed products, the use of factors to convert the RAC into processed commodities was discarded. The 2012 EFSA scientific opinion mentioned that most studies on the effect of baking with EA contaminated flours showed an overall reduction of EA levels in the final product (EFSA CONTAM Panel, 2012). However, these studies are not conclusive on the magnitude of the reduction beyond the fact that the ratio between the epimeric forms in general shifts towards the ‐inine forms. As an example, during baking 54–85% losses are reported for rye flour bread and 0–100% for wheat flour, with a higher reduction usually in the bread crust when compared to crumb (Scott, 2009). Likewise, Merkel et al. (2012) also investigated the degradation and epimerisation of EAs in rye flour after baking cookies, resulting in degradation of EAs (2–30%) and a shift in the epimeric ratio towards the ‐inine forms for all EAs. In the reported occurrence data, it can be seen that among the quantified samples of ‘Rye milling products’ and ‘Rye bread and rolls’ there was a reduction factor of ~ 5 in the EA concentrations from 263 to 51 μg/kg. The observed decreases cannot only be explained by dilution factors related to the recipes used but must also be due to the effect of baking on the EAs itself.
The group ‘Bread and rolls, unspecified’ was created considering all samples of bread and rolls to account for the unspecified consumption of breads and rolls. Besides this group, the highest number of samples belongs to grains and grain milling products of rye and wheat (Table 4). Among processed foods, the most reported commodities were ‘Mixed wheat and rye bread and rolls’ (n = 201) and ‘Rye bread and rolls’ (n = 181). The food group ‘Breakfast cereals’ was also well represented, with samples reported with different grain composition, such as oat, rye and wheat flakes. Diverse types of samples of ‘Cereal‐based food for infants and young children’ were also available, including few samples of ‘Biscuits, rusks and cookies for children’ (n = 22).
Overall, and within each particular group, the highest EA mean levels were reported for rye and rye‐containing commodities. The highest mean values were reported for ‘Rye milling products’ with 198–239 μg/kg (LB–UB, n = 394) followed by ‘Rye grains’ with 149–203 μg/kg (LB–UB, n = 321). Concerning processed foods, similar EA mean levels were reported for different rye‐based processed products, such as ‘Mixed wheat and rye bread and rolls’ (33–82 μg/kg, n = 201), ‘Rye bread and rolls’ (29–67 μg/kg, n = 181) and ‘Rye flakes’ (35–83 μg/kg, n = 15), always for LB–UB scenarios.
As can be seen in Table 4, EA contamination is not only limited to rye, but also affects other cereal grains such as wheat, spelt, oats and corn and their derived processed products. In general, the mean values were lower than those reported for rye and rye‐based products, e.g. ‘Wheat milling products (12–87 μg/kg (LB–UB), n = 293), cereal flakes made of oat (3–100 μg/kg (LB–UB), n = 52) or wheat (1–68 μg/kg (LB–UB), n = 8), although the UB scenario was clearly affected by the left‐censored data and the reported LOQs. Among the samples of ‘Cereal‐based food for infants and young children’, the highest mean values were reported for samples of ‘Biscuits, rusks and cookies for children’ (11–12 μg/kg (LB–UB), n = 22). The samples in this food group contained, overall, lower levels of EAs than other grain‐based processed products.
3.1.2. Grain as crops
‘Grain as crops’ (FoodEx level 2) refers to samples of unprocessed grains of unknown end‐use. These grains are usually not considered when estimating human dietary exposure, and in particular occasions they have been combined with the feed samples to cover some feed groups that initially were not available. This occurred, for instance, in the EFSA 2012 scientific opinion on EAs with few samples of barley, rye and wheat (EFSA CONTAM Panel, 2012).
In the current data set, a total of 1,235 samples were reported as ‘Grain as crops’; Figure 10 shows the different type of grains where ‘Wheat grains’ almost represented half of the total (45%). Among the different ‘Grain as crops’ the highest mean levels were submitted for rye grains (LB = 3,368 μg/kg, UB = 3,419 μg/kg), followed by triticale, wheat, barley and oat grains. No EAs were found in rice, millet and buckwheat grains (Table 5). For almost 80% of the samples, at least one EA was reported as quantified, a higher percentage than in feed samples. When looking at the samples with the 12 EAs analysed and at least one EA quantified (n = 954), the three predominant EAs in terms of average contribution were ergotamine (23%), ergosine (19%) and ergocristine (17%). The –ine (R)‐epimers represented on average as much as 75% of the total EA content in each sample.
Figure 10.

Samples of different grains reported as ‘Grains as crops’ that refer to unprocessed grains of unknown end‐use
Table 5.
Summary statistics of the levels of EAs (in μg/kg) in different unprocessed grains of unknown end‐use (‘Grains as crops’)
| Percentiles (μg/kg) | |||||||||
|---|---|---|---|---|---|---|---|---|---|
| N | %LCa | LB/UB | Mean (μg/kg) | P5 | P25 | Median | P75 | P95 | |
| Rice (Crop) | 191 | 100 | LB | 0 | 0 | 0 | 0 | 0 | 0 |
| UB | 240 | 240 | 240 | 240 | 240 | 240 | |||
| Oat grain (Crop) | 33 | 70 | LB | 65 | – | 0 | 0 | 26 | – |
| UB | 207 | – | 120 | 220 | 240 | – | |||
| Millet grain (Crop) | 2 | 100 | LB | 0 | – | – | – | – | – |
| UB | 240 | – | – | – | – | – | |||
| Buckwheat grain (Crop) | 4 | 100 | LB | 0 | – | – | – | – | – |
| UB | 240 | – | – | – | – | – | |||
| Rye grain (Crop) | 171 | 36 | LB | 3,368 | 0 | 0 | 120 | 536 | 9,843 |
| UB | 3,419 | 36 | 104 | 230 | 556 | 9,843 | |||
| Barley grain (Crop) | 173 | 41 | LB | 115 | 0 | 0 | 16 | 100 | 545 |
| UB | 201 | 36 | 57 | 135 | 240 | 545 | |||
| Wheat grain (Crop) | 559 | 37 | LB | 294 | 0 | 0 | 20 | 121 | 623 |
| UB | 322 | 12 | 15 | 65 | 151 | 635 | |||
| Triticale (crop) | 102 | 25 | LB | 315 | 0 | 0 | 72 | 317 | 1,603 |
| UB | 343 | 36 | 48 | 100 | 327 | 1,603 | |||
N: number of samples; %LC: percentage of left‐censored samples; LB: lower bound; UB: upper bound.
A sample was considered as left‐censored when not a single EA is quantified.
These grains were collected between 2012 and 2016 from five different countries, Croatia, the Czech Republic, France, the Netherlands and the United Kingdom. Most of the samples reported the 12 EAs covered in this report (88%) with the rest being analysed for 11 EAs. All analytical results were expressed in whole weight.
All crops were analysed by LC–MS/MS or LC–MS. For the samples reporting MS/MS, in certain cases additional information on the analyser was also provided (QqQ). The highest sensitivity was reported in samples of wheat and rye with an LOQ of 1 μg/kg for each of the EAs analysed, except for rye where for ergocryptine (sum of α‐ and β‐isomers) and its ‐inine form an LOQ of 6 μg/kg was reported.
3.1.3. Occurrence data on feed
A total of 654 samples of feed were available in the final data set; all analytical results were expressed on a whole weight basis. The samples were collected in five different countries, the Czech Republic, Croatia, Slovenia, the Netherlands and the United Kingdom between 2011 and 2016 (Figure 11). All feed samples except one were analysed for all 12 EAs.
Figure 11.
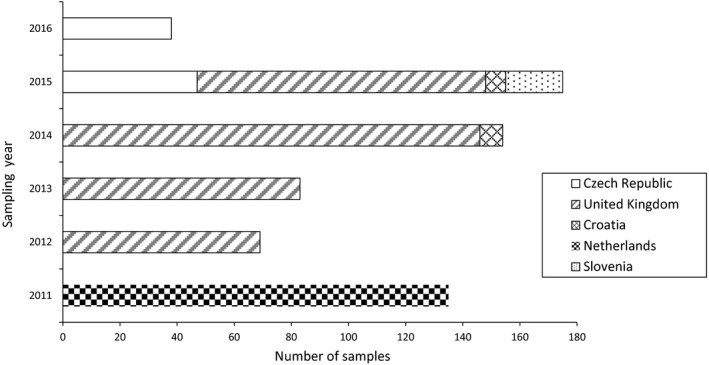
Distribution of feed samples across sampling year and sampling countries
Liquid chromatography was the method of choice when analysing the feed samples with the predominant detection method being MS/MS. As for food, additional information was sometimes provided on the MS detector (QqQ). Only one data provider reported the use of LC–MS (n = 7). The highest sensitivity was 1 μg/kg (LOQ) for both LC–MS and LC–MS/MS. While the few samples analysed by LC–MS reported an LOQ of 1 μg/kg for each of the EAs analysed, for LC–MS/MS analysis the LOQs ranged between 1 and 10 μg/kg among the different EAs.
In more than half of the feed samples, no EAs were quantified (n = 352). The presence of the different EAs in the feed samples was also analysed. Figure 12 shows the number of times the different EAs were quantified/non‐quantified; the EAs most commonly quantified were ergotamine and ergosine (~ 38% of the samples) while on the other side ergometrine and its –inine (S)‐epimer were only quantified in 22% and 19% of the occasions, respectively. Overall, only 28% of the analytical results were quantified.
Figure 12.

Number of times each ergot alkaloid was reported as quantified/non quantified in the final data set of feed samples (n = 654)
Looking at the samples with all 12 EAs analysed and at least one quantified (n = 302), the highest average contributions to the total concentration in each sample were reported for three EAs, namely ergotamine (21%), ergosine (17%) and ergocristine (13%). Overall, ‐ine (R)‐epimers represented on average 69% of the total levels of EAs in each sample, with barely differences between raw and processed feed commodities.
Table 6.
Average contribution of the different EAs to the total concentration in unprocessed and processed feed samples with all the 12 EAs reported and at least one quantified
| n = 302 | n = 43 | n = 259 | |
|---|---|---|---|
| Feed samples | Processed feeds | Unprocessed feeds | |
| Ergometrine | 5.4 | 5.6 | 5.4 |
| Ergosine a | 17.3 | 18.5 | 17.1 |
| Ergocornine a | 6.8 | 9.2 | 6.4 |
| Ergotamine a | 21.3 | 20.2 | 21.5 |
| Ergocristine a | 13.4 | 11.0 | 13.8 |
| Ergometrinine | 7.8 | 4.1 | 8.5 |
| Ergosinine | 5.3 | 4.5 | 5.4 |
| Ergocorninine | 3.6 | 4.9 | 3.3 |
| Ergotaminine | 4.5 | 4.5 | 4.5 |
| Ergocristinine | 4.4 | 5.7 | 4.2 |
| Ergocryptine | 5.7 | 6.6 | 5.5 |
| Ergocryptinine | 4.4 | 5.2 | 4.2 |
| ‐ine (R)‐epimers | 69.1 | 71.1 | 69.7 |
| ‐inine (S)‐epimers | 30.9 | 28.9 | 30.1 |
| Four selected ergots a | 58.8 | 58.9 | 58.8 |
Four ergot alkaloids, ergotamine, ergocristine, ergosine and ergocornine, indicated in the 2012 EFSA opinion as the most abundant among the Claviceps purpurea EAs (EFSA CONTAM Panel, 2012).
Table 7 shows the mean and 95th concentration of the different feed samples. Most of the samples referred to unprocessed samples (n = 581), mainly grain cereals but also few samples of diverse type of grass. Samples of ‘Compound feed’ were also available divided by the type of animal to be fed; overall, a very limited number of samples was available for each animal. The highest number of samples were reported for barley grains (n = 222) and wheat grains (n = 201), with the highest levels reported for rye grains (n = 21, LB–UB = 175–191 μg/kg).
Table 7.
Mean and 95th percentile concentration (μg/kg) of ergot alkaloids in different feed samples
| Concentration (μg/kg) | ||||||||||
|---|---|---|---|---|---|---|---|---|---|---|
| Mean | 95th percentilea | |||||||||
| Feed level 1 | Feed level 2 | Feed level 3 | N | %LCb | LB | MB | UB | LB | MB | UB |
| Cereal grains, their products and by‐products | Barley | Barley | 222 | 70 | 15 | 30 | 44 | 71 | 97 | 124 |
| Triticale | Triticale | 13 | 38 | 33 | 38 | 44 | – | – | – | |
| Wheat | Wheat | 201 | 43 | 92 | 99 | 106 | 389 | 389 | 392 | |
| Maize | Maize | 4 | 100 | 0 | 18 | 35 | – | – | – | |
| Oats | Oats | 89 | 54 | 38 | 54 | 71 | 166 | 169 | 183 | |
| Rye | Rye | 21 | 57 | 175 | 183 | 191 | – | – | – | |
| Spelt | Spelt | 2 | 0 | 60 | 60 | 60 | – | – | – | |
| Forages and roughage, and products derived thereof | Grass, field dried, (hay) | Grass, field dried, (hay) | 20 | 50 | 34 | 47 | 60 | – | – | – |
| Grass, herbs, legume plants, (green forage) | 9 | 0 | 63 | 63 | 63 | – | – | – | ||
| Compound feed | Complete feed | Complete feed unspecified | 1 | 100 | 0 | 60 | 120 | – | – | – |
| Calves (pre‐ruminant) | 1 | 0 | 6 | 16 | 26 | – | – | – | ||
| Fattening sheep | 7 | 43 | 24 | 34 | 43 | – | – | – | ||
| Fattening goats | 7 | 57 | 5 | 16 | 26 | – | – | – | ||
| Poultry (starter diets) | 2 | 0 | 15 | 24 | 33 | – | – | – | ||
| Fattening chickens (broilers) | 4 | 75 | 41 | 50 | 59 | – | – | – | ||
| Laying hens | 9 | 89 | 7 | 17 | 28 | – | – | – | ||
| Fattening turkeys | 3 | 100 | 0 | 12 | 24 | – | – | – | ||
| Fattening ducks | 1 | 100 | 0 | 12 | 24 | – | – | – | ||
| Pet food, birds | 4 | 0 | 60 | 60 | 60 | – | – | – | ||
| Fattening cattle | 3 | 0 | 123 | 127 | 131 | – | – | – | ||
| Dairy cows | 1 | 0 | 60 | 60 | 60 | – | – | – | ||
| Piglets (weaning diets) | 3 | 0 | 8 | 18 | 28 | – | – | – | ||
| Growing/Fattening pigs | 8 | 0 | 46 | 48 | 51 | – | – | – | ||
| Breeding pigs | 1 | 0 | 60 | 60 | 60 | – | – | – | ||
| Lambs (weaning diets) | 3 | 33 | 39 | 46 | 52 | – | – | – | ||
| Complementary feed (incomplete diet) | Complementary feed, unspecified | 1 | 0 | 60 | 60 | 60 | – | – | – | |
| Fattening sheep | 3 | 33 | 13 | 22 | 31 | – | – | – | ||
| Fattening goats | 1 | 100 | 0 | 12 | 24 | – | – | – | ||
| Fattening chickens (broilers) | 3 | 100 | 0 | 12 | 24 | – | – | – | ||
| Pet food, birds | 1 | 0 | 60 | 60 | 60 | – | – | – | ||
| Dairy cows | 6 | 17 | 50 | 53 | 56 | – | – | – | ||
N: number of samples; %LC: percentage of left‐censored samples; LB: lower bound; MB: middle bound; UB: upper bound.
Estimation of 95th percentile is not reliable when less than 60 observations are available.
A sample was considered as left‐censored when not a single EA was quantified.
Looking at the samples of ‘Grain as crops’ reported in the previous section (Table 5), higher EA levels were reported for rye, barley, wheat, oat and triticale grains as compared to the same grains reported as feed. To cover worst‐case situations and assuming that the samples of ‘Grain as crops’ could end up entering in the feed chain, the 1,235 samples of ‘Grain as crops’ were combined with the feed samples. Table 8 shows the summary statistics for the available number of feed samples once ‘Grain as crops’ and feed samples were combined; the mean and 95th percentile levels shown in this table were used to estimate animal exposure to EAs. In the merged data set, the highest mean EA levels were reported for rye grains (LB–UB = 3,019–3,066 μg/kg, n = 192), followed by triticale and wheat grains with LB–UB = 284–309 μg/kg (n = 115) and LB–UB = 240–265 μg/kg (n = 760), respectively.
Table 8.
Mean and 95th percentile concentration (μg/kg) of ergot alkaloids in the data set as a result of combining feed samples and those initially reported as ‘Grains as crops’ (see Table 5)
| Concentration (μg/kg) | ||||||||||
|---|---|---|---|---|---|---|---|---|---|---|
| Mean | 95th percentilea | |||||||||
| Feed level 1 | Feed level 2 | Feed level 3 | N | %LCb | LB | MB | UB | LB | MB | UB |
| Cereal grains, their products and by‐products | Barley | Barleyc | 395 | 57 | 59 | 86 | 113 | 309 | 310 | 324 |
| Triticale | Triticalec | 115 | 27 | 284 | 296 | 309 | 1,603 | 1,603 | 1,603 | |
| Wheat | Wheatc | 760 | 38 | 240 | 253 | 265 | 499 | 513 | 522 | |
| Maize | Maize | 4 | 100 | 0 | 18 | 35 | – | – | – | |
| Oats | Oatsc | 122 | 58 | 45 | 76 | 108 | 204 | 244 | 284 | |
| Rye | Ryec | 192 | 38 | 3,019 | 3,042 | 3,066 | 8,157 | 8,157 | 8,157 | |
| Spelt | Spelt | 2 | 0 | 60 | 60 | 60 | – | – | – | |
| Forages and roughage, and products derived thereof | Grass, field dried, (Hay) | Grass, field dried, (Hay) | 20 | 50 | 34 | 47 | 60 | – | – | – |
| Grass, herbs, legume plants, (green forage) | 9 | 0 | 63 | 63 | 63 | – | – | – | ||
| Compound feed | Complete feed | Complete feed unspecified | 1 | 100 | 0 | 60 | 120 | – | – | – |
| Calves (pre‐ruminant) | 1 | 0 | 6 | 16 | 26 | – | – | – | ||
| Fattening sheep | 7 | 43 | 24 | 34 | 43 | – | – | – | ||
| Fattening goats | 7 | 57 | 5 | 16 | 26 | – | – | – | ||
| Poultry (starter diets) | 2 | 0 | 15 | 24 | 33 | – | – | – | ||
| Fattening chickens (broilers) | 4 | 75 | 41 | 50 | 59 | – | – | – | ||
| Laying hens | 9 | 89 | 7 | 17 | 28 | – | – | – | ||
| Fattening turkeys | 3 | 100 | 0 | 12 | 24 | – | – | – | ||
| Fattening ducks | 1 | 100 | 0 | 12 | 24 | – | – | – | ||
| Pet food, birds | 4 | 0 | 60 | 60 | 60 | – | – | – | ||
| Fattening cattle | 3 | 0 | 123 | 127 | 131 | – | – | – | ||
| Dairy cows | 1 | 0 | 60 | 60 | 60 | – | – | – | ||
| Piglets (weaning diets) | 3 | 0 | 8 | 18 | 28 | – | – | – | ||
| Growing/Fattening pigs | 8 | 0 | 46 | 48 | 51 | – | – | – | ||
| Breeding pigs | 1 | 0 | 60 | 60 | 60 | – | – | – | ||
| Lambs (weaning diets) | 3 | 33 | 39 | 46 | 52 | – | – | – | ||
| Complementary feed (incomplete diet) | Complementary feed, unspecified | 1 | 0 | 60 | 60 | 60 | – | – | – | |
| Fattening sheep | 3 | 33 | 13 | 22 | 31 | – | – | – | ||
| Fattening goats | 1 | 100 | 0 | 12 | 24 | – | – | – | ||
| Fattening chickens (broilers) | 3 | 100 | 0 | 12 | 24 | – | – | – | ||
| Pet food, birds | 1 | 0 | 60 | 60 | 60 | – | – | – | ||
| Dairy cows | 6 | 17 | 50 | 53 | 56 | – | – | – | ||
N: number of samples; %LC: percentage of left‐censored samples; LB: lower bound; MB: middle bound; UB: upper bound.
Estimation of 95th percentile is not reliable when less than 60 observations are available.
A sample was considered as left‐censored when not a single EA was quantified.
Occurrence values resulting from combining grains reported as feed and those reported as ‘Grains as crops’.
3.1.4. Data on ergot sclerotia
Two data providers submitted information on the content of ergot sclerotia in samples codified as ‘Grain as crops’, samples of unprocessed grains of unknown end‐use. In addition, the United Kingdom provided details to EFSA of a study on monitoring the presence of ergot alkaloids in cereals and the potential relationship between sclerotia content and levels of ergot alkaloids.11 In this particular study, 197 samples of different grains were analysed for the 12 EAs, 12 of these samples being analysed both before and after undergoing a cleaning process to remove visible sclerotia.
In relation to the data submitted, the first data set (from the Croatian Food Agency) referred to 20 samples of rye grains that were also analysed for the presence of the 12 EAs. Nine samples where ergot sclerotia were identified underwent manual cleaning and the concentration of EAs was subsequently analysed and compared to that initially quantified.
The second data set (from Arvalis – Institut du vegetal) contained 2,526 results on ergot sclerotia in different crops, in 74% of the cases with no sclerotia identified (1,878 samples). A total of 618 samples were also analysed for their content on the 12 EAs (275 on wheat, 127 on barley, 102 on triticale, 100 on rye and 14 on oat). In most of the cases, the samples were analysed for their EA content following sclerotia identification; only 41 samples with no identified sclerotia were also analysed for EAs.
In both data sets, ergot sclerotia were identified by visual inspection and the amounts reported after gravimetric analysis.
Table 9 shows the samples from the two data sets where EA content was also analysed (n = 638). The highest amounts of sclerotia were observed for rye grains (mean = 2.7 g/kg, 95th percentile = 7.3 g/kg).
Table 9.
Amounts of ergot sclerotia (g/kg) reported in different grains (reported as ‘Grains as crops’) where ergot alkaloid content was also measured
| Amount of ergot sclerotia (g/kg) | ||||
|---|---|---|---|---|
| N | Mean | 95th percentile | Rangea (min–max) | |
| Barley grain | 127 | 0.06 | 0.24 | 0.002–1.15 |
| Oat grain | 14 | 0.03 | – | 0.001–0.15 |
| Rye grain | 120 | 2.68 | 7.30 | 0.003–105.6 |
| Triticale grain | 102 | 0.12 | 0.52 | 0.002–1.90 |
| Wheat grain | 275 | 0.09 | 0.26 | 0.003–2.71 |
Among those quantified.
3.2. Human dietary exposure assessment to ergot alkaloids
Based on the outcome of the EFSA 2012 CONTAM opinion, both chronic and acute dietary exposure to EAs were assessed (EFSA CONTAM Panel, 2012).
Before linking consumption and occurrence data, some adjustments were carried out on both data sets in order to obtain the most accurate exposure estimates possible. First, consumption data were grouped at the same levels as described for the occurrence data (see Table 4, ‘Food group’). Conversion factors were used in the consumption data when needed to match the occurrence values reported in dry samples with their respective liquid consumption amounts. This occurs for some of the eating occasions of ‘Cereal‐based food for infants and young children’ reported as consumed that were divided by a factor of either 7 or 4 depending on whether they refer to ‘Simple cereals which are or have to be reconstituted with milk or other appropriate nutritious liquids’ or to ‘Cereals with an added high protein food which are or have to be reconstituted with water or other protein‐free liquid’, respectively. Since no specific occurrence data were available to cover eating occasions reported as ‘Mixed breakfast cereals’ and ‘Breakfast cereals unspecified’, these eating occasions were linked to the food group ‘Cereal flakes, unspecified’. Likewise, as only few samples of porridge (n = 7, see Appendix D) were available and this is a food commodity with relatively high number of eating occasions, the occurrence values for the different flakes (oat, wheat and rye) were assigned to the consumption of porridge. Eating occasions for porridge reported as liquid/consumed were divided by a factor of 5 before being linked to the occurrence data of the cereal flakes.
3.2.1. Chronic dietary exposure
Dietary exposure to EAs was estimated in 35 dietary surveys from 19 different European countries. Table 10 shows summary statistics for mean and 95th percentile chronic dietary exposure to EAs across different age classes. Detailed mean and 95th percentile dietary exposure estimates calculated for each of the 35 dietary surveys are presented in Appendix E.
Table 10.
Summary statistics of chronic dietary exposure to EAs (ng/kg bw per day) across European dietary surveys and different age classes
| Mean dietary exposure (μg/kg bw per day) | |||||||
|---|---|---|---|---|---|---|---|
| Lower bound | Upper bound | ||||||
| Age classa | N | Min | Median | Max | Min | Median | Max |
| Infants | 6 | 0.01 | 0.02 | 0.08 | 0.03 | 0.15 | 0.34 |
| Toddlers | 10 | 0.03 | 0.06 | 0.12 | 0.18 | 0.25 | 0.47 |
| Other children | 18 | 0.02 | 0.05 | 0.17 | 0.14 | 0.20 | 0.46 |
| Adolescents | 17 | 0.01 | 0.03 | 0.15 | 0.07 | 0.12 | 0.29 |
| Adults | 17 | 0.01 | 0.02 | 0.05 | 0.06 | 0.09 | 0.18 |
| Elderly | 14 | 0.01 | 0.02 | 0.05 | 0.05 | 0.09 | 0.14 |
| Very elderly | 12 | 0.01 | 0.02 | 0.06 | 0.05 | 0.09 | 0.16 |
| 95th percentile dietary exposure b (μg/kg bw per day) | |||||||
|---|---|---|---|---|---|---|---|
| Lower bound | Upper bound | ||||||
| Age class a | N | Min | Median | Max | Min | Median | Max |
| Infants | 5 | 0.05 | –c | 0.19 | 0.29 | –c | 0.76 |
| Toddlers | 7 | 0.07 | 0.18 | 0.30 | 0.38 | 0.59 | 0.86 |
| Other children | 18 | 0.05 | 0.12 | 0.39 | 0.29 | 0.42 | 0.79 |
| Adolescents | 17 | 0.03 | 0.07 | 0.33 | 0.14 | 0.27 | 0.56 |
| Adults | 17 | 0.02 | 0.04 | 0.12 | 0.12 | 0.18 | 0.36 |
| Elderly | 14 | 0.02 | 0.04 | 0.10 | 0.11 | 0.17 | 0.28 |
| Very elderly | 9 | 0.02 | 0.03 | 0.09 | 0.12 | 0.15 | 0.26 |
bw: body weight; Max: maximum; Min: minimum; n: number of surveys.
Section 2.1.2 describes the age range within each age class.
The 95th percentile estimates obtained on dietary surveys/age classes with less than 60 observations may not be statistically robust (EFSA. 2011b). Those estimates were not included in this table.
Minimum number of six dietary surveys are required to estimate a statistically robust median (EFSA, 2011b).
Overall, chronic dietary exposure to EAs in the youngest age classes (‘Infants’, ‘Toddlers’, and ‘Other children’) were 2–3 times higher than those estimated for the adult population (‘Adults’, ‘Elderly’, and ‘Very elderly’). UB estimations were on average fourfold higher than LB estimations.
Mean dietary exposure was highest in ‘Toddlers’ and ‘Other children’ with maximum UB estimates of 0.47 and 0.46 μg/kg bw per day, respectively. Considering both the LB and the UB scenarios, the estimates for mean exposure ranged from 0.01 μg/kg bw per day (minimum LB) in diverse age classes to 0.47 μg/kg bw per day (maximum UB) for ‘Toddlers’.
The 95th percentile dietary exposure was highest in ‘Toddlers’ with a maximum UB estimate of 0.86 μg/kg bw per day. Considering both the LB and the UB scenarios, the estimates for 95th percentile dietary exposure ranged from 0.02 μg/kg bw per day (minimum LB) in diverse age classes to 0.86 μg/kg bw per day (maximum UB) for ‘Toddlers’.
Chronic dietary exposure in the two dietary surveys covering ‘Pregnant women’ and ‘Lactating women’ were within the range of exposure estimates in the adult population; these exposure estimates are shown in Appendix E.
It should be mentioned that few dietary surveys, including those with the two highest estimates (0.79 and 0.86 μg/kg bw per day, 95th percentile, UB), reported all or part of the consumption data disaggregated into minimally processed commodities (e.g. rye and wheat milling products). As seen in Table 4, the available occurrence data for minimally processed commodities (e.g. ‘Rye milling products’, LB = 198 μg/kg) were rather high as compared to the derived processed food. The disaggregated consumption data in these dietary surveys do not specify the original consumed processed commodity (e.g. cake, bread, etc.), which prevents the application of any factor to return to the processed commodities. Likewise, at the level of occurrence data, the lack of conclusive and precise data on the fate of EAs during baking makes it impossible to apply any retention factor for the EAs. Therefore, the dietary exposure where the consumption data are totally disaggregated to RAC was most likely overestimated as it was assumed that the concentration of EAs reported for the RAC is not affected by processing.
In any case, in several of the dietary surveys among those with high exposure estimates (e.g. 0.76 μg/kg bw per day for ‘Infants’ and 0.67 μg/kg bw per day for ‘Other children’, 95th percentile, UB) consumption data were not reported disaggregated to minimally processed commodities. For the particular case of the dietary survey on ‘Infants’, the main contributors to the exposure (MB scenario) were ‘Rye bread and rolls’ (36%) and ‘Cereal flakes’ (30%), going up to 61% for ‘Rye bread and rolls’ when looking at the LB estimations. It is important to note the large variation associated with certain food contributors when considering LB–UB exposure estimations due to the high number of left‐censored data and the relatively high LOQs reported for certain samples (see Appendix E for food contributors).
Overall, among the processed foods, the main contributors to the dietary exposure to EAs were different types of bread and rolls, in particular those containing or made exclusively of rye. In some countries such as Austria, the contribution of ‘Mixed wheat and rye bread and rolls’ to the exposure to EAs represented up to 84% (MB) of the total. The consumption of rye‐derived processed foods was also important in Nordic countries, where the contribution of ‘Rye bread and rolls’ went up to 61% of the total and up to 65% for ‘Mixed wheat and rye bread and rolls’ in some dietary surveys. ‘Wheat bread and rolls’ also played an important role as contributor to the dietary exposure to EAs (up to 80% of the total, MB), usually in dietary surveys from Mediterranean countries. However, in general, these countries were not among those with the highest exposure estimates. Other food commodities that contributed to the exposure to EAs were ‘Breakfast cereals’ in general, and ‘Cereal flakes’ in particular, with contributions up to 43% at the MB.
Detailed information on the different food contributors by age class and dietary survey is shown in Appendix E.
3.2.2. Acute dietary exposure
Acute dietary exposure to EAs was estimated using a probabilistic approach in 41 dietary surveys from 23 different European countries.
Considering that the final EA content in the samples results from the sum of up to 12 individual compounds and the vast amount of left‐censored data (only 11% of the analytical results were quantified), to estimate acute dietary exposure the MB scenario in the individual occurrence data was used as the UB scenario would represent an overly conservative exposure scenario.
Table 11 shows the range of average and 95th percentile acute exposures across different age classes and dietary surveys considering the whole population. Information is also given on the percentage of subjects above the ARfD in all the different iterations (n = 1,000); an ARfD = 1 μg/kg bw per day was derived in the 2012 EFSA CONTAM opinion (EFSA CONTAM Panel, 2012).
Table 11.
Range of acute exposure assessment (average and 95th percentile, MB scenario)a to ergot alkaloids across European dietary surveys, and percentage of subjects above the acute reference doseb
| Rangeof average acute exposure (μg/kg bw per day) | ||||
|---|---|---|---|---|
| Age classc | Number dietary surveys | Minimum | Median | Maximum |
| Infants | 6 | 0.02 (0.01–0.04) | 0.08 | 0.21 (0.20–0.21) |
| Toddlers | 11 | 0.11 (0.11–0.11) | 0.15 | 0.30 (0.29–0.30) |
| Other children | 20 | 0.08 (0.08–0.08) | 0.13 | 0.32 (0.30–0.33) |
| Adolescents | 20 | 0.04 (0.04–0.05) | 0.07 | 0.23 (0.21–0.24) |
| Adults | 22 | 0.03 (0.03–0.03) | 0.06 | 0.17 (0.16–0.17) |
| Elderly | 16 | 0.03 (0.03–0.03) | 0.05 | 0.13 (0.11–0.14) |
| Very elderly | 14 | 0.03 (0.03–0.04) | 0.05 | 0.12 (0.10–0.15) |
| Rangeof 95th percentile acute exposure (μg/kg bw per day) | ||||
|---|---|---|---|---|
| Number dietary surveys | Minimum | Median | Maximum | |
| Infants | 5 | 0.26 (0.25–0.27) | –d | 0.65 (0.62–0.68) |
| Toddlers | 10 | 0.35 (0.31–0.38) | 0.50 | 0.79 (0.76–0.83) |
| Other children | 20 | 0.27 (0.25–0.30) | 0.40 | 0.98 (0.90–1.06) |
| Adolescents | 20 | 0.13 (0.11–0.16) | 0.26 | 0.77 (0.67–0.89) |
| Adults | 22 | 0.10 (0.10–0.11) | 0.21 | 0.49 (0.46–0.53) |
| Elderly | 16 | 0.10 (0.09–0.11) | 0.16 | 0.37 (0.29–0.48) |
| Very elderly | 14 | 0.10 (0.09–0.11) | 0.16 | 0.39 (0.27–0.51) |
| Percentage of subjects above the acute reference dose (ARfD)b | |||
|---|---|---|---|
| Number dietary surveys | Minimum | Maximum | |
| Infants | 6 | 0.1 | 10 |
| Toddlers | 11 | 1 | 18 |
| Other children | 20 | 0.1 | 13 |
| Adolescents | 20 | < 0.01 | 11 |
| Adults | 22 | < 0.01 | 1 |
| Elderly | 16 | 0 | 1 |
| Very elderly | 14 | 0 | 1 |
With their corresponding confidence intervals (2.5th and 97.5th percentiles).
Range of percentage of subjects above the acute reference dose (ARfD) after 1,000 iterations in each of the dietary surveys and age classes. ARfD = 1 μg/kg bw per day as derived in the 2012 EFSA CONTAM opinion (EFSA CONTAM Panel, 2012).
Section 2.1.2 describes the age range within each age class.
Minimum number of six dietary surveys are required to estimate a statistically robust median (EFSA, 2011b).
Average acute exposure went from a minimum of 0.02 μg/kg bw per day estimated in ‘Infants’ up to a maximum of 0.32 μg/kg bw per day estimated in ‘Other children’. Regarding the 95th percentile acute dietary exposure, the highest estimates were for a dietary survey within the age class ‘Other children’ (0.98 μg/kg bw per day). Overall, the young population (‘Infants’, ‘Toddlers’, ‘Other children’) showed higher acute exposure to EAs than the other age classes. Acute dietary exposure in the two dietary surveys covering ‘Pregnant women’ and ‘Lactating women’ were within the range of exposure estimates in the adult population. Detailed acute exposure estimates for each dietary survey across age classes with their corresponding confidence intervals (2.5th and 97.5th percentiles) are described in Appendix F.
Looking at the acute exposure (consumers only) from the different food commodities, in very few occasions the consumption of only one food resulted in mean estimates close or above 1 μg/kg bw per day (Appendix F). This referred to population groups with very low number of consumers, and above all, to the consumption of certain grains (e.g. rye grain) or minimally processed commodities (e.g. rye milling products). As explained above, the dietary exposure derived from the reported consumption of minimally processed commodities is most probably overestimated as the data in most of the cases do not refer to consumption of these commodities but to disaggregated data from consumed processed commodities.
For cereal‐based processed commodities, the most relevant foods involved in the acute exposure to EAs were the same as those identified for the chronic dietary exposure. They mainly refer to ‘Mixed wheat and rye bread and rolls’ and ‘Rye bread and rolls’. For high consumers, the single consumption of ‘Mixed wheat and rye bread and rolls’ can lead to acute exposure estimates up to 0.74 (95% CI = 0.59–0.93) μg/kg bw per day while for ‘Rye bread and rolls’ the exposure can reach values up to 0.64 (95% CI = 0.60–0.69) μg/kg bw per day. Detailed information on the exposure levels that can be reached following the consumption of diverse single commodities is given in Appendix F.
As can be seen, no big differences were observed between estimates of chronic and acute exposure (MB scenario) indicating that the main contributors to the exposure are foods consumed on a regular basis within particular populations, together with a relatively symmetric distribution of their occurrence values.
3.3. Animal exposure
Although in animal nutrition, compound feeds (complementary or complete feeds) represent a very large proportion of the feed consumed by the farmed animals, the available data on the occurrence of EAs in these commodities are scarce (low number of samples available for each target species/category) and do not allow a reliable exposure estimate to be made. Therefore, only the occurrence data on grain cereals and on forages and roughage reported in Table 8 were used to calculate animal exposure.
Two scenarios were considered in the calculation of animal exposure: a mean occurrence scenario, in which the mean LB and UB values for each feedingstuff were used to estimate EA dietary concentrations; and a high occurrence scenario, in which the high (P90 or P95) LB and UB values were used. The calculated mean and high concentrations of dietary EAs (reported in Appendix B, Sections B.2.1–B.2.5) were combined with the estimated feed intake (also described in Appendix B) to obtain the estimated exposure of the different animal species and categories in the two scenarios. The detailed results, summarised below, are tabulated in the Appendix G.
Dietary exposure to EAs in dairy cows varied between 1.41 (LB) and 1.75 (UB) μg/kg bw per day using the mean occurrence scenario, and between 4.53 and 4.58 μg/kg bw per day in the high exposure scenario. The corresponding exposure of beef cattle varies between 0.31 and 2.05 and between 1.43 and 6.30 μg/kg bw per day in the two exposure scenarios. Sheep (1.14–1.38 and 3.74–3.78 μg/kg bw per day), milking goats (2.43–4.35 and 11.28–11.91 μg/kg bw per day) and fattening goats (0.82–1.51 and 3.80–4.04 μg/kg bw per day) showed a similar exposure.
Pigs showed comparable levels of exposure for the three categories at both mean and high exposure scenarios: piglets 6.82–8.07 and 16.38–16.61 μg/kg bw per day, fattening pigs 4.68–5.48 and 12.02–12.16 μg/kg bw per day, and lactating sows 4.92–5.58 and 12.31–12.43 μg/kg bw per day.
The same levels of exposure can be observed in poultry species, with values for broilers of 5.78–7.16 and 11.75–12.68 μg/kg bw per day, for laying hens 4.46–5.65 and 8.89–9.74 μg/kg bw per day, for turkeys for fattening 3.50–4.50 and 10.21–10.38 μg/kg bw per day, and for ducks for fattening 6.53–7.56 and 16.19–16.38 μg/kg bw per day.
Rabbit showed exposure levels of 1.74–2.98 and 7.04–8.19 μg/kg bw per day.
Fish (salmonids) showed exposure levels of 0.65–0.72 and 1.30–1.32 μg/kg bw per day.
Lower exposure levels were observed in companion animals, being for dogs 0.53–1.11 and 1.50–1.96 μg/kg bw per day, for cats 0.55–1.16 and 1.56–2.04 μg/kg bw per day, and for horses 0.88–1.28 and 3.38–3.59 μg/kg bw per day, respectively, in the two exposure scenarios.
The exposure levels of the five relevant target species/categories increased considerably when rye was included in the diets. The exposure of pigs for fattening ranged between 25.71 (LB mean scenario) to 67.26 (UB high scenario) μg/kg bw per day, and for lactating sows from 17.91 (LB mean scenario) to 46.61 (UB high scenario) μg/kg bw per day. Exposure of laying hens was calculated between 19.95 (LB mean scenario) and 50.86 (UB high scenario) μg/kg bw per day. The inclusion of rye in diets for ruminants had a smaller impact on the exposure level ranging from 2.83 (LB mean scenario) to 12.85 (UB high scenario) μg/kg bw per day.
3.4. Ergot sclerotia and concentration of ergot alkaloids
Following the Terms of reference (Section 1.1), a potential relationship between the content of ergot sclerotia and the levels of EAs was assessed. Likewise, the efficiency of the removal of ergot sclerotia on the presence of EAs was also evaluated, considering the different analytical data and information received. LB estimations were used when referring to the EA content; this could imply some underestimation of the EA contents as around 60% of the analytical data were left‐censored and, consequently, a bias in the evaluation of the relationship between the content of ergot sclerotia and the levels of EAs.
As mentioned in Section 3.1.3, two data sets containing samples with data on both ergot sclerotia and EAs were submitted to EFSA, one data set submitted by the Croatian Food Agency with 20 samples of rye grains, and one submitted by Arvalis – Institut du vegetal with 2,526 samples on different grains, of which 618 were also analysed for the EA content.
A correlation analysis was carried out to quantify the strength of a linear relationship between the content of sclerotia and the levels of ergot alkaloids for samples of barley, triticale, rye and wheat. A Pearson product‐moment correlation coefficient or Pearson's correlation was used with a significance level (α) of 0.05%. Before evaluating the potential correlation between ergot sclerotia and EA content, the 20 samples of rye grains were merged with the other data set, containing 618 samples (among them 100 samples of rye) in which EAs were analysed because of the presence of sclerotia.
The graphs in Figure 13 show the relationship between the content of sclerotia and the levels of ergot alkaloids for the samples of wheat, triticale, barley and rye; the Pearson's correlation coefficients for each of the crops evaluated are shown in Table 12. It can be seen that for all crops there was a strong and significant (p‐value < 0.0001) linear relationship between the content of sclerotia and the levels of EAs analysed; Pearson correlation coefficients ranged between 0.806 for rye grains and 0.972 for triticale grains. Similar strong linear correlation has been reported in wheat samples (Tittlemier et al., 2015), although other studies (in rye and triticale) indicated low association between EA content and sclerotia (Mulder et al., 2012). However, the observed correlation between EA content and sclerotia levels in this study it is not sufficient to be used to predict EA content based on sclerotia or vice versa (correlation but not causation).
Figure 13.

Relationship between the amount of ergot sclerotia and ergot alkaloids in samples of (A) wheat (n = 275), (B) barley (n = 127), (C) rye (n = 120) and (D) Triticale (n = 102)
Table 12.
Correlation analysis between content of sclerotia and levels of ergot alkaloids in different crops
| Number of samples | Pearson's coefficient | p‐value | |
|---|---|---|---|
| Barley grains | 127 | 0.927 | < 0.0001 |
| Oats grains | 14 | 0.948 | < 0.0001 |
| Rye grains | 120 | 0.806 | < 0.0001 |
| Triticale | 102 | 0.972 | < 0.0001 |
| Wheat grains | 275 | 0.969 | < 0.0001 |
There were 87 samples where ergot sclerotia were visually detected and then quantified, some of them at relatively high concentrations (range 1.1–180 mg/kg), whereas no EAs could be quantified. This confirms reports in the literature where it was hypothesised that there may have been a potential contamination with Claviceps strains that do not produce EAs (Battilani et al., 2009, Wegulo and Carison, 2011; Mulder et al., 2012).
Concerning the presence of EAs in the absence of sclerotia, in the first data set from Croatia, among the 11 samples of rye grains with no sclerotia identified after visual inspection, there were five occasions (46%) where at least one EA was quantified (total EAs ranging from 22 to 171 μg/kg, LB scenario). In the other data set, among the 41 samples with no visual detection of sclerotia, six samples (15%) were found to contain EAs (range 10–23 μg/kg). This situation has been reported in the past in different studies and it could be explained by the presence of very small particles resulting from the breakage of the sclerotia that remained unnoticed (Wegulo et al., 2011; Mulder et al., 2012).
It can be concluded that, in general, the presence of ergot sclerotia is a good indicator for the presence of EAs in grain samples, with only 14% of samples with sclerotia identified showing no quantified levels of EAs (‘false positives’). However, the absence of sclerotia does not exclude the presence of EAs, since there were several samples with no sclerotia detected that showed measurable levels of EAs (‘false negatives’).
The efficiency of the removal of ergot sclerotia on the total amount of EAs was also evaluated. A couple of studies have been recently published covering this issue. In a project funded by the UK Food Standards Agency and carried out by Campden BRI, it was reported that, although based on a limited number of samples, the applied cleaning processes significantly reduced the levels of EAs (Byrd et al., 2014). As an example, an initial EA content of 20,457 μg/kg in one sample of oats was reduced to 1 μg/kg following sclerotia removal. This particular study covered diverse samples of barley (n = 11), rye (n = 6), oat (n = 1) and wheat (n = 1), and different cleaning processes: from manual removal following visual examination (wheat and barley) to an optical sorting process (rye and oat). Similarly, another study on different feed samples reported that manual removal of sclerotia resulted in an average reduction of the EA content of 70%, with the lowest efficiency in samples of triticale (52.3% EA content remaining) (Mulder et al., 2012).
The data available to EFSA only pertained to nine samples of rye grain analysed for EAs before and after undergoing a cleaning process. Determination of ergot sclerotia was carried out following macroscopic and microscopic identification of ergot sclerotia and fragments, weighing the amount of identified sclerotia and fragments with a particle size > 0.5 mm.12 Surprisingly, no reduction was observed in the EA levels following the cleaning process (Figure 14). The analysis of the removed ergot sclerotia showed that their content in EAs was very low and could not explain the EA levels quantified in these rye grains. Although some studies have postulated a possible transfer of EAs from the sclerotia into the kernels during plant growth (Wolff and Richter, 1989), other researchers could not conclude on this (Mainka et al., 2007).
Figure 14.
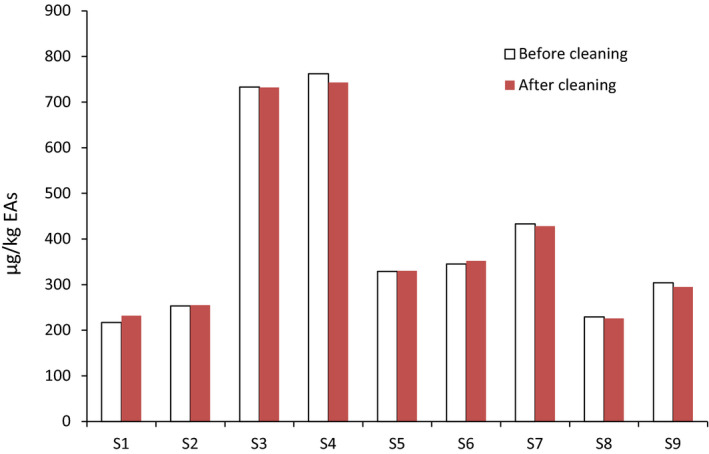
Levels of ergot alkaloids reported for nine samples of rye grain before and after manual removal of ergot sclerotia
4. Uncertainties
A qualitative evaluation of the inherent uncertainties in the assessment of the dietary exposure to EAs was performed following the guidance of the Opinion of the Scientific Committee related to Uncertainties in Dietary Exposure Assessment (EFSA, 2007).
Concerning occurrence data, most of the data submitted by Member States (MSs) originates from targeted monitoring programmes, which might have led to overestimation of EA levels and as a consequence to overestimation of the dietary exposure. There is uncertainty related to the representativity of the food and feed samples across Europe, in particular for feed since data came primarily from a few countries. The large proportion of left‐censored data introduces uncertainty to the overall dietary exposure estimates. This is particularly relevant for EAs as the final content in the samples results from the sum of up to 12 individual compounds, and even more in food samples where only 11% of the analytical results were quantified. While the LB values tend to underestimate the dietary exposure to EAs, UB values tend to overestimate it. The limited number of available samples for particular food and feed subgroups adds uncertainty to the representativity of the mean concentration values used to estimate exposure. Although many relevant processed foods were available, it cannot be discarded that food commodities that may contain EAs are not represented in the available data set leading, therefore, to an underestimation of the dietary exposure to EAs.
Regarding feed, the use of samples reported as ‘Grain as crops’ as feed may imply overestimation of the animal exposure as these samples were reported with relatively high EA content and their use as feed is not confirmed. Likewise, the reduced number of samples of compound feeds prevents their use in the exposure estimations which could imply an underestimation of the animal exposure to EAs.
Uncertainties and limitations related to the use of the EFSA Comprehensive Food Consumption Database have already been described elsewhere (EFSA, 2011b) and are not further detailed; only those with a particular impact on the dietary exposure to EAs are mentioned here. The main uncertainty refers to eating occasions reported as raw agricultural/minimally processed commodities derived from consumption data on processed foods that were disaggregated. The disaggregated consumption data in these dietary surveys do not specify the original consumed processed commodity (e.g. cake, bread, etc.) which makes it impossible to apply any factor to return to the processed commodities. These consumption data were linked to EA levels in raw agricultural/minimally processed commodities with no factors applied to cover the possible elimination of EAs during processing. As a result, the dietary exposure estimations obtained for these dietary surveys are likely overestimated.
Table 13 shows a summary of the uncertainty evaluation indicating an estimate of whether the respective source of uncertainty might have led to an over‐ or underestimation of the exposure.
Table 13.
Summary of the qualitative evaluation of the impact of uncertainties on the dietary exposure to EAs
| Sources of uncertainty | Directiona |
|---|---|
| Measurement uncertainty of analytical results associated to the methods of analysis | +/− |
| Large proportion of left‐censored data in the final data set | +/− |
| Using the substitution method at the lower‐bound (LB) scenario | − |
| Using the substitution method at the lower–bound (MB) scenario | +/− |
| Using the substitution method at the upper–bound (UB) scenario | + |
| Representativity of occurrence data to the whole of Europe | +/− |
| Reporting of consumption data on raw agricultural commodities derived from consumption of processed foods | + |
| Lack of occurrence data on relevant food and feed commodities | − |
| Use of samples reported as ‘Grain as crops’ for animal exposure | + |
+ = uncertainty with potential to cause overestimation of exposure; − = uncertainty with potential to cause underestimation of exposure.
Both chronic and acute estimates were particularly affected by the high proportion of left‐censored data, particularly relevant for EAs as the final content in the samples results from the sum of up to 12 individual compounds. Overall, lower bound estimations of chronic exposure to EAs most likely underestimated the exposure levels of the European population, while middle and, above all, upper bound exposure are most likely overestimated. Similarly, acute exposure estimates to EAs are likely overestimated by using the middle bound scenario.
5. Conclusions
The most recent available data on EAs (2011–2016) in food (4,528 samples) and feed (654 samples) as well as 1,234 samples initially codified as ‘Grain as crops’ were used to estimate human and animal dietary exposure. In 97% of the samples, the analysis covered the 12 main C. purpurea EAs: ergometrine, ergosine, ergocornine, ergotamine, ergocristine, ergocryptine (α‐ and β‐isomers) and the corresponding –inine (S)‐epimers. In addition to the data on EAs, for 2,546 samples, information on the content of ergot sclerotia was submitted by two different providers.
In food, the highest levels of EAs were reported in rye and rye‐containing commodities, in particular in raw agricultural or minimally processed commodities (e.g. ‘Rye milling products, 198–239 μg/kg, LB–UB). Among processed food, the highest levels of EAs were found in ‘Mixed wheat and rye bread and rolls’ (33–82 μg/kg), ‘Rye bread and rolls’ (29–67 μg/kg) and ‘Rye flakes’ (35–83 μg/kg), always for LB–UB scenarios.
Mean dietary exposure was highest in ‘Toddlers’ and ‘Other children’ with maximum UB estimates of 0.47 and 0.46 μg/kg bw per day, respectively. The 95th percentile dietary exposure was highest in ‘Toddlers’ with a maximum UB estimate of 0.86 μg/kg bw per day. Overall, chronic dietary exposure to EAs in the young population (‘Infants’, ‘Toddlers’, and ‘Other children’) was 2–3 times higher than that estimated for the adult population (‘Adults’, ‘Elderly’, and ‘Very elderly’). UB estimations were in average fourfold higher than LB estimations.
Among processed foods and within the dietary surveys with the highest exposure estimates, the main contributors to chronic dietary exposure were different types of bread and rolls, in particular those containing or made exclusively of rye.
Average acute exposure ranged from 0.02 μg/kg bw per day estimated in ‘Infants’ to 0.32 μg/kg bw per day estimated in ‘Other children’. For the 95th percentile acute dietary exposure, the highest estimate was for a dietary survey within the age class ‘Other children’ (0.98 μg/kg bw per day).
For cereal‐based processed commodities, the most relevant foods involved in the acute exposure to EAs were ‘Mixed wheat and rye bread and rolls’ and ‘Rye bread and rolls’. In high consumers, a single consumption of ‘Mixed wheat and rye bread and rolls’ can lead to acute exposure estimates up to 0.74 (95% CI = 0.59–0.93) μg/kg bw per day and up to 0.64 (95% CI = 0.60–0.69) μg/kg bw per day in the case of ‘Rye bread and rolls’.
As compared to the 2012 EFSA opinion, a much higher number of food commodities was available, in particular on processed foods. This probably led to higher chronic dietary exposure estimates as compared to those in 2012, although also the overall EA content seems to be slightly higher in the food samples used for the current assessment. Highest acute dietary exposure estimates were similar to those reported in 2012.
Animal dietary exposure varied according to the animal species. The exposure considering a mean concentration scenario varied between 0.31–0.46 μg/kg bw per day in beef cattle and 6.82–8.07 μg/kg bw per day (LB–UB) in piglets. While considering a high concentration scenario the exposure varied between 1.43–1.45 μg/kg bw per day and 16.38–16.61 μg/kg bw per day (LB–UB) in the same species. When rye is included in the diets, the exposure of the relevant species increases up to levels of 25.71–26.47 μg/kg bw per day in the mean concentration scenario up to 67.19–67.26 μg/kg bw per day (LB–UB) in the high concentration scenario in pigs for fattening, the species with the highest exposure level.
In all crops assessed (barley, oats, rye, triticale and wheat grains) there was a strong and statistically significant (p‐value < 0.0001) linear relationship between the content of sclerotia and the levels of EAs analysed, with Pearson correlation coefficients ranging between 0.806 for rye grains and 0.972 for triticale grains.
The presence of ergot sclerotia is a good indicator for the presence of EAs in grain samples, with only 14% of samples with sclerotia identified showing no quantified levels of EAs (‘false positives’). However, the absence of sclerotia does not exclude the presence of EAs, since there were several samples with no sclerotia detected that showed measurable levels of EAs (‘false negatives’).
In the very few samples (n = 9) submitted to EFSA where it was possible to assess the efficacy of the removal of sclerotia on decreasing the levels of EAs, no reduction was observed following a cleaning process. Further studies are needed to confirm these results that do not agree with findings previously reported in the literature.
6. Recommendations
Collection of analytical data on EAs in relevant food and feed commodities should continue, with special attention to processed foods.
Simultaneous collection of data on the presence of ergot sclerotia and on the EA content in different food and feed commodities should continue to help better understand the relationship between these two variables.
As the EA pattern seems to depend on many different factors (crop, epimerisation during processing and/or analysis, etc.), it is recommended that monitoring should continue for at least the EAs already listed in Commission Recommendation 2012/154/EU.
Available analytical methods with the appropriate sensitivity should be used to reduce the uncertainty associated with the different occurrence scenarios and, consequently, with dietary exposure estimations.
Abbreviations
- ARfD
acute reference dose
- BMDL10
benchmark dose at 10% extra risk
- bw
body weight
- CI
confidence interval
- Comprehensive Database
EFSA Comprehensive European Food Consumption Database
- CONTAM
EFSA Panel on Contaminants in the Food Chain
- EAs
ergot alkaloids
- FD
fluorescence detection
- HBGV
health‐based guidance value
- HPLC‐FD
high‐performance liquid chromatography with fluorescence detection
- i.v.
intravenous
- LB
lower bound
- LC–MS/MS
liquid chromatography–tandem mass spectrometry
- LD50
lethal dose, median
- LOD
limit of detection
- LOQ
limit of quantification
- MB
middle bound
- ML
maximum level
- MS
Member State
- NOAEL
no‐observed‐adverse‐effect levels
- RAC
raw agricultural commodities
- SSD
Standard Sample Description
- QqQ
triple‐quadrupole
- TDI
tolerable daily intake
- UB
upper bound
Appendix A – Dietary surveys used to estimate chronic and acute dietary exposure to ergot alkaloids in the European population
1.
Appendix A can be found in the online version of this output under ‘Supporting information’.
Appendix B – Intakes and composition of diets used to estimate animal exposure to ergot alkaloids
1.
The feed intake and the diet composition used to estimate the exposure to ergot alkaloids (EAs) of the animal species considered in this report are those extensively described by the EFSA Panel on Contaminants in the Food chain (CONTAM) in the Scientific Opinion on the risks for animal and public health related to the presence of T‐2 and HT‐2 toxin in food and feed (EFSA CONTAM Panel, 2005). They are summarised in this appendix. In addition, the diets for the farm livestock species and companion animals include also the calculated lower‐bound (LB) and upper‐bound (UB) mean and high concentrations for EAs, based on the LB and UB mean and high (P90–P95) concentrations in the feedingstuff reported in Table 8.
B.1. Feed intake
B.1.1. Cattle, sheep, goats and horses
Table B.1.
Live weights, growth rate/productivity and dry matter intake for cattle, sheep, goats and horses, and the proportions of the diet as non‐forage
| Live weight (kg) | Growth rate or productivity | Dry matter intake (kg/day) | % of diet as non‐forage feed | Reference | |
|---|---|---|---|---|---|
| Dairy cows, lactating | 650 | 40 kg milk/day | 20.7 | 60 | AFRC (1993) |
| Beef: fatteninga | 400 | 1 kg/day | 9.6 | 20 | AFRC (1993) |
| Beef: cereal | 400 | 1.4 kg/day | 8.4 | 85 | AFRC (1993) |
| Sheep: lactating | 80 | Feeding twin lambs | 2.8 | 35 | AFRC (1993) |
| Goats: milkingb | 60 | 6 kg milk/day | 3.4 | 75 | NRC (2007a) |
| Goats: fattening | 40 | 0.2 kg/day | 1.5 | 40 | NRC (2007a) |
| Horses | 450 | – | 9 | 50 | NRC (2007b) |
Housed castrate cattle, medium maturing breed.
Months 2–3 of lactation.
B.1.2. Pigs, poultry, fish and rabbit
Table B.2.
Live weights and feed intake for pigs, poultry, fish and rabbits
| Live weight (kg) | Feed intake (kg/day) | Reference | |
|---|---|---|---|
| Pigs: piglets | 20 | 1.0 | EFSA (2009a) |
| Pigs: fattening pigs | 100 | 3.0 | EFSA (2009a) |
| Pigs: lactating sows | 200 | 6.0 | EFSA (2009a) |
| Poultry: broilers | 2 | 0.12 | EFSA (2009a) |
| Poultry: laying hens | 2 | 0.12 | EFSA (2009a) |
| Turkeys: fattening turkeys | 12 | 0.40 | EFSA (2009a) |
| Ducks: fattening ducks | 3 | 0.14 | Leeson and Summers (2008) |
| Salmonids | 2 | 0.04 | EFSA (2009a) |
| Rabbit | 2 | 0.15 | Carabano and Piquer (1998) |
B.1.3. Dogs and cats
Table B.3.
Live weights and feed intake for dogs and cats
B.2. Diet composition and ergot alkaloids concentration estimates
B.2.1. Cattle sheep, goats and horses
Table B.4.
Compositions of non‐forage feed for cattle, sheep and goats, and calculated mean and high lower‐bound and upper‐bound levels of ergot alkaloids in these diets
| Feeds | Dairy cow | Beef cattle | Beef cattle | Sheep | Goats | Goats | Horses |
|---|---|---|---|---|---|---|---|
| Cereal beef | Fattening | Lactating | Dairy | Fattening | |||
| Wheat (%) | 15 | 14 | |||||
| Barley (%) | 20 | 60 | 40 | 18 | 25 | 20 | |
| Oats (%) | 35 | 40 | 40 | ||||
| Soybean meal (%) | 5 | 5 | 10 | 10 | |||
| Rapeseed meal (%) | 20 | 5 | 20 | 10 | 10 | 10 | |
| Sunflower meal (%) | 5 | 5 | |||||
| Beans (%) | 5 | 10 | 10 | ||||
| Maize gluten feed (%) | 10 | 10 | 11 | ||||
| Wheat feed (%) | 10 | 4 | 10 | 15 | 10 | 10 | 30 |
| Oat feed (%) | 12 | ||||||
| Sugar beet pulp (%) | 8 | 10 | 12 | 15 | 2 | ||
| Molasses (%) | 3 | 2 | 3 | 4 | 4 | 3 | 5 |
| Vegetable oils (%) | 1 | 1 | 1 | 1 | 2 | 2 | |
| Minerals and vitamins (%) | 3 | 3 | 3 | 3 | 4 | 3 | 3 |
| Ergot alkaloids a | |||||||
| Mean lower bound (μg/kg) | 76 | 61 | 657 | 83 | 57 | 55 | 88 |
| Mean upper bound (μg/kg) | 95 | 101 | 84 | 101 | 102 | 101 | 128 |
| High lower bound (μg/kg) | 246 | 304 | 262 | 272 | 266 | 253 | 338 |
| High upper bound (μg/kg) | 248 | 309 | 266 | 275 | 280 | 269 | 359 |
Ergot alkaloid concentration present in the diets calculated by using the mean or the high concentrations reported for the individual feeds (Table 8).
B.2.2. Pigs and poultry
Table B.5.
Diet compositions for pigs and poultry, and calculated mean and high lower‐bound and upper‐bound levels of ergot alkaloids in these diets
| Feeds | Piglets | Pigs for fattening | Lactating sow | Broilers | Laying hens | Turkeys for fattening | Ducks for fattening |
|---|---|---|---|---|---|---|---|
| Wheat (%) | 48 | 48 | 50 | 38 | 30 | 30 | 45 |
| Barley (%) | 20 | 20 | 11 | 35 | 15 | ||
| Maize (%) | 38 | 35 | |||||
| Soybean meal (%) | 22 | 11 | 16 | 15 | 22 | 15 | 28 |
| Rapeseed meal (%) | 3 | 4 | |||||
| Lucerne meal (%) | 4 | 9 | 5 | ||||
| Wheat feed (%) | 9 | 14 | 1 | 7 | |||
| Molasses (%) | 3 | 4 | 4 | 3 | 3 | 3 | |
| Vegetable oils (%) | 1 | 1 | 2 | 1 | 2 | 4 | |
| Minerals and vitamins (%) | 3 | 3 | 3 | 4 | 4 | 4 | |
| Ergot alkaloids a | |||||||
| Mean lower bound (μg/kg) | 136 | 156 | 164 | 96 | 74 | 105 | 140 |
| Mean upper bound (μg/kg) | 161 | 183 | 186 | 119 | 94 | 135 | 162 |
| High lower bound (μg/kg) | 328 | 401 | 410 | 196 | 148 | 306 | 347 |
| High upper bound (μg/kg) | 332 | 405 | 414 | 211 | 162 | 311 | 351 |
Ergot alkaloid concentration present in the diets calculated by using the mean or the high concentrations reported for the individual feeds (Table 8).
B.2.3. Rabbit
Table B.6.
Diet composition for rabbits and calculated mean and high lower‐bound and upper‐bound levels of ergot alkaloids
| Feeds | Rabbit |
|---|---|
| Sunflower meal (%) | 20 |
| Dried lucerne (%) | 19 |
| Wheat bran (%) | 19 |
| Barley (%) | 18 |
| Sugar beet pulp (%) | 12 |
| Beans (%) | 11 |
| Minerals and vitamins (%) | 1 |
| Ergot alkaloids a | |
| Mean lower bound (μg/kg) | 23 |
| Mean upper bound (μg/kg) | 40 |
| High lower bound (μg/kg) | 94 |
| High upper bound (μg/kg) | 109 |
Ergot alkaloid concentration present in the diets calculated by using the mean or the high concentrations reported for the individual feeds (Table 8).
B.2.4. Fish
Table B.7.
Diet composition for salmonids and calculated mean and high lower‐bound and upper‐bound levels of ergot alkaloids
| Feeds | Salmonids |
|---|---|
| Fishmeal (%) | 30.5 |
| Wheat (%) | 13.2 |
| Soybean meal (%) | 12.3 |
| Maize gluten feed (%) | 11.5 |
| Fish and vegetable oils (%) | 31.9 |
| Mineral vitamins premix (%) | 0.6 |
| Ergot alkaloids a | |
| Mean lower bound (μg/kg) | 33 |
| Mean upper bound (μg/kg) | 36 |
| High lower bound (μg/kg) | 65 |
| High upper bound (μg/kg) | 66 |
Ergot alkaloid concentration present in the diets calculated by using the mean or the high concentrations reported for the individual feeds (Table 8).
B.2.5. Dogs and cats
Table B.8.
Diet compositions for dogs and cats, and calculated mean and high lower‐bound and upper‐bound levels of ergot alkaloids
| Feeds | Dogs | Cats |
|---|---|---|
| Wheat (%) | 30.5 | 30.5 |
| Maize (%) | 13.2 | 13.2 |
| Barley (%) | 12.3 | 12.3 |
| Rice (%) | 11.5 | 11.5 |
| Maize gluten feed (%) | 31.9 | 31.9 |
| Ergot alkaloids a | ||
| Mean lower bound (μg/kg) | 67 | 67 |
| Mean upper bound (μg/kg) | 140 | 140 |
| High lower bound (μg/kg) | 189 | 189 |
| High upper bound (μg/kg) | 247 | 247 |
Ergot alkaloid concentration present in the diets calculated by using the mean or the high concentrations reported for the individual feeds (Table 8).
Appendix C – Provided limits of quantification (LOQs) in μg/kg as used in the analysis of ergot alkaloids
C.1. Limits of quantification (LOQs) in the analysis of ergot alkaloids in ‘Grains for human consumption’ and ‘Grain milling products’
| HPLC‐FD | LC–MS | LC–MS/MS | |||||||||||||||||||
|---|---|---|---|---|---|---|---|---|---|---|---|---|---|---|---|---|---|---|---|---|---|
| Grains for human consumption | Grain milling products | Grains for human consumption | Grain milling products | Grains and grain‐based products | Grains for human consumption | Grain milling products | |||||||||||||||
| Limits of quantification (μg/kg) | Limits of quantification (μg/kg) | Limits of quantification (μg/kg) | |||||||||||||||||||
| N | Min | Max | N | Min | Max | N | Min | Max | N | Min | Max | N | Min | Max | N | Min | Max | N | Min | Max | |
| Ergometrine | 18 | 6.2 | 6.3 | 12 | 6.2 | 6.3 | 8 | 1.0 | 1.0 | 9 | 1.0 | 1.0 | 2 | 2.0 | 20.0 | 410 | 0.1 | 20.0 | 665 | 0.1 | 20.0 |
| Ergosine | 18 | 12.5 | 12.5 | 12 | 12.5 | 12.5 | 8 | 1.0 | 1.0 | 9 | 1.0 | 1.0 | 2 | 2.0 | 20.0 | 412 | 0.1 | 20.0 | 666 | 0.1 | 20.0 |
| Ergocornine | 18 | 12.5 | 12.5 | 12 | 12.5 | 12.5 | 8 | 1.0 | 1.0 | 9 | 1.0 | 1.0 | 2 | 2.0 | 20.0 | 410 | 0.1 | 20.0 | 662 | 0.1 | 20.0 |
| Ergotamine | 18 | 12.5 | 12.5 | 12 | 12.5 | 12.5 | 8 | 1.0 | 1.0 | 9 | 1.0 | 1.0 | 2 | 4.0 | 20.0 | 411 | 0.1 | 20.0 | 666 | 0.1 | 20.0 |
| alpha‐Ergocryptine | 18 | 12.5 | 12.5 | 12 | 12.5 | 12.5 | – | – | – | – | – | – | – | – | – | 104 | 0.1 | 10.0 | 94 | 0.1 | 10.0 |
| beta‐Ergocryptine | – | – | – | – | – | – | – | – | – | – | – | – | – | – | – | 5 | 0.1 | 0.1 | 11 | 0.1 | 0.1 |
| Ergocristine | 18 | 12.5 | 12.5 | 12 | 12.5 | 12.5 | 8 | 1.0 | 1.0 | 9 | 1.0 | 1.0 | 2 | 2.0 | 20.0 | 411 | 0.1 | 20.0 | 665 | 0.1 | 20.0 |
| Ergometrinine | 14 | 12.2 | 12.5 | 11 | 6.2 | 12.5 | 8 | 1.0 | 1.0 | 9 | 1.0 | 1.0 | 2 | 1.0 | 20.0 | 365 | 0.1 | 20.0 | 649 | 0.1 | 20.0 |
| Ergosinine | 14 | 12.2 | 12.5 | 11 | 12.5 | 12.5 | 8 | 1.0 | 1.0 | 9 | 1.0 | 1.0 | 2 | 4.0 | 20.0 | 366 | 0.1 | 20.0 | 662 | 0.1 | 20.0 |
| Ergocorninine | 18 | 12.5 | 12.5 | 12 | 12.5 | 12.5 | 8 | 1.0 | 1.0 | 9 | 1.0 | 1.0 | 2 | 4.0 | 20.0 | 410 | 0.1 | 20.0 | 662 | 0.1 | 20.0 |
| Ergotaminine | 18 | 12.5 | 12.5 | 12 | 12.5 | 12.5 | 8 | 1.0 | 1.0 | 9 | 1.0 | 1.0 | 2 | 4.0 | 20.0 | 410 | 0.1 | 20.0 | 662 | 0.1 | 20.0 |
| alpha‐Ergocryptinine | 18 | 12.5 | 12.5 | 12 | 12.5 | 12.5 | – | – | – | – | – | – | – | – | – | 87 | 0.1 | 3.0 | 66 | 0.1 | 2.0 |
| Ergocristinine | 18 | 12.5 | 12.5 | 12 | 12.5 | 12.5 | 8 | 1.0 | 1.0 | 9 | 1.0 | 1.0 | 2 | 4.0 | 20.0 | 410 | 0.1 | 20.0 | 662 | 0.1 | 20.0 |
| Ergocryptine (sum of epimers) | – | – | – | – | – | – | 8 | 1.0 | 1.0 | 9 | 1.0 | 1.0 | 2 | 2.0 | 20.0 | 306 | 1.0 | 20.0 | 568 | 1.0 | 20.0 |
| Ergocryptinine (sum of epimers) | – | – | – | – | – | – | 8 | 1.0 | 1.0 | 9 | 1.0 | 1.0 | 2 | 4.0 | 20.0 | 323 | 1.0 | 20.0 | 596 | 1.0 | 20.0 |
HPLC‐FD: high‐performance liquid chromatography with fluorescence detection; LC–MS: liquid chromatography–mass spectrometry; LC–MS/MS: liquid chromatography–tandem mass spectrometry.
C.2. Limits of quantification (LOQs) in the analysis of ergot alkaloids in ‘Bread and rolls’, ‘Cereal‐based food for infants and young children’, ‘Breakfast cereals’ and ‘Fine bakery wares’
| HPLC‐FD | LC–MS | LC–MS/MS | |||||||||||||||||||
|---|---|---|---|---|---|---|---|---|---|---|---|---|---|---|---|---|---|---|---|---|---|
| Bread and rolls | Bread and rolls | Cereal‐based food for infants and young children | Bread and rolls | Breakfast cereals | Fine bakery wares | Cereal‐based food for infants and young children | |||||||||||||||
| Limits of quantification (μg/kg) | Limits of quantification (μg/kg) | Limits of quantification (μg/kg) | |||||||||||||||||||
| N | Min | Max | N | Min | Max | N | Min | Max | N | Min | Max | N | Min | Max | N | Min | Max | N | Min | Max | |
| Ergometrine | 18 | 6.3 | 12.5 | 4 | 1.0 | 1.0 | 2 | 1.0 | 1.0 | 278 | 0.8 | 20.0 | 194 | 0.1 | 20.0 | 40 | 1.0 | 5.0 | 92 | 0.1 | 20.0 |
| Ergosine | 18 | 12.5 | 12.5 | 4 | 1.0 | 1.0 | 2 | 1.0 | 1.0 | 278 | 0.5 | 20.0 | 194 | 0.1 | 20.0 | 40 | 1.0 | 5.0 | 92 | 0.1 | 20.0 |
| Ergocornine | 18 | 12.5 | 12.5 | 4 | 1.0 | 1.0 | 2 | 1.0 | 1.0 | 278 | 0.8 | 20.0 | 194 | 0.1 | 20.0 | 40 | 1.0 | 5.0 | 92 | 0.1 | 20.0 |
| Ergotamine | 18 | 12.5 | 12.5 | 4 | 1.0 | 1.0 | 2 | 1.0 | 1.0 | 278 | 0.8 | 20.0 | 194 | 0.1 | 20.0 | 40 | 1.0 | 5.0 | 92 | 0.1 | 20.0 |
| alpha‐Ergocryptine | 18 | 12.5 | 12.5 | – | – | – | – | – | – | 133 | 0.8 | 5.0 | 59 | 0.1 | 10.0 | 5 | 2.0 | 2.0 | 85 | 0.1 | 2.0 |
| beta‐Ergocryptine | – | – | – | – | – | – | – | – | – | 107 | 0.8 | 5.0 | 6 | 0.1 | 0.1 | – | – | – | 74 | 0.1 | 0.1 |
| Ergocristine | 18 | 12.5 | 12.5 | 4 | 1.0 | 1.0 | 2 | 1.0 | 1.0 | 278 | 0.8 | 20.0 | 194 | 0.1 | 20.0 | 40 | 1.0 | 5.0 | 92 | 0.1 | 20.0 |
| Ergometrinine | 17 | 12.5 | 12.5 | 4 | 1.0 | 1.0 | 2 | 1.0 | 1.0 | 277 | 0.8 | 20.0 | 184 | 0.1 | 20.0 | 36 | 1.0 | 2.0 | 92 | 0.1 | 20.0 |
| Ergosinine | 17 | 12.5 | 12.5 | 4 | 1.0 | 1.0 | 2 | 1.0 | 1.0 | 278 | 0.8 | 20.0 | 193 | 0.1 | 20.0 | 40 | 1.0 | 5.0 | 92 | 0.1 | 20.0 |
| Ergocorninine | 18 | 12.5 | 12.5 | 4 | 1.0 | 1.0 | 2 | 1.0 | 1.0 | 278 | 0.7 | 20.0 | 193 | 0.1 | 20.0 | 40 | 1.0 | 5.0 | 92 | 0.1 | 20.0 |
| Ergotaminine | 18 | 12.5 | 12.5 | 4 | 1.0 | 1.0 | 2 | 1.0 | 1.0 | 278 | 0.8 | 20.0 | 193 | 0.1 | 20.0 | 40 | 1.0 | 5.0 | 92 | 0.1 | 20.0 |
| alpha‐Ergocryptinine | 18 | 12.5 | 12.5 | – | – | – | – | – | – | 162 | 0.8 | 10.0 | 28 | 0.1 | 2.0 | 5 | 2.0 | 2.0 | 85 | 0.1 | 2.0 |
| beta‐Ergocryptinine | – | – | – | – | – | – | – | – | – | 44 | 1.5 | 9.0 | – | – | – | – | – | – | – | – | – |
| Ergocristinine | 18 | 12.5 | 12.5 | 4 | 1.0 | 1.0 | 2 | 1.0 | 1.0 | 278 | 0.6 | 20.0 | 193 | 0.1 | 20.0 | 40 | 1.0 | 5.0 | 92 | 0.1 | 20.0 |
| Ergocryptine (sum of epimers) | – | – | – | 4 | 1.0 | 1.0 | 2 | 1.0 | 1.0 | 167 | 1.0 | 20.0 | 135 | 1.0 | 20.0 | 35 | 1.0 | 5.0 | 7 | 1.0 | 20.0 |
| Ergocryptinine (sum of epimers) | – | – | – | 4 | 1.0 | 1.0 | 2 | 1.0 | 1.0 | 116 | 0.6 | 20.0 | 165 | 1.0 | 20.0 | 35 | 1.0 | 5.0 | 34 | 0.1 | 20.0 |
HPLC‐FD: high‐performance liquid chromatography with fluorescence detection; LC–MS: liquid chromatography–mass spectrometry; LC–MS/MS: liquid chromatography–tandem mass spectrometry.
Appendix D – Detailed occurrence levels of ergot alkaloids in food
1.
Appendix D can be found in the online version of this output under ‘Supporting information’.
Appendix E – Chronic dietary exposure to ergot alkaloids in the European population and contribution of different food commodities
1.
Appendix E can be found in the online version of this output under ‘Supporting information’.
Appendix F – Acute dietary exposure to ergot alkaloids in the European population and contribution of different food commodities
1.
Appendix F can be found in the online version of this output under ‘Supporting information’.
Appendix G – Exposure assessment of ergot alkaloids for animals
G.1. Estimated intake of ergot alkaloids using mean LB and UB ergot alkaloids concentrations in feedingstuffs
G.1.1. Dairy cows
Table G.1.
Estimated lower‐bound and upper‐bound exposure by a 650‐kg body weight lactating dairy cow to ergot alkaloids at a milk production level of 40 milk/day and of non‐forage feed intake of 12 kg (DM) (μg/day and μg/kg bw per day)
| Exposure | |
|---|---|
| Milk Yield: 40 kg Non‐forage feed consumed: 12 kg dry matter/day | |
| μg/day | |
| Lower bound | 916 |
| Upper bound | 1,137 |
| μg/kg bw per day | |
| Lower bound | 1.41 |
| Upper bound | 1.75 |
bw: body weight.
G.1.2. Beef cattle
Table G.2.
Estimated lower‐bound and upper‐bound exposure to ergot alkaloids by 400‐kg body weight fattening beef cattle reared on grass silage plus non‐forage feeds system or a cereal beef system (μg/day and μg/kg bw per day)
| Exposure | ||
|---|---|---|
| Fattening beef | Cereal beef | |
| Non‐forage feeds consumed (kg dry matter/day) | ||
| 1.9 | 7.1 | |
| μg/day | ||
| Lower bound | 123 | 497 |
| Upper bound | 184 | 821 |
| μg/kg bw per day | ||
| Lower bound | 0.31 | 1.24 |
| Upper bound | 0.46 | 2.05 |
bw: body weight.
G.1.3. Sheep and goats
Table G.3.
Estimated lower‐bound and upper‐bound exposure to ergot alkaloids by lactating sheep, milking goats and fattening goats (μg/day and μg/kg bw per day)
| Exposure | |||
|---|---|---|---|
| 80‐kg lactating sheep | 60‐kg milking goat | 40‐kg fattening goat | |
| μg/day | |||
| Lower bound | 91 | 146 | 33 |
| Upper bound | 111 | 261 | 60 |
| μg/kg bw per day | |||
| Lower bound | 1.14 | 2.43 | 0.82 |
| Upper bound | 1.38 | 4.35 | 1.51 |
bw: body weight.
G.1.4. Pigs
Table G.4.
Estimated lower bound and upper‐bound exposure of pigs to ergot alkaloids (μg/day and μg/kg bw per day)
| Exposure | |||
|---|---|---|---|
| Piglets | Fattening pigs | Lactating sows | |
| μg/day | |||
| Lower bound | 136.4 | 467.9 | 983.7 |
| Upper bound | 161.4 | 547.5 | 1,115.9 |
| μg/kg bw per day | |||
| Lower bound | 6.82 | 4.68 | 4.92 |
| Upper bound | 8.07 | 5.48 | 5.58 |
bw: body weight.
G.1.5. Poultry
Table G.5.
Estimated lower‐bound and upper‐bound exposure of poultry to ergot alkaloids (μg/day and μg/kg bw per day)
| Exposure | ||||
|---|---|---|---|---|
| Broilers | Laying hens | Turkeys for fattening | Ducks for fattening | |
| μg/day | ||||
| Lower bound | 11.6 | 8.9 | 41.9 | 19.6 |
| Upper bound | 14.3 | 11.3 | 54.0 | 22.7 |
| μg/kg bw per day | ||||
| Lower bound | 5.78 | 4.46 | 3.50 | 6.53 |
| Upper bound | 7.16 | 5.65 | 4.50 | 7.56 |
bw: body weight.
G.1.6. Rabbit
Table G.6.
Estimated lower‐bound and upper‐bound exposure of a 2‐kg body weight rabbit to ergot alkaloids (μg/day and μg/kg bw per day)
| Exposure | |
|---|---|
| Rabbit | |
| μg/day | |
| Lower bound | 3.49 |
| Upper bound | 5.96 |
| μg/kg bw per day | |
| Lower bound | 1.74 |
| Upper bound | 2.98 |
bw: body weight.
G.1.7. Farmed fish
Table G.7.
Estimated lower‐bound and upper‐bound exposure of a 2‐kg body weight salmon to ergot alkaloids (μg/day and μg/kg bw per day)
| Exposure | |
|---|---|
| Salmon | |
| μg/day | |
| Lower‐bound | 1.31 |
| Upper‐bound | 1.44 |
| μg/kg bw per day | |
| Lower‐bound | 0.65 |
| Upper‐bound | 0.72 |
bw: body weight.
G.1.8. Companion animals
Table G.8.
Estimated lower‐bound and upper‐bound exposure of a 25‐kg body weight dog, a 4‐kg body weight cat and a 450‐kg body weight horse to ergot alkaloids (μg/day and μg/kg bw per day)
| Exposure | |||
|---|---|---|---|
| Dogs | Cats | Horses | |
| μg/day | |||
| Lower bound | 13.27 | 2.21 | 394 |
| Upper bound | 27.72 | 4.62 | 574 |
| μg/kg bw per day | |||
| Lower bound | 0.53 | 0.55 | 0.88 |
| Upper bound | 1.11 | 1.16 | 1.28 |
bw: body weight.
G.2. Estimated intake of ergot alkaloids using high LB and UB ergot alkaloids concentrations in feedingstuffs
G.2.1. Dairy cows
Table G.9.
Estimated lower‐bound and upper‐bound exposure by a 650‐kg body weight lactating dairy cow to ergot alkaloids at a milk production level of 40 kg milk/day) and of non‐forage feed intake of 12 kg (DM) (μg/day, and μg/kg bw per day)
| Exposure | |
|---|---|
| Milk Yield: 40 kg Non‐forage feed consumed: 12 kg dry matter/day | |
| μg/day | |
| Lower bound | 2,947 |
| Upper bound | 2,980 |
| μg/kg bw per day | |
| Lower bound | 4.53 |
| Upper bound | 4.58 |
bw: body weight.
G.2.2. Beef cattle
Table G.10.
Estimated lower‐bound and upper‐bound exposure to ergot alkaloids by 400‐kg body weight fattening beef cattle reared on grass silage plus non‐forage feeds system or a cereal beef system (μg/day and μg/kg bw per day)
| Exposure | ||
|---|---|---|
| Fattening beef | Cereal beef | |
| Non‐forage feeds consumed (kg dry matter/day) | ||
| 1.9 | 7.1 | |
| μg/day | ||
| Lower bound | 571 | 2,478 |
| Upper bound | 579 | 2,522 |
| μg/kg bw per day | ||
| Lower bound | 1.43 | 6.19 |
| Upper bound | 1.45 | 6.30 |
bw: body weight.
G.2.3. Sheep and goats
Table G.11.
Estimated lower‐bound and upper‐bound exposure to ergot alkaloids by lactating sheep, milking goats and fattening goats (μg/day and μg/kg bw per day)
| Exposure | |||
|---|---|---|---|
| 80‐kg lactating sheep | 60‐kg milking goat | 40‐kg fattening goat | |
| μg/day | |||
| Lower bound | 299 | 677 | 152 |
| Upper bound | 302 | 715 | 162 |
| μg/kg bw per day | |||
| Lower bound | 3.74 | 11.28 | 3.80 |
| Upper bound | 3.78 | 11.91 | 4.04 |
bw: body weight.
G.2.4. Pigs
Table G.12.
Estimated lower‐bound and upper‐bound exposure of pigs to ergot alkaloids (μg/day and μg/kg bw per day)
| Exposure | |||
|---|---|---|---|
| Piglets | Fattening pigs | Lactating sows | |
| μg/day | |||
| Lower bound | 327.5 | 1,201.5 | 2,461.6 |
| Upper bound | 332.2 | 1,215.6 | 2,485.5 |
| μg/kg bw per day | |||
| Lower bound | 16.38 | 12.02 | 12.31 |
| Upper bound | 16.61 | 12.16 | 12.43 |
bw: body weight.
G.2.5. Poultry
Table G.13.
Estimated lower‐bound and upper‐bound exposure of poultry to ergot alkaloids (μg/day and μg/kg bw per day)
| Exposure | ||||
|---|---|---|---|---|
| Broilers | Laying hens | Turkeys for fattening | Ducks for fattening | |
| μg/day | ||||
| Lower bound | 23.5 | 17.8 | 122.6 | 48.6 |
| Upper bound | 25.4 | 19.5 | 124.5 | 49.1 |
| μg/kg bw per day | ||||
| Lower bound | 11.75 | 8.89 | 10.21 | 16.19 |
| Upper bound | 12.68 | 9.74 | 10.38 | 16.38 |
bw: body weight.
G.2.6. Rabbit
Table G.14.
Estimated lower‐bound and upper‐bound exposure of a 2‐kg body weight rabbit to ergot alkaloids (μg/day and μg/kg bw per day)
| Exposure | |
|---|---|
| Rabbit | |
| μg/day | |
| Lower bound | 14.09 |
| Upper bound | 16.38 |
| μg/kg bw per day | |
| Lower bound | 7.04 |
| Upper bound | 8.19 |
bw: body weight.
G.2.7. Farmed fish
Table G.15.
Estimated lower‐bound and upper‐bound exposure of a 2‐kg body weight salmon to ergot alkaloids (μg/day and μg/kg bw per day)
| Exposure | |
|---|---|
| Salmon | |
| μg/day | |
| Lower bound | 2.61 |
| Upper bound | 2.64 |
| μg/kg bw per day | |
| Lower bound | 1.30 |
| Upper bound | 1.32 |
bw: body weight.
G.2.8. Companion animals
Table G.16.
Estimated lower‐bound and upper‐bound exposure of a 25‐kg body weight dog, a 4‐kg body weight cat and a 450‐kg body weight horse to ergot alkaloids (μg/day and μg/kg bw per day)
| Exposure | |||
|---|---|---|---|
| Dogs | Cats | Horses | |
| μg/day | |||
| Lower bound | 37.46 | 6.24 | 1,520 |
| Upper bound | 48.95 | 8.16 | 1,616 |
| μg/kg bw per day | |||
| Lower bound | 1.50 | 1.56 | 3.38 |
| Upper bound | 1.96 | 2.04 | 3.59 |
bw: body weight.
G.3. Estimated intake of ergot alkaloids using mean or high LB and UB ergot alkaloids concentrations in diets containing rye
G.3.1. Estimated intake using mean LB and UB ergot alkaloids concentrations in feedingstuffs
Table G.17.
Estimated lower‐bound and upper‐bound exposure of pigs for fattening, lactating sows, laying hens, dairy cows and beef fattening to ergot alkaloids from diets containing rye up to the maximum recommended inclusion ratea (μg/day and μg/kg bw per day)
| Inclusion rate (%) | Diet concentration μg/kg | Intake μg/day | Intake μg/kg bw | ||
|---|---|---|---|---|---|
| Pigs for fattening | 50 | LB | 857 | 2,571 | 25.71 |
| UB | 882 | 2,647 | 26.47 | ||
| Lactating sows | 40 | LB | 597 | 3,582 | 17.91 |
| UB | 618 | 3,707 | 18.53 | ||
| Laying hens | 30 | LB | 333 | 40 | 19.95 |
| UB | 351 | 42 | 21.04 | ||
| Dairy cows (40 kg milk) | 25 | LB | 236 | 2,830 | 4.36 |
| UB | 253 | 3,036 | 4.67 | ||
| Beef (fattening) | 40 | LB | 520 | 1,133 | 2.83 |
| UB | 544 | 1,186 | 2.97 |
bw: body weight; LB: lower bound; UB: upper bound.
G.3.2. Estimated intake using high LB and UB ergot alkaloids concentrations in feedingstuffs
Table G.18.
Estimated lower‐bound and upper‐bound exposure of pigs for fattening, lactating sows, laying hens, dairy cows and beef fattening to ergot alkaloids from diets containing rye up to the maximum recommended inclusion rate (μg/day and μg/kg bw per day)
| Inclusion rate (%) | Diet concentration μg/kg | Intake μg/day | Intake μg/kg bw | ||
|---|---|---|---|---|---|
| Pigs for fattening | 50 | LB | 2,240 | 6,718 | 67.19 |
| UB | 2,242 | 6,725 | 67.26 | ||
| Lactating sows | 40 | LB | 1,551 | 9,308 | 46.54 |
| UB | 1,554 | 9,322 | 46.61 | ||
| Laying hens | 30 | LB | 838 | 101 | 50.27 |
| UB | 848 | 102 | 50.86 | ||
| Dairy cows (40 kg milk) | 25 | LB | 694 | 8,328 | 12.81 |
| UB | 696 | 8,352 | 12.85 | ||
| Beef (fattening) | 40 | LB | 1,462 | 3,188 | 7.97 |
| UB | 1,464 | 3,192 | 7.98 |
bw: body weight; LB: lower bound; UB: upper bound.
Supporting information
Dietary surveys used to estimate chronic and acute dietary exposure to ergot alkaloids in the European population
Detailed occurrence levels of ergot alkaloids in food
Chronic dietary exposure to ergot alkaloids in the European population and contribution of different food commodities
Acute dietary exposure to ergot alkaloids in the European population and contribution of different food commodities
Suggested citation: EFSA (European Food Safety Authority) , Arcella D, Gómez Ruiz JÁ, Innocenti ML and Roldán R, 2017. Scientific report on human and animal dietary exposure to ergot alkaloids. EFSA Journal 2017;15(7):4902, 53 pp. 10.2903/j.efsa.2017.4902
Requestor: European Commission
Question number: EFSA‐Q‐2016‐00564
Acknowledgements: EFSA specially thanks Ron Hoogenboom, Annette Petersen and Martin Rose for providing valuable comments during the preparation of the report and for reviewing the final version. EFSA acknowledges all the European competent institutions, academia as well as Campden BRI and Arvalis – Institut du vegetal that provided occurrence data on ergot alkaloids and sclerotia, and all European competent institutions that supported the data collection for the Comprehensive European Food Consumption Database. This Scientific report was endorsed by the EFSA Scientific Panel on Contaminants in the Food Chain in its 84th plenary meeting.
Approved: 10 May 2017
Notes
OJ L140, 30.5.2002, p. 10.
Commission Regulation (EC) No 1940/2015 of 28 October 2015 amending Regulation (EC) 1881/2006 as regards maximum levels of ergots sclerotia in certain unprocessed cereals and the provisions on monitoring and reporting. OJ L 283, 29.11.2015, p. 3–6.
Commission Regulation (EC) No 1881/2006 of 19 December 2006 setting maximum levels for certain contaminants in foodstuffs. OJ L 364, 20.12.2006, p. 5–24.
Commission Recommendation 2012/154/EU of 15 March 2012 on the monitoring of the presence of ergot alkaloids in feed and food (OJ L 77, 16.3.2012, p. 20).
Opinion of the Scientific Panel on Contaminants in Food Chain on a request from the Commission related to ergot as undesirable substance in animal feed Available online: https://doi.org/onlinelibrary.wiley.com/doi/10.2903/j.efsa.2005.225/epdf
EFSA Panel on Contaminants in the Food Chain (CONTAM); Scientific Opinion on Ergot alkaloids in food and feed. EFSA Journal 2012;10(7):2798, 158 pp. https://doi.org/10.2903/j.efsa.2012.2798. Available online: https://doi.org/onlinelibrary.wiley.com/doi/10.2903/j.efsa.2012.2798/epdf
OJ L 364, 20.12.2006, p. 5.
Commission Regulation (EU) No 68/2013 of 16 January 2013 on the Catalogue of feed materials Text with EEA relevance (OJ L 29, 16.1.2013, p. 1).
Commission Regulation (EU) No 68/2013 of 16 January 2013 on the Catalogue of feed materials. OJ L 29, 30.1.2013, p. 1–64.
International Association of Feedingstuff Analysis, Section Feedingstuff Microscopy. Method for the Determination of Ergot (Claviceps purpurea Tul.) in Animal Feedingstuff, AG‐Method A4.
References
- AFRC (Agricultural and Food Research Council), 1993. Energy and Protein Requirements of Ruminants. An advisory manual prepared by the AFRC Technical Committee on Responses to Nutrients. CAB International.
- Battilani P, Costa LG, Dossena A, Gullino ML, Marchelli R, Galaverna G, Pietri A, Dall'Asta C, Giorni P, Spadaro D and Gualla A, 2009. Scientific information on mycotoxins and natural plant toxicants. Scientific/Technical Report submitted to EFSA, CFP/EFSA/CONTAM/2008/01.
- Baumann U, Hunziker HR and Zimmerli B, 1985. Ergot alkaloids in Swiss cereal products. Mitteilungen aus dem Gebiete der Lebensmitteluntersuchung und Hygiene, 76, 609–630. [Google Scholar]
- Byrd N, De Alwis J, Booth M and Jewell K, 2014. Monitoring the Presence of Ergot Alkaloids in Cereals and a Study of the Possible Relationship between Occurrence of Sclerotia Content and Levels of Ergot alkaloids. Food Standard Agency, Final report, Project number FS516009. Available online: https://www.food.gov.uk/sites/default/files/FS516009%20Final%20Ergot%20Alkaloid%20report%20%283%29.pdf
- Carabano R and Piquer J, 1998. The digestive system of the rabbit. In: de Blas C, Wiseman J (eds.). The Nutrition of the Rabbit. CABI Publishing, Oxon, UK, pp. 1–16. [Google Scholar]
- Coufal‐Majewski S, Stanford K, McAllister T, Blakley B, McKinnon J, Chaves AV and Wang Y, 2016. Impacts of cereal Ergot in food animal production. Frontiers in Veterinary Science, 3, 15. 10.3389/fvets.2016.00015 [DOI] [PMC free article] [PubMed] [Google Scholar]
- Crews C, 2015. Analysis of Ergot Alkaloids. Toxins, 7, 2024–2050. 10.3390/toxins7062024 [DOI] [PMC free article] [PubMed] [Google Scholar]
- Diana Di Mavungu JD, Larionova DA, Malysheva SV, Van Peteghem C and De Saeger S, 2011. Survey on ergot alkaloids in cereals intended for human consumption and animal feeding. Scientific report submitted to EFSA. Available online: http://www.efsa.europa.eu/en/supporting/pub/214e.htm
- Diana Di Mavungu J, Malysheva SV, Sanders M, Larionova D, Robbens J, Dubruel P, Van Peteghem C and De Saeger S, 2012. Development and validation of a new LC‐MS/MS method for the simultaneous determination of six major ergot alkaloids and their corresponding epimers. Application to some food and feed commodities. Food Chemistry, 135, 292–303. 10.1016/j.foodchem.2012.04.098 [DOI] [Google Scholar]
- EFSA (European Food Safety Authority), 2005. Scientific Opinion of the Scientific Panel on Contaminants in the Food Chain on a request from the European Commission related to ergot as undesirable substance in animal feed. EFSA Journal 2005;3(5):225, 1–27 pp. 10.2903/j.efsa.2005.225 [DOI] [Google Scholar]
- EFSA (European Food Safety Authority), 2007. Opinion of the Scientific Committee related to Uncertainties in Dietary Exposure Assessment. EFSA Journal 2007;5(1):438, 54 pp. 10.2903/j.efsa.2007.438 [DOI] [Google Scholar]
- EFSA (European Food Safety Authority), 2009a. Guidance for the preparation of dossiers for sensory additives. EFSA Journal 2012;10(1):2534, 26 pp. 10.2903/j.efsa.2012.2534 [DOI] [Google Scholar]
- EFSA (European Food Safety Authority), 2010a. Standard sample description for food and feed. EFSA Journal 2010;8(1):1457, 54 pp. 10.2903/j.efsa.2010.1457 [DOI] [Google Scholar]
- EFSA (European Food Safety Authority), 2010b. Management of left‐censored data in dietary exposure assessment of chemical substances. EFSA Journal 2010;8(3):1557, 96 pp. 10.2903/j.efsa.2010.1557 [DOI] [Google Scholar]
- EFSA (European Food Safety Authority), 2011a. Evaluation of the FoodEx, the food classification system applied to the development of the EFSA Comprehensive European Food Consumption Database. EFSA Journal 2011;9(3):1970, 27 pp. 10.2903/j.efsa.2011.1970 [DOI] [Google Scholar]
- EFSA (European Food Safety Authority), 2011b. Use of the EFSA Comprehensive European Food Consumption Database in Exposure Assessment. EFSA Journal 2011;9(3):2097, 34 pp. 10.2903/j.efsa.2011.2097 [DOI] [Google Scholar]
- EFSA CONTAM Panel (EFSA Panel on Contaminants in the Food Chain), 2011. Scientific Opinion on the risks for animal and public health related to the presence of T‐2 and HT‐2 toxin in food and feed. EFSA Journal 2011;9(12):2481, 187 pp. 10.2903/j.efsa.2011.2481 [DOI] [Google Scholar]
- EFSA CONTAM Panel (EFSA Panel on Contaminants in the Food Chain), 2012. Scientific Opinion on Ergot alkaloids in food and feed. EFSA Journal 2012;10(7):2798, 158 pp. 10.2903/j.efsa.2012.2798 [DOI] [Google Scholar]
- Franzmann C, Steinmeier A, Dittmer N and Humpf HU, 2010. Mutterkorn in Roggen – Vorkommen, Nachweis und Stabilität der Mutterkornalkaloide. Cereal Technology, 4, 213–219. [Google Scholar]
- Huybrechts ISI, Boon PE, Ruprich J, Lafay L, Turrini A, Amiano P, Hirvonen T, De Neve M, Arcella DMJ, Westerlund A, Ribas‐Barba L, Hilbig A, Papoutsou S, Christensen T, Oltarzewski MVS, Rehurkova I, Azpiri M, Sette S, Kersting M, Walkiewicz A, Serra‐ Majem L VJ, Trolle E, Tornaritis M, Busk L, Kafatos A, Fabiansson S, De Henauw S and JD VK, 2011. Dietary exposure assessments for children in Europe (the EXPOCHI project): rationale, methods and design. Archives of Public Health, 69, 1169–1184. [DOI] [PMC free article] [PubMed] [Google Scholar]
- Krska R and Crews C, 2008. Significance, chemistry and determination of ergot alkaloids: a review. Food Additives and Contaminants: Part A, 25, 722–731. 10.1080/02652030701765756 [DOI] [PubMed] [Google Scholar]
- Leeson S and Summers JD, 2008. Commercial Poultry Nutrition, 3rd Edition. Nottingham University Press, Thrumpton, Nottingham, 398 pp. [Google Scholar]
- Mainka S, Dänicke S, Böhme H, Ueberschär KH and Liebert F, 2007. On the alkaloid content of ergot (Claviceps purpurea). Landbauforschung Völkenrode, 1, 51–59. [Google Scholar]
- Merkel S, Dib B, Maul R, Köppen R, Koch M and Nehls I, 2012. Degradation and epimerization of ergot alkaloids after baking and in vitro digestion. Analytical Bioanalytical Chemistry, 404, 2489–2497. [DOI] [PubMed] [Google Scholar]
- Merten C, Ferrari P, Bakker M, Boss A, Hearty A, Leclercq C, Lindtner O, Tlustos C, Verger P, Volatier JL and Arcella D, 2011. Methodological characteristics of the national dietary surveys carried out in the European Union as included in the European Food Safety Authority (EFSA) Comprehensive European Food Consumption Database. Food Additives and Contaminants Part A, 28, 975–995. [DOI] [PubMed] [Google Scholar]
- Miedaner T and Geiger HH, 2015. Biology, Genetics, and Management of Ergot (Claviceps spp.) in Rye, Sorghum, and Pearl Millet. Schardl CL, ed. Toxins, 7, 659–678. 10.3390/toxins7030659 [DOI] [PMC free article] [PubMed] [Google Scholar]
- Mulder PPJ, van Raamsdonk LWD, van Egmond HJ, Voogt J, van Brakel MW, van der Horst GM and de Jong J, 2012. Dutch survey ergot alkaloids and sclerotia in animal. RIKILT report 2012‐005, 54 pp. Available online: http://edepot.wur.nl/234699
- Mulder P, Pereboom‐de Fauw D, Hoogenboom LAP, de Stoppelaar J and de Nijs M, 2015. Tropane and ergot alkaloids in grain‐based products for infants and young children in the Netherlands in 2011–2014. Food Additives and Contaminants: Part B, 8, 284–290. 10.1080/19393210.2015.1089947 [DOI] [PubMed] [Google Scholar]
- NRC (National Research Council), 2006. Nutrient Requirements of Dogs and Cats. National Academies Press, Washington, DC, 424 pp. [Google Scholar]
- NRC (National Research Council), 2007a. Nutrient Requirements of Small Ruminants: Sheep, Goats, Cervids and New World Camelids. US National Academy of Science, Washington, DC, 360 pp. [Google Scholar]
- NRC (National Research Council), 2007b. Nutrient Requirement of Horses. 6th Revised Edition. National Academies Press, Washington, DC, 384 pp. [Google Scholar]
- Scott PM, 2009. Ergot alkaloids: extent of human and animal exposure. World Mycotoxin Journal, 2, 141–149. [Google Scholar]
- Speijers GJA, Wester PN, van Leeuwen FXR, de la Fonteyne‐Blankestijn L, Post W, van Egmond HP, Sizoo EA and Janssen GB, 1993. Subchronic toxicity experiment with rats fed a diet containing ergotamine tartrate. Report no. 618312002. National Institute of Public Health and Environmental Protection, Bilthoven, The Netherlands.
- Tittlemier SA, Drul D, Roscoe M and McKendry T, 2015. Occurrence of Ergot and Ergot alkaloids in western Canadian wheat and other cereals. Journal of Agricultural and Food Chemistry, 63, 6644–6650. 10.1021/acs.jafc.5b02977 [DOI] [PubMed] [Google Scholar]
- Wegulo SN and Carlson MP, 2011. Ergot of small grain cereals and grasses and its health effects on humans and livestock. University of Nebraska, Extension, EC1880. Available online: http://ianrpubs.unl.edu/live/ec1880/build/ec1880.pdf
- WHO/IPCS (World Health Organization/International Programme on Chemical Safety), 2009. Principles and Methods for the Risk Assessment of Chemicals in Food, International Programme on Chemical Safety, Environmental Health Criteria 240. Chapter 6: Dietary Exposure Assessment of Chemicals in Food. Available online: http://www.who.int/ipcs/food/principles/en/index1.html
- WHO‐IPCS (World Health Organization‐International Programme on Chemical Safety), 1990. Selected Mycotoxins: Ochratoxins, Trichothecenes, Ergot. Environmental Health Criteria, Switzerland, 105 pp. [Google Scholar]
- Wolff J and Richter W, 1989. Chemische Untersuchungen an Mutterkorn. Getreide, Mehl und Brot, 43, 103–107. [Google Scholar]
- Wolff J, Neudecker C, Klug C and Weber R, 1988. Chemical and toxicologic studies of native corn in flour and bread. Zeitschrift für Ernahrungswissenschaft, 27, 1–22. [DOI] [PubMed] [Google Scholar]
Associated Data
This section collects any data citations, data availability statements, or supplementary materials included in this article.
Supplementary Materials
Dietary surveys used to estimate chronic and acute dietary exposure to ergot alkaloids in the European population
Detailed occurrence levels of ergot alkaloids in food
Chronic dietary exposure to ergot alkaloids in the European population and contribution of different food commodities
Acute dietary exposure to ergot alkaloids in the European population and contribution of different food commodities