

Abstract
This report is part of the ‘Echinococcus multilocularis surveillance’ scientific reports which are presented annually by EFSA to the European Commission and are intended to assess the sampling strategy, data collection and detection methods used by Finland, Ireland, Malta, the UK and Norway in their respective surveillance programmes. The surveillance programmes of these five countries were evaluated by checking the information submitted by each of them and verifying that the technical requirements laid down in Regulation (EU) No 1152/2011 were complied. The information was divided into four different categories for assessment: the type and sensitivity of the detection method, the selection of the target population, the sampling strategy and the methodology. For each category, the main aspects that need to be taken into account in order to accomplish the technical requirements of the legislation were checked against compliance of several criteria. All of the territories participating in this surveillance (Finland, the UK, Norway, Malta and Ireland) succeeded in the fulfilment of the technical legal requirements foreseen in Regulation (EU) No 1152/2011 concerning these four different categories. However, both Malta and Northern Ireland (UK) fulfil those requirements only assuming a diagnostic test sensitivity value higher than the one suggested by EFSA (conservative value of 0.78). None of the five countries recorded positive samples in 2016.
Keywords: Echinococcus multilocularis, absence of infection, freedom from disease, surveillance
Summary
Following a request from the European Commission and the European Free Trade Association (EFTA) Surveillance Authority, the Animal and Plant Health Unit (ALPHA) at the European Food Safety Authority (EFSA) was asked ‐in the context of Article 31 of Regulation (EC) No 178/2002‐ to annually evaluate the surveillance programme on Echinococcus multilocularis infection in animals carried on by the five countries which are listed in the Annex I of Regulation (EU) No 1152/2011.
The surveillance programmes performed by Finland, Ireland, the UK, Malta and Norway in 2016 were assessed by checking the reports for completeness against relevant elements that need to be addressed when performing an E. multilocularis surveillance in the context of Regulation (EU) No 1152/2011 and analysing the raw data submitted by these countries. In order to facilitate the assessment, the information given by the different countries was divided into four different categories corresponding to the critical points that are addressed in the legislation in the 'requirements for the pathogen‐specific surveillance programme provided for in point c) of Article 3′ (Annex II): (i) the type and sensitivity of the detection method, (ii) the selection of the target population, (iii) the sampling strategy and (iv) the methodology.
The four Member States and Norway used appropriate techniques for the detection of E. multilocularis in intestinal contents or faeces, performed a 12‐month surveillance period collection, and developed appropriate sampling for detection of the E. multilocularis parasite, if present in any part of the Member State, at the design prevalence of less than 1%, with a 95% confidence level.
All of the countries selected adequate wild definitive hosts in order to perform the surveillance, with the exception of Malta, which, in the absence of wild animals, selected dogs to perform the surveillance. Malta and Northern Ireland fulfil the requirements of Regulation (EU) No 1152/2011 related to the desired confidence level of 95% only assuming a test sensitivity value higher than the one recommended by EFSA in 2015 (0.78).
None of the four Member States nor Norway recorded positive samples in the 12‐month surveillance period.
1. Introduction
Human alveolar echinococcosis (AE), caused by the larval stage of the fox tapeworm Echinococcus multilocularis (EM), is considered amongst one of the most dangerous zoonoses (Torgerson et al., 2010; EFSA AHAW Panel, 2015).
Affected humans show clinical signs that include fatigue, loss of weight, abdominal pain, general malaise and signs of hepatitis or hepatomegaly. In untreated patients, the disease can develop to a severe form associated with liver failure, splenomegaly, portal hypertension and acidosis which can be fatal. Even treated patients can experience a reduction on their quality of life (Mihmanli et al., 2016; WHO, 2017). Indeed, AE is thought to be responsible for about 666,434 disability‐adjusted life‐years (DALYs) per year (Torgerson et al., 2010).
The transmission cycle of E. multilocularis occurs when the adult stage (strobilar stage) of the cestode residing in the small intestine of the definitive hosts release the eggs into the environment via faeces (Peregrine et al., 2012; EFSA AHAW Panel, 2015). The infective eggs are ingested by the intermediate hosts and the oncosphere migrates inside them until reach some organs, especially the liver (Peregrine et al., 2012; CDC, online). In the liver, the oncosphere develops into an encysted larval (metacestode stage) which resembles a malignancy in appearance and behaviour, because it proliferates indefinitely by exogenous budding and invades the surrounding tissues. In rodents, hydatid cysts contain numerous small vesicles with multiple protoscoleces (infective stages), while in humans protoscoleces are rarely observed (Moro and Schantz, 2009). The cycle continues when the definitive host consumes an infected intermediate host (Torgerson et al., 2010). Humans may be infected directly through close contact with the definitive host or indirectly through ingestion of food or water contaminated with eggs of the parasite (Torgerson et al., 2010).
In Europe, several species are able to maintain the cycle of E. multilocularis in the nature. A scientific opinion on E. multilocularis performed by the European Food Safety Authority (EFSA) in 2015, revised the potential hosts (definitive and intermediate) of the parasite for this continent (Table 1; See EFSA AHAW Panel, 2015 for more detailed information).
Table 1.
Potential definitive and intermediate hosts of E. multilocularis in Europe (EFSA AHAW Panel, 2015)
| Definitive hosts | Intermediate hosts | ||
|---|---|---|---|
| Red fox (Vulpes vulpes) | Considered the main definitive host (DH) | Common vole (Microtus arvalis), field vole (Microtus agrestis), common pine vole (Microtus subterraneus), sibling vole (Microtus levis), bank voles (Myodes spp.), water voles (Arvicola spp.), snow vole (Chionomys nivalis), lemming (Lemmus lemmus) | Various species of voles are confirmed as suitable hosts. However, factors such as their population densities and predation rates may influence in their role in the cycle |
| Arctic fox (Vulpes lagopus) | In Europe, only relevant in Svalbard | Muridae (Apodemus spp., Mus spp., Rattus spp.), brown hare (Lepus europaeus), shrew (Sorex sp.) | Although some murid rodents, hares and shrews are susceptible, natural infections occur only sporadically |
| Raccoon dog (Nyctereutes procyonoides), Wolf (Canis lupus), Golden jackal (Canis aureus) | In the presence of the red fox, they can act as DHs. There is no evidence supporting their ability to maintain the lifecycle in the absence of the red fox | Muskrat (Ondatra ziibethicus), beaver (Castor spp.), nutria (Myocastor coypu), Alpine marmot (Marmota marmota) | Large rodents are susceptible hosts. Their role seems to be related to the dispersion of the parasite; e.g. through translocations (beaver) |
| Domestic dog and wild cat (Felis s. silvestris) |
Overall, prevalence of dogs with the parasite is low. However, in experimental surveys, they become infected easily On the contrary, cats hardly get infected experimentally, but their natural infection has been reported in numerous occasions. For both species, further information is needed |
Suids, horses and domestic dogs | Only accidental or refractory intermediate hosts |
The distribution of the parasite seems to expand over the time. Until the 1980s, only four countries (France, Germany, Switzerland and Austria) were known to be endemic for the disease (Eckert and Deplazes, 1999). Since then, EM infections in animals have been increasingly reported in countries previously thought to be free (Davidson et al., 2012). The latest available information indicates that at least twenty‐four European countries have found the presence of E. multilocularis in the main definitive host, the red fox. In addition, human cases of AE are notified every year (ECDC, 2016) in some of these countries (Table 2).
Table 2.
Table based on Oksanen's suggested prevalence classes (Oksanen et al., 2016) of countries in which E. multilocularis has been reported in foxes (see also EFSA AHAW panel, 2015; ECDC, 2016; Lalošević et al., 2016)
| Countries | Prevalence in foxes | Human AE casesa |
|---|---|---|
| Finland, Ireland, Malta, United Kingdom, Norwayb | 0 | Austria, Belarus, Belgium, Bulgaria, Czech Republic, Denmark, Estonia, France, FYR Macedonia, Germany, Greece, Hungary, Latvia, Lithuania, Moldova, Poland, Romania, Slovakia, Slovenia, Switzerland, Netherlands, Turkey and Ukraine |
| Denmark, Slovenia and Sweden | ≤ 1% | |
| Austria, Belarus, Belgium, Croatia, Hungary, Italy, Netherlands, Romania and Ukraine | > 1% to < 10% | |
| Czech Republic, Estonia, France, Germany, Latvia, Lithuania, Luxembourg, Poland, Serbia, Slovakia, Liechtenstein and Switzerland | > 10% |
Only included the confirmed E. multilocularis species.
Excluding Svalbard.
The prevalence of the parasite is not homogeneous and may vary depending on multiple elements such as for example microclimatic conditions, geographical location, host population dynamics and amount of intermediate hosts (IHs) (Casulli et al., 2015; EFSA AHAW Panel, 2015). A systematic review on the geographical distribution of E. multilocularis in definitive and intermediate hosts in the European Union and adjacent countries found differences between countries (Oksanen et al., 2016; Table 2). The prevalence has been reported to range from 0 to more than 50% (EFSA AHAW Panel, 2015).
In order to guarantee the prevention of introduction of E. multilocularis through dogs (non‐commercial movements only) into those European territories of the Member states, or parts thereof, that (i) have a lack of presence of the parasite in definitive host, or (ii) have implemented an eradication programme of the parasite in wild definitive hosts within a defined scale,1 the European Union adopted Regulation (EU) No 1152/2011 'as regards preventive health measures for the control of E. multilocularis in dogs′.
On one hand, this Regulation gives to those Member States (or parts thereof) the right to apply preventive health measures (see in Article 7) to dogs intended for non‐commercial movements prior to their introduction.
On the other hand, this Regulation entails certain obligations for those territories (see Art.5), including the implementation of pathogen‐specific surveillance programmes, in accordance with Annex II, to provide evidence for the absence of E. multilocularis infection. The requirements for the pathogen‐specific surveillance programme are reported and summarised below:
The pathogen‐specific surveillance programme shall be designed to detect, per epidemiologically relevant geographical unit in the Member State or part thereof, a prevalence of not more than 1% at confidence level of at least 95%;
The pathogen‐specific surveillance programme shall use appropriate sampling, either risk‐based or representative, that ensures detection of the E. multilocularis parasite if present in any part of the Member State at the design prevalence (DP) specified at point 1;
-
The pathogen‐specific surveillance programme shall consist in the ongoing collection, during the 12‐month surveillance period, of samples from wild definitive hosts or, in the case where there is evidence of the absence of wild definitive hosts in the Member State or part thereof, from domestic definitive hosts, to be analysed by examination of:
intestinal contents for the detection of the E. multilocularis parasite by the sedimentation and counting technique (SCT), or a technique of equivalent sensitivity and specificity; or
faeces for the detection of species‐specific deoxyribonucleic acid (DNA) from tissue or eggs of the E. multilocularis parasite by polymerase chain reaction (PCR), or a technique of equivalent sensitivity and specificity.
The outcomes of the pathogen‐specific surveillance programme of each Member State listed in the Annex I need to be annually submitted to the Commission by the 31 of May.
At the moment, only four Member States (Finland, Ireland, Malta and the United Kingdom) are listed in the Annex I of Regulation (EU) No 1152/2011. The Decision of the EEA Joint Committee No 103/2012 of 15 June 2012 added also the whole territory of Norway to the list of countries complying with the conditions of Article 3 (Conditions for listing Member States of parts thereof in Part A of Annex I) of the legislation.
This report follows previous annual reports (EFSA, 2013, 2014, 2015, 2016) presented by EFSA to the European Commission which aim to analyse and assess the sampling strategy, data collection and detection methods used by these five countries in the context of Regulation (EU) No 1152/2011 in their respective E. multilocularis (pathogen‐specific) surveillance programmes, and verify that the requirements laid down in this regulation are being complied with (EFSA AHAW Panel, 2015).
1.1. Background and Terms of Reference as provided by European Commission and the EFTA surveillance authority
The Commission adopted Commission Regulation (EU) No 1152/2011 of 14 July 2011, as regards preventive health measures for the control of Echinococcus multilocularis infection in dogs. This was in order to ensure continuous protection of Finland, Ireland, Malta and the United Kingdom that claim to have remained free of the parasite E. multilocularis as a result of applying national rules until 31 December 2011. The Decision of the EEA Joint Committee No 103/2012 of 15 June 2012 added the whole territory of Norway2 to the list of countries complying with the conditions of Article 3 of the Regulation.
This Regulation includes certain obligations for these Member States and Norway to implement a pathogen‐specific surveillance programme aimed at detecting the parasite, if present in any part of those Member States, in accordance with certain requirements regarding the sampling, the detection techniques and the reporting.
[omissis]
EFSA is asked, in the context of Article 31 of Regulation (EC) No 178/2002, to provide the following scientific and technical assistance to the Commission:
Regular follow‐up of the literature regarding E. multilocularis infection in animals in the European Union and adjacent countries, including its geographical distribution and prevalence;
Analysis and critical assessment, in the context of Regulation (EU) No 1152/2011, of (i) the sampling strategy considered for the programmes of the countries concerned; (ii) the data collected in the framework of these programmes; (iii) the detection methods used.
1.2. Interpretation of the Terms of Reference
This report addresses ToR 2 of the mandates M‐2012‐0200 and M‐2014‐0287 submitted to EFSA by the European Commission and the EFTA Surveillance Authority, respectively, and applies the principles and procedures established in the EFSA reports ‘Scientific and technical assistance on E. multilocularis infection in animals’ (EFSA, 2012a) and ‘A framework to substantiate absence of disease: the risk based estimate of system sensitivity tool (RiBESS) using data collated according to the EFSA Standard Sample Description ‐ An example on Echinococcus multilocularis’ (EFSA, 2012b).
2. Data and methodologies
To address Terms of Reference (ToR) 2, EFSA developed a scientific and a technical report in 2012 (EFSA, 2012a,b). The principles and procedures that were established there have been applied in the assessment of each of the subsequent annual national surveillance reports submitted to the Commission, including this report.
As a first step, the quality of the 2017 surveillance reports of the four Member States and Norway was assessed by checking the description of the surveillance system for completeness against the relevant elements that need to be addressed in the context of Regulation (EU) No 1152/2011.
In order to facilitate the assessment, we divided the information into four different categories (see Table 3) corresponding to the critical points of the three paragraphs addressed in the legislation in the ‘requirements for the pathogen‐specific surveillance programme provided for in point c) of Article 3’ (Annex II):
Table 3.
Assessment categories and their equivalence in the Regulation (EU) No 1152/2011 (Annex II)
| Information category | Main points considered in the assessment | Regulation (EU) No 1152/2011 reference |
|---|---|---|
| 1 | The type and sensitivity of the detection method was evaluated to ensure the fulfilment of the technical legal requirements regarding appropriate techniques for the detection of E. multilocularis in intestinal contents (sedimentation and counting technique – SCT – or a technique of equivalent sensitivity and specificity) or faeces (detection of species‐specific DNA from tissue or eggs of the E. multilocularis parasite by polymerase chain reaction – PCR – or a technique of equivalent sensitivity and specificity) | Annex II – Point 3 |
| 2 | The selection of the target population was evaluated to ensure the fulfilment of the technical legal requirements regarding the collection of samples from wild definitive hosts or domestic definitive host in the absence of the first | Annex II – Point 3 |
| 3 | The sampling strategy was evaluated to ensure the fulfilment of the technical legal requirements regarding appropriate sampling for detection of the E. multilocularis parasite, if present in any part of the Member State, at the design prevalence of less than 1% | Annex II – Point 2 |
| The sampling strategy was evaluated to ensure the fulfilment of the technical legal requirements regarding the 12‐month surveillance period collection | Annex II – Point 3 | |
| 4 | The Methodology was evaluated to ensure the fulfilment of the technical legal requirements regarding a confidence level of at least 0.95 against a design prevalence of 1% | Annex II – Point 1 |
For each of the four evaluation parts, the most relevant elements were extracted from the reports submitted by the MS and checked against the criteria described below (Table 4).
Table 4.
Relevant elements checked for compliance of the technical requirements of Annex II of Regulation (EU) No 1152/2011
| Points addressed in the Annex II | Element | Description of element |
|---|---|---|
| Type and sensitivity of the detection method | Type of test | The diagnostic test used for the detection of EM must be defined. Modifications of the original method should be indicated |
| Test sensitivity | The sensitivity and specificity of the test used in the surveillance system must be reported. This would ideally be estimates from each participating laboratory reported as a point estimate (average) of the values across the country with minimum and maximum values or a probability distribution. Alternatively, a value of 0.78, as recommended by EFSA (2015), shall be used | |
| Selection of the target population | Definition of susceptible host population targeted by the system | The susceptible wild definitive host population(s) (red foxes, raccoon dogs) targeted by the surveillance system should be described and the choice justified. If domestic host species (dogs or cats) are sampled, evidence for the absence of wild definitive hosts and for these domestic animals having had access to outdoors should be provided |
| Size of susceptible host population targeted by the system | The size of the targeted (wildlife) population should be reported, together with the evidence for this. Historical population data should be updated since these may not reflect current populations | |
| Sampling strategy | Epidemiological unit | It should be clearly defined if individual animals or individual faeces samples collected from the environment constitute the epidemiological unit. If individual faeces samples are collected from the environment, the method applied to establish the species from which the faeces originated has to be reported |
| Sample size calculation | The applied survey design should be fully documented, including considerations regarding potential biases inherent in the survey design. The method and the formula used to calculate the sample size should be fully documented | |
| Implementation of the sampling activity | The sampling methods used should be fully documented including the related assumptions and uncertainties, and a justification for choosing the approach should be provided. Timeframe of the surveillance data and geographical clustering of the infection must to be reported. The sample collection period must comprise the whole year and the spatial distribution of the sampling must be representative | |
| Methodology | Design prevalence (DP) | DP is specified in Annex II to Regulation (EU) No 1152/2011 and must be 1% or lower |
| Geographic epidemiological unit | The geographic epidemiological unit(s) identified as target for the surveillance activity has to be clearly indicated and supported by justification | |
| Methodology for calculation of area sensitivity | For the calculation of the area sensitivity, the diagnostic sensitivity should be set conservatively to the lowest value, excluding the lowest 20th percentile, from the ones reported in the scientific literature and related to the diagnostic tests implemented by the countries listed in Annex I of the Commission Delegated Regulation (EU) No 1152/2011. In this case, is 78% (EFSA AHAW Panel, 2015) |
A summary of the assessment of the relative elements of the different countries is given at the end of the document (see Annex A–E).
As a second step, the raw data on individual samples submitted by the five countries via the EFSA Data Collection Framework (DCF) were analysed. For the purpose, the software R (R core Team, 2013) was used to compute descriptive statistics. Table 5 lists and describes all the parameters that were extracted from the data submitted.
Table 5.
List of the parameters extracted from the raw data submitted by the Member States via the Data Collection Framework
| Parameter | Description | |
|---|---|---|
| 1 | Theoretical sampling period | The 12‐month reporting period. It may go from January to December, but this is not a restriction: the reporting period can also include twelve months over 2 years |
| 2 | Actual sampling period | Number of days from the first sampling collection date to the last sample date within the theoretical sampling period |
| 3 | Summary dates | Descriptive statistics of the sampling period |
| 4 | Sampling period | Total number of days sampled within the sampling period |
| 5 | Number of samples | Total number of samples collected during the theoretical sampling period |
| 6 | Number of test results | Total number of test results. If the number of test results is equal to the number of samples, none of the latter required further investigations (i.e. were negative at the first test) |
| 7 | Laboratory test completion | Comparison between the year when the samples are collected and the year when the test was completed |
| 8 | Sensitivity | Sensitivity of the diagnostic test |
| 9 | Host | Target population size (N); additional information on the host species |
| 10 | Animal sample | Type of sample collected |
| 11 | Sampling Strategy and Design | As reported (e.g. representative sample, risk based) |
| 12 | Sampling point | Activity adopted for the sample collection (e.g. hunting, veterinary activity, etc.) |
3. Assessment
3.1. Finland
3.1.1. Information as submitted in the report by the Member State
The Finnish Food Safety Authority (Evira) used a PCR method (PCR 12S rRNA) for the detection of E. multilocularis eggs in rectal content. The PCR method was described by Isaksson et al. (2014), with a modification in the magnetic beads washing step (manual instead of automatic). To estimate the actual sensitivity of the test developed by Isaksson et al. (2014), internal validations were performed in Evira in 2014, 2015 and 2016. In 2014, a total of 131 positive controls (spiked with inactivated eggs) were examined and 102 (78%) were found positive, giving the estimated sensitivity of 0.78. In 2015 and 2016, the estimated sensitivities were 0.84 and 0.97, respectively (see Table 6).
Table 6.
Results of the internal validations performed by Finland from 2014 to 2016
| Year | Spiked samples | Samples testing positive | Positive control | Estimated sensitivity |
|---|---|---|---|---|
| 2014 | 131 | 102 | 0.78 | |
| 2015 | 38 | 32 | 5 EM inactivated (−80°C) eggs/3 mL matrix (intestinal content) | 0.84 |
| 2016 | 32 | 31 | 10 EM inactivated (−80°C) eggs/3 mL matrix (intestinal content) | 0.97 |
In routine analyses, a positive control was always analysed parallel to actual samples. If a positive control was found negative, the analysis of the whole batch of samples was repeated.
The targeted host species were the raccoon dog (Nyctereutes procyonoides) and red fox (Vulpes vulpes). The justifications reported for choosing these target species were the facts that the red fox is the primary host of E. multilocularis in Europe (Deplazes, 2006), and that raccoon dogs have been shown to be good definitive hosts for E. multilocularis (Kapel et al., 2006). The raccoon dog is more numerous (230,000) in Finland than the red fox (150,000). The population densities for both species are highest in the southern part of the country. See maps in Figure 1. Population sizes were estimated by Kahuala (2007) using multiple methods and data, including radio tracking of individual animals, hunting bag statistics, annual snow‐track counts and knowledge on reproductive potential of each species. More recent estimates of the population sizes than Kahuala (2007) were not available. However, data from the annual hunting bag suggest that there haven't been major changes since 2007 (see Figure 2). Fox bag has slightly decreased while raccoon dog bag has slightly increased. Average annual hunting bag of foxes and raccoon dogs in 2007–2015 was 51,967 and 159,156, respectively.
Figure 1.
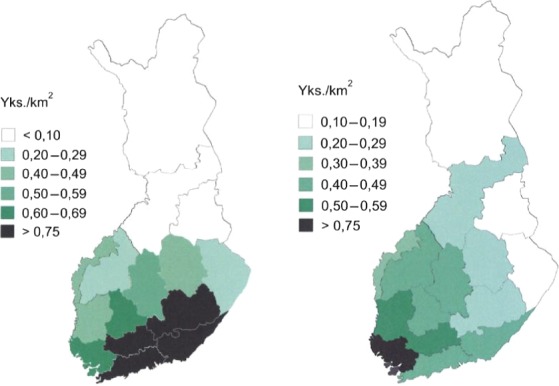
Finland – raccoon dog densities (left) and red fox densities (right) according to Kahuala (2007) (Yks./km2 = individuals/km2)
- Legend: the density values range from 0 to 1. Decimal values are indicated after the comma.
Figure 2.
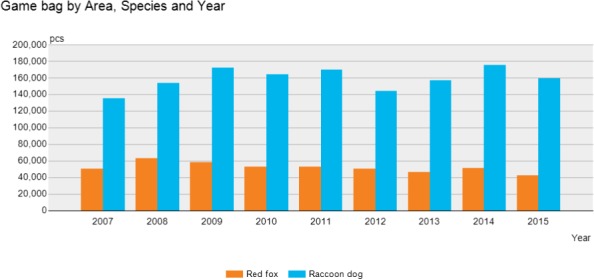
Finland – annual hunting bag of foxes and racoon dogs (2007–2015) (Source: OSF Natural Resources Institute Finland)
No information on age or gender structure of the target population was available.
The epidemiological unit was defined as the individual animal (red fox or raccoon dog).
The whole country of Finland, the entire wild small canid population(s) of the country (even though the population is a continuum of the north‐western taiga population), was defined as the geographical epidemiological unit.
The sample size was calculated by Finland using an overall sensitivity of the diagnostic approach of 0.78 and the DP of 1% prescribed in Regulation (EU) No 1152/2011 using the RiBESS tool.
The samples were collected by hunters on a voluntary basis. Hunters were informed of the sample collection by press releases in Evira's website and e‐mails and personal contacts to the Finnish Wildlife Agency which in turn informed local hunting associations. To motivate hunters, they received by post a written report of the results of the health status of the animals they sent in.
A total of 230 and 466 samples were collected from foxes and raccoon dogs, respectively (N = 696). Sex ratio was male‐biased in foxes (1:1.56) while it was close to equal in raccoon dogs (1:1.05). Of the animals that could be classified by age (N = 644), 66% were juveniles. The proportion of juveniles was high in both species (66% in raccoon dogs and 64% in foxes).
Sampling was targeted in the southern part of the country where populations are denser. More than a half (54%) of the samples originated from south‐east Finland, as this is the region where active monitoring of rabies control programme has taken place since 1990. The same area can be considered having an elevated risk of introduction of EM due to geographical closeness of infected areas in the south. Also, south‐east Finland has the highest density of raccoon dogs in Finland (Kahuala, 2007). A large sample of foxes (16% of all animals) was received from Lappi where active red fox population reduction to protect the arctic fox was ongoing. Sampling in the southern and western part of the country, where foxes and raccoon dogs are abundant, was successful. Large part of the raccoon dog samples from Päijät‐Häme and Kanta‐Häme were received from a field trial that tested the properties of different live trap models. These regions along with Satakunta and Varsinais‐Suomi submitted 23% of the samples (16% in 2015) (see Figure 3).
Figure 3.
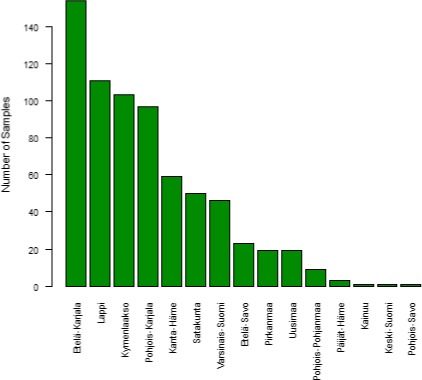
Finland – geographical distribution of samples
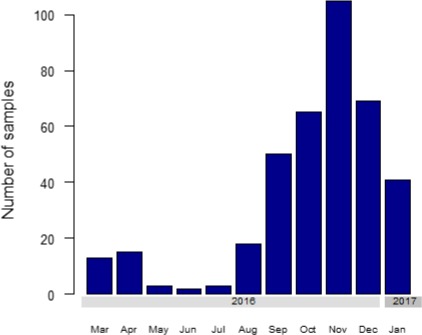
Samples were collected throughout 2016 (see Figure 4). January and October were the months with the highest sample sizes with a peak in October, which is an active season for small carnivore hunting, with abundance of juvenile raccoon dogs. Samples from Lappi district were mainly collected during January. Other active hunting months were February, September, March and November. In May, June and July, the sample sizes decreased due to the fact that the fox and female raccoon dogs with pups are protected, and consequently, hunting is only focused on diseased or injured individuals. The testing activity stopped when a sufficient amount of samples were collected and therefore samples received at the end of the year were not analysed.
Figure 4.
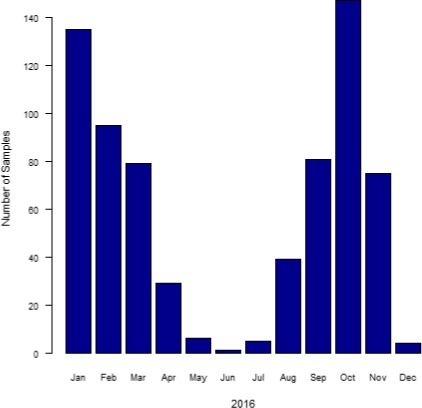
Finland – temporal distribution of samples
All samples were negative in PCR. Thus, no sample tested was found positive for E. multilocularis.
3.1.2. EFSA comments and considerations
3.1.2.1. Type and sensitivity of the detection method
Type of the detection method: The diagnostic test used by Finland for the detection of E. multilocularis consists of a PCR method (PCR targeting 12S rRNA gene) described by Isaksson in 2014 (Isaksson et al., 2014). The technique has been well described. A slight modification of the technique has been realised and it has been indicated in the report.
Test sensitivity: Estimated test sensitivities can vary due to several factors (e.g. tested populations, way of storage of the samples, amount of inhibitory substances, different DNA extraction methods and diverse gene targets) (Casulli et al., 2015; EFSA AHAW Panel, 2015). The diagnostic sensitivity of the PCR method used has been estimated to range from 88% to 95.7% (Casulli et al., 2015).
In order to estimate the actual sensitivity of the test developed by Isaksson et al. (2014), Evira performed internal validations in 2014, 2015 and 2016 (see Table 6). An exact binomial test indicates that the actual value may lie between 0.76 and 0.87 (95% CL, p‐value < 2.2−16). A Bayesian approach gives similar results (see Figure 5). Therefore, the lowest value (0.76) may be the safest choice for estimating the overall system sensitivity considering a worst‐case scenario.
Figure 5.
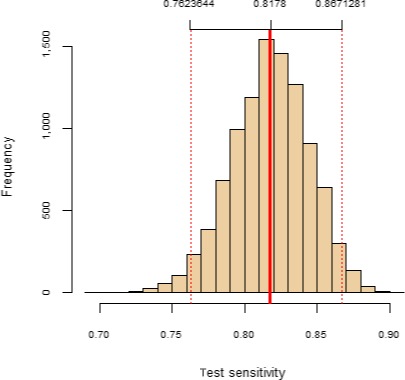
Finland – test sensitivity of the PCR 12S rRNA method (according to Isaksson et al., 2014) based on internal trials performed from 2014 to 2016
3.1.2.2. Selection of the target population
Definition of susceptible host population target by the system: The selection of racoon dogs and red fox species as target populations was based on their role as definitive hosts in the cycle. This is an assumption also confirmed by the EFSA Scientific opinion on E. multilocularis infection in animals (EFSA AHAW Panel, 2015).
It is not possible to conclude on the role of the age and gender composition of the target population in the epidemiology and the lifecycle of EM, due to lack of appropriate data and studies (EFSA AHAW Panel, 2015).
Size of susceptible host population targeted by the system: Host population sizes were based on a scientific study performed in 2007. Although population data have not been updated since 2007, new information regarding annual hunting bags has been included in the report. The decision to accept the size of the population as published by Kauhala is scientifically sound, particularly considering that the sample size calculation is not heavily affected when the population size has these dimensions (~ infinite population) (see EFSA AHAW Panel, 2015). The fact of considering the sum of the red fox and raccoon dog populations as the target population size seems to be correct, as raccoon dogs can act as DHs in conjunction with the red fox (EFSA AHAW Panel, 2015).
3.1.2.3. Sampling strategy
Epidemiological unit: The epidemiological unit appears in the report and is defined as the individual animal. Individual rectal contents were collected directly by hunters.
Sample size calculation: The method used to calculate the sample size of FI was the RIBESS tool. The sample size was calculated with an overall sensitivity of the diagnostic approach of 0.78 (as recommended by EFSA in EFSA AHAW Panel, 2015) and a population size of 380,000 (sum of red fox and raccoon dog population). With these conditions, the minimum number of samples to collect is 383.
Due to the results that were obtained in the estimation of the test sensitivity (see Section 3.1.2.1), EFSA investigated a worst‐case scenario using a test sensitivity of 0.76. The sample size required in this case is 393. For both sensitivity estimates, the sample size collected (N = 696) is sufficient to satisfy the requirements.
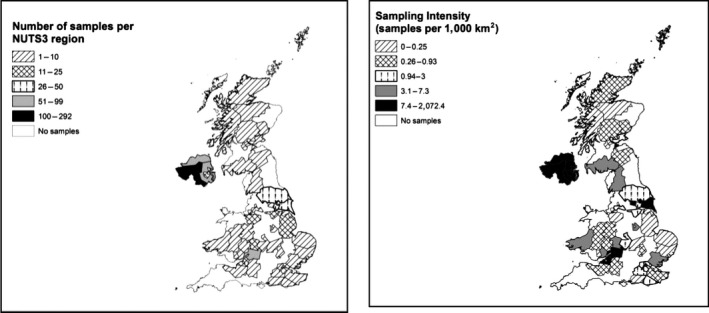
Implementation of the sampling activity: The geographical information shows that 15 out of 20 NUTS3 regions were included in the sampling activity (see Figure 6). There was a higher intensity of the sampling in the south‐east of the country.
Figure 6.
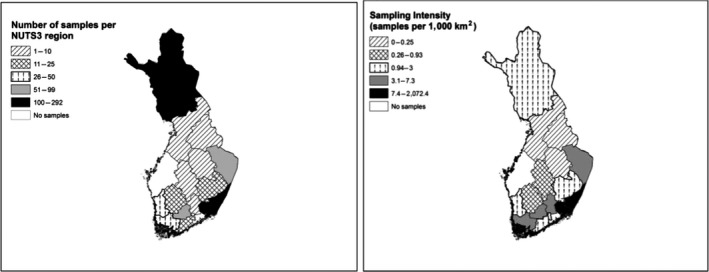
Finland – sampling activity and intensity by NUTS 3 region
The surveillance strategy as described in the Finnish report cannot be considered a simple random sample. Most of the samples were collected by hunters and efforts were concentrated in the north and south east of the country. However, in the case of wildlife animals, convenience sampling is the most frequently used method. To mitigate the potential bias caused by this sampling activity, more samples than required were collected.
Samples were collected during a period of 12 months as established in the relevant Regulation. The reduction of the intensity of the sampling during the summer months (May, June and July) is well justified and may not compromise the success of the detection of the parasite. A previous EFSA assessment suggested that a sampling distribution concentrated in the second half of the year – in a Freedom from Disease framework – could be more effective than a sampling distributed over the whole year; however, a quantitative evaluation was not performed (EFSA, 2013).
3.1.2.4. Methodology
Design Prevalence: The DP was equal to 1%, as it is specified in Annex II to Regulation (EU) No 1152/2011.
Epidemiological geographical unit: The geographical unit was specified to be the entire territory of Finland. The choice is sound as no risk factors were reported to justify the identification of sub‐areas within the Finnish territory.
Methodology for calculation of the area sensitivity: The area sensitivity was estimated by FI using the RiBESS tool. The parameters included for the calculation were the following, all fully documented:
design prevalence of 1%,
test sensitivity of 0.78,
population size of 380,000 (raccoon dogs + red foxes) and
sample size of 696.
The value of the area sensitivity (0.996) exceeded the established minimum value of 0.95 needed to fulfil the technical legal requirements of Regulation (EU) No 1152/201.
As mentioned earlier, EFSA investigated a worst‐case scenario using 0.76, i.e. the lowest value of the credible interval around the estimate of the test sensitivity (see Section 3.1.2.1). Also in this case, the sample size required is sufficient to satisfy the technical legal requirements (area sensitivity = 0.995075; > 0.95).
In summary, the set of data relative to the surveillance activity in 2017 ensure the fulfilment of all the technical legal requirements included in the Annex II of Regulation (EU) No 1152/2011.
3.2. Ireland
3.2.1. Information as submitted in the report by the Member State
Rectal contents from foxes were examined according to the method of Trachsel et al. (2007) referred to as PCR Cest1‐Cest2 NAD1. The DNA nucleotide sequences of primers were: Cest1 = TGCTGATTTGTTAAAGTTAGTGATC and Cest2 = CATAAATCAATGGAAACAACAACAAG. The positive control that was used was an extract of DNA from adult E. multilocularis worms which was supplied by the EU Reference Laboratory for Parasites. The negative control used was sterile saline solution.
The estimation of the test sensitivity (of 0.78) was based on the most recent advice arising from the scientific opinion by EFSA (EFSA AHAW Panel, 2015). In addition, the Irish National Reference Laboratory for Parasites is willing to participate in any test sensitivity assessment, if organised by the EU Reference Laboratory or other laboratory which could supply a large number of E. multilocularis positive samples.
In accordance with the requirements for pathogen‐specific surveillance for E. multilocularis outlined in Regulation (EU) 1152/2011, the most suitable host species to survey is a wildlife definitive host species. In Ireland, because of the occurrence of red foxes throughout the country and no known occurrence of racoon dogs (Hayden and Harrington, 2000; Marnell et al., 2009), the former was selected as the wildlife definitive host species to survey for the presence of E. multilocularis. The red fox population has been estimated to be between 150,000 and 200,000 (Hayden and Harrington, 2000; Marnell et al., 2009).
The red fox is a seasonal breeder, cubs are born in the spring and are almost fully grown by 7 months of age (Hayden and Harrington, 2000). Therefore, the age structure of the population between young and adult varies depending on the time of year. There is little published scientific evidence of the gender structure of the Irish red fox population.
The red fox is distributed throughout Ireland (Hayden and Harrington, 2000; Marnell et al., 2009). Further information about the distribution of the red fox population within Ireland has been produced in a report by Dr. Tomás Murray from the National Biodiversity Data Centre in 2015. See also Figure 7.
Figure 7.
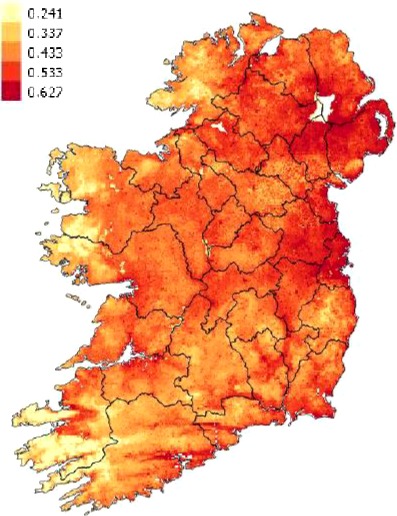
Ireland – probability of the presence per 1 km2 from the final Maxent species distribution model (Phillips et al., 2006) for red fox (Vulpes vulpes). Source: data provided by Dr. Tomás Murray, from National Biodiversity Data Centre (Ireland)
The survey was designed to detect E. multilocularis, if present, in red foxes in Ireland by taking a representative sample of the red fox population based on a DP of 0.01, a survey sensitivity of 0.95, fox population size of 150,000 and test sensitivity of 0.78.
The epidemiological unit was defined as the individual animal (the individual fox, V. vulpes).
The geographical epidemiological unit used was the same geographical area as that of the member state Ireland. The rationale for selecting this area as the geographical epidemiological unit was in order to comply with the conditions of the Regulation 1152/2011 for Member States listed in Annex I.
The animal samples were obtained from foxes which were culled (by shooting) for pest and predator control reasons and foxes that were inadvertently captured in traps set for other wildlife as part of wildlife disease control measures. Each of the 16 Regional Veterinary Offices in Ireland was requested to obtain a number of wild foxes, based on their respective area size and the fox population density to obtain a total number for that region which reflected the number calculated in the ‘Red fox (Vulpes vulpes) Species Distribution Model’ for each area. A slightly greater number than the minimum required to achieve the desired survey sensitivity for the entire survey were tested. In total, a collection of 405 samples was reported by Ireland.
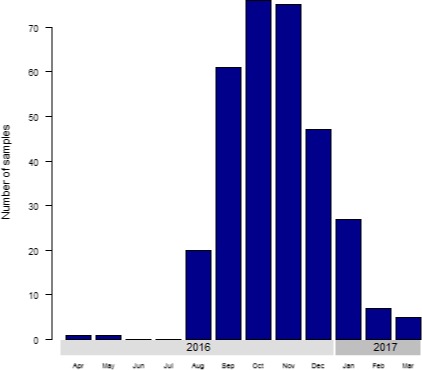
Samples were collected throughout 2016. The sampling intensity was undertaken to reflect the distribution throughout Ireland and further adjusted to reflect the geographical variation in density of fox population distribution (Figure 8). Samples were obtained during 10 months of the year with intensification during winter, at the end of the available sampling period (see Figure 9). A greater number were collected from culling during October, November and December, to avoid culling adult female foxes with fox cubs dependent on their dam to be fed. Collection of samples predominantly during the winter months should not adversely affect the sensitivity of the survey, based on a study from an endemic urban area in Switzerland, which found a greater prevalence of E. multilocularis in foxes in winter months (Hofer et al., 2000).
Figure 8.
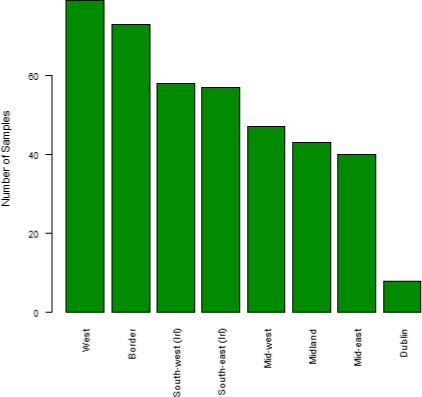
Ireland – sampling activity by regions
Figure 9.
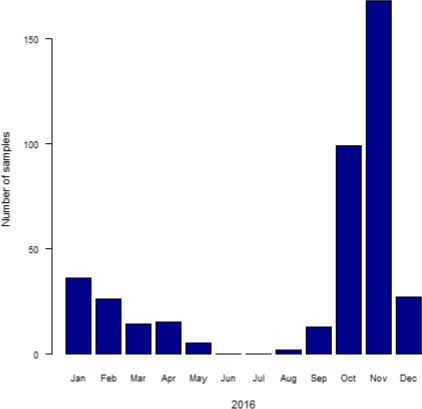
Ireland – temporal distribution of samples
All the samples tested negative for E. multilocularis using the PCR Cest1‐Cest2 NAD1 method.
3.2.2. EFSA comments and considerations
3.2.2.1. Type and sensitivity of the detection method
Type of test: The diagnostic test chosen by Ireland is well described (PCR Cest1‐Cest2 NAD1) and is based on a peer‐reviewed method with a correct reference included in the report.
Test sensitivity: In 2015, the EU Reference Laboratory in collaboration with the participating National Reference Laboratories for parasites initiated a pilot trial to supply to each participating laboratory spiked samples. Initially three samples were tested. Although The Irish National Reference Laboratory participated in the EURL ring trial in 2015, no further ring tests have been performed since then. It is accepted that the results of three samples are insufficient to determine accurately the test sensitivity of the method as used in Ireland. In the interim, Ireland followed EFSA's advice regarding the setting of the conservative, lowest value of the sensitivity (0.78).
3.2.2.2. Selection of the target population
Definition of susceptible host population target by the system: The red fox has been recognised as the main wildlife definitive host species for this parasite (EFSA AHAW Panel, 2015). The selection of this species to perform the pathogen surveillance is well explained and referenced. The absence of other important definitive wild hosts (raccoon dogs and wolfs) is also supported by scientific literature.
Regarding the age or gender of the target population, their role in the epidemiology and in the lifecycle of EM is not known due to the lack of appropriate data and studies (EFSA AHAW Panel, 2015).
Size of susceptible host population targeted by the system: Although the original information regarding the red fox population size was published in 2000 and 2009 (Hayden and Harrington, 2000; Marnell et al., 2009), Dr. Tomás Murray, of the National Biodiversity Data Centre, Ireland, specifically provided additional information regarding the Irish fox population in 2015, including more recent data on the relative population density distribution based on ongoing observation records. See also Figure 7. Nevertheless, at a population size greater than 10,000, moderate fluctuations in the population size would not significantly change the sample size required to achieve the same statistical confidence of less than 1% prevalence at a specific test sensitivity (EFSA, 2014). Therefore, fluctuations in the previous population size of 150,000 do not significantly alter the sample size required (EFSA, 2014).
3.2.2.3. Sampling strategy
Epidemiological unit: The epidemiological unit is defined in the report as the individual animal. Faeces samples were obtained post‐mortem from culled or trapped animals.
Sample size calculation: The method used to calculate the sample size for Ireland was the RIBESS tool. The sample size was calculated with: (a) overall sensitivity of 0.78 (as recommended by EFSA AHAW Panel, 2015) and (b) population size of 150,000 (red fox population). With these conditions, the minimum number of samples to collect in order to obtain a minimum of 0.95 of area sensitivity is 383.
The total number of samples collected by Ireland was 405, which ensures the fulfilment of the technical legal requirements in Regulation (EU) No 1152/2011 concerning a confidence level of at least 0.95 against a DP of 1%. Although EFSA would recommend taking into account for the population size the maximum value of the range instead of the minimum number (200,000 instead of 150,000), the minimum sample size thus calculated to achieve the same confidence would not differ significantly.
Implementation of the sampling activity: The geographical information shows that all regions were included in the sampling activity (see Figure 10). The sampling activity per 1,000 km2 shows a homogenous intensity, i.e. the target sample size is distributed across the territory as a function of the area size, adjusted for the density of the population. Such a sampling strategy, leading to a so called proportional sample, is more likely to be representative compared to other strategies.
Figure 10.
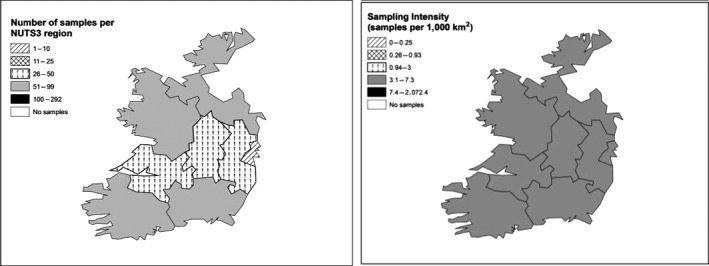
Ireland – sampling activity and intensity by NUTS 3 region
Samples were obtained during the whole year excluding June and July (see Figure 9). The reduction of collection of samples during spring and summer is justified to avoid culling adult female foxes which have fox cubs dependent on their dam to be fed. This fact might not influence the representativeness of the sample, as suggested in a previous EFSA assessment (EFSA, 2013). A sampling distribution concentrated in the second half of the year ‐in a Freedom from Disease framework‐ could be more effective than a sampling distributed across the whole year (EFSA, 2013).
3.2.2.4. Methodology
Design Prevalence: The DP was equal to 1%, as it is specified in Annex II to Regulation (EU) No 1152/2011.
Epidemiological geographical unit: The geographical unit was specified to be the entire territory of Ireland. The choice is sound as no risk factors were reported to justify the identification of sub‐areas within the Irish territory.
Methodology for calculation of the area sensitivity: The area sensitivity was estimated by Ireland using the RiBESS tool. The parameters included for the calculation were the following:
design prevalence of 1%,
test sensitivity of 0.78,
population size of 150,000 and
sample size of 405.
The value of the area sensitivity 0.958 (> 0.95) exceeded the established minimum value of 0.95 needed to fulfil the technical legal requirements described in Regulation (EU) No 1152/2011. With a population size of 200,000, the value of the area sensitivity would also reach this CL; 0.958 (> 0.95).
In summary, the set of data relative to the surveillance activity in 2017 ensures the fulfilment of the technical legal requirements included in all the paragraphs in Annex II of Regulation (EU) No 1152/2011.
3.3. Malta
3.3.1. Information as submitted in the report by the Member State
In the Maltese E. multilocularis surveillance system, the microscopy/PCR RNAsn U1 method was used to analyse faecal samples from live animals. According to the article of Mathis et al. (1996), the microscopy/PCR analytical method has a sensitivity of 94% compared to the parasitological findings after examination of the small intestines.
The initial phase in the identification of the agent was carried out at the National Veterinary Laboratory in Malta. Laboratory personnel from the National Veterinary Laboratory followed a short hands‐on training course at the Department of Infectious, Parasitic and Immunomediated Diseases of the Istituto Superiore di Sanità in Rome, Italy. The faeces samples were examined for worm eggs using the flotation and concentration method. All the worm eggs microscopically identified as Taenia spp. were then stored in 75% alcohol for further identification by PCR. The National Veterinary Laboratory in Malta is not accredited for the flotation method on faeces and the method is not yet validated.
The faeces positive for the presence of Taenia spp. eggs were sent to the Department of Infectious, Parasitic and Immunomediated Diseases of the Istituto Superiore di Sanità in Rome, Italy, for identification of Echinococcus granulosus, Echinococcus multilocularis and Taenia spp. eggs by means of multiplex‐PCR analysis.
In Malta there are no wild foxes or raccoon dogs and the only carnivore that is present is the weasel (Mustela nivalis). The population of this animal is considered to be very low and it is also worthy of note that M. nivalis is not considered to be an elite definitive host for EM. Furthermore, transmission of the disease through M. nivalis is considered to be very remote due to their nocturnal and retrieval behaviour. The presence of wildlife definitive host (V. vulpes) worldwide is described by the International Union for Conservation of Nature and Natural Resources – Species Survival Commission (SSC), which has been assessing the conservation status of species, subspecies, varieties, and even selected subpopulations on a global scale in order to highlight taxa threatened with extinction, and therefore promote their conservation (Macdonald and Reynolds, 2008). Red fox is described as a species not present in Malta as showed in the map of the distribution of the species available on IUCN website (http://www.iucnredlist.org/details/23062/0). Considering the absence of the definitive wild host population in Malta (including the island of Gozo), dogs may play a role as potential definite hosts in maintaining the life cycle of the parasite, through possible contact with the rodents. The target populations for the purpose of this study consisted of dogs (pets, hunting, rural and stray dogs): the main risk groups identified were ‘Rural’ dogs and ‘Stray dogs’.
Dog registration and micro chipping in the Maltese Islands is governed by a legal notice LN 199/2011, which obliges all dog owners to microchip and register their animals with the competent authority. The registration is undertaken and managed by the Veterinary Regulation Department.
The total number of registered dogs in 2016 was 52,229, out of which 27,033 were female and 25,196 were male. The age distribution young to adult dogs was 2,246 young dogs (≤ 2 years) and 49,983 adult dogs (> 2 years). This data was obtained from National Database used to register dogs for micro chipping.
There is no classification of the dog population into pets, hunting or rural dogs in the National Veterinary Information System where information connected to the identified dogs is registered.
Estimates of stray dogs were supplied by the six dog sanctuaries present in the Maltese islands.
Given the high population density of people in the Maltese Islands, the distribution of dogs is relatively homogeneous in Malta. Due to the small size of the island and the wide spread urbanisation, Malta can be considered as one big city. The existence of strictly rural areas is subjective due to the fact that urban areas are within very close proximity to these areas.
Considering the very small territory of the country (316 km2), and that rural areas are limited, a geographic distribution of the rural dog population was considered as not relevant for the purpose of the surveillance programme.
The surveillance followed a risk based approach through the sampling of dogs (hunting dogs, dogs in the sanctuaries and rural dogs). The sample size was set up using the software Epitool in order to detect a prevalence of 1% with LC95% within the population at risk. The estimated dog population, divided into the categories considered for the risk assessment, was the following: Pets and hunting dogs = 52,000; Rural dogs (farm dogs; known history) = 4,500; Stray dogs (sanctuary dogs; unknown history) = 2,000 for a total of 58,500 animals. The rural dog population was estimated to range between 3,500 and 4,000 considering that the number of farms present in the country are 2.061 (100 pig farms, 289 bovine, 1.672 sheep and goat farms, including those with < 3 animals). An average of two dogs for each farm was assumed. The estimation done was confirmed by information available at different NGOs operating in Malta and offering free neutering and microchipping for all dogs whose owners receive benefits, as well as for all farm, factory and hunters’ dogs. Records available at the six sanctuaries present in the country show that the stray dogs collected vary from 1,000 to 2,000 per year. Dogs in this category are identified as non‐pet animals within this surveillance programme. The sample size consisted of 333 samples, divided in 141 from stray dogs in dog sanctuaries (history unknown) and 192 from rural dogs (see Table 9).
Table 9.
Stratification of the population based on the categories identified as a function of the potential risk factors (a) and related sample size (b)
| Known history | Unknown history | ||
|---|---|---|---|
| a | |||
| Domestic petsa | 52,000 | 2,000 | 54,000 |
| Rural petsb | 4,500 | 0 | 4,500 |
| 56,500 | 2,000 | 58,500 | |
| b | |||
| Domestic petsa | 0 | 141 | 141 |
| Rural dogsb | 192 | 0 | 192 |
| 192 | 141 | 333 | |
Domestic pets: dogs kept in houses or any other facility, kept primarily for a person's company. This category includes stray dogs, in Sanctuaries which have unknown history.
Rural Dogs: dog owned by farmers and kept in farms. This category is considered as being at higher risk to be in contact with intermediate hosts.
The categories more at risk were identified as hunting dogs and rural dogs (see Table 7). The dogs held on the farms (rural dogs) could be considered at higher risk due to contact with the rodents, with particular reference to dogs present in pig and sheep farms. An unknown history (stray dogs) of the animal was considered a risk factor for the stratification of the sample, as it might indicate a possibility of having been in areas not free from the parasite or in areas with high risk. The dogs present in the sanctuaries were identified as animals with unknown history (see Table 8). All the categories considered with high risk because of their possibility of having been in contact with the intermediate host or for their possibility of having been in areas considered not free from the disease or at risk, were included in the surveillance programme, to optimise the likelihood of detection of EM (EFSA AHAW Panel, 2015).
Table 7.
Details on RR and population fraction composition based on risk factor ‘Domestic/rural environment’
| Category | Exposition to intermediate host | RR | Pop. fraction |
|---|---|---|---|
| Domestic pets | Less exposed | 1 | 0.93 |
| Rural pets | Exposed | 1.2 | 0.07 |
RR: relative risk.
Table 8.
Details on RR and population fraction composition based on risk factor ‘History’
| Category | Importation from non‐free areas | RR | Pop. fraction |
|---|---|---|---|
| Known history | Not exposed | 1 | 0.97 |
| Unknown history | Exposed | 1.2 | 0.03 |
RR: relative risk.
Sampling was carried out in two ways: samples from farms were collected by sampling teams carrying out Brucella, TB testing, Animal Welfare inspections and other on‐farm inspections, while the samples from sanctuaries/stray dogs were collected by a dedicated Echinococcus sampling team. Samples were collected from the ground. To ascertain their provenience, sampling officers sampled dogs which were kept tide up on farms, while the sampling of faeces from the sanctuaries were collected when the dogs were first admitted and thus being kept isolated.
A total of 333 samples were collected throughout 2016 (192 rural dogs and 141 stray dogs). Samples were collected in both Malta and Gozo. In Gozo, samples were collected from s localities out of the 14 localities. These localities represent the major rural areas in the island of Gozo. A dog pound is also located in one of these localities, were stray dogs from the all island of Gozo are collected. In Malta, 27 localities were sampled, across the island; the sampling area included four dog sanctuaries that collect stray dogs from all Malta. The distribution of the samples collected by locality is shown in Figure 11.
Figure 11.
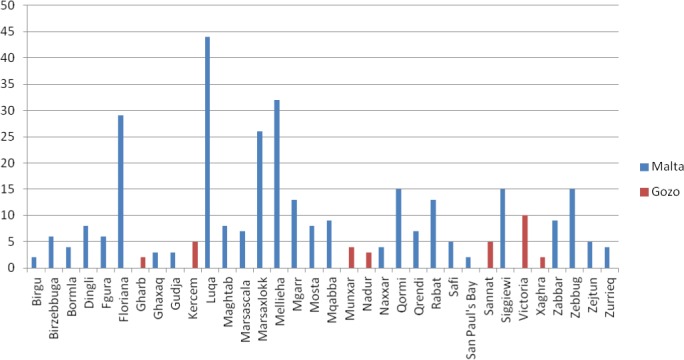
Malta – sample distribution by locality
The sampling activity was distributed over the full year (see Figure 12).
Figure 12.
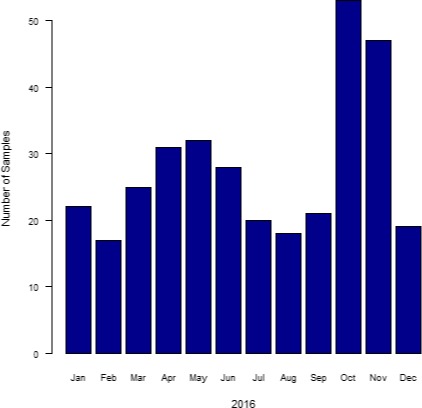
Malta – temporal distribution of samples
3.3.2. EFSA comments and considerations
3.3.2.1. Type and sensitivity of the detection method
Type of test: The method used by Malta in the surveillance of E. multilocularis (Microscopy/PCR RNAsn U1) is well described.
Test sensitivity: As mentioned before, sensitivities in diagnostic techniques may vary for many reasons. The sensitivity of the method used by Malta has been reported to range between 88% and 95.7% (Casulli et al., 2015), but lower sensitivity is also reported (50% in Conraths and Deplazes, 2015).
The paper of Mathis et al. (1996) is cited to support the choice of the test sensitivity value. In this study, the sensitivity was calculated from the simple ratio between the positive samples detected as positive (33) and the total number of positive samples (35). An exact binomial test indicates that the actual value may lie between 0.81 and 0.99 (95% CL). A Bayesian approach gives similar results (see Figure 13). Therefore, and also because the way and conditions used by Malta to perform the technique may differ from the ones used by Mathis et al., 1996; (e.g. dogs instead of foxes), sensitivity should be set to a lower value, ideally 0.78, which is the value that was recommended earlier (EFSA AHAW Panel, 2015).
Figure 13.
Malta – test sensitivity estimation based on Mathis et al. (1996)
3.3.2.2. Selection of the target population
Definition of susceptible host population target by the system: The selection of dogs as target species in order to carry on the surveillance is well described and justified. Although it is true that in the map available on the IUCN website the red fox appears absent from Malta, in the text of the website is listed as native (http://www.iucnredlist.org/details/23062/0). However, the absence of the main wild definitive hosts is supported also from other sources of information (e.g. Fauna Europaea, online: https://fauna-eu.org/cdm_dataportal/taxon/84f2e35f-eea0-4289-99c9-e6262bb0e386). Malta selected domestic dogs, due to the fact that dogs have been reported occasionally as DH, to accomplish the rules of the Annex II in the legislation in order to be listed in Annex I: ‘The pathogen‐specific surveillance programme shall consist in the ongoing collection, during the 12‐month surveillance period, of samples from wild definitive hosts or, in the case where there is evidence of the absence of wild definitive hosts in the Member State or part thereof, from domestic definitive hosts’.
Although the selection of the population is adequate (dogs in the absence of red fox), the definition of the different categories, identified within the population, appears to be a bit weak.
Size of susceptible host population targeted by the system: Dog population size is well described and has been updated since the last year. However, as discussed previously, the different categories in the classification are not always well defined and justified.
3.3.2.3. Sampling strategy
Epidemiological unit: The epidemiological unit is deduced to be the individual animal. Faeces samples were collected, presumably individually, from dogs of farms and sanctuaries (stray dogs).
Sample size calculation: The sample size of Malta was set up using the software Epitool. For a prevalence of 1% with a LC of 95%, the sample size was identified to be 333 (141 stray dogs and 192 rural dogs and pet dogs). However, taken into account EFSA's advice from 2016, which encourages to use a single random sampling method and ‐if it′s not possible to validate internally the test‐ a sensitivity of the test of 0.78, the number of samples needed will increase to 382. In this case, the 333 collected will not be sufficient to ensure the fulfilment of the technical legal requirements of Regulation (EU) No 1152/2011 regarding a confidence level of at least 0.95 against a DP of 1%.
Implementation of the sampling activity: The geographical information shows that the samples were collected from both of the NUTS 3 regions.
The sampling activity was homogeneously distributed over the full year with intensification in October and November, although the reason for this intensification is not reported. However, this fact may not affect the representativeness of the sample; a previous EFSA assessment suggested that a sampling distribution concentrated in the second half of the year ‐in a Freedom from Disease framework‐ could be more effective than a sampling distributed the whole year (EFSA, 2013).
3.3.2.4. Methodology
Design Prevalence: The DP used was equal to 1%, as it is specified in Annex II to Regulation (EU) No 1152/2011.
Epidemiological geographical unit: The whole territory of Malta (Maltese islands of Malta and Gozo) was considered as one epidemiological unit.
Methodology for calculation of the area sensitivity: The area sensitivity was estimated by Malta by three different methods:
-
under the assumption of a risk‐based sampling method considering 192 and 141 dogs at high risk and assuming a relative risk (RR) of 1.2. The parameters included for the calculation were the following: (a) DP of 1%, (b) test sensitivity of 0.94, (c) population size of 60,000 and (d) sample size of 333. The value of the area sensitivity (0.978) exceeded the established minimum value of 0.95 needed to fulfil the technical legal requirements of Regulation (EU) No 1152/2011.

-
same procedure and parameters as above but changing the value of the test sensitivity to 0.78. The value of the area sensitivity (0.957) exceeded the established minimum value of 0.95 needed to fulfil the technical legal requirements of Regulation (EU) No 1152/2011.

-
under the assumption of a random sampling method. The parameters included for the calculation were the following: (a) DP of 1%, (b) test sensitivity of 0.94, (c) population size of 60,000 and (d) sample size of 333. The value of the area sensitivity (0.957, binomial; 0.958, hypergeometric) exceeded the established minimum value of 0.95 needed to fulfil the technical legal requirements of Regulation (EU) No 1152/2011.

It should be pointed out that the choice of the RR values of 1.2 in this case is subjective and is not supported by evidence for any of the two identified risk factors. Risk‐based surveillance is considered to be the best approach from a cost/benefit perspective; however, because of the lack of scientific documentation, the RR of 1.2 can only subjectively be considered valid. This argumentation, although biologically sound, is not sufficient to justify a risk based approach.
Consequently, the assumption of a simple random sample is the safest option. Completing the set of scenarios presented by Malta, under the (i) assumption of a simple random sample, (ii) assuming a test sensitivity of 0.78 (as indicated in the Scientific Opinion on Echinococcus multilocularis infection in animals (EFSA AHAW Panel, 2015)), the area sensitivity (0.927) does not reach the required standard (49 additional tests would be required). Due to the fact that the sensitivity is taken from an experiment performed in another species and with other conditions than the one performed by Mathis et al. (1996), and that the sensitivity in this case may have changed, we strongly recommend to assume a minimum value of the test sensitivity equal to 0.78, as indicated in the Scientific opinion on E. multilocularis infection in animals (EFSA, 2015, section 3.9).
In summary, the set of data provided for the year 2016 would give adequate area sensitivity in line with the technical requirements of Regulation (EU) No 1152/2011, only if the value for the RR of 1.2 or the assumption for a test sensitivity of 0.94 (in a single random sampling) are considered valid. However, EFSA considers that, based on the available evidences, the only safe approach for the estimation of the actual confidence of a prevalence being below 1% is to assume a random sampling and a test sensitivity value of 0.78. In the latter case, Malta does not succeed in fulfilling the requirements in the relevant regulation.
3.4. The United Kingdom
3.4.1. Information as submitted in the report by the Member State
In Great Britain (GB), a PCR test (PCR Cest1‐Cest2 NAD1) was used to detect E. multilocularis DNA in rectal content (post‐mortem sampling) (Mathis et al., 1996; Dinkel et al., 1998). The method is based on the concentration of helminth eggs by a combination of sequential sieving of faecal samples and flotation of the eggs in zinc chloride solution. DNA of the taeniid eggs retained in the 20 microns sieve was obtained after alkaline lysis and nested PCR was performed using E. multilocularis species‐specific primers against the mitochondrial 12S rRNA gene. Test sensitivity for the PCR is between 85% and 99% depending on the laboratory. The sensitivity of the proposed method is further determined using spiked faecal samples and the specificity is tested with other taeniid species. In the case of the APHA/FERA laboratory, 78% sensitivity was used as the lowest possible sensitivity, based on successful ring trial participation.
In Northern Ireland (NI), a SCT test was used to detect E. multilocularis eggs from individual intestinal content (Eckert, 2003). The analyses were performed at the Agri‐Food and Biosciences Institute (AFBI). The egg counting method sensitivity is variable between laboratories, but the EFSA proposal to follow Eckert's suggestion to consider a Se of 99% to take account of potential individual errors was used (Eckert, 2003).
The red fox (V. vulpes) is the only wild definitive host for E. multilocularis in the UK (both GB and NI). No other wild definitive host is present. GB and NI are island populations with no access for other wild carnivores from other parts of Europe.
The fox population size (prebreeding adults) has been estimated at 240,000 by wildlife experts, and the numbers were published in 2013 (Defra, 2013) and has recently been modelled giving a predicted abundance as an average across several years (Croft et al., 2017) and gives a slightly lower prediction average of 230,000, but with a range of 70,000–385,000. The urban/suburban fox population is now estimated at ~ 15,000 (down from 33,000) (~ 6.5%). The variation in abundance is likely correlated with food resources, so while the density in hill areas of Scotland have been estimated at one breeding pair every 40 km2, the highest density recorded was in the urban areas of 27.6 foxes in a single km2 (http://www.lhnet.org/red-fox/; Croft et al., 2017). The rapid spread of sarcoptic mange in the red fox population and lack of geographic barriers demonstrates that there is considerable mixing of the red fox population within GB and within the island of Ireland, despite the variation in abundance. The average range of a red fox in the UK in open farm land is considered to be ~200–600 ha (2–6 km2). There is good evidence that the total abundance has not changed in the last decade (Wright et al., 2014; Croft et al., 2017) as measured on BTO survey squares (mostly rural), and as predicted. The urban fox distribution has changed in recent years with almost all urban areas now having foxes present (Scott et al., 2014). A map of systematically estimated fox distribution and abundance using NBN data and published density information and a small project using public sighting data to estimate fox abundance in all urban areas was provided (see Figure 14).
Figure 14.
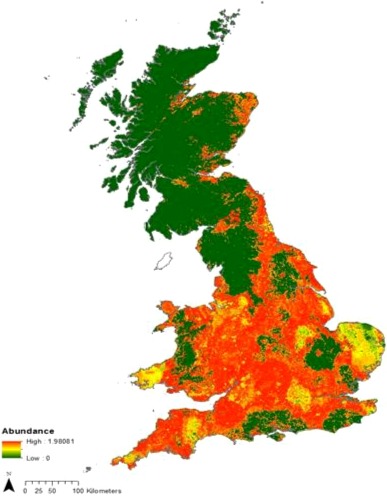
Great Britain – map estimating fox density in the UK. This is a systematic approach using NBN presence data and published density data and provides a confidence interval of 120–280,000 foxes. Some areas have few data as permission was not given to use the records. For more information, see Croft et al. (2017)
For NI, an estimate of 14,000 is given, which is equivalent of 1 fox per km2 and accounts for the large area of rural land in contrast to the urban land use (Conserve Ireland, 2009).
The epidemiological unit was the individual animal. As animal carcasses rather than fox scat were collected, the results could be reported at the individual fox level.
The UK was divided into two surveillance regions for the purpose of this report: NI and GB (England, Scotland and Wales).
The sample size was calculated using the EFSA RiBESS tool. Random sampling – not risk based ‐ sampling, is carried out at certain times of the year – the target is the wild population and therefore hunting is not permitted during the breeding season.
Wild animal carcasses were collected from hunting, road kills or research stations, therefore only an approximate location of the animal can be used. Hunters and gamekeepers who shoot foxes as part of pest population control were contracted to collect carcasses. Carcasses were delivered to field stations and frozen until sampling was undertaken. Road kills were only occasionally suitable for testing, therefore the number was low. No issues resulted in deviation from the sampling plan.
Reports were made at NUTS 3 level (the lowest level of NUTS; in GB individual counties or upper‐tier authorities, unitary authorities or districts; districts in NI). The NUTS boundaries are only rarely amended and therefore comparisons could be made from one year to the next in terms of distribution.
The map in Figure 14 shows that there is an uneven distribution of the wild host population – some areas have less dense fox populations than others – for example, the highest density is in urban areas in the south‐west of England, the least dense are rural areas in northern Scotland (see map) and that this distribution has not changed significantly in the last 10 years. This uneven distribution means sampling of animals is also uneven. GB consists of islands, surrounded by sea with no land bridges for foxes to arrive by, therefore there is a constant population (which varies during the year according to whether the females have given birth). Population size is based on numbers of breeding females. For NI, there is a single land border with another EU Member State, which is the Republic of Ireland. This border is porous for wildlife; however, Ireland also has official disease free status for E. multilocularis.
In GB, 384 samples were collected and tested. In NI, 320 samples were collected and tested. The sampling activity targeted the regions with higher fox density, according with the red fox population density map provided (See Figures 14, 15 and 16).
Figure 15.
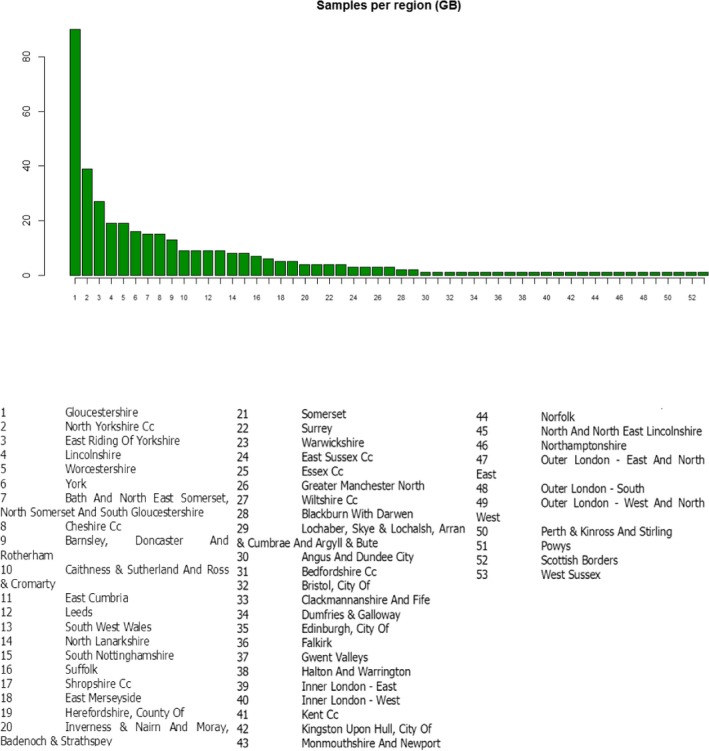
Great Britain – geographical distribution of samples
Figure 16.
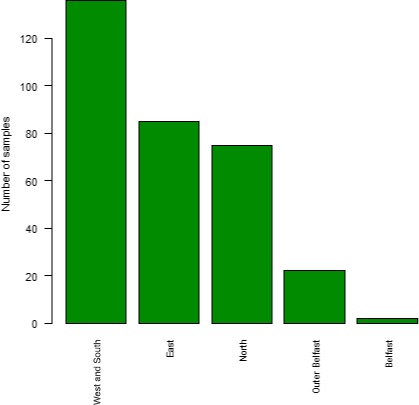
Northern Ireland – geographical distribution of samples
Sampling was carried out at certain times of the year; the target was the wild population and therefore hunting was not permitted during the breeding season (See Figures 17 and 18).
Figure 17.
Great Britain – temporal distribution of samples
Figure 18.
Northern Ireland – temporal distribution of samples from NI
3.4.2. EFSA comments and considerations
3.4.2.1. Type and sensitivity of the detection method
Type of test: Both methods used for detection of E. multilocularis in the UK were well described. GB selected a PCR Cest1‐Cest2 NAD1 test (Mathis et al., 1996; Dinkel et al., 1998) for detection of E. multilocularis in rectal content. In NI, the SCT test (Eckert, 2003), considered as the reference standard for detection of E. multilocularis eggs from individual intestinal content, was used.
Test sensitivity: The diagnostic technique used by GB has been found to range from 88% to 95.7% (Casulli et al., 2015). APHA/FERA laboratory used a sensitivity of 78% considering the lowest possible sensitivity based on successful ring trial participation. This value also corresponds with the EFSA′s recommended value of the sensitivity.
According to Casulli et al. (2015) and Conraths and Deplazes (2015), the method selected by NI (SCT) has a sensitivity of 98% and 83.8%, respectively. The analyses performed at the AFBI considered a Se of 99% (Eckert, 2003). The evidence provided to support the test sensitivity value for the SCT (Eckert, 2003) actually refers to a previous work (Hofer et al., 2000). However, the aim of the latter study was not to estimate the sensitivity of the SCT test, but rather to estimate the prevalence in the target population. Here, it is reported that no sample classified as negative by the SCT was detected positive by the intestinal scraping technique (IST), which could theoretically lead to the conclusion that the SCT has a sensitivity close to 100%, but in reality, there is no information on the real state of the sample (contaminated/not contaminated) nor is there any data on the IST technique. Therefore, the only possible conclusion is that the IST sensitivity is not higher than the one of the SCT. The almost perfect sensitivity of the SCT is actually an assumption. A safer option would be to follow the EFSA recommendation (Test Se = 0.78).
3.4.2.2. Selection of the target population
Definition of susceptible host population target by the system: The selection of red fox to perform the pathogen surveillance seems appropriate, as this species has been recognized as the main wildlife definitive host species for this parasite (EFSA AHAW Panel, 2015). Regarding the absence of other potential wild definitive hosts (raccoon dogs, wolves), the information is consistent with the report of Ireland. However, no reference has been provided.
Size of susceptible host population targeted by the system: Data of fox population size (240,000) is well documented and has been recently updated.
3.4.2.3. Sampling strategy
Epidemiological unit: For GB, the epidemiological unit (post‐mortem faecal samples from individual animals of research stations) was well defined and ensures individuality. Also for NI, where intestinal contents from hunted or road kill individual animals were sampled.
Sample size calculation: The method used to calculate the sample size of GB was the RIBESS tool. The sample size was calculated with an overall sensitivity of the diagnostic approach of 0.78 and a population size of 250,000 (red fox population). With these conditions, the minimum number of samples to collect in order to obtain a minimum of 0.95 of area sensitivity is 383. The total number of samples collected by GB was 384, which ensures the fulfilment of the technical legal requirements of Regulation (EU) No 1152/2011 regarding a confidence level of at least 0.95 against a DP of 1%.
The method used to calculate the sample size of NI was the RIBESS tool. The sample size was calculated with an overall sensitivity of the diagnostic approach of 0.99 and a population size of 14,000 (red fox population). With these conditions, the minimum number of samples to collect in order to obtain a minimum of 0.95 of area sensitivity is 298. The total number of samples collected by NI was 320. However, if a sensitivity of 0.78 is considered, as suggested by EFSA as a worse‐case scenario (EFSA, 2015), the required samples to fulfil the technical legal requirements regarding a confidence level of at least 0.95 against a DP of 1% increase to 379 (with 59 additional samples needed). As an internal validation of the test sensitivity has not been made (ideally it should be determined by each lab for the protocol used in house), a value of 0.78 should be the most suitable value in order to calculate the sample size. The sampling carried out in the Republic of Ireland, given the lack of geographical barrier between the two regions, would provide additional guarantees that NI remains disease free this year, even if a lower test sensitivity were used for the sample calculation.
Implementation of the sampling activity: The sampling process has more the characteristics of a convenience sampling, rather than a simple random sample. The difficulties in performing a simple random sampling technique; however, are well known and are broadly discussed in previous reports. See also Figure 19.
Figure 19.
United Kingdom – sampling activity and intensity by NUTS 3 region
The collection of samples was in both cases reduced during the spring–summer months and the reason for this reduction has been well justified.
3.4.2.4. Methodology
Design Prevalence: The DP used was equal to 1%, as it is specified in Annex II to Regulation (EU) No 1152/2011.
Epidemiological geographical unit: The UK was divided into two geographical epidemiological units, the whole territory of GB and NI.
Methodology for calculation of the area sensitivity:
The area sensitivity was estimated by GB using the RiBESS tool. The parameters included for the calculation were the following:
design prevalence of 1%,
test sensitivity of 0.78,
population size of 250,000 and
sample size of 384.
The value of the area sensitivity (0.9506; > 0.95) exceeded the established minimum value of 0.95 needed to fulfil the technical legal requirements included in Regulation (EU) No 1152/2011.
The area sensitivity for NI considering the following parameters:
design prevalence of 1%,
test sensitivity of 0.99,
population size of 14,000 and
sample size of 320,
With this conditions, area sensitivity was higher than 0.95 (0.96). However, if a test sensitivity of 0.78 is assumed, the area sensitivity (0.919) is not sufficient to comply with the EU regulation in force (59 additional tests would be required).
In summary, the set of data from the surveillance activity in 2016/2017 for the UK does not ensure the fulfilment of the technical legal requirements of Regulation (EU) No 1152/2011 regarding a confidence level of at least 0.95, against a DP of 1% in each of its geographical epidemiological units.
From a purely epidemiological point of view, to consider the whole island of Ireland as one epidemiological unit would be a more scientifically sound approach. Population of foxes is widespread distributed in Ireland and individual animals move freely throughout the territory without physical barriers. We performed a theoretical analysis taking into account the population of foxes of the whole territory of Ireland by means of combining the results of NI and Ireland. The global area sensitivity achieved would be 0.99, i.e. above the confidence required by the legislation.
| Component sensitivity | Overall area sensitivity | |
|---|---|---|
| EI | 0.958 | 0.996598 |
| NI | 0.919 |
3.5. Norway
3.5.1. Information as submitted in the report by Norway
In the Norwegian E. multilocularis surveillance system, a DNA‐fishing technique was used (Isaksson et al., 2014), referred to as PCR 12S rRNA, which involves magnetic capture mtDNA extraction from samples applying specific DNA hybridisation (Isaksson et al., 2014), followed by real‐time PCR (CO1rtPCR) (Øines et al., 2014). Samples are also analysed in duplicates in the detection step to increase sensitivity, and to reduce chance of errors introduced by operator. Results from samples with very low target DNA has also shown some false negative which are minimized by running detection in duplicates (Øines et al., 2014). Primers were ‘EMrtCO1F’ (5′‐TGGTATAAAGGTGTTTACTTGG‐3′), ‘EMrtCO1Rew’ (5′‐ACGTAAACAACACTATAAAAGA‐3′) and ‘Zen probe’ 5′‐56‐FAM/TCTAGTGTA/Zen/AATAAGAGTGATCCTATTTTGTGGTGGGT/3IABkFq/‐3′. Following a positive signal, samples are verified by PCR/sequencing confirmation of NAD1 (Trachsel et al., 2007) and an independent real‐time PCR (Taq PCR/12S rDNA real‐time by Isaksson et al., 2014). Test sensitivity was assumed to be at least 63% and the specificity 100% (see Øines et al., 2014 for details). Eggs/DNA extracted from whole worms (E. multilocularis provided by the EURL) and MilliQ water is included as positive and negative control, respectively.
Red fox is the target species and practically, the only wild definitive host for E. multilocularis in Norway. There are only tiny populations of wolves and artic foxes, whereas raccoon dogs are only occasionally reported. In 2017, samples from eight wolves (Canis lupus), submitted for forensic post‐mortem examination, were included in the surveillance. All tested negative for E. multilocularis.
There are no scientific studies describing the Norwegian red fox population size. However, around 21,000 red foxes are hunted annually in Norway (Statistics Norway) and in the absence of better alternatives, an updated estimated Norwegian red fox population of 151,000 (previously 70,000) was used in the surveillance programme. This updated population estimate was provided by professor emeritus Olav Hjeljord at the Norwegian University of Life Sciences and was partly based on the spatial distribution of preferred fox habitat and hunting statistics. The red fox is geographically distributed all over Norway, but the population densities during spring are (roughly estimated) varying from 1 red fox/10 km2 (mountain areas), 3 red foxes/10 km2 (forest/marsh) and 10 red foxes/10 km2 (urban/agricultural areas; e.g. Akershus, Vestfold, Østfold) (pers.com. prof. Olav Hjeljord).
EpiTools epidemiological calculators (http://epitools.ausvet.com.au/content.php?page=home), developed by AusVet Animal Health Services, was used to verify that the sample size is sufficient to claim a prevalence of not more than 1% at confidence level of at least 95%. The software use hypergeometric approximation when population size is provided. The goal was approximately 600 samples from red foxes in 2016, i.e. the epidemiological unit is the red fox.
Red fox hunters from across the country were initially invited to participate based on a list obtained from The Norwegian Register of Hunters. In addition, previously participating red fox hunters received invitation to attend the 2016 sampling season. Hunters were also recruited via the websites of the Norwegian Veterinary Institute and the Norwegian Association for Hunters and Anglers. The red foxes were all killed with firearms (shotgun or rifle), immediately followed by withdrawal of faeces from the rectum. A standard form that included information on where and when the fox had been killed, as well as the sex (male, female) and presumed age of the animal (juvenile, adult), was completed by each hunter. Faecal samples were promptly mailed individually in prepaid envelopes to the laboratory. To ensure the individuality of the samples, the hunters were also request to submit either the ear or tongue from each fox together with the corresponding faecal sample. Upon arrival at the laboratory samples were frozen at – 80°C for at least 3 days before for the analysis commenced. Sampling provided by volunteering hunters is regarded to obtain a representative sampling of the national red fox population and no other superior alternatives of sampling under the demanding, both geographical and climatic, conditions in Norway are considered feasible.
The first Swedish case of E. multilocularis was reported from a red fox found near Uddevalla in southern Sweden in late 2011. Consequently, red fox hunters in the south‐eastern part of Norway along the border with Sweden were encouraged to increase hunting and to submit samples, since one might argue that the risk of introduction of the parasite to this part of Norway via foxes might be higher than for other parts of the country. Habitat use and extent of migration of red foxes in Sweden is, however, not known. This lack of knowledge makes it complicated to assess the potential threat from Swedish foxes. The parasite is now approaching Norway (Uddevalla is about 80 km from the Norwegian border). For this reason, the sampling activity is more concentrated along the Swedish borders (performing a representative sampling, with convenience criterion).
A total of 575 samples were collected from red foxes in 2016 and all were negative in PCR.
Samples were collected throughout 2016. The spatial distribution of samples (see Figure 20) is somewhat uneven since the topography of Norway (large areas with mountains) entails scattered settlements and sampling is voluntary as performed by hunters that hunt in proximity to their homes. The temporal distribution of samples (Figure 21) is also somewhat uneven due to preferred hunting conditions during winter and banned hunting between 15 April and 15 July.
Figure 20.
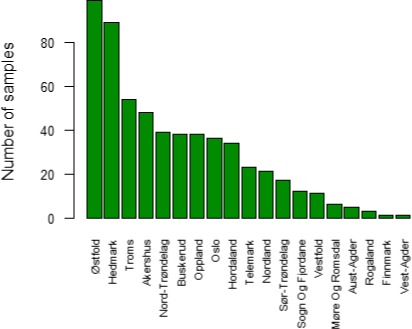
Norway – geographical distribution of samples in 2016
Figure 21.
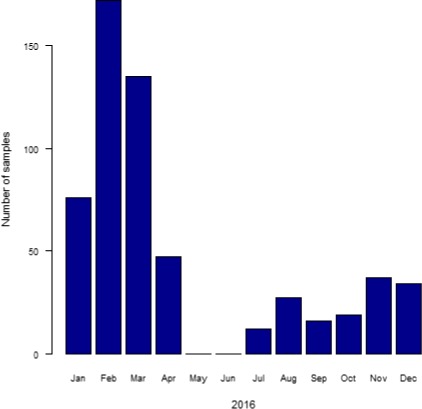
Norway – temporal distribution of samples in 2016
3.5.2. EFSA comments and considerations
3.5.2.1. Type and sensitivity of the detection method
Type of test: Norway used a DNA‐fishing technique, the PCR 12S rRNA (Isaksson et al., 2014), which is well described and appropriately referenced in the report.
Test sensitivity: The diagnostic sensitivity was set to the sensitivity obtained by Øines et al., 2014 (63%), a lower value than the minimum recommended by EFSA (0.78). Such low test sensitivity implies a much higher effort to reach the 95% of confidence stated in the legislation, as a large sample size is required. However, it has to be acknowledged that the choice of using a lower value than the one suggested by EFSA goes in a safe direction.
3.5.2.2. Selection of the target population
Definition of susceptible host population target by the system: Red fox was considered the target species for Norway, and only few numbers of wolves were also included in the surveillance. The reasons put forward by Norway to justify its decision of not include other wild definitive hosts (artic foxes and raccoon dogs) are valid. Although no references were added, apparently their population densities do not reach high numbers (environment.no, online: http://www.environment.no/topics/biodiversity/species-in-norway/threatened-species/arctic-fox-mainland-norway/; Florisson and Kreij, 2014).
Size of susceptible host population targeted by the system: In the absence of data on fox populations in Norway, the size was estimated taking into account the annual hunted foxes.
3.5.2.3. Sampling strategy
Epidemiological unit: The epidemiological unit appears in the report and is defined as the red fox. Individual rectal contents were collected directly by hunters.
Sample size calculation: EpiTools epidemiological calculators, developed by AusVet Animal Health Services, were used to verify that the sample size is sufficient to claim a prevalence of not more than 1% at a confidence level of at least 95%. Using these values, the online tool returns a target sample size equal to 475. The goal set by Norway, however, was set to approximately 600 samples to be collected from red foxes in 2016. This number of samples would be also sufficient to meet the requirements if calculated with RiBESS tool. Using this application, and considering DP of 1%, a test sensitivity of 0.63, and a population size of 151,000, the sample sized required is 474. The 575 samples collected by Norway fulfil the objectives.
Implementation of the sampling activity: Samples were collected from all the 19 Norwegian NUTS3 regions with an increase of the sampling in the south‐east of the country (Figure 22). The differences of sampling intensities among the different areas have also been justified in the report.
Figure 22.
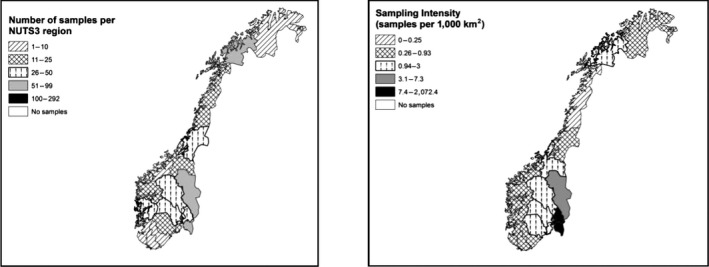
Norway ‐ Sampling activity and intensity by NUTS 3 region in 2016
Samples were collected during the whole year with a decline of the sampling during the summer season. The reasons are well justified.
3.5.2.4. Methodology
Design Prevalence: The DP was equal to 1%, as it is specified in Annex II to Regulation (EU) No 1152/2011.
Epidemiological geographical unit: The geographical unit is deduced to be the entire territory of Norway. The choice is sound as no risk factors were reported to justify the identification of sub‐areas within the Norwegian territory.
Methodology for calculation of the area sensitivity: The area sensitivity was estimated for Norway using the RiBESS tool and considering the following parameters:
design prevalence of 1%,
test sensitivity of 0.63,
population size of 151,000 and
sample size of 575,
The area sensitivity value is 0.9737 (> 0.95), which exceeds the established minimum value of 0.95 needed to fulfil the technical legal requirements of Regulation (EU) No 1152/2011.
In summary, the set of data relative to the surveillance activity in 2017 ensures the fulfilment of the technical legal requirements of all the paragraphs included in the Annex II of Regulation (EU) No 1152/2011.
4. Conclusions
E. multilocularis was not detected in any of the samples from the five territories collected in 2016.
All of the territories participating in this surveillance (Finland, the UK, Norway, Malta and Ireland) fulfil the technical legal requirements regarding the use of appropriate techniques for the detection of E. multilocularis in intestinal contents or faeces (Annex II – paragraph 3 of Regulation (EU) No 1152/2011). Each of them uses different methods for detection of the parasite as described in the report. In addition, sensitivity (and specificity) values of the techniques have been indicated.
All of the territories participating in this surveillance (Finland, the UK, Norway, Malta and Ireland) fulfil the technical legal requirements regarding the collection of samples from wild definitive hosts or domestic definitive host in the absence of the first (Annex II – paragraph 3 of Regulation (EU) No 1152/2011). Four of the countries selected adequate wild definitive hosts in order to perform the surveillance (Finland, the UK, Norway and Ireland). Malta, in the absence of wild animals that could act as definitive hosts, selected dogs to perform the surveillance.
All of the territories participating in this surveillance (Finland, the UK, Norway, Malta and Ireland) fulfil the technical legal requirements concerning an appropriate sampling for detection of the E. multilocularis parasite, if present in any part of the Member State, at the DP of less than 1% (Annex II – paragraph 2 of Regulation (EU) No 1152/2011). However, in the case of Malta, if the EFSA advice of using a 0.78 of test sensitivity (under the assumption of a random sampling method) is taken into account, the number of samples is not sufficient to ensure a confidence level of at least 0.95 against a DP of 1%.
Although the surveillance strategies performed by Finland, the UK, Norway and Ireland cannot be considered 'a surveillance strategy based on a simple random sample′, in the case of wildlife animals, convenience sampling is the method most frequently used. Also, obtaining representative samples from wildlife populations is often hampered by the lack of precise knowledge on the distribution of wild host populations (EFSA, 2015), although some countries demonstrated to have those estimates, combining sampling activity results and modelling.
All of the territories participating in this surveillance (Finland, the UK, Norway, Malta and Ireland) fulfil the technical legal requirements regarding the 12‐month surveillance period collection (Annex II – paragraph 3 of Regulation (EU) No 1152/2011). In general, the lower number of wild animals samples during spring and summer was well justified and historical data show that this lower number does not compromise the success of the detection of the parasite.
All of the territories participating in this surveillance (Finland, the UK, Norway, Malta and Ireland) fulfil the technical legal requirements regarding the confidence level of at least 0.95 against a DP of 1% (Annex II – paragraph 1 of Regulation (EU) No 1152/2011). However, as mentioned previously, taking into account EFSA recommendation of using a test sensitivity of 0.78 (under the assumption of a random sampling method), size of the samples from Malta and NI should increase in order to achieve the confidence level of at least 0.95 against a DP of 1% as described in the Regulation.
5. Recommendations
Studies to improve the knowledge on epidemiological risk factors, including geographical risk factors, should be encouraged to enable well‐founded risk‐based sampling in geographical subpopulations of hosts to improve the detection (EFSA, 2015). At the moment, a risk‐based approach is legally accepted and theoretically applicable. However, in practice, is extremely difficult to carry out because even if relevant relative risk values may be found in scientific literature they may not apply to and are not validated for the country and populations in question. EFSA, for the time being, does not recommend the implementation of a risk‐based approach.
A study should be undertaken to estimate the probability of each relevant test to detect infection, given that the animal is truly infected (according to the definition of test sensitivity), using an adequate sample of specimens from endemic areas where the entire range of different infection stages and intensities are represented. Such exercise has been conducted over time, e.g. by Finland, which performed additional internal testing on spiked samples, reducing the uncertainty around the estimate of the diagnostic test sensitivity. Such studies should follow the OIE Terrestrial Manual, Chapter 1.1.5 (OIE, 2017), and could be coordinated by the EURL for Parasites (EFSA, 2015).
Until better documentation is available or as an alternative, for future surveys the diagnostic sensitivity should be set conservatively to the lowest value, excluding the lowest 20th percentile, from the ones reported in the scientific literature and related to the diagnostic tests implemented by the countries listed under Commission Delegated Regulation (EU) No 1152/2011. In this case, the suggested value to be used for future surveys is 78% (EFSA, 2015). On the other hand, if evidences underpin higher values (i.e. following internal validation) those can be used for the estimation of the sample size and/or for the estimation of the area sensitivity.
The RiBESS tool is now available on‐line at the following address: https://shiny-efsa.openanalytics.eu/login. All features present in the first application are of course covered by the new one and more options are available. EFSA would like to highlight that the tool is free and can be used for any purpose related to surveillance activities as far as it is acknowledged and referenced. In addition, the subscription gives access to other online tools of scientific relevance. EFSA does not recommend to use the old version anymore, which is no more supported.
Glossary and Abbreviations
- Alveolar echinococcosis (AE)
The human disease caused by infection with the larval stage (metacestode) of E. multilocularis. It is characterised by infiltrative, tumour‐like growth, initially in the liver, potentially causing high fatality rates
- EFSA Data Collection Framework (DCF)
The EFSA web interface accessible by most common web browsers through which data providers can submit their files. The system provides automatic feedback on errors in structure and content, and confirmation of successful submissions
- Enzyme‐linked immunosorbent assay (ELISA)
The test that applies the immunological concept of an antigen binding to its specific antibody, which allows detection of very small quantities of antigens such as proteins, peptides, hormones or antibody in a fluid sample, utilising enzyme‐labelled antibodies or antigens and a chromogenic substrate for the enzyme to detect the target molecules
- NUTS
The Nomenclature of Territorial Units for Statistics (NUTS), or in French Nomenclature Unités Territoriales Statistiques, is a geocode standard for referencing the administrative divisions of countries for statistical purposes. The standard was developed by the European Union and subdivides the territory of the European Union into regions at three different levels (NUTS 1, 2 and 3, moving from larger to smaller territorial units (see also http://epp.eurostat.ec.europa.eu/statistics_explained/index.php/Glossary:NUTS)
- Odds Ratio (OR)
The ratio of the odds of an event occurring in one group to the odds of it occurring in another group. It estimates the probability of the event given exposure to a specific factor by measuring the probability of exposure given the presence of the event
- Risk based Estimate of System sensitivity and Sample size (RiBESS) tool
The Microsoft Excel‐based tool developed by EFSA for the calculation of the sample size needed to substantiate the absence of a given disease and/or to calculate the survey sensitivity (confidence) once the samples have been collected
- Sedimentation and counting technique (SCT)
The technique for the quantitative assessment of the E. multilocularis burden of foxes or other definitive hosts, where intestinal material is washed and sedimented several times and the resulting sediment is examined under a stereomicroscope for the presence of the parasite
- AFBI
Agri‐Food and Biosciences Institute
- ALPHA
Animal and Plant Health Unit
- ASe
area sensitivity
- DALYs
disability‐adjusted life‐years
- DCF
EFSA Data Collection Framework
- DH
Definitive Host
- DP
design prevalence
- EFTA
European Free Trade Association
- EM
Echinococcus multilocularis
- Evira
Finnish Food Safety Authority
- GB
Great Britain (including England, Wales and Scotland)
- IH
intermediate host
- IST
intestinal scraping technique
- N
Target population size
- NI
Northern Ireland
- OR
odds ratio
- PCR
polymerase chain reaction
- RR
relative risk
- Se
sensitivity
- Sp
specificity
- SSC
Species Survival Commission
- SSe
system sensitivity
- ToR
Terms of Reference
- TSe
test sensitivity
- UK
United Kingdom (including Great Britain and Northern Ireland)
Appendix A – Assessment tables for the surveillance report of Finland
Table A.1.
Assessment of the description of the surveillance system (Finland – Part I of surveillance report) for a representative sample survey
| Points addresses in Annex II | Element | Description of element | Information provided in surveillance report | Comments |
|---|---|---|---|---|
| Type and sensitivity of the detection method | Type of test | The diagnostic test used for the detection of EM must be defined. Modifications of the original method should be indicated |
|
Technique well described. A slight modification has been realised and it is indicated in the report |
| Test sensitivity | The sensitivity and specificity of the test used in the surveillance system must be reported. This would ideally be estimates from each participating laboratory reported as a point estimate (average) of the values across the country with minimum and maximum values or a probability distribution. Alternatively, a value of 0.78, as recommended by EFSA (2015), shall be used |
|
An exact binomial test indicates that the actual value may lie between 0.76 and 0.87 (95% CL). A Bayesian approach gives similar results. Therefore, the lowest value (0.76) may be the safest choice for estimating the overall system sensitivity considering a worst‐case scenario | |
| Selection of the target population | Definition of susceptible host population targeted by the system | The susceptible wild definitive host population(s) targeted by the surveillance system should be described and the choice justified. If domestic host species are sampled, evidence for the absence of wild definitive hosts and for these domestic animals having had access to outdoors should be provided |
|
The selection of racoon dogs and red fox species as target populations was based on their role as definitive hosts in the cycle; assumption also confirmed by the EFSA Scientific opinion on E. multilocularis infection in animals (EFSA AHAW Panel, 2015) Regarding age or gender composition of the target population, it is not possible to conclude their role in the epidemiology and in the lifecycle of EM, due to lack of appropriate data and studies (EFSA AHAW Panel, 2015) |
| Size of susceptible host population targeted by the system | The size of the targeted (wildlife) population should be reported, together with the evidence for this. Historical population data should be updated since these may not reflect current populations |
|
Although population data have not been updated since 2007, new information regarding annual hunting bags has been included in the report. The decision to accept the size of the population as published by Kauhala is scientifically sound, considering that the sample size calculation is not heavily affected when the population size has large dimensions (see EFSA AHAW Panel, 2015). The fact of considering the sum of the red fox and raccoon dog populations as the target population size seems to be correct, as raccoon dogs can act as DHs in conjunction with the red fox (EFSA AHAW Panel, 2015) | |
| Sampling strategy | Epidemiological unit | It should be clearly defined if individual animals or individual faeces samples collected from the environment constitute the epidemiological unit. If individual faeces samples are collected from the environment, the method applied to establish the species from which the faeces originated has to be reported |
|
The epidemiological unit appears in the report and is defined as the individual animal. Individual rectal contents were collected directly by hunters |
| Sample size calculation | The applied survey design should be fully documented, including considerations regarding potential biases inherent in the survey design. The method and the formula used to calculate the sample size should be fully documented |
The required sample size has been calculated using the RiBESS tool with the following parameters:
The sample size was estimated as being 383 (both binomial and hypergeometric) |
Due to the results that were obtained in the estimation of the test sensitivity (see test sensitivity), EFSA investigated a worst‐case scenario using a test sensitivity of 0.76. The sample size required in this case is 393. In both cases, the sample size collected (N = 696) is sufficient to fulfil the technical legal requirements | |
| Implementation of the sampling activity | The sampling methods used should be fully documented including the related assumptions and uncertainties, and a justification for choosing the approach should be provided. Timeframe of the surveillance data and geographical clustering of the infection must to be reported. The sample collection period must comprise the whole year and the spatial distribution of the sampling must be homogeneous |
|
The geographical information shows that 15 out of 20 NUTS3 regions were included in the sampling activity. There was a higher intensity of the sampling in the south‐east of the country The surveillance strategy as described in the Finnish report cannot be considered a simple random sample, as claimed. Most of the samples were collected by hunters and efforts were concentrated the south east of the country. However, in the case of wildlife animals, convenience sampling is the most frequently used method. To mitigate the potential bias caused by this sampling activity, more samples than required were collected Samples were collected during a period of 12 months as established in the relevant Regulation. The reduction of the intensity of the sampling during the summer months (May, June and July) is well justified and may not compromise the success of the detection of the parasite. A previous EFSA assessment suggested that a sampling distribution concentrated in the second half of the year – in a Freedom from Disease framework – could be more effective than a sampling distributed over the whole year; but a quantitative evaluation was not performed (EFSA Scientific Report, 2013) |
|
| Methodology | Design prevalence (DP) | DP is specified in Annex II to Regulation (EU) No 1152/2011 and must be 1% or lower | DP = 0.01 (1%) | |
| Geographical epidemiologic unit | The geographic epidemiological unit(s) identified as target for the surveillance activity has to be clearly indicated and supported by justification | The whole territory of Finland was considered as one epidemiological unit | The geographical unit was specified to be the entire territory of Finland. The choice is sound as no risk factors were reported to justify the identification of subareas within the Finnish territory | |
| Methodology for calculation of area sensitivity | For the calculation of the area sensitivity, the diagnostic sensitivity should be set conservatively to the lowest value, excluding the lowest 20th percentile, from the ones reported in the scientific literature and related to the diagnostic tests implemented by the countries listed in Annex I of the Commission Delegated Regulation (EU) No 1152/2011. In this case, is 78% (EFSA AHAW Panel, 2015) |
The system sensitivity was calculated by Finland using an overall sensitivity of the diagnostic approach of 0.78 and the design prevalence of 1% prescribed in Regulation (EU) No 1152/2011 using the RiBESS tool SYSTEM SENSITIVITY CALCULATION DP = 0.01 TSe = 0.78 sample size for 2016 n = 696 The obtained system sensitivity was 0.996 (both binomial and hypergeometric) |
As mentioned earlier, EFSA investigated a worst‐case scenario using 0.76, i.e. the lowest value of the credible interval around the estimate of the test sensitivity (see Section 3.1.2.1). Also in this case, the sample size required is sufficient to satisfy the technical legal requirements (area sensitivity = 0.995075; > 0.95) |
Table A.2.
Descriptive statistics for a representative survey (Finland ‐ Part II of surveillance report)
| Parameter | Evidence | Action | |
|---|---|---|---|
| 1 | Theoretical sampling period | From 1 January 2016 to 31 December 2016 | – |
| 2 | Actual sampling period | From January 2016 to December 2016 | Exact sampling date not reported. Report, if possible |
| 3 | Summary dates | Exact sampling date not reported. Report, if possible | |
| 4 | Sampling period | – | |
| 5 | Number of samples | 696 | – |
| 6 | Number of test results | 696 PCR 12S rRNA | – |
| 7 | Laboratory test completion |
695 results in 2016 1 results in 2017 |
– |
| 8 | Sensitivity | 0.78 | – |
| 9 | Host | 230 Vulpes vulpes; 466 Nyctereutes procyonoides | – |
| 10 | Animal sample | 696 individual rectal content | – |
| 11 | Sampling strategy and design | Objective sampling – simple random sample 696 | – |
| 12 | Sampling point | 696 hunting | – |
Appendix B – Assessment tables for the surveillance report of Ireland
Table B.1.
Assessment of the description of the surveillance system (Ireland – Part I of surveillance report) for a representative sample survey
| Points addresses in Annex II | Element | Description of element | Information provided in surveillance report | Comments |
|---|---|---|---|---|
| Type and sensitivity of the detection method | Type of test | The diagnostic test used for the detection of EM must be defined. Modifications of the original method should be indicated |
|
The diagnostic test chosen by Ireland is well described (PCR Cest1‐Cest2 NAD1) and a reference for this peer‐reviewed published method is provided |
| Test sensitivity | The sensitivity and specificity of the test used in the surveillance system must be reported. This would ideally be estimates from each participating laboratory reported as a point estimate (average) of the values across the country with minimum and maximum values or a probability distribution. Alternatively, a value of 0.78, as recommended by EFSA (2015), shall be used |
Test Se = 0.78 (78%) (based on EFSA AHAW Panel, 2015)
|
Ireland followed EFSA's advice regarding the setting of at least the conservative lowest value of the sensitivity (0.78) | |
| Selection of the target population | Definition of susceptible host population targeted by the system | The susceptible wild definitive host population(s) targeted by the surveillance system should be described and the choice justified. If domestic host species are sampled, evidence for the absence of wild definitive hosts and for these domestic animals having had access to outdoors should be provided |
|
Red fox has been recognised as the main wildlife definitive host species for this parasite (EFSA AHAW Panel, 2015). The selection of this species to perform the pathogen surveillance is well explained and referenced. The absence of other important definitive wild hosts is also supported by scientific literature Regarding age or gender of the target population, their role in the epidemiology and in the lifecycle of EM is not known due to the lack of appropriate data and studies (EFSA AHAW Panel, 2015) |
| Size of susceptible host population targeted by the system | The size of the targeted (wildlife) population should be reported, together with the evidence for this. Historical population data should be updated since these may not reflect current populations | Although the original information regarding the red fox population size was published in 2000 and 2009 (Hayden and Harrington, 2000; Marnell et al., 2009), Dr. Tomás Murray (National Biodiversity Data Centre), Ireland, provided additional information in 2015. Nevertheless, at a population size greater than 10,000, moderate fluctuations in the population size would not significantly change the sample size required to achieve the same statistical confidence of less than 1% prevalence at a specific test sensitivity (EFSA, 2014). Therefore, fluctuations in the previous population size of 150,000 do not significantly alter the sample size required (EFSA, 2014) | ||
| Sampling strategy | Epidemiological unit | It should be clearly defined if individual animals or individual faeces samples collected from the environment constitute the epidemiological unit. If individual faeces samples are collected from the environment, the method applied to establish the species from which the faeces originated has to be reported | The epidemiological unit was defined as the individual animal (the individual fox (Vulpes vulpes)) | The epidemiological unit is defined in the report as the individual animal. Faeces samples were obtained post‐mortem from culled or trapped animals |
| Sample size calculation | The applied survey design should be fully documented, including considerations regarding potential biases inherent in the survey design. The method and the formula used to calculate the sample size should be fully documented |
The required sample size has been calculated using the RiBESS tool with the following parameters:
The sample size was estimated as being 383 |
The total number of samples collected by Ireland was 405, which ensures the fulfilment of the technical legal requirements in Regulation (EU) No 1152/2011 concerning a confidence level of at least 0.95 against a design prevalence of 1% | |
| Implementation of the sampling activity | The sampling methods used should be fully documented including the related assumptions and uncertainties, and a justification for choosing the approach should be provided. Timeframe of the surveillance data and geographical clustering of the infection must to be reported. The sample collection period must comprise the whole year and the spatial distribution of the sampling must be homogeneous. |
|
All regions were included in the sampling activity. The sampling activity per 1,000 km2 shows a homogenous intensity, i.e. the target sample size is distributed across the territory as a function of the area size, adjusted for the density of the population. Such a sampling strategy, leading to a so called proportional sample, is more likely to be representative compared to other strategies Samples were obtained during the whole year excluding June and July. The reduction of collection of samples during spring and summer is justified. This fact might not influence the representativeness of the sample, as suggested in a previous EFSA assessment (EFSA, 2013). A sampling distribution concentrated in the second half of the year ‐in a Freedom from Disease framework‐ could be more effective than a sampling distributed across the whole year (EFSA, 2013) |
|
| Methodology | Design prevalence (DP) | DP is specified in Annex II to Regulation (EU) No 1152/2011 and must be 1% or lower | DP = 0.01 (1%) | |
| Geographical epidemiologic unit | The geographic epidemiological unit(s) identified as target for the surveillance activity has to be clearly indicated and supported by justification | The whole territory of Ireland was considered as one epidemiological unit | The geographical unit was specified to be the entire territory of Ireland. The choice is sound as no risk factors were reported to justify the identification of subareas within the Irish territory | |
| Methodology for calculation of area sensitivity | For the calculation of the area sensitivity, the diagnostic sensitivity should be set conservatively to the lowest value, excluding the lowest 20th percentile, from the ones reported in the scientific literature and related to the diagnostic tests implemented by the countries listed in Annex I of the Commission Delegated Regulation (EU) No 1152/2011. In this case, is 78% (EFSA AHAW Panel, 2015) |
SYSTEM SENSITIVITY CALCULATION DP = 0.01 TSe = 0.78 sample size for 2016 n = 405 The obtained system sensitivity was 0.959 |
The area sensitivity was estimated by Ireland using the RiBESS tool. The parameters included for the calculation were the following: (a) design prevalence of 1%, (b) test sensitivity of 0.78, (c) population size of 150,000 and (d) sample size of 405. The value of the area sensitivity 0.958 (> 0.95) exceeded the established minimum value of 0.95 needed to fulfil the technical legal requirements. With a population size of 20,000, the value of the area sensitivity would also reach this IC; 0.958 (> 0.95) |
Table B.2.
Descriptive statistics for a representative survey (Ireland ‐ Part II of surveillance report)
| Parameter | Evidence | Action | |
|---|---|---|---|
| 1 | Theoretical sampling period | From 1 January 2016 to 31 December 2016 | – |
| 2 | Actual sampling period | From 3 January 2016 to 13 December 2016 | – |
| 3 | Summary dates |
Min: ‘2016‐01‐03’ 1st Qu. ‘2016‐09‐20’ Median ‘2016‐10‐27’ Mean ‘2016‐09‐03’ 3rd Qu. ‘2016‐11‐14’ Max. ‘2016‐12‐13’ |
– |
| 4 | Sampling period | 345 days | – |
| 5 | Number of samples | 405 | – |
| 6 | Number of test results | 405 PCR Cest1‐Cest2 NAD1 | – |
| 7 | Laboratory test completion |
210 results in 2016 195 results in 2017 |
– |
| 8 | Sensitivity | 0.78 | – |
| 9 | Host | 405 Vulpes vulpes | – |
| 10 | Animal sample | 405 faeces post‐mortem | – |
| 11 | Sampling strategy and design | Objective sampling – Simple random sample 405 | – |
| 12 | Sampling point | 289 from hunting; 116 wildlife research station | – |
Appendix C – Assessment tables for the surveillance report of Malta
Table C.1.
Assessment of the description of the surveillance system (Malta – Part I of surveillance report) for a representative sample survey
| Points addresses in Annex II | Element | Description of Element | Information provided in surveillance report | Comments |
|---|---|---|---|---|
| Type and sensitivity of the detection method | Type of test | The diagnostic test used for the detection of EM must be defined. Modifications of the original method should be indicated |
|
The method used by Malta in the surveillance of E. multilocularis (microscopy/PCR RNAsn U1) is well described |
| Test sensitivity | The sensitivity and specificity of the test used in the surveillance system must be reported. This would ideally be estimates from each participating laboratory reported as a point estimate (average) of the values across the country with minimum and maximum values or a probability distribution. Alternatively, a value of 0.78, as recommended by EFSA (2015), shall be used |
Test Se = 0.94 (94%)
|
The paper of Mathis et al. (1996) is cited to support the choice of the test sensitivity value. An exact binomial test indicates that the actual value may lie between 0.81 and 0.99 (95% CL). A Bayesian approach gives similar results. Therefore, and also because the way and conditions used by Malta to perform the technique may differ from the ones used by Mathis et al. (1996) (e.g. dogs instead of foxes), sensitivity should be set to a lower value, ideally 0.78, which is the value that was recommended in the scientific opinion published in 2015 by EFSA (EFSA AHAW Panel, 2015) | |
| Selection of the target population | Definition of susceptible host population targeted by the system | The susceptible wild definitive host population(s) targeted by the surveillance system should be described and the choice justified. If domestic host species are sampled, evidence for the absence of wild definitive hosts and for these domestic animals having had access to outdoors should be provided |
|
The selection of dogs as target species in order to carry on the surveillance is well described and justified. Although it is true that in the map available on the IUCN website the red fox appears absent from Malta, in the text of the website is listed as native. However, the absence of the main wild definitive hosts is supported also from other sources of information (e.g. https://fauna-eu.org/). Malta selected domestic dogs, due to the fact that dogs have been reported occasionally as DH, to accomplish the rules of the Annex II in the legislation in order to be listed in Annex I: 'The pathogen‐specific surveillance programme shall consist in the ongoing collection, during the 12‐month surveillance period, of samples from wild definitive hosts or, in the case where there is evidence of the absence of wild definitive hosts in the Member State or part thereof, from domestic definitive hosts′ Although the selection of the population is adequate, the different categories within the population in order to perform a risk‐based sampling method are confusing and must be clarified. The targeted population is supposed to be composed by pets, hunting, rural and sanctuaries dogs, but some sentences in the document seem contradictory, e.g. 'the main risk groups identified were rural dogs and stray dogs′ with 'the categories more at risk were identified as hunting dogs and rural dogs′. In addition, during the analysis and stratification of the samples different names have been used. Furthermore, it is also state that: 'The sample size consisted of 333 samples, divided in 141 from stray dogs in dog sanctuaries (history unknown) and 192 from rural and pet dogs′ |
| Size of susceptible host population targeted by the system | The size of the targeted (wildlife) population should be reported, together with the evidence for this. Historical population data should be updated since these may not reflect current populations |
|
Dog population size is well described and has been updated since the last year. However, as discussed previously, the identification and the definition of the categories within the population appears to be somehow artificial | |
| Sampling strategy | Epidemiological unit | It should be clearly defined if individual animals or individual faeces samples collected from the environment constitute the epidemiological unit. If individual faeces samples are collected from the environment, the method applied to establish the species from which the faeces originated has to be reported | The epidemiological unit is deduced to be the individual animal. Faeces samples were collected presumably individually from dogs of farms and sanctuaries (stray dogs) | |
| Sample size calculation | The applied survey design should be fully documented, including considerations regarding potential biases inherent in the survey design. The method and the formula used to calculate the sample size should be fully documented |
|
Taken into account EFSA's advice from 2015, which encourages to use ‐if it′s not possible to validate internally the test‐ a sensitivity of the method of 0.78, the number of samples needed will increase to 382. In this case, the 333 collected will not be sufficient to ensure the fulfilment of the technical legal requirements of Regulation (EU) No 1152/2011 regarding a confidence level of at least 0.95 against a design prevalence of 1% | |
| Implementation of the sampling activity | The sampling methods used should be fully documented including the related assumptions and uncertainties, and a justification for choosing the approach should be provided. Timeframe of the surveillance data and geographical clustering of the infection must to be reported. The sample collection period must comprise the whole year and the spatial distribution of the sampling must be homogeneous |
|
The geographical information shows that the samples were collected from both of the NUTS 3 regionsThe sampling activity was homogeneously distributed over the full year with intensification in October and November, although the reason for this intensification is not reported. However, this fact may not affect the representativeness of the sample; a previous EFSA assessment suggested that a sampling distribution concentrated in the second half of the year – in a Freedom from Disease framework‐ could be more effective than a sampling distributed the whole year (EFSA Scientific Report, 2013) | |
| Methodology | Design prevalence (DP) | DP is specified in Annex II to Regulation (EU) No 1152/2011 and must be 1% or lower | DP = 0.01 (1%) | |
| Geographical epidemiologic unit | The geographic epidemiological unit(s) identified as target for the surveillance activity has to be clearly indicated and supported by justification | The whole territory of Malta (Maltese islands of Malta and Gozo) was considered as one epidemiological unit | The geographical unit was specified to be the entire territory of Malta | |
| Methodology for calculation of area sensitivity | For the calculation of the area sensitivity, the diagnostic sensitivity should be set conservatively to the lowest value, excluding the lowest 20th percentile, from the ones reported in the scientific literature and related to the diagnostic tests implemented by the countries listed in Annex I of the Commission Delegated Regulation (EU) No 1152/2011. In this case, is 78% (EFSA AHAW Panel, 2015) |
The area sensitivity was estimated by Malta by three different methods: i) under the assumption of a risk based sampling considering 192 and 141 dogs at high risk and assuming a Relative Risk of 1.2. The parameters included for the calculation were the following:
The obtained system sensitivity was 0.978 ii) under the assumption of a risk based sampling considering 192 and 141 dogs at high risk and assuming a Relative Risk of 1.2. The parameters included for the calculation were the following:
The obtained system sensitivity was 0.957 iii) under the assumption of a random sampling method. The parameters included for the calculation were the following:
The obtained system sensitivity was 0.957 (binomial) and 0.958 (hypergeometric) |
It should be pointed out that the choice of the RR values of 1.2 in this case is subjective and is not supported by evidence for any of the two identified risk factors. Risk based surveillance is considered to be the best approach from a cost/benefit perspective, however, because of the lack of scientific documentation, the RR of 1.2 can only subjectively be considered valid. This argumentation, however, is not sufficient to justify a risk based approach Moreover, if the test is assumed to be 0.78 (using a random sampling method), as indicated in the Scientific Opinion on E. multilocularis infection in animals (EFSA AHAW Panel, 2015)), the area sensitivity (0.927;< 0.95) does not reach the required standard (49 additional tests would be required). Due to the fact that the sensitivity is taken from an experiment performed in another species and with other conditions than the one perform by Mathis et al. (1996), and that the sensitivity in this case may have changed, we strongly recommend to assume a minimum value of the test sensitivity equal to 0.78, as indicated in the Scientific opinion on E. multilocularis infection in animals (EFSA, 2015, section 3.9 |
Table C.2.
Descriptive statistics for a representative survey (Malta – Part II of surveillance report)
| Parameter | Evidence | Action | |
|---|---|---|---|
| 1 | Theoretical sampling period | From 1 January 2016 to 31 December 2016 | – |
| 2 | Actual SAMPLING Period | From January 2016 to December 2016 | Exact sampling date not reported. Report, if possible |
| 3 | Summary dates | Exact sampling date not reported. Report, if possible | |
| 4 | Sampling period | – | |
| 5 | Number of samples | 333 | – |
| 6 | Number of test results | 333 microscopy/PCR RNAsn U1 | – |
| 7 | Laboratory test completion | All test results were reported in 2016. | – |
| 8 | Sensitivity | 0.94 | – |
| 9 | Host | 192; 141 Canis lupus familiaris | – |
| 10 | Animal sample | 333 faeces from live animal | – |
| 11 | Sampling strategy and design | Selective sampling – risk Based Surveillance 333 | – |
| 12 | Sampling point | 333 veterinary activities | – |
Appendix D – Assessment tables for the surveillance report of the United Kingdom
Table D.1.
Assessment of the description of the surveillance system (Great Britain – Part I of surveillance report) for a representative sample survey
| Points addresses in Annex II | Element | Description of element | Information provided in surveillance report | Comments |
|---|---|---|---|---|
| Type and sensitivity of the detection method | Type of test | The diagnostic test used for the detection of EM must be defined. Modifications of the original method should be indicated |
|
The method used for detection of E. multilocularis in GB was well described and cited |
| Test sensitivity | The sensitivity and specificity of the test used in the surveillance system must be reported. This would ideally be estimates from each participating laboratory reported as a point estimate (average) of the values across the country with minimum and maximum values or a probability distribution. Alternatively, a value of 0.78, as recommended by EFSA (2015), shall be used |
|
APHA/FERA laboratory used a sensitivity of 78% considering the lowest possible sensitivity based on successful ring trial participation. This value also corresponds with the EFSA's recommended value of the sensitivity | |
| Selection of the target population | Definition of susceptible host population targeted by the system | The susceptible wild definitive host population(s) targeted by the surveillance system should be described and the choice justified. If domestic host species are sampled, evidence for the absence of wild definitive hosts and for these domestic animals having had access to outdoors should be provided |
|
The selection of red fox to perform the pathogen surveillance seems appropriate, as this species has been recognized as the main wildlife definitive host species for this parasite (EFSA AHAW Panel, 2015). Regarding the absence of other potential wild definitive hosts (raccoon dogs, wolves) the information is consistent with the report of Ireland. However, no reference has been provided |
| Size of susceptible host population targeted by the system | The size of the targeted (wildlife) population should be reported, together with the evidence for this. Historical population data should be updated since these may not reflect current populations |
|
Data of fox population size (240,000) is well documented and has been recently updated | |
| Sampling strategy | Epidemiological unit | It should be clearly defined if individual animals or individual faeces samples collected from the environment constitute the epidemiological unit. If individual faeces samples are collected from the environment, the method applied to establish the species from which the faeces originated has to be reported | The epidemiological unit was the individual animal. As animal carcasses rather than fox scat were collected, the results could be reported at the individual fox level | The epidemiological unit (post‐mortem faecal samples from individual animals of research stations) was well defined and ensures individuality |
| Sample size calculation | The applied survey design should be fully documented, including considerations regarding potential biases inherent in the survey design. The method and the formula used to calculate the sample size should be fully documented |
The sample size has been calculated using the EFSA RiBESS tool with the following parameters:
The sample size was estimated as being 383 In GB, 384 samples were collected and tested. |
The total number of samples collected by GB was 384, which ensures the fulfilment of the technical legal requirements of Regulation (EU) No 1152/2011 regarding a confidence level of at least 0.95 against a design prevalence of 1% | |
| Implementation of the sampling activity | The sampling methods used should be fully documented including the related assumptions and uncertainties, and a justification for choosing the approach should be provided. Timeframe of the surveillance data and geographical clustering of the infection must to be reported. The sample collection period must comprise the whole year and the spatial distribution of the sampling must be homogeneous. |
|
The sampling process has more the characteristics of a convenience sampling, rather than a simple random sample. The difficulties in running such a sampling technique; however, are well known and are broadly discussed in previous reports. The temporal distribution of samples was reduced during the spring‐summer months and the reason of this reduction of the sampling effort has been well justified | |
| Methodology | Design prevalence (DP) | DP is specified in Annex II to Regulation (EU) No 1152/2011 and must be 1% or lower | DP = 0.01 (1%) | |
| Geographical epidemiologic unit | The geographic epidemiological unit(s) identified as target for the surveillance activity has to be clearly indicated and supported by justification | The United Kingdom was divided into two surveillance regions for the purpose of this report: GB (England, Scotland and Wales) and NI | The whole territory of GB and NI were considered as one epidemiological unit in their respective analysis | |
| Methodology for calculation of area sensitivity | For the calculation of the area sensitivity, the diagnostic sensitivity should be set conservatively to the lowest value, excluding the lowest 20th percentile, from the ones reported in the scientific literature and related to the diagnostic tests implemented by the countries listed in Annex I of the Commission Delegated Regulation (EU) No 1152/2011. In this case, is 78% (EFSA AHAW Panel, 2015) |
The system sensitivity was calculated by GB using an overall sensitivity of the diagnostic approach of 0.78 and the design prevalence of 1% prescribed in Regulation (EU) No 1152/2011 using the RiBESS tool SYSTEM SENSITIVITY CALCULATION DP = 0.01 TSe = 0.78 sample size for 2016 n = 384 The obtained system sensitivity was 0.951 |
The area sensitivity was estimated by GB using the RiBESS tool. The parameters included for the calculation were the following: (a) design prevalence of 1%, (b) test sensitivity of 0.78, (c) population size of 250,000 and (d) sample size of 384. The value of the area sensitivity (0.9506; > 0.95) exceeded the established minimum value of 0.95 needed to fulfil the technical legal requirements as laid down in Regulation (EU) No 1152/2011 |
Table D.2.
Descriptive statistics for a representative survey (Great Britain – Part II of surveillance report)
| Parameter | Evidence | Action | |
|---|---|---|---|
| 1 | Theoretical sampling period | From 1 March 2016 to 28 February 2017 | – |
| 2 | Actual sampling period | From 1 March 2016 to 27 January 2017 | – |
| 3 | Summary dates |
Min: ‘2016‐03‐01’ 1st Qu. ‘2016‐09‐26’ Median ‘2016‐11‐05’ Mean ‘2016‐10‐20’ 3rd Qu. ‘2016‐12‐04’ Max. ‘2017‐01‐27’ |
– |
| 4 | Sampling period | 332 days | – |
| 5 | Number of samples | 384 | – |
| 6 | Number of test results | 384 PCR Cest1‐Cest2 NAD1 | – |
| 7 | Laboratory test completion | 5 in 2016; 379 in 2017 | – |
| 8 | Sensitivity | 0.78 | – |
| 9 | Host | 384 Vulpes vulpes | – |
| 10 | Animal sample | 384 faeces post‐mortem | – |
| 11 | Sampling strategy and design | Objective sampling – simple random sample 384 | – |
| 12 | Sampling point | Wildlife Research Station 384 | – |
Table D.3.
Assessment of the description of the surveillance system (Northern Ireland – Part I of surveillance report) for a representative sample survey
| Points addresses in Annex II | Element | Description of Element | Information provided in surveillance report | Comments |
|---|---|---|---|---|
| Type and sensitivity of the detection method | Type of test | The diagnostic test used for the detection of EM must be defined. Modifications of the original method should be indicated |
|
The method used for detection of E. multilocularis in NI is cited |
| Test sensitivity | The sensitivity and specificity of the test used in the surveillance system must be reported. This would ideally be estimates from each participating laboratory reported as a point estimate (average) of the values across the country with minimum and maximum values or a probability distribution. Alternatively, a value of 0.78, as recommended by EFSA (2015), shall be used |
|
The evidence provided to support the test sensitivity value for the SCT (Eckert, 2003) actually refers to a previous work (Hofer et al., 2000) focus on the prevalence in the target population and not in the sensitivity of the SCT. The almost perfect sensitivity of the SCT is actually an assumption. A safer option would be to follow the EFSA recommendation (Test Se = 0.78) | |
| Selection of the target population | Definition of susceptible host population targeted by the system | The susceptible wild definitive host population(s) targeted by the surveillance system should be described and the choice justified. If domestic host species are sampled, evidence for the absence of wild definitive hosts and for these domestic animals having had access to outdoors should be provided |
|
The selection of red fox to perform the pathogen surveillance seems appropriate, as this species has been recognised as the main wildlife definitive host species for this parasite (EFSA AHAW Panel, 2015). Regarding the absence of other potential wild definitive hosts (raccoon dogs, wolves) the information is consistent with the report of Ireland. However, no reference has been provided |
| Size of susceptible host population targeted by the system | The size of the targeted (wildlife) population should be reported, together with the evidence for this. Historical population data should be updated since these may not reflect current populations |
|
||
| Sampling strategy | Epidemiological unit | It should be clearly defined if individual animals or individual faeces samples collected from the environment constitute the epidemiological unit. If individual faeces samples are collected from the environment, the method applied to establish the species from which the faeces originated has to be reported |
|
The epidemiological unit (intestinal contents from individual hunted or road kill animals) was well defined and ensures individuality |
| Sample size calculation | The applied survey design should be fully documented, including considerations regarding potential biases inherent in the survey design. The method and the formula used to calculate the sample size should be fully documented |
The sample size has been calculated using the EFSA RiBESS tool with the following parameters:
The sample size was estimated as being 320 |
If a sensitivity of 0.78 is considered (as recommended by EFSA as a worst‐case scenario), the required samples to fulfil the technical legal requirements regarding a confidence level of at least 0.95 against a design prevalence of 1% increase to 379 (with 59 additional samples needed) The sampling carried out in the Republic of Ireland, given the lack of geographical barrier between the two regions, would provide additional guarantees that Northern Ireland remains disease free this year, even if a lower test sensitivity were used for the sample calculation |
|
| Implementation of the sampling activity | The sampling methods used should be fully documented including the related assumptions and uncertainties, and a justification for choosing the approach should be provided. Timeframe of the surveillance data and geographical clustering of the infection must to be reported. The sample collection period must comprise the whole year and the spatial distribution of the sampling must be homogeneous |
|
The sampling process has more the characteristics of a convenience sampling, rather than a simple random sample. The difficulties in performing a simple random sampling technique; however, are well known and are broadly discussed in previous reports. The collection of samples was in both cases reduced during the spring‐summer months and the reason for this reduction has been well justified | |
| Methodology | Design Prevalence (DP) | DP is specified in Annex II to Regulation (EU) No 1152/2011 and must be 1% or lower | DP = 0.01 (1%) | |
| Geographical epidemiologic unit | The geographic epidemiological unit(s) identified as target for the surveillance activity has to be clearly indicated and supported by justification | The United Kingdom was divided into two surveillance regions for the purpose of this report: GB (England, Scotland and Wales) and NI | The whole territory of GB and NI was considered as one epidemiological unit in their respective analysis | |
| Methodology for calculation of area sensitivity | For the calculation of the area sensitivity, the diagnostic sensitivity should be set conservatively to the lowest value, excluding the lowest 20th percentile, from the ones reported in the scientific literature and related to the diagnostic tests implemented by the countries listed in Annex I of the Commission Delegated Regulation (EU) No 1152/2011. In this case, is 78% (EFSA AHAW Panel, 2015) |
The system sensitivity was calculated by NI using an overall sensitivity of the diagnostic approach of 0.99 and the design prevalence of 1% prescribed in Regulation (EU) No 1152/2011 using the RiBESS tool SYSTEM SENSITIVITY CALCULATION DP = 0.01 TSe = 0.99 sample size for 2016 n = 320 The obtained system sensitivity was 0.959 (binomial) and 0.961 (hypergeometric) |
If a test sensitivity of 0.78 is assumed, the area sensitivity (0.918, binomial; 0.920 hypergeometric) is not sufficient to comply with the technical legal requirements of the EU regulation in force (59 additional tests would be required) |
Table D.4.
Descriptive statistics for a representative survey (Northern Ireland ‐ Part II of surveillance report)
| Parameter | Evidence | Action | |
|---|---|---|---|
| 1 | Theoretical sampling period | From 1 April 2016 to 31 March 2017 | – |
| 2 | Actual sampling period | From 20 April 2016 to 29 March 2017 | – |
| 3 | Summary dates |
Min: ‘2016‐04‐20’ 1st Qu. ‘2016‐09‐29’ Median ‘2016‐11‐02’ Mean ‘2016‐11‐03’ 3rd Qu. ‘2016‐12‐05’ Max. ‘2017‐03‐29’ |
– |
| 4 | Sampling period | 343 days | – |
| 5 | Number of samples | 320 | – |
| 6 | Number of test results | 320 sedimentation and counting technique | – |
| 7 | Laboratory test completion |
207 test results in 2016 113 test results in 2017 |
– |
| 8 | Sensitivity | 0.99 | – |
| 9 | Host | 320 Vulpes vulpes | – |
| 10 | Animal sample | 320 individual intestinal content | – |
| 11 | Sampling strategy and design | Objective sampling – simple random sample 320 | – |
| 12 | Sampling point | 294 from hunting; 26 from road kills | – |
Appendix E – Assessment tables for the surveillance report of Norway
Table E.1.
Assessment of the description of the surveillance system (Part I of surveillance report) for a representative sample survey – Norway
| Points addresses in Annex II | Element | Description of element | Information provided in surveillance report | Comments |
|---|---|---|---|---|
| Type and sensitivity of the detection method | Type of test | The diagnostic test used for the detection of EM must be defined. Modifications of the original method should be indicated |
|
Method well described and appropriately referenced in the report |
| Test sensitivity | The sensitivity and specificity of the test used in the surveillance system must be reported. This would ideally be estimates from each participating laboratory reported as a point estimate (average) of the values across the country with minimum and maximum values or a probability distribution. Alternatively, a value of 0.78, as recommended by EFSA (2015), shall be used |
|
The diagnostic sensitivity was set to the sensitivity obtained by Øines et al. (2014) (63%), a lower value than the minimum recommended by EFSA (0.78). Such low test sensitivity implies a much higher effort to reach the 95% of confidence stated in the legislation, as a large sample size is required. However, it has to be acknowledged that the choice of using a lower value than the one suggested by EFSA goes in a precautionary direction | |
| Selection of the target population | Definition of susceptible host population targeted by the system | The susceptible wild definitive host population(s) targeted by the surveillance system should be described and the choice justified. If domestic host species are sampled, evidence for the absence of wild definitive hosts and for these domestic animals having had access to outdoors should be provided |
|
The reasons provided by Norway to justify its decision of not including other wild definitive hosts (artic foxes and raccoon dogs) are scientifically sound. Although no references were added, apparently their population densities do not reach high numbers (Environment.no, online; Florisson and Kreij, 2014) |
| Size of susceptible host population targeted by the system | The size of the targeted (wildlife) population should be reported, together with the evidence for this. Historical population data should be updated since these may not reflect current populations |
|
In the absence of data on fox populations in Norway, the size was estimated taking into account the annual hunted foxes | |
| Sampling strategy | Epidemiological unit | It should be clearly defined if individual animals or individual faeces samples collected from the environment constitute the epidemiological unit. If individual faeces samples are collected from the environment, the method applied to establish the species from which the faeces originated has to be reported |
|
The epidemiological unit appears in the report and is defined as the red fox. Individual rectal contents were collected directly by hunters |
| Sample size calculation | The applied survey design should be fully documented, including considerations regarding potential biases inherent in the survey design. The method and the formula used to calculate the sample size should be fully documented |
|
This number of samples would be also sufficient to meet the requirements if calculated with RiBESS tool. Using this application, and considering design prevalence of 1%, a test sensitivity of 0.63, and a population size of 151,000, the sample sized required is 474. The 575 samples collected by Norway fulfil the objectives | |
| Implementation of the sampling activity | The sampling methods used should be fully documented including the related assumptions and uncertainties, and a justification for choosing the approach should be provided. Timeframe of the surveillance data and geographical clustering of the infection must to be reported. The sample collection period must comprise the whole year and the spatial distribution of the sampling must be homogeneous |
|
Samples were collected from all the 19 Norwegian NUTS3 regions with an increase of the sampling in the south‐east of the country. The differences of sampling intensities among the different areas have been justified in the report Samples were collected during the whole year with a decline of the sampling during the summer season. The reasons are well justified |
|
| Methodology | Design prevalence (DP) | DP is specified in Annex II to Regulation (EU) No 1152/2011 and must be 1% or lower | DP = 0.01 (1%) | |
| Geographical epidemiologic unit | The geographic epidemiological unit(s) identified as target for the surveillance activity has to be clearly indicated and supported by justification | The geographical unit is deduced to be the entire territory of Norway. The choice is sound as no risk factors were reported to justify the identification of sub‐areas within the Norwegian territory | ||
| Methodology for calculation of area sensitivity | For the calculation of the area sensitivity, the diagnostic sensitivity should be set conservatively to the lowest value, excluding the lowest 20th percentile, from the ones reported in the scientific literature and related to the diagnostic tests implemented by the countries listed in Annex I of the Commission Delegated Regulation (EU) No 1152/2011. In this case, is 78% (EFSA AHAW Panel, 2015) | Using the RiBESS tool, and considering a test sensitivity of 0.63, a population size of 151,000 and a sample size of 575, the value of the area sensitivity is 0.9737 (> 0.95), which exceeds the established minimum value of 0.95 needed to fulfil the technical legal requirements of Regulation (EU) No 1152/2011 |
Table E.2.
Descriptive statistics for a representative survey (Part II of surveillance report) – Norway
| Parameter | Evidence | Action | |
|---|---|---|---|
| 1 | Theoretical sampling period | 1 January 2016 – 31 December 2016 | – |
| 2 | Actual sampling period | 4 January 2016 – 29 December 2016 | – |
| 3 | Summary dates |
Min. ‘2016‐01‐04’ 1st Qu. ‘2016‐02‐16’ Median ‘2016‐03‐08’ Mean ‘2016‐04‐24’ 3rd Qu. ‘2016‐07‐19’ Max. ‘2016‐12‐29’ |
– |
| 4 | Sampling period | 360 days | – |
| 5 | Number of samples | 575 | – |
| 6 | Number of test results | 575 PCR 12S rRNA | – |
| 7 | Laboratory test completion | All test results were reported in 2016 | – |
| 8 | Sensitivity | 0.63 | – |
| 9 | Host | 575 Vulpes vulpes | – |
| 10 | Animal sample | 575 Individual rectal content | – |
| 11 | Sampling strategy and design | Objective sampling – single random sampling 575 | – |
| 12 | Sampling point | 575 hunting | – |
Suggested citation: EFSA (European Food Safety Authority) , Beltrán‐Beck B and Zancanaro G, 2017. Scientific report on the assessment of Echinococcus multilocularis surveillance reports submitted in 2017 in the context of Commission Regulation (EU) No 1152/2011. EFSA Journal 2017;15(11):5051, 75 pp. 10.2903/j.efsa.2017.5051
Requestor: On request from the European Commission and the European Free Trade Association Surveillance Authority
Question numbers: EFSA‐Q‐2017‐00403 and EFSA‐Q‐2017‐00697
Acknowledgements: EFSA wishes to thank the members of the EFSA Scientific Network for Risk Assessment in Animal Health and Welfare: Antti Oksanen, Craig Simpson, Cristina Marino, Heidi Enemark, Helen Roberts, Ian David Woolsey, Josie Willet, Karl Karlsson, Marja Isomursu, Nigel Gibbens, Noel Demicoli, Ole‐Herman Tronerud, Roberto Balbo, Susan Chircop and William Byrne for their cooperation; Preben Willeberg and Mariano Domingo Álvarez for the peer review of this scientific report; Andrea Bau and Jane Richardson for their technical and scientific support.
Approved: 13 October 2017
Reproduction of the images listed below is prohibited and permission must be sought directly from the copyright holder:
Figure 1: © Kauhala, Riista‐ ja kalatalouden tutkimuslaitos; Figure 2: © Natural Resources Institute Finland; Figure 7: © Tomas Murray, Biodiversity Ireland; Figure 14: DEFRA, UK
Notes
These territories are listed in Annex I of the legislation.
For the purposes of Norway's obligations under the EEA Agreement, including those under Regulation (EU) No 1152/2011, the territory of Norway does not include Svalbard, cf. Protocol 40 to the EEA Agreement.
References
- Casulli A, Possenti A, La Torre G, Boue F, Busani L, Colamesta V, Conraths FJ, D'Aguanno S, De Giusti M, De Vito C, Karamon J, Maas M, Mannocci A, Maffongelli E, Mipatrini D, Oksanen A, Probst C, Saulle R, Siles‐Lucas M, Umhang G, van den End S, van der Giessen J and Villari P, 2015. E. multilocularis infection in animals (GP/EFSA/AHAW/2012/01). EFSA Supporting Publication 2015;12(12):EN‐882, 168 pp. 10.2903/sp.efsa.2015.en-882 [DOI] [Google Scholar]
- CDC (Centers for disease control and prevention), online. Parasites‐Echinococcosis. Available online: https://www.cdc.gov/parasites/echinococcosis/biology.html [Accessed: 5 July 2017].
- Conraths FJ and Deplazes P, 2015. Echinococcus multilocularis: epidemiology, surveillance and state‐of‐the‐art diagnostics from a veterinary public health perspective. Veterinary Parasitology, 213, 149–161. [DOI] [PubMed] [Google Scholar]
- Conserve Ireland , 2009. Red Fox. Available online: http://www.lhnet.org/red-fox/
- Croft S, Chauvenet A and Smith G, 2017. A systematic approach to estimate the distribution and total abundance of British mammals. PLoS ONE, 12, e0176399. [DOI] [PMC free article] [PubMed] [Google Scholar]
- Davidson RK, Romig T, Jenkins E, Tryland M and Robertson LJ, 2012. The impact of globalisation on the distribution of Echinococcus multilocularis . Trends in Parasitology, 28, 239–247. [DOI] [PubMed] [Google Scholar]
- DEFRA (Department for Environment Food and Rural Affairs), 2013. Request for information: bovine TB hotspots and population sizes of badgers and foxes. Available online: https://www.gov.uk/government/uploads/system/uploads/attachment_data/file/243894/5577.pdf
- Deplazes P, 2006. Ecology and epidemiology of Echinococcus multilocularis in Europe. Parassitologia, 48, 37–39. [PubMed] [Google Scholar]
- Dinkel A, von Nickisch‐Rosenegk M, Bilger B, Merli M, Lucius R and Romig T, 1998. Detection of Echinococcus multilocularis in the definitive host: coprodiagnosis by PCR as an alternative to necropsy. Journal of Clinical Microbiology, 36, 1871–1876. [DOI] [PMC free article] [PubMed] [Google Scholar]
- ECDC (European Centre for Disease Prevention and Control), 2016. Annual Epidemiological Report 2016 – Echinococcosis. Stockholm, Sweden. Available online: https://ecdc.europa.eu/en/publications-data/echinococcosis-annual-epidemiological-report-2016-2014-data
- Eckert J, 2003. Predictive values and quality control of techniques for the diagnosis of Echinococcus multilocularis in definitive hosts. Acta Tropica, 85, 157–163. [DOI] [PubMed] [Google Scholar]
- Eckert J and Deplazes P, 1999. Alveolar Echinococcosis in humans: the current situation in central Europe and the need for countermeasures. Parasitology Today, 15, 315–319. [DOI] [PubMed] [Google Scholar]
- EFSA (European Food Safety Authority), 2012a. Scientific and technical assistance on Echinococcus multilocularis infection in animals. EFSA Journal 2012;10(11):2973, 22 pp. 10.2903/j.efsa.2012.2973 [DOI] [Google Scholar]
- EFSA (European Food Safety Authority), 2012b. A framework to substantiate absence of disease: the risk based estimate of system sensitivity tool (RiBESS) using data collated according to the EFSA Standard Sample Description ‐ An example on Echinococcus multilocularis . EFSA Supporting Publications 2012;9(12):EN‐366, 44 pp. 10.2903/sp.efsa.2012.en-366 [DOI] [Google Scholar]
- EFSA (European Food Safety Authority), 2013. Assessment of Echinococcus multilocularis surveillance reports submitted 2013 in the context of Commission Regulation (EU) No 1152/2011. EFSA Journal 2013;11(11):3465, 41 pp. 10.2903/j.efsa.2013.3465 [DOI] [Google Scholar]
- EFSA (European Food Safety Authority), 2014. Assessment of Echinococcus multilocularis surveillance reports submitted in 2014 in the context of Commission Regulation (EU) No 1152/2011. EFSA Journal 2014;12(10):3875, 44 pp. 10.2903/j.efsa.2014.3875 [DOI] [Google Scholar]
- EFSA (European Food Safety Authority), 2015. Assessment of Echinococcus multilocularis surveillance reports submitted in 2015 in the context of Commission Regulation (EU) No 1152/2011. EFSA Journal 2015;13(11):4310, 58 pp. 10.2903/j.efsa.2015.4310 [DOI] [Google Scholar]
- EFSA AHAW Panel (EFSA Panel on Animal Health and Welfare), 2015. Scientific opinion on Echinococcus multilocularis infection in animals. EFSA Journal 2015;13(12):4373, 129 pp. 10.2903/j.efsa.2015.4373 [DOI] [Google Scholar]
- EFSA (European Food Safety Authority), Bau A, Palumbo R, Richardson J and Zancanaro G, 2016. Assessment of Echinococcus multilocularis surveillance reports submitted in 2016 in the context of Commission Regulation (EU) No 1152/2011. EFSA Journal 2016;14(12):4649, 55 pp. 10.2903/j.efsa.2016.4649 [DOI] [Google Scholar]
- Environment.no , online. Artic fox in Norway. Available online: http://www.environment.no/topics/biodiversity/species-in-norway/threatened-species/arctic-fox-mainland-norway/
- Fauna Europaea , online. Vulpes vulpes (Linnaeus, 1758). Available online: https://fauna-eu.org/cdm_dataportal/taxon/84f2e35f-eea0-4289-99c9-e6262bb0e386
- Florisson L and Kreij M, 2014. The raccoon dog: an exponential problem? Management methods used in Europe to control the raccoon dog population (Nyctereutes procyonoides). Available online: https://www.google.it/url?sa=t&rct=j&q=&esrc=s&source=web&cd=5&cad=rja&uact=8&ved=0ahUKEwiX7oHN5fzUAhUE8RQKHS7GAYIQFghIMAQ&url=http%3A%2F%2Fwww.samhao.nl%2Fwebopac%2FMetaDataEditDownload.csp%3Ffile%3D2%3A125524%3A1&usg=AFQjCNEMZdUQBO5HYnM34WSXNm-cbLyfAw
- Hayden T and Harrington R, 2000. Exploring Irish mammals. Town House & Country House Ltd., Dublin, Ireland: 340 pp. [Google Scholar]
- Hofer S, Gloor S, Muller U, Mathis A, Hegglin D and Deplazes P, 2000. High prevalence of Echinococcus multilocularis in urban red foxes (Vulpes vulpes) and voles (Arvicola terrestris) in the city of Zurich, Switzerland. Parasitology, 120, 135–142. [DOI] [PubMed] [Google Scholar]
- Isaksson M, Hagström Å, Armua‐Fernandez MT, Wahlström H, Ågren EO, Miller A, Holmberg A, Lukacs M, Casulli A, Deplazes P and Juremalm M, 2014. A semi‐automated magnetic capture probe based DNA extraction and real‐time PCR method applied in the Swedish surveillance of Echinococcus multilocularis in red fox (Vulpes vulpes) faecal samples. Parasites and Vectors, 7, 583. [DOI] [PMC free article] [PubMed] [Google Scholar]
- Kahuala K, 2007. Paljonko Suomessa on pienpetoja? Riista‐ja kalatalous Selvityksiä 1. Riista‐ja kalatalouden tutkimuslaitos, Helsinki 2007. Available online: http://jukuri.luke.fi/bitstream/handle/10024/532812/paljonko_suomessa_on_pienpetoja_julkaisu_nettiin.pdf?sequence=1
- Kapel CMO, Torgerson PR, Thompson RCA and Deplazes P, 2006. Reproductive potential of Echinococcus multilocularis in experimentally infected foxes, dogs, raccoon dogs and cats. International Journal for Parasitology, 36, 79–86. [DOI] [PubMed] [Google Scholar]
- Lalošević D, Lalošević V, Simin V, Miljević M, Čabrilo B and Čabrilo OB, 2016. Spreading of multilocular echinococcosis in southern Europe: the first record in foxes and jackals in Serbia, Vojvodina Province. European Journal of Wildlife Research, 62, 793–796. [Google Scholar]
- Macdonald D and Reynolds J, 2008. Vulpes vulpes. In: IUCN 2013. IUCN Red List of Threatened Species, Version 2013.1.
- Marnell F, Kingston N and Looney D, 2009. Irish Red List No. 3 ‐ Terrestrial Mammals. National Parks & Wildlife Service, Dublin, Ireland, Available online: https://www.npws.ie/content/publications/irish-red-list-no-3-terrestrial-mammals
- Mathis A, Deplazes P and Eckert J, 1996. An improved test system for PCR‐based specific detection of Echinococcus multilocularis eggs. Journal of Helminthology, 70, 219–222. [DOI] [PubMed] [Google Scholar]
- Mihmanli M, Idiz UO, Kaya C, Demir U, Bostanci O, Omeroglu S and Bozkurt E, 2016. Current status of diagnosis and treatment of hepatic echinococcosis. World Journal of Hepatology, 8, 1169–1181. [DOI] [PMC free article] [PubMed] [Google Scholar]
- Moro P and Schantz PM, 2009. Echinococcosis: a review. International Journal of Infectious Diseases, 13, 125–133. [DOI] [PubMed] [Google Scholar]
- OIE , 2017. 2017 © OIE ‐ Manual of Diagnostic Tests for Aquatic Animals – Chapter 1.1.2, Principles and methods of validation of diagnostic assays for infectious diseases. Available online: http://www.oie.int/fileadmin/Home/eng/Health_standards/aahm/current/chapitre_validation_diagnostics_assays.pdf
- Øines Ø, Isaksson M, Hagström Å, Tavornpanich S and Davidson RK, 2014. Laboratory assessment of sensitive molecular tools for detection of low levels of Echinococcus multilocularis‐eggs in fox (Vulpes vulpes) faeces. Parasites and Vectors, 7, 246. [DOI] [PMC free article] [PubMed] [Google Scholar]
- Oksanen A, Siles‐Lucas M, Karamon J, Possenti A, Conraths FJ, Romig T, Wysocki P, Mannocci A, Mipatrini D, La Torre G, Boufana B and Casulli A, 2016. The geographical distribution and prevalence of Echinococcus multilocularis in animals in the European Union and adjacent countries: a systematic review and meta‐analysis. Parasites and Vectors, 9, 519. [DOI] [PMC free article] [PubMed] [Google Scholar]
- Peregrine AS, Jenkins EJ, Barnes B, Johnson S, Polley L, Barker IK, De Wolf B and Gottstein B, 2012. Alveolar hydatid disease (Echinococcus multilocularis) in the liver of a Canadian dog in British Columbia, a newly endemic region. The Canadian Veterinary Journal, 53, 870–874. [PMC free article] [PubMed] [Google Scholar]
- Phillips SJ, Anderson RP and Schapire RE, 2006. Maximum entropy modeling of species geographic distributions. Ecological Modelling, 190, 231–259. [Google Scholar]
- R Core Team , 2013. R: A language and environment for statistical computing. R Foundation for Statistical Computing, Vienna, Austria. Available online: http://www.R-project.org/
- Scott DM, Berg MJ, Tolhurst BA, Chauvenet ALM, Smith GC, Neaves K, Lochhead J and Baker PJ, 2014. Changes in the Distribution of Red Foxes (Vulpes vulpes) in Urban Areas in Great Britain: findings and Limitations of a Media‐Driven Nationwide Survey. PLoS ONE, 9, e99059 10.1371/journal.pone.0099059 [DOI] [PMC free article] [PubMed] [Google Scholar]
- Torgerson PR, Keller K, Magnotta M and Ragland N, 2010. The global burden of alveolar Echinococcosis. PLOS Neglected Tropical Diseases, 4, e722. [DOI] [PMC free article] [PubMed] [Google Scholar]
- Trachsel D, Deplazes P and Mathis A, 2007. Identification of taeniid eggs in the faeces from carnivores based on multiplex PCR using targets in mitochondrial DNA. Parasitology, 134, 911–920. [DOI] [PubMed] [Google Scholar]
- WHO (World Health Organization), 2017. Echinococcosis‐ Fact sheet 2017. WHO, Geneva, Switzerland. Available online: http://www.who.int/mediacentre/factsheets/fs377/en/
- Wright LJ, Newson SE and Noble DG, 2014. The value of a random sampling design for annual monitoring of national populations of larger British terrestrial mammals. European Journal of Wildlife Research, 60, 213–221. [Google Scholar]