Abstract
An epidemiological analysis of the temporal and spatial patterns of LSD epidemics and of the risk factors for LSD spread in south‐eastern Europe was performed, based on the data collected from affected and at risk countries. Since 2015, the extent of the LSD epidemics in south‐eastern Europe was over 7,600 LSD outbreaks with 12,800 affected animals, with most outbreaks occurring between May and August. Most LSD spread occurs over a relatively small distance, approximately between 10 and 20 km, and the speed of propagation was estimated to be mostly up 2 km/day, in agreement with the vector‐borne pattern of LSD. Proximity to affected farms, warm temperatures and related vector abundance were among the main risk factors for LSD spread. Within a few months’ at least 90% of the animal population had been vaccinated with live homologous vaccine against LSD in south‐eastern Europe. Where almost total vaccination coverage was achieved, no further outbreaks were reported. The vaccination effectiveness in Albania was estimated to be around 70% at farm level and 77% at animal level. Possible adverse effects to live homologous vaccine, including fever, decreased milk production and oedema at injection site were reported in Croatia (a LSD‐free country) mostly within 2 weeks after vaccination, in 0.09% of the vaccinated animals. Unique farm identifiers should be always used across all databases, so to allow further analysis especially on improving the mathematical models for more robust estimates of transmission parameters applicable to the region, and for better estimation of vaccination effectiveness. All suspected clinical cases in vaccinated animals should be confirmed by differentiating field virus from vaccine strain. Trapping surveys for estimation of vector abundance can be carried out by targeting some sentinel farms, to be followed up during the whole LSD season, while long‐term studies can give more accurate information about species composition and seasonality of potential LSD vectors.
Keywords: lumpy skin disease, spread
Summary
The European Commission requested the European Food Safety Authority (EFSA) to perform an epidemiological analysis based on the data collected from the Member States or non‐EU countries affected by lumpy skin disease (LSD). In particular, an analysis of the temporal and spatial patterns of LSD and an analysis of the risk factors involved in the occurrence, spread and persistence of the LSD virus among the cattle population should be included. Two reports are foreseen for presenting the results of this analysis, the present report and a second report to be delivered in January 2018.
In this first report, an analysis is presented with the available data received from the countries involved in this project so far, namely by Albania, Bulgaria, Croatia, Greece, the former Yugoslav Republic of Macedonia, Kosovo,1 Montenegro, Serbia and Turkey. The collection of data from the affected countries included data on the structure and distribution of cattle farms, on LSD outbreaks and on vaccination, up to end of 2016. Although a certain degree of heterogeneity was observed in timeliness, quantity and quality of data received from the different countries, given the current epidemiological situation in the affected and at‐risk countries, there has been a very high level of commitment and collaboration by the veterinary services from the countries involved in this data collection project.
The methodology was based on descriptive epidemiology, mapping tools and on a survival analysis for the estimation of the effectiveness of vaccination. This analysis included a description of temporal and spatial patterns of LSD epidemics in the south‐eastern Europe compared to animal density, temperatures, progressive vaccination coverage and an analysis of vaccination effectiveness in the selected case study of Albania. This was chosen due to the characteristics of that situation, i.e. no culling of affected animals and mixed presence of vaccinated and unvaccinated farms, which fit the purpose of the analysis. An analysis of the possible adverse effects of vaccination in an unaffected country (Croatia) was also presented. Regarding the role of vectors as one of the main risk factors for LSD spread, opportunity maps for LSD vector survival were presented. Besides that, since the presence and abundance of LSD vectors is one of the main risk factors for the spread and since the knowledge on possible vectors of LSD virus is limited, in this first report, some indications are provided for survey and trapping protocols for vector insects of LSD. This is also linked to the importance of studying vectors during current outbreaks.
Since the introduction into Turkey in 2013, LSD virus outbreaks have expanded northwards to the west through south‐eastern Europe and to the east through the Caucasus, reaching Russia. In terms of extent of the epidemics, since the beginning over 7,600 LSD outbreaks with 12,800 affected animals were reported, with a clear seasonal pattern, with most outbreaks occurring between May and August, in south‐eastern Europe in 2015, excluding Turkey. The seasonality of the outbreaks is in agreement with the opportunity maps for vector survival. These maps also show that vector survival would be possible throughout the entire year in many regions of Greece. For this reason, warm temperatures and related abundance of vectors could be considered one of the main risk factors for LSD spread and persistence.
According to the analysis done for LSD in Turkey until October 2014 (no vaccination performed) and in line with what previously estimated by mathematical model in EFSA outputs, most LSD spread occurs over a relatively small distance, approximately between 10 and 20 km, and the speed of propagation was estimated to be mostly (75% percentile) up 2 km/day, with few values (95% CI) up to 15 km/day. This is in agreement with the vector‐borne pattern of LSD, with mainly vector transmission over a short distance, and with some transmission over much longer distances, and faster spread rate, as would be expected for less frequent long distance movement of infected cattle. In relation to that, proximity to affected farms can be considered a further risk factor for LSD spread.
Mass vaccination campaigns with live homologous vaccines against LSD were carried out at regional level in south‐eastern Europe in all affected countries and Croatia. These campaigns resulted in at least 90% vaccination coverage of the animal population, within a period of a few months, indicating a high level of responsiveness and preparedness of the national authorities of those countries to control the epidemics. Where almost total vaccination coverage was achieved, no further outbreaks were reported after beginning of October 2016; only few sporadic outbreaks have been reported in Greece and the former Yugoslav Republic of Macedonia. In some cases, (e.g. Bulgaria) the epidemics did not reach the expected peak of outbreaks in August, rather it died off earlier. The protective effect of vaccination is confirmed by the results of the analysis of the vaccination effectiveness in the case study of Albania. The effectiveness is estimated to be around 70% at farm level and 77% at animal level. This evidence shows that mass vaccination with homologous vaccines is one of the factors that mainly influence LSD spread and supports the findings of previous EFSA outputs by analysing Greek data and of the studies from Israel. These highlighted that the vaccination with the live homologous vaccine, when applied as uniformly as possible across the population with high coverage is most effective in reducing LSD virus (LSDV) spread.
Adverse effects to live homologous vaccines applied in situation of disease freedom (Croatia) were reported on 0.24% of the vaccinated farms, involving 0.09% of the total animals affected and 0.02% deaths. The majority of symptoms were reported within 2 weeks after vaccination and included fever, decrease in milk production and oedema at injection site.
The presence and abundance of all potential LSD vectors was one of the major risk factors considered to contribute to LSD spread and persistence. Thus, in the absence of specific data, the most relevant indications for vector collection to study seasonal dynamics and abundance are provided in this report, so to encourage the affected countries to perform vector surveys. Concerning those indications, it can be concluded that potential vectors for LSD can be identified by epidemiological evidences using their abundances during outbreak season. Moreover, different sampling methods for potential vectors of LSD are available, according to the scenario and the aim of the survey (i.e. epidemics, surveillance, LSD detection on vectors). In any case, each targeted vector requires specific sampling methods and training/ expertise on taxonomy.
To improve data quality and quantity, it is recommended that the data models as provided by EFSA are followed as much as possible. In particular, it is important to indicate the unique identifier of farms (farm ID) across all databases to allow connection between different databases. If possible, the unique identifier of farms should be also included as a variable in the Animal Disease Notification System (ADNS) system, so to be able to indicate which farm is involved in each outbreak reported.
Improvement of data quantity, quality and time availability will enable further analysis on different epidemiological aspects to enhance the mathematical models used previously, as well as to determine other potential risk factors for LSD spread and persistence. This will provide more robust estimates for transmission parameters that are directly applicable to the region, as well as to better assess the effectiveness of vaccination, based on field data.
Concerning the surveillance and any possible new LSD cases in 2017, given the current situation where most animals have been vaccinated with live LSDV homologous strain without DIVA possibilities, the most feasible option for surveillance seems to be the immediate notification of clinical suspected cases, the confirmation of LSDV in those animals by laboratory testing including the differentiation of field virus from vaccine strain. Concerning adverse effects of vaccination, these should be collected systematically, where possible, at animal level.
In relation to field surveys on potential LSD vectors, it is recommended to carry out ad hoc trapping surveys to calculate relative abundance of potential LSD vectors by targeting a number of outbreak farms, to be followed up during the whole LSD season, from the first LSD cases in spring until the last one in autumn. Moreover, long‐term studies (i.e. biannual, triennial) would give more accurate information about species compositions in farms and seasonality of potential vectors of LSD.
1. Introduction
1.1. Background and Terms of Reference as provided by the requestor
Lumpy skin disease (LSD) is a viral infection affecting cattle which is transmitted primarily by blood feeding insects (vectors) and to a lesser extent through direct contact between animals. Mortality due to LSD is not very high (up to 10%); however, occurrence of the disease is associated with a drop in production and serious trade restrictions.
LSD is endemic in most African countries. Since 2012, LSD has been spreading on an unusually large scale throughout the Middle East, including Egypt and Israel, into Turkey (reported steadily since 2013) where it is now considered endemic.
By November 2014, shortly before the publication of EFSA's opinion on LSD (January 2015), the disease was confirmed in the island of Cyprus (in the areas not under the effective control of the Republic of Cyprus). In the months that followed, LSD also gradually progressed from Anatolia (Turkey) where it is endemic, into the East Thrace area of Turkey (May 2015) and from there to Greece (Evros, August 2015) where it continued to spread westwards, producing new outbreaks as far as the regional units of Thessaloniki and Chalkidiki.
In 2016, the disease reappeared in Greece, close to the border with Bulgaria, in the region of Serres where vaccine coverage was relatively low. Thus, the decision was taken to expand the vaccination zone further to the west (procedure ongoing). Shortly, after the first outbreaks in Greece in 2015, in 2016, the disease occurred for the first time in Bulgaria, Albania, Serbia, the former Yugoslav Republic of Macedonia, Montenegro and Kosovo.1
The European Union (EU) legislation imposes culling and destruction of all cattle present in the affected holdings. This is followed by the establishment of a protection zone (3 km radius) and a surveillance zone (10 km radius) with special restrictions for cattle and products thereof.
Additional Commission protection measures, namely regionalization, apply in the affected areas and the vaccinated areas (specific Commission Implementing Decision are in place for Greece and Bulgaria).
Similar measures are envisaged for all areas where vaccination is applied to prevent the spread of the disease to previously unaffected areas through the movement of potentially infected cattle.
The Standing Group of Experts on Lumpy skin disease for south‐east Europe under the GF‐TADs umbrella,2 in their first meeting (Brussels 4–5 July 2016) proposed, among other recommendations, that: ‘The collection of surveillance data and scientific information that maybe relevant (e.g. incidence, weather conditions) be coordinated for purposes of better risk assessment and management’ (Final recommendations, available at http://web.oie.int/RR-Europe/eng/Regprog/docs/docs/LSD1/LSD%20SGE1%20(Brussels%20%20July2016)%20-%20Conclusions%20and%20recommendations%20(Final).pdf)
In the light of the above, the Commission needs an updated epidemiological analysis based on the data collected from the Member States affected by LSD. The use of the European Food Safety Authority (EFSA) Data Collection Framework is encouraged as it promotes the harmonisation of data collection. Any data that is available from neighbouring non‐EU countries should be used as well.
This analysis should consider and develop the findings of the EFSA scientific opinion on LSD adopted in January 2015. The data to be used should include all the available epidemiological data from 2014 onwards.
Therefore, in the context of Article 31 of Regulation (EC) No. 178/2002, EFSA should provide technical and scientific assistance to the Commission based on the following Terms of Reference:
To analyse the epidemiological data on LSD from Cyprus, Greece, Bulgaria and any other Member States or non‐EU countries that might be affected by LSD.
To include an analysis of the temporal and spatial patterns of LSD.
To include an analysis of the risk factors involved in the occurrence, spread and persistence of the LSD virus among the cattle population.
1.2. Introduction and interpretation of the Terms of Reference
In this first report produced in the framework of this mandate, an analysis is presented with the data received so far by the countries involved in this project, namely Greece, Bulgaria, Albania, Serbia, Bosnia and Herzegovina, the former Yugoslav Republic of Macedonia, Montenegro, Turkey, Romania, Croatia and Kosovo.1 The collection of data from the affected countries included data on the structure and distribution of cattle farms, on LSD outbreaks and on vaccination at farm level. To guarantee harmonisation, the EFSA Data Collection Framework was used as much as possible along the project. This analysis included a description of temporal and spatial patterns of LSD epidemics in the south‐eastern Europe, a comparison between temporal trends of outbreak, temperatures and progressive vaccination coverage and an analysis of vaccination effectiveness in the selected case study of Albania, with respect to the characteristics of that situation, i.e. no culling of affected animals and mixed presence of vaccinated and unvaccinated farm which fit the purpose of the analysis. An analysis of the possible adverse effects of vaccination in an unaffected country (Croatia) was also presented. Regarding the role of vectors as one of the main risk factors for LSD spread, opportunity maps for LSD vector survival were presented. Besides that, since the presence and abundance of LSD vectors is one of the main risk factors for the spread and since the knowledge on possible vectors of LSD virus is limited, in this first report, some indications are provided for survey and trapping protocols vector insects of LSD. This is also linked to the importance of studying vectors during current outbreaks.
Requesting and collecting epidemiological data from multiple countries currently affected by a livestock epidemic that causes huge losses anticipated a series of difficulties. The effort demonstrated by the veterinary services in collecting, compiling and providing the data to EFSA was recognised and appreciated, especially because this data collection was carried out while the disease had recently spread over the region and when veterinary services were overloaded with implementation of control measures. Thus, a certain degree of heterogeneity in timeliness, quantity and quality of data received from the different countries was expected and observed. For this reason, the present report should be considered as a starting point in this project, and it does not pretend to already present an exhaustive picture of all possible epidemiological characteristics and risk factors of the LSD epidemics in Europe. In fact, the databases could be refined throughout 2017 and the output of further analyses to be included in a second report which is foreseen by January 2018, together with an analysis of the data referring to 2017.
Because of the limited knowledge about possible vectors of LSD virus and because of the importance of studying vectors during current outbreak, in this first report a section is dedicated to possible vector insects of LSD, some indications are provided for survey and trapping protocols.
2. Data and methodologies
To discuss and agree which data were useful to collect and what would be feasible to provide within the timeline available for the present report, a workshop with the contact points from the countries involved in this project (see Section 1.2) was organised at EFSA in December 2016. Data models about cattle population, vaccination (including data on adverse effects of vaccination from non‐affected countries), were presented, and agreed (see Appendix A). For the LSD outbreak data, the ADNS3 format was used. The importance of providing a unique identifier for the farms (farm ID) in each type of database, that would allow connecting the different databases, was stressed. It was agreed that data on cattle population up to 1 January 2016, data on LSD outbreaks and vaccination up to 31 December 2016 would be used. Most of these data were submitted to EFSA by 31 January 2017. It was agreed not to provide laboratory data because they are not systematically collected, and in some countries only few tests are performed to confirm the outbreaks (diagnosis based on clinical signs).
For the second report (January 2018), the database for population, outbreak and vaccination from all the involved countries will be completed as far as possible, as well as the collection of the data from 2017. This would be important to compare the LSD spread in a season associated with susceptible animals and a starting vaccination campaign (2016) with spread in a season when almost the whole population has been vaccinated at least with one doses and immunity due to previous exposure is present.
The application of the mathematical model for the between‐farm spread of LSD virus (LSDV) developed as part of an earlier opinion (EFSA AHAW Panel, 2015, 2016) to outbreak data for the affected countries extracted from ADNS was explored. This was designed to provide updated estimates for transmission parameters for LSDV. However, the modelling approach, as currently implemented, only applies to spread in an unvaccinated population. For all countries, there were too few outbreaks over too short an interval prior to the implementation of vaccination to allow robust parameter estimates to be obtained. However, future work will explore the possibility of linking the demographic, vaccination and outbreak data sets for some or all the affected countries. An extended version of the model that includes vaccination will then be applied to these data. This will allow us to obtain more robust estimates for transmission parameters that are directly applicable to the region, as well as to assess the impact of vaccination on disease spread.
Regarding the last section about surveys on vectors, the data and information used is collected from the published literature, ECDC,4 Vectornet consortium5 and expert knowledge.
2.1. Epidemiological data
For the present, report data were provided by the competent authorities of Greece, Bulgaria, Albania, Serbia, Montenegro, Croatia, the former Yugoslav Republic of Macedonia, Kosovo and Turkey.
2.1.1. Cattle population data
Data on cattle population and farm structure as indicated in Appendix A (Table A.1) were provided at farm level by Greece, Bulgaria, Albania, Montenegro, Croatia, Serbia and from Turkey (in the latter case, data were provided at NUTS3 level).
Table A.1.
Data model on cattle population and possible entries in some of the variables
| FarmID | Country | Area (NUTS3) | Longitude | Latitude | Number of animals | Farm type | Farm structure | Pasture access | Grazing |
|---|---|---|---|---|---|---|---|---|---|
| Dairy | Backyard | Indoor | Individual | ||||||
| Mixed | Commercial | Outdoor | Communal | ||||||
| Beef | |||||||||
| Reproduction |
2.1.2. Outbreak data
Concerning LSD outbreak data, an ADNS extraction as submitted to the European Commission was updated with the data on LSD outbreaks reported up to the end of 2016 received by Greece, Bulgaria, Albania, Montenegro and Kosovo (see data model in Appendix A, Table A.2). Greece, Kosovo, Bulgaria, the former Yugoslav Republic of Macedonia, Kosovo and Albania also provided the identifiers of farm IDs. In most cases, the outbreaks reported are confirmed by laboratory test of samples taken from on few clinically affected animals. In other cases, e.g. Albania, the reported outbreaks are confirmed by clinical diagnosis based on signs of lumpy skin disease.
Table A.2.
Data model of outbreak data (as from ADNS system)a
| Farm ID | Multiple Farm outbreak Y/N | Country | Disease | Outbreak year | Reference number | Affected region (NUTS3) | Latitude | Longitude | Suspicion date | Destruction date | Confirmation date | No. susceptible cattle | No. affected cattle | No. dead cattle | No. killed cattle | No. destroyed cattle |
|---|---|---|---|---|---|---|---|---|---|---|---|---|---|---|---|---|
Important: In case of outbreak on multiple farms, data on suspicion/confirmation date and on number of susceptible and affected animals should be provided per each single farm together with related farmID.
2.1.3. Vaccination data
Data on vaccination against LSD were provided at farm level by Greece, Bulgaria, Albania, Montenegro, Croatia, Kosovo, Serbia, Kosovo, the former Yugoslav Republic of Macedonia and Turkey (in the latter case, data were provided at NUTS3 level for 2016). Croatia and Albania provided also information about post‐vaccination adverse effects.
2.1.4. Climatic data
Meteorological data from weather stations interpolated on a 25 x 25 km grid for min, max and average temperatures and rainfall were provided by the Joint Research Centre (JRC) of the European Commission6 through the Coordination Group for Meteorological Satellites (CGMS) database7 for the time window 2014–2016 for the countries involved.
2.2. Methodologies
Descriptive epidemiological characteristics were derived from the data and GIS software was applied to map their spatial distribution. The vaccination effectiveness and opportunity map for vector survival were estimated as explained below. Information on vector trapping were derived from scientific literature and expert knowledge.
2.2.1. Estimation of the vaccination effectiveness
In order to estimate the vaccination effectiveness, the case study of Albania was chosen because in this country the vaccination coverage at animal level was around 50%. Therefore, both vaccinated and unvaccinated farms were present during the epidemic. As said above, three databases were provided, namely: the registry of all the cattle farms in Albania, a list of all vaccinated farm and list of all the outbreaks which occurred in Albania until 31/12/2016.
After merging the three databases according to farm ID, approximately 3,600 outbreak farms and a database of approximately 200,000 farms scattered in 36 districts were available for analysis. This allowed a comparison between vaccinated and not vaccinated herds towards the onset of an outbreak.
In five districts, no outbreak occurred during 2016. Therefore, only data on farms from the other 31 districts were analysed. For each district, the date of occurrence of the first outbreak was defined as the date of the beginning of the follow‐up period. A farm was defined as not vaccinated (vaccinated and protective immunity established) during the follow‐up period if it had not been vaccinated or if the vaccination date plus 28 days (the time lag for immunity to be established) was later than the end of the year (31/12/2016) or if vaccination plus 28 days was later than the occurrence of an outbreak. Otherwise it was considered as vaccinated. In vaccinated farms, all animals are assumed to be vaccinated.
Assuming the district as the most homogeneous geographical unit available from the spatiotemporal point of view for this analysis, the follow‐up period for each farm was generated according to one of the following possible situations:
In non‐vaccinated farms with no outbreak event, the follow‐up period is from the occurrence of the first outbreak in the district until 31/12/2016.
In outbreak farms, which were not vaccinated, the follow‐up period is from the occurrence of the first outbreak in the district until the date of the outbreak event in the farm.
In vaccinated farms with no outbreak, the follow‐up period is from the date of vaccination plus 28 days until 31/12/2016.
In vaccinated outbreak farms, the follow‐up period is from the date of vaccination + 28 days until the date of the outbreak event (first suspicion) in the herd.
For vaccinated herds, a follow‐up period as not vaccinated was included as well if the date of vaccination plus 28 days was later than the date of first outbreak in the district. In this case, the follow‐up period for this herd considered as not vaccinated is from the occurrence of the first event in the district until the date of vaccination plus 28 days.
A survival analysis was performed comparing LSD incidence in vaccinated vs unvaccinated farms, as previously described in other EFSA statement (EFSA, 2016). Kaplan–Meier survival curves were created using survival module in R and graphs were generated by using the GGplot package, with the purpose of studying the protective effectiveness of vaccination of animal population in the EU, on a farm level (i.e. the farm was the unit of interest, and the outcome was ‘a herd becoming infected that is, at least one infected animals was identified).
Hazard ratio (HR) for an outbreak in vaccinated vs non‐vaccinated farms was calculated, using Cox proportional hazards ratio regression model. Vaccine effectiveness was calculated as 1‐HR.
The same analysis was performed at herd level (the smallest epidemiological unit available) by weighting according to the number of affected and non‐affected animals. The number of susceptible animals in non‐infected farms was the number of animals as reported in the cattle population census, while, in infected farms, was the number of exposed animals indicated in the outbreak database.
2.2.2. Opportunity maps for vector survival
Opportunity maps for vector survival were built by using mapping tools packages in R (https://www.r-project.org/). The grid of geolocated data of daily temperatures of the whole south‐eastern European region was explored, and to each grid unit the number of days in a month when the minimum temperature was above a certain temperature threshold for vector survival. In this report, the threshold used was 10°C as per previous studies on insect species potentially involved in LSD transmission (Rueda et al., 1990; Lysyk, 1998; EFSA, 2017).
3. Assessment
3.1. Overview of LSD situation in affected countries in Europe
LSD is a cattle disease caused by a capripoxvirus and characterised by fever, nodules on the skin, on the mucosal membranes and the internal organs. The disease is mainly transmitted by mechanical blood‐feeding arthropod vectors like flies, mosquitoes and ticks and can cause a reduction in milk production, sterility in bulls, abortion and damage to hides, leading to significant loss of incomes. Originally affecting cattle across Africa, the disease had spread in recent years outside the African continent with outbreaks in Middle East (Israel, Jordan and Lebanon) in 2012–13, and further spread into and through Turkey in 2013, where it is now considered endemic.
In August 2015, LSD outbreaks were notified in the EU with an incursion in eastern Greece (Tasioudi et al., 2016) and further spread over the country. In the following season, in spring and summer 2016, LSD spread further over the Balkans to Bulgaria, the former Yugoslav Republic of Macedonia, Kosovo,8 Serbia, Montenegro, Albania with over 1,000 outbreaks recorded in 2016 (Beard, 2016; European Food Safety A, 2016). Also, on the eastern side of the Black Sea, LSD spread over to Armenia, Azerbaijan, Kazakhstan, Georgia and the Russian Federation up to 54° N. In Figure 1, the yearly evolution of the LSD epidemics in Europe is shown, since 2014 (Figure 1).
Figure 1.
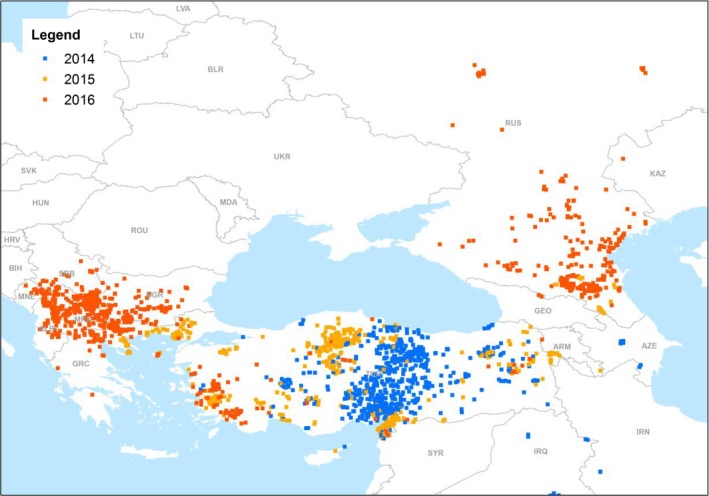
LSD outbreaks notified in Europe in 2014–2016
- (Data Source: Empres‐i, Global Animal Disease Information System, FAO)
Since LSD has spread in most of Balkan countries during the spring and summer 2016, the competent authorities of the affected countries have been implementing a policy of stamping‐out affected holdings coupled with vaccination using live homologous vaccines, since there is a consensus that stamping out alone does not seem sufficient to effectively control the disease (EFSA AHAW Panel, 2015, 2016).
In Table 1, basic epidemiological and vaccination information is summarised up to end of 2016.
Table 1.
Summary table on LSD outbreaks and vaccination until 31 December 2016
| Country | Date of first outbreak reporteda | Date of last outbreak reporteda | Nr of outbreaks reportedb | Nr of affected animalsb | Median intraherd morbidity % (95% CI)d | Nr of dead animals | Median intra herd mortality% (95% CI) | Culling policy | Date of start of vaccinationc | Date of completion of vaccination for 100% coverage | % Vaccinated animalse |
|---|---|---|---|---|---|---|---|---|---|---|---|
| Albania | 28/6/2016 | 9/9/2016 | 3,647g | 4,315g | 50 (0–100) | 364 | 0.0 (0.0–80) | None | 28/7/2016 | Ongoing | 67 |
| Croatia | Not affected | Not affected | Not affected | Not affected | Not affected | Not affected | Not affected | Not applicable | 6/8/2016 | November 2016 | 100 |
| Bulgaria | 12/4/2016 | 28/7/2016 | 217 | 366 | 50.0 (1.42–100) | 0 | 0.00 | Totalh | 28/4/2016 | June 2016 | 100 |
| Former Yugoslav Republic of Macedonia | 18/4/2016 | 28/10/2016 | 1,439 | 4,371 | 16.9 (0.0–100) | 7 | 0.0 (0.0–0.19) | Modifiedh | 24/5/2016 | December 2016 | 100 |
| Greece | 18/8/2015 | 24/11/2016 | 221 | 994 | 10.0 (0.79–100) | 134 | 0.0 (0.0–22) | Totalh | 5/9/2015 | Ongoing | 76 |
| Kosovo | 6/6/2016 | 23/11/2016 | 1,415 | 2,019 | 20.0 (10.0–100) | 12 | 0.0 (0–32) | None | 11/7/2016 | Ongoing | 82 |
| Montenegro | 20/7/2016 | 7/8/2016 | 436 | 557 | 33.0 (6.2–100) | 0 | 0.00 | Modifiedh | 1/8/2016 | August 2016 | 100 |
| Serbia | 5/6/2016 | 1/10/2016 | 225 | 267 | 20.0 (2.46–100) | 0 | 0.00 | Modifiedh | 24/6/2016 | August 2016 | 100 |
| Turkey | 6/8/2013 | 2/12/2016 | 1,394 | 4,676 | 25.0 (0.51–100) | 976 | 0.0 (0–100) | Modifiedh | 2014 | Ongoing | 66 |
| Russia | 7/7/2015 | 19/10/2016 | 1,946f | 18,233f | 29.2 (0.05–100) | 1,573 | 2.0 | None | na | na | na |
The dates are: date of suspicion, for Turkey; confirmation date, for the former Yugoslav Republic of Macedonia.
As reported from the national authorities. For Kosovo, the number is as extracted from ADNS.
Still ongoing, in the countries where 100% is already achieved, newborn and newly introduced animals are being also vaccinated.
The complete distribution of intraherd morbidity is shown in Figure 6.
Unvaccinated calves younger than 4 months born from vaccinated mothers may not be included in this calculation because they have not been vaccinated yet, but still immunised.
As provided by National Research Institute for Veterinary Virology and Microbiology of Russia (VNIIVViM, Pokrov) http://vniivvim.ru/.
Based on clinical diagnosis.
Total culling is culling all animals in the affected farm; modified culling is culling only the affected animals.
In the following sections, the most relevant facts about LSD outbreaks in each of the affected and at‐risk countries are reported, based on information provided by the respective national authorities, and on the communication to the Standing Group of Experts on Lumpy Skin Disease in South‐East Europe.2
3.1.1. Albania
Albania experienced its first outbreak of LSD in the villages of Vlashaj, Shupenzë and Bulqizë in July 2016. A rapid spread throughout the country followed. In total, 6,235 clinically diseased cattle (the Table 1 shows only the ones confirmed in the laboratory) were reported in around 3,600 farms, with an intraherd morbidity of around 48%. Albania keeps 73% of its cattle population in small holdings that consist of one to four animals. Therefore, the disease impact on the affected farms and farmers was high.
Implemented control measures include the restriction of animal movements, the import ban of live bovines and their products from zones of the countries with reported outbreaks (Bulgaria, the former Yugoslav Republic of Macedonia, Greece, Kosovo, Montenegro and Serbia) and the improvement of monitoring and clinical surveillance activities in border regions. Awareness campaigns to clinical surveillance, vector control, such as the use of repellents, and to apply farm biosecurity were organised. Vaccination of cattle with homologous strain vaccine started on 26 July 2016 and by 22 September around 250,000 animals were vaccinated. Veterinary students were also involved to follow up the situation in vaccinated farms.
3.1.2. Bosnia and Herzegovina
Bosnia and Herzegovina has not been affected by LSD so far. To anticipate a potential introduction from Serbia or Montenegro, clinical surveillance was established in border regions. In addition to this, awareness raising campaigns were addressed to farmers in order to detect the disease as early as possible. Import restrictions are currently in place. A preventive vaccination campaign is being discussed and most likely taking place through 2017.
3.1.3. Bulgaria
The first outbreak of LSD in Bulgaria was reported in April 2016. Most of the outbreaks occurred in the province of Blagoevgrad, bordering the former Yugoslav Republic of Macedonia and Greece. Certain parts in the North and East that were preventively vaccinated are considered LSD‐free. However, 17 of 28 provinces throughout the country are affected.
Especially, small farms with low standards of biosecurity were concerned. These represent around 17% of the cattle population in Bulgaria and generally house between one to five animals.
In order to prevent a further spread, total stamping out, animal movement and vector control are performed, e.g. insecticide spraying applied on vector biotopes. High standards of biosecurity and clinical observance are emphasised as well. Vaccination with homologous strain vaccine was completed in July 2016, and no recent outbreaks have been reported thereafter.
3.1.4. Croatia
There are no reported outbreaks of LSD in Croatia so far. A preventive vaccination campaign with homologous strain vaccine on the whole cattle population was carried out to protect the cattle population from LSD. In addition to this, clinical surveillance on farms located in counties bordering with Bosnia and Herzegovina, Montenegro and Serbia is performed.
3.1.5. Former Yugoslav Republic of Macedonia
LSD emerged in the former Yugoslav Republic of Macedonia in April 2016. The first outbreak was reported in the south‐east of the country in an outdoor farming system. From there the, disease spread all‐over the eastern part of the country. Depopulation took place right after the first outbreak but then a modified stamping out policy was approached. Further control measures included the improvement of biosecurity, vector control and public awareness campaigns. Vaccination with homologous strain vaccine started in restriction zones first and was then completed covering the whole country.
3.1.6. Greece
Greece was the first country in EU affected by LSD in August 2015. Immediately after, an emergency vaccination campaign was started, which is still in progress mainly in southern parts of the country and in the islands.
The last reported outbreaks occurred in non‐vaccinated regions or not totally immunised vaccinated animals, as occurred in April 2016 with the re‐emergence of disease in a not completely vaccinated area (EFSA AHAW Panel, 2016) close to areas where the disease had occurred in 2015. In 2016, 11 regional units registered outbreaks for the first time (and in some of them sporadic cases) and the outbreak season extended to 7 months in total.
Vaccination with homologous strain vaccine started in the surroundings of outbreaks in affected regional units. In a next step, buffer zones in free areas were created and then progressively extended. When the disease crossed this buffer zone, it was decided to vaccinate the whole mainland first and consider the islands later, where the vaccination started early in 2017. Annual boosters are applied to maintain the immune status.
A total stamping out policy of affected farms was implemented coupled with vaccination, without differentiating between vaccinated and non‐vaccinated herds. Animal movement and vector control, biosecurity and public awareness campaigns are further measures to prevent disease spread.
3.1.7. Hungary
Up to now, no outbreaks of LSD have been registered in Hungary. Preventive vaccination is planned in case the disease approaches the border within 100 km or less. Special focus is laid on animal movement control, biosecurity and surveillance.
3.1.8. Kosovo
The first outbreak of LSD occurred in June 2016 and was followed by a rapid spread across the country over 3–4 weeks. The first case was reported close to the Serbian border. Vaccination with homologous strain vaccine was carried out primarily in municipalities along the north‐eastern and south‐eastern borders. The vaccination coverage up to December 2016 is around 70%. Partial culling of only diseased cattle is applied and disease control further relies on animal movement control, the improvement of biosecurity and monitoring of farms surrounding outbreaks. Awareness raising campaigns have been conducted to inform farmers.
3.1.9. Montenegro
Montenegro documented the first outbreak of Lumpy skin disease in July 2016. Subsequent outbreaks were concentrated in the north‐eastern part of the country. Around 80% of these outbreaks took place on 1,600 m or higher above sea level. This is reflected in the traditional cattle breeding system where animals are taken to graze on open mountain pastures from April to October. During winter, they are kept indoors.
Vaccination with homologous strain vaccine was completed in 2 weeks in August 2016 and prioritised affected and bordering regions with Albania, Kosovo and Serbia. New born calves and imported cattle are still being vaccinated. Improved biosecurity, import restrictions and public awareness campaigns have been implemented as well.
3.1.10. Romania
Romania has not been affected by LSD so far. In terms of preparedness for possible future events, local disease control centres from 12 counties in the South, south‐east and south‐west were informed and instructed to review their capacities. Diagnostic capacity was improved.
Awareness was also increased among farmers and veterinarians by training and the distribution of information material. Markets and fairs were banned for a certain time in those counties.
Vaccination is planned in Romania only if and after the first case of LSD is confirmed.
3.1.11. Russia
For the first time, LSD cases in the Russian Federation have been officially notified close to the Georgian and Azerbaijan borders in July 2015 and spread on the territory of three Caucasian regions of Russia: Dagestan, the Chechen Republic and North Ossetia. In 2016, LSD has become a large‐scale epidemic involving many more regions, namely the Krasnodar region, the Republic of Kalmykia, the Stavropol Krai, the Astrakhan region, Ingushetia, Volgograd, Karachaevo‐Cherkessiaya, Kabardino‐Balkaria. There were three outbreaks that occurred at long distance from the epidemic front: in Voronezh, Tambov, Ryazan and Samara regions that are located a considerable distance, about 700–1,000 km, from initially infected areas. Ukraine, Belarus and eastern Kazakhstan are considered to be at risk of pass‐over. Kazakhstan already reported its first case in late 2016. In Appendix D, a summary table is provided with information on LSD situation in Russian Federation at regional level.
The main route of long‐distance spread is most likely uncontrolled movement of animals. A potential transmission through non‐heat‐treated meat products is currently being investigated and diagnostic tests for the differentiation of field virus and vaccine strains are under development.
Most of cases have been confirmed clinically, there is no stamping out strategy in place. Biosecurity, vector control and the raise of public awareness by involving media and press are pursued. Limitations are linked to legislative gaps on LSD, no reliable data on the susceptible animal population, and laboratory monitoring and diagnosis of LSD. Considering vaccination, a heterologous attenuated vaccine based on sheep and goat pox strain is used at higher dose (x10), although no control of its efficiency is in place.
3.1.12. Serbia
Serbia was initially hit by LSD in June 2016. The first outbreaks were clustered in the south of the country and one jump over a large distance from the south to the north was reported and explained by illegal animal movement. The district of Pcinjski bordering Bulgaria, the former Yugoslav Republic of Macedonia and Kosovo comprises most of the cattle population in Serbia and simultaneously documented the majority of outbreaks.
Total stamping out in non‐vaccinated farms and partial stamping out in vaccinated farms has been performed. Biosecurity and the control of animal movement are implemented to prevent the spread of disease.
Vaccination with homologous strain vaccine was completed by August 2016 and subsequently only a single outbreak has been notified in an unvaccinated animal. Vaccination proved to be very effective in stopping the epidemic in southern Serbia and LDSV spread to central and northern parts was attributed to new born calves and imported cattle. Vaccination side effects have been reported for the Neethling strain.
3.1.13. Turkey
Turkey reported its first outbreak of LSD in 2013. In 2014, outbreak numbers rose dramatically and the whole country was infected and now considered endemic. Some outbreaks even occurred during the winter season and were found at all heights between 50 and 1,300 m. Control of animal movement and biosecurity measures are in place. Vaccination is carried out based on sheep and goat pox strain.
3.2. Spatial and temporal dynamics of LSD outbreaks in 2015–2016 in the Balkans
The temporal distribution of outbreaks per month along 2015–2016 is displayed in Figure 2.
Figure 2.

LSD outbreaks in 2015–2016 by month per country
- The figures are separated according to the magnitude of number of outbreak farms reported per country. The figure above shows 2015 and 2016, the one below refers only to 2016.
Figure 2 shows that in 2015 the infection was only present in Turkey and Greece. Next, Bulgaria was affected in spring of 2016, followed by the former Yugoslav Republic of Macedonia, Serbia, Kosovo, Montenegro and Albania. In 2016, two peaks of outbreaks can be distinguished: one in May for Bulgaria, Greece and Turkey, and another one in July in Serbia, Montenegro, the former Yugoslav Republic of Macedonia, and then another one in August–September in Albania and Kosovo, respectively, reflecting the later introduction of LSD in these latter countries. By the end of September 2016, outbreaks had stopped in most countries, with exception of Turkey, Albania and Kosovo, and four sporadic outbreaks in Greece and 20 in the former Yugoslav Republic of Macedonia.
In Figures 3 and 4, the spatiotemporal dynamics of the LSD outbreaks throughout Turkey and Greece in 2015 and in the Balkan region in 2016, respectively, are displayed by month compared to the cattle density at NUTS3 level.
Figure 3.

Spatiotemporal dynamics of outbreaks occurring in Turkey and Greece in 2015 compared to cattle density at NUTS3 level
- Black and grey dots indicate new and past outbreaks, respectively.
Figure 4.
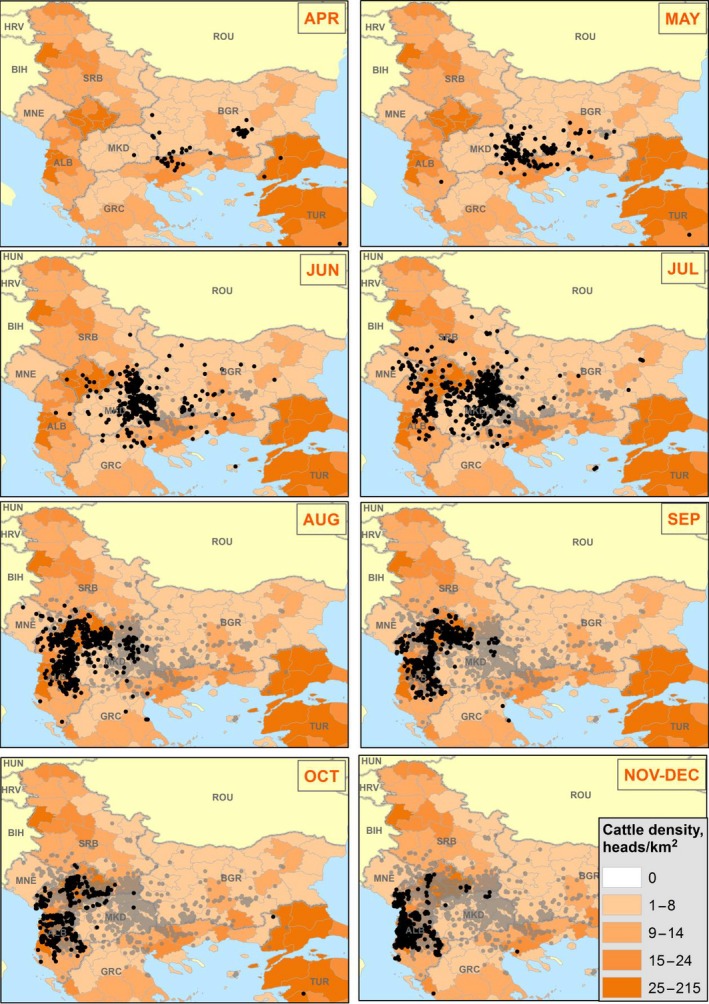
Spatiotemporal dynamics of outbreaks occurring in the Balkan region in 2016 compared to cattle density at NUTS3 level
- Black and grey dots indicate new and past outbreaks, respectively. White areas are where animal density is unknown.
From Figure 3, it appears how the outbreaks occurred in Turkey in May 2015 close to the borders of Greece could be the ones producing the subsequent incursion to Greece in August of the same year.
From Figure 4, it is evident the southeast–northwest direction of the spatial spread of LSD throughout the Balkan region, with intensification of the number of outbreaks in the summer month July and August, in Albania, Kosovo and the former Yugoslav Republic of Macedonia in particular, most likely due to higher abundance of vectors but also to the no culling policy in Kosovo and Albania and the low vaccination coverage in the latter country.
In Figure 5, the intraherd morbidity (number of affected animals out of the susceptible in each outbreak) of LSD outbreaks occurred in 2016 in south‐eastern Europe is displayed.
Figure 5.

Intraherd morbidity (number of affected animals out of the susceptible in each outbreak) of LSD outbreaks as reported in the Balkans up to December 2016
The high variation of the intraherd morbidity and the high rates in many farms is most likely linked to the small size of the affected farms in the region, the majority having less than 10 animals (Figure 6), and even in some countries like Albania and Montenegro, 75% farms have less than five animals (Figure 6), thus increasing the chance that the whole farm is affected.
Figure 6.

Distribution of farm size of the total cattle population in the affected countries
This can be seen from the distribution of the intraherd morbidity compared to the distribution of the number of susceptible animals in the affected farms is displayed in Figure 7.
Figure 7.
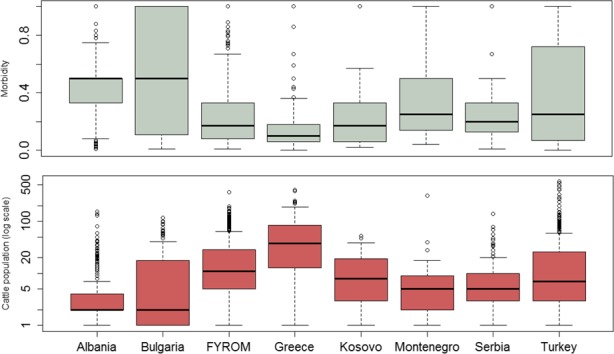
Distribution of intraherd morbidity (above) and of total exposed susceptible cattle population (below) in the affected farms
- Boxes are defined by lower, median and upper quartile, whiskers indicate 1.5 interquartile range
3.2.1. Speed of propagation of LSD – the case of Turkey
Suitable data on LSD transmission in Europe is limited, because vaccination is often applied rapidly after the first LSD outbreaks, and thus transmission under non‐vaccinated conditions cannot be derived from these sources. The case study of LSD outbreaks that occurred in 2014 in Turkey was chosen because until October 2014 vaccination was not yet applied in Turkey and the population could be considered mostly LSD naive. Moreover, in some aspects, the climate and farming systems are like those in some southern European countries. The spatiotemporal dynamics of LSD outbreaks as reported in Turkey in 2014 is shown in Figure 8.
Figure 8.
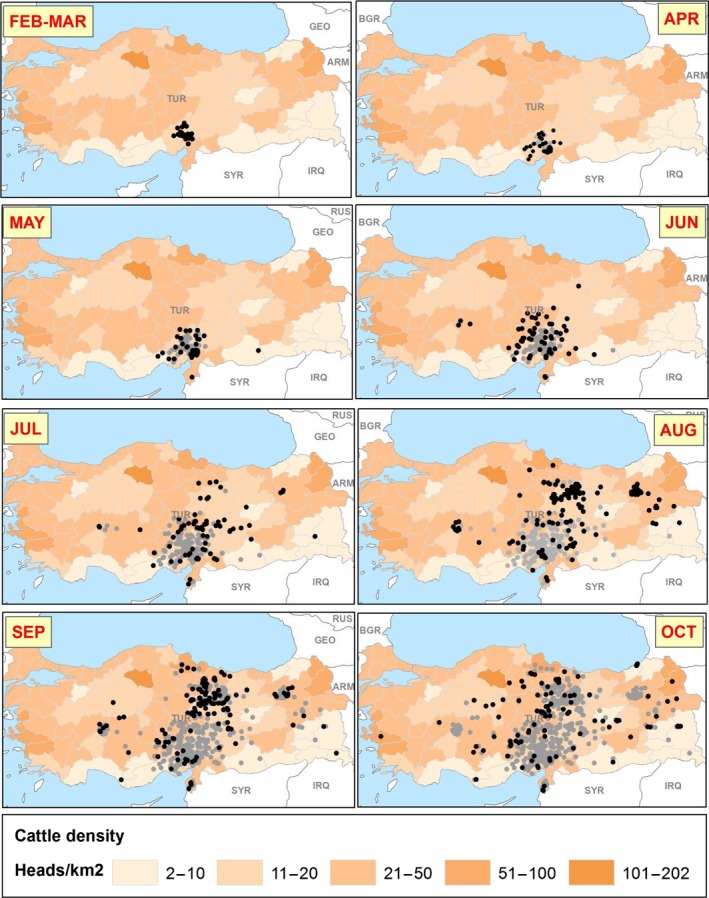
Spatial distribution of monthly outbreaks in Turkey in 2014 in the period when no vaccination was yet implemented
- Black and grey dots indicate new and past outbreaks, respectively.
To study the distribution of time and space between outbreaks, a network of the LSD outbreaks in Turkey until October 2014 (as reported to ADNS) was built by assuming that each outbreak could generate the next closest one in distance (Figure 9).9
Figure 9.
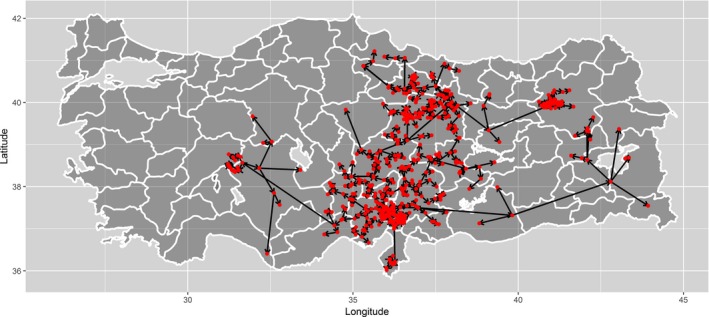
Network of outbreaks based on outbreak generating the next closest one in distance
Based on that, the number of days between an outbreak and the next closest one in distance was calculated in order to investigate potential time lags between outbreaks (Figure 10). In Figure 10, the median number of days was estimated to be 20, and the upper quartile 36, meaning that half of the outbreaks occurring in closest proximity would occur within 20 days.
Figure 10.
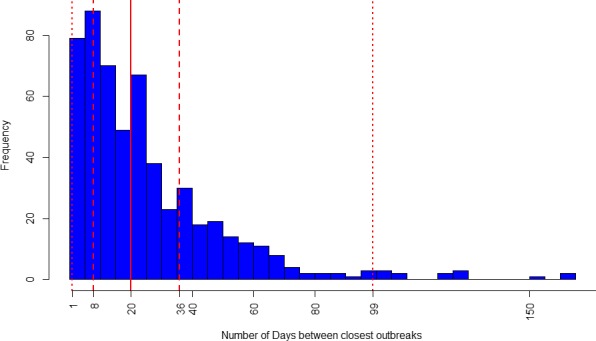
Frequency of the closest (in distance) LSD outbreaks in Turkey in 2014 according to the intervals (number of days) of occurrence among them
- The vertical dashed lines represent the 2.5%, 25%, 75% and 97.5% percentiles. The solid line is the median.
Since LSD incubation in the field ranges from 2 to 4 weeks (EFSA AHAW Panel, 2015), it could be argued that a surveillance set for approximately 1 month around an outbreak farm would be able to detect the majority (75%) of outbreaks occurring in close proximity. This is just a hypothesis which needs to be confirmed by more accurate analysis, since it is not possible with the available data to establish which outbreak was causing other ones reported: it could be considered that outbreaks could be causing any subsequent outbreak in Turkey. Moreover, the degree of underreporting would be a major bias.
For completeness, the Figure 11 shows the distribution of outbreaks according to their proximity (distance in km). In Figure 11, the median of the distance was estimated to be 10 km, and the upper quartile 22, meaning that half of the outbreaks occurring in closest time would occur within 10 km. This is in line with previous studies: according to the findings, both from mathematical model and field observations in Israel (EFSA AHAW Panel, 2015), most LSD spread occurs over a relatively small distance, up to approximately between 10 and 20 km, as would be expected for vector dispersal, but with some transmission over much longer distances, as would be expected for less frequent long distance movement of infected cattle.
Figure 11.

Frequency of the closest (in time) LSD outbreaks in Turkey in 2014 occurring as the proximity in space (km)
- The vertical dashed lines represent the 2.5%, 25%, 75% and 97.5% percentiles. The solid line is the median.
Similarly, using information regarding distances between outbreaks and time lag between outbreaks, a histogram of the speed of propagation (number of km per day) derived from the spatial pattern of outbreaks was estimated and is presented in Figure 12.
Figure 12.

Median, lower and upper bounds (95% CI) of the speed of propagation of LSD derived from the spatial pattern of outbreaks, as reported in Turkey in 2014
- The vertical dashed lines represent the 2.5%, 25% (these coincide), 75% and 97.5% percentiles. The solid line is the median.
The median speed of propagation was estimated to be 1 km/day, with a 95% CI of 0 to 15 km/day, again reflecting the fact that some less frequent transmission may occur at faster rate due to the long‐distance movement of infected cattle. These results are in line with field observation (EFSA AHAW Panel, 2015) and with recent analysis, although performed in different way, by Mercier et al. (2017), still they should be interpreted with caution for the same reasons and assumptions expressed above.
3.3. Vaccination against LSD
3.3.1. Temporal dynamics of outbreaks related to vaccination coverage and temperatures
Vaccination campaigns against LSD using live homologous vaccine were extensively conducted across all the Balkan affected regions, including Croatia, which was not affected, by achieving basically a total coverage by the end of 2016, with few areas left unvaccinated or not fully vaccinated (e.g. Albania and parts of Greece). In Figures 13–18, the temporal dynamics of the monthly occurrence of outbreaks is reported according to the suspicion dates for Greece, Bulgaria, Serbia, Montenegro, the former Yugoslav Republic of Macedonia, Kosovo and Albania together with the progressive vaccination coverage (% animals vaccinated) and the fluctuations of min, max, average temperatures (Figures 13–18).
Figure 13.
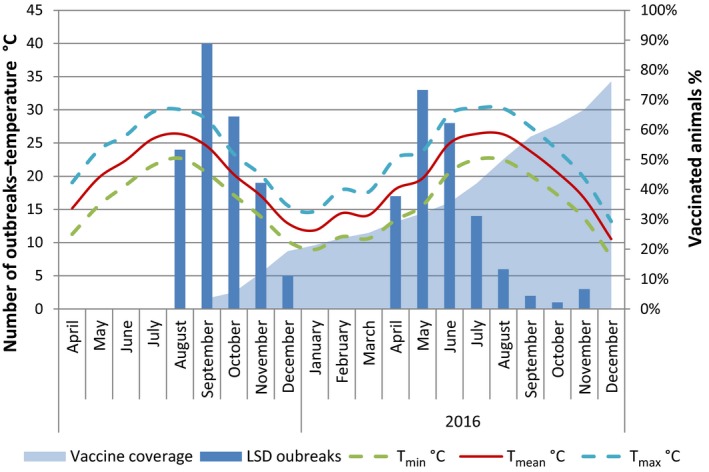
Number of outbreaks per month, temperatures and percentage of vaccinated animals in Greece 2015–2016
Figure 18.

Number of outbreaks per month, temperatures and percentage of vaccinated animals in Kosovo in 2016
- Temperatures are expressed in °F in order to be better displayed along the secondary axis scale.
In Bulgaria, Serbia and Montenegro, full vaccination coverage was achieved 2–3 months after the first outbreak reported, as shown in Figures 13, 14 and 15, respectively.
Figure 14.

Number of outbreaks per month, temperatures and percentage of vaccinated animals in Bulgaria in 2016
- Temperatures are expressed in °F in order to be better displayed along the secondary axis scale.
Figure 15.
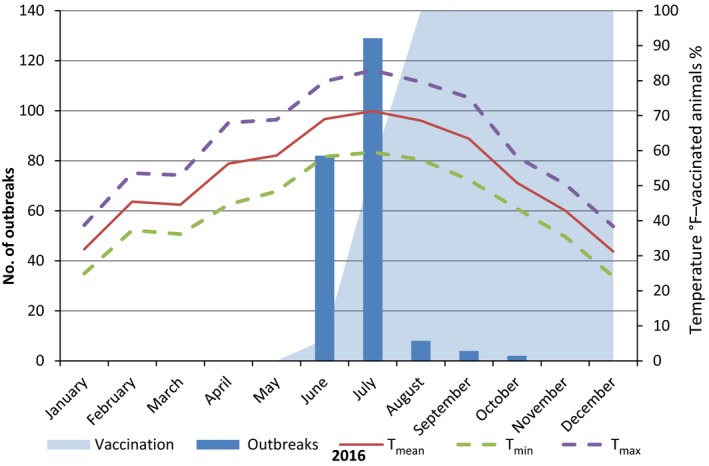
Number of outbreaks per month, temperatures and percentage of vaccinated animals in Serbia in 2016
- Temperatures are expressed in °F in order to be better displayed along the secondary axis scale.
Figure 17.
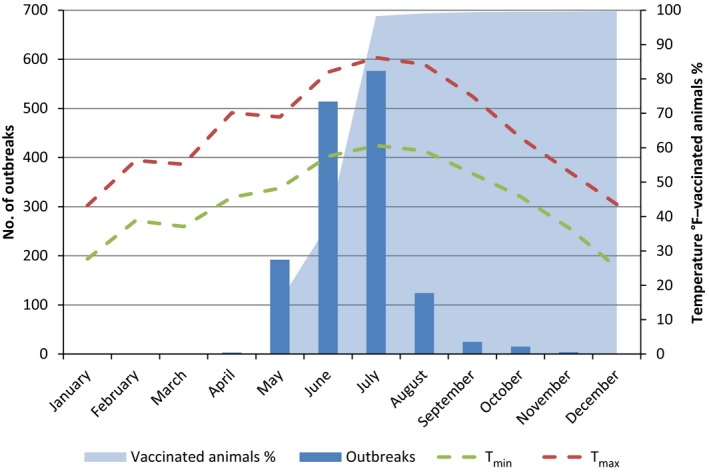
Number of outbreaks per month, temperatures and percentage of vaccinated animals in the former Yugoslav Republic of Macedonia in 2016
- Temperatures are expressed in °F in order to be better displayed along the secondary axis scale. T mean is not available.
In the case of Albania, the vaccination coverage up to end 2016 reached around 54%, and it is still in progress (Figure 19). This, together with the no culling policy applied, i.e. the affected herds and animals are not removed, may be ones of the reasons for the high number of outbreaks reported in this country.
Figure 19.
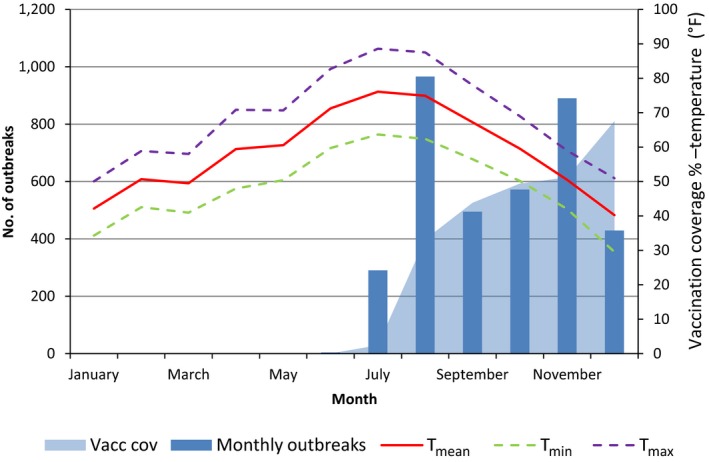
Number of outbreaks per month, temperatures and percentage of vaccinated animals in Albania in 2016
- Temperatures are expressed in °F in order to be better displayed along the secondary axis scale.
From the graphs shown in the figures above, it is evident that the LSD epidemic follows a clear and marked seasonal pattern, with a peak of outbreaks between April and September and a winter stop, which is linked to the transmission through vectors, and their presence and abundance.
Considering vaccination, not surprisingly, where higher quicker vaccination coverage (percentage of vaccinated animals) is achieved, the lower the number of monthly outbreaks recorded and the quicker the outbreaks fade out (Figures 13–16). On the contrary where the vaccination coverage is protracted or still not complete, outbreaks are still registered even when the temperatures start decreasing (Figures 13 and 19). This is in line with the results of the previous EFSA statement where the vaccination effectiveness of the homologous live vaccine against LSD was investigated and found to be at least 80% (EFSA, 2016), thus vaccination is what strongly influences and limit the LSD spread.
Figure 16.
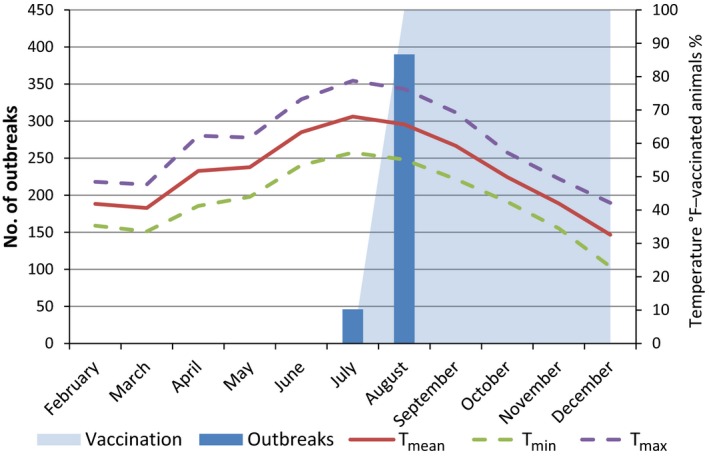
Number of outbreaks per month, temperatures and percentage of vaccinated animals in Montenegro in 2016
- Temperatures are expressed in °F in order to be better displayed along the secondary axis scale.
The situation in Turkey is different and cannot be directly compared with the previous scenario, mainly because the vaccination was carried out with the heterologous vaccine based on sheep pox strain, which is known to be less effective than the homologous strain vaccine (Ben‐Gera et al., 2015). The yearly vaccination coverage achieved was around 10% in 2014, 46% in 2015 and 66% in 2016 (monthly data on vaccination coverage are not available), and, although showing a marked decreasing trend since the first year of epidemics, LSD outbreaks are reported even in 2016 that is the fourth year of LSD epidemics, which started in Turkey in August 2013 (not shown in the graph), and the third year of vaccination (Figure 20).
Figure 20.

Number of outbreaks per month, temperatures and vaccination coverage in Turkey in 2014–2016
3.3.2. Vaccination effectiveness: the case study of Albania
The LSD situation in Albania is a good case study to verify the protective effect of vaccination as indicated in the previous section. The Kaplan–Meier survival curves were created for vaccinated and unvaccinated herds and animals experiencing an outbreak event or not, with follow up periods considered as discussed in Section 2.2 on methodology (Figures 22 and 23).
Figure 22.
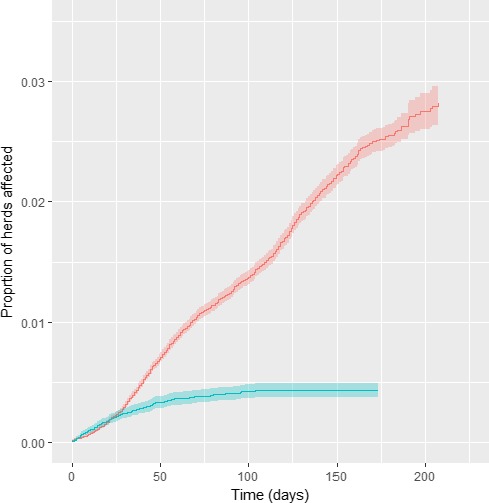
Cumulative proportion of vaccinated (blue) and unvaccinated (red) affected herds in Albania, according to follow up time starting with occurrence of the index case in each district
Figure 23.
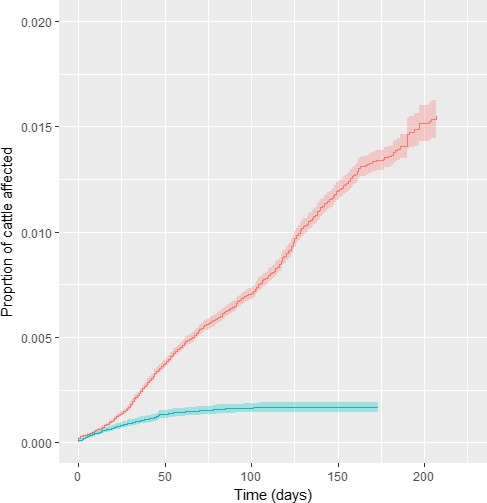
Cumulative proportion of affected animals in vaccinated (blue) and in unvaccinated farms (red) in Albania, according to follow‐up time starting with occurrence of the index case in each district
To correctly carry out the analysis, the spatiotemporal progression of the vaccination campaign should be considered. In Figure 21, a map about vaccinated animals in each NUTS region along time is displayed, with the new outbreaks per each time window (Figure 21). It is evident how the reactive vaccination campaign progresses from east to west, along with the disease spread.
Figure 21.
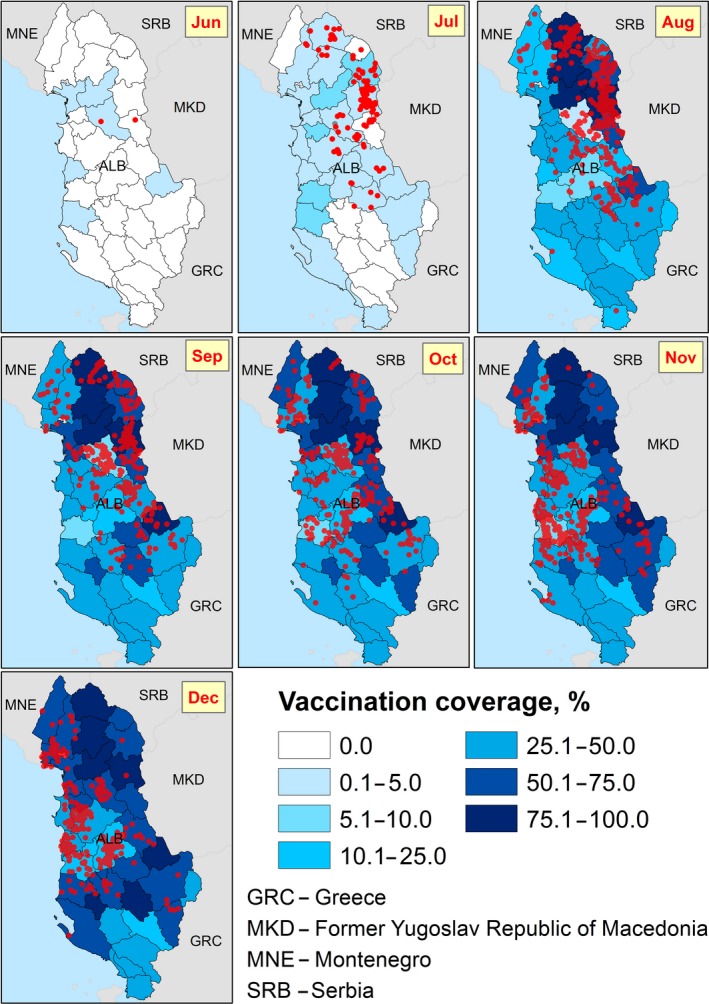
Spatiotemporal dynamics of LSD outbreaks compared to the development of vaccination campaign (% of vaccinated animals) in each NUTS region along time in Albania
Since the vaccination campaign in Albania was carried out alongside LSD spread (reactive vaccination), non‐vaccinated herds in districts affected at a later stage would be followed up while no actual risk for infection really existed. Similarly, the vaccination was conducted first in close proximity to the affected herds, where the actual risk of getting affected was higher.
To overcome this potential bias, in the analysis the time of follow up for each district is defined by the occurrence of the index case in each district. This analysis demonstrated a significant protection provided by the vaccine (Figure 22).
The analysis was carried out also by weighting according to the number of affected and non‐affected animals and showed a higher protection provided by the vaccine (Figure 23).
In Table 2, the Cox regression results are displayed for vaccinated vs non‐vaccinated herds and by weighting according to the number of vaccinated vs non‐vaccinated cattle in a farm.
Table 2.
Cox regression for vaccinated vs non‐vaccinated herds and vaccinated vs non‐vaccinated cattle
| Coef | Exp(coef) | SE(coef) | z | p | |
|---|---|---|---|---|---|
| Vaccinated/non‐vaccinated (herd level) | −1.16453 | 0.3120 | 0.07055 | −16.51 | < 2e‐16 |
| Vaccinated/non‐vaccinated herds (by weighting according to the farm size) | −1.4892 | 0.2256 | 0.0679 | −21.9 | < 2e‐16 |
From the results showed above, the HR is 0.312 for the herd level analysis and 0.225 when the farm size is considered; thus, according to this results, the vaccine effectiveness is 68.8% (CI: 64.2; 72.8) and 77.4% (CI: 74.2; 80.3), respectively, in line with that previously estimated in Greece (EFSA, 2016). The type of production (dairy, beef and mixed production) was considered as a covariate, but showed not to have any significant effect.
3.3.3. Potential adverse effects of vaccination – the case of Croatia
Croatia has not been affected by LSD so far, but a preventive vaccination campaign was implemented using live, attenuated homologous LSD virus. This is the best case to explore potential adverse effects post‐vaccination, in the absence of the field virus that could interfere with these effects. The post‐vaccination adverse effects were recorded in Croatia by passive surveillance, reported by the farmers and confirmed by the veterinarians. Table 3 shows the entity of adverse effects compared to the vaccinated population.
Table 3.
Overview of vaccination campaign in Croatia and adverse effects possibly linked to the vaccine
| No. vaccinated animals | No. vaccinated farms | No. farms with adverse effectsb | No. animals with adverse effectsb | No. dead animals reportedb |
|---|---|---|---|---|
| 431,367 | 28,686 | 55 (0.19%)a | 399 (0.09%)a | 102 (0.024%)a |
In brackets the proportion related to the vaccinated farms or animals.
Source of data: Veterinary Pharmacovigilance system.
In Figure 24, the time lag between vaccination and advent of adverse effects is displayed. The majority occurred within 2 weeks after vaccination (Figure 24).
Figure 24.

Distribution of time lag between vaccination and insurgence of adverse effects
The relative frequency of symptoms reported is shown in Figure 25, according to the number of times they were reported at farm level (not at animal level, as e.g. the number of deaths was recorded) in the Croatian farms where adverse effects were recorded.
Figure 25.
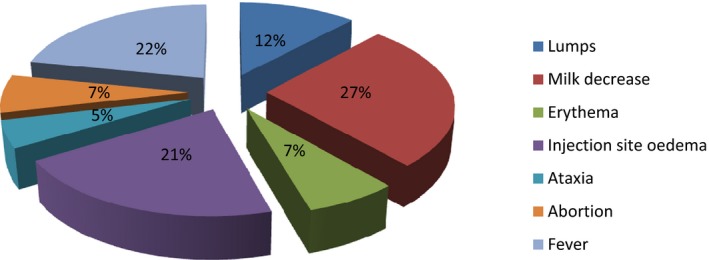
Relative frequency of type of symptoms in the farms where adverse effects were recorded
The recorded symptoms were attributed to vaccination because of time of insurgence, but due to the generic nature of some of the symptoms recorded (i.e. milk decrease, fever) other aetiology cannot be excluded, thus leading to the hypothesis that this could be an overestimation of the adverse effects due to vaccination.
3.4. Climatic influence and vectors
As shown in Figures 13–19, the LSD temporal dynamics has a clearly seasonality most likely linked to the vector survival, which is linked to temperature and humidity. Opportunity maps were created to show the areas of the LSD affected and at‐risk region of south‐eastern Europe and the period of the year suitable for vector survival, considering the number of days in a month when the minimum temperature was above 10°C (Figure 23). This value was chosen as temperature threshold for the survival of some of the recognised LSD vectors, such as Stomoxys calcitrans (Lysyk, 1998) and Aedes aegypti (Rueda et al., 1990); this would fit as well for Culicoides (EFSA, 2017). In the map, the green colour indicates that there was at least 1 day for which the minimum temperature was above 10°C, thus favourable conditions for the vector. Blue areas are those for which no day in a month was above 10°C, thus unfavourable conditions. The shades of greens indicate the number of days with minimum temperature above 10°C, thus the darker colour, the more suitable conditions for vectors. In Figure 26, the opportunity map for 2016 is shown, for the year 2014 and 2015 see Appendix B.
Figure 26.
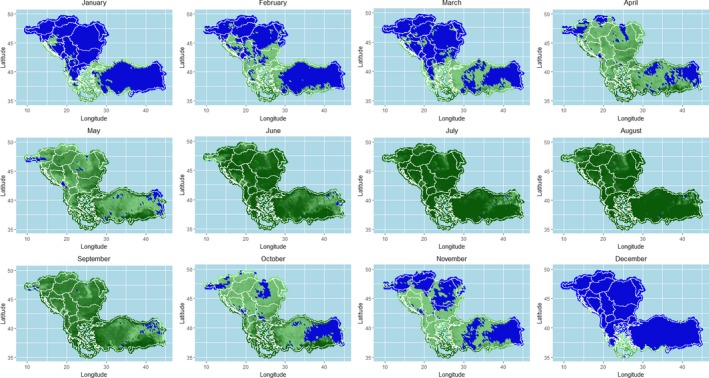
Opportunity map for vector survival in south‐eastern Europe considering minimum temperature above 10°C
- Blue zones represent the areas where vector survival is hampered; green zones indicate number of days in the month in which conditions are favourable. Darker colours indicate longer periods with favourable conditions.
The map above shows that vector survival would be possible throughout the entire year in many southern Balkan regions, such as in Greece.
3.5. Indications for the survey and collection of potential LSDV vectors
As already reported in the first EFSA opinion on LSD (EFSA AHAW Panel, 2015), the few experimental trials and field evidence suggest the involvement of haematophagus arthropod vectors in LSDV transmission among cattle by the mechanical route, although the role of each species is not well documented. The presence and abundance of all potential LSD vectors is certainly one of the major risk factors contributing to LSD spread and persistence (Kahana‐Sutin et al., 2016), and the importance of different mechanical vectors in the transmission of LSDV is likely to vary in different geographical regions, depending on the environment, temperature, humidity and abundance of the vectors.
As recommended previously by EFSA AHAW Panel (2015), in order to effectively control LSDV in affected countries, a comprehensive understanding of the ecology of different blood‐feeding and biting arthropod species in the cattle farming setting is required, the relevant vector species and their capability to transmit the virus should be experimentally investigated. The infection rate within each suspected vector species should be evaluated and the mode of transmission (mechanical/biological) should be investigated in detail.
3.5.1. Rationale and objective
Beyond experimental laboratory trials on vectors that serve to elucidate vector competence, field data on seasonal vector abundance collected during current outbreaks of vector‐borne diseases are of utmost importance to provide insights on vector capacity especially when the vector species involved in disease transmission are not fully understood as in the case of LSD. The current LSD epidemics in south‐eastern Europe could be an excellent field case for this purpose.
Vector capacity is dependent on vector abundance and its seasonal dynamic, as well as vector competence. When determining various vector abundances in a certain area, relative abundance can be used. This is done by collecting vectors using dedicated traps, counting individual vectors at certain time points over a time period and dividing each of these counts by the total count of the vector species during the trapping period. This allows the description of vector population dynamics and a comparison among various vectors to point to the most relevant one (highly abundant at the time of an outbreak). This methodology was implemented successfully for identifying potential LSDV vectors in Israel pointing to the stable fly as the most relevant vector in dairy farms, now awaiting confirmation in further competence studies (Kahana‐Sutin et al., 2016). Vector competence is usually investigated under laboratory conditions, but initial hints can be elucidated from identifying the pathogen in the potential vector in the field. This also gives information on the vector's actual attraction to the animal host, which is more accurate than vector abundance in the survey area. It should be noted that finding pathogens in blood meals of haematophagus arthropods does not necessarily indicate competence, as arthropods that acquire infected blood may not be able to further transmit the pathogen to a naïve host. Moreover, detection of viruses in vectors is challenging due to their low concentration in vectors and the preservation method of trapped vectors.
Therefore, the aim of this section is to provide some indications for vector collection to study seasonal dynamics and abundance, and when possible, LSDV detection in the collected arthropods. This could be of use for the LSD‐affected and at risk countries in order to initiate vector collection in farms or locations where outbreaks have already been reported or will be newly reported. Besides, more detailed indications on life cycle, traps and trapping operations and identification of samples for each vector species potentially involved in LSD transmission (ticks, Culicoides, mosquitoes, stable flies, horn flies and tabanids) are provided in Appendix C.
3.5.2. Field sampling strategy
3.5.2.1. Target vectors
Following the literature, haematophagous arthropods that are likely to serve as LSDV vectors include the following taxa: ticks (Acari: Ixodidae), mosquitoes (Diptera: Culicidae), Culicoides biting midges (Diptera: Ceratopogonidae), biting flies like stable flies or horn flies (Diptera: Muscidae) and horse flies (Diptera: Tabanidae) (EFSA AHAW Panel, 2015). Thereafter, our trapping protocols refer only to these vectors and do not include other haematophagous vectors such as sand flies.
The reason to include Culicoides is based on the well described association between Culicoides and cattle. Considering the rapid spread of LSD during the last outbreaks in Europe, Culicoides are an important group of farm‐associated insects, which are in general ubiquitous, highly abundant, highly diverse in number of species within the same group and present almost all year round. Assuming that LSDV is mechanically transmitted, biologically transmitted agents (e.g. BTV) outbreak models may not reflect the same spread as for mechanically transmitted ones. Culicoides may be important in a certain farm setting, but not in another, depending on their prevalence. Additionally, although Chihota et al. (2003) could not demonstrate transmission in one Culicoides species, the major drawback of this study is that no positive control was included. Therefore, Culicoides should not be excluded as a potential mechanical vector of LSD.
Other insects may be trapped in the suggested traps anyway.
3.5.2.2. Survey location and related data
The survey area should be defined ahead and include several farms that are free of and affected by LSD. A survey map with individual farm locations should be produced. The survey area can include various farm types and various geographical locations to represent actual farming structures with different ecological habitats. For each country, LSD hot spots should be identified and a final survey area should be determined according to available resources. Additional data that would be necessary for further analyses include weather and climatic data from the nearest weather station and the country's meteorological services. Maximum and minimum temperatures can be recorded in the field by placing a thermometer. Specific localisation (coordinates and altitude) of the traps should be done using a GPS.
3.5.2.3. Survey duration and trapping frequency
Ideally, an annual survey should be performed, as in some cases outbreaks have been reported during the winter season. For an initial survey, it is recommended to start trapping in March or April and end by November. It is best to follow time points of previous outbreaks and collect data at least 1 month before and 1 month after. The ideal frequency of trapping is 2 nights per week or, if not possible, at least once a week or every 2 weeks. Depending on manpower capacity and trapping methodology as described below, twice a month but not less than once a month is also suitable. Each trap should be placed for 24–48 h.
3.5.2.4. Trapping methods and vector storage
Traps are different for each vector taxon, as they are based on biological and ecological parameters that best attract each of them. These comprise activity time, flight height, breeding behaviour and host searching behaviour including visual and chemical cues. Here, we focus on the most frequently used traps and easy‐to‐implement methodologies for the above listed vectors. Thereby, the aim of obtaining vector counts to describe vector population dynamics and, when possible, for further LSDV detection can be fulfilled. The advantages and disadvantages for each method are highlighted in Table 4. Focus is set to methods that allow both short‐ and long‐term monitoring for a given scenario (i.e. outbreak, surveillance). Collection procedures vary according to trap and needs, ranging from no collection (vector counts) to destructive collection (e.g. glue), collection in ethanol and live collection. Collected arthropods can be kept in 70% ethanol or frozen at −20°C for further testing of LSDV presence.
Table 4.
Advantages and disadvantages of traps types for different vector species
| Vector | Trap | Advantages | Disadvantages |
|---|---|---|---|
| Ticks | Direct collection |
|
|
| Culicoides | Light trap |
|
|
| Mosquitoes | Light trap and/or CO2 trap |
|
|
| Stable fly | Various glue traps |
|
|
| Horn fly | Sweeping net |
|
|
| Tabanids | Liquid trap |
|
|
| Canopy trap |
|
|
|
| L‐shape sticky trap |
|
|
|
| Flies on host | Counting |
|
|
| Vacuum‐based trap |
|
|
Further methods that could be used for specific purposes or situations can be found elsewhere, but they are out of the scope of this document.
Trap location is crucial for trapping success and should consider the trapping operation (electricity needs, certain height and visual exposure, permanent vs disposable traps) and weather conditions (rain, wind and sunlight). The traps should be located in the same place during the survey period, ideally in the same location in each participating farm (e.g. near the major pen, milking area, feeding points, harness station, etc.) and be protected from curious animals and humans.
Although there are examples for available identification keys, it is strongly recommended and perhaps unavoidable, to consult a local entomologist who is familiar with some entomological survey methodologies and the identification of trapped arthropods.
3.5.3. Identification methods
Each trapping method will yield the targeted vector as well as other insects. Sorting of trapped insects is tedious and time‐consuming. This should be taken into consideration when planning trapping frequencies, with the idea that insect numbers can be estimated and if stored correctly, can be sorted later. Initial sorting to higher taxa can be done by non‐expert trained personnel; however, species identification morphologically or molecularly will need an expert in entomology and molecular biology. Basic keys for each taxa are available in the literature and online, still, it is not obvious for non‐entomologists and effort should be put into contacting veterinary or medical entomologists for a basic training of vector identification. Molecular identification is a destructive method and it is recommended to use it only if further confirmation is needed. Numerous molecular identification protocols are available in the literature. It is highly recommended to use BOLD (Barcoding) curated sequences database (http://boldsystems.org/). Molecular identification, however, can be combined with LSDV detection as both require the nucleic acids extracted from the vector.
3.5.4. Data analysis
The basic data unit obtained from a survey is the number of vectors per trap. As mentioned earlier, the most efficient way to determine vector population dynamics is by calculating its relative abundance over the survey period. It is important to determine the sampling unit for all vectors trapped (per trap/on host collection/on host count, per location, per night/collection duration, per week/month, No. adults/trap/night, average adults/trap/night, etc.) in order to compare among different vectors. After relative abundance was calculated, it can later be associated with biotic factors such as outbreak time points, other insects, cattle breed, sex and age, and vegetation; as well as with abiotic factors such as geographic region, climatic region, farm type and management, and different weather parameters. These associations are important for the prediction of vector populations and risk of diseases.
4. Conclusions
Given the results of the epidemiological analysis, it can be concluded that:
Since the introduction into Turkey in 2013, LSD virus outbreaks have expanded northwards around the Black Sea, on the west side through south‐eastern Europe and on the east side through the Caucasus, reaching Russia up to 54° N.
Since the beginning of the epidemic in south‐eastern Europe in 2015 (excluding Turkey), over 7,600 LSD outbreaks with around 12,800 affected animals were reported.
In south‐eastern Europe, LSD spread follows a clear seasonal pattern, with most outbreaks occurring between May and August. This concurs with the opportunity maps for vector survival that follow temperature fluctuations. These maps also show that vector survival would be possible throughout the entire year in many regions of Greece. Thus, warm temperatures and related abundance of insect vectors could be considered one of the main risk factors for LSD spread.
The farm structure in the region is characterised by very small farms, the majority with less than 10 animals, and the higher intraherd morbidity observed is linked to that: once LSD is introduced, small farms are likely to have higher possibility of high within farm prevalence.
According to the analysis done for LSD in Turkey until October 2014 (no vaccination performed) and in line with what was previously estimated by the mathematical model in EFSA outputs, most LSD spread occurs over a relatively small distance, approximately between 10 and 20 km, and the speed of propagation was estimated to be mostly (75% percentile) up 2 km/day, with few values (95% CI) up to 15 km/day. This is in agreement with the vector‐borne pattern of LSD, thus transmitted mainly by vector at short distance, and with some transmission over much longer distances, and faster spread rate, as would be expected with less frequent long distance movement of infected cattle. In relation to that, the proximity to affected farms can be considered a further risk factor for LSD spread.
Mass vaccination campaigns with a live homologous vaccine against LSD were carried out at regional level in south‐eastern Europe in all affected countries and Croatia. These campaigns resulted in a few months’ time in 90% vaccination coverage of the animal population, indicating a high level of responsiveness and preparedness of the national authorities of those countries to control the epidemics.
Where almost total vaccination coverage was achieved, no more outbreaks were reported since the beginning of October 2016, only few sporadic outbreaks have been reported: four in Greece and 20 in the former Yugoslav Republic of Macedonia. In some cases, e.g. Bulgaria, the epidemics does not reach the expected peak of outbreaks in August, rather it dies off earlier.
The protective effect of vaccination is supported by the results of the analysis of the vaccination effectiveness in the case study of Albania, which is about 70% at farm level and 77% at animal level. In the same analysis, no significant differences in the probability of LSD infection were found between different types of production (dairy, beef or mixed production). This evidence shows that mass vaccination with homologous strain is one of the factor that mainly influence LSD spread and supports the findings of previous EFSA outputs by analysing Greek data and of the studies from Israel. These highlighted that the vaccination with the live homologous vaccine, when applied as uniformly as possible across the population with high coverage is the most effective measure for reducing LSDV spread.
Adverse effects to live homologous vaccine applied in situation of disease freedom (Croatia) were reported on 0.19% of the vaccinated farms, including 0.09% of the total animals affected and 0.02% deaths. The majority of symptoms were reported within 2 weeks after vaccination and included fever, decrease in milk production and oedema at injection site.
Given the current epidemiological situation in the affected and at‐risk countries and the timeline available for this first report, there has been a very high level of commitment and collaboration of the veterinary services from the countries involved in this data collection project.
-
The presence and abundance of potential LSD vectors is considered to be one of the major risk factors contributing to LSD spread and persistence, therefore the most relevant suggestions for vector collection to study seasonal dynamics and abundance are provided in this report. The following can be concluded with respect to those suggestions:
-
1
– Potential vectors for LSD can be identified by epidemiological evidences using their abundances during outbreak season.
-
2
– Sampling methods for potential vectors of LSD are available for implementation depending on the scenario and the aim (i.e. epidemics, surveillance, LSD detection on vectors).
-
3
– Each targeted vector requires specific sampling methods and training/expertise on taxonomy.
-
4
– Direct sampling on host is the most appropriate sampling method for ticks and farm associated haematophagus flies. Traps are appropriate for Culicoides (i.e. light traps) and mosquitoes (i.e. light and CO2 traps).
-
5
– Most of the methods could be applied in a regular annual basis depending on resources and aim of sampling.
-
1
5. Recommendations
Given the data collection process conducted so far and the analysis that were possible with the data available, the following is recommended:
Data quality and quantity should be improved and the data models as provided by EFSA (Appendix A) should be followed as much as possible, thus allowing univocal records of entries and a complete set of information.
The unique identifier of farms (e.g. farm ID) should be used across all databases to allow connection between different databases, namely the ones on livestock population, outbreaks, vaccination and laboratory results. This would allow more in‐depth analysis. If possible, the unique identifier of farms should be also included as a variable in the ADNS system, so to be able to indicate which farm is involved in each outbreak reported.
Improvement of data quantity, quality, the adherence to the proposed data model (so to allow better comparability and harmonisation across countries) and time availability, will enable further analysis on different epidemiological aspects to enhance the mathematical models used previously, as well as to determine other potential risk factors for LSD spread and persistence. This will provide more robust estimates for transmission parameters that are directly applicable to the region, as well as to better assess the effectiveness of vaccination, based on field data.
Concerning the surveillance on possible further LSD cases in 2017, given the current situation where most animals have been vaccinated with live LSDV homologous strain, therefore without DIVA possibilities, the most feasible option for surveillance seems to be the immediate notification of clinical suspected cases, followed by the confirmation of LSD in those animals by laboratory testing including the differentiation of field virus from vaccine strain, as indicated in the data model in Appendix A.
The detection of confirmed new LSD cases should be also followed by an in‐depth and standardised outbreak investigation to better understand the infection sources and the risk factors possibly associated to this occurrence.
Concerning adverse effects of vaccination, these should be collected systematically, and where possible, at animal level, including quantitative data about, for example, milk production loss.
Concerning the indications on field surveys on potential LSD vectors:
Ad hoc trapping surveys for calculating relative abundance of potential LSD vectors should be carried out by targeting a number of farms experiencing LSD outbreaks, to be followed up during the whole LSD season, from the first LSD cases in spring until the last one in autumn. Moreover, long term studies (i.e. biannual, triennial) would give more accurate information about species compositions in farms and seasonality of potential vectors of LSD.
Collection methods of vectors should take into account the option for testing the presence of LSD virus as a preliminary indication of potential vectors at field level.
Abbreviations
- AHAW Panel
EFSA Panel on Animal Health and Welfare
- ANDS
Animal Disease Notification System
- BTV
Bluetongue virus
- CGMS
Coordination Group for Meteorological Satellites
- GIS
Geographic Information System
- HR
hazard ratio
- JRC
Joint Research Centre
- LSD
lumpy skin disease
- LSDV
lumpy skin disease virus
Appendix A – Data models
1.
Tables A.1–A.4 show the data models proposed for the data collection. The farm ID codes identifying each farm should be univocally the same across all databases.
Table A.4.
Data model of adverse effects of vaccination (to be connected to the one on vaccination)
| FarmID | AnimalID | Adverse effect | Lab Test | Result | Symptom ‘Fever’ | Symptom milk reduction | Symptom nodules | Symptom other | Insurgence date of symptoms | Vaccinated dead |
|---|---|---|---|---|---|---|---|---|---|---|
| Y/N | Type of test | Field/vaccine strain | Y/N | Y/N; % reduction | Y/N | <type> | <Date> | Y/N |
Table A.3.
Data model of vaccination data
| FarmID | Country | Area | Vaccination date | Vaccine name | Number of vaccinated animals |
|---|---|---|---|---|---|
Appendix B – Opportunity maps
1.
Opportunity maps (Figures B.1 and B.2) for vector survival in the region surrounding affected countries considering minimum temperature above 10°C, where the blue zones represent the areas in which the temperature is considered to be hampering vector survival and the shades of green indicate number of days in the month in which conditions are favourable (darker colours indicating longer periods with favourable conditions).
Figure B.1.
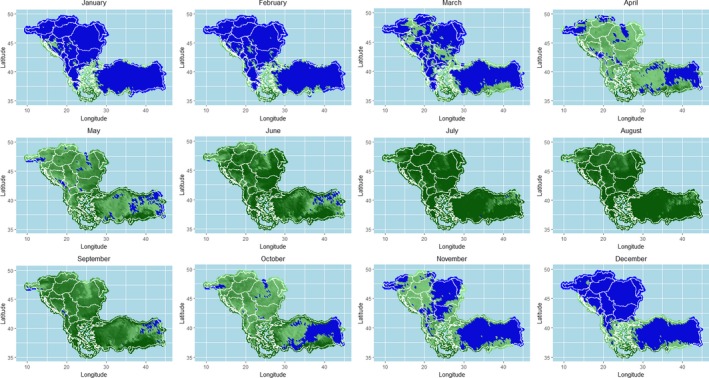
Opportunity maps for LSD based on minimum temperature being more than 10°C for the region surrounding affected countries for 2014
Figure B.2.

Opportunity maps for LSD based on minimum temperature being more than 10°C for the region surrounding affected countries for 2015
Appendix C – Vector trapping methods
1.
In the following sections, some indications are provided about life cycle, traps and trapping operations and identification of samples for each vector species potentially involved in LSD transmission (ticks, Culicoides, mosquitoes, stable flies, horn flies, and tabanids).
C.1. Ticks
C.1.1. Life cycle
A female tick can lay thousands of eggs after feeding and mating on a host. Egg disposition is realised in a humid and protected place to permit best hatching conditions. Larvae hatch from the eggs and develop into nymphs after feeding. The nymphs finally turn into adults after another process of feeding. Depending on the tick species, different stages of development can feed on the same or various hosts. More than one instar is possible in the case of some soft ticks (Braks et al., 2017).
C.1.2. Direct removal from living host
Ticks infesting domestic animals are usually adults, males and females that attach to the host during the final stage of their life cycle. Direct removal of adults from the living host is therefore one of the easiest methods to collect ticks infesting domestic animals.
C.1.3. Trap operation
Direct collection from living animals usually requires two operators and a crush pen to immobilise big size animals (i.e. cattle). Ticks are gently removed by using forceps and preserved directly in 70% ethanol or transported alive to the laboratory. If immatures are present, fine nit‐combs or fine forceps are required due to their smaller size. In order to collect ticks, the body of the animal can be divided into different areas. Time devoted to each animal depends on its size and the level of infestation. Previous observation on sites of the animal's body with higher infestation may allow targeting particular sites and therefore avoid sampling of the whole body (i.e. ears, perianal area, etc.).
C.1.4. Identification of samples
Males and females are easy to distinguish using a stereomicroscope. Most of the genera and some of the most common species can be identified by using morphological characters; however, training is needed to correctly identify some of them. Immatures are more difficult to identify and therefore effort should be put on adults. Some species included in complexes (i.e. Rhipicephalus sanguineus group: R. sanguineus and R. turanicus) require mounting specific morphological traits (i.e. the genital female openings) on microscope slides. Molecular techniques (PCR and BOLD) are available for the taxonomy of ticks (Dantas‐Torres et al., 2013).
C.2. Culicoides
C.2.1. Life cycle
Culicoides biting midges survive and lay their eggs in a humid environment. Larvae hatch from the eggs and run through four different instars. They can be extended over winter and are followed by pupation. As a final stage of development, adults emerge from the pupae (Braks et al., 2017).
C.2.2. Type of traps
Gold standard method for capturing adult Culicoides is based on UV light‐suction traps. These traps consist of a UV light that attracts adult Culicoides and an electrical back draw fan aspirates the insects into a collector. Several models are available, some of them commercially. Here, we recommend the MiniCDC (J.W. Hock, Gainesville, USA, Model 1212) (Figure C.1) and the Onderstepoort (OND)‐type trap (ARC – Institute for Agricultural Engineering; francois@moon.ovi.ac.za) (Figure C.2) as the models that have been used widely during BTV outbreaks in Europe (Capela et al., 2003; Calvete et al., 2006; Kiel et al., 2009; Patakakis et al., 2009; Venail et al., 2012; Meiswinkel et al., 2014; Goffredo et al., 2015). Comparison of different types of traps has been performed in several countries considering different population abundances. MiniCDC traps and OND‐type traps appeared to be the best options in terms of determining Culicoides species composition and abundance both in Spain (Del Rio et al., 2009, 2013) and South Africa (Venter et al., 2009).
Figure C.1.
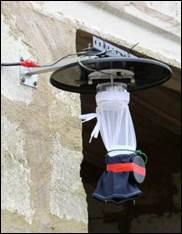
MiniCDC trap for Culicoides with UV light
- Source: Miguel Angel Miranda, University of the Balearic Islands UIB.
Figure C.2.
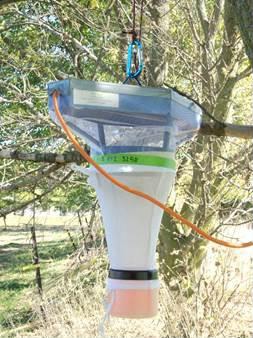
Onderstepoort trap
- Source: Miguel Angel Miranda, University of the Balearic Islands UIB.
C.2.3. Technical requirements
Light traps are operated by batteries (12 V or 6 V) or directly switched on from the main electricity (220 V) source depending on the model. For traps that are operated by batteries, a transformer can be used to plug the trap to the main electricity. Batteries are a key issue since they need to be fully charged to keep the trap running for 24–48 h. Ideally, the power consumption of the trap should be estimated to decide on the type of battery to be used. For the MiniCDC model, which has a smaller fan and light tube compared to the OND‐type, a motorbike battery would be enough to run the trap for 24 h. On the contrary, the OND requires higher power, and therefore, a car battery is recommended to run the trap for 24–48 h. A timer or light sensor, which is incorporated in some trap models, can be used both in main electricity and battery power traps to save energy during the day and focus on sampling between sunset and dawn. Culicoides are collected at the bottom of the trap by placing a collector bottle. If the aim is to capture dead insects, the collector should contain a mixture of water and 3–5 drops of soap. Alternatively, adding 2–3 mL of 70% ethanol also contributes to keep the sample in good conditions by avoiding the proliferation of fungi and bacteria. This is particularly important during summer time. Ethylene glycol or propylene glycol can also be used as a preserving medium in the collectors. Samples should be stored in 70% ethanol after collection, which will allow both the identification of Culicoides spp. (morphologically and molecularly) and further virus testing.
C.2.4. Trap operation
Traps should be tested before placing them in the field and UV bulbs have to be changed at least once a year depending on the regime of use of the trap. Traps should be placed near the animals at a maximum distance of 30 m and, ideally, nearby places where animals sleep. Special care should be taken to avoid animals, including rats, reaching the trap or wires from batteries or electricity. Collections should be conducted at least during two consecutive nights in the same place. An ideal regime of sampling is two nights per week during 1 year or, if not possible, once every 2 weeks. Traps should be switched on 1 h before sunset and switched off 1 h after sunrise. Light and fan should be checked when collecting the sample to assure they had been working overnight. Subsampling methods are available when large quantities of insects are collected and the analysis of the whole sample would consume long time (Van Ark and Meiswinkel, 1992). Artificial lights located around the vicinity of the trap may interfere with captures. Therefore, traps should preferably be placed in dark spots. Culicoides activity is affected by weather conditions. Under rainy and windy nights, captures of biting midges are expected to be low. In this case, extra nights can be added to increase the data collection.
Traps are usually recommended to be placed outside stables; however, depending on the climatic characteristics of the area, the system of production and the confinement of domestic host captures can also be obtained by placing the traps inside stables. This is the case in northern European countries where for some species (i.e. Obsoletus complex) indoor activity is recorded during winter when outside temperatures decrease dramatically (Baldet et al., 2008; Brugger et al., 2016).
Light traps are also useful to collect large quantities of adults and thus might be very convenient for molecular diagnostic of BTV in vectors (Savini et al., 2005; Goffredo et al., 2015) or when vector competence studies are desired (Venter et al., 1999, 2006, 2010; Paweska and Venter, 2004; Del Rio et al., 2012). In the latter case, Culicoides are collected alive by modifying the characteristics of the collector bottle by replacing the liquid with slightly wet paper that will provide shelter to the insects and avoid desiccation. CO2 in combination or not with light traps is not frequently used for capturing Culicoides, however, it should be considered that for certain species such as C. sonorensis in the USA, it has been shown that CO2 alone has high efficacy for collecting females and particularly BTV‐infected midges. This fact has not been shown or tested for any of the species at European level.
It is known that light traps may over or underestimate the presence of some Culicoides species (Carpenter et al., 2008; Viennet et al., 2011) if they are compared to other capture methods such as host‐baited drop traps. However, light trap captures still represent accurately the Culicoides species composition of the area when compared to other methods.
C.2.5. Identification of samples
Most of the Culicoides spp. can be identified by the pattern of spots on their wings using a stereomicroscope. There are several sources available on the internet for Culicoides taxonomy (Mathieu et al., 2012): http://www.iikculicoides.net
Culicoides species included in groups, complexes or assemblages require further expertise since microscope slides are needed for detailed taxonomy of females based on the formula of sensilla in the antennae, head and spermatheca. Males also require mounting the genitalia for species identification. General methods for mounting Culicoides spp. specimens can be found in Wirth and Marston (1968).
Molecular techniques are also available for Culicoides identification using conventional PCR techniques (Cêtre‐Sossah et al., 2004; Stephan et al., 2009; Garros et al., 2014) or the BOLD (Barcoding) protocols (Mordue et al., 2007; Ander et al., 2013). Identification by analysis of protein profile has also been developed during the last decade (Kaufmann et al., 2012). For arboviruses, such as bluetongue virus, females of Culicoides are age graded due to the importance of parous females in virus transmission. However, since LSDV is transmitted mechanically, age grading of females is not a requirement for virus detection.
Further details about Culicoides spp. trapping and identification can be found in Goffredo and Meiswinkel (2004).
C.3. Mosquitoes
C.3.1. Life cycle
Depending on the species, female mosquitoes lay their eggs either on the water surface, wet soil or the edge of water containers. Hatching larvae feed from particles in the water and run through four different instars that are followed by pupation. Both larvae and pupae need oxygen in order to survive. In the last step, adults emerge from the pupae by metamorphosis (Braks et al., 2017).
Despite the possibility to collect young stages of mosquitoes (i.e. eggs, larvae), the present document focuses on adults and the easiest approach to sampling several species that may have epidemiological importance for LSDV transmission.
C.3.2. Type of traps
The most widely used traps for collecting mosquitoes are based on light traps (white light) with a suction fan. One of the most frequently used models is the MiniCDC (Figure C.3). There are two types of light sources that can be used, a light bulb and a light tube. The advantage of the light tube is the possibility to use the same traps for other groups, such as Culicoides, by replacing the white tube with a UV tube. Captures of mosquitoes by the use of light are usually limited. Therefore, they can be combined with attractants. For instance, CO2 has been proven to be a powerful attractant to many mosquito species for decades. Light traps can also be used without light and rely only on CO2, which saves energy in the case of powering the trap by battery. Despite light‐CO2‐baited traps would capture most of the species of mosquitoes in a given area, they may result less effective depending on the species. This is the case for some aedine species (i.e. Aedes albopictus) that are active during the day. In this case, other traps, such as the BG‐Sentinel (Biogents), are recommended to be used equipped with commercial lures (BGLure) or CO2.
Figure C.3.
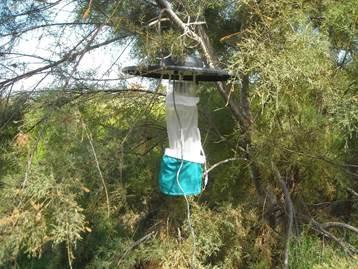
MiniCDC trap for mosquitoes with white light bulb
- Source: Miguel Angel Miranda, University of the Balearic Islands UIB.
C.3.3. Technical requirements
Light traps are operated by batteries (12 V or 6 V) or directly switched on from the main electricity (220 V) source depending on the model. For traps that are operated by batteries, a transformer can be used to plug the trap to the main electricity. Batteries are a key issue since they need to be fully charged to keep the trap running for 24–48 h. Ideally, the power consumption of the trap should be estimated to decide on the type of battery to be used. For the MiniCDC model, a motorbike battery would be enough to run the trap for 24 h. A timer or light sensor, which is incorporated in some trap models, can be used both in main electricity and battery power traps to save energy during the day and focus on sampling between sunset and dawn. Mosquitoes are collected at the bottom of the trap by placing a collector bottle. In the case of mosquitoes, identification should be performed with dry specimens. Therefore, no liquid is used in the container. Special collectors provided with a metal mesh at the bottom of the collector bottle are frequently used. Collected females should be stored in dry vials with cotton and silica gel to avoid fungal contamination. Males are preserved in 70% ethanol because mounting microscope slides is required. Storage of samples in freezers is another option for both sexes. In terms of long‐term preservation, pinning and labelling in collection boxes is recommended. For DNA virus detection, samples should be kept at −20°C.
C.3.4. Trap operation
Traps should be tested before placing them in the field and bulbs should be changed at least once a year depending on the regime of use of the trap. Traps should be placed outside the stable near the animals at a maximum distance of 30 m and, ideally, nearby places where animals sleep. Special care should be taken to avoid animals, including rats, reaching the trap or wires. Collections should be conducted at least during two consecutive nights in the same place. Traps should be switched on 1 h before sunset and switched off 1 h after sunrise. Light and fan should be checked when collecting the sample to assure they had been working overnight. Artificial lights located around the vicinity of the trap may interfere with captures. Therefore, traps should preferably be placed in dark spots. Mosquito activity is affected by weather conditions. When using in combination with light or exclusively CO2, a constant source of the gas is needed. This can be achieved by using dry ice (e.g. around 1 kg in an isolated bucket with 6–8 1 cm holes will allow a constant flux of CO2 during one night). Another option is to use CO2 gas bottles that can be regulated by a manometer. By this, flux could be regulated according to necessities. Under rainy and windy nights captures of insects are expected to be low. In this case, extra nights can be added to increase the data collection.
C.3.5. Identification of samples
After some training, female mosquitoes can be identified by morphology using a stereomicroscope. Since differentiation is based on the pattern of coloration of the legs, thorax and abdomen, specimens should be in good conditions to make identification easy. If specimens loose scales, morphological identification will be more difficult. It is also possible to distinguish males by coloration, but in some cases the genitalia should be mounted on microscope slides. Molecular methods (PCR and BOLD) are equally available for mosquito identification as well as techniques using protein profiling. For arboviruses, such as West Nile and others, female mosquitoes are age graded due to the importance of parous females in virus transmission. However, since LSDV is transmitted mechanically, age grading of females is not a requirement for virus detection.
C.4. Biting flies
Suspected vectors include the globally distributed species Stomoxys calcitrans (the stable fly), Haematobia irritans (the horn fly) and specific species of the family Tabanidae (horse flies) such as species of the genera Tabanus and Chrysops (Figure C.4). These will be referred to as tabanids. Other synanthropic and biting flies may also be trapped (such as the housefly, Musca domestica, the face fly, M. autumnalis, and the Indian cattle fly, M. crassirostis, which is a blood feeder).
Figure C.4.
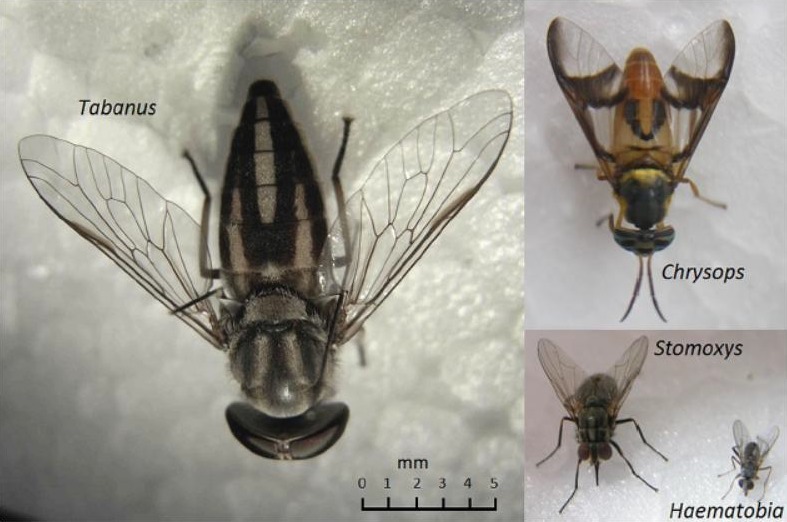
Blood feeding flies
- Source: Baldacchino et al. (2014).
For each fly taxon, there is a specific dedicated trap, which is described below.
C.5. Stable flies
C.5.1. Life cycle
Stable flies lay eggs in moist decomposing organic matter, in which the larvae hatch and feed. There are three larval stages followed by pupation. A complete life cycle from egg to adult can take 3–8 weeks. The adults live for about 3 weeks and feed one to several times a day (Kettle, 1984).
C.5.2. Type of traps
Stable flies are active during the day and attracted to translucent or blue‐coloured objects. They usually feed on lower parts of the animal such as the limbs and lower abdomen. Available commercial products use permanent glue smeared on translucent material. They include sticky alsynite traps and white‐stripe sticky tapes (Figure C.5). The latter is a low cost commercial option.
Figure C.5.
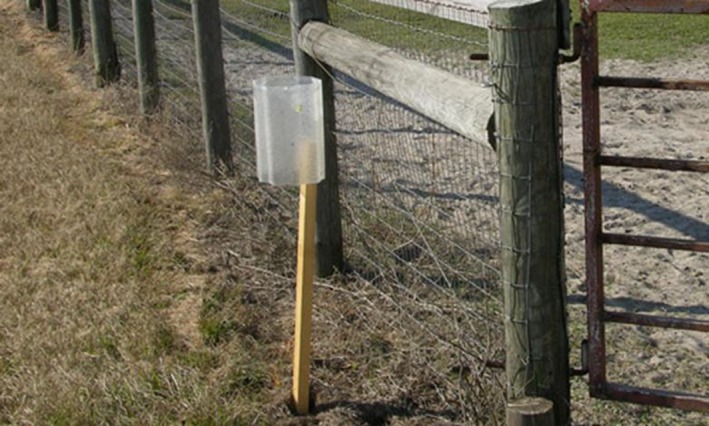
Alsynite traps for monitoring and control of stable flies, Stomoxys calcitrans (L.). Photograph by Phillip Kaufman, University of Florida
Furthermore, home‐made traps are easy to produce and can include any white coroplast covered with permanent glue (as described in Kahana‐Sutin et al. (2016), Figures C.6 and C.7) or white 3‐inch commercial plastic cylinder tubes covered with transparent nylon drenched in glue (Figure C.8, similar to the commercial Knightstick trap). The coroplast and the nylon traps are easily replaced every trapping period and so is the white sticky stripe trap.
Figure C.6.
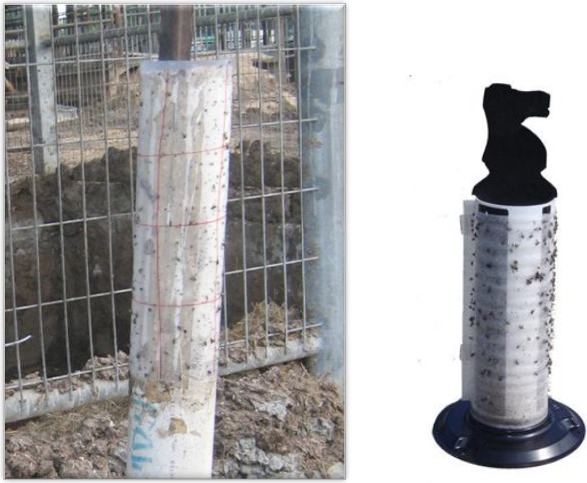
Left: Nylon glue trap over a white tube; right: KnightStick® Fly Trap
- Source: Diego Sercovich, Koret School of Veterinary Medicine, The Hebrew University of Jerusalem.
Figure C.7.
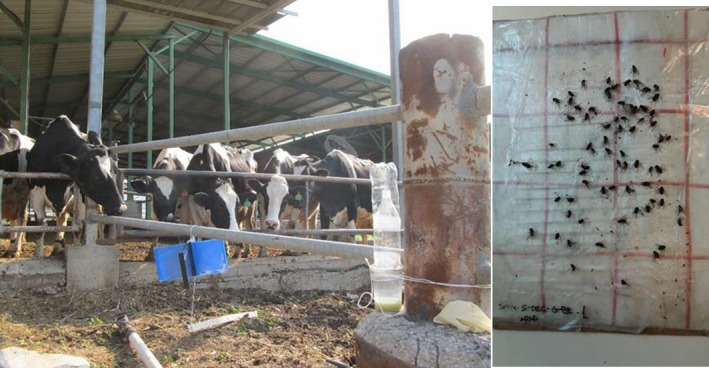
Left: In situ coroplast glue traps (Here black and blue, but can be adapted to any colour), right: trapping outcome
- Source: Etai Kahana‐Sutin, Koret School of Veterinary Medicine, The Hebrew University of Jerusalem.
Figure C.8.

White sticky tape trap
- Source: Diego Sercovich, Koret School of Veterinary Medicine, The Hebrew University of Jerusalem.
C.5.3. Trap operation
On each farm, two different locations should be chosen. These specific locations should consider the farm type as well as the respective restrictions mentioned above. A 50‐cm‐long sticky stripe is recommended. Alternatively, 40 cm2 of surface can be used for the coroplast or nylon. Traps should be deployed for 24–48 h. Then, flies can be counted directly on the spot or the traps are brought to the laboratory for counting and replacing them with new ones. If the traps are fully covered with insects, an estimated score can be given or counting should be performed on one quarter of the trap. This count has to be multiplied in another step.
C.6. Horn flies
C.6.1. Life cycle
The horn fly lay eggs in cow manure, where the larvae hatch and feed. There are three larval stages followed by pupation. One complete life cycle from egg to adult can take 10–20 days. The adults live for about 3 weeks and feed 20–30 times a day (McLintock and Depner, 1954).
C.6.2. Type of traps
The horn fly is active during the day and constantly found on the animal body, especially in open pasture. Horn fly traps include a cattle walk through construction but no specific monitoring traps exist for this species. Trapping of horn flies can be done by sweeping an insect net near the animal. This should only be done near tamed animals or when the animals are in chutes.
C.6.3. Trap operation
Sweeping near the animal should be done twice with an interval of 2–5 min. As certain animals have different attraction levels, the same procedure should be repeated on 3–5 animals. After sweeping, the flies are kept in the net and should be released into a marked vial, with or without ethanol, and closed properly. Counting of flies should be performed in the laboratory after chilling if they have been kept alive in the vial.
C.7. Tabanids
C.7.1. Life cycle
Tabanid flies accumulate their eggs in one single pile. Chosen biotopes range from running to stagnant waters and soil according to the species. Hatching increases with relative humidity and higher temperatures. Larvae are very resistant and can overwinter several times. Pupation takes place on land and adults emerge after 1–3 weeks (Baldacchino et al., 2014).
C.7.2. Type of traps
Horse flies are large flies that are active during the day and locate their hosts by visual and olfactory cues. Females and males seek water sources. Traps are based on their attraction to large and dark objects, linearly polarized (reflective) light and on their water needs. Available traps comprise a canopy based design, a polarized L‐shape sticky panel (Figure C.9) and a black water tray (Figure C.10). Existing commercial traps for tsetse flies are used to effectively trap tabanids. Models like the Nzi and Vavuoa involve black and blue fabrics with a collection tube (Mihok, 2002), although the use of polarized black L‐shape sticky panels (e.g. Egri et al. (2013a,b); Herczeg et al. (2014)) or the polarization liquid trap was found to be efficient as well. The liquid trap was shown to be highly efficient in Eastern Europe and easy to operate (Herczeg et al., 2014). Although canopy traps are the standard research trap, we recommend the use of this model.
Figure C.9.
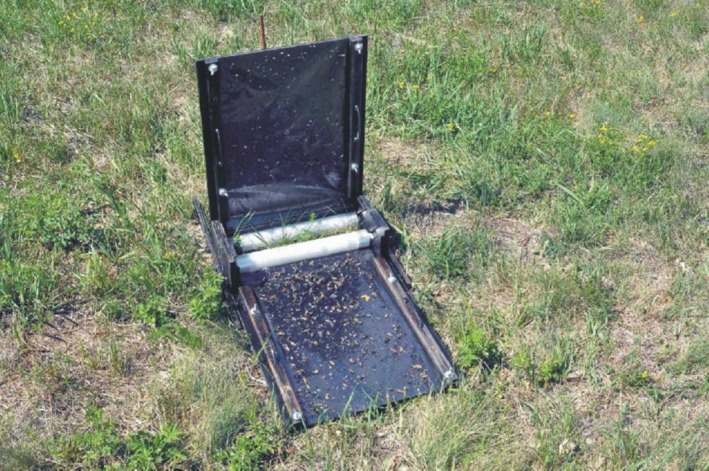
L‐shape sticky trap Taken by Dr. Gabor Horvath
- source: Egri et al. (2013a).
Figure C.10.
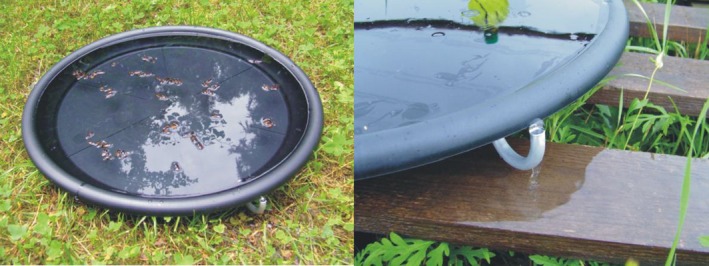
Liquid trap Taken by Dr. Gabor Horvath
- source: Egri et al. (2013b).
C.7.3. Trap operation
The trap consists of a black circular plastic bucket or tray (50 cm diameter) filled with tap water and vegetable oil (2:1). Two traps should be placed on the ground in a protected area with a minimum distance of 10 m for 24–48 h. Flies can be collected and stored in ethanol for further use.
C.7.4. Vacuum‐based fly traps
Traps that are based on vacuuming the flies from animals are commercially available (e.g. cow‐vac, https://www.spalding-labs.com/products/fly_control_products/cow_vac/default.aspx). Home‐made vacuum cleaner‐based traps can be designed with the idea that flies can be sorted later. This method should be used similarly to the sweeping method and can yield higher numbers of insects.
C.7.5. Alternative options
Since there is no universally accepted official protocol for farm‐associated fly trapping, another protocol is suggested here that may be taken into consideration by survey operators.
C.7.6. Counting
The described method is applicable to stable and horn flies, but it does not yield individuals for further testing. Still, it can be beneficial to the survey if it is performed by personnel trained in the identification of flies from distance.
For the horn fly, visual observation on cattle bodies should be carried out during the day and take 1 min per animal per side. Each side can be done by one operator. Total numbers can be estimated by counting groups (e.g. groups of about 10 at lower densities and groups of about 50 or even 100 at higher densities). This is also possible from a certain distance (e.g. 10–40 m) using binoculars. As individual cattle may vary in their horn fly load, it is preferable to do counts on the same animals over a period of time if they are identifiable. Alternatively, flies can be counted on 15–20 randomly sampled animals.
For the stable fly, the same procedure should be performed on the front legs (inside of one and outside the other when vied from one side) (Castro et al., 2005; Mullens et al., 2006).
Appendix D – LSD situation in Russian Federation
1.
In Table D.1, the epidemiological and vaccination information about LSD in Russian Federation is summarized up to end of 2016.
Table D.1.
Summary table on LSD outbreaks and vaccination in Russian Federation until 31 December 2016
| Country | Date of first outbreak reported | Date of last outbreak reported | Nr outbreaks reported | Nr affected animals | Morbidity % | Nr dead animals | Mortality % |
|---|---|---|---|---|---|---|---|
| Astrakhan | 20/6/2016 | 26/7/2016 | 12 | 1,308 | 40.8 (5.0–100) | 59 | 2.24 (0–4.8) |
| Volgograd | 8/7/2016 | 18/8/2016 | 34 | 61 | 30.9 (0.68–100) | 3 | 1.5 (0–25.0) |
| Voronezh | 17/8/2016 | 17/8/2016 | 1 | 1 | 100 | 0 | 0 |
| Kabardino‐Balkaria | 10/8/2016 | 10/8/2016 | 1 | 14 | (0.05–100) | 0 | 0 |
| Karachaevo‐Cherkessiya | 27/7/2016 | 16/9/2016 | 14 | 33 | 61.8 (1.4–100) | 1 | 0–100 |
| Krasnodar | 27/5/2016 | 29/8/2016 | 5 | 920 | 20.6 (7.7–33.7) | 13 | 0.37–1.39 |
| Adygea | 27/7/2016 | 27/7/2016 | 1 | 5 | 1.19 | 0 | 0 |
| Dagestan | 1/6/2016 | 24/10/2016 | 212 | 704 | 2.6 (0.3–12.5) | 0 | 0 |
| Ingushetia | 04/7/2016 | 4/7/2016 | 48 | 1,571 | 7.0 (27.4–0.7) | 231 | 1.0 (0–5.6) |
| Kalmykiya | 14/6/2016 | 1/8/2016 | 66 | 1,365 | 13.7 (0.5–100) | 13 | 0.2 (0–6.25) |
| Rostov | 22/7/2016 | 22/7/2016 | 116 | 16 | 20.8 (4.5–50) | 0 | 0 |
| Ryazan | 26/9/2016 | 26/9/2016 | 2 | 21 | 28.7 (7.4–50) | 0 | 0 |
| Samara | 14/10/2016 | 27/10/2016 | 12 | 32 | 62.6 (4.4–100) | 0 | 0 |
| Stavropol | 29/6/2016 | 18/8/2016 | 34 | 1,037 | 16.7 (0.2–100) | 28 | 1.7 (0–50) |
| Tambov | 30/8/2016 | 31/8/2016 | 15 | 158 | 54.8 (11.1–100) | 20 | 5.7 (0–50) |
| Chechnya | 21/9/2016 | 3/10/2016 | 1,361 | 6,534 | 38.0 (1.4–100) | 1,196 | 4.1 (0.1–21.9) |
Source: Provided by National Research Institute for Veterinary Virology and Microbiology of Russia (VNIIVViM, Pokrov) http://vniivvim.ru/
Suggested citation: EFSA (European Food Safety Authority) , 2017. Scientific report on lumpy skin disease: I. Data collection and analysis. EFSA Journal 2017;15(4):4773, 54 pp. doi: 10.2903/j.efsa.2017.4773
Requestor: European Commission
Question number: EFSA‐Q‐2016‐00542
Acknowledgements: EFSA wishes to thank the members of the Working Group on lumpy skin disease: Jan Arend Stegeman, Simon Gubbins, Nick Lyons, Eyal Klement, Miguel Miranda, Yuval Gottlieb for the preparatory work on this scientific output and the hearing experts Ledi Pite, Džemil Hajrić, Aleksandra Miteva, Brigita Hengl, Sotiria‐Eleni Antoniou, Bafti Murati, Tatjana Labus, Drago Maroejvic, Ioana Neghirla, Srgjan Meshterovikj, Esra Satir for the data collection; Dominique Bicout, Anette Bottner for reviewing the document, and EFSA staff members: Alessandro Broglia, Josè Cortiñas Abrahantes, Andrey Gogin, Lisa Kohnle, Mario Monguidi, Jane Richardson, Jelena Vracar for the support provided to this scientific output. A special thanks is to: Ledi Pite from Ministry of Agriculture, Rural Development and Water Administration, Albania; Aleksandra Miteva from Food Safety Agency, Bulgaria; Brigita Hengl from Croatian Food Agency and Ivica Sučec from Ministry of Agriculture, Croatia; Sotiria‐Eleni Antoniou and Chrysoula Dile of the Animal Health Directorate of the Greek Ministry of Rural Development and Food and to the veterinary staff of the Greek NRL of Capripoxviruses and Regional Veterinary Authorities, Greece; Bafti Murati from the Food and Veterinary Agency, Kosovo; Drago Marojevic from the Ministry of Agriculture and Rural Development, Montenegro; Srgjan Meshterovikj, Food and Veterinary Agency, former Yugoslav Republic of Macedonia; Tatjana Labus from the Ministry of Agriculture and Environmental Protection, Republic of Serbia; Esra Satir from Pendik Veterinary Control Institute, Turkey for the timely provision of the epidemiological data for this report. A special thanks also to Stefan Niemeyer and Andrea Toreti from Joint Research Centre (EC) for the timely provision of meteorological data.
Approved: 27 March 2017
Reproduction of the images listed below is prohibited and permission must be sought directly from the copyright holder:
Figure C.4: © Elsevier BV; Figure C.9: © Australian Society for Parasitology Inc; Figure C.10: © Cambridge University Press
Notes
This designation is without prejudice to positions on status, and is in line with UNSCR 1244 and the ICJ Opinion on the Kosovo Declaration of Independence. This footnote is applied whenever ‘Kosovo’ is mentioned in the present report.
This designation is without prejudice to positions on status, and is in line with UNSCR 1244 and the ICJ Opinion on the Kosovo Declaration of Independence.
At this https://drive.google.com/file/d/0B-yEhDLRv5PjNmhNSEp6ZVlRRFk/view, the simulated spread dynamics in Turkey in 2014 can be observed.
References
- Ander M, Troell K and Chirico J, 2013. Barcoding of biting midges in the genus Culicoides: a tool for species determination. Medical and Veterinary Entomology, 27, 323–331. [DOI] [PubMed] [Google Scholar]
- Baldacchino F, Desquesnes M, Mihok S, Foil LD, Duvallet G and Jittapalapong S, 2014. Tabanids: neglected subjects of research, but important vectors of disease agents!. Infection, Genetics and Evolution, 28, 596–615. [DOI] [PubMed] [Google Scholar]
- Baldet T, Delecolle JC, Cetre‐Sossah C, Mathieu B, Meiswinkel R and Gerbier G, 2008. Indoor activity of Culicoides associated with livestock in the bluetongue virus (BTV) affected region of northern France during autumn 2006. Preventive Veterinary Medicine, 87, 84–97. [DOI] [PubMed] [Google Scholar]
- Beard PM, 2016. Lumpy skin disease: a direct threat to Europe. Veterinary Record, 178, 557–558. [DOI] [PubMed] [Google Scholar]
- Ben‐Gera J, Klement E, Khinich E, Stram Y and Shpigel NY, 2015. Comparison of the efficacy of Neethling lumpy skin disease virus and x10RM65 sheep‐pox live attenuated vaccines for the prevention of lumpy skin disease – the results of a randomized controlled field study. Vaccine, 33, 4837–4842. [DOI] [PubMed] [Google Scholar]
- Braks M, Mancini G and Goffredo M, 2017. Risk of vector‐borne diseases for the EU: Entomological aspects – Part 1. EFSA supporting publication 2017:EN‐1173, 52.
- Brugger K, Kofer J and Rubel F, 2016. Outdoor and indoor monitoring of livestock‐associated Culicoides spp. to assess vector‐free periods and disease risks. BMC Veterinary Research, 12, 88. [DOI] [PMC free article] [PubMed] [Google Scholar]
- Calvete C, Miranda MA, Estrada R, Borras D, Sarto i Monteys V, Collantes F, Garcia‐de‐Francisco JM, Moreno N and Lucientes J, 2006. Spatial distribution of Culicoides imicola, the main vector of bluetongue virus, in Spain. Veterinary Record, 158, 130–131. [DOI] [PubMed] [Google Scholar]
- Capela R, Purse BV, Pena I, Wittman EJ, Margarita Y, Capela M, Romao L, Mellor PS and Baylis M, 2003. Spatial distribution of Culicoides species in Portugal in relation to the transmission of African horse sickness and bluetongue viruses. Medical and Veterinary Entomology, 17, 165–177. [DOI] [PubMed] [Google Scholar]
- Carpenter S, Szmaragd C, Barber J, Labuschagne K, Gubbins S and Mellor P, 2008. An assessment of Culicoides surveillance techniques in northern Europe: have we underestimated a potential bluetongue virus vector? Journal of Applied Ecology, 45, 1237–1245. [Google Scholar]
- Castro E, Gil A, Solari MA and Farias NA, 2005. Validation of a subjective counting method for a horn flies (Haematobia irritans irritans) (Diptera: Muscidae) population in a cattle herd. Veterinary Parasitology, 133, 363–367. [DOI] [PubMed] [Google Scholar]
- Cêtre‐Sossah C, Baldet T, Delecolle JC, Mathieu B, Perrin A, Grillet C and Albina E, 2004. Molecular detection of Culicoides spp. and Culicoides imicola, the principal vector of bluetongue (BT) and African horse sickness (AHS) in Africa and Europe. Veterinary Research, 35, 325–337. [DOI] [PubMed] [Google Scholar]
- Chihota CM, Rennie LF, Kitching RP and Mellor PS, 2003. Attempted mechanical transmission of lumpy skin disease virus by biting insects. Medical and Veterinary Entomology, 17, 294–300. [DOI] [PubMed] [Google Scholar]
- Dantas‐Torres F, Latrofa MS, Annoscia G, Giannelli A, Parisi A and Otranto D, 2013. Morphological and genetic diversity of Rhipicephalus sanguineus sensu lato from the New and Old Worlds. Parasites & Vectors, 6, 213. [DOI] [PMC free article] [PubMed] [Google Scholar]
- Del Rio R, Monerris M, Miranda MA, Calvete C, Borras D, Miquel M, Estrada R and Lucientes J, 2009. Two years of Culicoides trap comparison in the Balearic Islands. Revue d’élevage et de médecine vétérinaire des pays tropicaux, 62, 97. [Google Scholar]
- Del Rio R, Miranda MA, Paredes‐Esquivel C, Lucientes J, Calvete C, Estrada R and Venter GJ, 2012. Recovery rates of bluetongue virus serotypes 1, 2, 4 and 8 Spanish strains from orally infected Culicoides imicola in South Africa. Medical and Veterinary Entomology, 26, 162–167. [DOI] [PubMed] [Google Scholar]
- Del Rio R, Monerris M, Miquel M, Borras D, Calvete C, Estrada R, Lucientes J and Miranda MA, 2013. Collection of Culicoides spp. with four light trap models during different seasons in the Balearic Islands. Veterinary Parasitology, 195, 150–156. [DOI] [PubMed] [Google Scholar]
- EFSA (European Food Safety Authority) , 2016. Strengthening regional cooperation in South East Europe and Middle East for prevention and control of Lumpy Skin Disease (LSD). EFSA supporting publication 2016:EN‐1059, 19 pp. [Google Scholar]
- EFSA AHAW Panel (EFSA Panel on Animal Health and Welfare) , 2015. Scientific Opinion on lumpy skin disease. EFSA Journal 2015;13:3986, 73 pp. doi: 10.2903/j.efsa.2015.3986 [DOI] [Google Scholar]
- EFSA AHAW Panel (EFSA Panel on Animal Health and Welfare) , 2016. Statement: Urgent advice on lumpy skin disease. EFSA Journal 2016;14:4573, 27 pp. doi: 10.2903/j.efsa.2016.4573 [DOI] [Google Scholar]
- EFSA AHAW Panel (EFSA Panel on Animal Heal th and Welfare) , 2017. Scientificopinion on blueto ngue: control, surveillance and safe movement of animals. EFSA Journal 2017;15:4698, 126 pp. doi: 10.2903/j.efsa.2017.4698 [DOI] [PMC free article] [PubMed] [Google Scholar]
- Egri A, Blaho M, Szaz D, Barta A, Kriska G, Antoni G and Horvath G, 2013a. A new tabanid trap applying a modified concept of the old flypaper: linearly polarising sticky black surfaces as an effective tool to catch polarotactic horseflies. International Journal for Parasitology, 43, 555–563. [DOI] [PubMed] [Google Scholar]
- Egri A, Blaho M, Szaz D, Kriska G, Majer J, Herczeg T, Gyurkovszky M, Farkas R and Horvath G, 2013b. A horizontally polarizing liquid trap enhances the tabanid‐capturing efficiency of the classic canopy trap. Bulletin of Entomological Research, 103, 665–674. [DOI] [PubMed] [Google Scholar]
- Garros C, Balenghien T, Carpenter S, Delecolle JC, Meiswinkel R, Pedarrieu A, Rakotoarivony I, Gardes L, Golding N, Barber J, Miranda M, Borras DB, Goffredo M, Monaco F, Pages N, Sghaier S, Hammami S, Calvo JH, Lucientes J, Geysen D, De Deken G, Sarto IMV, Schwenkenbecher J, Kampen H, Hoffmann B, Lehmann K, Werner D, Baldet T, Lancelot R and Cetre‐Sossah C, 2014. Towards the PCR‐based identification of Palaearctic Culicoides biting midges (Diptera: Ceratopogonidae): results from an international ring trial targeting four species of the subgenus Avaritia. Parasites & Vectors, 7, 223. [DOI] [PMC free article] [PubMed] [Google Scholar]
- Goffredo M and Meiswinkel R, 2004. Entomological surveillance of bluetongue in Italy: methods of capture, catch analysis and identification of Culicoides biting midges. Veterinaria Italiana, 40, 260–265. [PubMed] [Google Scholar]
- Goffredo M, Catalani M, Federici V, Portanti O, Marini V, Mancini G, Quaglia M, Santilli A, Teodori L and Savini G, 2015. Vector species of Culicoides midges implicated in the 20122014 Bluetongue epidemics in Italy. Veterinaria Italiana, 51, 131–138. [DOI] [PubMed] [Google Scholar]
- Herczeg T, Blaho M, Szaz D, Kriska G, Gyurkovszky M, Farkas R and Horvath G, 2014. Seasonality and daily activity of male and female tabanid flies monitored in a Hungarian hill‐country pasture by new polarization traps and traditional canopy traps. Parasitology Research, 113, 4251–4260. [DOI] [PubMed] [Google Scholar]
- Kahana‐Sutin E, Klement E, Lensky I and Gottlieb Y, 2016. High relative abundance of the stable fly Stomoxys calcitrans is associated with lumpy skin disease outbreaks in Israeli dairy farms. Medical and Veterinary Entomology, doi: 10.1111/mve.12217. [DOI] [PubMed] [Google Scholar]
- Kaufmann C, Steinmann IC, Hegglin D, Schaffner F and Mathis A, 2012. Spatio‐temporal occurrence of Culicoides biting midges in the climatic regions of Switzerland, along with large scale species identification by MALDI‐TOF mass spectrometry. Parasites & Vectors, 5, 246. [DOI] [PMC free article] [PubMed] [Google Scholar]
- Kettle DS, 1984. Medical and Veterinary Entomology. Croom Helm, London, 658 pp. [Google Scholar]
- Kiel E, Liebisch G, Focke R, Liebisch A and Werner D, 2009. Monitoring of Culicoides at 20 locations in northwest Germany. Parasitology Research, 105, 351–357. [DOI] [PubMed] [Google Scholar]
- Lysyk T, 1998. Relationships between temperature and life‐history parameters of Stomoxys calcitrans (Diptera: Muscidae). Journal of Medical Entomology, 35, 107–119. [DOI] [PubMed] [Google Scholar]
- Mathieu B, Cetre‐Sossah C, Garros C, Chavernac D, Balenghien T, Carpenter S, Setier‐Rio ML, Vignes‐Lebbe R, Ung V, Candolfi E and Delecolle JC, 2012. Development and validation of IIKC: an interactive identification key for Culicoides (Diptera: Ceratopogonidae) females from the Western Palaearctic region. Parasites & Vectors, 5, 137. [DOI] [PMC free article] [PubMed] [Google Scholar]
- McLintock J and Depner KR, 1954. A review of the life‐history and habits of the Horn Fly, Siphona irritans (L.) (Diptera: Muscidae). The Canadian Entomologist, 86, 20–33. [Google Scholar]
- Meiswinkel R, Scolamacchia F, Dik M, Mudde J, Dijkstra E, Van Der Ven IJ and Elbers AR, 2014. The Mondrian matrix: Culicoides biting midge abundance and seasonal incidence during the 2006‐2008 epidemic of bluetongue in the Netherlands. Medical and Veterinary Entomology, 28, 10–20. [DOI] [PubMed] [Google Scholar]
- Mercier A, Arsevska E, Bournez L, Bronner A, Calavas D, Cauchard J, Falala S, Caufour P, Tisseuil C and Lefrançois T, 2017. Spread rate of lumpy skin disease in the Balkans, 2015–2016. Transboundary and Emerging Diseases, 1–5. 10.1111/tbed.12624 [DOI] [PubMed] [Google Scholar]
- Mihok S, 2002. The development of a multipurpose trap (the Nzi) for tsetse and other biting flies. Bulletin of Entomological Research, 92, 385–403. [DOI] [PubMed] [Google Scholar]
- Mordue AJ, Dallas JF, Nolan DV and Logan JG, 2007. Novel methods for the identification and control of Culicoides midges as vectors of emerging diseases In: Takken W, Knols BJ. (eds.). Ecology and Control of Vectors of Infectious Diseases Vol 1: Emerging pests and vector‐borne diseases in Europe. Wageningen Academic, Wageningen. [Google Scholar]
- Mullens BA, Lii KS, Mao Y, Meyer JA, Peterson NG and Szijj CE, 2006. Behavioural responses of dairy cattle to the stable fly, Stomoxys calcitrans, in an open field environment. Medical and Veterinary Entomology, 20, 122–137. [DOI] [PubMed] [Google Scholar]
- Patakakis MJ, Papazahariadou M, Wilson A, Mellor PS, Frydas S and Papadopoulos O, 2009. Distribution of Culicoides in Greece. Journal of Vector Ecology, 34, 243–251. [DOI] [PubMed] [Google Scholar]
- Paweska JT and Venter GJ, 2004. Vector competence of Culicoides species and the seroprevalence of homologous neutralizing antibody in horses for six serotypes of equine encephalosis virus (EEV) in South Africa. Medical and Veterinary Entomology, 18, 398–407. [DOI] [PubMed] [Google Scholar]
- Rueda L, Patel K, Axtell R and Stinner R, 1990. Temperature‐dependent development and survival rates of Culex quinquefasciatus and Aedes aegypti (Diptera: Culicidae). Journal of Medical Entomology, 27, 892–898. [DOI] [PubMed] [Google Scholar]
- Savini G, Goffredo M, Monaco F, Di Gennaro A, Cafiero MA, Baldi L, de Santis P, Meiswinkel R and Caporale V, 2005. Bluetongue virus isolations from midges belonging to the Obsoletus complex (Culicoides, Diptera: Ceratopogonidae) in Italy. Veterinary Record, 157, 133–139. [DOI] [PubMed] [Google Scholar]
- Stephan A, Clausen PH, Bauer B and Steuber S, 2009. PCR identification of Culicoides dewulfi midges (Diptera: Ceratopogonidae), potential vectors of bluetongue in Germany. Parasitology Research, 105, 367–371. [DOI] [PubMed] [Google Scholar]
- Tasioudi KE, Antoniou SE, Iliadou P, Sachpatzidis A, Plevraki E, Agianniotaki EI, Fouki C, Mangana‐Vougiouka O, Chondrokouki E and Dile C, 2016. Emergence of lumpy skin disease in Greece, 2015. Transboundary and Emerging Diseases, 63, 260–265. [DOI] [PubMed] [Google Scholar]
- Van Ark H and Meiswinkel R, 1992. Subsampling of large light trap catches of Culicoides (Diptera: Ceratopogonidae). The Onderstepoort Journal of Veterinary Research, 59, 183–189. [PubMed] [Google Scholar]
- Venail R, Balenghien T, Guis H, Tran A, Setier‐Rio M‐L, Delécolle J‐C, Mathieu B, Cêtre‐Sossah C, Martinez D, Languille J, Baldet T and Garros C, 2012. Assessing diversity and abundance of vector populations at a National Scale: example of Culicoides surveillance in France after bluetongue virus emergence In: Mehlhorn H. (ed.). Arthropods as Vectors of Emerging Diseases. Springer, Berlin Heidelberg: pp. 77–102. [Google Scholar]
- Venter GJ, Groenewald DM, Paweska JT, Venter EH and Howell PG, 1999. Vector competence of selected South African Culicoides species for the Bryanston serotype of equine encephalosis virus. Medical and Veterinary Entomology, 13, 393–400. [DOI] [PubMed] [Google Scholar]
- Venter GJ, Mellor PS and Paweska JT, 2006. Oral susceptibility of South African stock‐associated Culicoides species to bluetongue virus. Medical and Veterinary Entomology, 20, 329–334. [DOI] [PubMed] [Google Scholar]
- Venter GJ, Labuschagne K, Hermanides KG, Boikanyo SN, Majatladi DM and Morey L, 2009. Comparison of the efficiency of five suction light traps under field conditions in South Africa for the collection of Culicoides species. Veterinary Parasitology, 166, 299–307. [DOI] [PubMed] [Google Scholar]
- Venter GJ, Wright IM and Paweska JT, 2010. A comparison of the susceptibility of the biting midge Culicoides imicola to infection with recent and historical isolates of African horse sickness virus. Medical and Veterinary Entomology, 24, 324–328. [DOI] [PubMed] [Google Scholar]
- Viennet E, Garros C, Lancelot R, Allene X, Gardes L, Rakotoarivony I, Crochet D, Delecolle JC, Moulia C, Baldet T and Balenghien T, 2011. Assessment of vector/host contact: comparison of animal‐baited traps and UV‐light/suction trap for collecting Culicoides biting midges (Diptera: Ceratopogonidae), vectors of Orbiviruses. Parasites & Vectors, 4, 119. [DOI] [PMC free article] [PubMed] [Google Scholar]
- Wirth WW and Marston N, 1968. A method for mounting small insects on microscope slides in Canada balsam. Annals of the Entomological Society of America, 61, 783–784. [Google Scholar]


