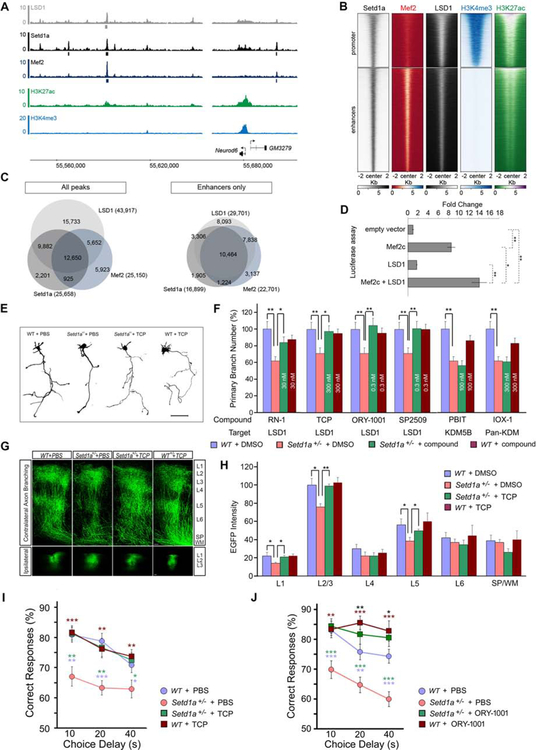
Figure 7. Inhibition of LSD1 activity in adulthood counteracts the effects of Setd1a deficiency.
(A) Neurod6 locus. ChIP-Seq of LSD1 (grey), Setd1a (black), Mef2 (dark blue), H3K27ac (green), H3K4me3 (light blue) is shown. Grey, black and dark blue boxes below Lsd1, Setd1a and Mef2 tracks respectively represent significant peaks that passed all quality checks (see methods).
(B) Heatmap of the ChIP-Seq coverage for Setd1a, LSD1, Mef2, H3K4me3 and H3K27ac 2 kb upstream and downstream of the center of Setd1a peaks [promoters (top panel) and enhancers (bottom panel)]. Heatmaps are sorted in the same order, based on Setd1a and H3K27ac signals.
(C) Venn diagram of the overlap between all the peaks (left panel) and enhancers only peaks for LSD1, Setd1a and Mef2 ChIP-seq (right panel).
(D) Luciferase reporter assay of the Mef2 responding element when Mef2c and/or LSD1 are co-transfected in HEK293T cells. While Mef2c alone showed a 8.5-fold increase in activity over the background, Mef2c co-transfected with LSD1 results in a significant 14-fold increase in activity. Values are mean ± standard error for three biological replicates, normalized to the empty vector (see Methods). Student’s t-test, *P < 0.05, **P < 0.01.
(E and F) Setd1a+/− cortical neurons were treated with LSD1 or JmjC domain KDM inhibitors from DIV3 to DIV5. Tracings of representative neurons imaged at DIV5 following TCP or PBS treatment are depicted in (E). The most effective concentrations of each inhibitor for restoring primary axon branch number in Setd1a+/− neurons (0.1 nM – 30 μM) are represented in (F). There are no significant differences between WT + DMSO and WT + compound in any of the comparisons.*P < 0.05, **P < 0.01. Scale bar, 50 μm.
(G) Representative images of contralateral axon-terminal branching of EGFP-labeled neurons from coronal sections of adult brains of mice injected AAV2Synapsine-EGFP virus at 8 weeks (upper panels) and viral injection sites in ipsilateral L2/3 (bottom panels). Immuno-histological staining represents EGFP (green). Scale bar, 100 μm.
(H) Histograms depicting quantitative assessment of contralateral axon branching in L1 to L6 and white matter in adulthood and indicating that TCP treatment restores contralateral axon branching in L2 to L5 in Setd1a+/− mice. WT + PBS: N = 6, Setd1a+/− + PBS: N = 7, Setd1a+/− + TCP: N = 6, WT + TCP: N = 5. *P < 0.05, **P < 0.01.
(I) Complete rescue of WM performance in a DNMTP task in Setd1a+/− mice treated with TCP. Mean percentage of correct responses for WT and Setd1a+/− mice with 3 mg/kg/day TCP or vehicle treatment are depicted. *P < 0.05. **P < 0.01, ***P < 0.001 (blue asterisk: WT + PBS vs Setd1a+/− + PBS, green asterisk: Setd1a+/− + TCP vs Setd1a+/− + PBS, brown asterisk: WT + TCP vs Setd1a+/− + PBS). No significant difference between WT + PBS and Setd1a+/− + TCP groups was observed (Setd1a+/− + PBS: N = 20, Setd1a+/− + TCP: N = 20, WT + PBS: N = 20, WT + TCP: N = 20).
(J) Rescue of WM performance in a DNMTP task in Setd1a+/− mice treated with ORY-1001. Mean percentage of correct responses for WT and Setd1a+/− mice with/without 10 μg/kg/day ORY-1001 or vehicle treatment are depicted. *P < 0.05, **P < 0.01, ***P < 0.001 (blue asterisk: WT + PBS vs Setd1a+/− + PBS, green asterisk: Setd1a+/− + ORY-1001 vs Setd1a+/− + PBS, brown asterisk: WT + ORY-1001 vs Setd1a+/− + PBS, black asterisk: WT + ORY-1001 vs WT + PBS). No significant difference between WT + PBS and Setd1a+/− + ORY-1001 was observed (Setd1a+/− + PBS: N = 21, Setd1a+/− + ORY-1001: N = 15, WT + PBS: N = 23, WT + ORY-1001: N = 15).
Histograms show means and error bars s.e.m.

