Abstract
MarkeTrak has been conducted on a regular schedule for over 30 years to take the pulse of the hearing health care market and of consumers with hearing loss. The current version, MarkeTrak 10 (MT10), builds on the successful completion of MarkeTrak 9, with the same two objectives: to estimate hearing difficulty, hearing aid usage, and adoption of hearing aids in the United States and to gain insights into the consumer's journey through the hearing health care delivery system. In addition, MarkeTrak 10 added additional questions regarding use and satisfaction with Personal Sound Amplification Products (PSAPs) by both owners and nonowners of hearing aids.
Keywords: MarkeTrak, hearing aids, hearing difficulty
Market research has a long and storied history in the hearing aid industry, grounded in the continuing goal to understand, to a greater degree, the issues and factors that encourage people with hearing loss to take action on this key health issue. Hearing, and indeed all sensory health factors, have historically sat outside the sphere of health care issues for a variety of reasons—gradual onset, lack of immediate life-threatening impact, and association with aging, just to name a few. These sensory abilities have taken on a new and critical importance over the last several decades as the Baby Boomers, that huge group of approximately 78 million American born between 1946 and 1964 are living longer and moving into the phase where sensory functions may begin to diminish. Baby Boomers are demanding maximum functioning and quality of life. This demographic trend, coupled with the advances in technology, has put a spotlight on managing hearing loss for which the hearing industry was prepared.
Beginning with the Gallup Omnibus Poll in 1981, the Hearing Industries Association (HIA) began to look at the beliefs, attitudes, and actions of people who said their hearing was a problem some or all of the time. In 1984, HIA expanded its investigation of these issues through a unique survey of approximately 3,000 individuals with self-identified hearing loss—one-third of them who used hearing aids and two-thirds of them who did not—to better understand these issues. That initial survey structure has been maintained over three decades of MarkeTrak, yielding an incredibly rich longitudinal picture of hearing loss in America. The nine previous waves of MarkeTrak have assisted the hearing aid manufacturers and the dispensing professions in tracking the evolution of key industry trends including binaural amplification, programmable technology, digital technology, and most recently wireless functionality and features.
The most recent edition of this series, MarkeTrak 10 (MT10), built upon the data collection methods used in MT9. Prior to MT9, the survey was conducted using a traditional paper and pencil survey mailed to selected participants. To take advantage of sophisticated, modern data collection methods, MT9 was revised as an online tool by AZ Marketing Research, HIA's partner in the recent MarkeTrak surveys. The key advantages of the online data collection are as follows:
One survey (two parts) and a more controlled survey process.
Randomized sections and items to minimize and/or remove the effect of order bias within a section or question.
Routing/Skipping capabilities utilizing programming logic to customize follow-up questions based on earlier responses to make the survey efficient and relevant for each person.
Masking the objective of the survey (by introducing the study as being about “health” as opposed to “hearing” and asking about a wide range of conditions in part 1), to not influence the hearing-related estimates in any way.
More rigor on question wording and instructions.
Weighting adjustments (similar to those used for the EuroTrak survey 1 ), which allowed for better comparisons between the American and European data.
While MT9 and MT10 incorporated innovative survey design strategies, some elements have remained the same over time. These include the following:
One “reporter” per household profiling household individuals. Each reporter is a sole/joint head-of-household adult within the home.
Upfront sample balanced to align with key U.S. household characteristics (using U.S. census information).
Households containing a person or persons with hearing difficulty invited to answer additional questions.
Self-reported information.
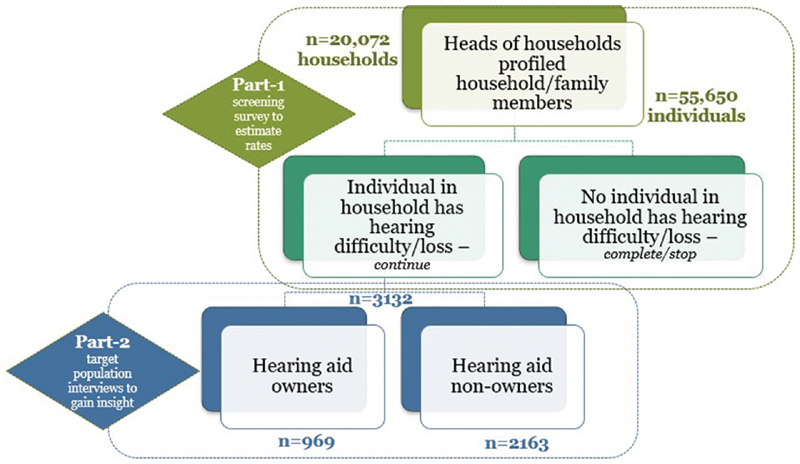
As seen in Fig. 1 , the data collection is divided into two parts. In part 1, a screening survey was sent to over 20,000 individual households, which was used to identify those individuals in the household with self-reported hearing loss. At the close of part 1, 3,132 individuals with self-reported hearing loss continued in the survey and participated in part 2, where they were asked to provide more details on their experience. In part 2, the individuals with reported hearing loss were divided into two groups, those who were current owners of hearing aids ( n = 969) and those who were nonowners ( n = 2,163). In this way, MT10 was able to gain clear insights into the consumer journey, directly from the perspective of the consumer.
Figure 1.

Research sample sizes.
With this introduction, the reader now has a sense of the methodology underlying MT10 and can make use of the rest of the articles in this edition to inform their clinical practice or research programs.
References
- 1.Hougaard S, Ruf S.EuroTrak I: a consumer survey about hearing aids in Germany, France, and the UK Hearing Review 2011180212–28.. Available at:http://www.hearingreview.com/2013/03/eurotrak-japantrak-2012-societal-and-personal-benefits-of-hearing-rehabilitation-withhearing-aids. Accessed December 29, 2019 [Google Scholar]


