

Abstract
The purpose of this article is threefold. First, it is to evaluate current rates of hearing aid satisfaction, in addition to the examination of factors that influence satisfaction rates. A second purpose is to evaluate the effects of hearing aid use on mental health and quality of life, from the consumer perspective. The third purpose of this article is to review the current status of the market in terms of usage and ownership. The usage statistics from MarkeTrak 10 answer questions such as what is the most common type of hearing aid style. And what types of hearing aid features are popular? The results of the usage statistics provide not only insight into the satisfaction and quality-of-life metrics but also information about marketplace trends. By fulfilling these purposes, strengths and weaknesses of the current hearing aid marketplace can be determined, guiding future technological and clinical practice developments. Survey results demonstrate the continued dominance of mini-BTE (behind the ear) hearing aids and high popularity of features, including wireless capabilities. Overall satisfaction rates are encouragingly high, driven by satisfaction with BTE instruments, especially those acquired in the past 5 years. Noted areas for improvement continue to be related to listening in noise and patient understanding of their hearing aids. Given the high levels of noted satisfaction, it is not surprising that the sample revealed significant hearing aid benefits, notably in a lower risk for depression, higher satisfaction listening in almost all environments, and improved quality of life on a regular basis. Together, these data provide insights into the factors that drive satisfaction, encourage industrial and scientific advancements in the identified areas of weakness, and paint a bright picture of the hearing aid market from the consumer perspective.
Keywords: hearing aid, satisfaction, survey
The primary consequence of sensorineural hearing loss is elevated thresholds for soft sounds, leading to reduced audibility. As a result, permanent sensorineural hearing loss is associated with reduced speech recognition abilities, 1 which are particularly disrupted in background noise. 2 3 4 In addition, there are a myriad of downstream consequences that can follow from communication disruptions, including increased number of depressive symptoms, 5 6 7 increased risk of isolation, 8 9 10 and reduced quality of life. 11 12 13
To mitigate the effects of hearing loss, hearing aids are a common recommendation, especially for people who have hearing losses that are not medically treatable and for people who are not surgical candidates. The primary goal of hearing aids is to improve audibility for a patient with hearing loss by amplifying incoming signals. Modern hearing aids also include a variety of technological features to reduce background noise (e.g., directional microphones, digital noise reduction) and to provide access to a variety of devices (e.g., wireless streaming from a television or telephone). In the laboratory, researchers have repeatedly demonstrated communication benefits of hearing aids, 14 15 16 noise reduction features, 17 18 19 and streaming features. 20 21 22 By improving communication, benefits also would be expected for the downstream sequelae of hearing loss, such as depressive symptoms and quality of life. Indeed, scientific investigations using a variety of experimental methodologies have demonstrated hearing aid benefits for reducing signs of depression, 23 24 improving isolation, 25 26 and increasing perceived quality of life. 6 27 28 29
Despite these documented hearing aid benefits, a comprehensive understanding of hearing aid satisfaction has remained elusive. 30 Experimentally, researchers have reported that patient-related factors contribute to higher hearing aid satisfaction, such as level of perceived hearing difficulty, 31 32 33 initial attitude toward hearing aids, 34 35 36 hearing loss self-management, 37 self-efficacy, 34 and perceived social support. 38 Researchers also have identified several patient characteristics that appear to be irrelevant to satisfaction, including pure-tone average, 31 36 39 age, 32 36 39 gender, 32 36 39 40 and employment status. 39 40
Only a few research studies have investigated the relationship between hearing aid or hearing aid fitting factors and satisfaction. 30 Some investigators have reported that hearing aid experience is related to satisfaction; patients with more experience are more satisfied. 32 41 In terms of the clinical experience, some studies support that shared decisions between hearing health care provider and patient can increase satisfaction. 42 Limited experimental findings are available for hearing aid–related factors that might influence satisfaction. Results of such findings suggest the cosmetic appearance of a hearing aid increases satisfaction. 39
For data illuminating hearing aid and fitting factors related to satisfaction, the MarkeTrak consumer surveys have been a source of valuable information for nearly 30 years. The purpose of this article is to examine the results of the most recent survey, MarkeTrak 10 (MT10), focusing on factors related to hearing aid satisfaction, in addition to potential hearing aid benefits for depression, isolation, and quality of life. The examination of the consumer perspective can positively contribute to the aforementioned literature by providing insights from respondents who might not otherwise participate in research studies. In addition, the consumer perspectives have the advantage of providing relatively layperson insights into complex constructs. Rather than using extensive surveys regarding quality of life or satisfaction, the MarkeTrak surveys use simple questions, sometimes single items, to address broad areas, such as quality of life. The results are responses to questions with high ecological validity. Details of the survey development and methodologies are published elsewhere in this issue (Powers in this issue). 43
The purpose of this article is threefold:
Evaluate current rates of hearing aid satisfaction and examine factors that influence satisfaction rates.
Evaluate the effects of hearing aid use on mental health and quality of life, from the consumer perspective.
Review the current status of the market in terms of usage and ownership (e.g., most common types, most popular features, and marketplace trends).
By fulfilling these purposes, the strengths and weaknesses of the current hearing aid marketplace can be determined, guiding future technological and clinical practice developments.
To achieve these aims, only data from survey respondents who report owning hearing aids (fitted by a hearing care professional) will be considered; data from respondents who are wearing hearing devices purchased over the counter are described in a separate article, also in this issue (Edwards in this issue). 44 When appropriate, data from a control group are included. The control group was derived by using data from respondents who are relatively matched to the hearing aid owners on degree of hearing difficulty. That is, they are respondents with similar degrees of hearing difficulties, but do not have hearing aids (see Powers, this issue for description of control group derivation). 43
Current Usage
MarkeTrak 10 survey questions queried respondents on a variety of aspects related to their current hearing aids, including age of hearing aid, hearing aid style, hearing aid features, wireless capabilities, and external devices. Each will be considered in turn. The following data include only respondents who acquired their hearing aids in the past 5 years.
Age and Repairs
The average age of hearing aids among current owners was 4.2 years and approximately half of respondents have had a hearing aid for 2 years or less ( Fig. 1 ). These data suggest many of the hearing aids in the market are relatively new. It also means that if hearing aids are replaced every 4 to 5 years, more than a third of existing hearing aid users (36%) might be in the market for replacement of hearing aids soon. Consistent with the age of hearing aids, 14% of current hearing aid owners plan to purchase a new hearing aid in the next year and 25% plan to purchase a new hearing aid in the next 2 to 7 years. Conversely, 18% of existing hearing aid users do not plan to purchase a hearing aid ever and 36% are unsure of the timing of their next purchase.
Figure 1.

Percent of survey respondents that report a given age of their hearing aid(s).
The need for hearing aid repair, defined as need to be sent to the manufacturer, was relatively uncommon. Half of respondents with hearing aids acquired in the past 5 years never needed a hearing aid repair. Only one repair was the second most common response (27%), followed by two to three times (19%), four to five times (4%), and more than six times (1%).
Style
Kochkin 45 noted that in 2005 to 2008, popularity of mini-BTE was growing and this had become the most common hearing aid (25.3%), followed by visible in the canal instruments (27.7%) and then standard BTEs (21.8%). At that time, visible ITEs and invisible in the canal instruments were less popular, representing 16.4 and 10% of hearing aids, respectively. Today, mini-BTEs are still the most popular hearing aid, and their popularity has continued to grow.
Among all hearing aid owners identified in the MT10 study, 73% wore BTE aids and 26% own in the ear (ITE) hearing aids. Of the ITE hearing aids, the ITC (8%) and ITE full shell (7%) were the most popular, followed by the CIC and “invisible” styles. Of the BTE hearing aids, the most common type (60%) is the “receiver in the canal” (displayed to respondents as a mini-BTE with a thin tube). Only 12% of respondents reported owning a standard BTE aid (displayed to respondents as a traditional BTE with a standard ear hook). In terms of coupling, the most common reported coupling was a custom mold (61%) compared to an “off-the-shelf” type (24%); 14% of respondents were not sure of the coupling. The distribution of styles was roughly equivalent regardless of whether a respondent purchased the hearing aid(s) within the last year or last 5 years.
Features
The most common hearing aid feature was a volume control on the hearing aid itself (67% respondents reported one). A program button was also common (41%). Less common features were directional microphones (28%), a telecoil (20%), and a tinnitus masker (14%). However, many respondents were uncertain if their hearing aids contained these features, especially directional microphones (35%), a telecoil (26%), and a tinnitus masker (43%).
Combined between rechargeable batteries for hearing aids (14%) and rechargeable hearing aids with nonremovable batteries (14%), nearly one-third of respondents reported having a rechargeable power solution. Of the 497 respondents without a rechargeable solution, only 21% of respondents considered getting one. Common reasons respondents did not consider rechargeable options included the following: not recommended (39%), cost (28%), not familiar (27%), not as important as other things (22%), seemed inconvenient to charge (15%), batteries are already free (4%), not available (1%), and other/not sure (9%).
Wireless Capabilities
Wireless capabilities were considered separately from the aforementioned features. More than half of owners reported their hearing aids have wireless capabilities (54%). This represents an increase in wireless capabilities relative to MarkeTrak 9 (MT9; 43%). Among people who acquired hearing aids in the last year, 59% reported wireless capabilities, another increase relative to MT9 (51%). The most common wireless capability was the ability to link volume or program changes (43%), followed by streaming from a television or cell phone with an intermediary device (26%), and then streaming directly from an iPhone (13%; Android streaming was not available at the time of the survey). As with other features, many respondents demonstrated uncertainty about their hearing aids' capabilities; approximately one in five was unsure if their aid(s) were capable of linking (20%), streaming with an intermediary device (18%), or streaming from an iPhone (21%).
More than 20% of respondents report use of an external application (e.g., remote control or remote microphone). Table 1 lists the use of external accessories. The most common external device is a remote control (21%), followed by use of a smartphone application for volume and program control (17%). Again, many respondents are unsure if they have a remote control or external accessories (rates of uncertainty range from 10 to 15%). Among people who have a remote control or smartphone application, use rates are relatively high (see Fig. 2 ). These data indicate that the majority of respondents who have a remote (56%) or an app (64%) use it at least weekly.
Table 1. External Accessories Reported by Survey Respondents with Hearing Aids in the Last 5 Years.
| External accessories or “apps” | HA owners who got HA(s) in past 5 y ( n = 702) | ||
|---|---|---|---|
| Yes | No | Not sure | |
| • Hearing aid remote control that adjusts the hearing aid volume, programs, etc. | 21% | 69% | 10% |
| • Body-worn Bluetooth device that connects the hearing aids to Bluetooth phones, computers, etc. | 15% | 73% | 12% |
| • TV streamer that plugs into the television and wirelessly streams the sound to the hearing aids | 11% | 79% | 10% |
| • Companion microphone that wirelessly streams a companion's voice to the hearing aids | 7% | 80% | 13% |
| • Downloadable app for smart phones that makes it possible to use a cell phone as a remote control for a hearing aid. [Adjusted to include only those with smart phones] | 17% | 68% | 15% |
Note: <slide 82 from HIA results>.
Figure 2.

Frequency of remote microphone or smartphone application among respondents who report having the features on hearing aids acquired in the past 5 years.
Technology Use
Although not hearing aid related, it is worth noting the role of technology in the lives of the respondents. First, with implications for marketing and networking, the majority of survey respondents use the Internet, specifically for social media; 61% had visited a social media site in the last month. Among those who used social media, hearing aid owners and nonowners were relatively equal in their distribution of sites visited, with Facebook by far the most common (90%). Other common sites, where owners and nonowners diverged, included YouTube (54% of nonowners, 36% of owners), Instagram (28% of nonowners, 19% of owners), and Pinterest (26% of nonowners, 16% of owners).
As the hearing aid industry's technology evolves to include more wireless connectivity options, and more health care providers are able to offer telehealth solutions, it will be important to understand the market penetration of mobile devices, to which patients and hearing aids can connect. Among all respondents with hearing loss, 52% have a tablet and 86% have a cell phone (78% of those are smartphones). The age breakdown of cellular telephone and smartphone ownership is displayed in Fig. 3 . Table 2 displays the percent of respondents who have an Apple or an Android operating system on their mobile devices. Table 2 includes all respondents with hearing loss. The operating system ownership changes slightly among hearing aid owners, where 47% have an iPhone and only 40% have an Android phone.
Figure 3.

Percent of respondents who have a cell phone (panel A ) and whose cell phone is a smartphone (panel B ) for different age groups. Yellow bars indicate age groups that are less likely to have a cell phone or a smart phone.
Table 2. Percentage of Respondents who own Mobile Devices with iPhone or Android Operating Systems.
| < 35 y old | 35–64 y old | 65+ y old | |
|---|---|---|---|
| iPhone | 44% | 37% | 47% |
| Android | 51% | 60% | 49% |
| N | 419 | 1,372 | 1,341 |
Note: Data are from all respondents with hearing loss.
Finally, 811 respondents own both hearing aids and a cellular telephone. Of those, 82% report wearing the hearing aid when placing or receiving calls. When they do place or receive calls, the most common problem reported is the other person's speech is not loud enough, which happens regularly for 9% of respondents, occasionally for 40% of respondents, rarely for 27% of respondents, and never for 24% of respondents. Other problems reported included the other person's speech is not clear enough, which happens regularly (11%), occasionally (34%), rarely (29%), and never (26%), in addition to interfering noises like buzzing, which happens regularly (4%), occasionally (22%), rarely (34%), and never (41%).
In summary, these data indicate technology use is prevalent, even in combination with hearing aids. These data also indicate that most hearing aids in the market are less than 4 years old and they have required few repairs. BTE hearing aids are the most common style; volume controls, remote controls, and wireless capabilities are also common. There continues to be uncertainty on the part of survey respondents regarding the less visible features (e.g., directional microphones, telecoils, and wireless capabilities). Now that the current status of hearing aids, features, and technology in the market has been elucidated, the next logical question is how many hearing aid users are satisfied with their hearing aids and what factors increase satisfaction?
Satisfaction
To evaluate satisfaction, the MT10 survey asked respondents to rate their satisfaction with a variety of things. In the two most recent MarkeTrak surveys, respondents rated their satisfaction on a 7-point scale, where 1 indicates very dissatisfied, 4 indicates neutral, and 7 indicates very satisfied. Respondents who indicated scores of 5, 6, or 7 were considered to be satisfied, and are hereafter referred to as Top-3 Box respondents. The results of the MT10 survey are consistent with previous findings, including MT9 (published in 2015) and some European surveys. MT10 demonstrates a slight (not significant) increase in satisfaction, with more than 8 out of 10 owners satisfied with their hearing aids (see Fig. 4 ). These data are also consistent with return rates; 8 of 10 respondents who purchased a hearing aid still have their hearing aid (see Jorgensen this issue). 46 Note that satisfaction rates are significantly lower for those who returned their hearing aids (50%) relative to those who kept their hearing aids (see bottom of Fig. 5 ). The following factors contribute to hearing aid satisfaction.
Figure 4.

Hearing aid satisfaction in the MarkeTrak surveys (MarkeTrak 9 in 2008 and MarkeTrak 10 in 2018) compared with satisfaction rates from other consumer surveys.
Figure 5.

Effect of hearing aid age on hearing aid satisfaction.
Factors that Contribute to Satisfaction
Hearing Aid Age
Hearing aid satisfaction rates, as indicated by percentage of respondents who chose one of the Top-3 boxes, are higher for those who acquired their hearing aid in the last year (86%) relative to other hearing aid ages (e.g., 78% of those whose aids are 6+ years old). In addition, respondents who have owned more than one hearing aid were more likely to note higher satisfaction with their current hearing aids compared to their first hearing aids. Fifty-eight percent (58%) of respondents reported their current hearing aids are much better than their first hearing aids; 26% say their current hearing aids are somewhat better than their first. Only a small percentage of respondents say their current hearing aids are equivalent to (14%), are somewhat worse than (3.6%), or much worse than (0.3%) their first one(s). These data are consistent with the MT9 results ( Fig. 5 ). 47
Respondents in MT10 attribute the improvements to better quality products or updated technology (67%), a better sense of their true needs (23%), a better experience with the hearing care professional (23%), increased willingness to use the hearing aid (21%), or some other reason (4%).
Hearing Aid Cost
People who paid more for their hearing aids ($3,000 + ) reported higher satisfaction than those who paid $2,999 or less. There was no difference in satisfaction rates for those who paid less than $1,500 or $1,500 compared to those who paid $2,999 for their hearing aids ( Fig. 6 ).
Figure 6.

Effect of purchase price on hearing aid satisfaction.
Hearing Aid Style
People who have ITEs are slightly less satisfied compared to other hearing aid styles (invisible, standard BTE, receiver in the canal BTE). The difference between ITEs and BTEs might be related to the level of technology in the respondents' hearing aids. When considering those with the highest level of technology, the satisfaction rates between ITE users (79%) and BTE users (84%) are more similar to each other (right bars in Fig. 7 ).
Figure 7.
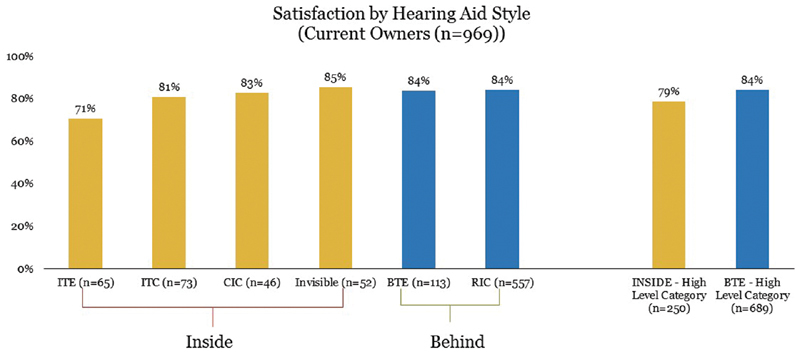
Effect of hearing aid style on hearing aid satisfaction.
Features
People who have directional microphones, telecoils, smartphone applications, Bluetooth devices, rechargeable batteries, tinnitus maskers, and wireless hearing aids are more satisfied than those who do not have those features. Program buttons, volume control on the hearing aid, rechargeable hearing aids, television streamers, remote control microphones, and companion microphones do not significantly increase reported satisfaction rates ( Fig. 8 ).
Figure 8.
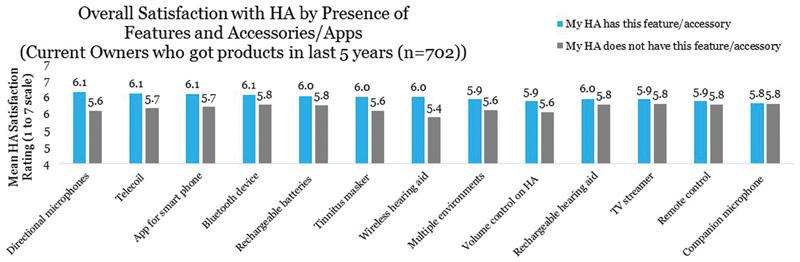
Effect of hearing aid features on hearing aid satisfaction.
Expectations
When hearing aid owners' expectations are exceeded, they are more likely to be satisfied. Most hearing aid owners reported having their expectations about hearing aids met. Almost half (47%) reported their hearing aids were better than they had expected (either much better [22%] or somewhat better [25%]). Forty-one percent (41%) reported the hearing aid was about as expected, while few reported unmet expectations (hearing aid was either somewhat worse [10%] or much worse [2%] than expected). Fewer past owners ( n = 180) reported their hearing aids exceeded expectations (20% much better and 15% somewhat better), while most reported the hearing aids were somewhat worse (23%) or much worse (12%) than expected; 30% reported the hearing aids were about as expected.
The factors that contribute to exceeded or unmet expectations were extracted by coding respondents' verbatim comments in response to a follow-up question “How does your current hearing aid (purchased through a professional) compare to whatever expectations you had when you purchased it.” Results, displayed in Fig. 9 , reveal that the top factor contributing to exceeded expectations is hearing well (e.g., hearing better, conversing, streaming). The top factor contributing to unmet expectations is sound issues (e.g., background noise, sound quality, or feedback), closely followed by not hearing well enough. Hearing aid price played only a small role in expectations being unmet or exceeded (too expensive or reasonable, respectively). These data highlight the importance of hearing well and sound quality to meeting hearing aid owners' expectations.
Figure 9.

Factors affecting met and unmet expectations.
Five Factors
Sound quality and hearing aid performance are similarly important for satisfaction. A model of factors driving hearing aid satisfaction was constructed using factor analysis and multiple regression models. The results, displayed in Fig. 10 , reveal five important factors contributing to satisfaction. The five factors, listed in descending order of contribution to ratings of satisfaction, are as follows: hearing aid performance and sound, hearing care professional effectiveness, hearing aid physical qualities, hearing aid maintenance, and costs (upfront and ongoing). These data demonstrate the importance of hearing aid performance and sound quality on hearing aid satisfaction, and also support cost as making only a small contribution to rates of hearing aid satisfaction.
Figure 10.

Factors contributing to hearing aid satisfaction.
Aspects of Hearing Aids that Are Satisfactory
The preceding data demonstrate hearing aid satisfaction rates are generally high and elucidate the potential hearing aid–related contributors to satisfaction. But how satisfied are owners with the various aspects of their hearing aid(s)? The MarkeTrak survey questions queried three categories—overall key attributes, physical/sound attributes, and functional aspects.
Overall Key Attributes
Considering the top three satisfaction choices, people are most satisfied with the product quality, ease of use, and appearance of hearing aids. They are most dissatisfied with the out-of-pocket price paid ( Fig. 11 ).
Figure 11.

Satisfaction with overall hearing aids.
Physical/Sound Attributes
Respondents are generally satisfied with the physical and sound attributes of hearing aids. They are most satisfied with hearing aid reliability and durability, but least satisfied with comfort listening to loud sounds ( Fig. 12 ).
Figure 12.

Satisfaction with physical and sound attributes of hearing aids.
Functional Aspects
Respondents are most satisfied with the ease of insertion/removal of their hearing aids and ease of changing the battery. They are most dissatisfied with the hearing aid's ability to minimize background noise and battery life. Satisfaction with the ability to mask tinnitus was only asked of people who reported tinnitus ( Fig. 13 ).
Figure 13.

Satisfaction with functional aspects of hearing aids.
In summary, most hearing aid owners are satisfied with their hearing aids. Respondents who spent more on their hearing aids, have recently acquired them, have hearing aid features, and who do not have ITE hearing aids are more likely to be satisfied. In addition, the most important factor driving hearing aid satisfaction is hearing aid performance and sound quality.
Benefits of Hearing Aids
Fortunately, the satisfaction data indicate hearing aid owners are generally satisfied with their hearing aids. But what do consumers say about hearing aid benefits? Clearly hearing aids provide benefits as evidenced by scientific research and also consumer surveys. The MT10 data are no exception, demonstrating hearing aid benefits in a variety of domains. Specifically, the survey included questions related to specific listening situations, mental health, and quality of life.
Listening Situations
MarkeTrak 10 survey respondents rated their satisfaction with their perceived hearing abilities in a variety of listening situations. Respondents answered if they were hearing aid owners or hearing aid nonowners. Hearing aid benefits can be indirectly estimated by comparing satisfaction rates between owners and nonowners. In terms of their overall ability to hear, 79% of hearing aid owners ( n = 969) are satisfied with their ability to hear, compared with only 41% of nonowners ( n = 2,013). That is, hearing aid owners are twice as likely to be satisfied with their ability to hear. Satisfaction rates vary based on the age of owners' hearing aids; they are highest with the newest hearing aids (83%), slightly lower with hearing aids less than 5 years old (81%), and significantly lower with hearing aids over 6 years old (69%).
Table 3 displays hearing satisfaction rates for hearing aid owners (by age of hearing aid), compared to nonowners for a variety of listening situations. Hearing aid owners are most likely to be satisfied with their ability to converse with one person (86%) and in the workplace (81%), but are least likely to be satisfied with their ability to hear in a classroom (66%), follow a conversation in noise (68%), or talk on a traditional telephone (69%). Most hearing aid nonowners are satisfied with their ability to converse with one person (58%), and by their ability to listen to music (57%). Nonowners are least likely to be satisfied with their hearing ability when following conversation in noise (27%) and in large group conversations (30%).
Table 3. Hearing Satisfaction Rates for Hearing Aid Owners (by Age of Hearing Aid), Compared with Nonowners for a Variety of Listening Situations.
| Top-3 Box satisfaction (on 7-point scale) | HA owners—age of HA | All nonowners | |||
|---|---|---|---|---|---|
| All owners | HA ≤ 1 y | HA ≤ 5 y | HA 6+ y | ||
| ( n = 969) | ( n = 294) | ( n = 702) | ( n = 164) | ( n = 2,013) | |
| At home with family members | 81% | 84% | 83% | 72% | 48% |
| When trying to follow conversations in noise | 68% | 76% | 69% | 61% | 27% |
| In conversations with one person | 86% | 88% | 88% | 81% | 58% |
| In conversations with small groups | 78% | 83% | 81% | 69% | 43% |
| In conversations with large groups | 70% | 77% | 71% | 62% | 30% |
| When talking to children | 73% | 77% | 73% | 71% | 44% |
| When talking on a cell phone | 73% | 80% | 75% | 60% | 51% |
| When talking on a traditional telephone | 69% | 71% | 69% | 63% | 50% |
| When watching TV with others | 77% | 82% | 79% | 68% | 40% |
| In a classroom (as observer or student) | 66% | 69% | 65% | 64% | 40% |
| In a larger lecture hall | 70% | 75% | 71% | 63% | 37% |
| At a movie theater | 71% | 74% | 72% | 65% | 51% |
| When listening to music | 78% | 78% | 77% | 76% | 57% |
| In the workplace | 81% | 92% | 79% | 91% | 48% |
| When riding in a car | 74% | 81% | 75% | 69% | 48% |
| Outdoors | 77% | 83% | 79% | 68% | 46% |
| During leisure activities | 77% | 79% | 78% | 74% | 52% |
| In a store, when shopping | 77% | 80% | 78% | 72% | 45% |
| Overall, across all listening situations | 78% | 83% | 81% | 67% | 41% |
The largest discrepancy between the owners and nonowners is on their satisfaction following conversations in noise, where 68% of owners are satisfied, whereas only 27% of nonowners are satisfied. Thus, despite being least satisfied with their ability to hear in noise, this is an area where hearing aids are providing benefits. Other situations with large discrepancies include conversations in large groups (70% of owners satisfied; 30% of nonowners satisfied), when watching television with others (77% of owners satisfied; 40% of no-owners satisfied), and conversations with small groups (78% of owners satisfied; 43% of nonowners satisfied).
Mental Health
Since mental health was not a focus of the MT10 survey, the only explicit comparison of owners and nonowners matched for degree of hearing difficulty is related to depression. Fortunately, the data indicate that hearing aid use lowers the risk of depression. Among hearing aid owners ( n = 656), 11% are at risk for depression based on the PHQ-2 depression symptom screening questionnaire. Conversely, 32% of hearing aid nonowners who are matched for degree of hearing difficulty with owners ( n = 513) were at risk for depression. That is, hearing aid nonowners with a loss profile similar to owners have more than double the risk of depressive symptoms.
While not queried further specifically, hearing aid benefits for mental health are evident indirectly in Fig. 14 , where respondents rated the extent to which hearing aids helped in a variety of domains. Of note, more than a third (34%) reported that hearing aids improved their emotional health. Other indices of mental health where respondents reported benefit include improved sense of humor (32%), feelings about oneself (37%), social life (41%), and feeling included (43%).
Figure 14.

Observed changes attributed to hearing aid use.
Feeling included was explored further with two questions in MarkeTrak; the questions queried the degree to which respondents with hearing loss (nonowners) or hearing aids (owners) felt embarrassed or rejected/made fun of. Results of these questions revealed nonowners reported feeling embarrassed regularly (21%) or occasionally (43%) as a result of hearing loss, but few report never (16%) or rarely (20%) feeling embarrassed. Conversely, owners reported such feelings less often. Fewer owners reported feeling rejected or made fun of regularly (9%) or occasionally (27%) and more owners report that the experience is rare (37%) or never occurs (37%).
Given the noted improvements in communication associated with hearing aid use, one might not be surprised that hearing aid use reduces feelings of embarrassment or bullying. For owners, the greater concern might be feelings of embarrassment and bullying would be reduced for hearing aid owners. For owners, the concern would be feelings of embarrassment or being made fun of as a result of hearing aid use. Fortunately, embarrassment and being made fun of as a result of hearing aid use is rare, occurring never for 73% and 78% of respondents, respectively. Embarrassment occurs rarely for 14% of respondents, occasionally for 9%, and regularly for only 4% of owner respondents. Sense of being made fun of occurs rarely for 11%, occasionally for 6%, and regularly for 5% of hearing aid owner respondents. Thus, it is likely that the increased ability to communicate in a variety of listening situations, without concomitant increase in feelings of embarrassment or being rejected, contributes to better mental health, and possibly also quality of life.
Quality of Life
Indeed, most hearing aid owners feel their hearing aids improve the quality of their life, either regularly (55%) or occasionally (32%). Few reported their hearing aid(s) rarely (10%) or never (3%) improved the quality of their life. These data are similar to the findings of the MT9 survey, where respondents reported hearing aids improved their quality of life regularly (48%), occasionally (40%), rarely (9%), or never (2%). 48 Specific changes attributed to hearing aid use are displayed in Fig. 14 . The change with the highest percentage of respondents noticing a positive change is the overall ability to communicate effectively, followed by overall quality of life and willingness to talk or engage in conversation. Respondents were least likely to attribute positive hearing aid–related changes to physical health and mental ability/memory. Few respondents noted negative changes associated with hearing aid use.
Conclusions
For several decades, significant effort has been expended to understand, develop, and evaluate the effectiveness of the interventions to mitigate the consequences of permanent hearing loss. From an experimental perspective, evidence supports hearing aid benefits in speech understanding, mental health, and quality-of-life domains. Experimental studies also facilitate the understanding of factors that contribute to hearing aid satisfaction. However, experimental evidence does little to indicate the hearing aid–related factors that contribute to satisfaction. Consumer surveys, such as the MarkeTrak series, provide the opportunity to understand hearing aid satisfaction (and benefits for mental health and quality of life) from the consumer perspective. The results of the most recent MarkeTrak survey provide considerable insights into the current consumer state, hearing aid satisfaction, and hearing aid benefits. The results of this survey also provide insight into the current usage in the market, in addition to weaknesses and strengths in the market.
Notable findings regarding the current usage in the market:
Mini-BTEs are the most common devices.
Most respondents have cell phones and many have smartphones (even among the oldest respondents).
More than half of hearing aids have wireless capabilities.
Volume controls and program buttons are popular.
Hearing aid features (directional microphones, telecoils, smartphone applications, Bluetooth devices, rechargeable batteries, tinnitus maskers, and wireless capabilities) increase hearing aid satisfaction rates.
Notable areas of weakness that should be addressed by the field include the following:
Continued difficulty understanding speech in large groups and in noise. Nearly a third of respondents were not satisfied with their hearing aid performance in these situations. Continued development of rehabilitative solutions to address speech understanding in noise would likely improve satisfaction in these difficult listening situations.
Using the cell phone with hearing aids is challenging. Nearly half of respondents reported experiencing difficulty with the clarity or loudness of the talker's voice at least occasionally. Continued difficulty with cell phones could be related to low telecoil use (26%), low streaming use (∼23% of hearing aid users), or factors unrelated to hearing aid/cell phone connection, such as background noise in the environment or lack of visual cues. Technological advancements that enhance the quality (and quantity) of streamed signals, in addition to advances that provide visual cues or reduce background noise during telephone conversations, have the potential to improve the listening experience. These developments might be particularly important as telehealth (or e-health) become more common generally 49 and for hearing healthcare specifically. 50
Related, wireless streaming from cell phones offers the potential for improved sound quality. Although smartphone market penetration is high (>80% of respondents younger than 75 years), streaming directly from a smartphone is uncommon (13% of respondents in this survey). This relatively low penetration of streaming is partly reflective of the technology available at the time of the survey and will likely grow in future surveys.
Hearing aid owners are uncertain regarding their features and wireless capabilities (∼1 in 5 do not recognize if they have less visible features, such as directional microphones or wireless capabilities). This is important because most of these features require interaction between the patient and the hearing aid to maximize use of the feature (e.g., turning to face the talker, changing a program, or connecting a hearing aid to an intermediary device for streaming). Although the phenomenon is not new, 51 these data suggest even experienced users might not have a comprehensive understanding of their hearing aids. Modified counseling strategies and hearing aid brochures, for example, use of shorter sentences 52 53 and larger font with more pictures, 51 could address this weakness.
Notable areas of strength for the consumer perspective evidenced from MT10 findings include the following:
Need for hearing aid repairs is relatively low.
Satisfaction rates are high (roughly 8 of 10 hearing aid owners are satisfied).
A majority of respondents report (85%) higher satisfaction with their current hearing aid(s) relative to their first hearing aid(s), demonstrating technological improvements in hearing aids over time.
Hearing aid owners are satisfied with their hearing aids in diverse listening situations.
Many hearing aid features increase hearing aid satisfaction (e.g., directional microphones, telecoils, smartphone apps, and Bluetooth streaming).
Hearing aid use reduces the risk of depression from 32% (nonowners) to 11% (owners).
The majority of hearing aid owners say their hearing aids regularly (55%) or occasionally (32%) improve the quality of their life.
In total, these results demonstrate the continued dominance of mini-BTE hearing aids and high popularity of features, including wireless capabilities. Overall satisfaction rates are encouragingly high, driven by satisfaction with BTE instruments, especially those acquired in the past 5 years. Noted areas for improvement continue to be related to listening in noise and patient understanding of their hearing aids. Given the high levels of noted satisfaction, it is not surprising that the sample revealed significant hearing aid benefits, notably in a lower risk for depression, higher satisfaction listening in almost all environments, and improved quality of life on a regular basis. Together, these data provide insights into the factors that drive satisfaction, encourage industrial and scientific advancements in the identified areas of weakness, and paint a bright picture of the hearing aid market from the consumer perspective.
Disclosure
E.M.P. is employed by Vanderbilt University Medical Center and receives funding for research from Sonova, GN Resound, and Signia, in addition to the National Institutes of Health.
References
- 1.Humes L E, Roberts L. Speech-recognition difficulties of the hearing-impaired elderly: the contributions of audibility. J Speech Hear Res. 1990;33(04):726–735. doi: 10.1044/jshr.3304.726. [DOI] [PubMed] [Google Scholar]
- 2.Plomp R. A signal-to-noise ratio model for the speech-reception threshold of the hearing impaired. J Speech Hear Res. 1986;29(02):146–154. doi: 10.1044/jshr.2902.146. [DOI] [PubMed] [Google Scholar]
- 3.Bronkhorst A W. The cocktail party phenomenon: a review of research on speech intelligibility in multiple-talker conditions. Acustica. 2000;86(01):117–128. [Google Scholar]
- 4.Sherbecoe R L, Studebaker G A. Audibility-index functions for the connected speech test. Ear Hear. 2002;23(05):385–398. doi: 10.1097/00003446-200210000-00001. [DOI] [PubMed] [Google Scholar]
- 5.Kramer S E, Kapteyn T S, Kuik D J, Deeg D J. The association of hearing impairment and chronic diseases with psychosocial health status in older age. J Aging Health. 2002;14(01):122–137. doi: 10.1177/089826430201400107. [DOI] [PubMed] [Google Scholar]
- 6.Cacciatore F, Napoli C, Abete P, Marciano E, Triassi M, Rengo F. Quality of life determinants and hearing function in an elderly population: Osservatorio Geriatrico Campano Study Group. Gerontology. 1999;45(06):323–328. doi: 10.1159/000022113. [DOI] [PubMed] [Google Scholar]
- 7.Monzani D, Galeazzi G M, Genovese E, Marrara A, Martini A. Psychological profile and social behaviour of working adults with mild or moderate hearing loss. Acta Otorhinolaryngol Ital. 2008;28(02):61–66. [PMC free article] [PubMed] [Google Scholar]
- 8.Stam M, Smit J H, Twisk J W et al. Change in psychosocial health status over 5 years in relation to adults' hearing ability in noise. Ear Hear. 2016;37(06):680–689. doi: 10.1097/AUD.0000000000000332. [DOI] [PubMed] [Google Scholar]
- 9.Mick P, Kawachi I, Lin F R. The association between hearing loss and social isolation in older adults. Otolaryngol Head Neck Surg. 2014;150(03):378–384. doi: 10.1177/0194599813518021. [DOI] [PubMed] [Google Scholar]
- 10.Hawthorne G. Perceived social isolation in a community sample: its prevalence and correlates with aspects of peoples' lives. Soc Psychiatry Psychiatr Epidemiol. 2008;43(02):140–150. doi: 10.1007/s00127-007-0279-8. [DOI] [PubMed] [Google Scholar]
- 11.Dalton D S, Cruickshanks K J, Klein B E, Klein R, Wiley T L, Nondahl D M. The impact of hearing loss on quality of life in older adults. Gerontologist. 2003;43(05):661–668. doi: 10.1093/geront/43.5.661. [DOI] [PubMed] [Google Scholar]
- 12.Chia E M, Wang J J, Rochtchina E, Cumming R R, Newall P, Mitchell P. Hearing impairment and health-related quality of life: the Blue Mountains Hearing Study. Ear Hear. 2007;28(02):187–195. doi: 10.1097/AUD.0b013e31803126b6. [DOI] [PubMed] [Google Scholar]
- 13.Gopinath B, Schneider J, Hickson L et al. Hearing handicap, rather than measured hearing impairment, predicts poorer quality of life over 10 years in older adults. Maturitas. 2012;72(02):146–151. doi: 10.1016/j.maturitas.2012.03.010. [DOI] [PubMed] [Google Scholar]
- 14.Humes L E, Wilson D L, Barlow N N, Garner C. Changes in hearing-aid benefit following 1 or 2 years of hearing-aid use by older adults. J Speech Lang Hear Res. 2002;45(04):772–782. doi: 10.1044/1092-4388(2002/062). [DOI] [PubMed] [Google Scholar]
- 15.Hornsby B W. The effects of hearing aid use on listening effort and mental fatigue associated with sustained speech processing demands. Ear Hear. 2013;34(05):523–534. doi: 10.1097/AUD.0b013e31828003d8. [DOI] [PubMed] [Google Scholar]
- 16.Shanks J E, Wilson R H, Larson V, Williams D. Speech recognition performance of patients with sensorineural hearing loss under unaided and aided conditions using linear and compression hearing aids. Ear Hear. 2002;23(04):280–290. doi: 10.1097/00003446-200208000-00003. [DOI] [PubMed] [Google Scholar]
- 17.Wu Y H. Effect of age on directional microphone hearing aid benefit and preference. J Am Acad Audiol. 2010;21(02):78–89. doi: 10.3766/jaaa.21.2.3. [DOI] [PubMed] [Google Scholar]
- 18.Sarampalis A, Kalluri S, Edwards B, Hafter E. Objective measures of listening effort: effects of background noise and noise reduction. J Speech Lang Hear Res. 2009;52(05):1230–1240. doi: 10.1044/1092-4388(2009/08-0111). [DOI] [PubMed] [Google Scholar]
- 19.Ricketts T, Henry P. Evaluation of an adaptive, directional-microphone hearing aid. Int J Audiol. 2002;41(02):100–112. doi: 10.3109/14992020209090400. [DOI] [PubMed] [Google Scholar]
- 20.Picou E M, Ricketts T A. Comparison of wireless and acoustic hearing aid-based telephone listening strategies. Ear Hear. 2011;32(02):209–220. doi: 10.1097/AUD.0b013e3181f53737. [DOI] [PubMed] [Google Scholar]
- 21.Picou E M, Ricketts T A. Efficacy of hearing-aid based telephone strategies for listeners with moderate-to-severe hearing loss. J Am Acad Audiol. 2013;24(01):59–70. doi: 10.3766/jaaa.24.1.7. [DOI] [PubMed] [Google Scholar]
- 22.Au A, Blakeley J M, Dowell R C, Rance G. Wireless binaural hearing aid technology for telephone use and listening in wind noise. Int J Audiol. 2019;58(04):193–199. doi: 10.1080/14992027.2018.1538573. [DOI] [PubMed] [Google Scholar]
- 23.Acar B, Yurekli M F, Babademez M A, Karabulut H, Karasen R M. Effects of hearing aids on cognitive functions and depressive signs in elderly people. Arch Gerontol Geriatr. 2011;52(03):250–252. doi: 10.1016/j.archger.2010.04.013. [DOI] [PubMed] [Google Scholar]
- 24.Gopinath B, Wang J J, Schneider J et al. Depressive symptoms in older adults with hearing impairments: the Blue Mountains Study. J Am Geriatr Soc. 2009;57(07):1306–1308. doi: 10.1111/j.1532-5415.2009.02317.x. [DOI] [PubMed] [Google Scholar]
- 25.Weinstein B E, Sirow L W, Moser S. Relating hearing aid use to social and emotional loneliness in older adults. Am J Audiol. 2016;25(01):54–61. doi: 10.1044/2015_AJA-15-0055. [DOI] [PubMed] [Google Scholar]
- 26.Joore M A, Brunenberg D E, Chenault M N, Anteunis L J. Societal effects of hearing aid fitting among the moderately hearing impaired. Int J Audiol. 2003;42(03):152–160. doi: 10.3109/14992020309090424. [DOI] [PubMed] [Google Scholar]
- 27.Chisolm T H, Johnson C E, Danhauer J L et al. A systematic review of health-related quality of life and hearing aids: final report of the American Academy of Audiology Task Force On the Health-Related Quality of Life Benefits of Amplification in Adults. J Am Acad Audiol. 2007;18(02):151–183. doi: 10.3766/jaaa.18.2.7. [DOI] [PubMed] [Google Scholar]
- 28.Kitterick P T, Smith S N, Lucas L. Hearing instruments for unilateral severe-to-profound sensorineural hearing loss in adults: a systematic review and meta-analysis. Ear Hear. 2016;37(05):495–507. doi: 10.1097/AUD.0000000000000313. [DOI] [PMC free article] [PubMed] [Google Scholar]
- 29.Mulrow C D, Aguilar C, Endicott J E et al. Quality-of-life changes and hearing impairment. A randomized trial. Ann Intern Med. 1990;113(03):188–194. doi: 10.7326/0003-4819-113-3-188. [DOI] [PubMed] [Google Scholar]
- 30.Knudsen L V, Oberg M, Nielsen C, Naylor G, Kramer S E. Factors influencing help seeking, hearing aid uptake, hearing aid use and satisfaction with hearing aids: a review of the literature. Trends Amplif. 2010;14(03):127–154. doi: 10.1177/1084713810385712. [DOI] [PMC free article] [PubMed] [Google Scholar]
- 31.Cox R M, Alexander G C, Gray G A. Personality, hearing problems, and amplification characteristics: contributions to self-report hearing aid outcomes. Ear Hear. 2007;28(02):141–162. doi: 10.1097/AUD.0b013e31803126a4. [DOI] [PubMed] [Google Scholar]
- 32.Uriarte M, Denzin L, Dunstan A, Sellars J, Hickson L. Measuring hearing aid outcomes using the Satisfaction with Amplification in Daily Life (SADL) questionnaire: Australian data. J Am Acad Audiol. 2005;16(06):383–402. doi: 10.3766/jaaa.16.6.6. [DOI] [PubMed] [Google Scholar]
- 33.Takahashi G, Martinez C D, Beamer S et al. Subjective measures of hearing aid benefit and satisfaction in the NIDCD/VA follow-up study. J Am Acad Audiol. 2007;18(04):323–349. doi: 10.3766/jaaa.18.4.6. [DOI] [PubMed] [Google Scholar]
- 34.Ferguson M A, Woolley A, Munro K J. The impact of self-efficacy, expectations, and readiness on hearing aid outcomes. Int J Audiol. 2016;55(03) 03:S34–S41. doi: 10.1080/14992027.2016.1177214. [DOI] [PubMed] [Google Scholar]
- 35.Wilson C, Stephens D. Reasons for referral and attitudes toward hearing aids: do they affect outcome? Clin Otolaryngol Allied Sci. 2003;28(02):81–84. doi: 10.1046/j.1365-2273.2003.00669.x. [DOI] [PubMed] [Google Scholar]
- 36.Gatehouse S. Components and determinants of hearing aid benefit. Ear Hear. 1994;15(01):30–49. doi: 10.1097/00003446-199402000-00005. [DOI] [PubMed] [Google Scholar]
- 37.Convery E, Keidser G, Hickson L, Meyer C. The relationship between hearing loss self-management and hearing aid benefit and satisfaction. Am J Audiol. 2019;28(02):274–284. doi: 10.1044/2018_AJA-18-0130. [DOI] [PubMed] [Google Scholar]
- 38.Singh G, Lau S T, Pichora-Fuller M K. Social support predicts hearing aid satisfaction. Ear Hear. 2015;36(06):664–676. doi: 10.1097/AUD.0000000000000182. [DOI] [PubMed] [Google Scholar]
- 39.Hickson L et al. Hearing aid fitting: outcome for older adults. Aust J Audiol. 1999;21(01):9–21. [Google Scholar]
- 40.Jerram J C, Purdy S C. Technology, expectations, and adjustment to hearing loss: predictors of hearing aid outcome. J Am Acad Audiol. 2001;12(02):64–79. [PubMed] [Google Scholar]
- 41.Hosford-Dunn H, Halpern J. Clinical application of the SADL scale in private practice II: predictive validity of fitting variables. Satisfaction with amplification in daily life. J Am Acad Audiol. 2001;12(01):15–36. [PubMed] [Google Scholar]
- 42.Shay L A, Lafata J E. Where is the evidence? A systematic review of shared decision making and patient outcomes. Med Decis Making. 2015;35(01):114–131. doi: 10.1177/0272989X14551638. [DOI] [PMC free article] [PubMed] [Google Scholar]
- 43.Powers T, Rogin C. MarkeTrak 10: history and methodology. Semin Hear. 2020;41(01):3–5. doi: 10.1055/s-0040-1701241. [DOI] [PMC free article] [PubMed] [Google Scholar]
- 44.Edwards B. Emerging technologies, market segments, and MarkeTrak 10 insights in hearing health technology. Semin Hear. 2020;41(01):38–55. doi: 10.1055/s-0040-1701244. [DOI] [PMC free article] [PubMed] [Google Scholar]
- 45.Kochkin S. MarkeTrak VIII mini-BTEs tap new market, users more satisfied. The Hearing Journal. 2011;64:17–18. [Google Scholar]
- 46.Jorgensen L, Novak M. Factors influencing hearing aid adoption. Semin Hear. 2020;41(01):6–20. doi: 10.1055/s-0040-1701242. [DOI] [PMC free article] [PubMed] [Google Scholar]
- 47.Mahar J H, Rosencrance J G, Rasmussen P A. Telemedicine: past, present, and future. Cleve Clin J Med. 2018;85(12):938–942. doi: 10.3949/ccjm.85a.17062. [DOI] [PubMed] [Google Scholar]
- 48.Abrams H, Kihm J. An introduction to MarkeTrak IX: a new baseline for the hearing aid market. Hearing Rev. 2015;22(06):16. [Google Scholar]
- 49.Swanepoel W, Clark J L, Koekemoer D et al. Telehealth in audiology: the need and potential to reach underserved communities. Int J Audiol. 2010;49(03):195–202. doi: 10.3109/14992020903470783. [DOI] [PubMed] [Google Scholar]
- 50.Desjardins J L, Doherty K A. Do experienced hearing aid users know how to use their hearing aids correctly? Am J Audiol. 2009;18(01):69–76. doi: 10.1044/1059-0889(2009/08-0022). [DOI] [PubMed] [Google Scholar]
- 51.Joseph J, Svider P F, Shaigany K et al. Hearing aid patient education materials: is there room for improvement? J Am Acad Audiol. 2016;27(04):354–359. doi: 10.3766/jaaa.15066. [DOI] [PubMed] [Google Scholar]
- 52.Sciacca A, Meyer C, Ekberg K, Barr C, Hickson L. Exploring audiologists' language and hearing aid uptake in initial rehabilitation appointments. Am J Audiol. 2017;26(02):110–118. doi: 10.1044/2017_AJA-16-0061. [DOI] [PubMed] [Google Scholar]
- 53.Caposecco A, Hickson L, Meyer C, Khan A. Evaluation of a modified user guide for hearing aid management. Ear Hear. 2016;37(01):27–37. doi: 10.1097/AUD.0000000000000221. [DOI] [PubMed] [Google Scholar]