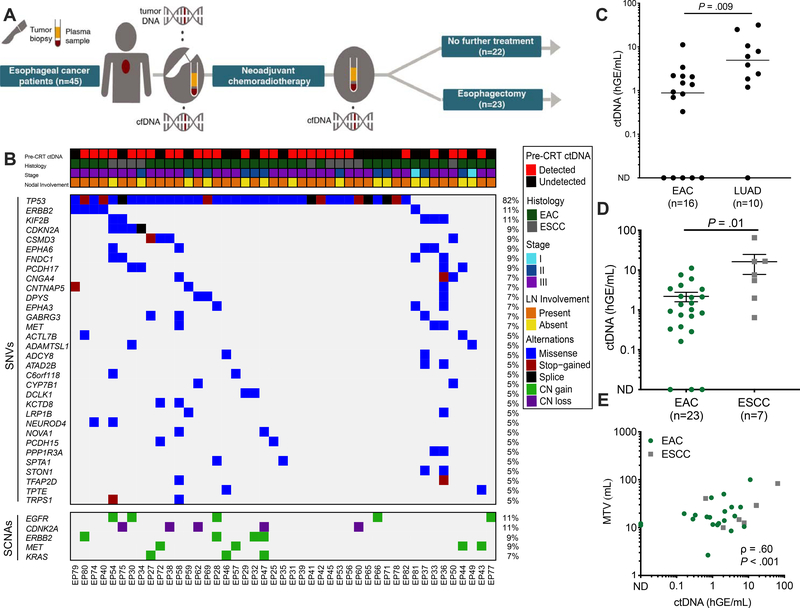
Figure 1. Pre-CRT assessment of ctDNA in patients with locally advanced ESCA.
(A) Study overview of forty-five patients with EGD-proven locally advanced ESCA enrolled in the study. Plasma samples were collected before and after chemoradiotherapy (CRT). Following CRT, patients either underwent esophagectomy (n=23) or no further treatment (n=22). (B) Clinical characteristics and tumor genotyping results. Pre-CRT ctDNA detection status and clinical characteristics, where each column is a patient and each row is a parameter (e.g. histology). Similarly, the associated co-mutation plot depicts patient-level mutational profiles of 45 tumors from patients with esophageal cancer genotyped by our ESCA-specific NGS panel. Genes mutated in at least 5% of the patients in our cohort are depicted. The fraction of tumors with mutations in each gene is denoted on the left. (C) Comparison of absolute ctDNA concentration between Stage III esophageal adenocarcinoma (EAC, n=16) and Stage III lung adenocarcinoma (LUAD, n=10). P value calculated by the Mann-Whitney test. (D) Pre-treatment ctDNA concentration in esophageal adenocarcinoma (EAC, n= 23) and esophageal squamous cell carcinoma (ESCC, n=7) patients. Patients were included if tumor-informed mutations were detected either pre- or post-CRT. Data represent mean + SEM. P value was calculated by the Mann-Whitney test. (E) Correlation of ctDNA concentration (haploid genome equivalents per mL, hGE/mL) with pre-CRT metabolic tumor volume (MTV) measured by PET-CT, stratified by histology. P value and ρ were calculated by Pearson correlation.

