Abstract
Objective
To use diffusion basis spectrum imaging (DBSI) to assess how damage to normal-appearing white matter (NAWM) in the corpus callosum (CC) influences neurologic impairment in people with MS (pwMS).
Methods
Using standard MRI, the primary pathologies in MS of axonal injury/loss, demyelination, and inflammation are not differentiated well. DBSI has been shown in animal models, phantoms, and in biopsied and autopsied human CNS tissues to distinguish these pathologies. Fifty-five pwMS (22 relapsing-remitting, 17 primary progressive, and 16 secondary progressive) and 13 healthy subjects underwent DBSI analyses of NAWM of the CC, the main WM tract connecting the cerebral hemispheres. Tract-based spatial statistics were used to minimize misalignment. Results were correlated with scores from a battery of clinical tests focused on deficits typical of MS.
Results
Normal-appearing CC in pwMS showed reduced fiber fraction and increased nonrestricted isotropic fraction, with the most extensive abnormalities in secondary progressive MS (SPMS). Reduced DBSI-derived fiber fraction and increased DBSI-derived nonrestricted isotropic fraction of the CC correlated with worse cognitive scores in pwMS. Increased nonrestricted isotropic fraction in the body of the CC correlated with impaired hand function in the SPMS cohort.
Conclusions
DBSI fiber fraction and nonrestricted isotropic fraction were the most useful markers of injury in the NAWM CC. These 2 DBSI measures reflect axon loss in animal models. Because of its ability to reveal axonal loss, as well as demyelination, DBSI may be a useful outcome measure for trials of CNS reparative treatments.
MS is a common inflammatory CNS disorder, affecting over 600,000 people in the United States.1 Irreversible axonal injury and loss are believed to be the main causes of permanent neurologic impairments in MS. Yet, standard MRI does not measure axonal loss.2 To address the need for a noninvasive method to detect and discriminate axonal loss from other pathologies, such as inflammation and demyelination, we developed diffusion basis spectrum imaging (DBSI) to accurately detect and distinguish components of white matter (WM) pathologies in MS.3 Using preclinical models, we previously showed that DBSI quantitatively assessed apparent axonal density (anisotropic diffusion tensor fraction), apparent cellularity (restricted isotropic diffusion tensor fraction), and edema and tissue loss (nonrestricted isotropic diffusion tensor fraction).3–5
We hypothesized that DBSI metrics reflecting axon damage in normal-appearing WM (NAWM) would correlate with neurologic impairment in people with MS (pwMS). The corpus callosum (CC) is a major WM structure connecting the 2 cerebral hemispheres that is frequently affected by MS pathology.6 We used DBSI and tract-based spatial statistics (TBSS), a widely used approach to avoid registration errors,7 to assess NAWM of the CC in pwMS and healthy controls (HCs). We compared DBSI analysis on a TBSS WM skeleton between cohorts representing the 3 main clinical subtypes of MS.8 DBSI findings at the voxel level and region of interest level were examined for correlations with results of standardized tests of cognition and physical function.
Methods
Human subjects
Procedures were approved by the Institutional Review Board of Washington University. Each participant provided written informed consent. Thirteen HC subjects and 55 pwMS with clinical subtypes confirmed by 2 investigators, including 22 with relapsing-remitting MS (RRMS), 16 with secondary progressive MS (SPMS), and 17 with primary progressive MS (PPMS), were enrolled between 2014 and 2017. Knowing that the subjects with SPMS and PPMS would be older, we purposefully recruited older subjects with RRMS so that the MS clinical subtype cohorts would be of similar ages to reduce the confounding effect of age on MRI findings.
Clinical evaluation
All subjects, including HCs, completed a battery of clinical tests within 5 days of imaging, administered by trained examiners who were blinded to DBSI findings. Tests included the Expanded Disability Status Scale (EDSS), a global composite of neurologic function with particular emphasis on gait and considered as a “gold standard” in MS, and the Multiple Sclerosis Functional Composite (MSFC, comprising 9-Hole Peg Test [of upper extremity function], Timed 25-Foot Walk [test of gait and leg function], and 3- and 2-second Paced Auditory Serial Addition Test [PASAT2, PASAT3, test of attention, working memory, and auditory processing speed]). Because more than 50% of pwMS are impaired in the cognitive domains of processing speed, and learning and memory,9 additional tests of cognition were performed: the Symbol Digit Modalities Test (to assess attention and visuospatial processing speed) and the Brief Visuospatial Memory Test-Revised, total and delayed recall (to assess visuospatial memory and processing speed), and Selective Reminding Test total and delayed recall (to assess verbal memory, new learning, and recall). Published normative results were used to calculate z-scores.9
MRI acquisition
Subjects underwent MRI at 3.0T (Trio; Siemens, Erlangen, Germany) using a 32-channel head coil. T1 weighted magnetization-prepared rapid gradient-echo (MPRAGE) scan with an isotropic 1 mm3 resolution was used for identification of structural landmarks and for coregistration (repetition time [TR] = 2,400 ms, echo time [TE] = 3.16 ms, inversion time [TI] = 1,000 ms, matrix = 256 × 224, field of view [FOV] = 256 × 224 mm2, resolution = 1 × 1 × 1 mm3). A fluid-attenuated inversion recovery (FLAIR) scan was acquired to quantify visible WM lesions (TR = 7,500 ms, TI = 2,500 ms, TE = 210 ms, TI = 2,500 ms, matrix = 256 × 256, FOV = 256 × 256 mm2, resolution = 1 × 1 × 1 mm3). Diffusion-weighted images (DWIs) were collected with a 99-direction multi-b-value diffusion encoding scheme by single-shot spin-echo echo-planar imaging sequence with the following key parameters: voxel size = 2 × 2 × 2 mm3; maximum b value = 1,500 seconds/mm2; acquisition time = 16 minutes. Two transverse non–diffusion-weighted images (b = 0 s/mm2) with opposite polarity of the phase encoding direction (AP and PA) were acquired for image processing.
Image processing and lesion mapping
DWIs were preprocessed to minimize motion and susceptibility artifact due to nonzero off-resonance fields. The FSL-based “TOPUP” tool, which estimates the susceptibility-induced off-resonance field from pairs of images, with reversed phase-encode blips and distortions going in opposite directions,10 and the Functional MRI of the Brain Software Library (FSL)-based “EDDY” tool, which corrects image distortions by combining the correction for susceptibility and eddy currents/movements, were used. Both B0 and FLAIR images were aligned to MPRAGE using an affine registration. WM lesions were manually traced on FLAIR. Subsequently, each lesion mask was nonlinearly transformed onto a common WM skeleton and lesions removed to reveal NAWM before statistical analysis.
DBSI
DBSI metric maps were estimated on the preprocessed DW images using the in-house software developed using MATLAB. DBSI models diffusion-weighted MRI signals as a linear combination of multiple tensors describing both the discrete anisotropic axonal fibers and an isotropic diffusion spectrum encompassing the full range of diffusivities,3 equation 1.
 |
where Sk and  are the normalized signal and b value of the kth diffusion gradient, NAniso is the number of anisotropic tensors,
  is the angle between the kth diffusion gradient and the principal direction of the ith anisotropic tensor,
  and
and  are the axial diffusivity (AD) and radial diffusivity (RD) of the ith anisotropic tensor, fi is the signal intensity fraction for the ith anisotropic tensor, and a and b are the low and high diffusivity limits for the isotropic diffusion spectrum f(D). The anisotropic diffusion component describes water molecules inside and immediately outside myelinated or nonmyelinated axons. DBSI-derived anisotropic signal intensity fractions (fi, i.e., fiber fraction) can also be defined as apparent axonal density in WM. DBSI-derived AD and RD retain the pathologic specificity for axonal injury and demyelination as previously proposed but with fewer confounds from coexisting MS pathologies using DBSI.
Cellular and axonal packing plays a crucial role in extracellular and extra-axonal diffusion characteristics. Less restricted or nonrestricted isotropic diffusion components represent water molecules in less densely packed environments, such as areas of tissue disintegration or edema or nonrestricted water within CSF.3,11,12 The DBSI-derived “restricted” isotropic diffusion fraction (ADC ≤0.3 μm2/ms) has been shown to reflect cellularity.3
Quantification of dMRI metrics on WM skeleton
Whole-brain WM, voxel-wise statistical analysis of the images was performed in blinded fashion on a common WM skeleton created using TBSS with the following steps.7 First, fractional anisotropy (FA) maps were computed for each subject. Next, all FA maps from all subjects were aligned to standard-space image (JHU-ICBM-FA-1 mm in Montreal Neurological Institute 152 space) using the FSL nonlinear image registration tool FNIRT.13 The aligned FA maps were then averaged to produce a group mean image, thus generating an FA skeleton to highlight the tracts common to the entire group. For each subject, an FA threshold of 0.2 was used before projecting the aligned FA map onto this skeleton. For subjects with MS, lesions were manually demarcated on anatomical MRI and then excluded before any statistical analysis. Resulting skeletonized FA maps became the WM skeletons for subsequent analyses comparing subtypes. All DBSI metrics were projected onto this WM skeleton for voxel-based and for region-based statistical analyses.
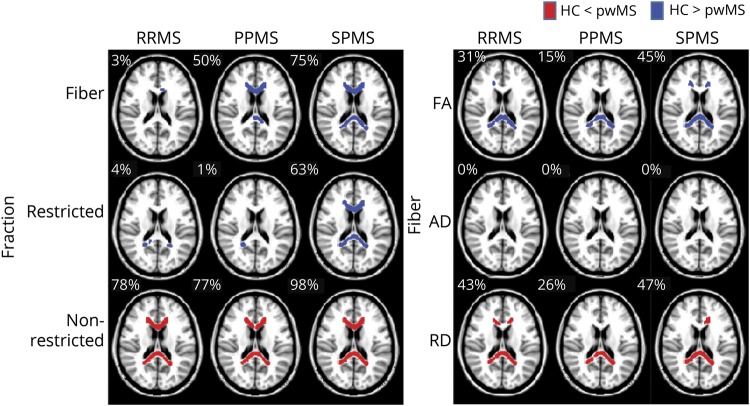
The proportions of the CC that were significantly different from the HC group were calculated by equation 2 and indicated in figure 1.
 |
Figure 1. TBSS-based DBSI of normal-appearing corpus callosum revealed widespread abnormalities in fiber fraction, nonrestricted fraction, fractional anisotropy, and radial diffusivity compared with healthy controls.
DBSI metrics in the three clinical subgroups of RRMS, PPMS, and SPMS were compared with healthy controls (HCs). Regions in red or blue represent regions with a significant increase or decrease in that diffusion metric in pwMS compared with HC, respectively. The proportion of the CC volumes that were significantly different from the HC group is indicated at the upper left corner of each map. In the figures, the TBSS skeleton was thickened for better visibility. CC = corpus callosum; DBSI = diffusion basis spectrum imaging; PPMS = primary progressive MS; pwMS = people with MS; RRMS = relapsing-remitting MS; SPMS = secondary progressive MS; TBSI = tract-based spatial statistics.
Statistical analysis
Two types of analyses, voxel-level and region-level analyses, were performed on the WM skeleton of the CC.
Voxel-based group comparison
Nonparametric permutation tests were used for voxel-wise statistical analysis of the skeletons between HC and pwMS.7 The threshold-free cluster enhancement (TFCE) method was applied to the statistical maps to enhance cluster-like structures within the images and produce output images in which the voxel-wise values represent the amount of cluster-like local spatial support.14 This combination of permutation testing and TFCE produced a “smooth” (i.e., continuous) map of corrected p values, 1 per voxel, that took into account spatial dependency in the data. The significance level was set at p ≤ 0.05 after family-wise error correction for multiple comparisons. The statistical analyses were performed using the FSL tool RANDOMIZE.15
Region-based analyses
Median values of diffusion metrics within each region, including the whole CC and its subregions, were compared among patient subtypes. Subregions of the CC (splenium, body, and genu) were based on the WM parcellations defined in ICBM-DTI-81 WM labels.16 Kruskal-Wallis one-way nonparametric analysis of variance was used to test for any differences between MS subtypes. A post hoc nonparametric test using the Fisher least significant difference method with Holm-Bonferroni correction indicated the existence of significant differences between subtypes. The statistical analyses were performed using software R.
Correlations of median regional DBSI values with clinical test scores and subtypes were assessed using Spearman rank correlation analysis. The significance level was set at p ≤ 0.05 after Benjamini-Hochberg correction for multiple comparisons. Individual participants were considered as independent. HCs were excluded from analyses of dMRI correlations with clinical tests. The statistical analyses were performed using software R.
Data availability
Anonymized data will be shared upon reasonable request.
Results
Clinical characteristics
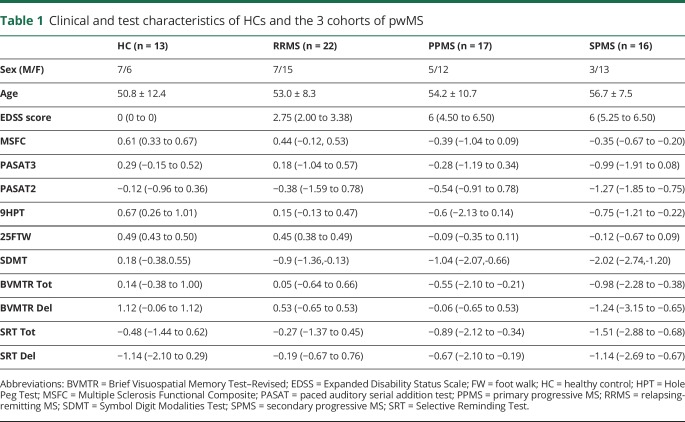
The HC (n = 13), RRMS (n = 22), PPMS (n = 17), and SPMS (n = 16) subjects were similar in age (table 1). As expected, the RRMS cohort performed better on neurologic tests than subjects with PPMS, who performed better than subjects with SPMS on motor and cognitive tests (table 1).17,18
Table 1.
Clinical and test characteristics of HCs and the 3 cohorts of pwMS
Voxel-based assessments of NAWM in CC using DBSI metrics
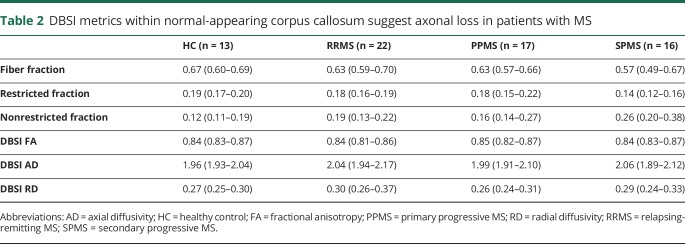
DBSI-derived fiber fraction (indicator of apparent axonal density) was lower in a significantly larger percentage of voxels in the normal-appearing CC among all clinical MS subtypes, relative to HC, with variable spatial distributions. Overall, the median fiber fraction of the CC in HC subjects was 0.67 (table 2). RRMS and PPMS each had a slightly lower median overall fiber fraction (0.63 and 0.63, respectively) compared with HC (table 2). Subjects with SPMS had the lowest median fiber fraction of 0.57 (table 2). In addition, the spatial extent of reduced DBSI fiber fraction in the normal-appearing CC varied, with 75% of the normal-appearing CC being reduced in the SPMS cohort, 50% in the PPMS cohort, and 3% in the RRMS cohort (figure 1).
Table 2.
DBSI metrics within normal-appearing corpus callosum suggest axonal loss in patients with MS
DBSI-derived nonrestricted isotropic fraction (indicator of tissue loss or edema) was significantly higher in the vast majority of voxels in the normal-appearing CC of all 3 clinical subtype cohorts compared with HC (78%, 77%, and 98% for RRMS, PPMS, and SPMS subtypes, respectively, figure 1). Compared with HC, DBSI-derived restricted fraction (indicator of apparent cellularity) was lower in a significantly larger percentage of voxels of the normal-appearing CC in SPMS but not in RRMS or PPMS.
DBSI-derived FA (of residual fiber tracts) was reduced compared with HC in the normal-appearing CC, with this reduction encompassing variable proportions of the CC depending on the MS subtype (31%, 15%, and 45% in RRMS, PPMS, and SPMS, respectively). The spatial extent of voxels with reductions in FA were consistent with increased DBSI-derived RD covered 43%, 26%, and 47% of the normal-appearing CC in RRMS, PPMS, and SPMS, respectively (figure 1). No statistically significant changes in DBSI-AD were observed in the normal-appearing CC in any of the MS subtypes (table 2).
Region-based DBSI metrics of the whole CC
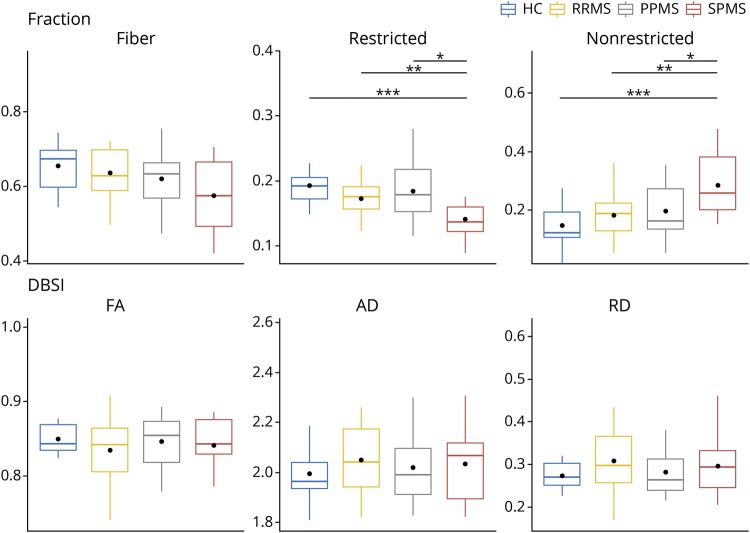
The DBSI-derived metrics from the whole CC were extracted. The median values for the CC were compared among the MS clinical subgroups and to the values of HC (figure 2). Consistent with voxel-based analyses, the SPMS group was notable for having the most reduced fiber fraction and the most increased nonrestricted isotropic fraction of the MS subgroups.
Figure 2. Comparisons of DBSI parameters within normal-appearing CC among HC and MS clinical subtypes.
The horizontal line within each box indicates the median, the dot indicates mean, and the box encompasses the IQR between Q1 (25th percentile) and Q3 (75th percentile). Whiskers of the boxes are defined as Q1 − 1.5 × IQR or Q3 + 1.5 × IQR. Group comparisons performed using Kruskal-Wallis one-way nonparametric ANOVA and post hoc nonparametric tests were compared using the Fisher least significant difference (LSD) method. p values were adjusted using Holm-Bonferroni correction for multiple comparisons. *p < 0.05, **p < 0.01, ***p < 0.001. ANOVA = analysis of variance; CC = corpus callosum; DBSI = diffusion basis spectrum imaging; HC = healthy control.
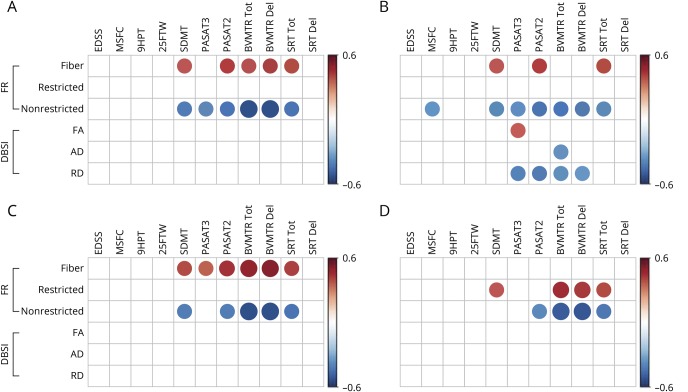
DBSI metrics of the normal-appearing CC correlate with cognitive and motor test scores in MS
Reduced DBSI fiber fraction correlated with worse cognitive test scores (figure 3). DBSI-derived nonrestricted isotropic fraction correlated negatively with cognitive test scores and with MSFC. Reduced isotropic restricted fraction had modest correlations with worse scores on some cognitive tests. DBSI-derived RD, AD, and FA showed minimal or no correlations with any clinical test results (figure 3). DBSI parameters from all subregions of the CC revealed correlations with cognitive test scores, but not with measures of physical function (figure 3, B–D). The only correlation between EDSS and any of the DBSI metrics was with the nonrestricted isotropic fraction and only in the SPMS group (r = −0.7, p < 0.01, data not shown).
Figure 3. Graphic illustration of correlation coefficients of clinical test scores with DBSI metrics from the normal-appearing CC.
Graphic illustration of the correlations in MS subjects of clinical test scores (columns) with individual DBSI metrics from the normal-appearing CC (rows) for the (A) entire CC, (B) genu, (C) body, and (D) splenium. Red circles have a positive correlation, and blue circles have a negative correlation with test scores, with the size of the circle reflecting the magnitude of the correlation. Data are only shown when the corresponding significant level is p < 0.05, after Benjamini-Hochberg correction for multiple comparisons. CC = corpus callosum; DBSI = diffusion basis spectrum imaging; Fr = fraction.
Discussion
MRI studies have historically been very useful for the noninvasive diagnosis of MS and to better understand the changes over time in this chronic disease. MRI has been increasingly used to assess the relationship between the distribution and extent of pathology in the MS CNS and neurologic impairment. However, correlations of T2-weighted brain MRI abnormalities with neurologic impairment in MS are weak.19 At least part of this lack of correlation is due to the nonspecific nature of abnormalities seen on standard MRI modalities.19 This is especially true in progressive MS, where CNS inflammation becomes dissociated from BBB damage such that gadolinium enhancement is far less useful to detect it.20,21
In this study, the main goal was to use DBSI, which is pathologically more specific than standard MRI, to help understand how damage to NAWM in the CC influences neurologic disability in MS. Subjects of each of the 3 main clinical subtypes were recruited to be of similar ages so that age-related pathologic findings would not be a confounding factor. Patients with SPMS have more damage and less remyelination and a greater brain lesion load compared with patients with PPMS.22 People with RRMS are considered to have the least axon loss, although neuropathologic confirmation of this is sparse.23 The motor and cognitive test results on our 3 patient cohorts reflected the expected hierarchy, with subjects with SPMS performing worst, subjects with RRMS performing best, and subjects with PPMS scoring in between on the tests. We had hypothesized that axon damage in NAWM, as detected by DBSI, would correlate with worse scores on clinical tests of functions most often impaired in pwMS. We found that reduced fiber fraction and increased nonrestricted isotropic fraction correlated with cognitive dysfunction and, to a far lesser extent, motor impairment. As the fiber fraction reflects the apparent axonal density, and the nonrestricted isotropic fraction is increased in regions of axon fiber loss, the DBSI results supported our hypothesis. The results indicated abnormalities in the NAWM of the CC in pwMS suggesting loss of axons and also reflected the expected hierarchy of severity among MS subtypes.
As MS treatments become greater in number and as the field moves toward reparative therapies, it is increasingly important to elucidate the presence of preserved but demyelinated axons to identify those pwMS who can best respond to potential remyelinating therapies. Increased DBSI RD, reflecting demyelination of surviving axons, suggested that 26–47% of NAWM of the CC in our MS cohort was demyelinated. Enrollment of subjects with much demyelination and relative axon sparing, as could be shown by DBSI metrics, would enhance the ability to detect efficacy in future trials of putative remyelinating agents. Identification of those who would benefit most from remyelination treatments might be further improved by application of DBSI to other major WM tracts beyond the CC, such as the internal capsules, cerebral peduncles, and centrum semiovale regions, which we plan to do in future studies.
DTI has been used previously to investigate pathologic changes in the NAWM.24,25 However, DTI findings are confounded by coexisting pathologies, making it pathologically less specific than DBSI.12 DTI works better when studying strongly coherent WM tracts, such as mouse models of MS and human optic neuritis. Studying these tracts, reduced AD determined by DTI was associated with pathologically verified axon injury in mice and worse outcomes in humans.26,27
In the present study, we focused on the normal-appearing CC. We assessed not only the degree of alteration of each DBSI metric but also the volume of abnormal tissue within the nonlesioned CC. The volume of abnormal tissue (compared with a healthy cohort) within the normal-appearing CC reached 77%–98% for nonrestricted isotropic fraction in all 3 clinical subtypes. These results likely reflect the well-known finding that in pwMS, NAWM is often not normal.30 Notably, reduced axon density in the normal-appearing CC has been shown by several groups using MR spectroscopy in living people with RRMS and progressive MS.28 In the present studies, decreased DBSI fiber fraction (putative marker of apparent axonal density, figure 1) was seen most extensively in SPMS, followed by PPMS then RRMS, consistent with the accepted hierarchy of severity of axon loss among MS subtypes.29
Axonal loss is believed to be a critical mechanism of irreversible neurologic disability.30–32 Thus, it was not surprising that fiber fraction, as a surrogate of axon density, correlated with disability in pwMS (table 1, median of EDSS: RRMS 2.75, PPMS 6, and SPMS 6).
Cognitive impairment affects 40%–70% of pwMS and has substantial negative consequences.33–35 Although motor deficits are the principal measures for disease severity scales,36 cognitive impairment is the strongest predictor of work reduction or leaving the workforce.37 Previous studies using DTI also revealed WM tract injury to be strongly associated with cognitive dysfunction in patients with MS.24,38,39 Focal abnormalities, particularly in the CC, have been related to impaired calculation, sequence learning, and memory.24,40–44 It was not unsurprising that abnormal fiber fraction and nonrestricted isotropic fraction correlated best with impaired cognitive performance in our studies, as they are thought to reflect axonal loss and loss of tissue integrity, respectively.
Previous attempts to correlate DTI metrics with the EDSS yielded conflicting results, with some studies finding significant correlation45–47 and others not.48 We only observed a correlation between the DBSI and EDSS for the nonrestricted isotropic fraction and only in the SPMS group. We surmise that the inability to find correlations with the EDSS is due to the dependency of the EDSS on ambulation, and we expect to see much greater correlations with the EDSS when in the future we extend DBSI to the spinal cord.
Limitations to our study include that the number of pwMS enrolled was only 55. The subjects who were enrolled had well-defined clinical subtypes and were of similar mean ages. However, our RRMS cohort was older than a typical RRMS cohort, perhaps resulting in a “benign” group of subjects with RRMS in this study. Another limitation relates to the TBSS methodology. TBSS assumes that the effect of interest occurs in voxels where the local FA is highest and thus may lose sensitivity in detecting pathologic changes in areas of low FA.49
In summary, we used DBSI to assess NAWM integrity within the CC in RRMS, SPMS, and PPMS cohorts. The DBSI metric that best indicates axonal loss (fiber fraction) reflected the expected hierarchy of axonal loss among clinical subtypes. Fiber fraction also correlated with cognitive test results. DBSI might be useful for quantitatively monitoring the CNS of individual pwMS, as an outcome measure in clinical trials and as an aid in recruiting appropriate subjects for future trials of potential neuroreparative MS therapies.
Acknowledgment
The authors appreciate the contributions to subject clinical examinations by Drs. Erin Longbrake, Afsaneh Shirani, Emily Evans, and Gregory Wu, and Megan Orchard, PA.
Glossary
- AD
axial diffusivity
- BBB
blood-brain barrier
- BVMT-R
Brief Visuospatial Memory Test–Revised
- CC
corpus callosum
- DBSI
diffusion basis spectrum imaging
- dMRI
diffusion MRI
- DTI
diffusion tensor imaging
- DWI
diffusion-weighted image
- EDSS
Expanded Disability Status Scale
- FA
fractional anisotropy
- FLAIR
fluid-attenuated inversion recovery
- Fr
fraction
- FSL
Functional MRI of the Brain Software Library
- FTW
foot walk
- HC
healthy control
- HPT
Hole Peg Test
- IQR
interquartile range
- MPRAGE
magnetization-prepared rapid gradient-echo sequence
- MSFC
MS Functional Composite
- NAWM
normal-appearing white matter
- PPMS
primary progressive MS
- pwMS
people with MS
- RD
radial diffusivity
- RRMS
relapsing-remitting MS
- SDMT
Symbol Digit Modalities Test
- SPMS
secondary progressive MS
- SRT
Selective Reminding Test
- TBSS
tract-based spatial statistics
- TFCE
threshold-free cluster enhancement
- WM
white matter
Appendix. Authors

Study funding
Supported by the NIH P01 NS059560.
Disclosure
P. Sun, D.C. Perantie, A. George, Z. Ye, and K. Trinkaus report no disclosures. R.T. Naismith consulted for Alkermes, Acorda, Bayer, Biogen, EMD Serono, Genentech, Genzyme, Mallinckrodt, Novartis, Pfizer, Teva, and TG Therapeutics. S.-K. Song reports no disclosures. A.H. Cross consulted for Biogen, Celgene, EMD Serono, Genentech/Roche, Novartis, and TG Therapeutics. Go to Neurology.org/NN for full disclosures.
References
- 1.Wallin MT, Culpepper WJ, Campbell JD, et al. . The prevalence of MS in the United States: a population-based estimate using health claims data. Neurology 2019;92:e1029–e1040. [DOI] [PMC free article] [PubMed] [Google Scholar]
- 2.Paty DW, Li DK, Oger JJ, et al. . Magnetic resonance imaging in the evaluation of clinical trials in multiple sclerosis. Ann Neurol 1994(36 suppl):S95–S96. [DOI] [PubMed] [Google Scholar]
- 3.Wang Y, Wang Q, Haldar JP, et al. . Quantification of increased cellularity during inflammatory demyelination. Brain 2011;134:3590–3601. [DOI] [PMC free article] [PubMed] [Google Scholar]
- 4.Wang Y, Sun P, Wang Q, et al. . Differentiation and quantification of inflammation, demyelination and axon injury or loss in multiple sclerosis. Brain 2015;138:1223–1238. [DOI] [PMC free article] [PubMed] [Google Scholar]
- 5.Lin TH, Chiang CW, Perez-Torres CJ, et al. . Diffusion MRI quantifies early axonal loss in the presence of nerve swelling. J Neuroinflammation 2017;14:78. [DOI] [PMC free article] [PubMed] [Google Scholar]
- 6.Evangelou N, Konz D, Esiri MM, Smith S, Palace J, Matthews PM. Regional axonal loss in the corpus callosum correlates with cerebral white matter lesion volume and distribution in multiple sclerosis. Brain 2000;123:1845–1849. [DOI] [PubMed] [Google Scholar]
- 7.Smith SM, Jenkinson M, Johansen-Berg H, et al. . Tract-based spatial statistics: voxelwise analysis of multi-subject diffusion data. Neuroimage 2006;31:1487–1505. [DOI] [PubMed] [Google Scholar]
- 8.Lublin FD, Reingold SC, Cohen JA, et al. . Defining the clinical course of multiple sclerosis: the 2013 revisions. Neurology 2014;83:278–286. [DOI] [PMC free article] [PubMed] [Google Scholar]
- 9.Strober L, Englert J, Munschauer F, Weinstock-Guttman B, Rao S, Benedict RH. Sensitivity of conventional memory tests in multiple sclerosis: comparing the Rao brief repeatable neuropsychological battery and the minimal assessment of cognitive function in MS. Mult Scler 2009;15:1077–1084. [DOI] [PubMed] [Google Scholar]
- 10.Smith SM, Jenkinson M, Woolrich MW, et al. . Advances in functional and structural MR image analysis and implementation as FSL. Neuroimage 2004;23(suppl 1):S208–S219. [DOI] [PubMed] [Google Scholar]
- 11.Wang X, Cusick MF, Wang Y, et al. . Diffusion basis spectrum imaging detects and distinguishes coexisting subclinical inflammation, demyelination, and axonal injury in experimental autoimmune encephalomyelitis mice. NMR Biomed 2014;27:843–852. [DOI] [PMC free article] [PubMed] [Google Scholar]
- 12.Chiang CW, Wang Y, Sun P, et al. . Quantifying white matter tract diffusion parameters in the presence of increased extra-fiber cellularity and vasogenic edema. Neuroimage 2014;101:310–319. [DOI] [PMC free article] [PubMed] [Google Scholar]
- 13.Andersson JLR, Jenkinson M, Smith S. Non-linear registration aka spatial normalisation. FMRIB Technical Report TR07JA2. Oxford: FMRIB Centre; 2007. [Google Scholar]
- 14.Smith SM, Nichols TE. Threshold-free cluster enhancement: addressing problems of smoothing, threshold dependence and localisation in cluster inference. Neuroimage 2009;44:83–98. [DOI] [PubMed] [Google Scholar]
- 15.Winkler AM, Ridgway GR, Webster MA, Smith SM, Nichols TE. Permutation inference for the general linear model. Neuroimage 2014;92:381–397. [DOI] [PMC free article] [PubMed] [Google Scholar]
- 16.Mori S, Wakana S, Van Zijl PCM. MRI Atlas of Human White Matter. 1st ed The Netherlands: Elsevier; 2005:239. [Google Scholar]
- 17.Huijbregts SC, Kalkers NF, de Sonneville LM, de Groot V, Polman CH. Cognitive impairment and decline in different MS subtypes. J Neurol Sci 2006;245:187–194. [DOI] [PubMed] [Google Scholar]
- 18.Confavreux C, Vukusic S. The clinical course of multiple sclerosis. Handb Clin Neurol 2014;122:343–369. [DOI] [PubMed] [Google Scholar]
- 19.Barkhof F. MRI in multiple sclerosis: correlation with expanded disability status scale (EDSS). Mult Scler 1999;5:283–286. [DOI] [PubMed] [Google Scholar]
- 20.Lassmann H, van Horssen J, Mahad D. Progressive multiple sclerosis: pathology and pathogenesis. Nat Rev Neurol 2012;8:647–656. [DOI] [PubMed] [Google Scholar]
- 21.Kwon EE, Prineas JW. Blood-brain barrier abnormalities in longstanding multiple sclerosis lesions. An immunohistochemical study. J Neuropathol Exp Neurol 1994;53:625–636. [DOI] [PubMed] [Google Scholar]
- 22.Revesz T, Kidd D, Thompson AJ, Barnard RO, McDonald WI. A comparison of the pathology of primary and secondary progressive multiple sclerosis. Brain 1994;117:759–765. [DOI] [PubMed] [Google Scholar]
- 23.De Stefano N, Matthews PM, Fu L, et al. . Axonal damage correlates with disability in patients with relapsing-remitting multiple sclerosis. Results of a longitudinal magnetic resonance spectroscopy study. Brain 1998;121:1469–1477. [DOI] [PubMed] [Google Scholar]
- 24.Yu HJ, Christodoulou C, Bhise V, et al. . Multiple white matter tract abnormalities underlie cognitive impairment in RRMS. Neuroimage 2012;59:3713–3722. [DOI] [PubMed] [Google Scholar]
- 25.Kern KC, Sarcona J, Montag M, Giesser BS, Sicotte NL. Corpus callosal diffusivity predicts motor impairment in relapsing-remitting multiple sclerosis: a TBSS and tractography study. Neuroimage 2011;55:1169–1177. [DOI] [PubMed] [Google Scholar]
- 26.Budde MD, Xie M, Cross AH, Song SK. Axial diffusivity is the primary correlate of axonal injury in the experimental autoimmune encephalomyelitis spinal cord: a quantitative pixelwise analysis. J Neurosci 2009;29:2805–2813. [DOI] [PMC free article] [PubMed] [Google Scholar]
- 27.Naismith RT, Xu J, Tutlam NT, et al. . Diffusion tensor imaging in acute optic neuropathies: predictor of clinical outcomes. Arch Neurol 2012;69:65–71. [DOI] [PMC free article] [PubMed] [Google Scholar]
- 28.Oh J, Pelletier D, Nelson SJ. Corpus callosum axonal injury in multiple sclerosis measured by proton magnetic resonance spectroscopic imaging. Arch Neurol 2004;61:1081–1086. [DOI] [PubMed] [Google Scholar]
- 29.Evangelou N, Esiri MM, Smith S, Palace J, Matthews PM. Quantitative pathological evidence for axonal loss in normal appearing white matter in multiple sclerosis. Ann Neurol 2000;47:391–395. [PubMed] [Google Scholar]
- 30.Kornek B, Storch MK, Weissert R, et al. . Multiple sclerosis and chronic autoimmune encephalomyelitis: a comparative quantitative study of axonal injury in active, inactive, and remyelinated lesions. Am J Pathol 2000;157:267–276. [DOI] [PMC free article] [PubMed] [Google Scholar]
- 31.Medana IM, Esiri MM. Axonal damage: a key predictor of outcome in human CNS diseases. Brain 2003;126:515–530. [DOI] [PubMed] [Google Scholar]
- 32.Wujek JR, Bjartmar C, Richer E, et al. . Axon loss in the spinal cord determines permanent neurological disability in an animal model of multiple sclerosis. J Neuropathol Exp Neurol 2002;61:23–32. [DOI] [PubMed] [Google Scholar]
- 33.Rocca MA, Amato MP, De Stefano N, et al. . Clinical and imaging assessment of cognitive dysfunction in multiple sclerosis. Lancet Neurol 2015;14:302–317. [DOI] [PubMed] [Google Scholar]
- 34.Chiaravalloti ND, DeLuca J. Cognitive impairment in multiple sclerosis. Lancet Neurol 2008;7:1139–1151. [DOI] [PubMed] [Google Scholar]
- 35.Ruet A, Deloire M, Hamel D, Ouallet JC, Petry K, Brochet B. Cognitive impairment, health-related quality of life and vocational status at early stages of multiple sclerosis: a 7-year longitudinal study. J Neurol 2013;260:776–784. [DOI] [PubMed] [Google Scholar]
- 36.Kurtzke JF. Rating neurologic impairment in multiple sclerosis: an expanded disability status scale (EDSS). Neurology 1983;33:1444–1452. [DOI] [PubMed] [Google Scholar]
- 37.Morrow SA, Drake A, Zivadinov R, Munschauer F, Weinstock-Guttman B, Benedict RH. Predicting loss of employment over three years in multiple sclerosis: clinically meaningful cognitive decline. Clin Neuropsychol 2010;24:1131–1145. [DOI] [PubMed] [Google Scholar]
- 38.Vrenken H, Pouwels PJW, Geurts JJG, et al. . Altered diffusion tensor in multiple sclerosis normal-appearing brain tissue: cortical diffusion changes seem related to clinical deterioration. J Magn Reson Imaging 2006;23:628–636. [DOI] [PubMed] [Google Scholar]
- 39.Rovaris M, Iannucci G, Falautano M, et al. . Cognitive dysfunction in patients with mildly disabling relapsing-remitting multiple sclerosis: an exploratory study with diffusion tensor MR imaging. J Neurol Sci 2002;195:103–109. [DOI] [PubMed] [Google Scholar]
- 40.Llufriu S, Blanco Y, Martinez-Heras E, et al. . Influence of corpus callosum damage on cognition and physical disability in multiple sclerosis: a multimodal study. PLoS One 2012;7:e37167. [DOI] [PMC free article] [PubMed] [Google Scholar]
- 41.Audoin B, Guye M, Reuter F, et al. . Structure of WM bundles constituting the working memory system in early multiple sclerosis: a quantitative DTI tractography study. Neuroimage 2007;36:1324–1330. [DOI] [PubMed] [Google Scholar]
- 42.Roosendaal SD, Geurts JJG, Vrenken H, et al. . Regional DTI differences in multiple sclerosis patients. NeuroImage 2009;44:1397–1403. [DOI] [PubMed] [Google Scholar]
- 43.Lin X, Tench CR, Morgan PS, Constantinescu CS. Use of combined conventional and quantitative MRI to quantify pathology related to cognitive impairment in multiple sclerosis. J Neurol Neurosurg Psychiatry 2008;79:437–441. [DOI] [PubMed] [Google Scholar]
- 44.Mesaros S, Rocca MA, Riccitelli G, et al. . Corpus callosum damage and cognitive dysfunction in benign MS. Hum Brain Mapp 2009;30:2656–2666. [DOI] [PMC free article] [PubMed] [Google Scholar]
- 45.Liu Y, Duan Y, He Y, et al. . Whole brain white matter changes revealed by multiple diffusion metrics in multiple sclerosis: a TBSS study. Eur J Radiol 2012;81:2826–2832. [DOI] [PubMed] [Google Scholar]
- 46.Giorgio A, De Stefano N. Cognition in multiple sclerosis: relevance of lesions, brain atrophy and proton MR spectroscopy. Neurol Sci 2010;31:S245–S248. [DOI] [PubMed] [Google Scholar]
- 47.Ciccarelli O, Wheeler-Kingshott CA, McLean MA, et al. . Spinal cord spectroscopy and diffusion-based tractography to assess acute disability in multiple sclerosis. Brain 2007;130:2220–2231. [DOI] [PubMed] [Google Scholar]
- 48.Fink F, Klein J, Lanz M, et al. . Comparison of diffusion tensor-based tractography and quantified brain atrophy for analyzing demyelination and axonal loss in MS. J Neuroimaging 2010;20:334–344. [DOI] [PubMed] [Google Scholar]
- 49.Bach M, Laun FB, Leemans A, et al. . Methodological considerations on tract-based spatial statistics (TBSS). Neuroimage 2014;100:358–369. [DOI] [PubMed] [Google Scholar]
Associated Data
This section collects any data citations, data availability statements, or supplementary materials included in this article.
Data Availability Statement
Anonymized data will be shared upon reasonable request.


