Abstract
Background:
Gene expression profiles from early-onset breast cancer and normal tissues were analyzed to explore the genes and prognostic factors associated with breast cancer.
Methods:
GSE109169 and GSE89116 were obtained from the database of Gene Expression Omnibus. We firstly screened the differentially expressed genes between tumor samples and normal samples from patients with early-onset breast cancer. Based on database for annotation, visualization and intergrated discovery (DAVID) tool, functional analysis was calculated. Transcription factor-target regulation and microRNA-target gene network were constructed using the tool of transcriptional regulatory relatitionships unraveled by sentence-based text mining (TRRUST) and miRWalk2.0, respectively. The prognosis-related survival information was compiled based on The Cancer Genome Atlas breast cancer clinical data.
Results:
A total of 708 differentially expressed genes from GSE109169 data sets and 358 differentially expressed genes from GSE89116 data sets were obtained, of which 122 common differentially expressed genes including 102 uniformly downregulated genes and 20 uniformly upregulated genes were screened. Protein–protein interaction network with a total of 83 nodes and 157 relationship pairs was obtained, and genes in protein–protein interaction, such as peroxisome proliferator-activated receptor γ, FGF2, adiponectin, and PCK1, were recognized as key nodes in protein–protein interaction. In total, 66 transcription factor–target relationship pairs were obtained, and peroxisome proliferator-activated receptor γ was the only one downregulated transcription factor. MicroRNA-target gene network contained 368 microRNA-target relationship pairs. Moreover, 16 differentially expressed genes, including 2 upregulations and 14 downregulations, were related to a significant correlation with the prognosis, including SQLE and peroxisome proliferator-activated receptor γ.
Conclusions:
SQLE and peroxisome proliferator-activated receptor γ might be important prognostic factors in breast cancers, and adiponectin might be important in breast cancer pathogenesis regulated by peroxisome proliferator-activated receptor γ.
Keywords: early onset breast cancer, differentially expressed genes, prognostic factors
Introduction
In China, the incidence rate of breast cancers increased markedly in the past decades, and it has been reported that the rate would keep increasing in the next few years. Meanwhile, among older patients, the mortality of breast cancers showed significant upward trends.1 In the United States, younger than 40 years, about 6.6% of humans have been diagnosed with breast cancer.2,3 Those data imply that breast cancer will become a leading global public health problem as the increasing incidence rate of the disease in the next few decades.
With the development of bioinformatics technology, most researchers focused on exploring molecular biomarkers associated with the development of breast cancers.4-6 Potential genes associated with early-onset breast cancer development have been put forward, such as growth arrest specific 7 and breast cancer 1/2.7 Meanwhile, a lot of prognostic markers have also been put forward. For example, the 21-gene recurrence score has been used in clinical for prognosis of patients with breast cancer.8 Ellegård and his colleagues reported that copy numbers of ERBB2 and PTPN2 was one of significant prognostic factors in breast cancer after trastuzumab treatment.9 However, for early-onset breast cancer, the recent biomarkers were still limited, and the novel biomarkers identification was also urgently needed.
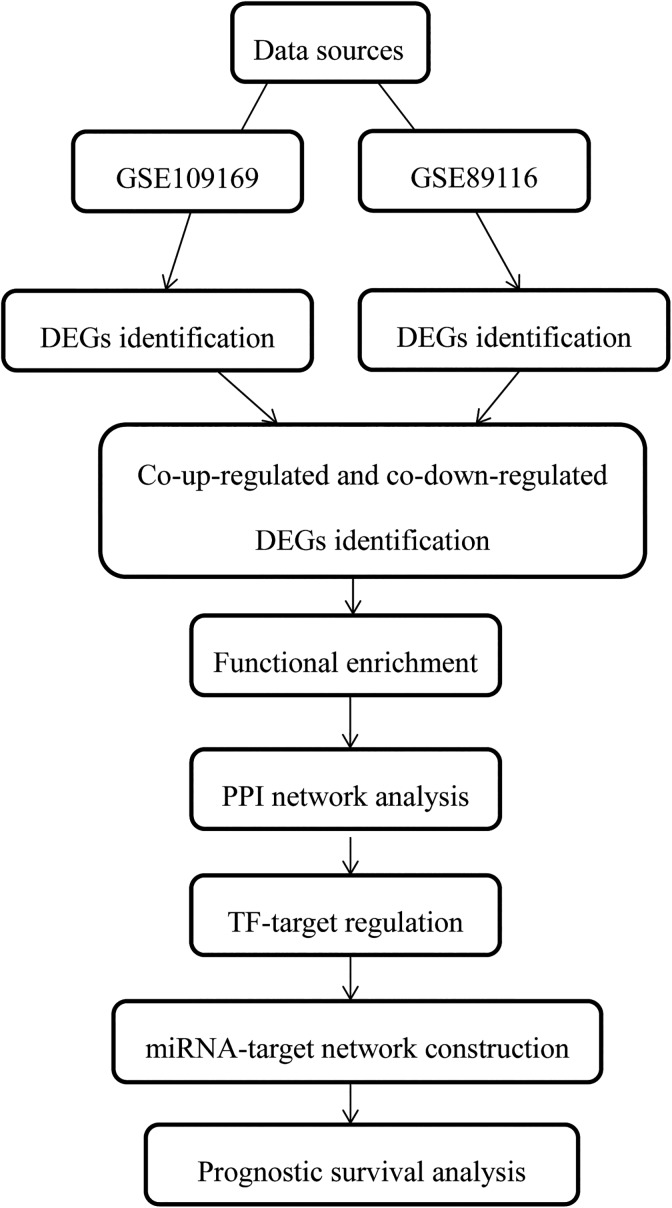
In order to explore the prognostic factors in early-onset breast cancers, microarray data of GSE109169 and GSE89116 were downloaded, and the differentially expressed genes (DEGs) between tumor samples and normal samples were screened by classic Bayesian method in limma package. Transcription factor (TF)–target regulation forecast and microRNA (miRNA)-target gene network were constructed using the tool of transcriptional regulatory relatitionships unraveled by sentence-based text mining (TRRUST) and miRWalk2.0, respectively. Moreover, the prognosis-related survival information was compiled based on The Cancer Genome Atlas (TCGA) breast cancer clinical data. The workflow of analysis is shown in Figure 1.
Figure 1.
The workflow of analysis.
Materials and Methods
Data Sources
Gene expression profiles of GSE109169 and GSE89116 were downloaded from the database of Gene Expression Omnibus (GEO; http://www.ncbi.nlm.nih.gov/geo/).10 GSE109169 was deposited by Chang et al,11 which included data from 25 pairs of early-onset breast normal/tumor tissue specimens and were generated on the platform of GPL5175 (HuEx-1_0-st) Affymetrix Human Exon 1.0 ST Array (transcript [gene] version). A total of 11 breast tumor tissue specimens and 4 breast normal tissue specimens were included in GSE89116, which were generated on the platform of GPL6947 Illumina HumanHT-12 V3.0 expression beadchip. This data set was deposited by Malvia et al.12 The samples in the 2 data sets were collected from patients aged <40 years.
Differentially Expressed Genes Screening
Cell format profile data of GSE109169 were downloaded, the microarray data were then converted into expression matrix using Oligo package in R software (version 1.38.0, http://www.bioconductor.org/packages/release/bioc/html/oligo.html). After that, the methods based on the robust multiarray average were used to preprocess the microarray data, and the data were calculated following by the processes of background correction, normalization, and expression calculation. GSE89116 was downloaded as the standardized probe matrix file GSE89116-GPL6947_series_matrix.TXT from GEO. After that, the probes from both microarray data were further annotated according to platform annotation information. The probes not mapped to the gene symbol were deleted. The medial value would be considered as the final gene expression value if multiple probes mapped to the same gene symbol.
The DEGs between tumor samples and normal samples were screened by classic Bayesian method in limma package (version 3.10.3, http://www.bioconductor.org/packages/2.9/bioc/html/limma.html) in R software. All genes were analyzed to obtain the corresponding P value and log fold-change (FC) values. Then, multiple test corrections were conducted using the Benjamini and Hochberg method, and the corrected P value, adjusted P value, was obtained. The microarray data were evaluated based on the multiple difference and significance levels. If adjusted P value < .05 and |log FC| >1, the gene would be defined as the DEG.
After obtaining the DEGs in the 2 data sets, there would be some common DEGs that were upregulated (downregulated) in one data set but downregulated (upregulated) in the other data set. In order to ensure the accuracy of the results, the DEGs that were simultaneously upregulated or simultaneously downregulated in the 2 sets of data were screened for subsequent analysis.
Functional Enrichment Analysis of DEGs
Gene Ontology (GO) and Kyoto Encyclopedia of Genes and Genomes (KEGG) functional enrichment analysis were performed using the tool of database for annotation, visualization and intergrated discovery (DAVID) (version6.8, https://david-d.ncifcrf.gov/) based on hypergeometric algorithm.13,14 A P < .05 was defined as screening criteria to select the functional enriched biological processes and KEGG pathway.
Protein–Protein Interaction Network and Module Construction
The database of Search Tool for Retrieval of Interacting Genes (STRING) is an online tool evaluating the network of protein–protein interaction (PPI). Using STRING (version 10.0, http://www.string-db.org/) database,15 the PPI of DEGs was analyzed. The input genes were set as DEGs and the species was set as human beings. The PPI score was set as 0.4 to create subsets of medium-confidence human PPI networks. The tool of Cytoscape (version: 3.2.0, http://www.cytoscape.org/) was used to visualize the predicted PPI network.
The topology properties of the node network were analyzed by the CytoNCA (version 2.1.6, http://apps.cytoscape.org/apps/cytonca), and the parameter of the calculation was set as without weight.16 The score of nodes would be obtained, and the importance of nodes in network of PPI would be sequenced by the score. Hub protein was defined as important node involved in protein interaction in PPI networks.
Transcription Factor–Target Regulation Forecast
Transcription factor prediction was performed using the tool of TRRUST (version 2; http://www.grnpedia.org/trrust/).17 The species was set as human beings, and Q value <.05 was designed as significance. The TF-target pairs were visualized by Cytoscape.
MicroRNA-Target Network Construction
For DEGs, miRWalk2.018 (http://zmf.umm.uni-heidelberg.de/apps/zmf/mirwalk2/) was used to synthesize results from commonly used databases, including miRWalk, miRanda, miRDB, PITA, RNA22, and Targetscan. If the predicted miRNAs appeared in all above 6 databases, it would be considered as the miRNA with high reliability. Then, miRNA–messenger RNA (mRNA) relationship pair was obtained. The miRNAs simultaneously regulated 3 or more target genes were selected. Finally, miRNA–mRNA network was mapped using Cytoscape software.
Prognostic Survival Analysis of Differential Genes
The data used for survival analysis were obtained from the University of California, Santa Cruz (http://xena.ucsc.edu/) database,19 which contained TCGA-related data. Clinical survival information and gene expression data for breast cancer (log2 [FPKM + 1]) were downloaded. Finally, 1058 cancer samples with survival information (−01A) were obtained through one-to-one correspondence.
The prognosis-related survival information was compiled based on TCGA breast cancer clinical data, including overall survival (OS) and OS status. The above DEGs were selected as candidate genes. Kaplan-Meier (K-M) survival analysis was then performed combining the gene expression value (log2 [FPKM + 1]) with prognostic information in the TCGA database. Two subgroups were obtained based on the median value of their expression values, including high expression group and low expression group, and K-M survival curve was drawn. The significance of P value was calculated by log-rank test, and the gene with P value <.05 was selected as prognosis-related gene.
Results
Data Preprocessing
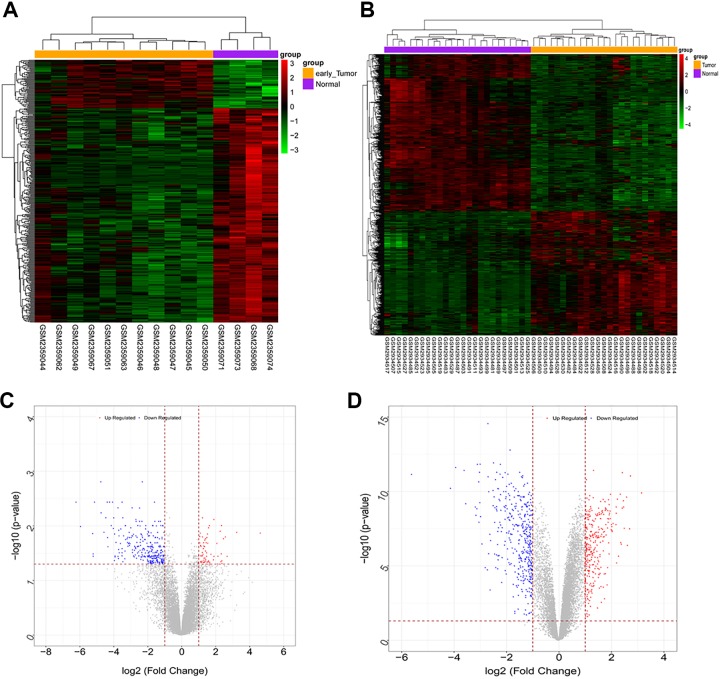
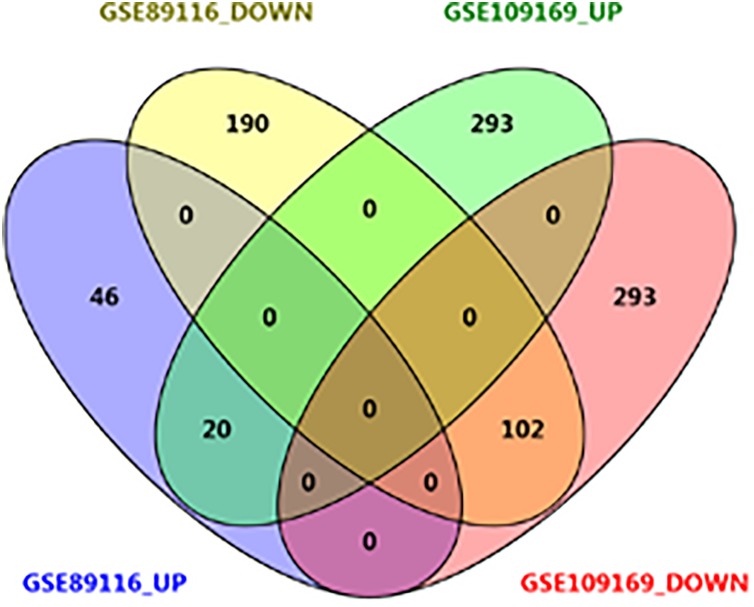
A total of 14 726 genes were annotated in GSE109169, and 18 906 genes were annotated in GSE89116. Moreover, from GSE109169, 708 DEGs were screened, including 313 upregulated and 395 downregulated DEGs, and 358 DEGs were obtained from GSE89116 data sets, including 66 upregulated and 292 downregulated DEGs. As shown in Figure 2, the bidirectional clustering heat map and volcano map were constructed. From the heat map, samples in predesigned groups could be clearly distinguished by DEGs. The DEGs of the 2 data sets were intersected, and the DEGs that were co-upregulated or co-downregulated were screened for further analysis. As shown in Figure 3, a total of 122 common DEGs were obtained. Among these DEGs, 102 were uniformly downregulated and 20 were uniformly upregulated.
Figure 2.
The double hierarchical clustering heat map of the GSE89116 (A) and GSE109169 (B) data sets. Volcano map of the GSE89116 (C) and GSE109169 (D) data sets.
Figure 3.
Functional Enrichment of Common DEGs
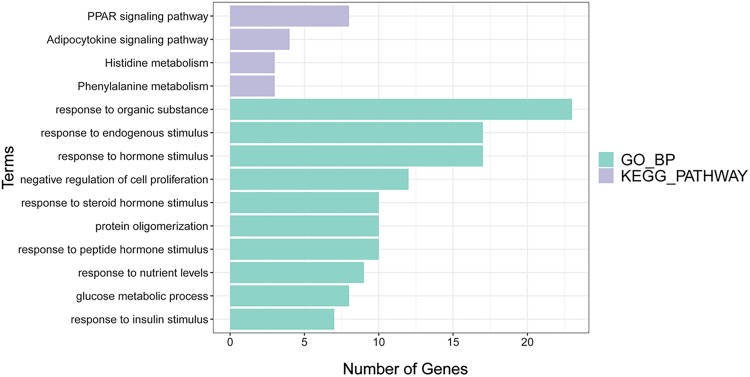
Biological process of GO and KEGG pathway functional enrichment analysis was conducted on the common DEGs. According to the threshold set by the method, 170 biological processes and 4 KEGG pathways were obtained. The top 10 biological process and 4 KEGG pathways are shown in Figure 4.
Figure 4.
The Gene Ontology (GO) functional enrichment analysis and Kyoto Encyclopedia of Genes and Genomes (KEGGE) pathway of differentially expressed genes (DEGs) that related to prognosis in data set.
These common DEGs were significantly associated with biological processes of GO, such as responses to organic substance, hormone stimulus, endogenous stimulus, peptide hormone stimulus, protein stimulation, steroid hormone stimulus, and other hormone-stimulating biological functions. The 4 KEGG pathways included PPAR signaling pathway, phenylalanine metabolism, adipocytokine signaling pathway, and histidine metabolism.
Protein–Protein Interaction Network
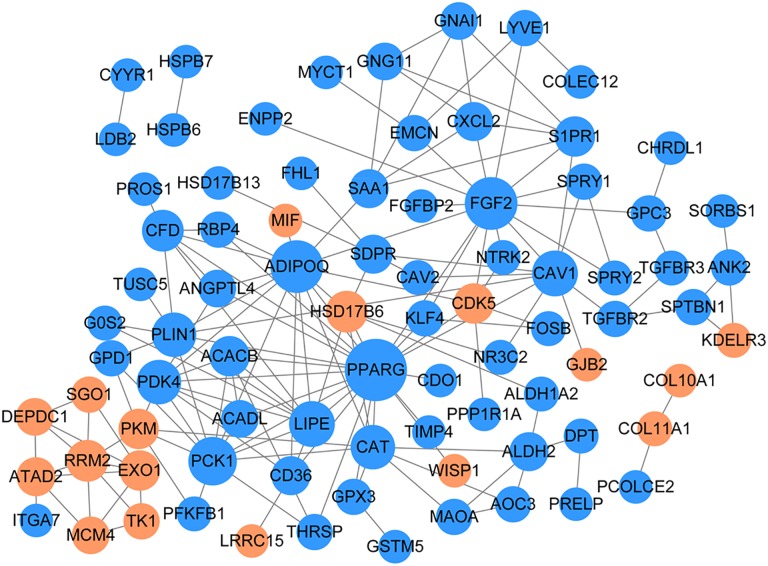
According to the “Method” section, the PPI network with a total of 83 nodes and 157 relationship pairs was obtained. As shown in Figure 5, the node connectivity of the differential genes in the network was calculated using the CytoNCA passage in Cytoscape software. The degree scores of the top 12 are given in Table 1, and the connectivity of 12 genes including peroxisome proliferator-activated receptor γ (PPARG), fibroblast growth factor 2 (FGF2), adiponectin (ADIPOQ), C1Q and collagen domain containing (ADIPOQ), and pyruvate dehydrogenase kinase 4 (PDK4) was more than 7, which were recognized as key nodes in PPI.Transcription Factor Prediction Analysis and TF-Target Network Construction
Figure 5.
Protein–protein interaction network of common differentially expressed genes of GSE89116 and GSE109169. The yellow node indicates the up, the blue node indicates the down, and the node size indicates the size of the degree.
Table 1.
Top 12 Genes With Highest Degrees in Protein–Protein Interaction Network.
| Gene | Degree | Up Down |
|---|---|---|
| PPARG | 22 | Down |
| FGF2 | 15 | Down |
| ADIPOQ | 15 | Down |
| PCK1 | 12 | Down |
| CAV1 | 10 | Down |
| LIPE | 10 | Down |
| PDK4 | 9 | Down |
| CAT | 9 | Down |
| PLIN1 | 9 | Down |
| CFD | 7 | Down |
| HSD17B6 | 7 | Up |
| RRM2 | 7 | Up |
Abbreviations: ADIPOQ, adiponectin; PPARG, peroxisome proliferator-activated receptor γ.
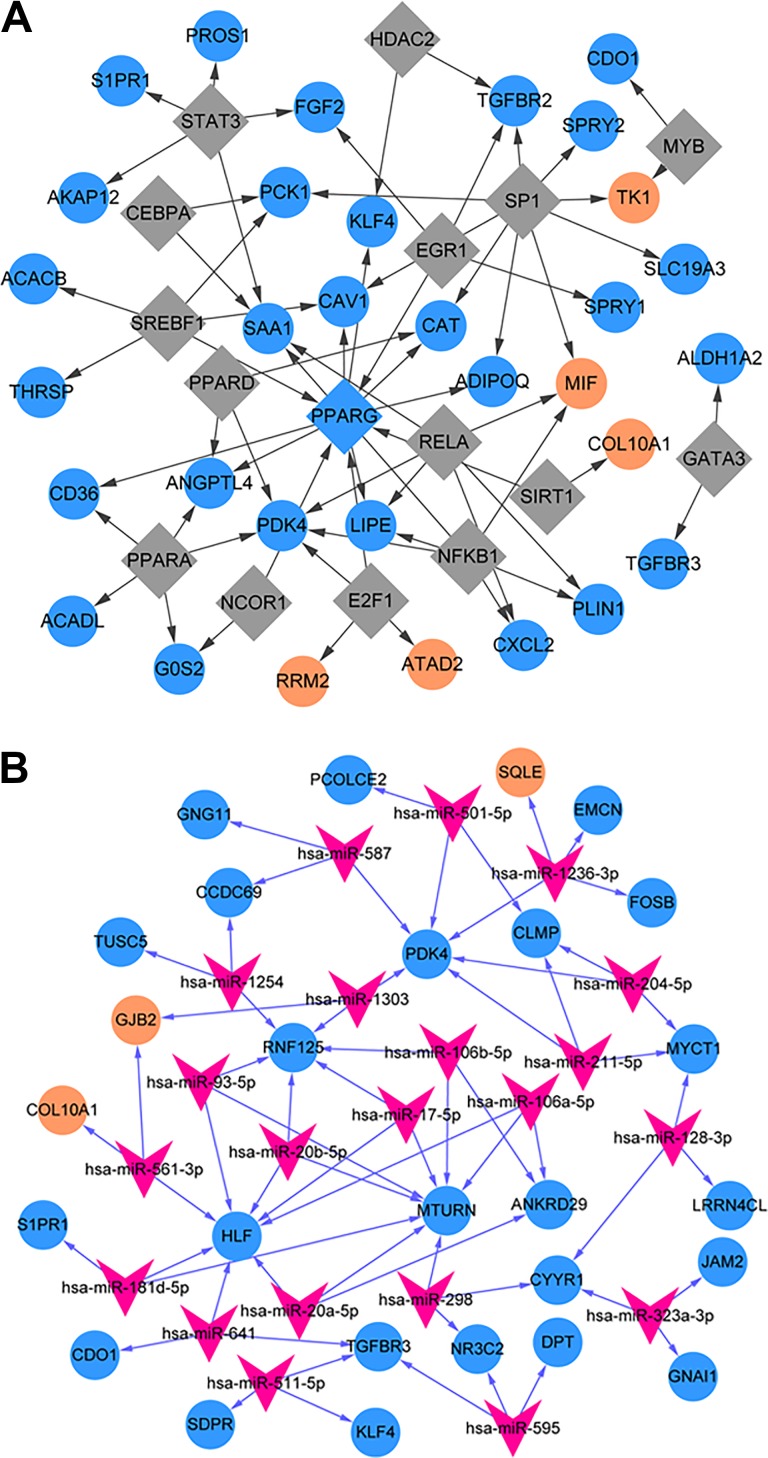
In total, 66 TF-target relationship pairs were calculated, and these pairs included 16 TFs and 33 target genes. Among 16 TFs, PPARG was the only one downregulated TF. The network of TF target is shown in Figure 6A. The PPARG could regulate 7 genes, such as Kruppel-like factor 4 (KLF4), CD36 molecule (CD36), and ADIPOQ.
Figure 6.
The regulatory network of transcription factor (TF)–target (A) and microRNA-target (B).
MicroRNA Predictive Analysis and miRNA-Target Network Construction
From the network of miRNA-target genes, 368 miRNA-target relationship pairs were calculated, and the relationship pairs included 27 miRNAs and 52 target genes, of which 21 miRNAs could regulate 3 or more target genes. Figure 6B shows that miRNA-target network contains 64 miRNA-target relationship pairs, including 21 miRNAs and 27 targets.
Prognostic Survival Analysis of Common DEGs
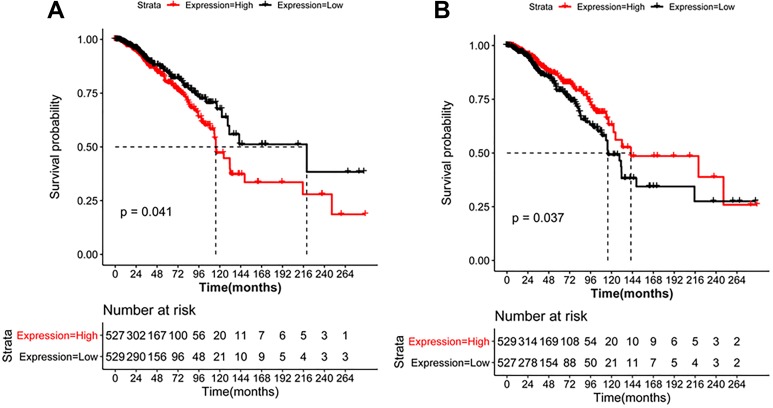
After prognostic survival analysis, we obtained a matrix of expression values of 121 DEGs in 1058 breast cancer samples. Table 2 shows a total of 16 common DEGs, including 2 upregulations and 14 downregulations, were significantly related to the prognosis of the disease. The K-M survival curves of 16 prognosis-related genes are shown in Table 2. Moreover, one upregulated (squalene epoxidase, SQLE) and one downregulated gene (PPARG) are shown in Figure 7. It can be seen that the higher the expression of SQLE, the worse the prognosis; the lower the expression of PPARG, the worse the prognosis.
Table 2.
Sixteen Differentially Expressed Genes Associated With Prognosis.
| Gene | P Value | Up_Down |
|---|---|---|
| CCDC69 | .0012 | Down |
| CXCL2 | .0025 | Down |
| SORBS1 | .0028 | Down |
| NR3C2 | .0055 | Down |
| NTRK2 | .0109 | Down |
| CLMP | .0187 | Down |
| SAA1 | .0243 | Down |
| ANKRD29 | .0249 | Down |
| EXO1 | .0256 | Up |
| FREM1 | .0300 | Down |
| FBLN5 | .0309 | Down |
| PROS1 | .0324 | Down |
| RBP4 | .0369 | Down |
| PPARG | .0372 | Down |
| SQLE | .0406 | Up |
| CDO1 | .0474 | Down |
Abbreviation: PPARG, peroxisome proliferator-activated receptor γ.
Figure 7.
Kaplan-Meier survival curve of SQLE (A) and peroxisome proliferator-activated receptor γ (PPARG) (B).
Discussion
In our study, a total of 122 common DEGs were obtained, of which 102 genes were uniformly downregulated and 20 genes were uniformly upregulated in both GSE109169 and GSE89116. The PPI network with a total of 83 nodes and 157 relationship pairs was obtained, and genes in PPI such as PPARG, FGF2, ADIPOQ, and PDK4 were recognized as key nodes in PPI. In total, 66 TF-target relationship pairs were obtained, and PPARG was the only one downregulated TF. Prognostic survival analysis showed that 16 differential genes, including 2 upregulations and 14 downregulations, were related to a significant correlation with the prognosis.
Previous studies have demonstrated that obesity played a major role in breast cancer pathogenesis.20,21 The gene of PPARG was the key nodes in the PPI network of breast cancers, which was widely known as a critical factor in the lipid and glucose homeostasis and adipocyte differentiation. Moreover, the pathology of a lot of diseases associated with the above metabolic process, such as obesity, diabetes, atherosclerosis, and cancer. A previous systematic review by Tang and his colleagues reported significant association between PPARG rs1801282 C>G variants and the decreased risk of breast cancer.22 In our study, PPARG was one of downregulated DEGs between samples from normal tissue and breast cancers. Meanwhile, PPARG may be an important TF in the process of disease and regulate KLF4, CD36, ADIPOQ, LIPE, CAV1, ANGPTL4, and CAT. The PPAR signaling pathway was one of the enriched KEGG pathway of DEGs. A previous study showed that PPAR signaling pathway played as one of the important predictors for patients with breast cancer after treatment by neoadjuvant chemotherapy.23 Thus, it should be believed that PPARG might be one of protective factor of breast cancer based on PPAR signaling pathway, and the patients with lower expression levels might have poorer prognosis.
Adiponectin was also a key node in PPI network of breast cancer, which was exclusively expressed in adipose tissue. The gene was an adipocytokine secreted by adipocytes, which was demonstrated as a gene negatively regulating cancer cell growth. Previous studies demonstrated that the gene could regulate the processes associated with cell growth, angiogenesis, and tissue remodeling mediated by various growth factors.24 Chung et al put forward that, in breast cancer cells, ADIPOQ/adiponectin could increase microtubule-associated protein 1 light chain 3 β-II and decrease sequestosome 1 (SQSTM1)/p62 based on the process of autophagy.25 A previous study by Méndez-Hernández and his colleagues26 collected a sample of 177 Mexican women with primary breast cancers receiving neoadjuvant therapy and demonstrated that ADIPOQ genotypes was related to chemotherapeutic treatment response. However, in another study by Teras et al,27 data from 648 cases and 659 controls showed no statistically significant associations between the risk of American breast cancer and polymorphisms of any single nucleotide. In our study, ADIPOQ was regulated by the key TF of PPARG, and we speculated that ADIPOQ might play a major role in breast cancer pathogenesis through being regulated by PPARG.
SQLE was one of the most important prognostic factors in our study. As is well known, SQLE is one of the rate-limiting enzymes in sterol biosynthesis. Brown et al 28 tried to assess the correlation of copy number and gene expression levels of SQLE among multiple cancer types and showed that SQLE was an important therapeutic target in breast cancer. In our study, SQLE was also demonstrated as one of the most important prognosis genes, and patients with higher SQLE expression levels would have poorer prognosis.
PDK4 is a key enzyme in the process of glucose metabolism and highly expressed in breast cancers. Our data showed the gene was one of key nodes of PPI network in breast cancer, and it has a targeted binding relationship with more than 5 miRNAs. Previous evidence demonstrated inverse correlation between expression of miR-211 and PDK4, and targeting miR-211 to inhibit PDK4 was recognized as a valuable potential therapeutic strategy in breast cancers.29 In our study, the correlations between PDK4 and 20 miRNAs were demonstrated, such as miR-211, miR-602, and miR-16. Although no clinical data have been published on these correlations, these findings might be useful for future advances in breast cancer treatment.
In summary, SQLE and PPARG might be important prognostic factors in breast cancers, and ADIPOQ might play a major role breast cancer pathogenesis regulated by PPARG.
Abbreviations
- ADIPOQ
adiponectin
- DEGs
differentially expressed genes
- FC
fold change
- FGF2
fibroblast growth factor 2
- GEO
Gene Expression Omnibus
- GO
Gene Ontology
- KEGG
Kyoto Encyclopedia of Genes and Genomes
- KLF4
Kruppel-like factor 4
- K-M
Kaplan-Meier
- mRNA
messenger RNA
- miRNA
microRNA
- OS
overall survival
- PDK4
pyruvate dehydrogenase kinase 4
- PPARG
peroxisome proliferator-activated receptor γ
- PPI
protein–protein interaction
- STRING
Search Tool for Retrieval of Interacting Genes
- TCGA
The Cancer Genome Atlas
- TF
transcription factor
Footnotes
Authors’ Note: Our study did not require an ethical board approval because it did not contain human or animal trials. Zhun Yu, Qi He and Guoping Xuare also affiliated with Shanghai Key Laboratory of Embryo Original Diseases, Shanghai, China and Shanghai Municipal Key Clinical Specialty, Shanghai, China.
Declaration of Conflicting Interests: The author(s) declared no potential conflicts of interest with respect to the research, authorship, and/or publication of this article.
Funding: The author(s) received no financial support for the research, authorship, and/or publication of this article.
ORCID iD: Guoping Xu  https://orcid.org/0000-0001-6033-3630
References
- 1. Cheng Y, Yan Y, Gong J, Yang N, Nie S. Trends in incidence and mortality of female breast cancer during transition in Central China. Cancer Manag Res. 2018;10:6247–6255. [DOI] [PMC free article] [PubMed] [Google Scholar]
- 2. Cazap E. Breast cancer in Latin America: a map of the disease in the region. Am Soc Clin Oncol Educ Book. 2018;38:451–456. [DOI] [PubMed] [Google Scholar]
- 3. Romieu I, Biessy C, Carayol M, et al. Reproductive factors and molecular subtypes of breast cancer among premenopausal women in Latin America: the PRECAMA study. Sci Rep. 2018;8(1):13109. [DOI] [PMC free article] [PubMed] [Google Scholar]
- 4. Fu D, He C, Wei J, et al. PGK1 is a potential survival biomarker and invasion promoter by regulating the HIF-1alpha-mediated epithelial-mesenchymal transition process in breast cancer. Cell Physiol Biochem. 2018;51(5):2434–2444. [DOI] [PubMed] [Google Scholar]
- 5. Oztemur Islakoglu Y, Noyan S, Aydos A, Gur Dedeoglu B. Meta-microRNA biomarker signatures to classify breast cancer subtypes. OMICS. 2018;22(11):709–716. [DOI] [PubMed] [Google Scholar]
- 6. Wu C, Tuo Y. SYCP2 expression is a novel prognostic biomarker in luminal A/B breast cancer. Future Oncol. 2019;15(8):817–826. [DOI] [PubMed] [Google Scholar]
- 7. Grynberg M, Hayeck BD, Papanikolaou EG, Sifer C, Sermondade N, Sonigo C. BRCA1/2 gene mutations do not affect the capacity of oocytes from breast cancer candidates for fertility preservation to mature in vitro. Hum Reprod. 2019;34(2):374–379. [DOI] [PubMed] [Google Scholar]
- 8. Ding S, Wu J, Lin C, et al. Predictors for survival and distribution of 21-gene recurrence score in patients with pure mucinous breast cancer: a SEER population-based retrospective analysis. Clin Breast Cancer. 2019;19(1):e66–e73. [DOI] [PubMed] [Google Scholar]
- 9. Ellegård S, Veenstra C, Pérez-Tenorio G, et al. ERBB2 and PTPN2 gene copy numbers as prognostic factors in HER2-positive metastatic breast cancer treated with trastuzumab. Oncol Lett. 2019;17(3):3371–3381. [DOI] [PMC free article] [PubMed] [Google Scholar]
- 10. Barrett T, Suzek TO, Troup DB, et al. NCBI GEO: mining millions of expression profiles—database and tools. Nucleic Acids Res. 2005;33(Database issue):D562–D566. [DOI] [PMC free article] [PubMed] [Google Scholar]
- 11. Chang JW, Kuo WH, Lin CM, et al. Wild-type p53 upregulates an early onset breast cancer-associated gene GAS7 to suppress metastasis via GAS7-CYFIP1-mediated signaling pathway. Oncogene. 2018;37(30):4137–4150. [DOI] [PMC free article] [PubMed] [Google Scholar]
- 12. Malvia S, Bagadi SAR, Pradhan D, et al. Study of Gene expression profiles of breast cancers in Indian women. Sci Rep. 2019;9(1):10018. [DOI] [PMC free article] [PubMed] [Google Scholar]
- 13. Ashburner M, Ball CA, Blake JA, et al. Gene ontology: tool for the unification of biology. The Gene Ontology Consortium. Nat Genet. 2000;25(1):25–29. [DOI] [PMC free article] [PubMed] [Google Scholar]
- 14. Kanehisa M, Goto S. KEGG: Kyoto Encyclopedia of Genes and Genomes. Nucleic Acids Res. 2000;28(1):27–30. [DOI] [PMC free article] [PubMed] [Google Scholar]
- 15. Szklarczyk D, Franceschini A, Wyder S, et al. STRING v10: protein–protein interaction networks, integrated over the tree of life. Nucleic Acids Res. 2015;43(Database issue):D447–D452. [DOI] [PMC free article] [PubMed] [Google Scholar]
- 16. Tang Y, Li M, Wang J, Pan Y, Wu FX. CytoNCA: a cytoscape plugin for centrality analysis and evaluation of protein interaction networks. Biosystems. 2015;127:67–72. [DOI] [PubMed] [Google Scholar]
- 17. Han H, Cho JW, Lee S, et al. TRRUST v2: an expanded reference database of human and mouse transcriptional regulatory interactions. Nucleic Acids Res. 2018;46(D1):D380–D386. [DOI] [PMC free article] [PubMed] [Google Scholar]
- 18. Dweep H, Gretz N. miRWalk2.0: a comprehensive atlas of microRNA-target interactions. Nat Methods. 2015;12(8):697. [DOI] [PubMed] [Google Scholar]
- 19. Karolchik D, Baertsch R, Diekhans M, et al. The UCSC genome browser database. Nucleic Acids Res. 2003;31(1):51–54. [DOI] [PMC free article] [PubMed] [Google Scholar]
- 20. Heetun A, Cutress RI, Copson ER. Early breast cancer: why does obesity affect prognosis? Proc Nutr Soc. 2018;77(4):369–381. [DOI] [PubMed] [Google Scholar]
- 21. Mormile R. Obesity and breast cancer risk: implications of MiR-126. Minerva Endocrinol. 2018;43(3):385. [DOI] [PubMed] [Google Scholar]
- 22. Tang W, Chen Y, Wang Y, Gu H, Chen S, Kang M. Peroxisome proliferator-activated receptor gamma (PPARG) polymorphisms and breast cancer susceptibility: a meta-analysis. Int J Clin Exp Med. 2015;8(8):12226–12238. [PMC free article] [PubMed] [Google Scholar]
- 23. Chen YZ, Xue JY, Chen CM, et al. PPAR signaling pathway may be an important predictor of breast cancer response to neoadjuvant chemotherapy. Cancer Chemother Pharmacol. 2012;70(5):637–644. [DOI] [PubMed] [Google Scholar]
- 24. Sueldo C, Liu X, Peluso JJ. Progestin and AdipoQ receptor 7, progesterone membrane receptor component 1 (PGRMC1), and PGRMC2 and their role in regulating progesterone’s ability to suppress human granulosa/luteal cells from entering into the cell cycle. Biol Reprod. 2015;93(3):63. [DOI] [PubMed] [Google Scholar]
- 25. Chung SJ, Nagaraju GP, Nagalingam A, et al. ADIPOQ/adiponectin induces cytotoxic autophagy in breast cancer cells through STK11/LKB1-mediated activation of the AMPK-ULK1 axis. Autophagy. 2017;13(8):1386–1403. [DOI] [PMC free article] [PubMed] [Google Scholar]
- 26. Méndez-Hernández A, Gallegos-Arreola MP, Moreno-Macías H, Espinosa Fematt J, Pérez-Morales R. LEP rs7799039, LEPR rs1137101, and ADIPOQ rs2241766 and 1501299 polymorphisms are associated with obesity and chemotherapy response in Mexican women with breast cancer. Clin Breast Cancer. 2017;17(6):453–462. [DOI] [PubMed] [Google Scholar]
- 27. Teras LR, Goodman M, Patel AV, et al. No association between polymorphisms in LEP, LEPR, ADIPOQ, ADIPOR1, or ADIPOR2 and postmenopausal breast cancer risk. Cancer Epidemiol Biomarkers Prev. 2009;18(9):2553–2557. [DOI] [PubMed] [Google Scholar]
- 28. Brown DN, Caffa I, Cirmena G, et al. Squalene epoxidase is a bona fide oncogene by amplification with clinical relevance in breast cancer. Sci Rep. 2016;6:19435. [DOI] [PMC free article] [PubMed] [Google Scholar]
- 29. Guda MR, Asuthkar S, Labak CM, et al. Targeting PDK4 inhibits breast cancer metabolism. Am J Cancer Res. 2018;8(9):1725–1738. [PMC free article] [PubMed] [Google Scholar]


