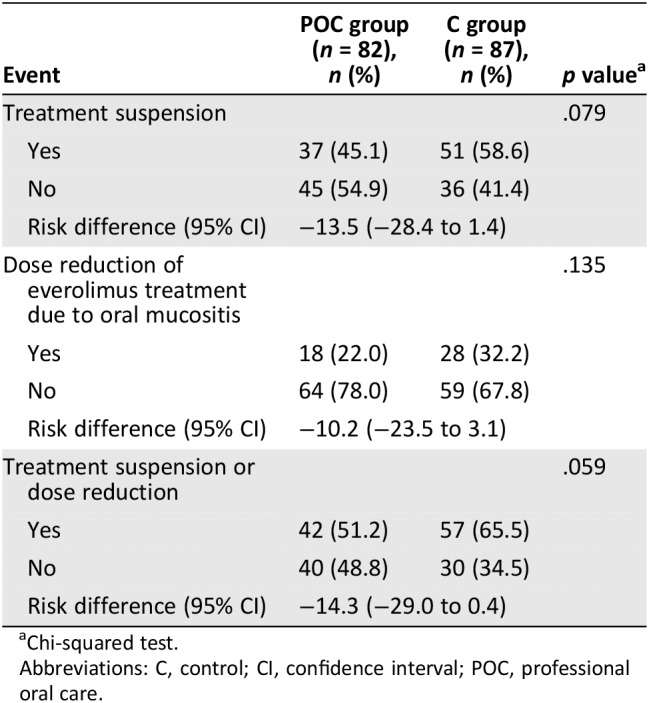
Table 4.
Delay or dose‐reduction of everolimus
| Event | POC group (n = 82), n (%) | C group (n = 87), n (%) | p valuea |
|---|---|---|---|
| Treatment suspension | .079 | ||
| Yes | 37 (45.1) | 51 (58.6) | |
| No | 45 (54.9) | 36 (41.4) | |
| Risk difference (95% CI) | −13.5 (−28.4 to 1.4) | ||
| Dose reduction of everolimus treatment due to oral mucositis | .135 | ||
| Yes | 18 (22.0) | 28 (32.2) | |
| No | 64 (78.0) | 59 (67.8) | |
| Risk difference (95% CI) | −10.2 (−23.5 to 3.1) | ||
| Treatment suspension or dose reduction | .059 | ||
| Yes | 42 (51.2) | 57 (65.5) | |
| No | 40 (48.8) | 30 (34.5) | |
| Risk difference (95% CI) | −14.3 (−29.0 to 0.4) | ||

Chi‐squared test.
Abbreviations: C, control; CI, confidence interval; POC, professional oral care.
