Abstract.
Purpose: Biomarkers related to hemodynamics can be quantified using angiographic parametric imaging (API), which is a quantitative imaging method that uses digital subtraction angiography (DSA). We aimed to assess the accuracy of API in locating infarct core within large vessel occlusion (LVO) acute ischemic stroke (AIS) patients.
Approach: Data were retrospectively collected for 25 LVO AIS patients who achieved successful recanalization. DSA data from lateral and anteroposterior (AP) views were loaded into API software to generate hemodynamic parameter maps. Relative differences in hemispherical regions for each API parameter were calculated. Ground truth infarct core locations were obtained using 24-h follow-up fluid-attenuation inversion recovery (FLAIR) MRI imaging. FLAIR MRI infarct locations were registered with DSA images to determine infarct regions in API parameter maps. Relative differences across hemispheres for each API parameter were plotted against each other. A support vector machine was used to determine the optimal hyperplane for classifying regions as infarct or healthy tissue.
Results: For the lateral and AP views, respectively, the most accurate classification of infarct regions came from plotting mean transit time (MTT) versus peak height (PH) [ (95%)], the area under the receiver operator characteristic curve (95%), and plotting MTT versus the area under the curve (AUC) [ (95%), (95%)].
Conclusions: API provides accurate assessment of locating ischemic core in AIS LVO patients and has the potential for clinical benefit by determining infarct core location and growth in real time for intraoperative decision making.
Keywords: angiographic parametric imaging, brain, digital subtraction angiography, infarct core, ischemic stroke
1. Introduction
Stroke is the leading cause of long-term disabilities within the United States and affects one person every 40 s.1 There are two types of strokes, ischemic and hemorrhagic, accounting for 87% and 13% of all strokes, respectively.2 Ischemic strokes result from reduced or lack of blood flow to the brain due to stenosis or arterial occlusion.3,4 Depending on the viability of the brain tissue, which is affected by the duration of occlusion and collateral flow, the tissue can be classified as infarct core, penumbra, or healthy tissue. Infarct core is tissue that is permanently damaged from oxygenated blood deprivation and cannot be salvaged even in the event of reperfusion procedures.5,6 The severity of an occlusion can be measured using a patient’s hypoperfusion intensity ratio (HIR), which is the volume of severely hypoperfused tissue divided by the volume of tissue with any degree of hypoperfusion. If a patient’s HIR is , infarct forms at a rate of 0.9 mL/h and if their HIR is , infarct forms at a rate of 10.1 mL/h.7 These rates indicate that time is valuable when salvaging tissue that is deficient in blood supply, penumbra, before it converts to infarct core.
Currently, computed tomography perfusion (CTP) and fluid-attenuation inversion recovery (FLAIR) MRI are the standard methods used to diagnose infarct tissue in stroke centers, especially at late time windows or when the exact time of stroke symptom onset is unknown.8,9 CTP involves the quantification of hemodynamic parameters through the injection of contrast media into a patients neurovasculature. Infarct regions are subsequently quantified through contralateral hemisphere comparisons of these hemodynamic parameters.10 FLAIR MRI is capable of detecting infarct by isolating hyperintense brain lesions and is additionally known to be the gold standard for quantifying infarct core.9,11 CTP and FLAIR MRI, however, have drawbacks in that they do not provide real-time guidance, and in the case of FLAIR MRI, can take up to 12 min to acquire.12 In the event that the embolus causing the occlusion is removed through a mechanical thrombectomy and the embolus breaks apart causing occlusions in distal vascular branches, additional CTP, or FLAIR MRI imaging will be required to identify new forming regions of infarct. In a study conducted, this thombectomy complication occurred in 1 out of every 144 patients.13 Due to this, a method that can detect infarct tissue in real time would be of great clinical benefit. Using such information, physicians would be able to modify certain aspects of the endovascular procedure or postoperative workflow and intensive care unit monitoring.
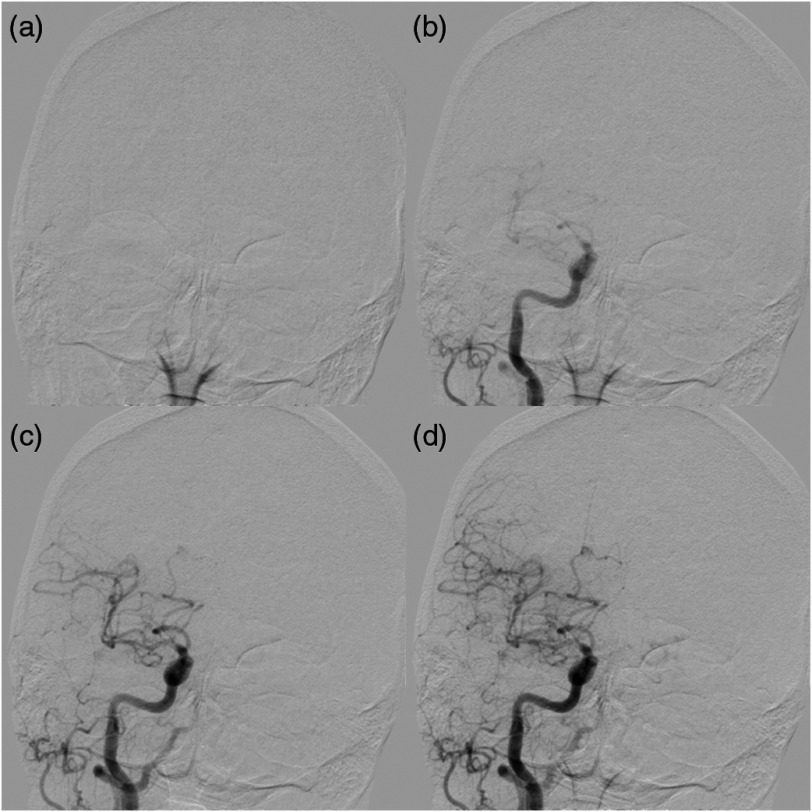
Digital subtraction angiography (DSA) imaging is a clinical imaging method that provides real-time evaluation of patients through two-dimensional visualization of contrast media progressing through vasculature but to date has mainly been used for structural imaging (Fig. 1).14 Angiographic parametric imaging (API) is based on DSA imaging and it quantifies hemodynamic parameters within patient vasculature based on the flow of injected contrast. To date, most studies conducted using API derived from DSA have had different clinical applications, such as determination of coronary flow reserve and renal transplant evaluation.15,16 The five standard API parameters used for quantitative hemodynamic analysis are: bolus arrival time (BAT), time to peak (TTP), mean transit time (MTT), the area under the curve (AUC), and peak height (PH). In the presence of infarct core, time-related parameters such as BAT, TTP, and MTT should increase due to delay in flow in permanently damaged tissue. Conversely, the AUC and PH parameters should decrease in regions of damaged tissue due to delay and prevention of contrast media flow.
Fig. 1.
Demonstration of an AP DSA sequence showing progression of contrast through vasculature for an AIS patient who received successful reperfusion of TICI 2b. (a) Prior to contrast injection (time = 0.67 s) and (b) while contrast is located within the carotid artery (time = 2.67 s); (c) (time = 3.33 s) and (d) (time = 4.00 s) show contrast progressing into distal vessels.
Within this study, we aim to determine whether API can be utilized to detect regions of infarct core within large vessel occlusion (LVO) acute ischemic stroke (AIS) patients through comparison of API parameter relative differences between cerebral hemispheres. Additionally, we compared predicted infarct regions using API with FLAIR MRI to assess the accuracy of API. If deemed successful in locating infarct core, API could be used for patients who are candidates for thrombectomy by aiding in the prediction of infarct location and growth during the endovascular procedure to potentially influence intraoperative decision-making. Particularly, this method could be of great assistance in the event of new vessel occlusions during reperfusion procedures.
2. Methods
2.1. Image and Data Collection
For this retrospective study, institutional review board approval was obtained and informed consent was waived. Inclusion criteria for this study were patients with LVO AIS who had undergone successful recanalization of thrombolysis in cerebral infarction (TICI) 2b (reperfusion with of distal branch filling) or 3 (complete reperfusion of all distal branches).17 Additionally, patients who did not receive 24-h follow-up FLAIR MRI imaging were excluded from the study. The TICI scores were determined by the treating attending physicians at the completion of reperfusion mechanical thrombectomy procedures and were further adjudicated by an additional operator not involved in the interventional procedure. The additional operator was an endovascular fellow and a consensus was reached between the two operators in determining the final TICI score. The following clinical data were collected: baseline National Institute of Health Stroke Scale (NIHSS) scores, time of onset of stroke symptoms, and time of achieved reperfusion. Finally, postinterventional standard anteroposterior (AP) and lateral DSA images demonstrating successful reperfusion from each patient were downloaded from the hospital’s picture archiving communications system (PACS). Original acquisition of the DSA images for all patients was conducted using two Canon (formerly Toshiba) Infinix biplane system. Scan acquisition parameters varied from patient to patient but summary statistics (mean ± standard deviation [median] {interquartile range}) for continuous parameters are as follows: a tube voltage of [80] {75 to 85} peak kilo-voltages, a tube current of [160] {150 to 165} milliamps, and resolution of 0.15 mm. Additionally, a field of view of 199 and 248 mm for the AP and lateral views, respectively, and a temporal sampling rate of 3 frames per s was utilized. DSA images were acquired for both hemispheres of the brain (stroke positive and stroke negative) from both the lateral and AP views. Cases with images with significant motion artifact precluding accurate analysis were excluded. The FLAIR MRI images were also downloaded from the hospital’s PACS. In total, data from 25 patients was collected for usage in this study.
2.2. API Software
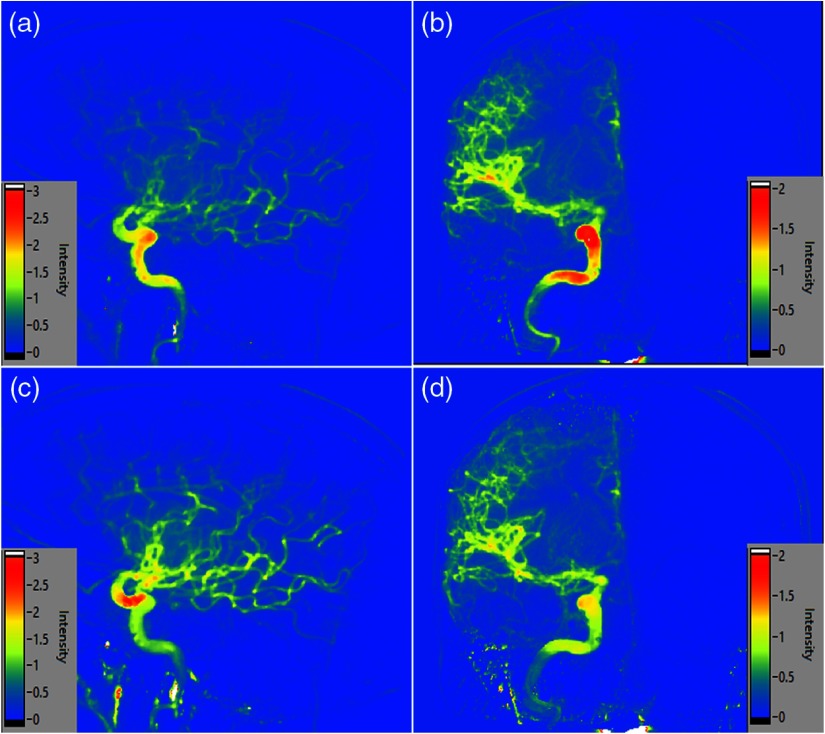
DSA images for the right and left hemispheres of the brain were registered with each other for the lateral and AP views, respectively, using a MATLAB R2018a 9.4.0 (MathWorks, Natick, Massachusetts) built in geometric-based image registration function (Image Processing Toolkit 10.2) as shown in Fig. 2. Previous scientific studies have been conducted and were successful utilizing this built in registration tool on medical imaging data.18–20 This registration method focused on the geometric shape and intensity values of the skull motion artifact to register the DSA images for contralateral hemispheres for each image in the DSA sequence. For this study, registration parameters utilized were a similarity transformation, a linear interpolation method, and a similarity metric that minimized mean square error. Additionally, a one-plus-one evolutionary optimizer was used with the following parameters: an initial search radius of , a minimum search radius of , a search radius growth factor of 1.01, and a maximum number of iterations of 1000 for the optimizer. These parameters control the step size used in the parameter space to refine the registration and converge on the local optimum. The registered DSA images were then loaded into an analysis software developed in LabVIEW 18.0.0 (National Instruments, Austin, Texas), which generated API parameter maps. The software records the pixel intensity in each frame to generate a time density curve (TDC). Gamma variate curve fitting was then utilized to calculate the API parameter values at each pixel location. Equation (1) indicates the gamma variate curve fitting equation, where indicates the maximum value of the TDC, BAT is the bolus arrival time for the pixel being sampled, is the time points of the DSA sequence, and and are the curve fitting parameters.21 Calculated API parameter values for each pixel location allow for the generation of BAT, TTP, MTT, AUC, and PH API parameter maps for both the right and left hemispheres for the lateral and AP views for each patient. Figure 3 shows the lateral and AP maps generated for the AUC and PH API parameters. Since the rate of injection is dependent on the neurosurgeon’s technique, normalization of each API map needs to be conducted to prevent skewed values due to one hemisphere containing a quicker injection rate than the contralateral hemisphere. This normalization was carried out by dividing the entire API map by the average arterial inlet value for each respective API map. For intensity parameters such as PH and AUC, all intensities in each API map were scaled down by the average inlet artery intensity for each respective parameter. For time related parameters, such as BAT, TTP, and MTT, each respective API map is scaled down by the corresponding API parameter’s average inlet time. This arterial inlet value is determined by generating a TDC at the intel of the main feeding artery and quantifying each hemodynamic parameter at the inlet location:
| (1) |
Fig. 2.
(a), (b) AP DSA images for the same patient for the left and right hemispheres, respectively. Note the tilt in the patients head within (b). (c) An overlay of the two images following registration to allow for the exact same placement of ROIs between hemispheres. Note the significant overlap of skull region in the registered images.
Fig. 3.
(a), (b) Lateral and AP normalized API maps, respectively, for the AUC parameter. (c), (d) Normalized API maps for the PH parameter from the lateral and AP views, respectively.
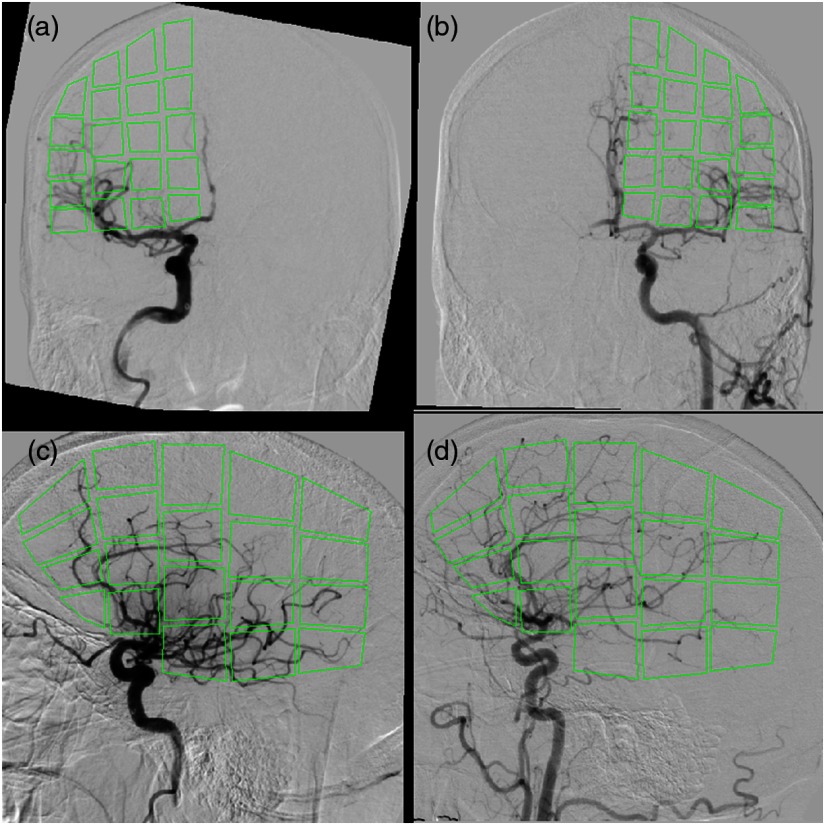
Following generation of the API parameter maps, 20 regions of interest (ROI) were placed within the right hemisphere in both the lateral and AP views for each patient. A predefined shape and position was set for each ROI to be place within the right hemisphere after which the user could manipulate the shape and size of the ROI to prevent it from extending into the extracranial space. The use of 20 ROIs was selected to efficiently segment vasculature into multiple sections but still overcome any erroneous API values introduced during averaging in future techniques. ROIs were placed to avoid the main inlet vessel to prevent skewing of the API parameter values. The previously mentioned image registration of the hemispheres allowed for 20 additional ROIs to be placed within the exact same region in the contralateral hemisphere for both the lateral and AP views. Figure 4 shows the placement of the ROIs within each hemisphere and within each view. Once ROIs were placed, average values were extracted from each ROI within the BAT, TTP, MTT, AUC, and PH API maps. Relative difference values were determined between corresponding hemispherical ROIs for each API parameter. Contralateral hemisphere comparisons were conducted due to the high accuracy of this method in detecting infarct core for CTP. Furthermore, CTP utilizes similar parameters to API such as MTT, BAT, and TTP.10,22,23 Relative differences were calculated by dividing the absolute value of the difference between the hemispherical API values by the average of those two API values. Equation (2) indicates the relative difference formula used with indicating the ROI API value from the right hemisphere and representing the corresponding ROI API value from the left hemisphere:
| (2) |
Fig. 4.
Overlay of the ROIs for extracting API parameters values are indicated. ROI placement in (a) is influenced by ROI placement in (b) by flipping the placed ROIs over the axis. (c), (d) The placement of ROIs in the right and left hemispheres, respectively, for the lateral view.
2.3. FLAIR MRI Image Registration
FLAIR MRI data were obtained using a Vantage Titan 1.5T MRI unit (Canon Medical Systems Corporation, Otawara, Japan) using the axial FLAIR protocol. This protocol involves an inversion time of 2500 ms, a repetition time of 10,000 ms, and an echo time of 120 ms. Additionally, a slice thickness of 5 mm, pixel spacing of 0.3947 mm, and in-plane resolution of 0.9462 mm was utilized. To determine ground truth infarct locations, FLAIR MRI images for each patient were loaded into the Slicer Community’s open source 3-D Slicer software. Pixel spacing and slice thickness values for each MRI were input into the software to generate the original MRI volume. Infarct core was segmented using a standard thresholding technique. The specific threshold set was to identify regions within the brain as infarct if their FLAIR protocol gray scale pixel values were based on a previous study conducted.24 Two-dimensional views were subsequently generated from the lateral and AP views showing the entire diameter of the infarct core. Figure 5 shows the original FLAIR MRI image with segmented infarct from the lateral and AP views. At the generated lateral and AP views, the skull was segmented using thresholding and the resulting lateral and AP images were exported indicating both infarct core and skull.
Fig. 5.
(a) A single slice from an FLAIR MRI image. Infarct core is the highly intensified signal in the right hemisphere. (b), (c) AP and lateral view segmented infarct outputs from the 3-D Slicer software, respectively.
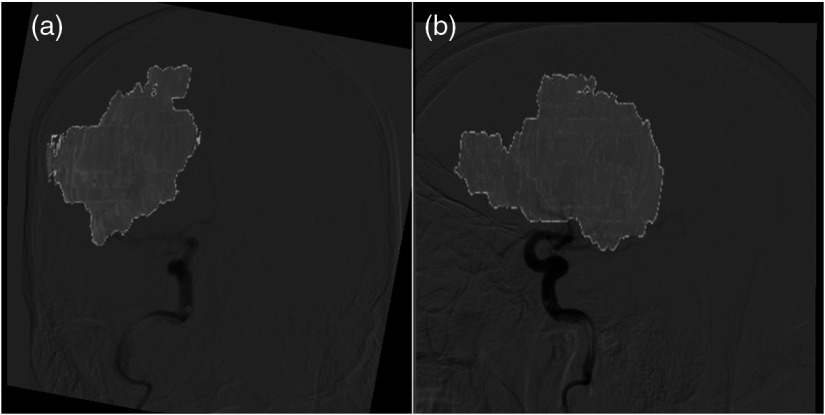
Exported images showing infarct core and skull were registered to the DSA images used to generate the API maps. MATLAB’s build in geometric registration tool was used for this and the registration was driven by the skull formation within the DSA and segmented infarct FLAIR MRI images. For this portion of the study, registration parameters utilized were an affine transformation, linear interpolation, and a multimodal Mattes method similarity metric. This metric is specifically designed for registration across different imaging modalities by calculating the joint probability distribution of pixels sampled in each image to determine where pixels map to across images.25 This particular multimodal method has been tested in a previous study between CT and MRI images.20 Additionally, a one-plus-one evolutionary optimizer was used with an initial search radius of , a minimum search radius of , a search radius growth factor of 1.65, and a maximum number of 2000 optimizer iterations. Registration of these images and removal of the skull region from the FLAIR MRI image is demonstrated in Fig. 6. Following registration, ground truth infarct and healthy tissue labels were created for each ROI within the DSA images based on the overlap of infarct in the FLAIR MRI images. In the event that a single ROI contained a combination of infarct and healthy tissue, it was labeled as infarct positive only if more that 10% of the region was filled with infarct. This cutoff was set to impose strict identification of any infarct tissue present but also account for small breaches in the ROI caused by infarct and healthy tissue interfaces.
Fig. 6.
Overlay of infarct core onto DSA images following exported FLAIR MRI infarct image registration with DSA images. (a), (b) Overlays from the AP and lateral views, respectively.
2.4. Support Vector Machine Infarct Core Classification
Relative difference values between contralateral hemisphere ROIs for each API parameter were plotted against each other, two parameters at a time. In order to determine the optimal separation plane for labeling infarct core and healthy tissue, MATLAB’s built in unsupervised machine learning support vector machine (SVM) was used. SVMs generate a hyperplane at the region that best separates data into two binary classes and in this case that is infarct core and healthy tissue. The SVM utilizes support vectors to generate this hyperplane between the relative difference values for each API parameter plotted. The support vectors are chosen as the data points closest to the separation plane that creates the largest margin between the two classes. For this study, the hyperplane was generated for each grouping of API parameters using 289 healthy data points and 211 infarct data points for the AP view and 327 healthy and 173 infarct data points for the lateral view. Following the generation of the hyperplane for each grouping of API parameters, calculations of how accurate the SVM was in predicting infarct and healthy tissue were performed for each API parameter pairing. This accuracy determination was conducted using a 10-fold cross-validation method where the sample set is partitioned into 10 equal sized subsamples with 9 subsamples being used for training the model and 1 subsample being used for testing. The validation process is repeated 10 times, alternating which subsamples are used for training and testing. Additionally, receiver operator characteristic (ROC) curves were generated for each grouping of API parameters to indicate that two API parameters are optimal in classifying infarct core through the area under the receiver operator characteristic curve (AUROC) calculations. The SVM was run 20 total times since it is possible different support vectors could be chosen for each run when generating the optimal classification hyperplane. Accuracy results from each of these 20 runs were averaged together to account for any variability in the support vectors used to generate the classification hyperplane. 95% confidence intervals were determined for the accuracies and AUROC for each grouping of API parameters that were plotted against each other.
Following pooling of all patient data for training and testing, data from individual patients were grouped and tested on. This method involved training the SVM model on the previously mentioned API groupings from 24 patients and testing the model on the remaining patient to determine the accuracy of identifying infarct regions in that particular patient. Training and testing of the model for the same patient was conducted 20 times to take into account any variability in selection of the support vectors use in generating the classification hyperplane and classification accuracies were averaged together. This method of training on 24 patients and testing on the remaining patient was repeated so infarct classification accuracies could be determined for each patient individually. This method was conducted for both the AP and lateral views.
3. Results
Basic demographics and clinical results for the 25 patients in this study are represented in Table 1. For the entirety of the dataset, the mean age for all patients was and 48% (12/25) of patients were male. The median NIHSS score was 14. The majority of all occlusions that occurred (60%) were within the middle cerebral artery. The median time from onset of stroke symptoms until initial stroke protocol imaging was 157 min. Median time (interquartile range) from initial stroke protocol imaging to recanalization was 77 (43 to 114) min. Recanalization procedures resulted in TICI scores of 2b and 3 in 40% and 60% of the cases, respectively.
Table 1.
Characteristics of all 25 LVO AIS patients included within the study. Continuous variables, such as age, are displayed with the summary statistics mean, standard deviation, median, and interquartile range. Discrete variables, such as recanalization TICI scoring, are displayed as the fraction and percentage of patients with that particular score.
| Characteristic | Mean | Standard deviation | Median | Interquartile range |
|---|---|---|---|---|
| Age (years) | 67.2 | 10.2 | 65 | 60 to 72 |
| NIHSS score | 14.0 | 8.0 | 14 | 8 to 20 |
| Time from onset of symptoms to initial stroke imaging (min) | 156.9 | 86.2 | 132 | 120 to 153 |
| Time from onset of symptoms to recanalization (min) | 273.3 | 152.8 | 221 | 172 to 326 |
| Time from initial stroke imaging to recanalization (min) |
116.4 |
138.0 |
77 |
43 to 114 |
| |
Percentage |
Fraction |
||
| Sex (male and female) | 48.0, 52.0 | 12/25, 13/25 | ||
| Middle cerebral artery occlusion | 60.0 | 15/25 | ||
| Posterior cerebral artery occlusion | 12.0 | 3/25 | ||
| Anterior cerebral artery occlusion | 8.0 | 2/25 | ||
| Internal carotid artery occlusion | 20.0 | 5/25 | ||
| TICI 2b | 40.0 | 10/25 | ||
| TICI 3 | 60.0 | 15/25 | ||
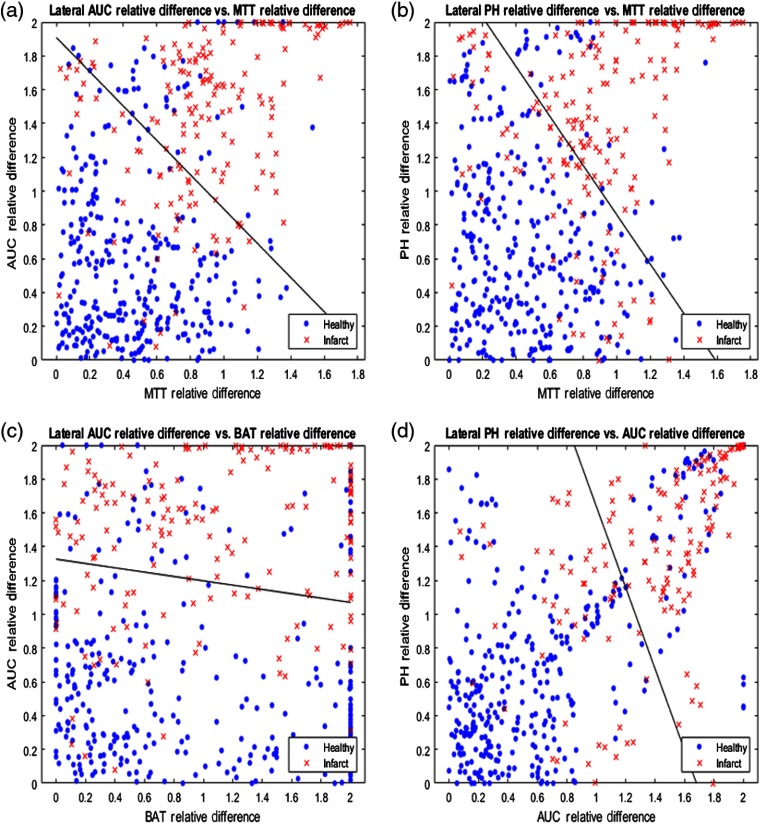
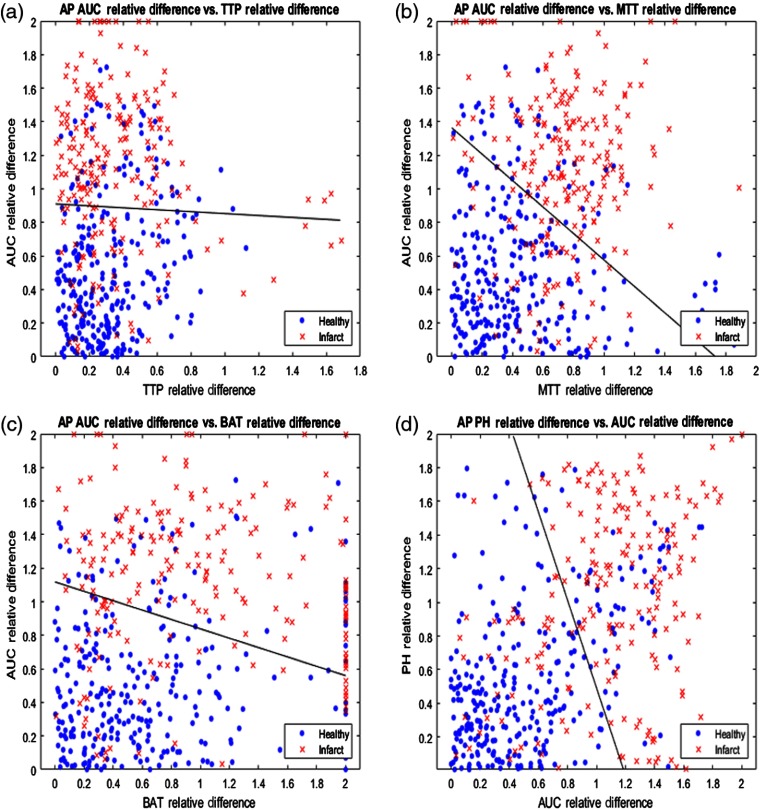
The relative differences for each pair of API parameters were plotted against each other for the lateral view and the four most accurate pairings are displayed in Fig. 7. Additionally, the solid black line in each subplot of Fig. 7 demonstrates the SVM determined hyperplane that best separates the data points into infarct core and healthy tissue. Similarly, relative differences between each paring of API parameters were plotted for the AP view and the four most accurate pairings are represented in Fig. 8. 95% confidence intervals for the accuracy of the SVM determined hyperplane in classifying infarct core and healthy tissue regions are shown in Table 2 for all parings of API parameters.
Fig. 7.
(a) AUC relative hemisphere differences plotted against MTT relative differences, (b) PH relative differences plotted against MTT relative differences, (c) AUC relative differences plotted against BAT relative differences, and (d) PH relative differences plotted against AUC relative differences for the lateral view. Note the solid black line in each figure, which is the hyperplane created by the SVM to best classify data as infarct core or healthy tissue.
Fig. 8.
(a) AUC relative hemisphere differences plotted against TTP relative differences, (b) AUC relative differences plotted against MTT relative differences, (c) AUC relative differences plotted against BAT relative differences, and (d) PH relative differences plotted against AUC relative differences for the AP view. Note the solid black line in each figure, which is the hyperplane created by the SVM to best classify data as infarct core or healthy tissue.
Table 2.
Accuracies of all pairings of API parameters in classification of infarct and healthy tissue using an SVM. The average accuracies are calculated from 20 separate testing batches using the SVM. All average accuracies are represented as 95% confidence intervals.
| Plotted API parameters | Lateral view accuracy | AP view accuracy |
|---|---|---|
| TTP versus MTT | ||
| TTP versus BAT | ||
| TTP versus AUC | ||
| TTP versus PH | ||
| MTT versus BAT | ||
| MTT versus AUC | ||
| MTT versus PH | ||
| BAT versus AUC | ||
| BAT versus PH | ||
| AUC versus PH |
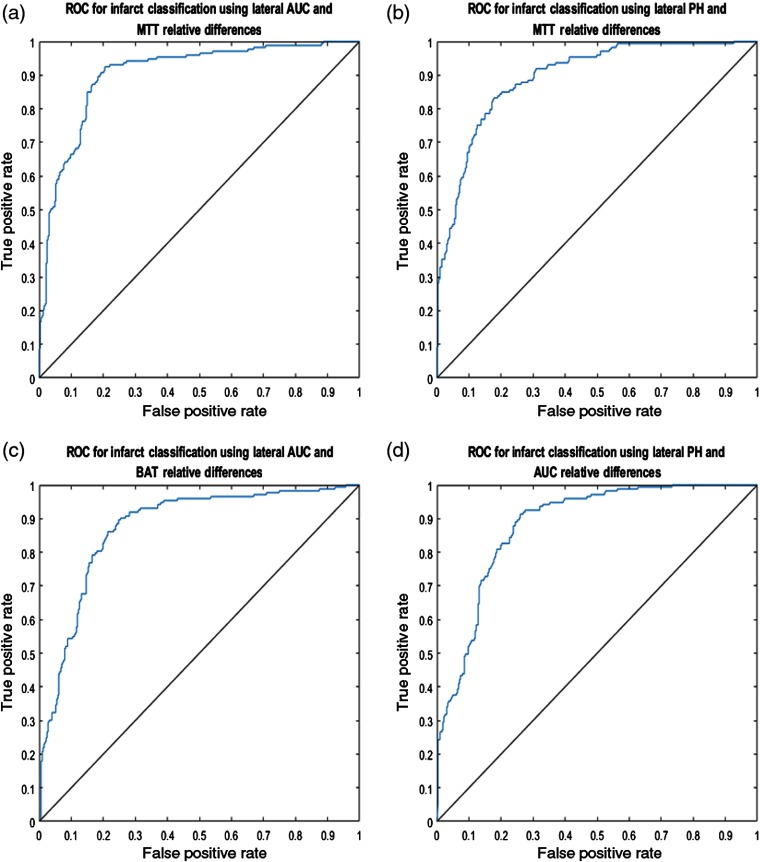
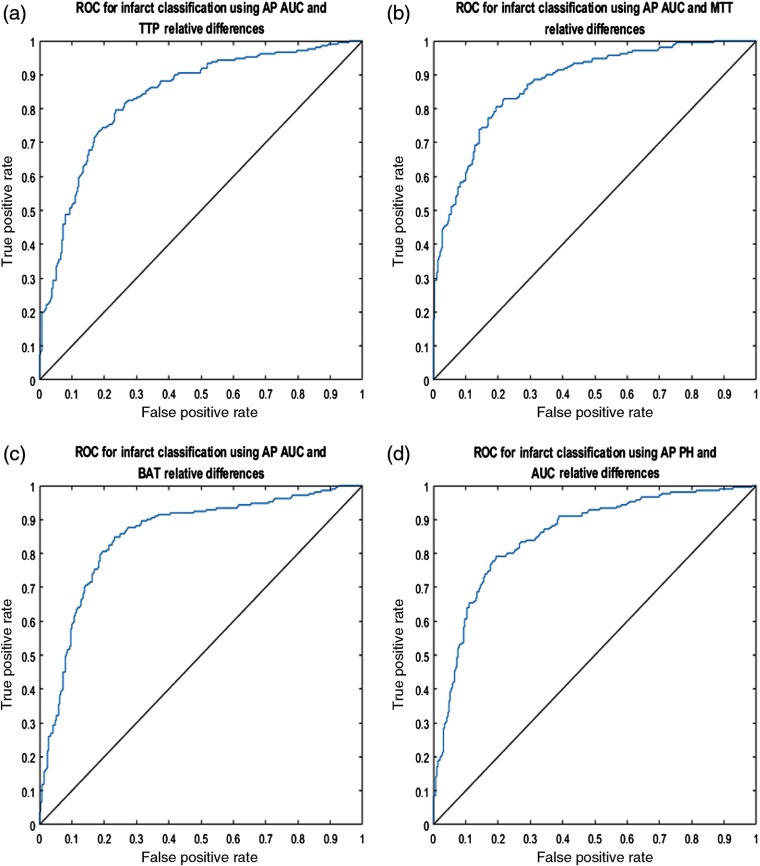
ROC curves were subsequently generated for the lateral and AP view’s four most accurate pairings of API parameters in classifying infarct core and healthy tissue. Figures 9 and 10 represent the ROC curves for these optimal API parameter pairings for the lateral and AP views, respectively. 95% confidence intervals for the AUROC for each respective parameter pairing for both the lateral and AP view are represented in Table 3.
Fig. 9.
ROC curves for the predicted lateral view classification of infarct core and healthy tissue based on the indicated API parameters. Mean AUROC for each respective subfigure are: (a) 0.9038, (b) 0.8946, (c) 0.8725, and (d) 0.8815.
Fig. 10.
ROC curves for the predicted AP view classification of infarct core and healthy tissue based on the indicated API parameters. Mean AUROC for each respective subfigure are: (a) 0.8354, (b) 0.8759, (c) 0.8725, and (d) 0.8517.
Table 3.
AUROC values of all pairings of API parameters in classification of infarct and healthy tissue using an SVM. The average AUROC values are calculated from 20 separate testing batches using the SVM. All average AUROC values are represented as 95% confidence intervals. Note that the 95% confidence levels of 0 are due to little to no variation across the generation of each curve.
| Plotted API parameters | Lateral view AUROC | AP view AUROC |
|---|---|---|
| TTP versus MTT | ||
| TTP versus BAT | ||
| TTP versus AUC | ||
| TTP versus PH | ||
| MTT versus BAT | ||
| MTT versus AUC | ||
| MTT versus PH | ||
| BAT versus AUC | ||
| BAT versus PH | ||
| AUC versus PH |
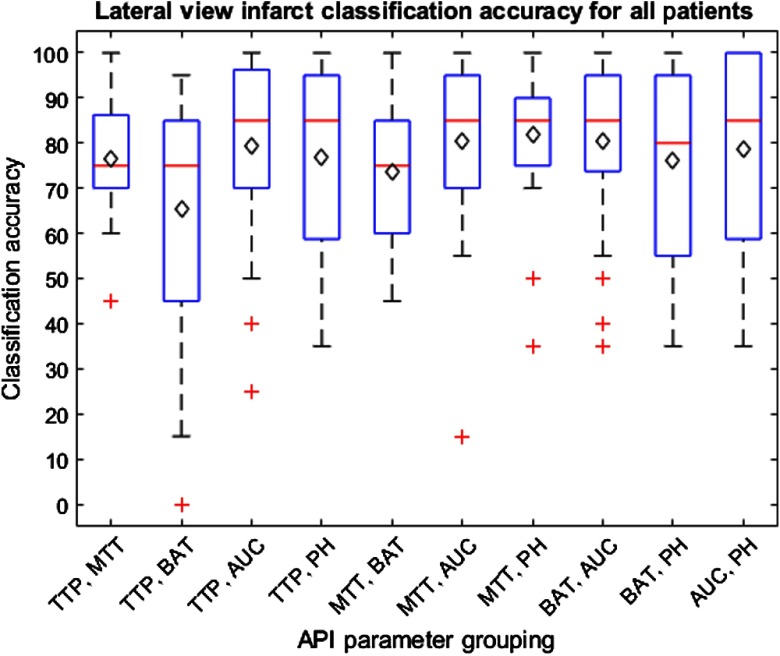
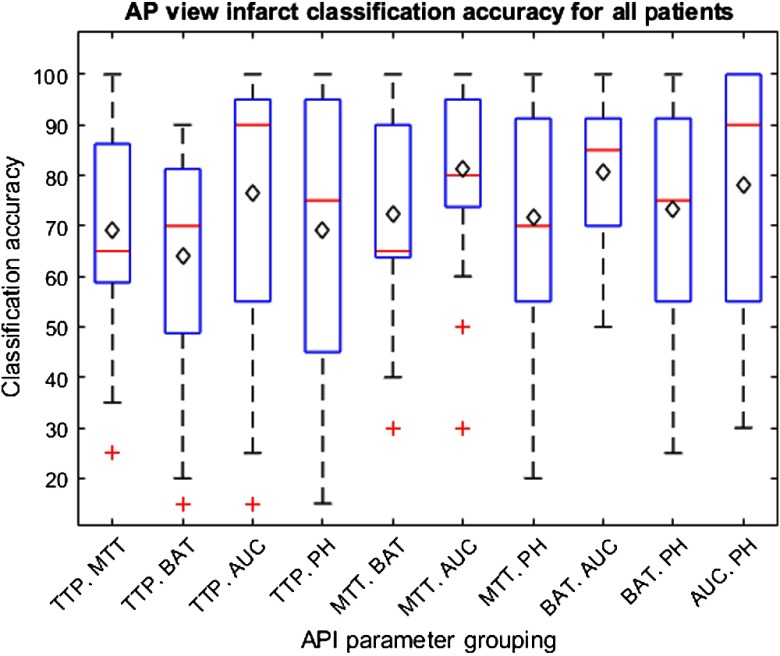
The results for training on 24 patients and testing on the remaining patient to determine classification accuracies for each patient are indicated within Figs. 11 and 12 for the lateral and AP views, respectively. These box and whisker plots indicate the distribution of accuracies in classifying infarct tissue for all patients using each grouping of API parameters. The average classification accuracy for all patients is indicated by the black diamond in each box.
Fig. 11.
Box and whisker plot indicating the distribution of infarct core classification accuracies for individual patients utilizing all 10 API parameter groupings from the lateral view. Average infarct classification accuracy for individual patients is indicated by the black diamond. Outliers are indicated by red crosses. Note that narrow interquartile ranges indicate parameter groupings are successful to similar degrees across all patients.
Fig. 12.
Box and whisker plot indicating the distribution of infarct core classification accuracies for individual patients utilizing all 10 API parameter groupings from the AP view. Average infarct classification accuracy for individual patients is indicated by the black diamond. Outliers are indicated by red crosses. Note that narrow interquartile ranges indicate parameter groupings are successful to similar degrees across all patients.
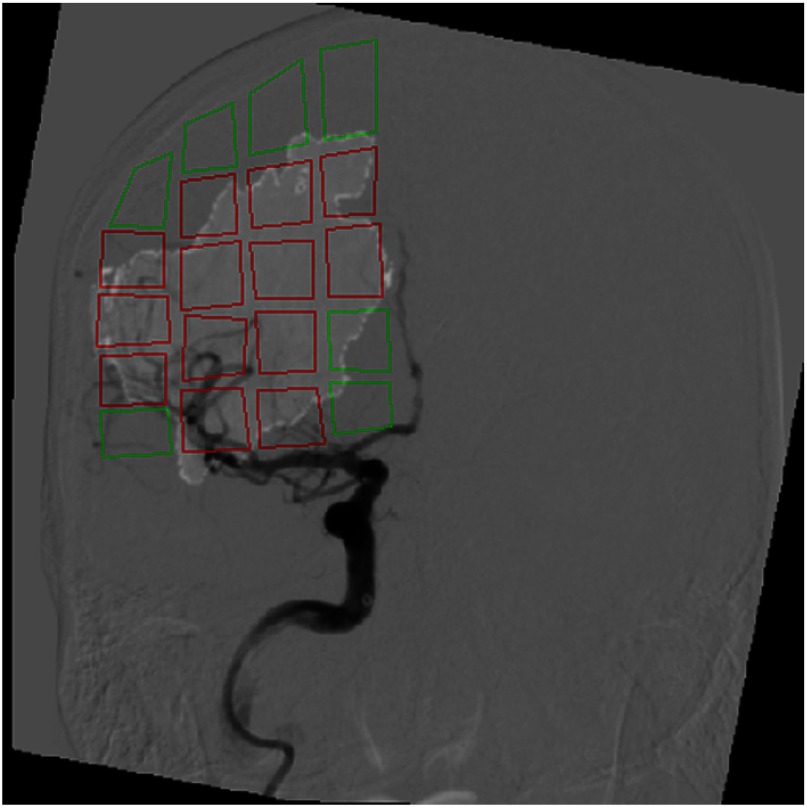
Figure 13 indicates the classification of ROIs within a particular patient as infarct or healthy tissue. The AUC and MTT API parameter hyperplane for the AP view, generated using data from the other 24 patients, was utilized to classify these ROIs. Within this figure, regions outlined in red and green represent infarct and healthy tissue, respectively.
Fig. 13.
Overlay of infarct core onto an AP view DSA image following ROI classification as infarct or healthy tissue. This classification utilized the API parameters AUC and MTT to label infarct and healthy tissue. The red and green ROIs represent regions labeled as infarct and healthy tissue, respectively. Note the regions with very minute amounts of infarct () were labeled as healthy tissue.
4. Discussion
This study provides an understanding regarding the ability of API to accurately locate regions of infarct core within LVO AIS patients through comparisons with FLAIR MRI ground truth infarct labels. This study demonstrates that API can be used to monitor blood flow changes and predict infarct core with very high sensitivity (AUROC values mostly above 0.75). During diagnosis and intervention, it is very important to know precisely the extent of infarct core and penumbra due to perfusion deficits. Other studies have indicated that accurate location of infarct core within sufficient time periods following an occlusion can directly predict the clinical outcome of a patient.26 Misidentification of the location and extent of infarct core could additionally lead to the mislabeling of penumbra tissue as healthy tissue. This could affect the therapeutic decision to not perform the required mechanical thrombectomy and prevent salvageable tissue from converting to infarct core.27 Additionally, accurate real-time assessment of infarct core could prevent the occurrence of a reperfusion injury, which occurs when permanently injured tissue and vasculature is reintroduced to oxygenated blood.28
Through utilization of an SVM in classifying regions as infarct core or healthy tissue using the lateral view, the optimal pairing of API parameters was found to be PH and MTT. This combination of parameters was found to have the highest mean accuracy of 0.8125. Additionally, groupings of MTT with PH, AUC with BAT, and AUC with PH where found to all have accuracies above 0.8000. The parameters of AUC and PH are commonly seen with the highest accuracy in this study. This is mostly likely due to intensity changes of the TDC that occur in the regions of infarct core. Within these infarct regions, there will be little to no flow of contrast media into the microvessels feeding tissue, potentially due to vessel damage.29 This indicates the peak, or PH, of the TDC will decrease in intensity. Additionally, due to a decrease in the height of the curve and little to no contrast entering the region, the area underneath the TDC should decrease as well. MTT is frequently seen as an identifier of infarct core as well since any contrast media that enters regions of dead tissue will slowly progress through the region due to the little amounts of blood flow present.29 This further indicates the full-width half-max of the TDC extending in width, which corresponds to an increased MTT parameter. Similar to the accuracy values calculated, the same API parameter pairings were found to have the highest AUROC values. This further indicates that the previously mentioned pairings are optimal in acting as classifiers in differentiating infarct core from healthy tissue.
When analyzing the results from the AP view, it was found that the AUC against MTT was the optimal grouping in classifying infarct core and healthy tissue. Similarly, AUC against PH and AUC against BAT where again within the top four classification pairings, each with accuracies of about 0.7900. The AUROC values further indicate these pairings of parameters to be the most successful classifiers. This is represented through the AUROC values for each of the three pairing of API parameters previously mentioned.
Through used of an SVM to determine the accuracies of infarct classification for each patient, it can be determined that the MTT against PH parameter is again the most accurate for the lateral view infarct classification. Additionally, the AUC against MTT parameter is the most accurate in determining infarct core for the AP view. This is indicated within Figs. 11 and 12 by average patient classification accuracies when utilizing the previously mentioned groupings of parameters. Furthermore, the interquartile ranges for the aforementioned groupings of API parameters, for their respective views, are more narrow compared to the remainder of groupings. This narrow interquartile range indicates that these metrics are just as effective across the majority of patients and only in a few patients is this method less effective. In addition, for the MTT and PH grouping for the lateral view and AUC and MTT grouping for the AP view, 75% of the individual patient accuracies lie above 75% further enforcing this method is effective in most patients with a few outliers where the method is ineffective.
When viewing the results of the lateral and AP views together, it can be seen that the unison of TTP and BAT is the least accurate identifier and these two parameters are typically involved in the lower accuracy classifications. These parameters together most likely have the lowest classification accuracy due to the direct influence of TTP on BAT. Overall, the TTP parameter tends to have lower accuracies and since the BAT parameter is determined from the time, in which the TDC reaches 10% its maximum height, it is intuitive that the BAT parameter would have lower accuracies as well.21 Additionally, when comparing the results from the AP and lateral views, it can be seen the lateral view typically has higher accuracies and AUROCs. This discrepancy in accuracies across views is likely due to the increased amount of overlapping vasculature in the AP view compared to the lateral view. From the AP view perspective, anterior and posterior vasculature is overlapped meaning regions of the anterior cerebral artery and posterior cerebral artery cannot be differentiated at times. From the lateral view, however, the three main arterial branches appear in a more spacious manner allowing for differentiation between each of the branches and further allowing for less overlapping vasculature in general. Additionally, it is worth noting that all API parameter groupings will always differ between the AP and lateral views in regards to the threshold classification hyperplane determined by the SVM. This is due to the different views having different amounts of overlapping vasculature, meaning calculated API values and subsequent relative differences between hemispheres will differ between views.
Additionally, the normalization technique used in this study increased the accuracies of the results. Within previously conducted studies, it was found that the rate of contrast injection could significantly influence the API parameters that were calculated.21 Since clinicians inject contrast by hand, this would result in different rates of contrast flow within each hemisphere of the brain. By dividing the entirety of the API maps by the arterial inlet values for each specific patient, normalization of the maps was achieved to a degree that allowed for hemispherical comparisons. Had normalization not been conducted, there would have been no standardized thresholds in classification of infarct core due to not only different rates of injection but also due to different rates of blood flow in contralateral hemispheres.
Limitations of this study include the frame rate in which the DSA sequences were acquired prior to loading them into the API software. The rate in which these sequences were taken was 3 frames per s. This frame rate indicates that fewer points are being used to generate the TDC using the gamma variate fit function meaning the function is less accurate than it would be if images were taken at a rate of 19 frames per s. In addition, the API software used is for two-dimensional images, which leads to an overlap of vasculature when generating the API maps. This limits the accuracy of the API values calculated within both infarct and healthy tissue regions in the event of a main artery being present in front of, or behind the infarct core. Infarct core will typically have higher time related parameters, but in a two-dimensional image, if the main artery is in front of the infarct core the values will be significantly decreased since the contrast flowing through the artery will significantly outweigh the contrast flow measurements in the surrounding microvessels. Another limitation to this study is the utilized normalization method may not be the most optimal normalization than can be utilized. This is because injections conducted at a later time within the DSA scan would lead to an additive variability in the API maps as opposed to a scaling factor.
Furthermore, within this study, only groupings of two API parameters were utilized in infarct core classification. This was done for the purpose of easy visualization for clinical implementation. However, it is possible that groupings of more than two API parameters could lead to more accurate results in infarct core classification. Additionally, a further limitation of this study is that there is an uneven sample size of infarct and healthy tissue data points when training and testing the SVM. Particularly for the lateral view, there are only 173 infarct data points compared to the 327 healthy data points, which could lead to classification errors due to fewer infarct training data. Another limitation to this study is that contralateral hemisphere comparisons of data points may not always yield correct results. In the event a patient has bilateral infarctions, tissue is diseased in both hemispheres, or there are anatomical variances across hemispheres and the comparison of API data points might not be different to a significant degree to correctly identify infarct tissue. This can additionally be seen as a drawback to CTP since bilateral infarctions in contralateral hemispheres are not always identified correctly.30
An additional limitation to the study is the FLAIR MRI images used for the ground truth infarct labels had a slice thickness of 5 mm. This means that interpolation had to be performed when regenerating the MRI images further lowering the accuracy of the true location of infarct tissue. To increase the accuracy of these ground truth labels, FLAIR MRI images need to be acquired with a thinner slice thickness or CT perfusion infarct predictions could be used in its place. Another limitation was that the accuracy of image registration between the DSA and FLAIR MRI images was not calculated since there is no ground truth to relate. In the event there is any error in the registration between these images, ground truth classification errors of infarct tissue could be introduced to the study. A further limitation to this study is that API analysis was not conducted on prethrombectomy DSA images since the occlusion obstructed direct contrast injection. A comparison of the calculated infarct tissue between pre- and postthrombectomy images could allow for determination of any potential infarct growth that occurs. One final limitation was the amount of motion that occurs during DSA acquisition. This patient motion introduces noise into the image, which causes fluctuations in image intensity values between sequential images in a sequence. Since the density curves are generated via intensity values in subsequence images, any noise introduced into the image will impact the accuracy of the generated TDC.
5. Conclusion
API has shown the ability to accurately classify regions of infarct core and healthy tissue based on contralateral hemisphere comparisons of hemodynamic parameter values. This method has the potential to be of great clinical benefit by determining infarct core location and growth in real time, which could influence intraoperative decision making. Further validation of this method is warranted.
Acknowledgments
The authors would like to thank Ariana B. Allman, Alexander R. Podgorsak, and Mohammad Mahdi Shiraz Bhurwani for their assistance in the completion of this project. This research was partially funded by a research grant provided by Canon Medical Systems USA, Inc. The company was not involved in the collection, analysis, interpretation, or drafting of this manuscript.
Biography
Biographies of the authors are not available.
Disclosure
Maxim Mokin is a consultant for Canon, Cerenovus, and Penumbra. Kenneth V. Snyder is consulting and teaching for Canon Medical Systems Corporation, Penumbra Inc., Medtronic, and Jacobs Institute and also the co-founder of the Neurovascular Diagnostics, Inc. Adnan H. Siddiqui was supported by the research grant: NIH/NINDS 1R01NS091075 as a co-investigator for “Virtual Intervention of Intracranial Aneurysms;” financial interest/investor/stock options/ownership: Amnis Therapeutics, Apama Medical, Blink TBI Inc., Buffalo Technology Partners Inc., Cardinal Consultants, Cerebrotech Medical Systems, Inc. Cognition Medical, Endostream Medical Ltd., Imperative Care, International Medical Distribution Partners, Neurovascular Diagnostics Inc., Q’Apel Medical Inc., Rebound Therapeutics Corp., Rist Neurovascular Inc., Serenity Medical Inc., Silk Road Medical, StimMed, Synchron, Three Rivers Medical Inc., Viseon Spine Inc. and as a consultant/advisory board: Amnis Therapeutics, Boston Scientific, Canon Medical Systems USA Inc., Cerebrotech Medical Systems Inc., Cerenovus, Corindus Inc., Endostream Medical Ltd., Guidepoint Global Consulting, Imperative Care, Integra LifeSciences Corp., Medtronic, MicroVention, Northwest University–DSMB Chair for HEAT Trial, Penumbra, Q’Apel Medical Inc., Rapid Medical, Rebound Therapeutics Corp., Serenity Medical Inc., Silk Road Medical, StimMed, Stryker, Three Rivers Medical, Inc., VasSol, and W.L. Gore & Associates; as a principal investigator/steering comment of the following trials: Cerenovus NAPA and ARISE II; Medtronic SWIFT PRIME and SWIFT DIRECT; MicroVention FRED & CONFIDENCE; MUSC POSITIVE; and Penumbra 3-D Separator, COMPASS, and INVEST. Jason M. Davies was supported by the research grant from the National Center for Advancing Translational Sciences of the National Institutes of Health under Award No. KL2TR001413 to the University at Buffalo. Speakers’ bureau: Penumbra; Honoraria: Neurotrauma Science, LLC; shareholder/ownership interests: RIST Neurovascular. Elad I. Levy is a shareholder/ownership interests: NeXtGen Biologics, RAPID Medical, Claret Medical, Cognition Medical, Imperative Care (formerly the Stroke Project), Rebound Therapeutics, StimMed, Three Rivers Medical; National Principal Investigator/Steering Committees: Medtronic (merged with Covidien Neurovascular) SWIFT Prime and SWIFT Direct Trials; Honoraria: Medtronic (training and lectures); as a consultant for Claret Medical, GLG Consulting, Guidepoint Global, Imperative Care, Medtronic, Rebound, StimMed; Advisory Board: Stryker (AIS Clinical Advisory Board), NeXtGen Biologics, MEDX, Cognition Medical, Endostream Medical; and as a site principal investigator for CONFIDENCE study (MicroVention), STRATIS Study—Sub I (Medtronic).
Contributor Information
Ryan A. Rava, Email: ryanrava@buffalo.edu.
Maxim Mokin, Email: mokin@health.usf.edu.
Kenneth V. Snyder, Email: ksnyder@ubns.com.
Muhammad Waqas, Email: mwaqas@ubns.com.
Adnan H. Siddiqui, Email: asiddiqui@ubns.com.
Jason M. Davies, Email: jdavies@ubns.com.
Elad I. Levy, Email: eladlevy@buffalo.edu.
Ciprian N. Ionita, Email: cnionita@buffalo.edu.
References
- 1.Benjamin E. J., et al. , “Heart disease and stroke statistics—2017 update: a report from the American Heart Association,” Circulation 135, e146 (2017). 10.1161/CIR.0000000000000485 [DOI] [PMC free article] [PubMed] [Google Scholar]
- 2.Mozaffarian D., et al. , “Heart disease and stroke statistics-2016 update a report from the American Heart Association,” Circulation 133, e38–e360 (2016). 10.1161/CIR.0000000000000350 [DOI] [PubMed] [Google Scholar]
- 3.Dani K. A., et al. , “Computed tomography and magnetic resonance perfusion imaging in ischemic stroke: definitions and thresholds,” Ann. Neurol. 70, 384–401 (2011). 10.1002/ana.v70.3 [DOI] [PubMed] [Google Scholar]
- 4.Krupinski J., et al. , “Role of angiogenesis in patients with cerebral ischemic stroke,” Stroke 25, 1794–1798 (1994). 10.1161/01.STR.25.9.1794 [DOI] [PubMed] [Google Scholar]
- 5.Goyal M., Menon B. K., Derdeyn C. P., “Perfusion imaging in acute ischemic stroke: let us improve the science before changing clinical practice,” Radiology 266, 16–21 (2013). 10.1148/radiol.12112134 [DOI] [PubMed] [Google Scholar]
- 6.Olsen T. S., “Regional cerebral blood flow after occlusion of the middle cerebral artery,” Acta Neurol. Scand. 73, 321–337 (1986). 10.1111/ane.1986.73.issue-4 [DOI] [PubMed] [Google Scholar]
- 7.Guenego A., et al. , “Hypoperfusion ratio predicts infarct growth during transfer for thrombectomy,” Ann. Neurol. 84, 616–620 (2018). 10.1002/ana.25320 [DOI] [PubMed] [Google Scholar]
- 8.Koenig M., et al. , “Perfusion CT of the brain: diagnostic approach for early detection of ischemic stroke,” Radiology 209, 85–93 (1998). 10.1148/radiology.209.1.9769817 [DOI] [PubMed] [Google Scholar]
- 9.Kamran S., et al. , “Significance of hyperintense vessels on FLAIR MRI in acute stroke,” Neurology 55, 265–269 (2000). 10.1212/WNL.55.2.265 [DOI] [PubMed] [Google Scholar]
- 10.Miles K., Eastwood J. D., Konig M., Multidetector Computed Tomography in Cerebrovascular Disease: CT Perfusion Imaging, CRC Press, London: (2007). [Google Scholar]
- 11.Doubal F. N., Dennis M. S., Wardlaw J. M., “Characteristics of patients with minor ischaemic strokes and negative MRI: a cross-sectional study,” J. Neurol. Neurosurg. Psychiatr. 82, 540–542 (2011). 10.1136/jnnp.2009.190298 [DOI] [PubMed] [Google Scholar]
- 12.Ashikaga R., Araki Y., Ishida O., “MRI of head injury using FLAIR,” Neuroradiology 39, 239–242 (1997). 10.1007/s002340050401 [DOI] [PubMed] [Google Scholar]
- 13.Akins P., et al. , “Complications of endovascular treatment for acute stroke in the SWIFT trial with solitaire and Merci devices,” Am. J. Neuroradiol. 35, 524–528 (2014). 10.3174/ajnr.A3707 [DOI] [PMC free article] [PubMed] [Google Scholar]
- 14.Laviña B., “Brain vascular imaging techniques,” Int. J. Mol. Sci. 18, 70 (2017). 10.3390/ijms18010070 [DOI] [PMC free article] [PubMed] [Google Scholar]
- 15.Hess O. M., et al. , “Determination of coronary flow reserve by parametric imaging,” Circulation 82, 1438–1448 (1990). 10.1161/01.CIR.82.4.1438 [DOI] [PubMed] [Google Scholar]
- 16.Gallagher J. H., et al. , “Parametric imaging of digital subtraction angiography studies for renal transplant evaluation,” Proc. SPIE 0314, 229–234 (1981). 10.1117/12.933051 [DOI] [Google Scholar]
- 17.Sugg R., et al. , “Recanalization vs reperfusion as vascular end points in acute ischemic stroke endovascular intervention,” J. NeuroInterv. Surg. 3, 1–2 (2011). 10.1136/neurintsurg-2011-010097.321990777 [DOI] [Google Scholar]
- 18.Hu H. H., et al. , “Assessment of cerebral blood perfusion reserve with acetazolamide using 3D spiral ASL MRI: preliminary experience in pediatric patients,” Magn. Reson. Imaging 35, 132–140 (2017). 10.1016/j.mri.2016.08.019 [DOI] [PubMed] [Google Scholar]
- 19.Maknojia S., et al. , “Visualization of brain shift corrected functional magnetic resonance imaging data for intraoperative brain mapping,” World Neurosurg. X 2, 100021 (2019). 10.1016/j.wnsx.2019.100021 [DOI] [PMC free article] [PubMed] [Google Scholar]
- 20.Muthukumaran D., Sivakumar M., “Medical image registration: a MATLAB-based approach,” Int. J. Sci. Res. Comput. Sci. Eng. Inf. Technol. 2, 29–34 (2017). [Google Scholar]
- 21.Ionita C. N., et al. , “Effect of injection technique on temporal parametric imaging derived from digital subtraction angiography in patient specific phantoms,” Proc. SPIE 9038, 90380L (2014). 10.1117/12.2041347 [DOI] [PMC free article] [PubMed] [Google Scholar]
- 22.Mokin M., et al. , “Predictive value of RAPID assessed perfusion thresholds on final infarct volume in SWIFT PRIME (Solitaire With the Intention for Thrombectomy as Primary Endovascular Treatment),” Stroke 48, 932–938 (2017). 10.1161/STROKEAHA.116.015472 [DOI] [PubMed] [Google Scholar]
- 23.Wintermark M., et al. , “Perfusion-CT assessment of infarct core and penumbra: receiver operating characteristic curve analysis in 130 patients suspected of acute hemispheric stroke,” Stroke 37, 979–985 (2006). 10.1161/01.STR.0000209238.61459.39 [DOI] [PubMed] [Google Scholar]
- 24.Isa I., et al. , “Assessing intensity of white matter hyperintensity and normal appearing white matter in healthy adults,” in IEEE EMBS Conf. Biomed. Eng. and Sci. (IECBES), Kuala Lumpur (2016). 10.1109/IECBES.2016.7843502 [DOI] [Google Scholar]
- 25.Mattes D., et al. , “PET-CT image registration in the chest using free-form deformations,” IEEE Trans. Med. Imaging 22, 120–128 (2003). 10.1109/TMI.2003.809072 [DOI] [PubMed] [Google Scholar]
- 26.Gasparotti R., et al. , “Perfusion CT in patients with acute ischemic stroke treated with intra-arterial thrombolysis: predictive value of infarct core size on clinical outcome,” Am. J. Neuroradiol. 30, 722–727 (2009). 10.3174/ajnr.A1439 [DOI] [PMC free article] [PubMed] [Google Scholar]
- 27.König M., “Brain perfusion CT in acute stroke: current status,” Eur. J. Radiol. 45, S11–S22 (2003). 10.1016/S0720-048X(02)00359-5 [DOI] [PubMed] [Google Scholar]
- 28.Kalogeris T., et al. , “Cell biology of ischemia/reperfusion injury,” in International Review of Cell and Molecular Biology, Jeon K., Ed., pp. 229–317, Elsevier, Amsterdam, Netherlands: (2012). [Google Scholar]
- 29.Birenbaum D., Bancroft L. W., Felsberg G. J., “Imaging in acute stroke,” West. J. Emerg. Med. 12, 67 (2011). [PMC free article] [PubMed] [Google Scholar]
- 30.MacLellan A., Boyle K., “Computed tomography perfusion abnormalities in bilateral thalamic infarction due to artery of percheron occlusion,” J. Stroke Cerebrovasc. Dis. 26, e170–e171 (2017). 10.1016/j.jstrokecerebrovasdis.2017.05.017 [DOI] [PubMed] [Google Scholar]


