Ovarian cancer care at a high-performing hospital is an independent predictor of improved survival, and barriers to access disproportionately affect patients according to sociodemographic characteristics.
Abstract
OBJECTIVE:
To validate the observed/expected ratio for adherence to ovarian cancer treatment guidelines as a risk-adjusted measure of hospital quality care, and to identify patient characteristics associated with disparities in access to high-performing hospitals.
METHODS:
This was a retrospective population-based study of stage I–IV invasive epithelial ovarian cancer reported to the California Cancer Registry between 1996 and 2014. A fit logistic regression model, which was risk-adjusted for patient and disease characteristics, was used to calculate the observed/expected ratio for each hospital, stratified by hospital annual case volume. A Cox proportional hazards model was used for survival analyses, and a multivariable logistic regression model was used to identify independent predictors of access to high-performing hospitals.
RESULTS:
The study population included 30,051 patients who were treated at 426 hospitals: low observed/expected ratio (n=304) 23.5% of cases; intermediate observed/expected ratio (n=92) 57.8% of cases; and high observed/expected ratio (n=30) 18.7% of cases. Hospitals with high observed/expected ratios were significantly more likely to deliver guideline-adherent care (53.3%), compared with hospitals with intermediate (37.8%) and low (27.5%) observed/expected ratios (P<.001). Median disease-specific survival time ranged from 73.0 months for hospitals with high observed/expected ratios to 48.1 months for hospitals with low observed/expected ratios (P<.001). Treatment at a hospital with a high observed/expected ratio was an independent predictor of superior survival compared with hospitals with intermediate (hazard ratio [HR] 1.06, 95% CI 1.01–1.11, P<.05) and low (HR 1.10, 95% CI 1.04–1.16, P<.001) observed/expected ratios. Being of Hispanic ethnicity (odds ratio [OR] 0.85, 95% CI 0.78–0.93, P<.001, compared with white), having Medicare insurance (OR 0.74, 95% CI 0.68–0.81 P<.001, compared with managed care), having a Charlson Comorbidity Index score of 2 or greater (OR 0.91, 95% CI 0.83–0.99, P<.05), and being of lower socioeconomic status (lowest quintile OR 0.41, 95% CI 0.36–0.46, P<.001, compared with highest quintile) were independent negative predictors of access to a hospital with a high observed/expected ratio.
CONCLUSION:
Ovarian cancer care at a hospital with a high observed/expected ratio is an independent predictor of improved survival. Barriers to high-performing hospitals disproportionately affect patients according to sociodemographic characteristics. Triage of patients with suspected ovarian cancer according to a performance-based observed/expected ratio hospital classification is a potential mechanism for expanded access to expert care.
The mortality rate for ovarian cancer has decreased by 33% over the past 40 years owing to a modest decrease in incidence coupled with substantial improvements in treatment.1,2 Treatment advances are reflected in the National Comprehensive Cancer Network's treatment guidelines, which are the accepted standard for quality ovarian cancer care.3–9 Unfortunately, a majority of patients with ovarian cancer do not receive the recommended care, and race, poverty level, and insurance status have been identified as independent predictors of an increased likelihood of treatment that deviates from standard guidelines.3,4,10–13
For ovarian cancer, eliminating sociodemographic disparities and improving outcomes for all segments of the population hinges on universal access to expert care.14–17 Accordingly, a definition of hospital-based expert ovarian cancer care that is both valid and practical is a necessary first step. Although high-volume hospital care (more than 20 cases per year) correlates with adherence to National Comprehensive Cancer Network treatment guidelines, crude case volume alone is an imprecise measure of quality care, and there are relatively few centers with the required caseload.9,18 Recently, Wright et al9 studied 100,725 patients and 1,268 hospitals from the National Cancer Database, and reported that increasing annual case volume and adherence to quality metrics were associated with improved survival outcome.
Our group previously reported a more precise hospital-based quality metric for ovarian cancer care—the observed/expected ratio for adherence to National Comprehensive Cancer Network guidelines—combining structural, process, and outcome measures with risk adjustment for patient population characteristics.8,19,20 There are multiple patient- and disease-related factors that preclude 100% adherence to ovarian cancer treatment guidelines. The observed/expected ratio instrument accounts for differences in case-mix complexity among hospitals and provides a measure of guideline adherence that is adjusted for these confounding factors. The objectives of the current study were to 1) validate the utility of the observed/expected ratio methodology using an expanded California Cancer Registry data set with risk adjustment for patient and disease characteristics and 2) investigate sociodemographic characteristics associated with disparities in access to high-performing hospitals.
METHODS
This was a retrospective population-based study of invasive epithelial ovarian cancer reported to California Cancer Registry between January 1, 1996, and December 31, 2014, with follow-up through 2016 and record linkage to the California Office of Statewide Health Planning and Development database. The study received exempt status by the Institutional Review Board of the University of California, Irvine (UCI 14-66/HS# 2014-1476). The California Cancer Registry is California’s statewide population-based cancer surveillance system that has collected information about tumor characteristics, patient characteristics, and treatment for all cancers diagnosed in California since 1988.21 Standardized data collection and quality control procedures have been in place since that time. Case reporting is estimated to be 99% for the entire state of California, with follow-up completion rates exceeding 95%.22 International Classification of Disease Codes for Oncology based on World Health Organization criteria were used for tumor location and histology. Cases were identified using the Surveillance, Epidemiology, and End Results ovary primary site code (C569).
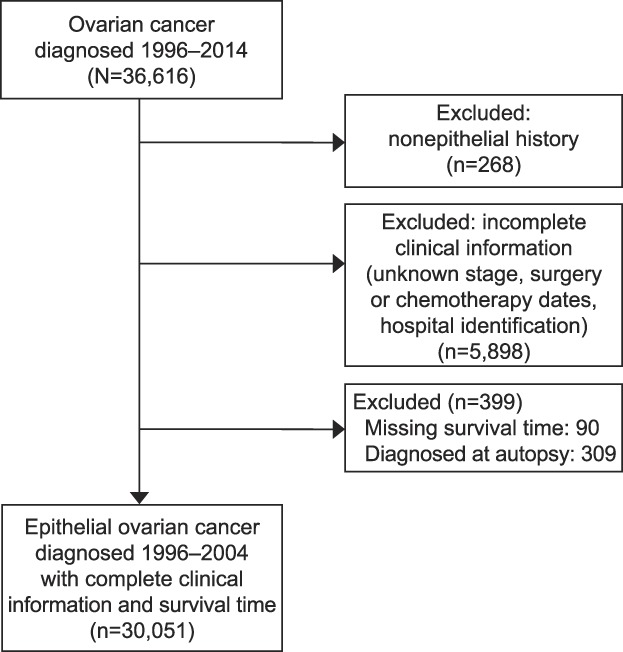
Cases included patients who were aged 18 years or older and were diagnosed with a first or only invasive epithelial ovarian cancer from 1996 to 2014. Those with incomplete clinical information, nonepithelial histologic subtypes, missing International Classification of Disease Codes for Oncology morphology code, or data extracted from autopsy or death certificate only were excluded (Fig. 1). A total of 30,051 patients were included in the final sample for analysis. Age at diagnosis was treated either as a continuous or a categorical variable. Other patient sociodemographic characteristics included race–ethnicity and insurance type. Socioeconomic status was classified into quintiles based on the Yost or Yang score. The Yost score was used for patients diagnosed before 2006 and is a composite index of socioeconomic status based on a principal component analysis of block group level census variables (eg, education, income and occupation).23 The Yang scale is a similar index based on American Community Survey variables at the block group level (for patients who were diagnosed after 2006).24 The Deyo adaptation of the Charlson Comorbidity Index was used a measure of patient comorbidity.25 Comorbidity scores were calculated for each patient using diagnosis codes included in California Office of Statewide Health Planning and Development hospital discharge data before the cancer diagnosis. Charlson Comorbidity Index score was categorized into four groups: 0, 1, 2 or greater, or unknown. Tumor characteristic included stage, tumor grade, and histology. Hospital volume was calculated based on the average annual number of ovarian cancer cases admitted in that hospital and included both surgical and nonsurgical cases. Hospitals with 20 or more cases per year were classified as high-volume; hospitals with fewer than 20 cases per year were considered low-volume.
Fig. 1. STROBE (Strengthening the Reporting of Observational Studies in Epidemiology) exclusion flowchart.
Bristow. Risk-Adjusted Model for Ovarian Cancer Care. Obstet Gynecol 2020.
Adherence to treatment guidelines for ovarian cancer was based on National Comprehensive Cancer Network recommendations for surgery and chemotherapy according to the time period of diagnosis (1996–2014).26–33 Surgical treatment for stages I–IIIB was considered adherent to National Comprehensive Cancer Network guidelines if it included a minimum of oophorectomy, pelvic or para-aortic lymph node biopsy, and omentectomy. A minimum of oophorectomy and omentectomy was considered adherent surgical care for International Federation of Gynecology and Obstetrics stages IIIC–IV disease. For patients with stages IA–IB, grade 1–2 disease, no adjuvant treatment was considered adherent to National Comprehensive Cancer Network guidelines. Administration of multi-agent chemotherapy was considered adherent care for patients with stages IC–IV or grade 3 diseases, and surgery must have preceded chemotherapy for those with stages I–IIIB. For stages IIIC–IV either initial surgery or chemotherapy was characterized as appropriate care. Dichotomous variables, adherence or nonadherence, were created for adherence to surgical guidelines, chemotherapy guidelines, and the overall treatment plan (both surgery and chemotherapy).
Two steps were carried out to calculate the hospital-based observed/expected ratio for adherence to treatment guidelines, which were risk-adjusted for patient and tumor characteristics. Univariate analyses were conducted first to examine the relation between each predictor variable and overall treatment adherence using χ2 test for categorical variable and t test for continuous variable. Model selection was based on univariate analyses augmented by clinical knowledge. Predictors in the final logistic model for overall adherence included only those patient and disease characteristics relevant to treatment received: age at diagnosis, year of diagnosis, Charlson Comorbidity Index score, tumor stage, grade, histology, and size. The c-statistic was used to measure the predictive accuracy of the model (c-statistic=0.79), and Hosmer-Lemeshow test was used to test the calibration of the model and showed that the final logistic model provided adequate fit. In the second step, the final multivariate logistic model was used to estimate the probability of adherence to National Comprehensive Cancer Network overall treatment plan for each patient. Expected adherence for each hospital was calculated by summing the probabilities of adherence for all patients who were treated in that center. Observed adherence for each hospital was calculated as the number of patients who received adherent care in the center. A high observed/expected ratio indicated that the hospital had a higher rate of adherence to the guidelines than would be expected according to its patient mix. Centers with very low case volume tended to have too few cases to calculate a stable observed/expected ratio, and sensitivity analysis revealed that hospitals with five or more cases had a stable SD of observed/expected ratio. Thus, centers were grouped according to observed/expected ratio and case volume into three categories: low observed/expected ratio (lowest quartile of observed/expected ratio or annual case volume less than 5), intermediate observed/expected ratio (middle two quartiles of observed/expected ratio and annual case volume 5 or more), and high observed/expected ratio (highest quartile of observed/expected ratio and annual case volume of 5 or more).
Cause of death was recorded according to International Classification of Diseases criteria in effect at the time of death.34 The last date of follow-up was either the date of death or the date of last contact. Ovarian cancer-specific mortality was defined as death caused by ovarian cancer alone, and patients who died from other causes were treated as censored cases at the time of the event.
Descriptive statistics for demographic and clinical characteristics were analyzed with χ2 test for categorical variables. The first main outcome variable was disease-specific survival. Survival analysis was performed using the Kaplan-Meier estimate of survival probability and log-rank test. After verifying the proportionality assumption, a Cox proportional hazards model was fitted to evaluate the independent effect on survival of each predictor. Possible interaction terms of main effects were tested, and statistically insignificant factors were removed from the final model using stepwise selection. Adjusted hazard ratios (HRs) and 95% CIs were generated. The second main outcome variable was access to hospitals with high observed/expected ratios. Multivariable logistic regression analysis was performed to estimate the probability of receiving treatment at a hospital with a high observed/expected ratio. All statistical analysis was performed on SAS 9.4.
RESULTS
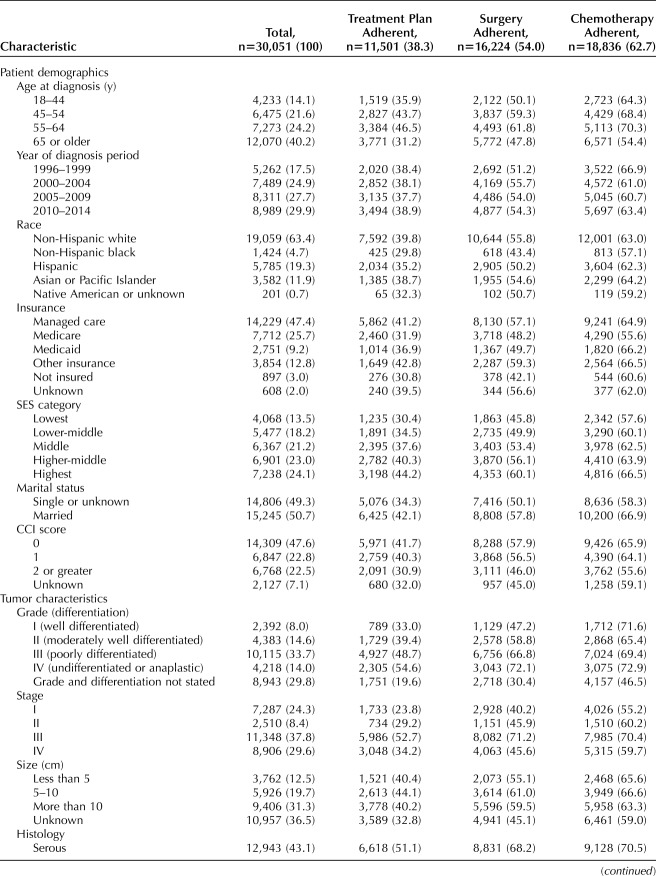
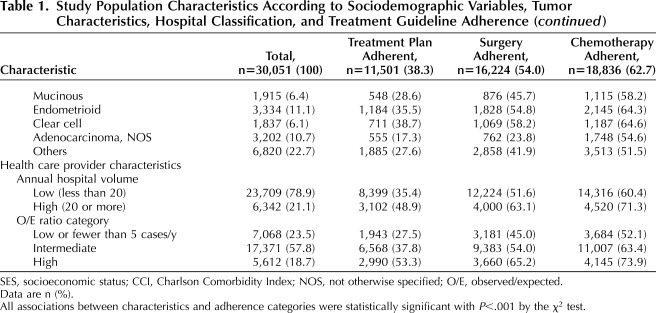
For the final study population of 30,051 patients with invasive epithelial ovarian cancer, sociodemographic variables, tumor-related characteristics, and hospital classification, stratified by National Comprehensive Cancer Network guideline adherence, are shown in Table 1. For all cases, 38.3% were adherent to National Comprehensive Cancer Network treatment guidelines, with adherence to the surgical and chemotherapy components in 54.0% and 62.7% of all cases, respectively.
Table 1.
Study Population Characteristics According to Sociodemographic Variables, Tumor Characteristics, Hospital Classification, and Treatment Guideline Adherence
A total of 426 hospitals were identified as providing ovarian cancer care during the study period; the proportional distributions of hospitals and patients according to observed/expected ratio classification and average annual case volume are shown in Table 2. The 304 hospitals with low observed/expected ratios represented 71.4% of treating facilities and accounted for 7,068 cases (23.5%); the 92 hospitals with intermediate observed/expected ratios represented 21.6% of all facilities and treated 57.8% of patients. There were 30 hospitals with high observed/expected ratios (7% of all facilities), which accounted for 18.7% of cases. Hospitals with high observed/expected ratios were significantly more likely to deliver National Comprehensive Cancer Network guideline–adherent care (53.3%) compared with hospitals with intermediate (37.8%) and low (27.5%) observed/expected ratios (P<.001) (Table 1). By comparison, classification according to annual case volume alone identified 14 hospitals that met the high-volume criterion (20 or more cases per year).15,35 Ovarian cancer care was adherent to National Comprehensive Cancer Network guidelines for 48.9% of patients treated at high-volume hospitals, compared with 35.4% of those treated at low-volume hospitals (P<.001).
Table 2.
Distribution of 426 Ovarian Cancer–Treating Hospitals According to Average Annual Case Volume and Observed/Expected Ratio* Classification
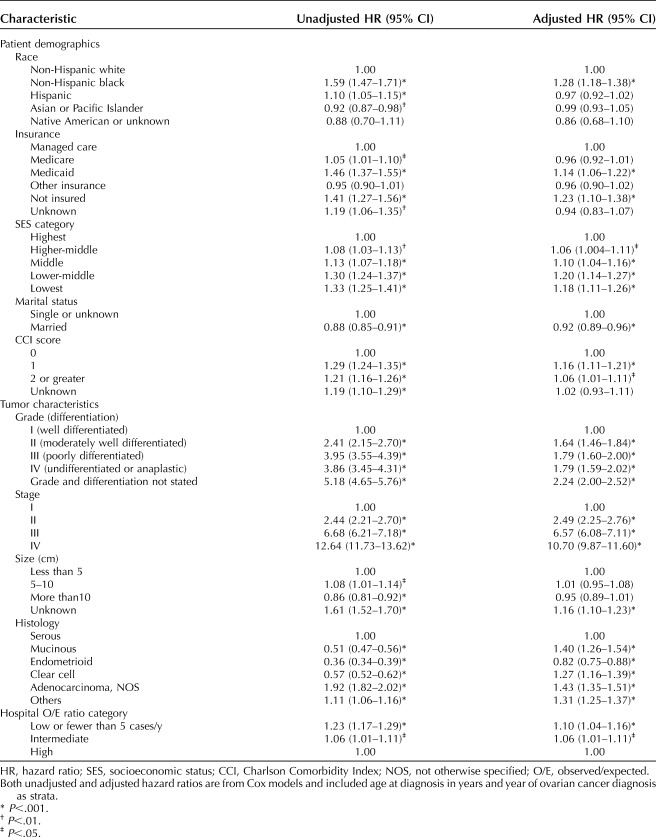
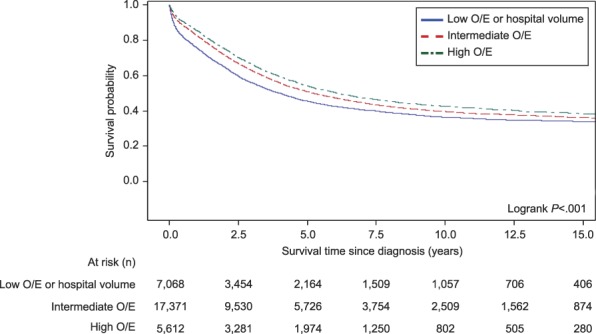
Univariate survival analysis revealed that the median disease-specific survival time was different across hospital observed/expected ratio categories: 48.1 months at hospitals with low observed/expected ratios (95% CI 44.8–50.8 months); 62.4 months at hospitals with intermediate observed/expected ratios (95% CI 60.1–65.5 months); and 73.0 months at hospitals with high observed/expected ratios (95% CI 68.6–79.3 months), P<.001 (Fig. 2). Multivariate survival analysis revealed the expected survival effects of tumor grade, stage, and histologic subtype (Table 3). Being of non-Hispanic black race, not being married, having a Charlson Comorbidity Index score of 1 or greater, having Medicaid insurance or no insurance, and being of a lower socioeconomic status were associated with a worse survival outcome. After controlling for other variables, care at a hospital with a high observed/expected ratio was significantly and independently associated with superior disease-specific survival compared with hospitals with intermediate observed/expected ratios (HR 1.06, 95% CI 1.01–1.11, P=.022) and those with low observed/expected ratios (HR 1.10, 95% CI 1.04–1.16, P<.001).
Fig. 2. Ovarian cancer-specific survival by hospital observed/expected (O/E) ratio category.
Bristow. Risk-Adjusted Model for Ovarian Cancer Care. Obstet Gynecol 2020.
Table 3.
Unadjusted and Adjusted Hazard Ratios for Disease-Specific Survival for Sociodemographic Variables, Tumor Characteristics, and Hospital Classification
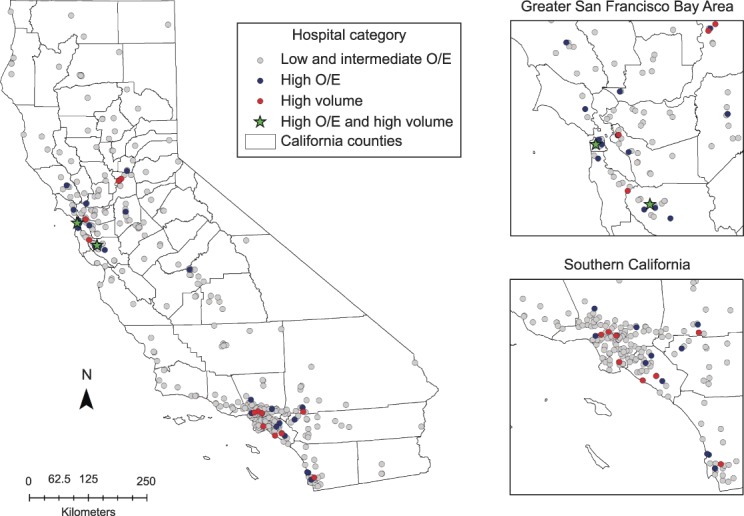
The geographic distribution of the 426 hospitals treating patients with ovarian cancer, classified according to observed/expected ratio status and high annual case volume, is shown in Figure 3. The northernmost regions and mid-section of the state were predominantly serviced by hospitals with low and intermediate observed/expected ratios. The 30 hospitals with high observed/expected ratios and 14 high-volume centers were largely concentrated around population-dense areas in Northern and Southern California. A cross-tabulation by hospital observed/expected ratio classification and case volume revealed that only 2 of the 30 hospitals with high observed/expected ratios also had high average annual case volume; both were located in Northern California (Table 4 and Fig. 3, top inset). In other words, 93.3% of hospitals with high observed/expected ratios were not high-volume, and only 14.3% of hospitals with high annual case volumes met the performance-based metric of having a high observed/expected ratio.
Fig. 3. Geographic distribution of 426 treating hospitals by observed/expected (O/E) ratio category and annual case volume.
Bristow. Risk-Adjusted Model for Ovarian Cancer Care. Obstet Gynecol 2020.
Table 4.
Cross-Tabulation of Hospital Observed/Expected Ratio Classification and Annual Volume Criteria
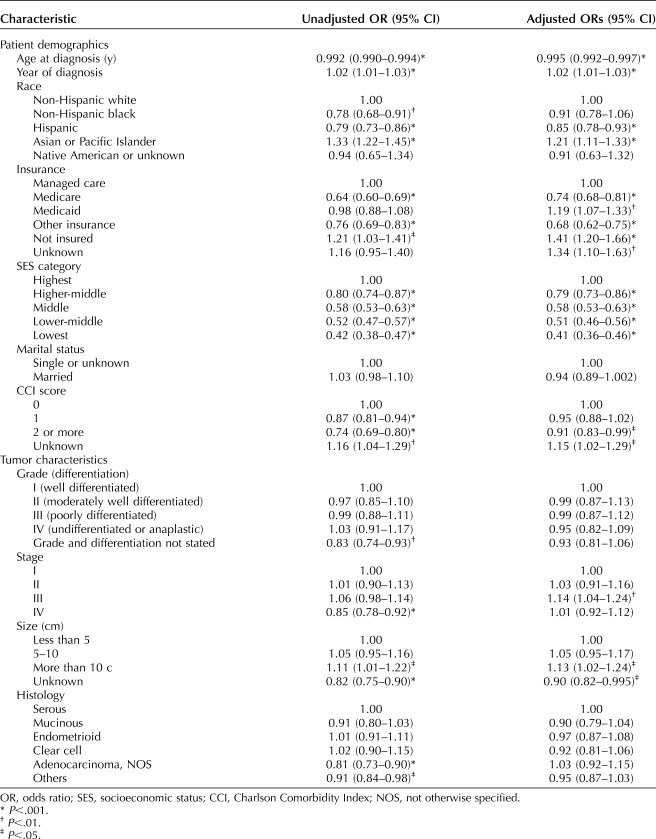
Multivariable analysis of sociodemographic and clinical characteristics and treatment at a hospital with a high observed/expected ratio revealed a small but statistically significant positive effect for increasing year of diagnosis (Table 5). Among clinical characteristics, patients with a Charlson Comorbidity Index score of 2 or greater were less likely to receive care at a hospital with a high observed/expected ratio; care at a hospital with a high observed/expected ratio was more likely for patients with stage III disease and tumor size larger than 10 cm. Among sociodemographic characteristics, being of Hispanic ethnicity (odds ratio [OR] 0.85, 95% CI 0.78–0.93, P<.001, compared with white) and having Medicare insurance (OR 0.74, 95% CI 0.68–0.81, P<.001, compared with managed care) were independent negative predictors of access to a hospital with a high observed/expected ratio. In contrast, being of Asian or Pacific Islander race (OR 1.21, 95% CI 1.11 1.33, P<.001, compared with white) and having Medicaid insurance (OR 1.19, 95% CI 1.07–1.33, P=.002, compared with managed care) or no insurance (OR 1.41, 95% CI 1.20–1.66, P<.001, compared with managed care) were predictive of a higher likelihood of treatment at a hospital with a high observed/expected ratio. Notably, socioeconomic status was independently associated with the likelihood of treatment at a hospital with a high observed/expected ratio, decreasing in a linear fashion from the highest socioeconomic status quintile (OR 1.00) to the lowest socioeconomic status quintile (OR 0.41, 95% CI 0.36–0.46, P<.001). In other words, patients in the highest socioeconomic status quintile were almost 2.5 times more likely to access a hospital with a high observed/expected ratio than their counterparts in the lowest socioeconomic status quintile.
Table 5.
Unadjusted and Adjusted Odds Ratios of Access to Centers With High Observed/Expected Ratios
DISCUSSION
A significant proportion of patients with ovarian cancer in the United States do not receive the recommended standard of care for initial treatment, although definitions and methodologies differ across populations and study designs. In population-based studies, the rate of adherence to National Comprehensive Cancer Network treatment guidelines has been reported as 30.2–65.9%, and in single-institution studies it ranges from 26.7% to 85.4%.3–7,10,18,35 The reasons behind this trend are multifactorial and include medical comorbidities precluding surgery or chemotherapy, limited availability of or access to high-volume specialty health care providers, and barriers to care associated with sociodemographic and geographic characteristics.4–6,10,35–38 Although development of novel therapeutic agents and innovative treatment strategies for ovarian cancer offer the potential for improved survival, the most basic mechanism for immediately improving outcomes is to increase adherence to accepted treatment guidelines.
The current data suggest that the observed/expected ratio methodology offers a means of distinguishing high-performing ovarian cancer hospitals with improved outcomes while expanding the number of designated expert centers beyond the traditional, and less precise, structural measure of average annual case volume. In California, adoption of the performance-based observed/expected ratio methodology for designating preferred hospitals for ovarian cancer care would more than double the number of potential referral facilities associated with superior outcomes. Surprisingly, the current data indicate minimal overlap between hospitals with high observed/expected ratios and high-volume hospitals. Only 2 of the 14 high-volume hospitals also had high observed/expected ratios; conversely, just 2 of the 30 hospitals with high observed/expected ratios were also high-volume.
Admittedly, hospitals with high observed/expected ratios treated a modest proportion of all patients with ovarian cancer, so that redistribution of patients with ovarian cancer according a performance-based metric still presents the challenge of achieving widespread access to designated institutions. In the current report, 93% of hospitals that treated patients with ovarian cancer did not have high observed/expected ratios. Substantially increasing the rate of adherence to guidelines or annual case volume for these 396 facilities is likely impractical. A more workable approach may be to concentrate care in the 30 hospitals with demonstrable high performance that uses a preferential triage strategy. This approach has been successfully adopted for a number of high-risk procedures and treatments.39 An increasing body of evidence now supports concentration of ovarian cancer care to improve adherence to treatment guidelines, surgical outcomes, survival, and cost-effectiveness.40,41 For example, Dahm-Kähler et al42 reported the effect of centralization of ovarian cancer care in Sweden and found an improved rate of complete cytoreductive surgery, a decrease in the time interval from surgery to chemotherapy, and a 50% improvement in 3-year survival. These data, combined with an increasing focus being placed on patient safety and quality improvement, suggest that a coordinated effort from health care policy administrators, professional societies, advocacy organizations, and payers to concentrate ovarian cancer care in high-performing centers is warranted.
Improving the health of all sociodemographic groups is a national priority; however, the National Healthcare Quality and Disparities Report indicates that disparities in access to care across race–ethnicity and socioeconomic status have remained largely unchanged in recent years.43 The current data show that barriers to high-performing facilities disproportionately affect patients with: Hispanic ethnicity, Medicare insurance, a Charlson Comorbidity Index score of 2 or greater, and a lower socioeconomic status. The strongest effect was seen for socioeconomic status, where patients in the highest socioeconomic status quintile were almost 2.5 times more likely to access a hospital with a high observed/expected ratio compared with those in the lowest socioeconomic status quintile. Sociodemographic disparities in ovarian cancer survival are thought to be largely attributable to unequal access to care and administration of nonstandard treatment regimens, primarily as a consequence of lower socioeconomic status, community disadvantage, and safety net insurance or lack of coverage altogether among disadvantaged and minority populations.13,36,44 This premise is supported by data indicating that, when patients receive comparable treatment, disparities in ovarian cancer survival according to race–ethnicity and socioeconomic status are largely mitigated.10,45–47 If the fundamental goal is health care equity, all segments of the population should not only have equal access to high-quality care, but resources must be directed toward remediating the underlying barriers to actually obtaining such care for underserved populations. This will require a more detailed understanding of the specific barriers (eg, financial, geographic, cultural, health literacy) affecting the populations most vulnerable to disparities in access to expert care.17,36,48
There are several limitations that must be considered when interpreting the data presented. First, the retrospective, population-based cohort study design is subject to the potential for selection and reporting bias inherent to such methodology. With respect to the California Cancer Registry specifically, the reporting facility may not be the same facility in which the patient receives the majority of her care, and satellite facilities may report under their parent institution. In addition, registry data may be subject to underreporting of chemotherapy administration.49 As an observational study the possibility exists that unmeasured confounding variables could have affected the observed results. Lastly, the current findings may not be generalizable to geographic locations outside of California.
Despite these limitations, several important conclusions can be drawn from the current data. First, the larger, more expansive and detailed data set validates our initial findings that the observed/expected ratio model for ovarian cancer care is both a valid and practical measure of hospital-based ovarian cancer care quality and incorporates the three critical components of the Donabedian paradigm for healthcare quality, namely structure (case volume), process (adherence to treatment guidelines), and outcomes (survival).18,19 Second, access to high-performing hospitals is currently limited, and marked disparities exist for specific vulnerable populations in their ability to access hospitals with high observed/expected ratios. Finally, improving access to hospitals with high observed/expected ratios through a performance-based triage strategy for patients with suspected ovarian cancer may be one of the most expedient means available to directly improve outcomes and progress toward true healthy equity in ovarian cancer care.
Footnotes
Supported by the National Institute on Minority Health and Health Disparities and the National Institutes of Health under award number R01MD009697
Financial Disclosure The authors did not report any potential conflicts of interest.
Each author has confirmed compliance with the journal's requirements for authorship.
Peer reviews and author correspondence are available at http://links.lww.com/AOG/B688.
REFERENCES
- 1.Siegel RL, Miller KD, Jemal A. Cancer statistics 2019. CA Cancer J Clin 2019;69:7–34. [DOI] [PubMed] [Google Scholar]
- 2.Torre LA, Trabert B, DeSantis CE, Miller KD, Samimi G, Runowicz CD, et al. Ovarian cancer statistics, 2018. CA Cancer J Clin 2018;68:284–96. [DOI] [PMC free article] [PubMed] [Google Scholar]
- 3.Bristow R, Chang J, Ziogas A, Anton-Culver H. Adherence to treatment guidelines for ovarian cancer as a measure of quality of care. Obstet Gynecol 2013;121:1226–34. [DOI] [PubMed] [Google Scholar]
- 4.Bristow RE, Powell MA, Al-Hammadi N, Chen L, Miller P, Roland PY, et al. Disparities in ovarian cancer care quality and survival according to race and socioeconomic status. J Natl Cancer Inst 2013;105:823–32. [DOI] [PMC free article] [PubMed] [Google Scholar]
- 5.Erickson BK, Martin JY, Shah M, Straughn JM, Leath CA. Reasons for failure to deliver National Comprehensive Cancer Network (NCC)-adherent care in the treatment of epithelial ovarian cancer at an NCCN cancer center. Gynecol Oncol 2014;133:142–6. [DOI] [PMC free article] [PubMed] [Google Scholar]
- 6.Ore RM, Chen Q, DeSimone CP, Miller RW, Baldwin LA, van Nagell JR, et al. Population-based analysis of patient age and other disparities in the treatment of ovarian cancer in Central Appalachia and Kentucky. South Med J 2018;111:333–41. [DOI] [PubMed] [Google Scholar]
- 7.Lee JY, Kim TH, Suh DH, Kim JW, Kim HS, Chung HH, et al. Impact of guideline adherence on patient outcomes in early-stage epithelial ovarian cancer. Eur J Surg Oncol 2015;41:585–91. [DOI] [PubMed] [Google Scholar]
- 8.Galvan-Turner VB, Chang J, Ziogas A, Bristow RE. Observed-to-expected ratio for adherence to treatment guidelines as a quality of care indicator for ovarian cancer. Gynecol Oncol 2015;139:495–9. [DOI] [PMC free article] [PubMed] [Google Scholar]
- 9.Wright JD, Chen L, Hou JY, Burke WM, Tergas AI, Ananth CV, et al. Association of hospital volume and quality of care with survival for ovarian cancer. Obstet Gynecol 2017;130:545–53. [DOI] [PMC free article] [PubMed] [Google Scholar]
- 10.Bristow R, Chang J, Ziogas A, Campos B, Chavez L, Anton-Culver H. Sociodemographic disparities in advanced ovarian cancer survival and adherence to treatment guidelines. Obstet Gynecol 2015;125:833–42. [DOI] [PMC free article] [PubMed] [Google Scholar]
- 11.Harlan LC, Greene AL, Clegg LX, Mooney M, Stevens JL, Brown ML. Insurance status and the use of guideline therapy in the treatment of selected cancers. J Clin Oncol 2003;21:3488–94. [DOI] [PubMed] [Google Scholar]
- 12.Parham G, Phillips JL, Hicks ML, Andrews N, Jones WB, Shingleton HM, et al. The National Cancer Data Base report on malignant epithelial ovarian carcinoma in African-American women. Cancer 1997;80:816–26. [PubMed] [Google Scholar]
- 13.Terplan M, Schluterman, McNamara EJ, Tracy JK, Temkin SM. Have racial disparities in ovarian cancer increased over time? An analysis of SEER data. Gynecol Oncol 2012;125:19–24. [DOI] [PubMed] [Google Scholar]
- 14.Goff BA, Matthews BJ, Wynn M, Muntz HG, Lishner DM, Baldwin LM. Ovarian cancer: patterns of surgical care across the United States. Gynecol Oncol 2006;103:383–90. [DOI] [PubMed] [Google Scholar]
- 15.Bristow RE, Chang J, Ziogas A, Randall LM, Anton-Culver H. High-volume ovarian cancer care: survival impact and disparities in access for advanced-stage disease. Gynecol Oncol 2014;132:403–10. [DOI] [PubMed] [Google Scholar]
- 16.Goff BA, Matthews BJ, Larson EH, Andrilla CH, Wynn M, Lishner DM, et al. Predictors of comprehensive surgical treatment in patients with ovarian cancer. Cancer 2007;109:2031–42. [DOI] [PubMed] [Google Scholar]
- 17.Bristow RE, Palis BE, Chi DS, Cliby WA. The National Cancer Database report on advanced-stage epithelial ovarian cancer: impact of hospital surgical case volume on overall survival and surgical treatment paradigm. Gynecol Oncol 2010;118:262–7. [DOI] [PubMed] [Google Scholar]
- 18.Phippen NT, Barnett JC, Lowery WJ, Miller CR, Leath CA. Surgical outcomes and national comprehensive cancer network compliance in advanced ovarian cancer surgery in a low volume military treatment facility. Gynecol Oncol 2013;131:158–62. [DOI] [PubMed] [Google Scholar]
- 19.Donabedian A. Evaluating the quality of medical care. Milbank Mem Fund Quart 1966;44:166–203. [PubMed] [Google Scholar]
- 20.Donabedian A. The quality of care: how can it be assessed? JAMA 1988;121:1145–50. [PubMed] [Google Scholar]
- 21.California Cancer Registry: about the CCR data. Available at: http://ccr.ca.gov/Data_and_Statistics/About_Data_from_the_CCR.shtml. Retrieved December 1, 2017. [Google Scholar]
- 22.California Cancer Registry: how complete are California Cancer Registry data. Available at: http://ccr.ca.gov/Inside_CCR/FAQ.shtml. Retrieved December 1, 2017. [Google Scholar]
- 23.Yost K, Perkins C, Cohen R, Morris C, Wright W. Socioeconomic status and breast cancer incidence in California for different race/ethnic groups. Cancer Causes Control 2001;12:703–11. [DOI] [PubMed] [Google Scholar]
- 24.Yang J, Schupp C, Harrati A, Clarke C, Keegan T, Gomez S. Developing an area-based socioeconomic measure from American Community Survey data. Fremont (CA): Cancer Prevention Institute of California; 2014. [Google Scholar]
- 25.Deyo RA, Cherkin DC, Ciol MA. Adapting a clinical comorbidity index for use with ICD-9-CM administrative databases. J Clin Epidemiol 1992;45:613–9. [DOI] [PubMed] [Google Scholar]
- 26.Morgan RJ, Copeland L, Gershenson D, Locker G, McIntosh D, Ozols R, et al. Update of the NCCN ovarian cancer practice guidelines. Oncology 1997;11:95–107. [PubMed] [Google Scholar]
- 27.Morgan R, Alvarez RD, Armstrong DK, Copeland L, Fiorica J, Fishman DA, Fowler DA, et al. NCCN practice guidelines for ovarian cancer. Version 2000. Fort Washington (PA): National Comprehensive Cancer Network; 2000. [Google Scholar]
- 28.Morgan R, Alvarez RD, Armstrong DK, Copeland L, Fiorica J, Fishman DA, et al. Ovarian cancer guideline. Version 1.2002. Fort Washington (PA): National Comprehensive Cancer Network; 2002. [Google Scholar]
- 29.Morgan R, Alvarez RD, Armstrong DK, Chen LM, Copeland L, Fiorica J, et al. Ovarian cancer. Version 1.2005. Fort Washington (PA): National Comprehensive Cancer Network; 2005. [Google Scholar]
- 30.Morgan RJ, Alvarez RD, Armstrong DK, Boston B, Chen LM, Copeland L, et al. Ovarian cancer. V.1.2007. Fort Washington (PA): National Comprehensive Cancer Network; 2007. [Google Scholar]
- 31.Morgan RJ, Alvarez RD, Armstrong DK, Boston B, Burger RA, Chen LM, et al. Ovarian cancer including fallopian tube cancer and primary peritoneal cancer. V.1.2010. Fort Washington (PA): National Comprehensive Cancer Network; 2010. [Google Scholar]
- 32.Morgan RJ, Alvarez RD, Armstrong DK, Burger RA, Castells M, Chen LM, et al. Ovarian cancer, version 3.2012. J Nat Comp Canc Netw 2012;10:1339–49. [DOI] [PubMed] [Google Scholar]
- 33.Morgan RJ, Alvarez RD, Armstrong DK, Burger RA, Chen LM, Copeland L, et al. Ovarian cancer, version 2.2013. J Nat Comp Canc Netw 2013;11:1199–209. [DOI] [PubMed] [Google Scholar]
- 34.Fritz A, Percy C, Jack A, Shanmugaratnam K, Sobin L, Parkin DM, et al. International classification of diseases for oncology. 3rd ed Geneva (Switzerland): World Health Organization; 2000. [Google Scholar]
- 35.Bristow RE, Chang J, Ziogas A, Anton-Culver H, Vieira V. Spatial analysis of adherence to treatment guidelines for advanced-stage ovarian cancer and the impact of race and socioeconomic status. Gynecol Oncol 2014;134:60–7. [DOI] [PMC free article] [PubMed] [Google Scholar]
- 36.Chornokur G, Amankwah EK, Schildkraut JM, Phelan CM. Global ovarian cancer health disparities. Gynecol Oncol 2013;129:258–64. [DOI] [PMC free article] [PubMed] [Google Scholar]
- 37.Hodeib M, Chang J, Ziogas A, Dilley S, Randall LM, Anton-Culver H, et al. Socioeconomic status as a predictor of adherence to treatment guidelines for early-stage ovarian cancer. Gynecol Oncol 2015;138:121–7. [DOI] [PMC free article] [PubMed] [Google Scholar]
- 38.Long B, Chang J, Ziogas A, Tewari KS, Anton-culver H, Bristow RE. Impact of race, socioeconomic status, and the health care system on the treatment of advanced-stage ovarian cancer in California. Am J Obstet Gynecol 2015;212:468.e1–9. [DOI] [PubMed] [Google Scholar]
- 39.Finks JF, Osborne NH, Birkmeyer JD. Trends in hospital volume and operative mortality for high-risk surgery. N Engl J Med 2011;364:2128–37. [DOI] [PMC free article] [PubMed] [Google Scholar]
- 40.Cowan RA, O'Cearbhaill RE, Gardner GJ, Levine DA, Roche KL, Sonoda Y, et al. Is it time to centralize ovarian cancer care in the United States? Ann Surg Oncol 2016;23:989–93. [DOI] [PMC free article] [PubMed] [Google Scholar]
- 41.Tingulstad S, Skjeldestad FE, Hagen B. The effect of centralization of primary surgery on survival in ovarian cancer patients. Obstet Gynecol 2003;102:499–505. [DOI] [PubMed] [Google Scholar]
- 42.Dahm-Kähler P, Palmqvist C, Staf C, Holmberg E, Johannesson L. Centralized primary care of advanced ovarian cancer improves complete cytoreduction and survival—a population-based cohort study. Gynecol Oncol 2016;142:211–6. [DOI] [PubMed] [Google Scholar]
- 43.2017 national healthcare quality and disparities report. Rockville (MD): Agency for Healthcare Research and Quality; 2018. AHRQ Pub. No. 18-0033-EF. [PubMed] [Google Scholar]
- 44.Vieira VM, Villanueva C, Chang J, Ziogas A, Bristow RE. Impact of community disadvantage and air pollution burden on geographic disparities of ovarian cancer survival in California. Environ Res 2017;156:388–93. [DOI] [PMC free article] [PubMed] [Google Scholar]
- 45.Bristow RE, Ueda S, Gerardi MA, Ajiboye OB, Ibeanu OA. Analysis of racial disparities in stage IIIC epithelial ovarian cancer care and outcomes in a tertiary gynecologic oncology referral center. Gynecol Oncol 2011;122:319–23. [DOI] [PubMed] [Google Scholar]
- 46.Farley JH, Tian C, Rose GS, Brown CL, Birrer M, Maxwell GL. Race does not impact outcomes for advanced ovarian cancer patients treated with cisplatin/paclitaxel: an analysis of Gynecologic Oncology Group trials. Cancer 2009;115:4210–7. [DOI] [PMC free article] [PubMed] [Google Scholar]
- 47.Terplan M, Temkin S, Tergas A, Lengyl E. Does equal treatment yield equal outcomes? The impact of race on survival in epithelial ovarian cancer. Gynecol Oncol 2008;111:173–8. [DOI] [PMC free article] [PubMed] [Google Scholar]
- 48.Fairfield KM, Lucas FL, Earle CC, Small L, Trimble EL, Warren JL. Regional variation in cancer-directed surgery and mortality among women with epithelial ovarian cancer in the Medicare population. Cancer 2010;116:4840–8. [DOI] [PubMed] [Google Scholar]
- 49.Noone AM, Lund JL, Mariotto A, Cronin K, McNeel T, Deapen D, et al. Comparison of SEER treatment data with Medicare claims. Med Care 2016;54:e55–64. [DOI] [PMC free article] [PubMed] [Google Scholar]


