Abstract
Protein structure determination by solid-state NMR requires the measurement of many inter-atomic distances through dipole-dipole couplings. To obtain multiple long-range distance restraints rapidly and with high sensitivity, here we demonstrate a new 1H-detected fast magic-angle-spinning (MAS) NMR technique that yields many long distances in a 2D-resolved fashion. The distances are measured up to ~15 Å, with an accuracy of better than 10%, between 1H and 19F, two nuclear spins that have the highest gyromagnetic ratios. Exogenous fluorines are sparsely introduced into the aromatic residues of the protein, which is perdeuterated and back-exchanged to give amide protons. This 1H-19F distance experiment, termed 2D HSQC-REDOR, is demonstrated on the singly fluorinated model protein, GB1. We extracted 33 distances between 5-19F-Trp43 and backbone amide protons, using 2D spectral series that were measured in less than 3 days. Combining these 1H-19F distance restraints with 13C-19F distances and chemical shifts, we calculated a GB1 structure with a backbone RMSD of 1.73 Å from the high-resolution structure. This 1H-detected 1H-19F distance technique promises to provide a highly efficient tool for constraining the three-dimensional structures of proteins and protein-ligand complexes, with not only precise and fast measurements, but also access to truly long-range distances.
Graphical Abstract
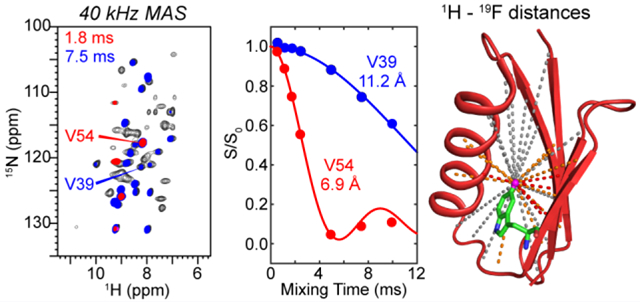
Solid-state NMR (SSNMR) is an excellent tool for determining the three-dimensional structures of complex biological macromolecules such as membrane proteins and fibrillar proteins 1. A necessary component of SSNMR-based structure determination is the measurement of inter-atomic distances using nuclear-spin dipole-dipole couplings. To determine the three-dimensional fold and oligomeric structure of proteins and macromolecular assemblies, distances in the 1-2 nm range are crucial 2. When 13C-13C and 13C-15N distances are measured, as in most NMR structural determination studies 1, the distance restraints are typically limited to ~7 Å or less due to the low gyromagnetic ratios of 13C and 15N spins. Longer distance restraints of ~10 Å can be measured when dipolar couplings between different nuclear spins with higher gyromagnetic ratios such as 19F and 31P 3–5 are recoupled under MAS using the rotational-echo double-resonance (REDOR) technique 6. However, these REDOR experiments are typically conducted in a 1D fashion, thus limiting the number of distances that can be measured in each experiment. Moreover, detection of low-frequency nuclei limits the spectral sensitivity, thus requiring extensive signal-averaging times of weeks to even months. As a result, although long-distance measurement by SSNMR is possible, so far such measurements have been inefficient, making fast and high-sensitivity detection a bottleneck in accessing distances in the nanometer range.
Here we demonstrate the combination of fast MAS, 1H detection, and 1H-19F REDOR to measure a large number of long-range distances in a 2D-resolved fashion within 2-3 days. The 2D spectra have high sensitivity due to 1H detection, distances can be measured to ~15 Å due to the high gyromagnetic ratios of 1H and 19F spins, and the measured distances have a high accuracy of ~10% due to the simplicity of heteronuclear spin dynamics. The choice of 1H-19F heteronuclear distance measurement circumvents the difficulties in measuring homonuclear 1H-1H distances, where the dense 1H network in biomolecules causes dipolar truncation 7 and relayed transfer 8–9. Proton dilution by perdeuteration followed by back H/D exchange 10 still leaves uncertainties in 1H-1H distance measurements due to residual relayed polarization transfer, while ultrafast MAS of ~100 kHz for protonated samples 11–15 requires 3D and 4D correlation experiments for 1H chemical shift assignment 16–18. The 1H-19F distance approach demonstrated here circumvents these difficulties, and complements the recently introduced homonuclear 19F-19F distance measurements 19–21. It also complements a 2D-resolved 13C-19F REDOR technique 22, which has a shorter distance upper limit of ~1 nm. The combination of 1H and 19F for distance measurement was previously reported for the slow MAS condition 23–24, which suffered from short 1H T2 relaxation times and the lack of possibility for high-sensitivity 1H detection.
The pulse sequence for this 2D-resolved 1H-19F distance experiment (Fig. 1) contains a 1H-19F REDOR module 6, 23 inserted into a cross-polarization (CP) based 2D 1H-15N heteronuclear single-quantum coherence (HSQC) sequence immediately before 1H detection. Two 2D spectra are measured back-to-back, one with the 19F pulses off (S0) and the other with the 19F pulses on (S). The S0 spectrum gives relaxation-compensated intensities for the 1H-15N correlation peaks while the S spectrum gives lower intensities for protons that are close to the 19F probe. The difference spectrum (ΔS) between the two shows the amide protons that are close to the 19F spin. We demonstrate this technique using 13C, 15N, 2H-labeled GB1 that contains a single fluorinated residue, 5-19F-Trp43 (5F-W43 CDN-GB1). The protein was fully back-exchanged in H2O to obtain amide protons. The fluorinated Trp was incorporated into the protein using glyphosate before the onset of protein expression, to suspend aromatic amino acid synthesis in E. coli 25. Unlabeled Tyr and Phe were also added, thus the 2D spectra do not contain 1H-15N cross peaks of the aromatic residues. The single 5F-W43 served to dephase all 15N-bonded amide protons.
Figure 1.
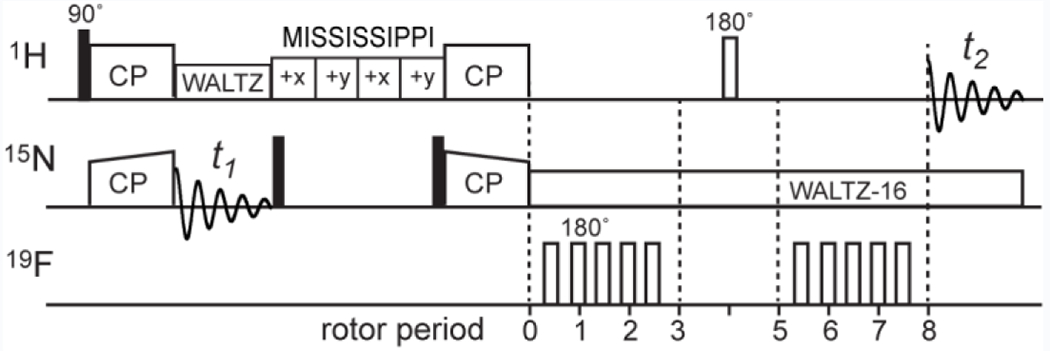
1H-detected 1H-19F HSQC-REDOR pulse sequence. The REDOR block is inserted between the 15N evolution (t1) and 1H detection (t2) periods. A MISSISSIPPI period after the 15N evolution suppresses the solvent 1H signals 26.
2D HN-15N correlation spectra of 5F-W43 CDN-GB1 (Fig. S1) measured at 40 kHz MAS and a nominal temperature of 273 K, which corresponds to an estimated sample temperature of ~303 K, show well-resolved peaks with 1H linewidths of 0.1–0.3 ppm. These 1H and 15N chemical shifts are nearly identical to those of non-fluorinated GB1 (Table S1), indicating that single-site fluorination does not perturb the protein structure. Control spectra measured with the 19F pulses off show the full intensities of HN-N correlation peaks (Fig. 2A) modulated only by T2 relaxation of the protons. Turning on the 19F pulses reduced the intensities of 19F-proximal amide protons, thus the difference spectrum (ΔS) displays HN signals close to 19F. At short mixing times such as 1.8 ms (Fig 2B), only a few correlation peaks are observed that correspond to HN atoms that are 4-6 Å from the 19F. At longer mixing times such as 7.5 ms (Fig. 2C), many more correlation peaks appear in the difference spectrum, including amide protons that are 10–14 Å from the 19F probe. The difference intensity, after dividing by the control intensity to account for T2 relaxation (ΔS/S0 = 1 − S/S0), indicates the strength of the dipolar coupling and hence the 1H-19F distances. Importantly, these 2D spectra have very high signal-to-noise ratios of 100-200 : 1 due to 1H detection and fast MAS, thus giving precise distance-dependent REDOR dipolar dephasing.
Figure 2.
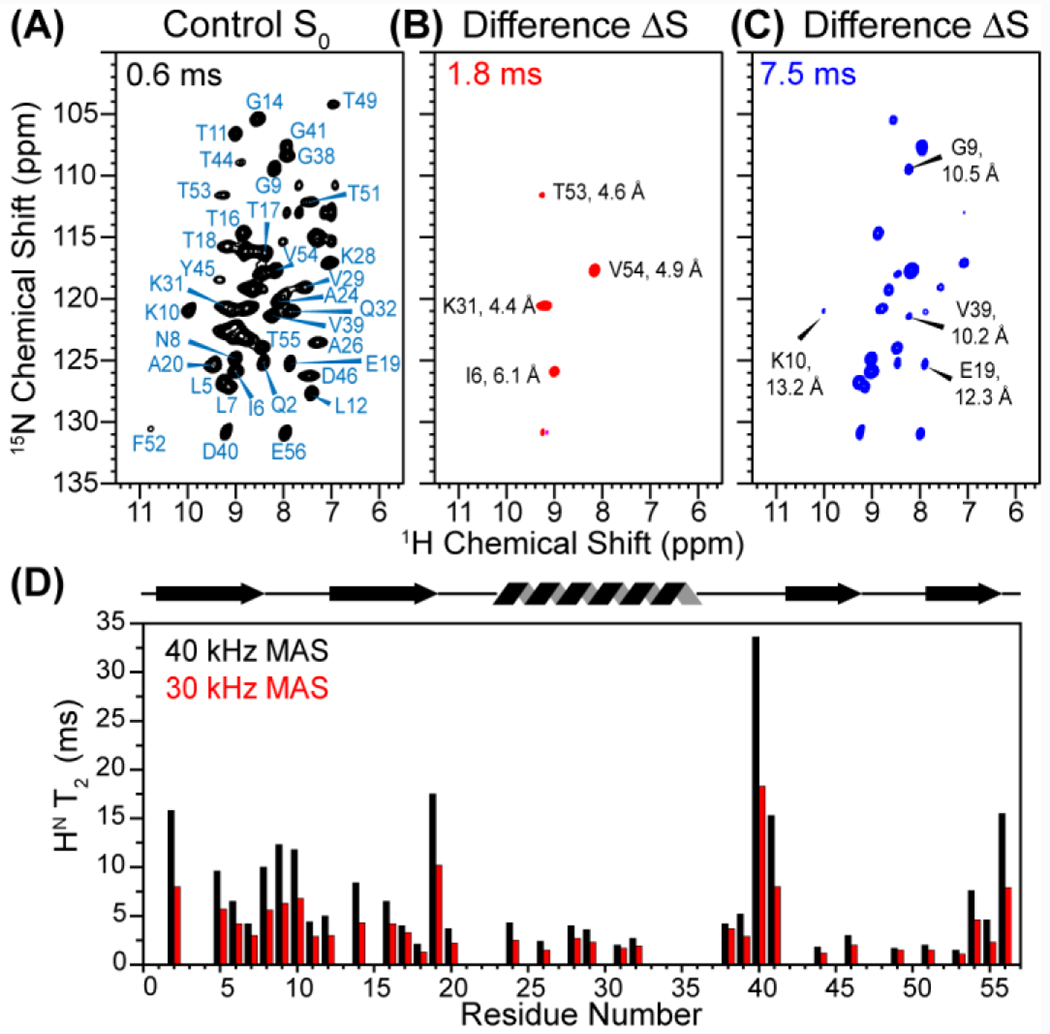
Representative 2D 1H-19F HSQC-REDOR spectra of 5F-W43 CDN-GB1. The spectra were measured under 40 kHz MAS at 273 K. Indicated distances are from PDB 2LGI structure. (A) Control S0 spectrum at 0.6 ms mixing, showing most HN-N cross peaks. (B) Difference spectrum ΔS at 1.8 ms. (C) Difference spectrum at 7.5 ms mixing. (D) HN T2 relaxation times at 40 kHz (black) and 30 kHz MAS (red). Faster MAS gives longer relaxation times and thus higher sensitivity for the 2D 19F-dephased spectra.
The cross peak intensities in the control spectra decay with increasing mixing times due to 1HN T2 relaxation. We found that the residue-specific 1HN T2 values (Fig. 2D) nearly doubled from 30 kHz MAS (average 4.2 ms) to 40 kHz MAS (average 7.2 ms), indicating that faster MAS lengthens the coherence lifetime, by averaging residual 1H-1H dipolar couplings. Long 1HN T2 times are essential for measuring weak 1H-19F dipolar couplings that encode longer distances, since longer REDOR mixing times of ~10 ms are required to detect these weak couplings. Fig. S2 shows that the difference spectra measured at 40 kHz MAS have many more cross peaks than the 30 kHz spectra for similar mixing times. Thus, the increased 1HN T2 by fast MAS compensates for the additional pulse imperfections arising from the larger number of rotation periods needed to reach the same mixing time.
To quantify the 1H-19F distances, we investigated how the large 19F chemical shift anisotropy (CSA) affects 1H-19F dipolar dephasing. We simulated the REDOR dephasing, S/S0, as a function of mixing time (Fig. S3). At a slow MAS frequency of 10 kHz, the REDOR curves show noticeable dependences on the orientation of the 19F chemical shift tensor relative to the 1H-19F internuclear vector. But this orientation dependence vanishes at MAS rates of 40 kHz and above, so that the 1H-19F dipolar dephasing depends chiefly on distances. This is consistent with the observation for 13C-19F REDOR 22 and represents a significant benefit of fast MAS for REDOR experiments. The magnitude of the 19F CSA also affects the REDOR dephasing, by elevating the S/S0 values; but similarly this effect is diminished by fast MAS and can be rigorously accounted for by numerical simulations. In fitting the measured REDOR dephasing below, we also take into account finite 19F pulse lengths and pulse imperfections 22, 27.
We extracted 1H-19F distances from the mixing-time-dependent S/S0 intensities of the 2D HSQC-REDOR spectra. Representative REDOR decays for several residues are shown in Fig. 3 for the 40 kHz dataset; the complete set of decay trajectories is given in Fig. S4. The high sensitivity of the 1H-detected 2D spectra gave rise to very precise S/S0 values, with uncertainties of less than 0.02 in the dephasing values (Fig. 3a). A wide range of dipolar dephasing trajectories are observed: residues such as I6 and V54 show rapid dephasing to zero within ~5 ms while residues such as V39 manifest slow dephasing and high S/S0 values of ~0.6 even at 10 ms. Therefore, the technique is sensitive to the distance distribution in the protein.
Figure 3.
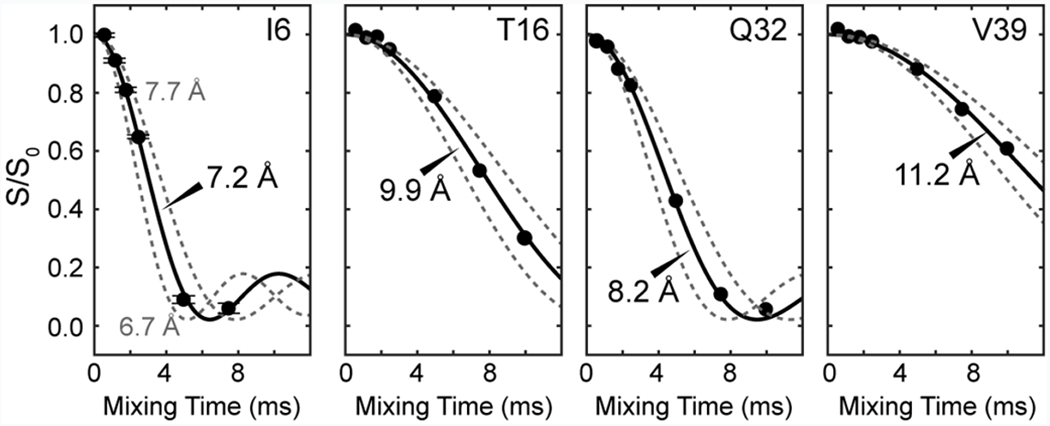
HN-19F REDOR dephasing, measured under 40 kHz MAS, for representative residues of GB1. Best-fit simulations (solid lines) are shown, together with simulated curves for distances that are ±0.5 Å from the best fit (dashed lines). Residues with shorter T2 relaxation times such as I6 may have their signals disappear from some of the spectra at longer mixing times, in which case fewer REDOR intensity data points are detected. The high sensitivity of the 1H-detected spectra yielded error bars that are typically less than 0.02, which are smaller than the points in the plot, as shown for the I6 data as an example.
We extracted best-fit distances from the minimum RMSD between the simulated and measured S/S0 intensities (Fig. S5). Since fast protein motions weaken the 1H-19F dipolar couplings, to increase the accuracy of the distance restraints, we semi-quantitatively accounted for residual motion of the fluorine-bearing indole of W43 by analyzing the measured 19F chemical shift anisotropy (CSA). The 19F spinning sideband spectrum of 5F-W43 22 indicates a CSA order parameter of 0.87, which is used to approximate the scaling factor for the 1H-19F dipolar couplings. A more exact analysis of the motional scaling factor is not possible without detailed knowledge of the geometry of motion and the relative orientation of the 1H-19F vector to the indole ring. Since distances depend on the dipolar coupling as ωd−3, a dipolar scaling factor of 0.87 means that the true distances may be up to 4.6% shorter than the best-fit distances. Thus we applied a uniform scaling factor of 95.4% to the measured distances (Table S2). These motionally adjusted distances, although approximate, show excellent agreement with the distances in the high-resolution GB1 structure (PDB code: 2LGI) (Fig. 4A, Fig. S6): the correlation plot has a slope of 1.1, a correlation coefficient of 0.89 and an RMSD of 1.1 Å between the measured and predicted distances. We observed 1H-19F distances up to 1.5 nm, which is the upper limit expected for this model protein, since the overall dimension of the protein is about 1.5 x 1.4 x 2.9 nm. Based on the 2D dataset obtained at a nominal temperature 273 K (which corresponds to an estimated sample temperature of ~303 K), the measured distances are on average 0.66 Å longer than the distances in the high-resolution structure, indicating that the measured 1H-19F dipolar couplings are still weaker than expected even after taking into account the indole motion. We attribute this slight lengthening of the measured distances to residual motion of the protein backbone, which may occur on the microsecond timescale to escape detection in the 19F CSA spectra 28. This hypothesis is supported by the fact that the distance accuracy improved at a lower sample temperature of ~275 K (Fig. S6C). Among all measured distances, Q2 and A20 have shorter distances than predicted by the structure. We attribute this effect to intermolecular dipolar coupling, since Q2 and A20 lie at one end of the ellipsoid-shaped protein, in closer contact with the neighboring protein than other amide protons (Fig. 4D). L5 and K31 show longer measured distances than predicted by the structure, which can be attributed to partial overlap of these resonances in the spectra.
Figure 4.
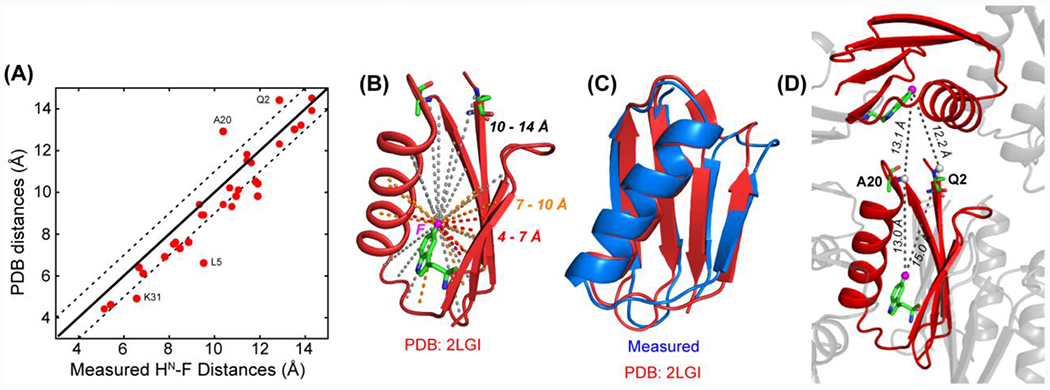
(A) Comparison of the 1HN-F distances measured at 273 K under 40 kHz MAS with predicted distances in the high-resolution structure (PDB ID: 2LGI). (B) Measured 1HN-F distances (dashed lines) in 5F-W43 (pink sphere) labeled GB1. (C) 1H-19F and 13C-19F distance-restrained GB1 structure (blue), superimposed with the high-resolution SSNMR structure (red) 29. (D) A20 and Q2 are located at one end of the protein, and have similar HN-F distances of 12-13 Å to 5F-W43 of the same molecule versus to 5F-W43 of a neighboring molecule. The simultaneous coupling to two fluorines explains the apparent shortening of the measured distances compared to the known intramolecular distances.
Altogether, we measured 33 distances from 5F-W43 to amide protons (Fig. 4B). Among these, 5 are shorter than 0.7 nm, 10 are 0.7–1.0 nm, whereas 18 are 1.0–1.5 nm. Thus, the majority of the measured 1HN-19F distances are sufficiently long to constrain the three-dimensional structure of the protein. We calculated the GB1 structure using the 33 1H-19F distances measured here, the 47 13C – 19F distances reported recently 22, and the known 13C and 15N chemical shifts of the protein 30. The structure ensemble (Fig. S7) has a backbone RMSD of 1.24 Å (Table S3) and the best structure agrees with the high-resolution GB1 SSNMR structure with a backbone RMSD of 1.73 Å (Fig. 4C, Table S4). Importantly, the protein fold is correctly captured with a minimal number of constraints, with the main deviation being the spacing between two of the four β-strands. Therefore, 1H-19F REDOR not only gives crucial qualitative inter-atomic proximities but also quantitative distance restraints for the three-dimensional structure.
We envision that this 1H-19F HSQC-REDOR technique will facilitate SSNMR-based structure determination by providing accurate, long-range distances in a high-throughput manner. Each 2D 1H-19F HSQC-REDOR spectrum of GB1 was measured in about 3 hours with signal-to-noise ratios of 100-200 : 1 for the cross peaks, and a full series of spectra were measured in 2-3 days (Table S5). Thus this technique can be applied to proteins that are several times larger than GB1 while still retaining sufficient sensitivity. Similar to all 1H-detected fast MAS experiments, the key requirement for multiplexed 1H-19F distance measurement is sufficient resolution of the 1H and 15N chemical shifts in the 2D spectra. This 1H-19F distance technique is complementary to the recently introduced 13C-13C resolved 13C-19F distance experiment 22, and yields more distance restraints than 19F-19F 2D experiments 20–21. Aromatic residues in proteins, particularly the sparse tryptophan (Trp) residues, can be fluorinated during protein expression without perturbing the structure 31–32. Lipid-exposed Trp residues on the surfaces of membrane proteins can allow the investigation of ligand binding 33 and intermolecular assembly 34–35, whereas Trp residues in the core of globular proteins can provide crucial constraints for the three-dimensional structure. The ability to measure distances to ~2 nm opens the possibility of elucidating protein conformational changes, protein-ligand binding, and macromolecular binding interfaces where 19F labeling of one partner can be combined with orthogonal labeling of the other partner 4. With the increased sensitivity from 1H detection and the increased distance reach, this 1H-19F distance technique should significantly enhance the capability of SSNMR-based structure determination.
Supplementary Material
Acknowledgement:
This work is supported by NIH grant GM066976 to M. H. The authors thank Dr. Matthias K. Roos for helpful discussions about the work and reading of the manuscript.
Footnotes
Supporting Information Available
Details for expressing fluorinated CDN-GB1, NMR experimental parameters, additional spectra, REDOR simulations, and protein structure calculation statistics are provided. This material is available free of charge via the Internet at http://pubs.acs.org.
References
- 1.Comellas G; Rienstra CM Protein Structure Determination by Magic-Angle Spinning Solid-State NMR, and Insights Into the Formation, Structure, and Stability of Amyloid Fibrils. Annu. Rev. Biophys 2013, 42, 515–536. [DOI] [PubMed] [Google Scholar]
- 2.Hong M; Schmidt-Rohr K Magic-Angle-Spinning NMR techniques for measuring long-range distances in biological macromolecules. Acc. Chem. Res 2013, 46, 2154–2163. [DOI] [PMC free article] [PubMed] [Google Scholar]
- 3.Olsen GL, et al. Monitoring tat peptide binding to TAR RNA by solid-state 31P-19F REDOR NMR. Nucleic Acids Res. 2005, 33, 3447–3454. [DOI] [PMC free article] [PubMed] [Google Scholar]
- 4.Yang H, et al. REDOR NMR Reveals Multiple Conformers for a Protein Kinase C Ligand in a Membrane Environment. ACS Central Science 2018, 4 (1), 89–96. [DOI] [PMC free article] [PubMed] [Google Scholar]
- 5.Kim SJ; Tanaka KS; Dietrich E; Rafai FA; Schaefer J Locations of the Hydrophobic Side Chains of Lipoglycopeptides Bound to the Peptidoglycan of Staphylococcus aureus. Biochemistry 2013, 52, 3405–3414. [DOI] [PMC free article] [PubMed] [Google Scholar]
- 6.Gullion T; Schaefer J Rotational-echo double-resonance NMR. J. Magn. Reson 1989, 81 (1), 196–200. [DOI] [PubMed] [Google Scholar]
- 7.Bayro MJ, et al. Dipolar Truncation Effect in Magic-Angle Spinning NMR Recoupling Experiments. J. Chem. Phys 2009, 130, 114506. [DOI] [PMC free article] [PubMed] [Google Scholar]
- 8.Hodgkinson P; Emsley L The Accuracy of Distance Measurements in Solid-State NMR. J. Magn. Reson 1999, 139, 46–59. [DOI] [PubMed] [Google Scholar]
- 9.Duong NT; Raran-Kurussi S; Nishiyama Y; Agarwal V Quantitative 1H-1H Distances in Protonated Solids by Frequency-Selective Recoupling at Fast Magic Angle Spinning NMR. J. Phys. Chem. Lett 2018, 9, 5948–5954. [DOI] [PubMed] [Google Scholar]
- 10.Chevelkov V; Rehbein K; Diehl A; Reif B Ultrahigh Resolution in Proton Solid-State NMR Spectroscopy at High Levels of Deuteration. Angew. Chem. Int. Ed. Engl 2006, 45, 3878–3881. [DOI] [PubMed] [Google Scholar]
- 11.Stanek J, et al. NMR Spectroscopic Assignment of Backbone and Side-Chain Protons in Fully Protonated Proteins: Microcrystals, Sedimented Assemblies, and Amyloid Fibrils. Angew. Chem. Int. Ed. Engl 2016, 55 (50), 15504–15509. [DOI] [PubMed] [Google Scholar]
- 12.Penzel S, et al. Protein resonance assignment at MAS frequencies approaching 100 kHz: a quantitative comparison of J-coupling and dipolar-coupling-based transfer methods. J. Biomol. NMR 2015, 63 (2), 165–86. [DOI] [PubMed] [Google Scholar]
- 13.Andreas LB; Le Marchand T; Jaudzems K; Pintacuda G High-Resolution Proton-Detected NMR of Proteins at Very Fast MAS. J. Magn. Reson 2015, 253, 36–49. [DOI] [PubMed] [Google Scholar]
- 14.Barbet-Massin E, et al. Rapid proton-detected NMR assignment for proteins with fast magic angle spinning. J. Am. Chem. Soc, 2014, 136 (35), 12489–97. [DOI] [PMC free article] [PubMed] [Google Scholar]
- 15.Zhou DH, et al. Solid-state NMR analysis of membrane proteins and protein aggregates by proton detected spectroscopy. J. Biomol. NMR 2012, 54 (3), 291–305. [DOI] [PMC free article] [PubMed] [Google Scholar]
- 16.Andreas LB, et al. Structure of Fully Protonated Proteins by Proton-Detected Magic-Angle Spinning NMR. Proc. Natl. Acad. Sci. U. S. A 2016, 113, 9187–9192. [DOI] [PMC free article] [PubMed] [Google Scholar]
- 17.Jain MG, et al. Selective 1H-1H Distance Restraints in Fully Protonated Proteins by Very Fast Magic-Angle Spinning Solid-State NMR. J. Phys. Chem. Lett 2017, 8, 2399–2405. [DOI] [PubMed] [Google Scholar]
- 18.Xiang S; Biernat J; Mandelkow E; Becker S; Linser R Backbone assignment for minimal protein amounts of low structural homogeneity in the absence of deuteration. Chem. Commun 2016, 52, 4002–4005. [DOI] [PubMed] [Google Scholar]
- 19.Wang M, et al. Fast Magic Angle Spinning 19F NMR of HIV-1 Capsid Protein Assemblies. Angew. Chem. Int. Ed. Engl 2018, Epub ahead of print. [DOI] [PMC free article] [PubMed] [Google Scholar]
- 20.Roos M; Mandala VS; Hong M Determination of Long-Range Distances by Fast Magic-Angle-Spinning Radiofrequency-Driven 19F–19F Dipolar Recoupling NMR. J. Phys. Chem. B 2018. [DOI] [PMC free article] [PubMed] [Google Scholar]
- 21.Roos M; Wang T; Shcherbakov AA; Hong M Fast Magic-Angle-Spinning F-19 Spin Exchange NMR for Determining Nanometer Distances in Proteins and Pharmaceutical Compounds. J. Phys. Chem. B 2018, 122 (11), 2900–2911. [DOI] [PMC free article] [PubMed] [Google Scholar]
- 22.Shcherbakov AA; Hong M Rapid Measurement of Long-Range Distances in Proteins by Multidimensional 13C-19F REDOR NMR Under Fast Magic-Angle Spinning. J. Biomol. NMR 2018, 71, 31–43. [DOI] [PMC free article] [PubMed] [Google Scholar]
- 23.Wi S; Sinha N; Hong M Long-range 1H-19F distance measurement in peptides by solid-state NMR. J. Am. Chem. Soc 2004, 126, 12754–12755. [DOI] [PubMed] [Google Scholar]
- 24.Sorte EG; Alam TM 1H-19F REDOR-filtered NMR spin diffusion measurements of domain size in heterogeneous polymers. Magn. Reson. Chem 2017, 55, 1006–1014. [DOI] [PubMed] [Google Scholar]
- 25.Kim HW; Perez JA; Ferguson SJ; Campbell ID The Specific Incorporation of Labeled Aromatic-Amino-Acids Into Proteins Through Growth of Bacteria in the Presence of Glyphosate – Application to Fluorotryptophan Labeling to the H+-ATPASE of Escherichia-Coli and NMR-Studies. FEBS Letters 1990, 272 (1–2), 34–36. [DOI] [PubMed] [Google Scholar]
- 26.Zhou DH; Rienstra CM High-performance solvent suppression for proton detected solid-state NMR. J. Magn. Reson 2008, 192, 167–172. [DOI] [PMC free article] [PubMed] [Google Scholar]
- 27.Jaroniec CP; Tounge BA; Rienstra CM; Herzfeld J; Griffin RG Recoupling of Heteronuclear Dipolar Interactions with Rotational-Echo Double-Resonance at High Magic-Angle Spinning Frequencies. J. Magn. Reson 2000, 146 (1), 132–139. [DOI] [PubMed] [Google Scholar]
- 28.Kurauskas V, et al. Slow conformational exchange and overall rocking motion in ubiquitin protein crystals. Nat. Commun 2017, 8, 145. [DOI] [PMC free article] [PubMed] [Google Scholar]
- 29.Wylie BJ, et al. Ultrahigh resolution protein structures using NMR chemical shift tensors. Proc. Natl. Acad. Sci. U.S.A 2011, 108 (41), 16974–16979. [DOI] [PMC free article] [PubMed] [Google Scholar]
- 30.Franks WT, et al. Magic-angle spinning solid-state NMR spectroscopy of the beta 1 immunoglobulin binding domain of protein G (GB1): N-15 and C-13 chemical shift assignments and conformational analysis. J. Am. Chem. Soc 2005, 127 (35), 12291–12305. [DOI] [PubMed] [Google Scholar]
- 31.Kitevski-LeBlanc JL; Prosser RS Current applications of 19F NMR to studies of protein structure and dynamics. Prog. Nucl. Magn. Reson. Spectros 2012, 62, 1–33. [DOI] [PubMed] [Google Scholar]
- 32.Sharaf NG; Gronenborn AM (19)F-Modified Proteins and (19)F-Containing Ligands as Tools in Solution NMR Studies of Protein Interactions. Methods Enzymol. 2015, 565, 67–95. [DOI] [PubMed] [Google Scholar]
- 33.Elkins MR, et al. Cholesterol-binding site of the influenza M2 protein in lipid bilayers from solid-state NMR. Proc. Natl. Acad. Sci. U.S.A 2017, 114 (49), 12946–12951. [DOI] [PMC free article] [PubMed] [Google Scholar]
- 34.Williams JK; Zhang Y; Schmidt-Rohr K; Hong M pH-Dependent Conformation, Dynamics, and Aromatic Interaction of the Gating Tryptophan Residue of the Influenza M2 Proton Channel from Solid-State NMR. Biophys. J 2013, 104, 1698–1708. [DOI] [PMC free article] [PubMed] [Google Scholar]
- 35.Mandala VS; Liao SY; Kwon B; Hong M Structural Basis for Asymmetric Conductance of the Influenza M2 Proton Channel Investigated by Solid-State NMR Spectroscopy. J. Mol. Biol 2017, 429, 2192–2210. [DOI] [PMC free article] [PubMed] [Google Scholar]
Associated Data
This section collects any data citations, data availability statements, or supplementary materials included in this article.


