. 2020 Feb 11;9:e49544. doi: 10.7554/eLife.49544

Figure 1. Eyespot/spot size plasticity is widespread across butterfly lineages but the response to rearing temperature has different norms of reaction across species.

(A) Size of hindwing ventral Cu1 eyespots (arrowheads). Thirteen species of butterflies were reared at two different rearing temperatures. Eyespot size corrected for wing size is plotted for two different temperatures (low temperature 17°C or 20°C is marked with blue symbols, while high temperature of 27°C or 30°C is marked with red symbols). Error bars represent 95% CI of means. (B) Mapping origins of eyespot size plasticity via maximum parsimony phylogenetic analysis suggests three independent origins for two different patterns of plasticity in the lineage with eyespots (eyespot size decreases with increasing temperatures: red lineages, and eyespot size increases with increasing temperature: blue lineage). The lineage leading to Satyrid butterflies gained a positive response to plasticity (blue arrowhead), whereas most other Nymphalids had either no response, or limited negative plasticity response (red arrowhead).

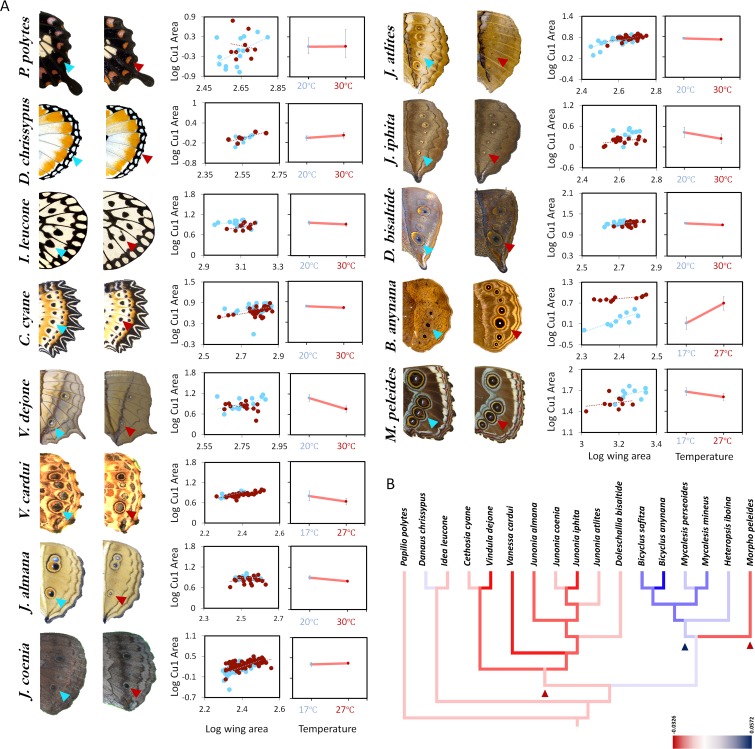
Figure 1—source data 1. Supporting details for Figure 1.
Table S1 - Species reared for comparative morphometrics, gene expression and hormonal measurements. Table S2 - F statistics, p-values from analysis of covariance for differences in Cu1 eyespot size between rearing temperatures (fixed factor) and assigned character state for phylogenetic analysis.

Figure 1.

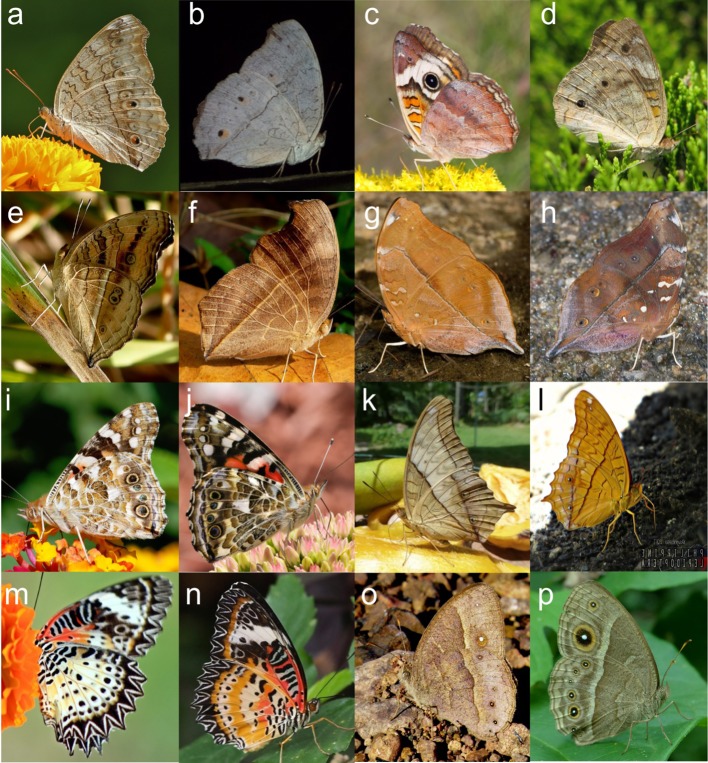
Figure 1—figure supplement 1. Phenotypic plasticity in wing patterns is observed across a wide variety of species in wild.

Figure 1—figure supplement 1.

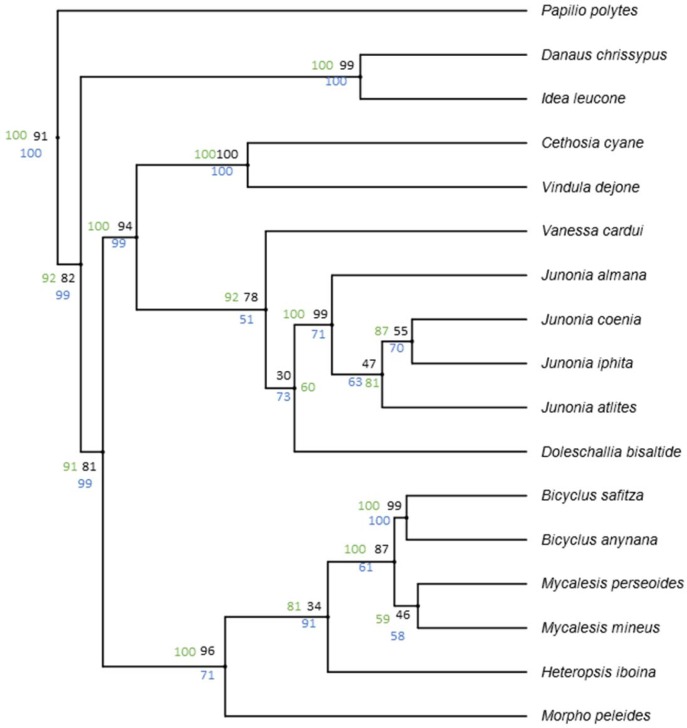
Figure 1—figure supplement 2. Data from Wahlberg et al. (2009) show high support value for the basal nodes across different analysis methods.

Figure 1—figure supplement 2.

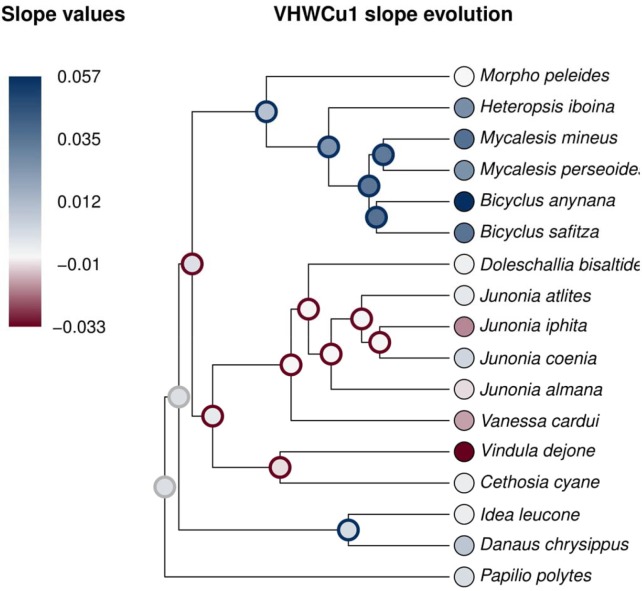
Figure 1—figure supplement 3. Ancestral state reconstruction using maximum likelihood models suggest that positive directionality of plasticity is a derived trait in Satyrid butterflies.

Figure 1—figure supplement 3.

Ancestral states are significantly positive (blue outline), significantly negative (red outline), or not significantly different from zero (gray outline).

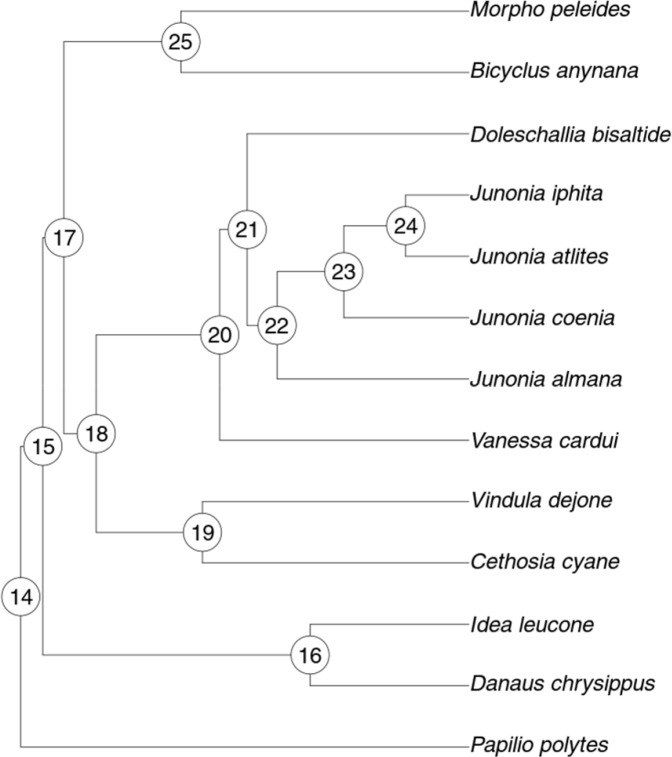
Figure 1—figure supplement 4. Tree used for ancestral state hypotheses tests.

Figure 1—figure supplement 4.

See text and Figure 4—source data 1 for explanation of node numbers.