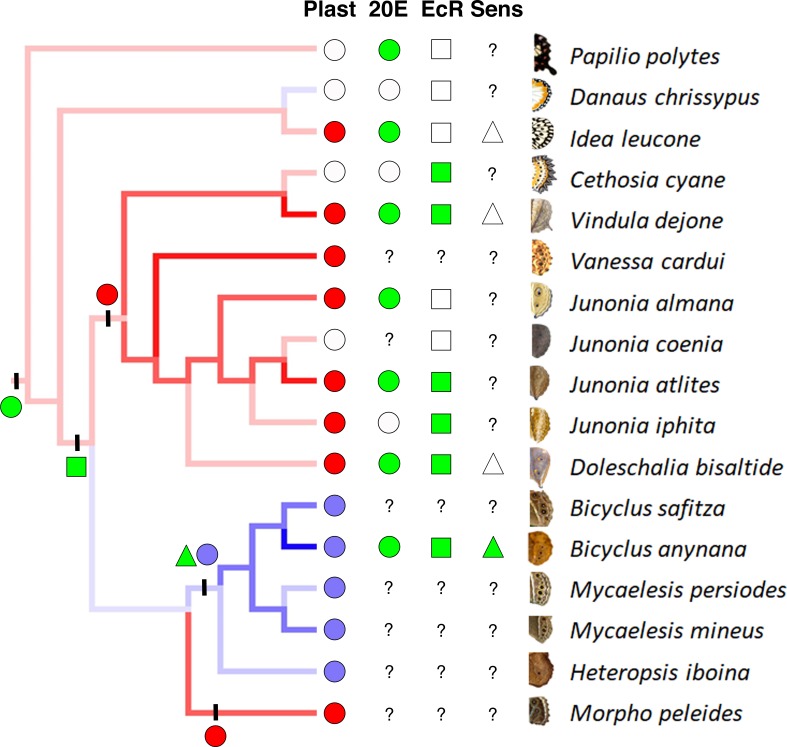
Figure 4. Phenotypic plasticity as a complex trait evolved gradually.
Phylogenetic analysis suggests three independent origins for two different patterns of eyespot size plasticity (eyespot size decreases with increasing temperatures: red lineages and red circles, and eyespot size increases with increasing temperature: blue lineage and blue circles). Empty circles represent a lack of plastic response. Green circles (character state 1) represent high 20E titers with increasing temperature, while white circles (character state 0) represent no significant difference in titers at two developmental temperatures. Green squares represent presence of EcR in eyespots, while white squares represent its absence. EcR expression in eyespots is inferred to have originated concurrently with the origin of eyespots, about 85 Mya, and subsequently lost in a few nymphalid lineages. Green triangles represent sensitivity towards 20E (character state 1), while white triangles represent absence of sensitivity (character state 0). Question marks represent missing data points. Circles, square and triangle on left with vertical bars represent respective estimated evolution of eyespot size plasticity (red and blue circles), 20E titer plasticity (green circle), EcR expression in eyespots (green square) and sensitivity towards 20E (green triangle). Alternative models using Maximum Likelihood reach similar conclusions (Supplementary Information: Figure 1—figure supplement 2, 3, Figure 4—source data 1). H. iboina image copyright of David.C. Lees, Cambridge University Department of Zoology.

