
Figure 2. MHb neuron subtypes can be distinguished transcriptionally.
(A) Location of MHb and ISH of Tac2 expression from the Allen Institute Database. Tac2 expression is restricted to cells in the MHb in this region. (B) Tac2 serves as an excellent marker for MHb neurons in the dataset of SCTs (Scale on right shows normalized (log) gene expression.) (C) Left: Illustration showing patterns of gene expression observed for DEGs using the Allen Institute Database. Right: Sample ISH images from the Allen Institute Database showing selected differentially expressed genes for distinct transcriptionally defined neuronal subtypes in MHb. (D) Left: Dendrogram with MHb subtype labels corresponding to clusters shown in (Figure 2—figure supplement 1C). Right: Heatmap showing the relative expression (mean z- scored) of selected genes that are enriched in each MHb neuron subtype. Spatial distributions of enriched genes highlighted in (C) are labeled in red.

Figure 2—figure supplement 1. Subclustering of MHb neurons before and after subtraction of heterogeneity introduced by elevated expression of activity-dependent genes (ADGs).

Figure 2—figure supplement 2. Sample ISH images showing spatial distribution of selected differentially expressed genes in MHb.

Figure 2—figure supplement 3. Differentially expressed genes define distinct habenular subtypes.

Figure 2—figure supplement 4. Ion channel diversity in MHb and LHb neuronal subtypes.

Figure 2—figure supplement 5. Ion channel diversity in MHb and LHb neuronal subtypes (part 2).

Figure 2—figure supplement 6. Neurotransmitter receptor diversity in MHb and LHb neuronal subtypes.

Figure 2—figure supplement 7. Neurotransmitter receptor diversity in MHb and LHb neuronal subtypes (part 2).
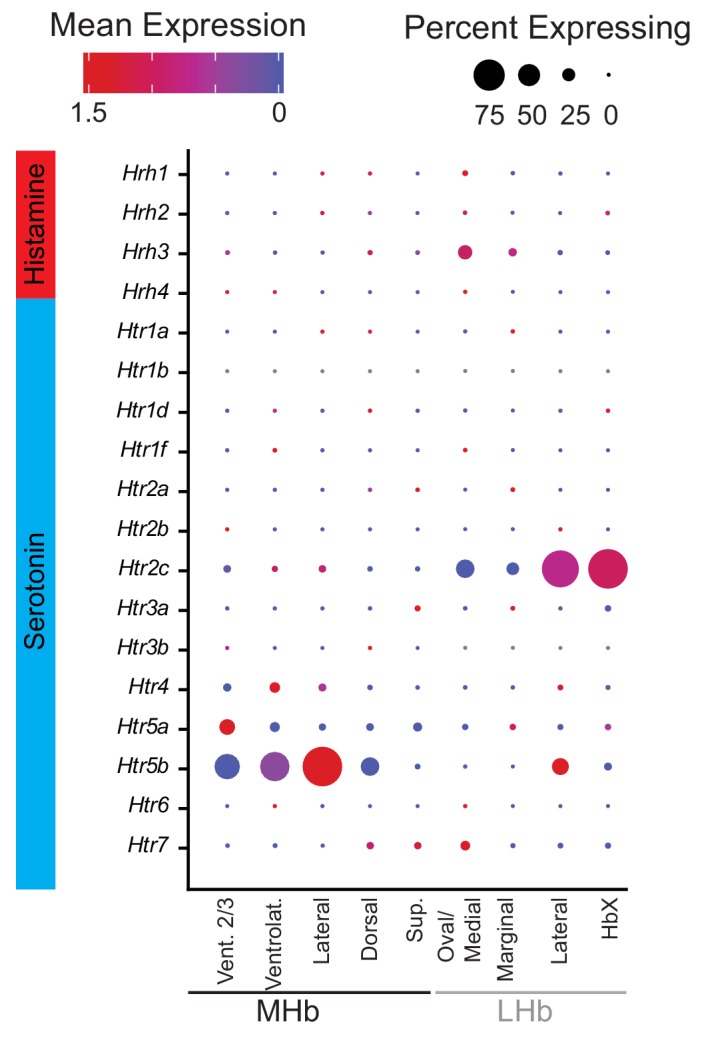
Figure 2—figure supplement 8. GPCR diversity in MHb and LHb neuronal subtypes.

Figure 2—figure supplement 9. GPCR diversity in MHb and LHb neuronal subtypes (part 2).

Figure 2—figure supplement 10. GPCR diversity in MHb and LHb neuronal subtypes (part 3).

Figure 2—figure supplement 11. GPCR diversity in MHb and LHb neuronal subtypes (part 4).
