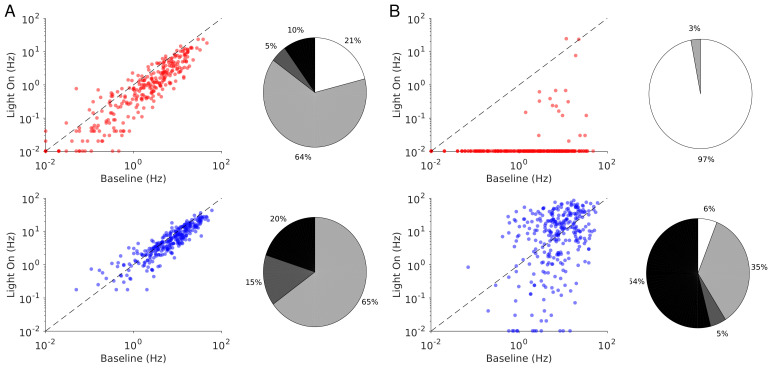
Figure 8. Single neuron firing rates in the PC and PV populations upon PV activation for two values of the light intensity (Model 1 with ).
(A) Single neuron firing rates at baseline vs. at . (B) Same for . Top: PCs. Bottom: PV neurons. Scatter plots of 300 randomly chosen PC and PV neurons. Pie charts for the whole population. Firing rates were estimated over 100s simulation time. Neurons with rates smaller than 0.01Hz are plotted at 0.01Hz. Color code as in Figure 6. Parameters as in Figure 7.

