Abstract
The lipophilic vs. hydrophilic properties of three protic ruthenium compounds were studied as a function of pH. Specifically, we measured log(Do/w) values for [(N,N)2Ru(6,6’-dhbp)]2+ complexes (where N,N = 2,2’-bipyridine (1A), 1,10-phenanthroline (2A), 2,3-dihydro-[1,4]dioxino[2,3-f][1,10]phenanthroline (3A) and 6,6’-dhbp is the diprotic 6,6’-dihydroxy-2,2’-bipyridine ligand) from pH 4.0 to 8.0. This study allowed us to demonstrate that as the ligand is deprotonated at higher pH values the resulting neutral charge on the complex improves its lipophilic properties. Thus, improved uptake by passive diffusion is expected with protic ligands on Ru(II). Furthermore, cellular studies have demonstrated that passive diffusion is the dominant pathway for cellular uptake. However, metabolic inhibition has also shown that energy dependent efflux reduces the amount of the ruthenium complex (as measured by mean fluorescence intensity) in the cells. These compounds have been shown by fluorescence microscopy to accumulate in the nuclei of cancer cells (MCF7, MDA-MB-231, and HeLa). Taken together, this data shows that uptake is required for toxicity but uptake alone is not sufficient. The greatest light activated toxicity appears to occur in breast cancer cell lines with relatively moderate uptake (MCF7 and MDA-MB-231) rather than the cell line with the greatest uptake of complex 3A (normal breast cell line MCF-10A).
Keywords: Ruthenium, Anticancer, Photodynamic Therapy, Cellular Uptake, Cellular Efflux, Protic Ligands
Graphical Abstract
1. Introduction
The anti-proliferative properties of certain ruthenium complexes are known to depend on their uptake into cells. Several mechanisms are possible for cellular uptake including energy independent processes such as passive diffusion and facilitated diffusion.[1–3] Energy dependent uptake and efflux of drugs can also occur and these processes are termed active transport.[1–3] For many ruthenium complexes, both active transport and passive diffusion both occur although the relative amount of each process can vary depending on drug concentration (which influences passive diffusion) and the gene expression of the cell line (which can up regulate pumps and proteins for active transport).[4] This paper is focused on studying how the charge of protic ruthenium complexes can influence their passive diffusion. Passive diffusion is difficult to directly measure, but it can be estimated based on the distribution coefficient which quantifies how the ionizable metal complex distributes between octanol and water.[5–10] One key innovation in this paper is in determining how distribution coefficients for protic ruthenium complexes vary as a function of pH. While pH dependent distribution coefficients are well established for protic organic drugs,[5, 7, 11] very few papers have studied this phenomenon with protic metallodrugs.[12]
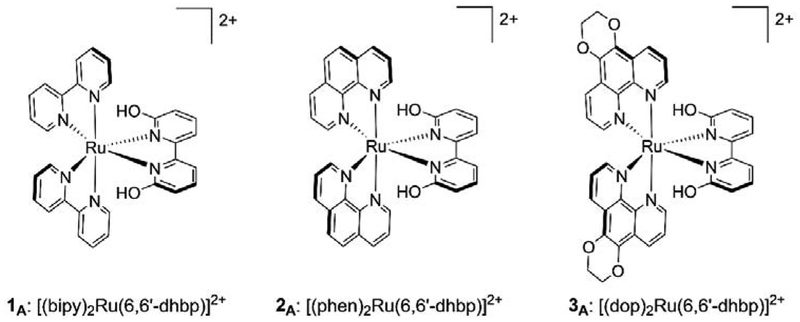
Recently, we reported a series of light activated ruthenium complexes, [(N,N)2Ru(6,6’-dhbp)]2+, wherein (N,N) is varied from 2,2’-bipyridine (bipy) (in 1A) to 1,10-phenanthroline (phen) (in 2A) to 2,3-dihydro-[1,4]dioxino[2,3-f][1,10]phenanthroline (dop) (in 3A) (Figure 1).[13–15] The protic ligand, 6,6’-dihydroxy-2,2’-bipyridine (6,6’-dhbp), provides a means of changing the complex charge with pH. As shown in Figure 1, at low pH the complexes are in their dicationic form (XA) where the subscript A indicates the acidic form is present (Scheme 1). Importantly, deprotonation events change the charge of the metal complex and the neutral form of the complex is achieved at elevated pH values (Scheme 1, XB with subscript B for basic form). Thus, for complex 1 the known pKa values in Table 1 indicate that the dicationic species 1A predominates at pH 5, but at physiological pH values (pH = 7.5) the neutral species 1B predominates. Although the pKa values are slightly different for 2 and 3, a similar trend applies and at physiological pH values both complexes are mostly deprotonated and present as the neutral species, 2B and 3B. Complexes 1-3 were synthesized as the dicationic acidic forms (1A-3A, isolated as the dichloride salt), but they are readily deprotonated in cell media at pH 7.4. These complexes show light activated toxicity with the best phototoxicity being observed for complex 3 in breast cancer cells (Table 2 shows an excerpt of our previously reported data.[14]) This phototoxicity was originally attributed to light triggered ligand loss (photodissociation), but more recent studies suggest the mechanism may be more complicated and it appears that singlet oxygen formation (rather than photodissociation) is responsible for the observed phototoxicity of 3.[16] Further work on this topic is in progress and will be reported separately. Despite a complex mechanism for phototoxicity, it is clear that having a protic ligands offers advantages by comparing OH bearing complexes to their OMe analogs.[14, 16] The methoxy substituted ligands (e.g. 6,6’-dimethoxy-2,2’-bipyridine = 6,6’-dmbp) led to ruthenium complexes (e.g. [(dop)2Ru(6,6’-dmbp)]2+) that were non-toxic (in both light and dark conditions).[16]
Figure 1.
The three [(N,N)Ru(6,6’-dhbp)]2+ complexes used in this study. All complexes were isolated and used as the dichloride salt.
Scheme 1.
Protonation/deprotonation pathway for complexes 1A, 2A, and 3A.
Table 1.
Thermodynamic Acidity Data for Compounds 1A, 2 A, and 3Aa
| Compound | Structure | pKa1 | pKa2 | pKa avg |
|---|---|---|---|---|
| 1A | [(bipy)2Ru(6,6’-dhbp)]2+ | 5.26 | 7.27 | 6.3 |
| 2A | [(phen)2Ru(6,6’-dhbp)]2+ | 5.2(2) | 6.8(2) | 6.0(1) |
| 3A | [(dop)2Ru(6,6’-dhbp)]2+ | 5.0(2) | 6.8(2) | 5.9(1) |
Table 2.
Cell Viability Data for Treatment with 1A–3A in the Dark and upon Irradiation for One Hour with Blue Light (450 nm)a
| vs MDA-MD-231 (breast CSC) | vs MCF7 (breast cancer) | |||||
|---|---|---|---|---|---|---|
| compound | IC50 dark | IC50 light | PIb | IC50 dark | IC50 light | PI |
| 1A | 1010 | 290 | 3.5 | >500 | >500 | ~1 |
| 2A | 280 | 83 | 3.3 | 490 | 180 | 2.8 |
| 3A | 190 | 3.7 | 52 | 490 | 4.1 | 120 |
| MCF10A (normal) | vs HeLa (cervical cancer) | |||||
| compound | IC50 dark | IC50 light | PIb | IC50 dark | IC50 light | PI |
| 1A | >500 | 210 | >2.4 | 148 | 202 | 0.73 |
| 2A | 110 | 13 | 9 | 1440 | 383 | 3.8 |
| 3A | 58 | 29 | 2 | 730 | 120 | 6 |
IC50 values are in μM and were previously reported.[14]
The phototoxicity index (PI) is the ratio of IC50 in the dark to IC50 in the light.
In this work, we measure log(Do/w) as a function of pH and discuss what this data implies for the mechanism of cellular uptake. We use D (distribution coefficient) rather than P (partition coefficient which is frequently used for aprotic compounds[8]) because D is more appropriate for ionizable compounds. Do/w refers to the concentration of all ruthenium species in octanol divided by the concentration of all ruthenium species in water or buffered aqueous solution. Log(Do/w) gives a rough estimate of drug uptake by passive diffusion. Lipophilic complexes display positive log(Do/w) values that are ideally between 2–6 for good cellular uptake with sufficient water solubility for drug administration.[6, 17–19] While our prior work discussed log(Do/w) values at pH 7.4, this work is the first example of measuring the distribution coefficient as a function of pH for a protic metallo-prodrug. Therefore, these results can elucidate how uptake by passive diffusion will vary in different pH environments. It is well-established that cancer cells and hypoxic tumors can acidify their surroundings due to metabolic abnormalities including an overreliance on fermentation.[20–22] This is known as the aerobic glycolysis or the Warburg effect. This leads to the expectation that uptake by passive diffusion may vary as a function of extracellular pH. Herein, we present evidence to show that the factors that determine the net uptake of 1-3 in cells include a combination of uptake by passive diffusion and active transport including predominantly efflux.
2. Materials and Methods
2.1. Materials and Instrumentation
1-Octanol (99.99%) was purchased from Acros Organics and used without further purification. Compounds 1–3 were synthesized using published methods without modification.[14, 23] Buffer solutions for Log(Do/w) measurements were prepared fresh at 0.1M acetate (pH 4.00–5.25) or 0.1M phosphate (pH 5.8–8.0). UV-Visible spectra were collected on a Perkin Elmer Lambda 35 spectrometer and measured in the range of 300–700 nm.
2.2. Log(Do/w) as a function of pH Measurements
1-octanol and buffer at a given pH were mixed in a 1:1 ratio and stirred for 24 h before use to ensure the solutions were saturated with the corresponding solution. The procedure used to measure Log(Do/w) as a function of pH was a modified “shake flask” method that was deemed acceptable for use by measuring the Log(Do/w) at pH 7.4 of 5-fluorouracil and comparing those results to reported literature values.[24] These experiments were carried out under dark conditions to protect the compounds from light exposure.[14, 24–26] As a general procedure, the ruthenium compound of interest (200 μM) was first dissolved in n-octanol saturated with buffer. A portion of this solution (5 mL) was then mixed with an equal volume of buffer saturated with n-octanol and gently stirred for 24 h at ambient temperature while avoiding light exposure. Afterwards, an aliquot was removed from the aqueous phase, filtered, and the absorbance was measured via UV-Vis spectroscopy to determine the concentration in the aqueous phase. Typical procedures call for centrifugation of the solution[27, 28] however due to the light-sensitive nature of the analyzed complexes, the samples were filtered while being prepared in a dark room. A small amount of white precipitate was observed in the octanol phase which was believed to be insoluble buffer salts and not the compounds of interest which are deeply colored. From this data, the concentration of the compound in the organic phase was calculated and used to establish a Log(Do/w) value (Eq. 1). All measurements were done in quadruplicate at a given pH value with the average Log(Do/w) reported.
| Eq. 1 |
2.3. Cell Culture
HeLa, MCF7, MDA-MB-231, and MCF10A cell lines were purchased from ATCC. HeLa, MCF7, and MDA-MB-231 were grown with DMEM (Gibco, 21063–029) supplemented with 10% FBS (Gibco, 26140079). MCF10A was grown with MEGM (Lonza Walkersville CC4136). All cells were grown in humidified incubators at 37°C with 5% CO2.
2.3.1. pH External of Various Cell Lines
3×10⁵ cells were seeded in 6 well plate and incubated for overnight to let them adhere to the plate. Media was replaced once, and the pH was measured over 48 h using a Mettler Toledo pH meter.
2.3.2. Measuring Uptake of the Ru Complex 3 at Varying Concentrations by Flow Cytometry
Cells were treated with 500 nM, 5 μM, 50 μM, and 100 μM of complex 3 in a dark room and incubated for 1 h at 37 °C. After incubation, cells were washed with phosphate buffered saline (PBS) and then irradiated by blue light (Philips, goLITE) for 30 min at 37 °C. Uptake of Ru was detected in FL4 channel using Bio-Rad S3e sorter and measured by mean fluorescent intensity (MFI). There is precedence in the literature for measuring uptake of ruthenium complexes by MFI using flow cytometry.[2, 3, 29] We note that there are limitations to using MFI to determine uptake. Here, we are observing the inherent luminescence of the ruthenium complexes, and this luminescence is sensitive to the local environment. We cannot rule out the possibility that certain biological molecules may quench the excited state for the ruthenium complexes, and this may produce less MFI in certain cellular environments.
2.3.3. Measuring Uptake of the Ru Complex 3 Under Metabolic Inhibition
Uptake of complex 3 was analyzed during inhibition of metabolic activity following a procedure from the Barton group.[30] Briefly, cells were treated with 50 mM of 2-deoxy-D-glucose (Acros Organics, 111980010) and 5 μM of oligomycin A (Tocris Bioscience, 4110/5) PBS for 1 h at 37°C with 5% CO2 and washed with PBS. After the inhibition, cells were treated with various concentrations of 3 in PBS for the metabolic activity inhibition samples and media for the control samples. Then, the uptake of the Ru compound was analyzed by flow cytometry.
2.3.4. Immunofluorescence Imaging of Ru Localization
Cells were seeded in a chamber slide (Greiner Bio-One, 543079) and incubated overnight at 37nel and analy2 for stable attachment. Nuclei were stained using Hoechst 33342 (Invitrogen, H1399) 5 μM of complex 3 was added to cells in the dark room for 30 min. After incubation, the cells were irradiated by blue light to activate the complex for 15 min. All images were acquired within 5 min after incubation and irradiation, using Nikon C2+ confocal microscope.
3. Results and Discussion
3.1. Interpreting Log(Do/w) values in terms of the pKa values and the lipophilicity of each species.
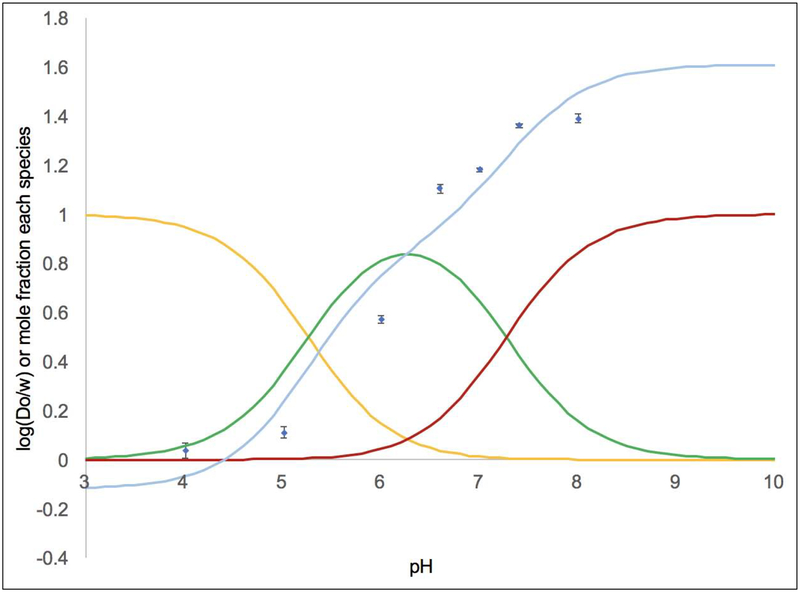
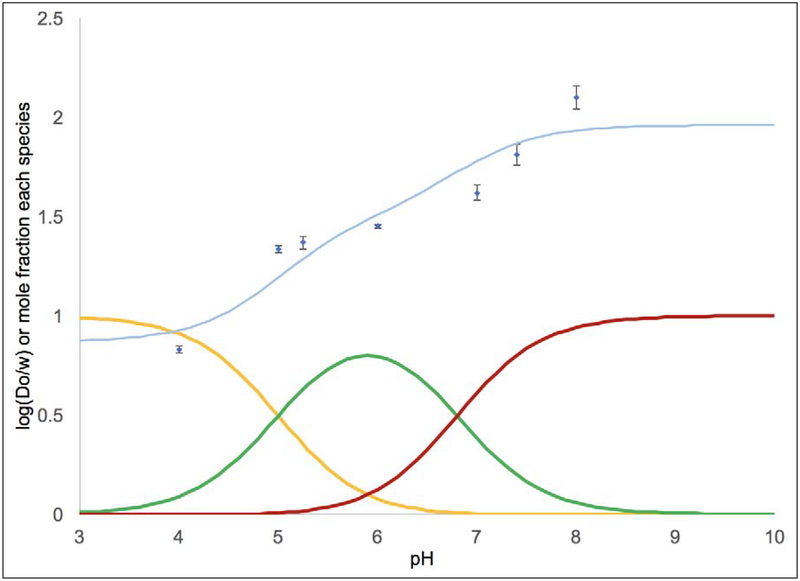
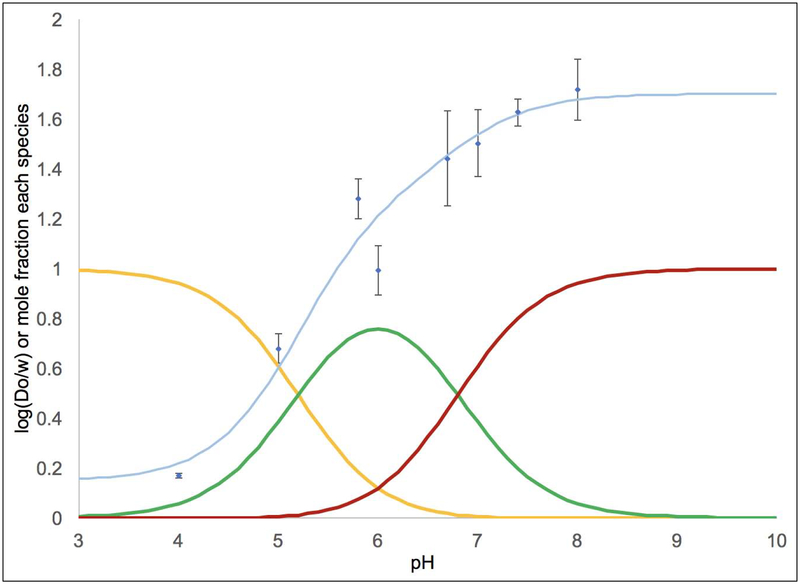
The Log(Do/w) values were measured across a pH range of 4.00–8.00 in acetate or phosphate buffer (Table 3 and Figures 2–4). This range of pH values allows us to quantify the lipophilicity of the acidic form (XA) at low pH and the basic form (XB) at high pH. Across the pH range, compound 3 generally had the highest Log(Do/w) values followed by compounds 2 and 1. For complex 1, Figure 2 shows the Log(Do/w) values as a function of pH as blue diamonds. The mole fractions of 1A (in yellow), the monoprotic form of 1 (in green), and 1B were calculated based upon the pKa values and superimposed on this plot.[31] Each observed Log(Do/w) value was assumed to arise from a weighted average of the Log(Do/w) values for each protonation state and the mole fraction of that protonation state. This allowed us to compute a calculated Log(Do/w) value at each pH value based upon empirically varying the Log(Do/w) values for each species until the error between the observed and calculated Log(Do/w) values was minimized. The results of this analysis are shown in Table 4. It should be noted that the Log(Do/w) values for XA and XB are known more precisely than for the monoprotic species. At low pH, the observed Log(Do/w) arises from mostly XA in solution and at high pH the Log(Do/w) arises from mostly XB in solution. However, even at intermediate pH values (e.g. pH 6.0 to 6.6 for 1) where there is ~80–83% of the monoprotic species, there is still a significant amount of 1A and 1B at these pH values. Thus, the value obtained for Log(Do/w) for the monoprotic species is highly dependent on what value is assigned to 1A and 1B based upon the high and low pH data.
Table 3.
Log(Do/w) Values for Compounds 1A, 2A, and 3Aa
| 1A | 2A | 3A | ||
|---|---|---|---|---|
| pH | Log(Do/w) | Log(Do/w) | Log(Do/w) | |
| 0.1M Acetate Buffer | 4.00 | 0.04(3) | 0.17(1) | 0.83(2) |
| 5.00 | 0.11(2) | 0.68(6) | 1.33(2) | |
| - | - | 1.37(3) | ||
| 0.1M Phosphate Buffer | 5.80 | - | 1.3(1) | - |
| 6.00 | 0.57(2) | 1.0(1) | 1.45(1) | |
| 6.60 | 1.10(2) | - | - | |
| 6.70 | - | 1.4(2) | - | |
| 7.00 | 1.18(1) | 1.5(1) | 1.62(4) | |
| 7.40 | 1.36(1) | 1.63(5) | 1.81(5) | |
| 8.00 | 1.39(2) | 1.7(2) | 2.10(6) |
All Log(Do/w) values were measured in quadruplicate.
Figure 2.
Log(Do/w) as a function of pH data for 1 is shown by the blue diamonds with error bars. The pKa values were used to calculate the proportion of the diprotic acid 1A (shown in yellow), the monoprotic species (in green), and the conjugate base 1B (in red). The curve fit in light blue shows that predicted Log(Do/w) values of −0.1 for 1A, 0.9 for the monoprotic species, and 1.6 for 1B produce a satisfactory fit. To generate the fit, the Log(Do/w) values for these species were empirically varied until the predicted Log(Do/w) (as a weighted average considering the proportion of each species and its Log(Do/w) value) closely matched the observed Log(Do/w) at each pH.
Figure 4.
Log(Do/w) as a function of pH data for 3 is shown by the blue diamonds with error bars. The pKa values were used to calculate the proportion of the diprotic acid 3A (shown in yellow), the monoprotic species (in green), and the conjugate base 3B (in red). The curve fit in light blue shows that predicted Log(Do/w) values of 0.9 for 3A, 1.5 for the monoprotic species, and 2.0 for 3B produce a satisfactory fit. To generate the fit, the Log(Do/w) values for these species were empirically varied until the predicted Log(Do/w) (as a weighted average considering the proportion of each species and its Log(Do/w) value) closely matched the observed Log(Do/w) at each pH.
Table 4.
Estimated Log(Do/w) Values for Protonation States of 1, 2, and 3a
| 1 | 2 | 3 | |
|---|---|---|---|
| Log(Do/w) | Log(Do/w) | Log(Do/w) | |
| Acidic Form (XA) | −0.1 | 0.2 | 0.9 |
| Monoprotic Acid | 0.9 | 1.3 | 1.5 |
| Basic Form (XB) | 1.6 | 1.7 | 2.0 |
Examining this data more closely (Tables 3 and 4, Figures 2–4), it is clear that at physiological pH (7.4) the mole fractions of 1B, the monoprotic species, and 1A are ~0.57, 0.42 and 0.003, respectively. This leads to the observed Log(Do/w) of 1.36(1) at pH 7.4, where the major species is 1B. For 2, lower pKa values (Table 1) lead to mole fractions for 2B, the monoprotic species, and 2A of ~0.80, 0.20 and 0.001, respectively, and the observed Log(Do/w) is 1.63(1) at pH 7.4. Here the increased acidity allowed the lipophilicity of 2B to dominate, even though the Log(Do/w) values for 1B and 2B are similar. Finally, for 3, the pKa values and the fraction of each species at pH 7.4 (~0.8, 0.2, and 8×10⁻⁴, respectively) are similar to that seen for 2. Therefore, the lipophilicity increase from 2 to 3 (Log(Do/w) is 1.81(5) at pH 7.4 for 3) is due to the structure of 3 including more aliphatic rings rather than the pKa values, which are similar.
Comparing the acidic forms (XA) to the basic forms (XB), it is clear that doubly deprotonating the ligand and forming a neutral species allows the Log(Do/w) values to increase by ~1.7 (for 1) to ~1.1 (for 3) orders of magnitude. Similarly, we recently synthesized [(phen)2Ru(6,6’-dmbp)]2+ and [(dop)2Ru(6,6’-dmbp)]2+ (where 6,6’-dmbp = 6,6’-dimethoxy-2,2’-bipyridine) which are aprotic and displayed negative Log(Do/w) values of −1.3(2) and −1.1(1), respectively.[16] The increased hydrophilicity can be attributed to the 2+ charge on each complex that results from using the 6,6’-dmbp ligand in place of 6,6’-dhbp. A lack of toxicity (in the dark and the light) for these compounds was attributed primarily to both unfavorable Log(Do/w) values and secondarily to mechanistic differences in light activation.[16]
3.2. Variations in the pH External (pHe) of the Cell Lines Studied and Implications for the Mechanism of Cellular Uptake.
At this stage, we hypothesized that variations in the external pH (pHe) could lead to differences in ruthenium complex uptake by passive diffusion, and we would expect a lower pHe would lead to less uptake. Therefore, we measured the decrease in pHe over 48 h without changing the media in one non-cancerous (normal) breast epithelial cell line (MCF10A), two breast cancer cell lines (MCF7 and MDA-MB-231), and in one cervical cancer cell line (HeLa) (Table 5). The results showed that HeLa cells acidified their surroundings more than the breast cell lines. While HeLa had relatively low uptake as expected, the correlation between Δ(pHe) and cellular uptake of complex 3 as measured by mean fluorescence intensity (MFI) was not consistent across all cell lines (Table 5). This suggests that passive diffusion may not be the only factor. The observed uptake appears to be related to both uptake by passive diffusion and efflux (by active transport) as described below. Furthermore, during most experiments (e.g. those leading to MFI and IC50 data in Table 5) the media was changed regularly which prevented a significant pHe drop. Thus, although certain cell lines do acidify the surroundings more than the others, the media supplied results in a similar pHe observed in practice from cell line to cell line.
Table 5.
The Change in pHe over 48 h in Various Cell Lines and Uptake of Complex 3.
| Cell Line | Δ(pHe) over 48 ha | MFIb | IC50 Dark for 3c | IC50 Light for 3c |
|---|---|---|---|---|
| MCF10A | −0.32 ± 0.01 | 1189 ± 654 | 58 | 29 |
| MDA-MD-231 | −0.49 ± 0.09 | 181 ± 84 | 190 | 3.7 |
| MCF7 | −0.12 ± 0.03 | 596 ± 206 | 490 | 4.1 |
| HeLa | −0.88 ± 0.07 | 322 ± 134 | 730 | 120 |
The external pH was monitored for 48 h without changing the media. Each result is the average of five experiments.
Mean fluorescence intensity (MFI) is assumed to be proportional to uptake of 3. See the experimental section for a discussion of the limitations of this assumption. All cell lines were treated with 50 μM of 3 in the dark. These experiments were under typical conditions which included changing the media regularly.
IC50 values were reported previously and are shown in μM.[14]
3.3. Cellular uptake and efflux mechanism for complex 3.
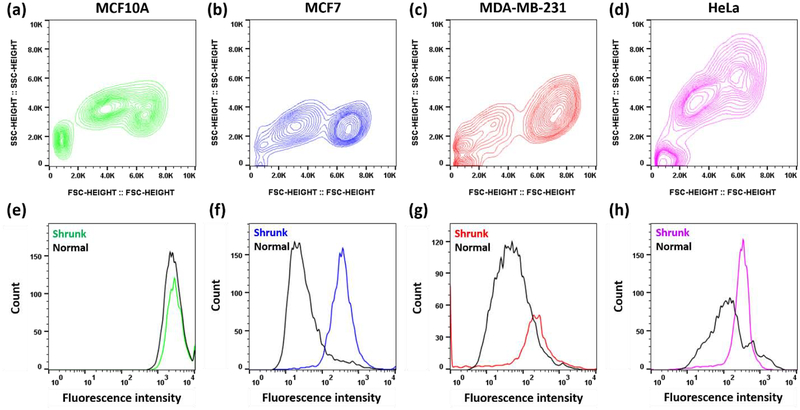
We hypothesized that the specific phototoxicity of complex 3 could be related to its cellular uptake. To test this hypothesis, cells were treated with various concentrations of complex 3, and the uptake was measured by utilizing the inherent fluorescence of the Ru complex. Herein, we measured MFI by flow cytometry to provide a qualitative measure of uptake, and while this information is not quantitative and it has limitations (see experimental section) it can provide a useful means of comparing uptake in different cell lines and under different conditions. As such, it has been used by other researchers to determine the mechanism of ruthenium drug uptake in cells.[2, 3, 29] In all cell lines at 50 μM of complex 3, we observed two distinct populations (Figure 5). All cancer cells (i.e., all except MCF10A) showed higher uptake of complex 3 in the shrunk cell population (Figure 5). It appears that cell shrinkage is a result of the uptake of complex 3 in cancer cells.
Figure 5.
MCF10A, MCF7, MDA-MB-231, and HeLa cells were administered with 50 μM of 3A and were studied by flow cytometry. (a – d) Flow cytometry contour plots of cell size and granularity were detected using forward scatter (FSC) and side scatter (SSC), respectively. Cell debris was detected at bottom left corner for all cell lines (≤ 2.0K SSC, ≤ 2.0K FSC). The population on the left indicates cells with smaller sizes, i.e., shrunk cells (FSC 2.0K-4.0K), whereas the population on the right indicates cells with normal sizes (FSC ≥5.0K). (e – h) Flow cytometry histogram analysis shows fluorescence intensity which is proportional to the Ru concentration. Shrunk and normal cells correspond to the same populations from a-d.
The uptake of complex 3 was measured by mean fluorescence intensity (MFI) as a function of the concentration for the shrunk population using flow cytometry (Figure 6). In all samples, we observed that MFI is directly proportional to external Ru concentration. This implies that the dominant mechanism of Ru uptake was via passive diffusion. Interestingly, we observed a higher uptake of complex 3 with the non-cancerous cell line MCF10A vs. the other cell lines, which made sense as a relatively high dark toxicity was observed for 3 vs. MCF10A (IC50 = 58 μM).
Figure 6.
Cellular uptake of 3A as a function of concentration (x axis) is proportional to the mean fluorescence intensity (MFI) ± SD (y axis). Cells were treated with 0 – 100 μM of 3A in the dark. (a) MCF10A. (b) MCF7. (c) MDA-MB-231. (d) HeLa. The no drug control (-) shows the inherent fluorescence for the cells in the absence of 3A.
Furthermore, to determine if light enhances uptake, we measured drug uptake both in the dark and under blue-light irradiation conditions (Figure 7). We did not observe any increase in uptake upon light irradiation. In all cell lines except MCF10A, light irradiation caused an apparent decrease in uptake which can better be interpreted as light leads to cell death in these cells with sufficient uptake, and thus only the cells with low uptake survive and are observed. Further experiments to probe photoactivated uptake are discussed below.
Figure 7.
Representative flow cytometry analysis of the influence of light on cellular uptake of 50 μM of 3A. Fluorescence intensity is proportional to the Ru concentration in cells. (a) MCF10A. (b) MCF7. (c) MDA-MB-231. (d) HeLa. This data suggests that light does not cause increased uptake.
Others have used metabolic inhibitors such as deoxyglucose and oligomycin to determine whether uptake and efflux is energy dependent or independent.[2, 3] We tested the impact of deoxyglucose and oligomycin on cellular uptake of 3 in a variety of cell lines (Figure 8). When ATP production was inhibited, we observed a significantly higher MFI in all cancer cell lines (i.e., all cell lines except MCF10A). Since this shows a higher uptake of 3 with metabolic inhibition, this ruled out the possibility of energy-dependent active transport of the complex into the cells. On the contrary, this suggests that there may be an energy-dependent efflux of the compounds out of the cancer cells in normal cell culture conditions. This is not surprising as the high activity of efflux pumps is a known characteristic of cancer cells and have been previously attributed to their drug resistance.[1]
Figure 8.
Representative flow cytometry analysis of cellular uptake of 50 μM of 3A as measured by MFI in the dark under normal metabolism (control in blue) and under metabolic inhibition conditions (with deoxyglucose and oligomycin in red). (a) MCF10A. (b) MCF7. (c) MDA-MB-231. (d) HeLa. Fluorescence intensity is proportional to the Ru concentration in cells.
3.4. Subcellular localization of the ruthenium complex 3.
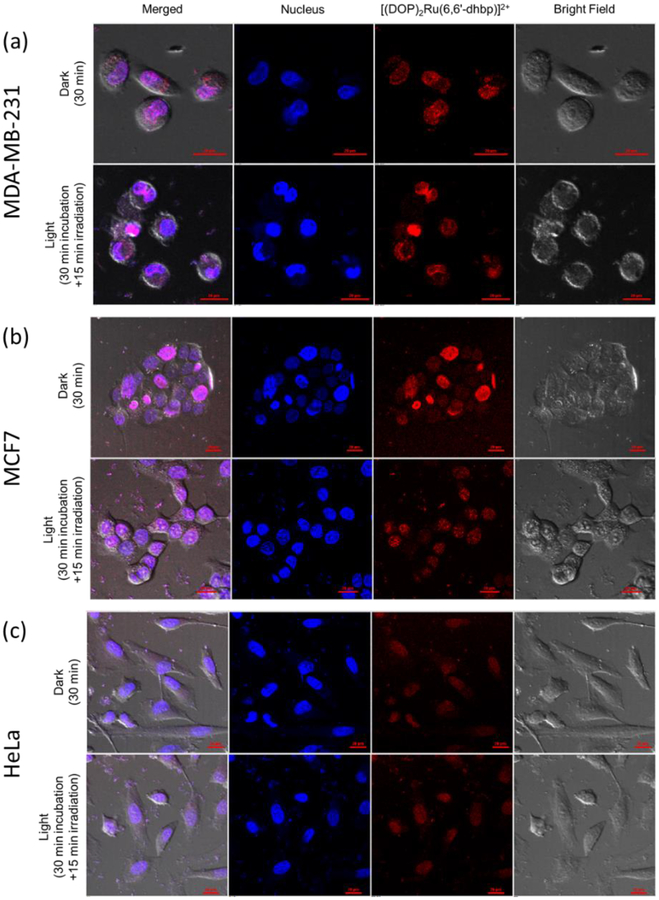
Despite the relatively low uptake of complex 3 in MDA-MB-231 and MCF7 (as compared to MCF10A), complex 3 showed a promising light-dependent cytotoxicity in these breast cancer cell lines.[14] Many cytotoxic ruthenium complexes have been shown to localize in the nucleus of cells and bind to DNA [32–34]. Thus, we studied the localization of 3 by using fluorescence microscopy after its uptake in three cancer cell lines, MDA-MB-231, MCF7, and HeLa (Figure 9). Cellular uptake was visualized in the dark and upon irradiation with blue light to determine if light influences subcellular localization. The normal cells, MCF10A, were also treated with complex 3 in the dark and visualized (Figure S4). Interestingly, our Ru complex was localized in the nucleus after the treatment with 3 in the dark in all four cell lines. As shown in Figure 9, light irradiation did not increase the amount of complex 3 in the cancerous cells, and this result suggests either that photoactivated uptake is not occurring or that the laser light used for the fluorescence imaging in the “dark” experiments in Figure 9 is sufficient to cause photoactivated uptake. In our prior publication,[14] uptake was measured in the dark by ICP-MS and this suggests that photoactivated uptake is not the major route of entry for complex 3 from the combined data.[32] Interestingly, nuclear localization occurred despite low uptake in several cell lines (Table 5). This suggests that the mode of action for light induced activity may involve either direct binding of the Ru complexes to DNA or the ability of these complexes to generate reactive oxygen species (ROS) in proximity to DNA upon light irradiation.
Figure 9.
Localization of complex 3A (5μM) after treatment in the dark and in the blue light. (a)MDA-MB-231. (b) MCF7. (c) HeLa. Ru complex (TRITC; red), nuclei (Hoechst 33342; blue). Scale bar: 20 μm.
4. Conclusion
The observed uptake of our most toxic light activated complex, 3, results from a combination of uptake by passive diffusion and energy dependent efflux. Uptake by passive diffusion is more favorable for 3 vs. 1 or 2 due increased hydrophobicity for 3 and higher log(Do/w) values at each pH studied. Furthermore, we can compare ([(dop) Ru(6,6’-dmbp)]2+) to 3 ([(dop) Ru(6,6’-dhbp)]2+) and see that the presence of the protic 6,6’-dhbp ligand increases the hydrophobicity by nearly 3 log(Do/w) units (−1.1(1) to 1.81(5), respectively, at pH 7.4). For compounds 1, 2, and 3, going from the acidic form (XA) to the basic form (XB) increases the log(Do/w) values by 1.1 (for 3) to 1.7 (for 1). Thus, cellular Δ(pHe) was measured (without changing the media for 48 h) and may be expected to influence uptake by passive diffusion in scenarios where pHe is not tightly controlled (e.g. hypoxic solid tumors). For example, externally acidic cancerous cells displaying the Warburg phenotype are expected to display less uptake of protic metallodrugs; this prediction was born out for HeLa cells with acidification of the surrounding and relatively low uptake (Table 5). However, in practice frequently changing the media for cultured cancer cells prevents a significant change in pHe and thus the Warburg phenotype was not well correlated with decreased uptake in all cell lines that we studied.
By investigating the influence of metabolic inhibition, we observed that MDA-MB-231 cells show the greatest increase in Ru uptake when ATP production is inhibited. This suggests that this cell line has more efflux pumps that under normal metabolic conditions pump out complex 3 to counteract passive diffusion into the cell. This results in the lowest concentration of 3 in the MDA-MB-231 cells by MFI. In contrast, the cell line MCF10A shows no difference in the concentration of 3 in cells with and without metabolic inhibition. This shows a lack of efflux pumps for this normal cell line, and passive diffusion into the cells without efflux leads to a higher concentration of 3 in these cells (Table 5). The remaining cell lines (MCF7 and HeLa) are intermediate in showing some efflux out of the cells and thus intermediate uptake by MFI values. Subcellular localization studies show that 3 goes readily to the nucleus in the dark in both the normal and cancerous cell lines. The highest net uptake of 3 appears to lead to the highest dark toxicity in MCF10A. However, the data does not suggest an explanation for why greater light activated toxicity is seen in certain cell lines (MDA-MB-231 and MCF7). Most likely, this relates to the inherent vulnerability of these cancerous cell lines to ROS generated upon treatment with light rather than simply being correlated with uptake alone. Good uptake is required for toxicity and this paper has explored the factors (passive diffusion and efflux) that influence uptake, but uptake alone is not sufficient for light driven toxicity.
Supplementary Material
Figure 3.
Log(Do/w) as a function of pH data for 2 is shown by the blue diamonds with error bars. The pKa values were used to calculate the proportion of the diprotic acid 2A (shown in yellow), the monoprotic species (in green), and the conjugate base 2B (in red). The curve fit in light blue shows that predicted Log(Do/w) values of 0.2 for 2A, 1.3 for the monoprotic species, and 1.7 for 2B produce a satisfactory fit. To generate the fit, the Log(Do/w) values for these species were empirically varied until the predicted Log(Do/w) (as a weighted average considering the proportion of each species and its Log(Do/w) value) closely matched the observed Log(Do/w) at each pH.
Synopsis.
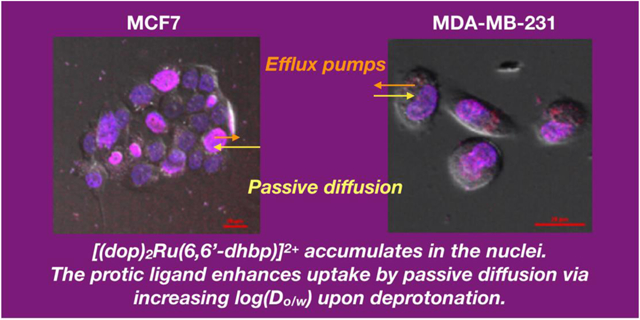
The cellular uptake for protic ruthenium anticancer complexes is primarily due to uptake by passive diffusion and energy dependent efflux. Passive diffusion is influenced by the charge of the complexes as determined by pH and this allows for an uptake advantage that occurs with the use of protic ligands.
Highlights.
The lipophilicity of a ruthenium prodrug is influenced by its charge and its acidity.
Enhanced lipophilicity leads to enhanced uptake by passive diffusion.
The uptake of a cytotoxic ruthenium complex is primarily by passive diffusion.
Metabolic inhibition shows that energy dependent efflux removes ruthenium from cells.
Protic ruthenium complexes localize in the nucleus of cancer cells.
Acknowledgements
This work was supported by the National Science Foundation EPSCoR Track 2 Grant (OIA-1539035), the Undergraduate Creativity and Research Academy (UCRA) at UA, the Research Grants Committee (RGC) at UA, and the Alabama Commission on Higher Education Fellowship (to S.P.). We thank the NSF REU (CHE 1358971) program for full support to Angela Hairston and partial support to Sarah Altman. We acknowledge partial support from NIH (RGM132803A).
Abbreviations
- bipy
2,2’-bipyridine
- 6,6’-dhbp
6,6’-dihydroxy-2,2’-bipyridine
- 6,6’-dmbp
6,6’-dimethoxy-2,2’-bipyridine
- dop
2,3-dihydro-[1,4]dioxino[2,3-f][1,10]phenanthroline
- HeLa
A cervical cancer cell line derived from Henrietta Lacks
- Log D(o/w)
Distribution Coefficient in octanol vs. water
- MCF7
A breast cancer cell line (Michigan Cancer Foundation-7)
- MCF10A
A “normal-like” breast cell line (Michigan Cancer Foundation-10A)
- MDA-MB-231
A breast cancer cell line (MD Anderson Metastatic Breast cancer-231)
- MFI
Mean fluorescence intensity
- phen
1,10-phenanthroline
- PI
Phototoxicity Index = IC50 Dark/IC50 Light
- XA
The fully protonated species of a given complex 1, 2, or 3
- XB
The fully deprotonated species of a given complex 1, 2, or 3
Footnotes
Publisher's Disclaimer: This is a PDF file of an unedited manuscript that has been accepted for publication. As a service to our customers we are providing this early version of the manuscript. The manuscript will undergo copyediting, typesetting, and review of the resulting proofbefore it is published in its final form. Please note that during the production process errors may be discovered which could affect the content, and all legal disclaimers that apply to the journal pertain.
Conflict of Interest Statement
The Authors declare no conflict of interest.
References
- [1].Spreckelmeyer S, van der Zee M, Bertrand B, Bodio E, Stürup S, Casini A, Frontiers in chemistry, 6 (2018) 377. [DOI] [PMC free article] [PubMed] [Google Scholar]
- [2].Puckett CA, Barton JK, Biochemistry, 47 (2008) 11711–11716. [DOI] [PMC free article] [PubMed] [Google Scholar]
- [3].Puckett CA, Barton JK, J. Am. Chem. Soc, 129 (2007) 46–47. [DOI] [PMC free article] [PubMed] [Google Scholar]
- [4].Klajner M, Licona C, Fetzer L, Hebraud P, Mellitzer G, Pfeffer M, Harlepp S, Gaiddon C, Inorg. Chem, 53 (2014) 5150–5158. [DOI] [PubMed] [Google Scholar]
- [5].Mehling T, Kloss L, Ingram T, Smirnova I, Langmuir, 29 (2013) 1035–1044. [DOI] [PubMed] [Google Scholar]
- [6].Tardito S, Bassanetti I, Bignardi C, Elviri L, Tegoni M, Mucchino C, Bussolati O, Franchi-Gazzola R, Marchiò L, J. Am. Chem. Soc, 133 (2011) 6235–6242. [DOI] [PubMed] [Google Scholar]
- [7].Ingram T, Richter U, Mehling T, Smirnova I, Fluid Phase Equilib, 305 (2011) 197–203. [Google Scholar]
- [8].Mannhold R, Poda GI, Ostermann C, Tetko IV, J. Pharm. Sci, 98 (2009) 861–893. [DOI] [PubMed] [Google Scholar]
- [9].Fetzer L, Boff B, Ali M, Meng X, Collin J-P, Sirlin C, Gaiddon C, Pfeffer M, Dalton Trans, 40 (2011) 8869–8878. [DOI] [PubMed] [Google Scholar]
- [10].Huang H, Zhang P, Chen H, Ji L, Chao H, Chem. - Eur. J, 21 (2015) 715–725. [DOI] [PubMed] [Google Scholar]
- [11].Yoshida F, Topliss JG, J. Med. Chem, 43 (2000) 2575–2585. [DOI] [PubMed] [Google Scholar]
- [12].Tsopelas FN, Ochsenk hn-Petropoulou MT, Tsantili-Kakoulidou A, Ochsenk hn K-M, Anal. Bioanal. Chem, 381 (2004) 420–426. [DOI] [PubMed] [Google Scholar]
- [13].Hufziger KT, Thowfeik FS, Charboneau DJ, Nieto I, Dougherty WG, Kassel WS, Dudley TJ, Merino EJ, Papish ET, Paul JJ, J. Inorg. Biochem, 130 (2014) 103–111. [DOI] [PMC free article] [PubMed] [Google Scholar]
- [14].Qu F, Park S, Martinez K, Gray JL, Thowfeik FS, Lundeen JA, Kuhn AE, Charboneau DJ, Gerlach DL, Lockart MM, Law JA, Jernigan KL, Chambers N, Zeller M, Piro NA, Kassel WS, Schmehl RH, Paul JJ, Merino EJ, Kim Y, Papish ET, Inorg. Chem, 56 (2017) 7519–7532. [DOI] [PubMed] [Google Scholar]
- [15].Papish ET, Paul JJ, Merino EJ, (2014) Patent Application filed with US Patent Office [Google Scholar]
- [16].Qu F, Martinez K, Arcidiacono AM, Park S, Zeller M, Schmehl RH, Paul JJ, Kim Y, Papish ET, Dalton Trans, 47 (2018) 15685–15693. [DOI] [PubMed] [Google Scholar]
- [17].Zeng L, Chen Y, Huang H, Wang J, Zhao D, Ji L, Chao H, Chem. Eur. J, 21 (2015) 15308–15319. [DOI] [PubMed] [Google Scholar]
- [18].Chow MJ, Babak MV, Wong DYQ, Pastorin G, Gaiddon C, Ang WH, Mol. Pharm, 13 (2016) 2543–2554. [DOI] [PubMed] [Google Scholar]
- [19].Tabrizi L, Chiniforoshan H, Dalton Trans, 45 (2016) 18333–18345. [DOI] [PubMed] [Google Scholar]
- [20].Cardone RA, Casavola V, Reshkin SJ, Nat. Rev. Cancer, 5 (2005) 786–795. [DOI] [PubMed] [Google Scholar]
- [21].Gatenby RA, Gillies RJ, Nat. Rev. Cancer, 4 (2004) 891–899. [DOI] [PubMed] [Google Scholar]
- [22].Seyfried TN, Flores RE, Poff AM, D’Agostino DP, Carcinogenesis, 35 (2014) 515–527. [DOI] [PMC free article] [PubMed] [Google Scholar]
- [23].Hufziger KT, Thowfeik FS, Charboneau DJ, Nieto I, Dougherty WG, Kassel WS, Dudley TJ, Merino EJ, Papish ET, Paul JJ, J Inorg Biochem, 130 (2014) 103–111. [DOI] [PMC free article] [PubMed] [Google Scholar]
- [24].El Maghraby GMM, Williams AC, Barry BW, Int. J. Pharm, 292 (2005) 179–185. [DOI] [PubMed] [Google Scholar]
- [25].Ghosh G, Colon KL, Fuller A, Sainuddin T, Bradner E, McCain J, Monro SMA, Yin H, Hetu MW, Cameron CG, McFarland SA, Inorg. Chem, 57 (2018) 7694–7712. [DOI] [PMC free article] [PubMed] [Google Scholar]
- [26].Morris ME, Clin. Pharmacol. Ther. (N. Y., NY, U. S.), 91 (2012) 767–768. [Google Scholar]
- [27].Chang SW, Lewis AR, Prosser KE, Thompson JR, Gladkikh M, Bally MB, Warren JJ, Walsby CJ, Inorg. Chem, 55 (2016) 4850–4863. [DOI] [PubMed] [Google Scholar]
- [28].Fang L, Gou S, Zhao J, Sun Y, Cheng L, Eur. J. Med. Chem, 69 (2013) 842–847. [DOI] [PubMed] [Google Scholar]
- [29].Li X, Heimann K, Dinh XT, Keene FR, Collins JG, Mol. BioSyst, 12 (2016) 3032–3045. [DOI] [PubMed] [Google Scholar]
- [30].Puckett CA, Barton JK, Biochemistry-Us, 47 (2008) 11711–11716. [DOI] [PMC free article] [PubMed] [Google Scholar]
- [31].McCord P Fraction of Species. https://ch301.cm.utexas.edu/help/ch302/ab/fracspecies.pdf (accessed 1/10/2019).
- [32].Svensson FR, Matson M, Li M, Lincoln P, Biophys. Chem, 149 (2010) 102–106. [DOI] [PubMed] [Google Scholar]
- [33].Klajner M, Licona C, Fetzer L, Hebraud P, Mellitzer G, Pfeffer M, Harlepp S, Gaiddon C, Inorg Chem, 53 (2014) 5150–5158. [DOI] [PubMed] [Google Scholar]
- [34].Li FF, Collins JG, Keene FR, Chem Soc Rev, 44 (2015) 2529–2542. [DOI] [PubMed] [Google Scholar]
Associated Data
This section collects any data citations, data availability statements, or supplementary materials included in this article.


