Abstract
Agarose gel electrophoresis is one of the most straightforward techniques that can be used to differentiate between topoisomers of closed circular DNA molecules. Generally, the products of reactions that monitor the interconversion of DNA between negatively supercoiled and relaxed DNA or positively supercoiled and relaxed DNA can be resolved by one-dimensional gel electrophoresis. However, in more complex reactions that contain both positively and negatively supercoiled DNA, one-dimensional resolution is insufficient. In these cases, a second dimension of gel electrophoresis is necessary. This chapter describes the technique of two-dimensional agarose gel electrophoresis and how it can be used to resolve a spectrum of DNA topoisomers.
1. Introduction
The superhelicity of DNA can have a profound effect on a number of DNA processes including replication, transcription, and recombination.[1–7] Therefore, it is important to be able to distinguish DNA molecules that are underwound (negatively supercoiled), contain no torsional stress (relaxed), and overwound (positively supercoiled). The easiest way to resolve supercoiled and relaxed DNA topoisomers is by agarose gel electrophoresis. In order to maintain the topological state of DNA during electrophoresis, the molecules must be in a “closed” system (i.e. the ends cannot have free-rotation). Therefore, this method applies primarily to circular DNA molecules.
Because the charges on DNA come from the phosphate groups in the DNA backbone, all DNA molecules have the same charge-to-mass ratio. Thus, in a vacuum, DNA topoisomers would all migrate at the same rate. However, when subjected to electrophoresis through a gel matrix, smaller or more compact molecules migrate more readily through the medium than a molecule that has more volume. When DNA is in a “relaxed” state, in which there is no torsional stress on the molecule, it maintains a more open structure (Fig. 1). Thus, it has a wide diameter. However, when torsional stress is applied to the molecule by increasing or decreasing the number of turns of the double helix, free DNA converts ~75% of the torsional stress to axial stress,[1] which is manifested by the double helix wrapping around itself to form “superhelical twists.” As seen in Fig. 1, superhelical twisting leads to a more compact structure of DNA; the greater the superhelical twisting (or supercoiling), the more compact the structure. Therefore, the more supercoiled the DNA molecule, the faster it will migrate through an agarose gel toward the cathode. Superhelical twists occur in discrete units (i.e., molecules will have 1, 2, 3, … etc. DNA nodes or crossovers). Individual DNA topoisomers (i.e., plasmids with a specific number of DNA nodes or superhelical twists) will run as distinct bands.
Fig. 1: Interconversion of DNA topoisomers.

DNA that is not under torsional stress is referred to as “relaxed” (center), while over- and underwinding results in DNA that is positively (left) or negatively (right) supercoiled, respectively. The term “supercoiled” is derived from the fact that when under torsional stress, some of the stress is alleviated by the DNA forming superhelical twists about itself.
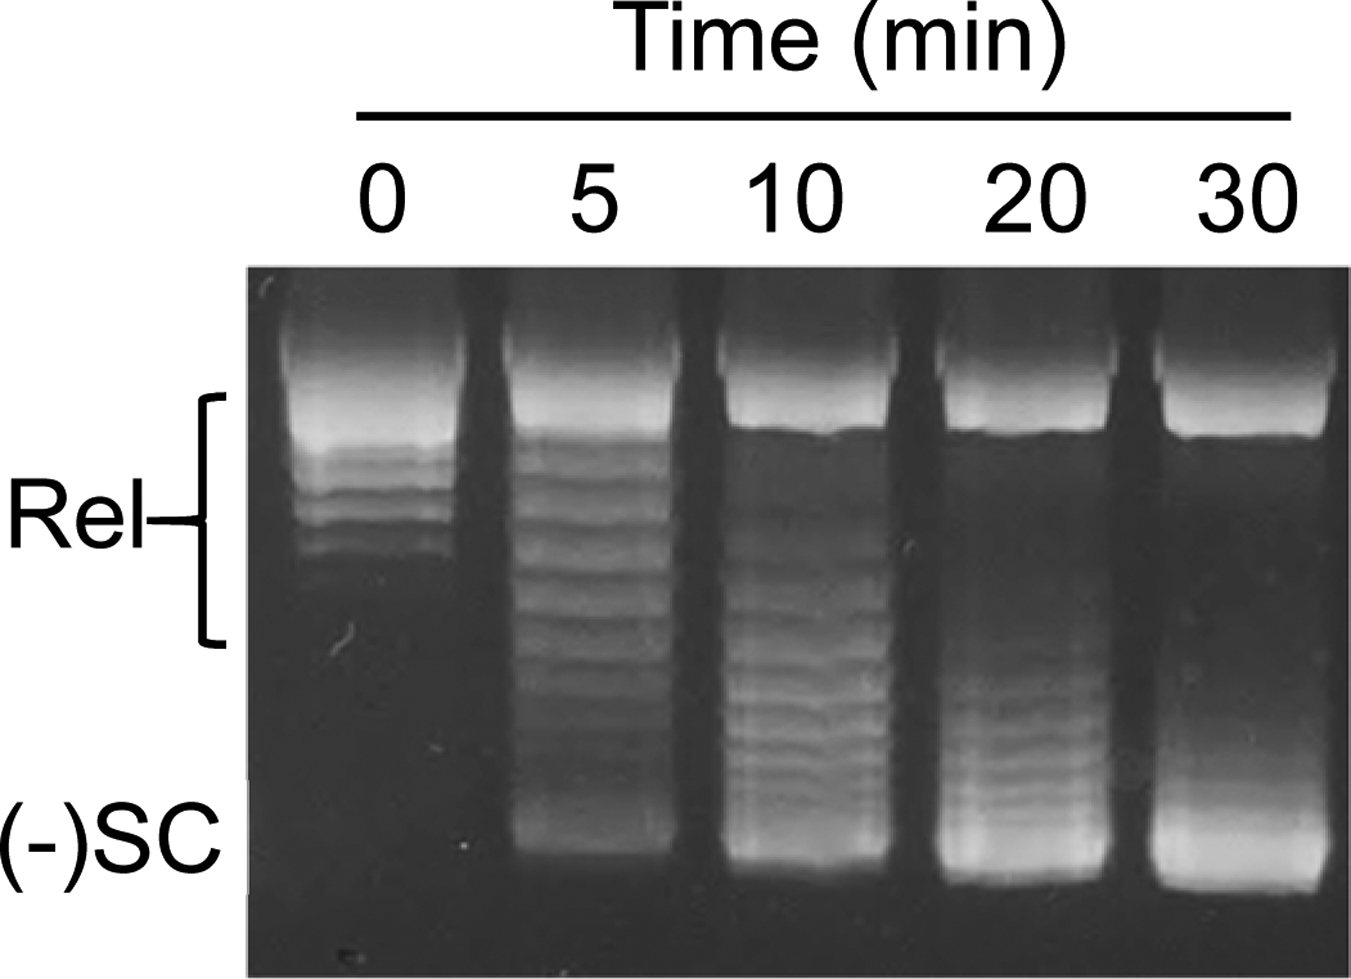
When monitoring reactions in which a DNA molecule is being converted from relaxed to negatively or positively supercoiled, or from supercoiled to relaxed, one-dimensional electrophoresis is generally sufficient to resolve topoisomers (Fig. 2). In these cases, all of the intermediate DNA topoisomers will contain a number of supercoils ranging from that of the substrate to that of the product. In the example shown in Fig. 2, the time course follows a reaction in which a relaxed plasmid is converted to a negatively supercoiled molecule by an enzyme known as DNA gyrase.[8,5,6] Hence, all of the individual DNA bands that are visualized contain either no supercoils (relaxed) or some number of negative supercoils.
Fig. 2: One-dimensional resolution of relaxed and negatively supercoiled DNA topoisomers.

A time course for the conversion of relaxed plasmid to negatively supercoiled molecules by S. aureus gyrase is shown. Reaction products were resolved by one-dimensional agarose gel electrophoresis and DNA bands were visualized by mid-range ultraviolet light following staining with ethidium bromide. The positions of relaxed (Rel) and negatively supercoiled [(−)SC] DNA are indicated on the gel.
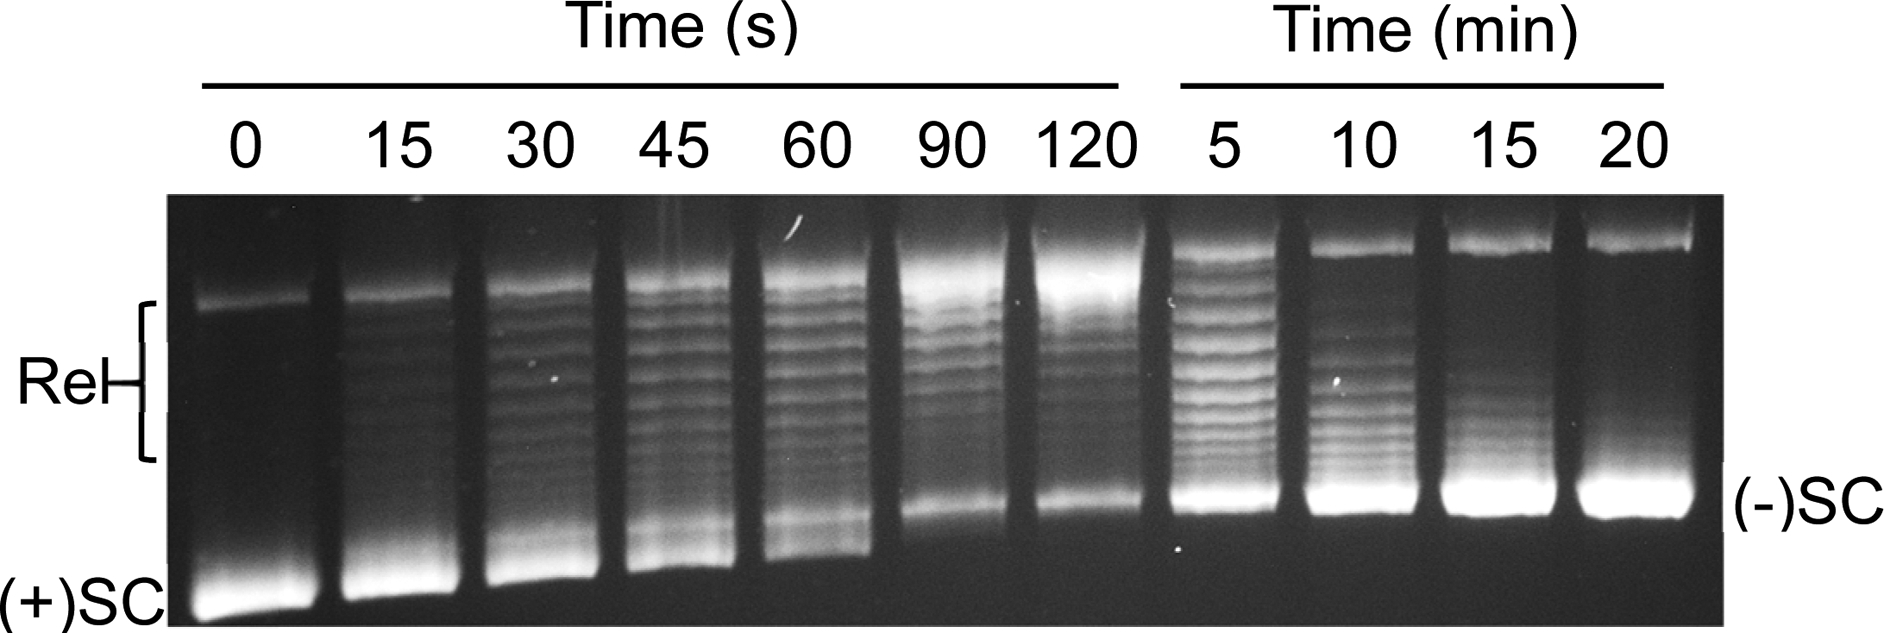
In contrast to the reaction shown in Fig. 2, some reactions are more complex. For example, Fig. 3 shows a time course for the conversion of positively to negatively supercoiled DNA by gyrase.[9–11] In this case, positive supercoils are removed to produce relaxed DNA followed by the introduction of negative supercoils. Positively supercoiled DNA is slightly more compact [1] than its negatively supercoiled counterpart and therefore migrates slightly further on an agarose gel. [12] However, one-dimensional electrophoresis is insufficient to determine whether the intermediate bands are positively or negatively supercoiled. Thus, it is necessary to use two-dimensional electrophoresis to resolve this issue.
Fig. 3: One-dimensional resolution of negatively and positively supercoiled DNA topoisomers.

A time course for the conversion of positively supercoiled plasmid to negatively supercoiled molecules by S. aureus gyrase is shown. Reaction products were resolved by one-dimensional agarose gel electrophoresis and DNA bands were visualized by mid-range ultraviolet light following staining with ethidium bromide. The positions of relaxed (Rel), positively supercoiled [(+)SC], and negatively supercoiled [(−)SC] DNA are indicated on the gel.
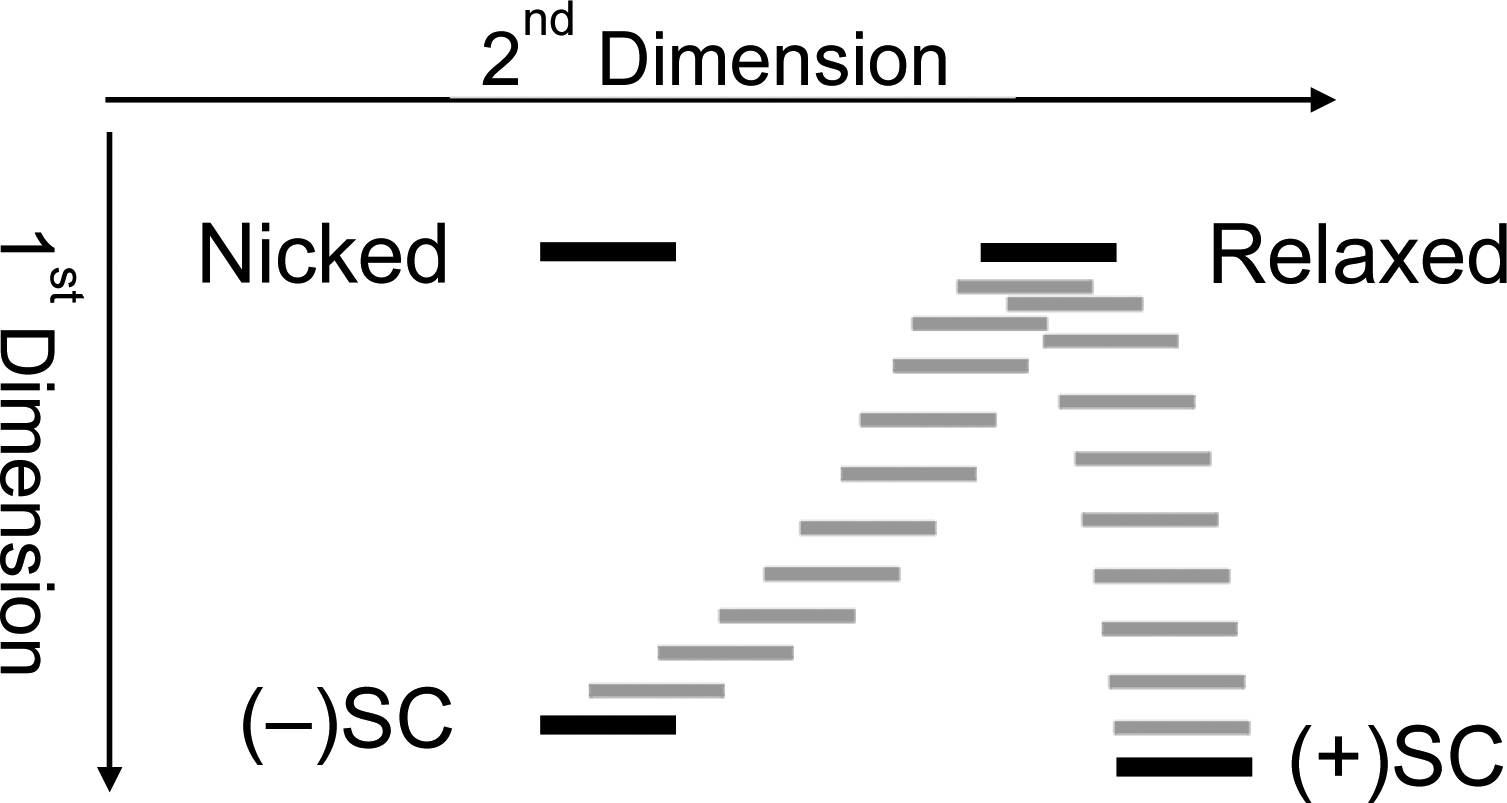
The first dimension in two-dimensional gel electrophoresis separates DNA topoisomers as described above. To distinguish positive from negative intermediate topoisomers, the gel is then soaked in chloroquine, a DNA intercalative agent. DNA intercalators locally unwind the double helix. Because the number of turns of the double helix is invariant in a closed circular system, [1,2] the local underwinding (which is constrained by the presence of the intercalator) is compensated by a global overwinding.[13–15] Hence, negatively supercoiled molecules will tend to look less negatively supercoiled (or even fully relaxed) in the presence of an intercalator and relaxed DNA will tend to look positively supercoiled. Because molecules that already contain a high level of positive superhelical twists cannot absorb very much intercalator, positively supercoiled DNA changes very little in the presence of a DNA intercalator. [12,13] Similarly, the migration of nicked DNA changes relatively little in the presence of an intercalator. This is because the presence of the nick opens the topological system and the absorption of an intercalator does not lead to compensatory overwinding. In the example described below, the amount of chloroquine that is added is sufficient to make negatively supercoiled DNA appear to be fully relaxed and relaxed DNA to be fully positively supercoiled. Once the gel is soaked in chloroquine, it is turned 90° clockwise and is subjected to electrophoresis once again (Fig. 4). Fully relaxed DNA, which comigrates with nicked DNA in the first dimension, migrates considerably further in the second dimension, as it appears to be positively supercoiled. Conversely, the migration of negatively supercoiled DNA (which now appears to be relaxed) in the second dimension is greatly retarded compared to positively supercoiled DNA. The addition of the second dimension allows positively and negatively supercoiled topoisomers to be readily resolved from one another; intermediate positively supercoiled molecules run in an arc between fully positively supercoiled DNA and the apex band of relaxed DNA, whereas intermediately negatively supercoiled DNA runs on an arc between relaxed and fully negatively supercoiled molecules (Fig. 4).
Fig. 4: Schematic depicting the migration of DNA topoisomerases following two-dimensional agarose gel electrophoresis.

The positions of nicked, relaxed, negatively supercoiled [(−)SC], and positively supercoiled [(+)SC] DNA are shown as black bands. Gray bands represent DNA topoisomers of intermediate supercoiling. Partially negatively supercoiled molecules migrate as the arc between relaxed and (−)SC DNA and partially positively supercoiled molecules migrate as the arc between (+)SC and relaxed DNA.
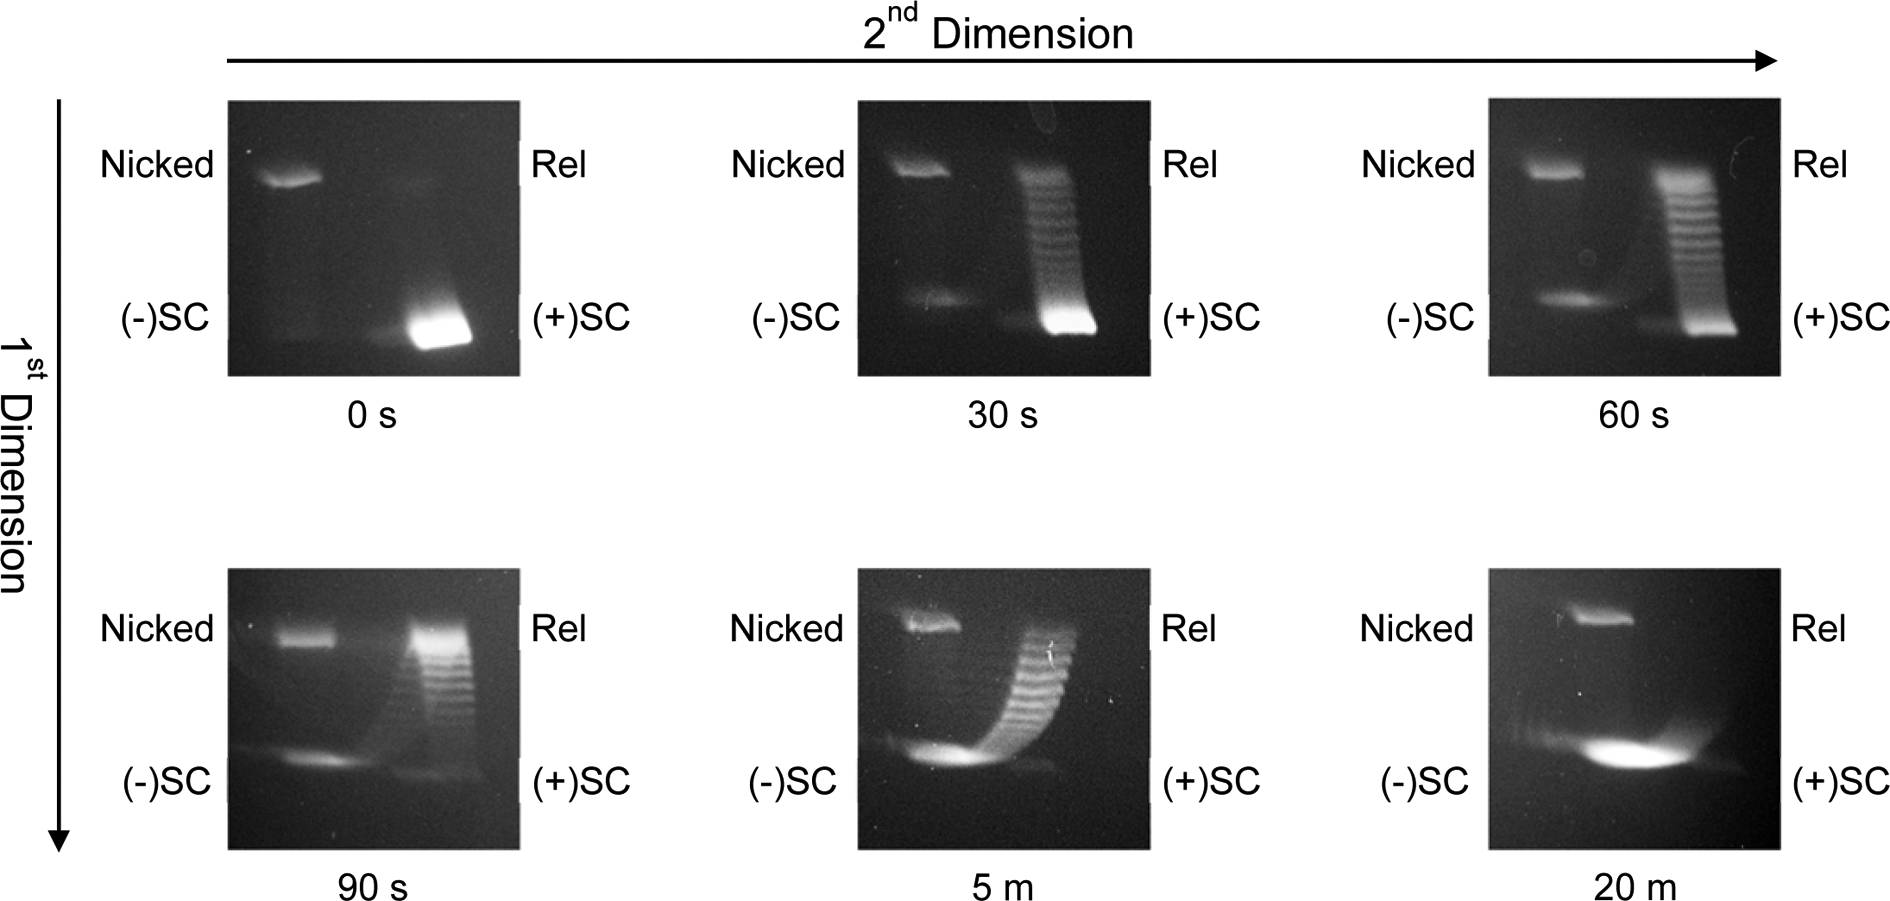
When samples that correspond to those shown in the one-dimensional gel in Fig. 3 are subjected to two-dimensional gel electrophoresis (Fig. 5), it becomes obvious that all of the intermediate bands observed at 30 s are positively supercoiled, that a mixed population is seen at 90 s, and that all of the intermediate bands observed at 5 min are negatively supercoiled topoisomers.
Fig. 5. Two-dimensional resolution of negatively and positively supercoiled DNA topoisomers.

A time course for the conversion of positively supercoiled plasmid to negatively supercoiled molecules by S. aureus gyrase is shown. Reaction products were resolved by two-dimensional agarose gel electrophoresis and DNA bands were visualized by mid-range ultraviolet light following staining with ethidium bromide. Samples at the reaction times shown are from the time course depicted in Fig. 3. The positions of nicked, relaxed (Rel), positively [(+)SC], and negatively supercoiled [(−)SC] DNA are indicated on the gel and methods are described below.
2. Materials
Prepare all reagents at room temperature using deionized water and analytical grade reagents. Unless stated otherwise, all reagents should be stored at room temperature.
Electrophoresis Buffer 10X Stock: 1 M Tris-borate, pH 8.3, and 20 mM EDTA. Add 121.1 g of Tris-base, 61.8 g of Boric acid, and 5.85 g of EDTA to approximately 600 mL of H2O and stir until dissolved. Transfer the solution to a graduated cylinder, add H2O to a final volume of 1 L, and mix thoroughly (see Notes 1–3).
Loading Buffer: 60% sucrose, 10 mM Tris-HCl, pH 7.9, 0.5% bromophenol blue, and 0.5% xylene cyanol FF. Add 6 g of sucrose and 100 μL of 1 M Tris-HCl, pH 7.9, to 6–8 mL of H2O in a graduated cylinder and mix (see Note 4). Add 0.05 g of bromophenol blue, 0.05 g of xylene cyanol FF, and H2O to a final volume of 10 mL and mix thoroughly. Store in 1 mL aliquots. For long-term storage (>1 month), store aliquots at −20 °C.
Chloroquine: 10 mg/mL solution. Add 50 mg of chloroquine to a graduated cylinder, bring the final volume to 5 mL with H2O, and mix thoroughly. Store in a light-proof container at 4 °C (see Note 5).
Ethidium bromide: 10 mg/mL. Add 50 mg of ethidium bromide to a graduated cylinder, bring the final volume to 5 mL with H2O, and mix thoroughly. Store in a light-proof container at 4 °C (see Notes 5and 6).
3. Methods
Preparation of agarose gel: mix 80 mL of Electrophoresis Buffer 10X Stock with 720 mL of H2O to yield 1X Electrophoresis Buffer. Add 1 g of molecular biology grade agarose to 100 mL of 1X Electrophoresis Buffer in a 250 mL Erlenmeyer flask. Heat the mixture in a microwave until the agarose is completely dissolved (heat for 1 min on high, swirl the mixture, and heat on high for an additional 30–45 s until the mixture has reached a low boil, see Note 7). Swirl the mixture to make sure it is fully dissolved and place it in a 50 °C water bath until ready to pour. Gently pour the liquid agarose mixture into a 14×14 cm gel box (avoid trapping bubbles in the gel) and insert a comb ~1 cm from the top of the gel. For the procedure below, a 16 well comb is used. If two combs are used, insert the second comb ~7 cm from the top of the gel. Each comb can support up to 3 samples. Allow the gel to harden at room temperature. It will take ~10–15 min (see Note 8). Cover the solid gel with 1X Electrophoresis Buffer such that the buffer level is ~8–10 mm above the top surface of the gel and carefully remove the comb(s). This protocol will result in a gel that is ~7 mm in depth. The wells that are left following removal of the combs should be ~5–6 mm deep, ~1.5 mm high, and ~5 mm wide.
The example used in this chapter represents a time course for the conversion of positively supercoiled plasmid DNA (pBR322) (see Note 9) to negatively supercoiled plasmid DNA in a reaction mixture containing Staphylococcus aureus gyrase. [11] This electrophoresis protocol can be used to separate supercoiled/relaxed DNA topoisomers from virtually any reaction.
For the purposes of the gel electrophoresis, 25 μL samples are used that contain 2 μL of loading buffer (see Note 10). Samples should contain a minimum of 0.3 μg of DNA for visibility. Samples (20 μL of the DNA samples described above) (see Note 11) should be loaded slowly into the wells using a 20 μL micropipette (see Note 12). If 3 samples are run on the gel, they should be loaded into lanes 1, 6, and 11 of a 16 well comb. If a second comb is used, a single gel can accommodate up to 6 samples.
Electrophoresis should be carried out at 150 V (~100 mA). The anode should be at the top of the gel. Electrophoresis should be carried out for ~2 h or until the bromophenol blue dye front has moved ~halfway down the length of the gel.
Turn off the voltage and carefully transfer the gel to a pan containing ~200 mL of 1X Electrophoresis Buffer containing 4.5 μg/mL chloroquine. The chloroquine-containing solution is prepared by adding 450 μL of 10 mg/mL chloroquine, 100 mL of Electrophoresis Buffer 10X Stock, and H2O to a final volume of 1 L. Make sure that the gel is covered with the chloroquine-containing buffer and soak it for 2 h with gentle agitation.
Turn the gel 90° clockwise from its original position and place it back into the electrophoresis apparatus. Add a sufficient volume of 1X Electrophoresis Buffer containing 4.5 μg/mL chloroquine to cover the gel (once again, by ~8–10 mm), and subject the gel to electrophoresis for 2 h at 120 V (~80 mA).
Turn off the voltage and carefully transfer the gel to a pan containing sufficient H2O to cover and soak the gel for ~15 min with gentle agitation. This step removes excess chloroquine, which will allow the ethidium bromide to intercalate more efficiently.
To stain the gel in order to be able to visualize the DNA bands, transfer it to a pan containing sufficient H2O containing 1 μg/mL ethidium bromide to cover and soak for ~30 min with gentle agitation. The ethidium bromide-containing solution is prepared by adding 30 μL of 10 mg/mL ethidium bromide to 300 mL of H2O.
Destain the gel to remove excess ethidium bromide by transferring the gel to a pan containing sufficient H2O to cover for 10–20 min with gentle agitation (see Note 13).
DNA bands are observed using medium-range ultraviolet light (see Notes 14and 15).
4. Notes
When mixed together, the Tris-borate-EDTA mixture should have a pH of ~8.3 with no further adjustment.
It is preferable to use EDTA, as opposed to NaEDTA, when making the Electrophoresis Buffer 10X Stock. In the presence of Na+ ions, some of the borate in the buffer can be converted to a borax complex, which tends to precipitate out of solution over time. Even when using EDTA, some precipitate may form over several weeks.
If the Electrophoresis Buffer 10X Stock is going to be stored for more than a month, it is desirable to filter it through a 0.22 μm sterilizing filter, which further deters precipitation.
If the sucrose has difficulty dissolving in the Tris-HCl, heat it at 37 °C for 5–10 min. Before adding the dyes, cool the solution to room temperature.
Chloroquine and ethidium bromide are light-sensitive compounds. If a light-proof container is unavailable, the vessel can be wrapped in aluminum foil to protect the solution from light-induced degradation.
Ethidium bromide is a mild carcinogen. Therefore, appropriate caution should be used when handling the compound, (including personal protective equipment) and solutions containing ethidium bromide should be disposed of according to proper safety protocols.
When heating the agarose gel solution, it is critical to make sure that the container is properly vented to avoid a potential pressure explosion.
The clear liquid agarose solution will become opaque upon solidifying.
The described protocol is tailored for use with plasmid pBR322, which is 4363 bp in length. Because all DNA molecules have the same charge-to-mass ratio, electrophoretic separation is based on the size of the plasmid and its topology. Therefore, electrophoresis times or the percentage of agarose in gels may need to be modified if plasmids that are substantially longer or shorter than pBR322 are used. A slightly higher percentage of agarose can be used with shorter plasmids (which will migrate faster than pBR322), and a lower agarose percentage can be used for longer plasmids (which will migrate slower).
Sucrose is present in the loading buffer to increase the density of the samples so that they will sink to the bottom of the well. Therefore, the loading buffer should comprise at least 8% of the total sample volume. Doing so ensures that samples will stay in the wells following loading and that the DNA bands will remain tight. Two dyes, bromophenol blue and xylene cyanol FF, are included in the loading buffer to monitor the electrophoresis. The dyes run differentially when subjected to electrophoresis in the agarose gel. Bromophenol blue migrates more quickly and will move as the dye front ahead of the migrating DNA. Xylene cyanol FF migrates more slowly and follows the DNA.
Even though the assay samples are 25 μL in volume, we generally load only 20 μL into the wells. This keeps the wells from being overloaded and ensures that a consistent volume can be added into each well.
To keep DNA bands from diffusing, it is best to load wells when the power is on. As long as the gel is loaded rapidly, there is no discernable difference in electrophoretic mobility between the first and last samples that are loaded. Although the low level of current poses no danger, it is best to wear gloves while loading.
Even though intercalated ethidium bromide fluoresces considerably more brightly than free molecules, background fluorescence can be seen in the gel. Thus, the destaining step is recommended to decrease background levels of fluorescence.
Ethidium bromide fluoresces with an orange color under medium-wave ultraviolet light. Therefore, an orange filter is generally used when imaging gels. This results in DNA bands that appear as white on a black background.
The topological state of plasmid DNA affects the amount of ethidium bromide that can be intercalated. Nicked or linear DNA can absorb the most ethidium bromide because torsional stress on the DNA induced by intercalation is unconstrained. Other DNA topoisomers absorb ethidium bromide in the following order: negatively supercoiled > relaxed > positively supercoiled. Consequently, the same amount of nicked DNA will fluoresce more brightly than negatively supercoiled, which will fluoresce more brightly than relaxed DNA, which will fluoresce more brightly than positively supercoiled DNA. Thus, images containing different DNA topoisomers should be considered qualitative and levels of DNA in each band cannot necessarily be compared directly with one another in a quantitative manner.
Acknowledgement
Work in the laboratory of the senior author (N.O.) was supported by National Institutes of Health grant GM126363 and US Veterans Administration Merit Review award I01 Bx002198. E.G.G was supported by a Pharmacology Training Grant (5T32GM007628) from the National Institutes of Health and pre-doctoral fellowships from the PhRMA Foundation and the American Association of Pharmaceutical Scientists. A.A.O. was a trainee under National Institutes of Health grant T32-CA009582.
References
- 1.Bates AD, Maxwell A (2005) DNA Topology. Oxford University Press, New York, USA [Google Scholar]
- 2.Deweese JE, Osheroff MA, Osheroff N (2008) DNA topology and topoisomerases: teaching a “knotty” subject. Biochem Mol Biol Educ 37 (1):2–10. [DOI] [PMC free article] [PubMed] [Google Scholar]
- 3.Nitiss JL (2009) DNA topoisomerase II and its growing repertoire of biological functions. Nat Rev Cancer 9 (5):327–337. [DOI] [PMC free article] [PubMed] [Google Scholar]
- 4.Liu Z, Deibler RW, Chan HS, Zechiedrich L (2009) The why and how of DNA unlinking. Nucleic Acids Res 37 (3):661–671. [DOI] [PMC free article] [PubMed] [Google Scholar]
- 5.Chen SH, Chan NL, Hsieh TS (2013) New mechanistic and functional insights into DNA topoisomerases. Annu Rev Biochem 82:139–170. [DOI] [PubMed] [Google Scholar]
- 6.Bush NG, Evans-Roberts K, Maxwell A (2015) DNA topoisomerases. EcoSal Plus 6 (2). [DOI] [PMC free article] [PubMed] [Google Scholar]
- 7.Pommier Y, Sun Y, Huang SN, Nitiss JL (2016) Roles of eukaryotic topoisomerases in transcription, replication and genomic stability. Nat Rev Mol Cell Biol 17 (11):703–721. [DOI] [PMC free article] [PubMed] [Google Scholar]
- 8.Gellert M, Mizuuchi K, O’Dea MH, Nash HA (1976) DNA gyrase: an enzyme that introduces superhelical turns into DNA. Proc Natl Acad Sci U S A 73:3872–3876. [DOI] [PMC free article] [PubMed] [Google Scholar]
- 9.Ashley RE, Dittmore A, McPherson SA, Turnbough CL Jr., Neuman KC, Osheroff N (2017) Activities of gyrase and topoisomerase IV on positively supercoiled DNA. Nucleic Acids Res 45 (16):9611–9624. [DOI] [PMC free article] [PubMed] [Google Scholar]
- 10.Ashley RE, Blower TR, Berger JM, Osheroff N (2017) Recognition of DNA supercoil geometry by Mycobacterium tuberculosis gyrase. Biochemistry 56 (40):5440–5448. [DOI] [PMC free article] [PubMed] [Google Scholar]
- 11.Gibson EG, Bax B, Chan PF, Osheroff N (2019) Mechanistic and structural basis for the actions of the antibacterial gepotidacin against Staphylococcus aureus gyrase. ACS Infect Dis 5 (4):570–581. [DOI] [PMC free article] [PubMed] [Google Scholar]
- 12.McClendon AK, Rodriguez AC, Osheroff N (2005) Human topoisomerase IIα rapidly relaxes positively supercoiled DNA: implications for enzyme action ahead of replication forks. J Biol Chem 280 (47):39337–39345. [DOI] [PubMed] [Google Scholar]
- 13.Fortune JM, Velea L, Graves DE, Osheroff N (1999) DNA topoisomerases as targets for the anticancer drug TAS-103: DNA interactions and topoisomerase catalytic inhibition. Biochemistry 38:15580–15586. [DOI] [PubMed] [Google Scholar]
- 14.Chaires JB (1990) Biophysical chemistry of the daunomycin-DNA interaction. Biophys Chem 35 (2–3):191–202. [DOI] [PubMed] [Google Scholar]
- 15.Graves DE (1999) Drug-DNA interactions In: Bjornsti M-A, Osheroff N () Protocols in DNA topology and DNA topoisomerases, vol 2 Humana Press, Inc., Newark, New Jersey, 785–792 [Google Scholar]


