

Abstract
Purpose
A meta‐analysis was formulated to appraise the diagnostic accuracy of circulating tumor DNA (ctDNA) in hepatocellular carcinoma (HCC).
Materials and Methods
We enrolled all relevant studies published until September 2019. Four primary subgroups were investigated: the subgroup of quantitative or qualitative analysis of ctDNA, the subgroup of Ras association domain family 1 isoform A (RASSF1A) methylation in ctDNA and the subgroup of the combined alpha‐fetoprotein (AFP) and ctDNA assay. We analyzed the pooled sensitivity (SEN), specificity (SPE), positive likelihood ratio (PLR), negative likelihood ratio (NLR), diagnostic odds ratio (DOR), and summary receiver operating characteristic (SROC) as well as the area under the curve (AUC).
Results
A total of 33 qualified articles with 4113 subjects were incorporated into our meta‐analysis. The combined SEN, SPE, and DOR in quantitative studies were 0.722 (95% confidence interval (95% CI): 0.686‐0.756), 0.823 (95% CI: 0.789‐0.854), 18.532 (95% CI: 8.245‐41.657), respectively, yielding an AUC of 0.880. For qualitative studies, the corresponding value was 0.568 (95% CI: 0.548‐0.587), 0.882 (95% CI: 0.867‐0.897), 10.457 (95% CI: 7.270‐15.040) and 0.787, respectively. Detection of RASSF1A methylation yielded an AUC of 0.841, with a SEN of 0.644 (95% CI: 0.608‐0.678) and a SPE of 0.875 (95% CI: 0.847‐0.900). AFP combined with ctDNA assay achieved an AUC of 0.944, with a SEN of 0.760 (95% CI: 0.728‐00.790) and a SPE of 0.920 (95% CI: 0.893‐00.942).
Conclusion
Circulating tumor DNA displays a promising diagnostic potential in HCC. However, it is not independently sufficient and can serve as an assistant tool combined with AFP for HCC screening and detection.
Keywords: circulating tumor DNA, diagnostic accuracy, hepatocellular carcinoma, meta‐analysis, methylation
We performed the first integrated meta‐analysis on the overall diagnostic accuracy of circulating tumor DNA assays in HCC. Quantitative and qualitative analysis of ctDNA can be used as a complementary strategy integrated with AFP assay for the early detection and diagnosis of HCC.
1. INTRODUCTION
Liver cancer, with over 841 000 patients globally, has currently become the second most frequent reason for tumor‐related deaths.1, 2 Hepatocellular carcinoma (HCC), as the most common pathologic subtype of primary liver tumors, occupies approximately 90% of all patients.2, 3 The prognosis of untreated HCC patients is undesirable with a median survival of 2‐14 months.2, 4, 5 Compelling observational data have demonstrated that earlier HCC detection and therapeutic interventions are conducive to boosting the overall survival of patients.6
Currently, surgical intervention, such as partial hepatic resection and hepatic transplantation remain the primary therapeutic strategies for HCC patients. Indeed, if patients with early HCC that is currently hard to recognize and delineate could be accurately diagnosed, the 5‐year survival rate for HCC patients who have received surgery would reach up to 90%.7 Unfortunately, a large proportion of HCC individuals are usually diagnosed at an advanced stage on account of the non‐specific clinical symptoms and the limitations in detection methods, thus triggering that fewer than 30% of the patients are qualified for surgical treatment.8, 9 Early screening for HCC has been conducted in several cohorts following the Asian‐Pacific Association for the Study of the Liver guidelines, which advocates that HCC surveillance should be implemented for clinical subjects with liver cirrhosis and those with positive surface antigen of hepatitis B virus (HBsAg) by utilizing liver ultrasonography (US) and serum alpha‐fetoprotein (AFP) test every 6 months.10
Nevertheless, the diagnostic efficiency of AFP assay for HCC is not satisfactory, with a sensitivity (SEN) of 25%‐65% and a specificity (SPE) lower than 82%, respectively.11 When liver US is applied for the detection of HCC nodules smaller than one cm, its SEN is approximately 60%.12 Additionally, the fluctuation in AFP levels is also associated with inflammation and liver disease type.13 For example, AFP levels may be enhanced in non‐HCC conditions, including chronic liver diseases (such as liver cirrhosis and hepatic inflammation), other tumors (such as intrahepatic cholangiocarcinoma and metastatic colon cancer) as well as pregnancy.14, 15, 16 Therefore, the detection of HCC with these methods remains suboptimal, it is imperative to develop additional biomarkers for early detection and diagnosis of HCC in a minimally invasive, convenient and accurate manner.
Accumulating evidence has indicated that the cumulation of genetic and epigenetic changes in liver tissue results in the tumorigenesis and development of HCC, which is intimately associated with the surrounding microenvironment.17 Recent progresses in the field have highlighted that the minimally invasive detection of circulating tumor DNA (ctDNA) confers a promising opportunity for the early screening and diagnosis of HCC. This assay, in conjunction with circulating tumor cells and circulating cell‐free DNA, is termed “liquid biopsy”.18 Circulating tumor DNA is generally derived from apoptotic or necrotic tumor cells and further released into the circulation,19 which carries cancer‐specific modifications in gene or epigenetics, including single nucleotide mutation,20 copy number aberration (CNA),21 and DNA methylation19 or 5‐hydroxymethylcytosines.16 Quantitative alteration and qualitative alteration of ctDNA are primarily detected in HCC patients. The former is associated with measuring the quantity of ctDNA that is generally increased in HCC patients,22 and the latter refers to monitoring tumor‐specific genetic aberrations. Specifically, with the booming development of next generation sequencing, a growing number of studies have been concentrating on the “methylation pattern” of ctDNA in HCC patients and demonstrated that tumor‐specific alterations in methylation may represent a novel discriminatory tool for the screening, detection, and diagnosis of HCC. Thus, by deciphering the information of deoxyribonucleic acid derived from HCC patients’ circulation, clinicians can utilize this “liquid biopsy” technology to confer precise diagnosis and appropriate therapy for HCC patients.
Although a considerable number of studies have revealed the diagnostic efficiency of ctDNA for HCC, the results are very diverse partially ascribed to the discrepancies in study design and assay methods for ctDNA among studies. Thus, prior to its clinical utilization, a comprehensive analysis and evaluation of the diagnostic value of ctDNA in HCC is imminently required. Herein, we implemented a meta‐analysis to objectively assess the diagnostic performance of ctDNA assays for HCC, which potentially confers guideline for technology improvement and clinical applications.
2. MATERIALS AND METHODS
2.1. Search strategy
All potentially relevant articles that were published up to September 2019 were retrieved and the following electronic databases were independently queried by two authors: PubMed, Web of Science, Embase, Cochrane Library, and China National Knowledge Infrastructure. The query terms were as follows: “circulating tumor DNA” OR “circulating DNA” OR “ctDNA” OR “plasma DNA” OR “serum DNA” OR “blood DNA” AND “liver cancer” OR “hepatocellular carcinoma” OR “liver neoplasms” OR “hepatic carcinoma” OR “liver tumor” AND “diagnosis” OR “sensitivity” OR “specificity” OR “accuracy”. The language of all articles was limited to English. We also manually screened the reference from the included articles and relevant reviews for enlarged retrieval.
2.2. Inclusion and exclusion criteria
The publications that conformed to the following criteria were incorporated: (a) ctDNA indicators were used for the first diagnosis rather than the recurrent diagnosis of HCC; (b) the numerical value of SEN and SPE could be collected either directly from the papers or could be calculated in each study; and (c) specimens were extracted from peripheral blood. The exclusion criteria were as follows: (a) review, case report, letter or conference abstract; (b) the sample size of studies was less than 10; and (c) duplicate or overlapping publications that included the same population and gene. Two authors independently evaluated the eligibility of studies. Discrepancies were resolved via consensus.
2.3. Data extraction
Two authors independently conducted data extraction from the included studies and further summarized the ultimate results. The information extracted from the incorporated publications was as follows: the first author's name, publication year, region/country, study design, participant characteristics (including sample size, control type), detection details (including source of specimens, sampling time, experimental methods, reference gene, cutoff values), diagnostic performance (including SEN and SPE, true positive (TP), true negative (TN), false positive (FP), and false negative (FN), positive likelihood ratio (PLR) and negative likelihood ratio (NLR), and diagnostic concordance).
2.4. Quality assessment
Based on the revised Quality Assessment of Diagnostic Accuracy Studies‐2 (QUADAS‐2), the risk of bias and concerns about applicability of all included publications were evaluated as “low risk”, “high risk” and “unclear risk” through four key domains including patient selection, index test, reference standard, and flow and timing.23 All the studies were independently assessed and rated by two authors. Divergence was discussed until an agreement was reached. If an article was evaluated to be of poor quality by two authors, it would be excluded.
2.5. Statistical analysis
We utilized RevMan Manager 5.3 and Meta‐Disc 1.4 software to conduct this diagnostic meta‐analysis. The pooled SEN and SPE, PLR, NLR, diagnostic odds ratio (DOR) and corresponding 95% confidence interval (95% CI) were calculated as evaluation indicators.24 Simultaneously, the summary receiver operating characteristic (SROC) curve and its corresponding area under the curve (AUC) value were formulated to evaluate the overall test accuracy.25, 26, 27, 28 The closer the AUC value was to 1, the higher was the diagnostic efficiency.29, 30 The AUC range of 0.5‐0.7, 0.7‐0.9, 0.9‐1.0 corresponded to low, moderate or high accuracy, respectively.29 The Spearman correlation coefficient and its corresponding P value were used to identify the presence of the threshold effect. Generally, threshold effect was considered to exist when the P value was lower than 0.05. If heterogeneity resulted from nonthreshold effect, we utilized the chi‐square and I2 test to evaluate the heterogeneity among the studies. I 2 > 50% or P < .05 suggested a significant heterogeneity.24, 31 Thus, the random effect model was applied for statistical analysis. Further subgroup analysis and meta‐regression analysis were also conducted to probe the source of heterogeneity.32 The Deek's funnel plot was formulated to examine the existence of potential publication bias.33 A result with P value < .05 was considered to be statistically significant.
3. RESULTS
3.1. Study characteristics
Figure 1 shows a Preferred Reporting Items for Systematic Reviews and Meta‐Analyses (PRISMA) flow diagram adapted from Moher et al34 depicting the retrieval strategy of databases to incorporate qualified publications. Initially, a total of 610 publications were queried through our search strategy. Eventually, 33 eligible articles22, 35, 36, 37, 38, 39, 40, 41, 42, 43, 44, 45, 46, 47, 48, 49, 50, 51, 52, 53, 54, 55, 56, 57, 58, 59, 60, 61, 62, 63, 64, 65, 66 published from 2000 to 2019 were incorporated into this diagnostic meta‐analysis following the exclusion of duplicate studies, the examination of title and abstract as well as the comprehension of full text. Specifically, all the included studies consisted of quantitative analysis to measure ctDNA concentration (n = 5)22, 56, 57, 58, 59 and qualitative analysis to unravel tumor‐specific single‐gene methylation in ctDNA (n = 25),35, 36, 37, 38, 39, 40, 41, 42, 43, 44, 45, 46, 47, 48, 49, 50, 51, 52, 53, 54, 55, 63, 64, 65, 66 as well as both quantitative and qualitative analysis (n = 3).60, 61, 62 Among these 33 publications, 11 articles described the diagnostic role of circulating Ras association domain family 1 isoform A (RASSF1A) methylation in HCC37, 39, 40, 48, 49, 50, 52, 60, 61, 62, 65 and eight articles evaluated the diagnostic performance of ctDNA combined with AFP assay in HCC.38, 40, 41, 42, 43, 44, 54, 56 Nine articles assessed the diagnostic accuracy of AFP assay for HCC 37, 40, 41, 42, 43, 44, 62, 63, 64
Figure 1.
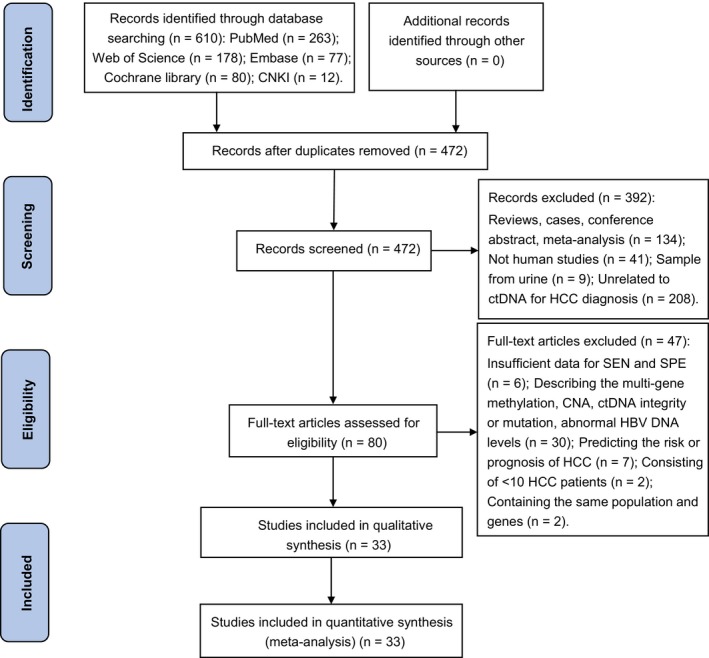
A PRISMA flow diagram of the literature search. CAN, copy number aberration; CNKI: China National Knowledge Infrastructure; ctDNA: circulating tumor DNA; HBV: hepatitis B virus; HCC, hepatocellular carcinoma; PRISMA, Preferred Reporting Items for Systematic Reviews and Meta‐Analyses; SEN, sensitivity; SPE, specificity
Our study enrolled a total population of 2268 HCC patients and 1845 control individuals (1318 patients with benign liver disorders and 527 healthy volunteers). The primary characteristics of all participants are summarized in Table 1. An overwhelming majority of participants were Asian (n = 3808), with the residual 160 participants from America and 145 individuals from Egypt. Twelve researches belonged to retrospective (n = 8) or prospective trial (n = 4), respectively, and the remaining publications (n = 21) did not definitely describe the study design. Among 19 studies with known time point of sampling, most of the samples were collected before treatment (n = 14) and ctDNA was obtained from plasma (n = 13), serum (n = 18), both plasma and serum (n = 2). The assay methods to measure the concentrations of ctDNA were real‐time quantitative polymerase chain reaction (RT‐qPCR) (n = 5), ultraviolet transilluminator (n = 1), enzyme‐linked immunosorbent assay (ELISA) (n = 1) and droplet digital PCR DNA (DdPCR) (n = 1). For qualitative analysis of ctDNA, methylation‐specific polymerase chain reaction (MSP) was the most common method used (n = 25).
Table 1.
Summary of the most relevant features of the enrolled publications
| First author, year | Country/Region | Study type | Control type | No. of HCC/BD/HC | Timing sample | Sample source | Detection methods | Assay indicators | Cutoff value | SEN (%) | SPE (%) | PLR | NLR | Diagnostic concordance | TP | FP | FN | TN |
|---|---|---|---|---|---|---|---|---|---|---|---|---|---|---|---|---|---|---|
| Kisiel, 2019 | USA | Retrospective | LC | 21/30/‐ | During surgery | Plasma | MSP | Methylation (EMX1) | NA | 76.0 | 100.0 | Infinity | 0.240 | 0.902 | 16 | 0 | 5 | 30 |
| Wei, 2018 | China | NA | BD/HC | 119/157/50 | Pre surgery | Plasma | MSP | Methylation (SOCS3) | NA | 28.6 | 95.2 | 5.958 | 0.750 | 0.709 | 34 | 10 | 85 | 197 |
| Dong, 2017 | China | NA | CHB and LC/HC | 98/165/80 | NA | Serum | MSP | Methylation (RASSF1A) | NA | 52.0 | 93.1 | 7.536 | 0.516 | 0.813 | 51 | 17 | 47 | 228 |
| Mansour, 2017 | Egypt | NA | HCV infection | 45/40/‐ | NA | Serum | MSP | Methylation (RASSF1A) | 8 copies/µL | 86.7 | 72.5 | 3.153 | 0.183 | 0.800 | 39 | 11 | 6 | 29 |
| Hu, 2017 | China | NA | LC, CHB | 80/80/‐ | Pre treatment | Serum | MSP | Methylation (UBE2Q1) | NA | 66.3 [53.8] § | 57.5 [87.5] | 1.560 [4.30] | 0.586 [0.53] | 0.619 [0.706] | 53 [43] | 34 [10] | 27 [37] | 46 [70] |
| Huang, 2015 | China | Retrospective | LC | 31/10/‐ | NA | Plasma | MSP | Methylation (RASSF1A) | NA | 51.6 | 80.0 | 2.580 | 0.605 | 0.585 | 16 | 2 | 15 | 8 |
| Methylation (GSTP1) | NA | 38.7 | 60.0 | 0.968 | 1.022 | 0.439 | 12 | 4 | 19 | 6 | ||||||||
| Methylation (P16) | NA | 41.9 | 70.0 | 1.397 | 0.830 | 0.488 | 13 | 3 | 18 | 7 | ||||||||
| Dong, 2015 | China | NA | CHB | 190/120/‐ | Pre treatment | Serum | MSP | Methylation (RASSF1A) | NA | 64.2 [80.9] | 89.8 [93.4] | 6.294 [12.3] | 0.399 [0.20] | 0.742 [0.855] | 122 [153] | 12 [8] | 68 [37] | 108 [112] |
| Li, 2014 | China | NA | CHB | 136/46/‐ | Pre treatment | Serum | MSP | Methylation (IGFBP7) | NA | 65.4 | 82.6 | 3.759 | 0.419 | 0.698 | 89 | 8 | 47 | 38 |
| Huang, 2014 | USA | NA | BD | 66/43/‐ | NA | Serum | Pyrosequencing | Methylation (INK4A) | 5%¶ | 65.3 [80.3] | 87.2 [100] | 5.102 [Infinity] | 0.398 [0.20] | 0.734 [0.881] | 43 [53] | 6 [0] | 23 [13] | 37 [43] |
| Han, 2014 | China | Retrospective | CHB | 160/88/‐ | NA | Serum | MSP | Methylation (TGR5) | NA | 48.1 [65.0] | 86.4 [85.2] | 3.537 [4.39] | 0.601 [0.41] | 0.617 [0.722] | 77 [104] | 12 [13] | 83 [56] | 76 [75] |
| Yang, 2014 | China | NA | LC and CHB | 123/57/‐ | NA | Serum | MSP | Methylation (IDO1) | NA | 42.3 [83.0] | 89.5 [87.7] | 4.029 [6.75] | 0.645 [0.19] | 0.572 [0.844] | 52 [102] | 6 [7] | 71 [21] | 51 [50] |
| Ji, 2014 | China | Retrospective | CHB | 100/37/‐ | Pre surgery | Serum | MSP | Methylation (MT1M) | NA | 50 | 94.6 | 9.259 | 0.529 | 0.533 | 50 | 14 | 50 | 23 |
| Methylation (MT1G) | NA | 69 | 83.8 | 4.259 | 0.370 | 0.730 | 69 | 6 | 31 | 31 | ||||||||
| Kuo, 2014 | Taiwan | NA | HC | 39/‐/34 | During surgery | Plasma | MSP | Methylation (HOXA9) | >0.88 † | 73.3 [94.6] | 97.1 [97.1] | 25.28 [32.6] | 0.275 [0.06] | 0.849 [0.959] | 29 [37] | 1 [1] | 10 [2] | 33 [33] |
| Zhang, 2013 | China | NA | HC | 31/‐/27 | Pre treatment | Serum | Chip/Pyrosequencing | Methylation (DBX2) | NA | 88.9 | 87.1 | 6.891 | 0.127 | 0.897 | 28 | 3 | 3 | 24 |
| Methylation (THY1) | NA | 85.2 | 80.7 | 4.415 | 0.183 | 0.828 | 26 | 5 | 5 | 22 | ||||||||
| Sun, 2013 | China | NA | CHB | 43/24/‐ | NA | Serum | MSP | Methylation (TFPI2) | NA | 46.5 | 83.3 | 2.784 | 0.642 | 0.597 | 20 | 4 | 23 | 20 |
| Mohamed, 2012 | Egypt | Case‐control | HC | 40/‐/20 | NA | Serum | MSP | Methylation (RASSF1A) | 304 nmol/L | 75.0 | 80.0 | 3.750 | 0.313 | 0.767 | 30 | 4 | 10 | 16 |
| Lizuka, 2011 | Japan | Prospective | HCV infection | 108/56/‐ | NA | Serum | MSP | Methylation (SPINT2) | 0.2 pg/mL | 35.2 | 98.2 | 19.56 | 0.660 | 0.567 | 38 | 1 | 70 | 55 |
| Methylation (RASSF1A) | 0.2 pg/mL | 83.3 | 58.9 | 2.027 | 0.284 | 0.750 | 90 | 23 | 18 | 33 | ||||||||
| Huang, 2011 | China | NA | BD | 72/‐/41 | Pre treatment | Plasma | MSP | Methylation (APC) | NA | 68.1 | 97.6 | 28.38 | 0.327 | 0.788 | 49 | 1 | 23 | 40 |
| Methylation (GSTP1) | NA | 55.6 | 90.2 | 5.673 | 0.492 | 0.681 | 40 | 4 | 32 | 37 | ||||||||
| Methylation (RASSF1A) | NA | 72.2 | 95.1 | 14.74 | 0.292 | 0.805 | 52 | 2 | 20 | 39 | ||||||||
| Sun, 2010 | Hong Kong | Retrospective | LC/HC | 35/16/12 | NA | Plasma | RT‐qPCR | Methylation (LMNB1) | NA | 80.0 | 82.0 | 4.444 | 0.244 | 0.810 | 28 | 5 | 7 | 23 |
| Hu, 2010 | China | Retrospective | HC | 35/‐/10 | Pre surgery | Serum | MSP | Methylation (RASSF1A) | NA | 40.0 | 100.0 | Infinity | 0.600 | 0.533 | 14 | 0 | 21 | 10 |
| Chang, 2008 | China | NA | LC | 26/16/‐ | NA | Plasma | MSP | Methylation (RASSF1A) | NA | 26.9 | 81.3 | 1.439 | 0.899 | 0.476 | 7 | 3 | 19 | 13 |
| Zhang, 2007 | Taiwan | Prospective | HC | 50/‐/50 | Closest to diagnosis | Serum | MSP | Methylation (P16) | NA | 44.0 | 96.0 | 11.00 | 0.583 | 0.700 | 22 | 2 | 28 | 48 |
| Methylation (P15) | NA | 22.0 | 100.0 | Infinity | 0.780 | 0.610 | 11 | 0 | 39 | 50 | ||||||||
| Methylation (RASSF1A) | NA | 70.0 | 94.0 | 11.67 | 0.319 | 0.820 | 35 | 3 | 15 | 47 | ||||||||
| Wang, 2006 | China | NA | LC | 32/8/‐ | NA | Serum | MSP | Methylation (GSTP1) | NA | 50.0 | 62.5 | 1.333 | 0.800 | 0.525 | 16 | 3 | 16 | 5 |
| Yeo, 2005 | Hong Kong | NA | HC | 40/‐/10 | Pre surgery | Plasma | MSP | Methylation (RASSF1A) | NA | 42.5 | 100.0 | Infinity | 0.575 | 0.540 | 17 | 0 | 23 | 10 |
| Lin, 2005 | China | NA | BD/HC | 64/15/20 | Pre‐ and post‐surgery | Serum | MSP | Methylation (p16) | NA | 76.6 | 100.0 | Infinity | 0.234 | 0.848 | 49 | 0 | 15 | 35 |
| Chu, 2004 | Korea | NA | LC | 46/23/‐ | NA | Serum | MSP | Methylation (p16INK4a) | NA | 47.8 | 82.6 | 2.747 | 0.632 | 0.594 | 22 | 4 | 24 | 19 |
| Wong, 2003 | Hong Kong | Prospective | BD/HC | 45/30/20 | Pre‐, intra‐ and post‐surgery | Serum/plasma | MSP | Methylation (p16INK4a) | NA | 31.1 [62.0] | 100.0 [100] | Infinity [Infinity] |
0.689 [0.38] |
0.674 0.821 |
14 [28] |
0 [0] |
31 [17] |
50 [50] |
| Wong, 2000 | Hong Kong | Prospective | BD/HC | 25/35/20 | Pre surgery | Serum/plasma | MSP | Methylation (p16) | NA | 60.0 | 100.0 | Infinity | 0.400 | 0.594 | 15 | 0 | 10 | 55 |
| Gai, 2018 | Hong Kong | NA | HBV carriers and LC/HC | 40/29/30 | NA | Plasma | DdPCR | ctDNA | 370 copies/mL | 93.0 | 60.0 | 2.325 | 0.117 | 0.674 | 37 | 24 | 3 | 35 |
| Huang, 2012 | China | NA | HC | 72/‐/41 | Pre treatment | Plasma | RT‐qPCR | ctDNA | 18.2 ng/mL | 90.2 [95.1] | 90.3 [94.4] | 9.299 [17.0] | 0.109 [0.05] |
0.903 [0.973] |
65 [71] |
4 [2] |
7 [1] |
37 [39] |
| Yang, 2011 | China | case control | HBV infection/HC | 60/21/29 | Pre treatment | Plasma | RT‐qPCR | hTERT | 1.87 × 10⁴ copies/uL | 64.0 | 90.0 | 6.400 | 0.400 | 0.903 | 38 | 5 | 22 | 45 |
| Dong, 2008 | China | NA | LC, CH and AH/HC | 117/152/40 | Pre surgery | Plasma | ELISA | TGF‐β1 | 1.2 μg/L | 89.7 | 91.1 | 10.08 | 0.113 | 0.755 | 105 | 17 | 12 | 175 |
| Ren, 2006 | China | NA | LC/HC | 79/20/20 | Pre surgery | Plasma | Ultraviolet transilluminator | ctDNA | 36.6 ng/mL | 51.9 | 77.5 | 2.307 | 0.621 | 0.906 | 41 | 9 | 38 | 31 |
Abbreviations: AH, acute hepatitis; CDO1, Cysteine dioxygenase 1; CH, chronic hepatitis; CHB, Chronic hepatitis B; CLD, chronic liver diseases; DdPCR, droplet digital PCR; ELISA, enzyme‐linked immunosorbent assay; EMX1, empty spiracles homeobox 1; FN, false negative; FP, false positive; GPC‐3, glypican‐3; HBV, hepatitis B virus; HCV, hepatitis C virus; IGFBP7, insulin‐like growth factor‐binding protein 7; LC, liver cirrhosis; LMNB1, Lamin B1; MSP, methylation‐specific polymerase chain reaction; NA, not applicable; NLR, negative likelihood ratio; No. of HCC/BD/HC, number of hepatocellular carcinoma/benign live diseases/ healthy controls; RASSF1A, Ras association domain family 1 isoform A; PLR, positive likelihood ratio; RT‐qPCR, real‐time quantitative polymerase chain reaction; SEN, sensitivity; SPE, specificity; TGR5:, G‐protein‐coupled bile acid receptor Gpbar1; TN, true negative; TP, true positive.
The SEN and SPE, PLR and NLR, diagnostic concordance, TP, TN, FP and FN of the ctDNA combined with AFP for HCC detection are presented in [].
A limit of detection (LOD) of 5%.
Methylation index.
3.2. Quality assessment
The quality assessment outcome of the eligible 33 publications is revealed in Figure 2 and Figure S1. A majority of the literature exhibited a moderate‐high quality, indicating that the overall quality of the included studies was commonly robust. Nevertheless, 13 studies might generate an unknown risk of bias in index test because of insufficient information about predefined threshold. Additionally, 12 studies did not mention whether the patient selection was consecutive or random in a particular time period, potentially generating an unknown risk of performance bias. All enrolled patients obtained definite pathological diagnoses.
Figure 2.
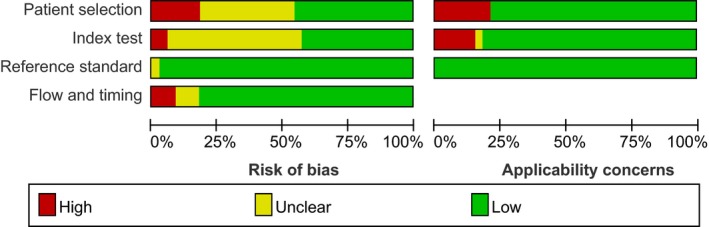
Quality assessment of the included studies by the revised QUADAS‐2. QUADAS‐2, Quality Assessment of Diagnostic Accuracy Studies‐2
3.3. Diagnostic accuracy
3.3.1. Diagnostic value of quantitative and qualitative analysis of ctDNA for HCC
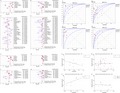
The quantitative detection of ctDNA discriminated HCC patients from control individuals with a SEN of 0.722 (95% CI: 0.686‐0.756) and a SPE of 0.823 (95% CI: 0.789‐0.854) (Figure 3A,B). The numerical value of PLR, NLR and DOR was 4.208 (95% CI: 2.526‐7.009), 0.264 (95% CI: 0.145‐0.483), 18.532 (95% CI: 8.245‐41.657), respectively. This also corresponded to the SROC curve with an AUC of 0.880 (Figure 5A), indicating a higher level of moderate overall accuracy to differentiate HCC patients from control subjects. Among the included quantitative studies, there was significant heterogeneity (SEN: I 2 = 94.3%, P = .000; SPE: I 2 = 88.3%, P = .000; DOR: I 2 = 80.7%, P = .000) and the Spearman correlation coefficient was 0.283 (P = .460), indicating that heterogeneity among studies was derived from nonthreshold effects.
Figure 3.
Forest plots of SEN and SPE for diagnostic value of ctDNA assay for HCC in (A) the quantitative detection subgroup and (B) the qualitative detection subgroup with the diagnostic indicator of cancer‐specific single‐gene methylation alterations in ctDNA. ctDNA, circulating tumor DNA; HCC, hepatocellular carcinoma; SEN, sensitivity; SPE, specificity
Figure 5.
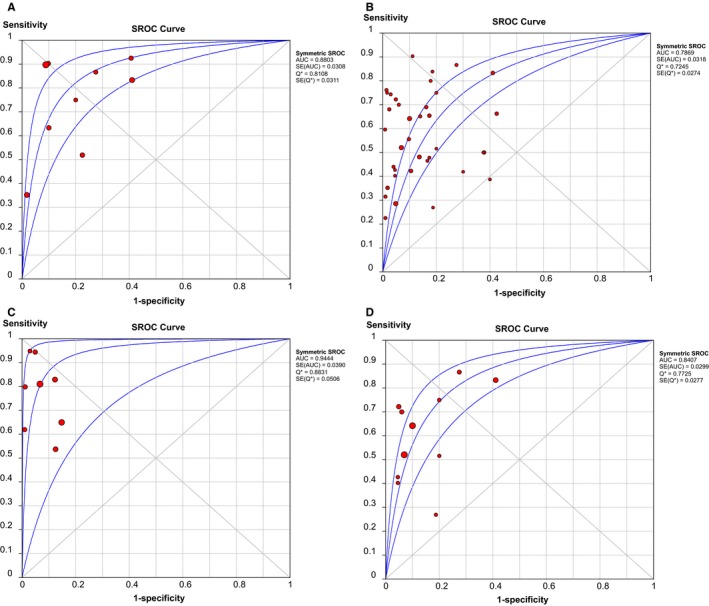
SROC curves of diagnostic value for (A) the quantitative detection subgroup; (B) the qualitative detection subgroup; (C) the subgroup of ctDNA combined with AFP assay; and (D) the RASSF1A methylation detection subgroup. AFP, alpha‐fetoprotein; AUC, area under the curve; ctDNA: circulating tumor DNA; SROC, summary receiver operating characteristic.
Similarly, in the qualitative analysis group associated with tumor‐specific single‐gene methylation, a SEN of 0.568 (95% CI: 0.548‐0.587), a SPE of 0.882 (95% CI: 0.867‐0.897) and a DOR of 10.457 (95% CI: 7.270‐15.040) were revealed (Figure 3C,D). The combined PLR and NLR were 4.378 (95% CI: 3.251‐5.897), 0.489 (95% CI: 0.431‐0.555), respectively. It further exhibited an AUC of 0.787 in SROC curve, highlighting acceptably moderate levels of diagnostic accuracy of ctDNA for HCC (Figure 5B). Significant heterogeneity was also revealed in the diagnostic analysis of qualitative studies (SEN: I 2 = 87.8%, P = .000; SPE: I 2 = 84.0%, P = .000; DOR: I 2 = 68.8%, P = .000). There was no significant threshold effect because of the Spearman correlation coefficient of 0.168 and the P value of .320.
3.3.2. Diagnostic value of ctDNA combined with AFP assay for HCC
Initially, we evaluated the diagnostic efficiency of AFP assay in HCC. The AFP test yielded an AUC of 0.638, with a SEN of 0.478 (95% CI: 0.447‐0.509) and a SPE of 0.840 (95% CI: 0.809‐0.867) (Figure S2). The value of PLR, NLR and DOR were 3.368 (95% CI: 1.913‐5.929), 0.611 (95% CI: 0.506‐0.738), and 6.284 (95% CI: 3.109‐12.700), respectively. Furthermore, the combination of ctDNA and AFP assay yielded an AUC of 0.944 (Figure 5C), with a SEN of 0.760 (95% CI: 0.728‐0.790) and a SPE of 0.920 (95% CI: 0.893‐0.942) (Figure 4A,B). This corresponded to a PLR of 9.469 (95% CI: 5.178‐17.313), an NLR of 0.234 (95% CI: 0.154‐0.357) and a DOR of 54.864 (95% CI: 19.980‐150.66), highlighting that compared with the ctDNA assay or AFP test alone, the detection of ctDNA integrated with AFP could distinguish HCC patients from control individuals with a remarkably increased high level of accuracy (Table 2).
Figure 4.
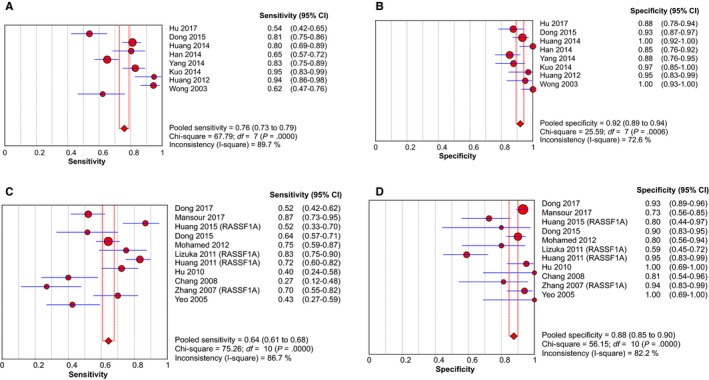
Forest plots of SEN and SPE for diagnostic value of ctDNA assay for HCC in (A) the subgroup of ctDNA combined with AFP assay and (B) the RASSF1A methylation detection subgroup. AFP, alpha‐fetoprotein; ctDNA: circulating tumor DNA; HCC: hepatocellular carcinoma; SEN: sensitivity; SPE: specificity
Table 2.
Summary of diagnostic accuracy of ctDNA assay for HCC in multiple subgroups
| Group | SEN (95% CI) | SPE (95% CI) | PLR (95% CI) | NLR (95% CI) | DOR (95% CI) | AUC (95% CI) |
|---|---|---|---|---|---|---|
| AFP assay | 0.478 (0.447‐0.509) | 0.840 (0.809‐0.867) | 3.368 (1.913‐5.929) | 0.611 (0.506‐0.738) | 6.284 (3.109‐12.700) | 0.638 |
| Quantitative analysis of ctDNA | 0.722 (0.686‐0.756) | 0.823 (0.789‐0.854) | 4.208 (2.526‐7.009) | 0.264 (0.145‐0.483) | 18.532 (8.245‐41.657) | 0.880 |
| Qualitative analysis of ctDNA | 0.568 (0.548‐0.587) | 0.882 (0.867‐0.897) | 4.378 (3.251‐5.897) | 0.489 (0.431‐0.555) | 10.457 (7.270‐15.040) | 0.787 |
| AFP combined with ctDNA | 0.760 (0.728‐0.790) | 0.920 (0.893‐0.942) | 9.469 (5.178‐17.313) | 0.234 (0.154‐0.357) | 54.864 (19.980‐150.66) | 0.944 |
Abbreviations: 95% CI, 95% confidence interval; AFP, alpha‐fetoprotein; AUC: the area under the curve; DOR, diagnostic odds ratio; ctDNA, circulating tumor DNA; HCC, hepatocellular carcinoma; NLR, negative likelihood ratio; PLR, positive likelihood ratio; SEN, sensitivity; SPE, specificity.
3.3.3. Diagnostic value of circulating RASSF1A methylation for HCC
In the qualitative analysis of ctDNA, circulating RASSF1A promoter methylation is the most frequently detected epigenetic change in HCC. Thus, we also estimated the diagnostic efficacy of RASSF1A methylation in discriminating HCC patients from controls. In the 11 studies describing circulating RASSF1A methylation, the pooled SEN and SPE was 0.644 (95% CI: 0.608‐0.678) and 0.875 (95% CI: 0.847‐0.900), respectively (Figure 4C,D). The pooled PLR and NLR was 4.525 (95% CI: 2.757‐7.426) and 0.439 (95% CI: 0.345‐0.557), respectively, and the DOR was 12.550 (95% CI: 7.826‐20.126). The AUC for RASSF1A was 0.841 (Figure 5D), indicating that ctDNA RASSF1A methylation can be considered as a potential HCC diagnostic biomarker with a higher level of moderate overall accuracy.
3.4. Subgroup analysis and meta‐regression analysis
Subgroup analysis was performed based on different covariates: region (Asia vs non‐Asia), sample size (≥100 vs <100), control type (benign disease vs healthy controls), sample source (plasma vs serum), assay methods (RT‐qPCR vs other methods in the quantitative study; MSP vs other methods in the qualitative studies) and methylation gene location (RASSF1A vs other gene targets in the qualitative studies) (Table 3). For the quantitative analysis of ctDNA, subgroup analyses based on sample source revealed that compared with sample collected from serum, sampling from plasma achieved an increased diagnostic accuracy in discriminating HCC from control subjects, with SEN of 0.777 (95% CI: 0.731‐0.819) vs 0.654 (95% CI: 0.598‐0.708), and SPE of 0.846 (95% CI: 0.805‐0.880) vs 0.773 (95% CI: 0.703‐0.834) as well as an AUC of 0.902 vs 0.843, respectively. Another subgroup analysis associated with control type showed that the SEN, SPE and AUC for quantitative ctDNA assay to distinguish HCC patients from healthy subjects was 0.775 (95% CI: 0.731‐0.814), 0.843 (95% CI: 0.804‐0.877) and 0.895, respectively. While the corresponding indicators to discriminate HCC from benign liver diseases were much lower at 0.697 (95% CI: 0.657‐0.735), 0.817 (95% CI: 0.780‐0.851) and 0.868, respectively. Similarly, in term of subgroup analysis related to control type in the included qualitative analysis of ctDNA, studies using healthy controls were characterized with more satisfactory diagnostic efficiency compared with those utilizing subjects with benign liver disorders, displaying SEN of 0.604 (95% CI: 0.563‐0.644) vs 0.556 (95% CI: 0.533‐0.579) and SPE of 0.938 (95% CI: 0.916‐0.955) vs 0.852 (95% CI: 0.831‐0.872), respectively. These results highlighted a more robust capability of the ctDNA assay to differentiate HCC patients from healthy individuals than from benign patients. We also performed the meta‐regression analysis to further explore the source of heterogeneity. As has been revealed in Table 4, the parameter of “control type” potentially was the primary source of heterogeneity in the qualitative analysis group (P = .022). None of parameters might generate significant heterogeneity in the quantitative analysis group (both P > .05).
Table 3.
Subgroup analysis of diagnostic performance of ctDNA assay for HCC
| Analysis | Group | Subgroup | SEN (95% CI) | SPE (95% CI) | DOR (95% CI) | AUC |
|---|---|---|---|---|---|---|
| Quantitative analysis | Control type | HC | 0.775 (0.731‐0.814) | 0.843 (0.804‐0.877) | 21.320 (6.848‐66.377) | 0.895 |
| BD | 0.697 (0.657‐0.735) | 0.817 (0.780‐0.851) | 16.015 (6.334‐40.496) | 0.868 | ||
| Sample size | ≥100 | 0.693 (0.652‐0.732) | 0.864 (0.829‐0.895) | 20.501 (6.323‐66.466) | 0.887 | |
| ˂100 | 0.848 (0.773‐0.906) | 0.672 (0.580‐0.756) | 15.676 (7.740‐31.750) | 0.855 | ||
| Sample source | Plasma | 0.777 (0.731‐0.819) | 0.846 (0.805‐0.880) | 23.762 (6.321‐89.324) | 0.902 | |
| Serum | 0.654 (0.598‐0.708) | 0.773 (0.703‐0.834) | 10.632 (6.199‐18.236) | 0.843 | ||
| Assay method | RT‐qPCR | 0.693 (0.647‐0.736) | 0.817 (0.765‐0.862) | 17.568 (8.502‐36.304) | 0.873 | |
| Other methods | 0.775 (0.717‐0.827) | 0.828 (0.780‐0.870) | 18.307 (2.271‐147.58) | 0.875 | ||
| Qualitative analysis | Region | Asian | 0.554 (0.534‐0.575) | 0.886 (0.869‐0.900) | 9.883 (6.672‐14.639) | 0.767 |
| Other areas | 0.744 (0.672‐0.808) | 0.842 (0.769‐0.900) | 15.206 (7.798‐29.653) | 0.860 | ||
| Control type | HC | 0.604 (0.563‐0.644) | 0.938 (0.916‐0.955) | 22.151 (14.827‐33.093) | 0.893 | |
| BD | 0.556 (0.533‐0.579) | 0.852 (0.831‐0.872) | 6.990 (4.661‐10.483) | 0.740 | ||
| Sample size | ≥ 100 | 0.557 (0.533‐0.580) | 0.880 (0.862‐0.897) | 10.196 (6.694‐15.529) | 0.770 | |
| ˂100 | 0.541 (0.508‐0.574) | 0.911 (0.890‐0.929) | 9.878 (5.667‐17.218) | 0.802 | ||
| Sample source | Plasma | 0.516 (0.476‐0.555) | 0.934 (0.909‐0.953) | 11.476 (5.024‐26.212) | 0.718 | |
| Serum | 0.586 (0.563‐0.609) | 0.861 (0.841‐0.880) | 10.170 (6.782‐15.251) | 0.800 | ||
| Assay method | MSP | 0.553 (0.533‐0.574) | 0.885 (0.869‐0.900) | 9.483 (6.433‐13.980) | 0.750 | |
| Other methods | 0.767 (0.694‐0.829) | 0.848 (0.773‐0.906) | 20.130 (10.035‐40.381) | 0.908 | ||
| Methylation gene location | RASSF1A | 0.644 (0.608‐0.678) | 0.875 (0.847‐0.900) | 12.550 (7.826‐20.126) | 0.841 | |
| Other gene location | 0.535 (0.511‐0.559) | 0.886 (0.867‐0.904) | 10.031 (6.266‐16.058) | 0.750 |
Abbreviations: 95% CI: 95% confidence interval; AUC: area under the curve; BD, benign live diseases; ctDNA, circulating tumor DNA; DOR, diagnostic odds ratio; HC, healthy controls; HCC, hepatocellular carcinoma; MSP, methylation‐specific polymerase chain reaction; RT‐qPCR, real‐time quantitative polymerase chain reaction; SEN, sensitivity; SPE, specificity.
Table 4.
Meta‐regression of impacts of study features on diagnostic value of ctDNA for HCC
| Analysis | Covariates | Coefficient | SE | P value | RDOR (95% CI) |
|---|---|---|---|---|---|
| Quantitative analysis | Control type | 1.649 | 0.959 | 0.184 | 5.20 (0.25‐109.94) |
| Sample size | 0.541 | 1.129 | 0.665 | 1.72 (0.05‐62.41) | |
| Sample source | 0.264 | 1.227 | 0.843 | 1.30 (0.03‐64.73) | |
| Assay method | 0.679 | 1.108 | 0.583 | 1.97 (0.06‐67.02) | |
| Qualitative analysis | Region | ‐0.779 | 0.589 | 0.196 | 0.46 (0.14‐1.53) |
| Control type | 1.146 | 0.473 | 0.022 | 3.15 (1.20‐8.27) | |
| Sample size | 0.401 | 0.385 | 0.307 | 1.49 (0.68‐3.28) | |
| Sample source | 0.109 | 0.421 | 0.798 | 1.11 (0.47‐2.64) | |
| Assay method | −0.756 | 0.671 | 0.269 | 0.47 (0.12‐1.85) | |
| Methylation gene location | 0.289 | 0.416 | 0.493 | 1.34 (0.57‐3.13) |
Abbreviations: 95% CI: 95% confidence interval; ctDNA: circulating tumor DNA; HCC, hepatocellular carcinoma; RDOR: relatively diagnostic odds ratio; SE: standard error.
3.5. Publication bias
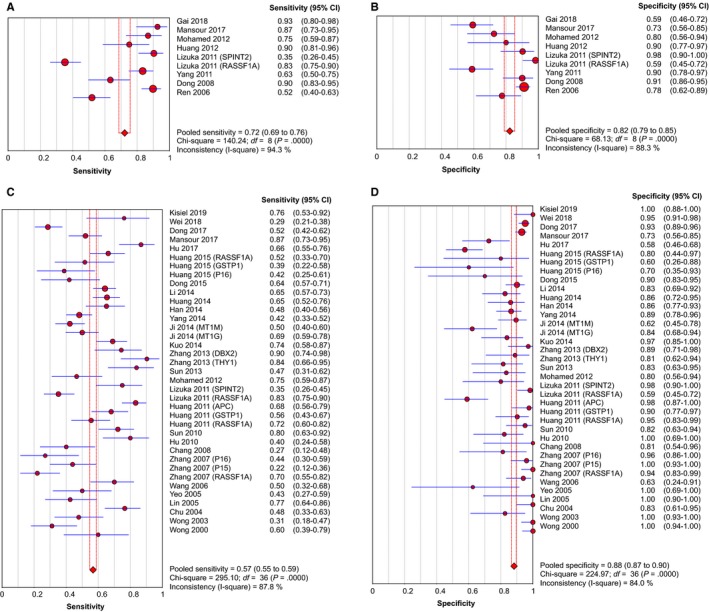
We examined the potential publication bias of the incorporated articles by performing Deek's funnel plot asymmetry test. Our results revealed that no significant publication bias existed in the group of quantitative analysis (Figure 6A, P = .114), in the group of qualitative analysis (Figure 6B, P = .725), in the group of ctDNA combined with AFP assay (Figure 6C, P = .079), or in the group of RASSF1A methylation detection (Figure 6D, P = .449).
Figure 6.

Funnel plots to evaluate the publication bias for (A) the quantitative detection subgroup; (B) the qualitative detection subgroup; (C) the subgroup of ctDNA combined with AFP assay; and (D) the RASSF1A methylation detection subgroup. AFP, alpha‐fetoprotein; ctDNA, circulating tumor DNA; DOR, diagnostic odds ratio; ESS, effective sample sizes
4. DISCUSSION
HCC is a high‐grade malignant neoplasm with undesirable prognosis and high mortality, which is largely attributable to its low early diagnostic rate. Therefore, it is essential to disclose novel and effective biomarkers for the detection and diagnosis of early‐stage HCC. Applying novel molecular technologies to liquid biopsies has advanced our understanding of the effect of ctDNA detection on HCC diagnosis.1, 12 In this diagnostic meta‐analysis, we aimed to incorporate these published results for the first time and systematically estimate the diagnostic accuracy of ctDNA for HCC.
In our meta‐analysis, compared with the group of quantitative analysis, the group of qualitative analysis yielded a lower SEN (0.568 vs 0.722) and AUC (0.787 vs 0.880), and that was probably because some genetic loci selected for test were predominantly expressed in non‐HCC individuals.50, 62 However, the SPE (0.882) of the qualitative group was superior to that of the quantitative group (0.823). Notably, we specifically concentrated on RASSF1A methylation in the qualitative analysis of ctDNA RASSF1A is a well‐acknowledged tumor suppressor and is continually inactivated by promoter hypermethylation in HCC. It has the capability to trigger autophagy defects to facilitate oxidative stress and genome instability, thus accelerating tumorigenesis.67 We revealed that RASSF1A methylation discriminated HCC patients from control individuals with a SEN of 0.644 and a SPE of 0.875, contributing to an improvement of AUC from 0.787 to 0.841. These results indicate that circulating tumor DNA RASSF1A methylation can serve as a potential biomarker to screen HCC.
Our results also showed that AFP, as the most frequently used biomarker for HCC diagnosis, exhibited an unsatisfactory diagnostic performance on account of a low SEN of merely 0.478, which was relatively lower than the result of Farinati et al (the SEN was 0.540).68 Thus, quantitative or qualitative analysis of ctDNA was more sensitive and feasible, and the diagnostic accuracy of ctDNA was superior to the AFP assay alone (the AUC was merely 0.638). Additionally, the combined detection of ctDNA and AFP assay resulted in a remarkably increased diagnostic accuracy with a SEN of 0.760 and a SPE of 0.920 as well as an AUC of 0.944 in discriminating HCC from control individuals. This encouraging result highlights that the combined AFP and ctDNA assay for diagnosing and evaluating HCC can generate much more favorable accuracy than does either method on its own and that ctDNA detection potentially develops into a novel auxiliary tool for AFP in the screening and detection of HCC.
Furthermore, we also analyzed the DOR to evaluate the diagnostic accuracy in each group. The discriminatory test performance would be considered satisfactory when the numerical value of DOR was higher than 10.25 In our results, the DOR for quantitative and qualitative ctDNA assay to distinguish HCC cases from control subjects was 18.532 and 10.457, respectively. The DOR of RASSF1A methylation detection of ctDNA (12.550) was slightly higher than that of qualitative ctDNA assay (10.457). While the DOR for AFP assay to discriminate HCC and controls was much lower at 6.284. The DOR was dramatically improved to 54.864 when utilizing the combined detection of ctDNA and AFP, indicating a powerful capability of integrating ctDNA analysis with AFP to exactly screen and diagnose HCC.
In our report, the value of PLR in quantitative and qualitative detection of ctDNA was 4.208 and 4.378, respectively, manifesting that HCC cases have an approximately four to five fold higher chance of being ctDNA assay‐positive in comparison with control individuals. Compared with the quantitative detection of ctDNA, the qualitative detection of ctDNA displayed a higher NLR (0.489), implying that the probability for cases with negative qualitative assay results to have HCC is 48.9%. Thus, a negative ctDNA test result should be explained prudently when single‐gene methylation is independently utilized to screen and detect HCC. Nevertheless, addition of AFP statistically boosted the overall accuracy and robustness, with a PLR of 9.469 and an NLR of 0.234.
Publication bias was not revealed in our meta‐analysis by formulating Deek's funnel plot. Furthermore, a meta‐regression analysis was performed to explore the potential source of heterogeneity, thus demonstrating that in these quantitative studies, none of the parameters (such as sample source, sample size, control types and assay methods) represented a primary source of heterogeneity. Heterogeneity might have arisen because of additional reasons, including enrolled patients’ age, tumor size, lymph node invasion, lesion metastasis, TNM staging and discrepancies in the surgical protocol, which failed to be evaluated in this study on account of partial deficiency of the data or illegible details. Furthermore, the covariate of “control types” potentially exerted certain influence on heterogeneity in the qualitative analysis group. Therefore, further large clinical trials should reasonably select control individuals to boost the diagnostic performance of ctDNA in HCC.
Notably, several limitations deserve to be discussed in our meta‐analysis. Firstly, in spite of the thorough literature search, we did not incorporate several valuable articles because we failed to access their full texts. Moreover, a relatively smaller number of publications were incorporated into the quantitative group, thus potentially diminishing the statistical significance. Thirdly, some bias was potentially generated in this analysis because we merely included English‐language articles. Ultimately, we failed to include some covariates that were not depicted in these included studies, such as neoplasm size, lymph node invasion, lesion metastasis, and TNM staging of tumors. Therefore, more large‐scale prospective clinical researches that delineate the diagnostic value of ctDNA detection for HCC are needed to further identify the conclusions of this meta‐analyses.
5. CONCLUSION
In summary, we performed the first integrated meta‐analysis on the overall diagnostic accuracy of circulating tumor DNA assays in HCC. The diagnostic performance of quantitative and qualitative analysis of ctDNA was superior to the classical HCC biomarker AFP. Specifically, ctDNA RASSF1A methylation potentially serves as an effective diagnostic biomarker for HCC. Notably, because of deficiency of robustness, the ctDNA assay cannot be utilized as an independent diagnostic tool. The combined assays of ctDNA and AFP yielded a higher level of discriminatory power in HCC detection. Therefore, quantitative and qualitative analysis of ctDNA can be used as a complementary strategy integrated with AFP assay for the early detection and diagnosis of HCC. Larger sample studies are needed to further confirm our conclusions and to make the ctDNA approach more sensitive and specific.
CONFLICTS OF INTEREST
The authors declare that there are no conflicts of interest.
AUTHOR CONTRIBUTIONS
PG Cao, ZY Zhang designed/planned the study and wrote the paper. ZY Zhang, P Chen, H Xie performed the computational modeling, acquired and analyzed clinical data. H Xie and P Chen performed the imaging analysis. ZY Zhang, H Xie, P Chen, PG Cao participated in discussion of related data.
Supporting information
Zhang Z, Chen P, Xie H, Cao P. Using circulating tumor DNA as a novel biomarker to screen and diagnose hepatocellular carcinoma: A systematic review and meta‐analysis. Cancer Med. 2020;9:1349–1364. 10.1002/cam4.2799
Ziying Zhang and Peng Chen contributed equally to this work.
Funding information
This work was supported by the National Natural Science Foundation of China [81872473 (Peiguo Cao)]; the Hunan Province Science and Technology Plan [2017SK2052 (Peiguo Cao)].
REFERENCES
- 1. Ye Q, Ling S, Zheng S, Xu X. Liquid biopsy in hepatocellular carcinoma: circulating tumor cells and circulating tumor DNA. Mol Cancer. 2019;18(1):114. [DOI] [PMC free article] [PubMed] [Google Scholar]
- 2. Zhang Z, Tang H, Chen P, Xie H, Tao Y. Demystifying the manipulation of host immunity, metabolism, and extraintestinal tumors by the gut microbiome. Signal Transduct Tar Therapy. 2019;4:41. [DOI] [PMC free article] [PubMed] [Google Scholar]
- 3. Siegel RL, Miller KD, Jemal A. Cancer statistics, 2017. CA Cancer J Clin. 2017;67(1):7‐30. [DOI] [PubMed] [Google Scholar]
- 4. Vogel A, Cervantes A, Chau I, et al. Hepatocellular carcinoma: ESMO Clinical Practice Guidelines for diagnosis, treatment and follow‐up. Ann Oncol. 2018;29(Suppl 4):iv238‐iv255. [DOI] [PubMed] [Google Scholar]
- 5. Islami F, Miller KD, Siegel RL, Fedewa SA, Ward EM, Jemal A. Disparities in liver cancer occurrence in the United States by race/ethnicity and state. CA Cancer J Clin. 2017;67(4):273‐289. [DOI] [PubMed] [Google Scholar]
- 6. Singal AG, Pillai A, Tiro J. Early detection, curative treatment, and survival rates for hepatocellular carcinoma surveillance in patients with cirrhosis: a meta‐analysis. PLoS Med. 2014;11(4):e1001624. [DOI] [PMC free article] [PubMed] [Google Scholar]
- 7. Tang J‐C, Feng Y‐L, Guo T, Xie A‐Y, Cai X‐J. Circulating tumor DNA in hepatocellular carcinoma: trends and challenges. Cell Biosci. 2016;6:32. [DOI] [PMC free article] [PubMed] [Google Scholar]
- 8. European Association For The Study Of The Liver , European Organisation For Research And Treatment Of Cancer . EASL‐EORTC clinical practice guidelines: management of hepatocellular carcinoma. J Hepatol. 2012;56(4):908‐943. [DOI] [PubMed] [Google Scholar]
- 9. Forner A, Reig M, Bruix J. Hepatocellular carcinoma. Lancet. 2018;391(10127):1301‐1314. [DOI] [PubMed] [Google Scholar]
- 10. Omata M, Cheng A‐L, Kokudo N, et al. Asia‐Pacific clinical practice guidelines on the management of hepatocellular carcinoma: a 2017 update. Hepatol Int. 2017;11(4):317‐370. [DOI] [PMC free article] [PubMed] [Google Scholar]
- 11. Kondo Y, Kimura O, Shimosegawa T. Significant biomarkers for the management of hepatocellular carcinoma. Clin J Gastroenterol. 2015;8(3):109‐115. [DOI] [PubMed] [Google Scholar]
- 12. Li J, Han XU, Yu X, et al. Clinical applications of liquid biopsy as prognostic and predictive biomarkers in hepatocellular carcinoma: circulating tumor cells and circulating tumor DNA. J Exp Clin Cancer Res. 2018;37(1):213. [DOI] [PMC free article] [PubMed] [Google Scholar]
- 13. Richardson P, Duan Z, Kramer J, Davila JA, Tyson GL, El‐Serag HB. Determinants of serum alpha‐fetoprotein levels in hepatitis C‐infected patients. Clin Gastroenterol Hepatol. 2012;10(4):428‐433. [DOI] [PMC free article] [PubMed] [Google Scholar]
- 14. Zamcheck N, Pusztaszeri G. CEA, AFP and other potential tumor markers. CA Cancer J Clin. 1975;25(4):204‐214. [DOI] [PubMed] [Google Scholar]
- 15. Gamil M, Alboraie M, El‐Sayed M, et al. Novel scores combining AFP with non‐invasive markers for prediction of liver fibrosis in chronic hepatitis C patients. J Med Virol. 2018;90(6):1080‐1086. [DOI] [PubMed] [Google Scholar]
- 16. Cai J, Chen L, Zhang Z, et al. Genome‐wide mapping of 5‐hydroxymethylcytosines in circulating cell‐free DNA as a non‐invasive approach for early detection of hepatocellular carcinoma. Gut. 2019;68(12):2195‐2205. [DOI] [PMC free article] [PubMed] [Google Scholar]
- 17. Gao Q, Zhu H, Dong L, et al. Integrated proteogenomic characterization of HBV‐related hepatocellular carcinoma. Cell. 2019;179(2):561‐577.e22. [DOI] [PubMed] [Google Scholar]
- 18. Qu C, Wang Y, Wang P, et al. Detection of early‐stage hepatocellular carcinoma in asymptomatic HBsAg‐seropositive individuals by liquid biopsy. Proc Natl Acad Sci USA. 2019;116(13):6308‐6312. [DOI] [PMC free article] [PubMed] [Google Scholar]
- 19. Xu R‐H, Wei W, Krawczyk M, et al. Circulating tumour DNA methylation markers for diagnosis and prognosis of hepatocellular carcinoma. Nat Mater. 2017;16(11):1155‐1161. [DOI] [PubMed] [Google Scholar]
- 20. Huang Y‐L, Wu J‐R, Fang M, et al. The role of ERCC1 and AFP gene polymorphism in hepatocellular carcinoma. Medicine. 2019;98(14):e15090. [DOI] [PMC free article] [PubMed] [Google Scholar]
- 21. Jiang P, Chan CWM, Chan KCA, et al. Lengthening and shortening of plasma DNA in hepatocellular carcinoma patients. Proc Natl Acad Sci USA. 2015;112(11):E1317‐E1325. [DOI] [PMC free article] [PubMed] [Google Scholar]
- 22. Gai W, Ji LU, Lam WKJ, et al. Liver‐ and colon‐specific DNA methylation markers in plasma for investigation of colorectal cancers with or without liver metastases. Clin Chem. 2018;64(8):1239‐1249. [DOI] [PubMed] [Google Scholar]
- 23. Whiting PF, Rutjes AW, Westwood ME, et al. QUADAS‐2: a revised tool for the quality assessment of diagnostic accuracy studies. Ann Intern Med. 2011;155(8):529‐536. [DOI] [PubMed] [Google Scholar]
- 24. Zamora J, Abraira V, Muriel A, Khan K, Coomarasamy A. Meta‐DiSc: a software for meta‐analysis of test accuracy data. BMC Med Res Methodol. 2006;6:31. [DOI] [PMC free article] [PubMed] [Google Scholar]
- 25. Glas AS, Lijmer JG, Prins MH, Bonsel GJ, Bossuyt PMM. The diagnostic odds ratio: a single indicator of test performance. J Clin Epidemiol. 2003;56(11):1129‐1135. [DOI] [PubMed] [Google Scholar]
- 26. Jaeschke R, Guyatt GH, Sackett DL. Users' guides to the medical literature. III. How to use an article about a diagnostic test. B. What are the results and will they help me in caring for my patients? The Evidence‐Based Medicine Working Group. JAMA. 1994;271(9):703‐707. [DOI] [PubMed] [Google Scholar]
- 27. Reitsma JB, Glas AS, Rutjes AWS, Scholten RJPM, Bossuyt PM, Zwinderman AH. Bivariate analysis of sensitivity and specificity produces informative summary measures in diagnostic reviews. J Clin Epidemiol. 2005;58(10):982‐990. [DOI] [PubMed] [Google Scholar]
- 28. Arends LR, Hamza TH, van Houwelingen JC, Heijenbrok‐Kal MH, Hunink M, Stijnen T. Bivariate random effects meta‐analysis of ROC curves. Med Decis Making. 2008;28(5):621‐638. [DOI] [PubMed] [Google Scholar]
- 29. Swets JA. Measuring the accuracy of diagnostic systems. Science. 1988;240(4857):1285‐1293. [DOI] [PubMed] [Google Scholar]
- 30. Walter SD. Properties of the summary receiver operating characteristic (SROC) curve for diagnostic test data. Stat Med. 2002;21(9):1237‐1256. [DOI] [PubMed] [Google Scholar]
- 31. Higgins JP, Thompson SG, Deeks JJ, et al. Measuring inconsistency in meta‐analyses. BMJ. 2003;327(7414):557‐560. [DOI] [PMC free article] [PubMed] [Google Scholar]
- 32. Thompson SG, Higgins JP. How should meta‐regression analyses be undertaken and interpreted? Stat Med. 2002;21(11):1559‐1573. [DOI] [PubMed] [Google Scholar]
- 33. Deeks JJ, Macaskill P, Irwig L. The performance of tests of publication bias and other sample size effects in systematic reviews of diagnostic test accuracy was assessed. J Clin Epidemiol. 2005;58(9):882‐893. [DOI] [PubMed] [Google Scholar]
- 34. Moher D, Liberati A, Tetzlaff J, Altman DG. Preferred reporting items for systematic reviews and meta‐analyses: the PRISMA statement. PLoS Med. 2009;6(7):e1000097. [DOI] [PMC free article] [PubMed] [Google Scholar]
- 35. Kisiel JB, Dukek BA, V.S.R. Kanipakam R, et al. Hepatocellular carcinoma detection by plasma methylated DNA: discovery, phase i pilot, and phase II clinical validation. Hepatology. 2019;69(3):1180‐1192. [DOI] [PMC free article] [PubMed] [Google Scholar]
- 36. Wei L, Huang Y, Zhao R, et al. Detection of promoter methylation status of suppressor of cytokine signaling 3 (SOCS3) in tissue and plasma from Chinese patients with different hepatic diseases. Clin Exp Med. 2018;18(1):79‐87. [DOI] [PubMed] [Google Scholar]
- 37. Dong X, Hou Q, Chen Y, Wang X. Diagnostic value of the methylation of multiple gene promoters in serum in hepatitis B virus‐related hepatocellular carcinoma. Dis Markers. 2017;2017:2929381. [DOI] [PMC free article] [PubMed] [Google Scholar]
- 38. Hu NA, Fan X‐P, Fan Y‐C, et al. Hypomethylated Ubiquitin‐Conjugating Enzyme2 Q1 (UBE2Q1) gene promoter in the serum is a promising biomarker for hepatitis B virus‐associated hepatocellular carcinoma. Tohoku J Exp Med. 2017;242(2):93‐100. [DOI] [PubMed] [Google Scholar]
- 39. Huang W, Li T, Yang W, et al. Analysis of DNA methylation in plasma for monitoring hepatocarcinogenesis. Genet Test Mol Bioma. 2015;19(6):295‐302. [DOI] [PMC free article] [PubMed] [Google Scholar]
- 40. Dong X, He H, Zhang W, Yu D, Wang X, Chen Y. Combination of serum RASSF1A methylation and AFP is a promising non‐invasive biomarker for HCC patient with chronic HBV infection. Diagn Pathol. 2015;10:133. [DOI] [PMC free article] [PubMed] [Google Scholar]
- 41. Huang G, Krocker JD, Kirk JL, et al. Evaluation of INK4A promoter methylation using pyrosequencing and circulating cell‐free DNA from patients with hepatocellular carcinoma. Clin Chem Lab Med. 2014;52(6):899‐909. [DOI] [PMC free article] [PubMed] [Google Scholar]
- 42. Han LY, Fan YC, Mu NN, et al. Aberrant DNA methylation of G‐protein‐coupled bile acid receptor Gpbar1 (TGR5) is a potential biomarker for hepatitis B Virus associated hepatocellular carcinoma. Int J Med Sci. 2014;11(2):164‐171. [DOI] [PMC free article] [PubMed] [Google Scholar]
- 43. Yang Y, Fan Y‐C, Gao S, et al. Methylated cysteine dioxygenase‐1 gene promoter in the serum is a potential biomarker for hepatitis B virus‐related hepatocellular carcinoma. Tohoku J Exp Med. 2014;232(3):187‐194. [DOI] [PubMed] [Google Scholar]
- 44. Kuo C‐C, Lin C‐Y, Shih Y‐L, et al. Frequent methylation of HOXA9 gene in tumor tissues and plasma samples from human hepatocellular carcinomas. Clin Chem Lab Med. 2014;52(8):1235‐1245. [DOI] [PubMed] [Google Scholar]
- 45. Zhang P, Wen X, Gu F, et al. Methylation profiling of serum DNA from hepatocellular carcinoma patients using an Infinium Human Methylation 450 BeadChip. Hep Intl. 2013;7(3):893‐900. [DOI] [PubMed] [Google Scholar]
- 46. Sun F‐K, Fan Y‐C, Zhao J, et al. Detection of TFPI2 methylation in the serum of hepatocellular carcinoma patients. Dig Dis Sci. 2013;58(4):1010‐1015. [DOI] [PubMed] [Google Scholar]
- 47. Sun S, Xu MZ, Poon RT, Day PJ, Luk JM. Circulating Lamin B1 (LMNB1) biomarker detects early stages of liver cancer in patients. J Proteome Res. 2010;9(1):70‐78. [DOI] [PubMed] [Google Scholar]
- 48. Hu L, Chen G, Yu H, Qiu X. Clinicopathological significance of RASSF1A reduced expression and hypermethylation in hepatocellular carcinoma. Hep Intl. 2010;4(1):423‐432. [DOI] [PMC free article] [PubMed] [Google Scholar]
- 49. Chang H, Yi B, Li LI, et al. Methylation of tumor associated genes in tissue and plasma samples from liver disease patients. Exp Mol Pathol. 2008;85(2):96‐100. [DOI] [PubMed] [Google Scholar]
- 50. Zhang Y‐J, Wu H‐C, Shen J, et al. Predicting hepatocellular carcinoma by detection of aberrant promoter methylation in serum DNA. Clin Cancer Res. 2007;13(8):2378‐2384. [DOI] [PubMed] [Google Scholar]
- 51. Wang J, Qin Y, Li BO, Sun Z, Yang BO. Detection of aberrant promoter methylation of GSTP1 in the tumor and serum of Chinese human primary hepatocellular carcinoma patients. Clin Biochem. 2006;39(4):344‐348. [DOI] [PubMed] [Google Scholar]
- 52. Yeo W, Wong N, Wong W‐L, Lai PBS, Zhong S, Johnson PJ. High frequency of promoter hypermethylation of RASSF1A in tumor and plasma of patients with hepatocellular carcinoma. Liver Int. 2005;25(2):266‐272. [DOI] [PubMed] [Google Scholar]
- 53. Lin Q, Chen L‐B, Tang Y‐M, Wang J. Promoter hypermethylation of p16 gene and DAPK gene in sera from hepatocellular carcinoma (HCC) patients. Chin J Cancer Res. 2005;17(4):250‐254. [Google Scholar]
- 54. Wong IHN, Zhang J, Lai PBS, et al. Quantitative analysis of tumor‐derived methylated p161NK4a sequences in plasma, serum, and blood cells of hepatocellular carcinoma patients. Clin Cancer Res. 2003;9(3):1047‐1052. [PubMed] [Google Scholar]
- 55. Wong IH, Lo YM, Yeo W, et al. Frequent p15 promoter methylation in tumor and peripheral blood from hepatocellular carcinoma patients. Clin Cancer Res. 2000;6(9):3516‐3521. [PubMed] [Google Scholar]
- 56. Huang Z, Hua D, Hu YU, et al. Quantitation of plasma circulating DNA using quantitative PCR for the detection of hepatocellular carcinoma. Pathol Oncol Res. 2012;18(2):271‐276. [DOI] [PubMed] [Google Scholar]
- 57. Yang Y‐J, Chen H, Huang P, Li C‐H, Dong Z‐H, Hou Y‐L. Quantification of plasma hTERT DNA in hepatocellular carcinoma patients by quantitative fluorescent polymerase chain reaction. Clin Invest Med. 2011;34(4):E238‐E244. [DOI] [PubMed] [Google Scholar]
- 58. Dong ZZ, Yao DF, Yao M, et al. Clinical impact of plasma TGF‐beta1 and circulating TGF‐beta1 mRNA in diagnosis of hepatocellular carcinoma. Hepatobiliary Pancreat Dis Int. 2008;7(3):288‐295. [PubMed] [Google Scholar]
- 59. Ren N, Qin L‐X, Tu H, Liu Y‐K, Zhang B‐H, Tang Z‐Y. The prognostic value of circulating plasma DNA level and its allelic imbalance on chromosome 8p in patients with hepatocellular carcinoma. J Cancer Res Clin Oncol. 2006;132(6):399‐407. [DOI] [PMC free article] [PubMed] [Google Scholar]
- 60. Mansour LA, El Raziky M, Mohamed AA, et al. Circulating hypermethylated RASSF1A as a molecular biomarker for diagnosis of hepatocellular carcinoma. Asian Pac J Cancer Prev. 2017;18(6):1637‐1643. [DOI] [PMC free article] [PubMed] [Google Scholar]
- 61. Mohamed NA, Swify EM, Amin NF, Soliman MM, Tag‐Eldin LM, Elsherbiny NM. Is serum level of methylated RASSF1A valuable in diagnosing hepatocellular carcinoma in patients with chronic viral hepatitis C? Arab J Gastroenterol. 2012;13(3):111‐115. [DOI] [PubMed] [Google Scholar]
- 62. Iizuka N, Oka M, Sakaida I, et al. Efficient detection of hepatocellular carcinoma by a hybrid blood test of epigenetic and classical protein markers. Clin Chim Acta. 2011;412(1–2):152‐158. [DOI] [PubMed] [Google Scholar]
- 63. Li F, Fan Y‐C, Gao S, Sun F‐K, Yang Y, Wang K. Methylation of serum insulin‐like growth factor‐binding protein 7 promoter in hepatitis B virus‐associated hepatocellular carcinoma. Genes Chromosomes Cancer. 2014;53(1):90‐97. [DOI] [PubMed] [Google Scholar]
- 64. Ji XF, Fan YC, Gao S, et al. MT1M and MT1G promoter methylation as biomarkers for hepatocellular carcinoma. World J Gastroenterol. 2014;20(16):4723‐4729. [DOI] [PMC free article] [PubMed] [Google Scholar]
- 65. Huang Z‐H, Hu YU, Hua D, Wu Y‐Y, Song M‐X, Cheng Z‐H. Quantitative analysis of multiple methylated genes in plasma for the diagnosis and prognosis of hepatocellular carcinoma. Exp Mol Pathol. 2011;91(3):702‐707. [DOI] [PubMed] [Google Scholar]
- 66. Chu HJ, Heo J, Seo SB, et al. Detection of aberrant p16INK4A methylation in sera of patients with liver cirrhosis and hepatocellular carcinoma. J Korean Med Sci. 2004;19(1):83‐86. [DOI] [PMC free article] [PubMed] [Google Scholar]
- 67. Li W, Yue F, Dai Y, et al. Suppressor of hepatocellular carcinoma RASSF1A activates autophagy initiation and maturation. Cell Death Differ. 2019;26(8):1379‐1395. [DOI] [PMC free article] [PubMed] [Google Scholar]
- 68. Farinati F, Marino D, De Giorgio M, et al. Diagnostic and prognostic role of alpha‐fetoprotein in hepatocellular carcinoma: both or neither? Am J Gastroenterol. 2006;101(3):524‐532. [DOI] [PubMed] [Google Scholar]
Associated Data
This section collects any data citations, data availability statements, or supplementary materials included in this article.
Supplementary Materials