

Abstract
Objectives:
To (1) design and build a low-cost exposure chamber system for whole-body exposure of rodents to electronic cigarette aerosol, (2) provide detailed instructions with particular focus on automated e-cigarette activation, and (3) develop a simple mathematical model for aerosol levels in the exposure chamber.
Methods:
We built the system with standard laboratory equipment and an open-source electronics platform (Arduino) for e-cigarette activation. Arduino is used to control a solenoid, which pushes the activation button of so-called “Mod” e-cigarettes, and a pump to move the aerosol from the mouthpiece of the e-cigarette into the chamber. For “Pods” and “Cigalikes,” the solenoid is not used as they are activated by the vacuum created by the pump. Aerosol concentrations were measured with a light-scattering laser photometer.
Results:
The system allows varying the air exchange rate, monitoring aerosol levels, and programming arbitrary puff topography. Aerosol concentrations observed for different chamber operating conditions (puff time and period, e-cigarette power output, air exchange rate) were consistent with the mathematical model.
Conclusions:
Our low-cost exposure chamber can be used in animal experimental studies of the health effects of e-cigarettes. Our model allows estimating design parameters such as chamber volume, air exchange rate, and puff period.
Keywords: E-cigarette, Exposure chamber, Vaping machine, Puff topography, Open-source electronics platform, Arduino, Design, Animal studies
1. INTRODUCTION
E-cigarette (e-cig) usage in the US has increased dramatically over the past several years, with about 7.9 million users in 2017 (Wang et al. 2018). Despite the public’s perception of e-cigs as “safer” than tobacco cigarettes (Brikmanis et al. 2017, Wagner et al. 2017), a wide variety of toxic organic and inorganic chemicals, including carcinogens, are found in e-cig aerosol (Williams et al. 2013, Kosmider et al. 2014, Jensen et al. 2015, Aherrera et al. 2017, Hess et al. 2017, Dunbar et al. 2018, Olmedo et al. 2018, Zhao et al. 2019). Little is known about the potential long-term human health effects of exposure to e-cig aerosols, especially as it relates to cancer, cardiovascular or respiratory disease (National Academies of Sciences and Medicine 2018).
Animal experiments utilizing controlled e-cig exposure conditions provide a useful complement to human e-cig studies. Besides control over air exchange rates, any exposure system requires an ability to generate e-cig aerosol, deliver it to a housing chamber, and measure the resultant aerosol concentrations. A variety of different methods and approaches have been reported. For example, tobacco cigarette smoking machines have been adapted to inject e-cig aerosol into custom-built exposure chambers (Sussan et al. 2015), vacuum pumps were used to withdraw e-cig aerosol for injection into custom-built exposure chambers (McGrath-Morrow et al. 2015, Smith et al. 2015, Larcombe et al. 2017, Laube et al. 2017), and commercial vaping machines were used to inject aerosol from e-cigs into custom-built (Lauterstein et al. 2016, Zelikoff et al. 2018) or commercial chamber systems (Lechasseur et al. 2017, Alasmari et al. 2018, Qasim et al. 2018, Shi et al. 2019). In general, such attempts include one or more compromises with respect to design, performance, accuracy, cost or reliability.
Aerosol generation from e-cigs depends on device type (Williams and Talbot 2019). E-cigs can be divided into two categories: closed-system devices (e.g., “Cigalikes” and “Pods”), which do not allow users to refill such devices with their own e-liquid, change heating coils, or adjust power output; and open-system devices (e.g., “Mods”) which do not have these constraints (Cooper et al. 2016). Closed-system e-cigs are typically activated by the vacuum created by a user seeking to inhale the aerosol from the mouthpiece, whereas open-system e-cigs require the user to push a button. In early studies, the buttons of open-system e-cigs were pushed manually to activate them, resulting in puff times which cannot be easily reproduced and whose accuracy is not well characterized (Geiss et al. 2016, Olmedo et al. 2016, Talih et al. 2016, Jensen et al. 2017). More recent studies used either an electronically controlled solenoid to push the buttons (Havel et al. 2017, Olfert et al. 2018) or modified the button terminal to short-circuit the two contacts with an electronically controlled relay switch (Bitzer et al. 2018). Closed-system e-cigs are typically activated by attaching tubing to their mouthpiece and applying a vacuum with a pump. Finally, commercially available aerosol generators have been developed that deliver variable electrical power to the heating coil-containing cartridges of closed-system e-cigs or the atomizers of open-system e-cigs to achieve desired puff topographies (Zhao et al. 2016, Soulet et al. 2017).
Once aerosol is generated, it needs to be moved from the mouthpiece of the e-cig into the exposure chamber. Most commonly, tubing is attached to the mouthpiece and aerosol is sucked away via a vacuum pump, mimicking the action of an e-cig user who applies a vacuum to his/her mouthpiece (McGrath-Morrow et al. 2015, Smith et al. 2015, Sussan et al. 2015, Sleiman et al. 2016, Laube et al. 2017). In contrast, some commercial aerosol generators (Zhao et al. 2016, Soulet et al. 2017) push the aerosol out of the cartridge/atomizer and inject it through tubing into an exposure chamber, avoiding use of a vacuum pump and subsequent potential for aerosol contamination (Lauterstein et al. 2016, Zelikoff et al. 2018). One commercial vaping machine (Soulet et al. 2017) also allows sucking the aerosol from the atomizer.
Some animal exposure experiments do not report e-cig aerosol levels but instead simply characterize puff topography (McGrath-Morrow et al. 2015, Smith et al. 2015, Lechasseur et al. 2017, Olfert et al. 2018, Qasim et al. 2018, Shi et al. 2019). Often, however, e-cig aerosol concentrations within the exposure chambers are measured with commercially available particulate matter optical monitors such as nephelometers, which measure light reflected over a wide range of angles. Such instruments are typically factory-calibrated to provide accurate readings for a certain type of aerosol, e.g., red Arizona desert dust (Heintzenberg et al. 2006). Typically, these instruments are not specifically calibrated for e-cig aerosol, which has very different optical properties (Charlson et al. 2012), even though calibration can be accomplished using gravimetric analysis, in which aerosol measured optically by the nephelometer is collected onto a pre-weighed filter (Cai et al. 2014). By measuring the cumulative aerosol mass deposited on the filter, and comparing it to the nephelometer readings, one can properly calibrate optical concentration measurements. This approach is described in the current manuscript.
While a number of groups have reported development and use of custom-built e-cig aerosol exposure systems, none describe detailed construction of a low-cost e-cig exposure system that also allows injecting e-cig aerosol with a programmable puff topography. To address this concern, this manuscript describes design and construction of a low-cost exposure chamber for exposing rodents to e-cig aerosol with arbitrary puff topography. Furthermore, the paper examines the effects of puff topography, power output, and air exchange rate on transient aerosol concentrations. Lastly, a simple mathematical model is presented to interpret and analyze transient chamber aerosol levels and estimate chamber design parameters.
2. DESIGN OF EXPOSURE CHAMBER
2.1. Chamber construction
The system is specifically designed to facilitate aerosol injection from an e-cig into a rodent exposure chamber, control of air exchange rate, and measurement of aerosol concentration by a light-scattering laser photometer. Figure 1 shows a sketch and photo of our exposure system. A commercially available, 5-sided 12” cubic acrylic display box was purchased and modified to serve as the exposure chamber (shopPOPdisplays.com). The black plastic base that came with the box was not used. Instead, the case was turned upside down and a 13” × 13” frame with an 11” × 11” opening was constructed and glued onto the chamber to support a separate, removable 3-mm thick acrylic cover sealed to the frame with optical grease. This cover can easily be removed to allow rodents to be placed into or removed from the exposure chamber. With a chamber area of about 144 square inches, the chamber can house up to 12 adult mice (with a weight <25 g) as guidelines suggest ~12 square inches per mouse.
Figure 1:
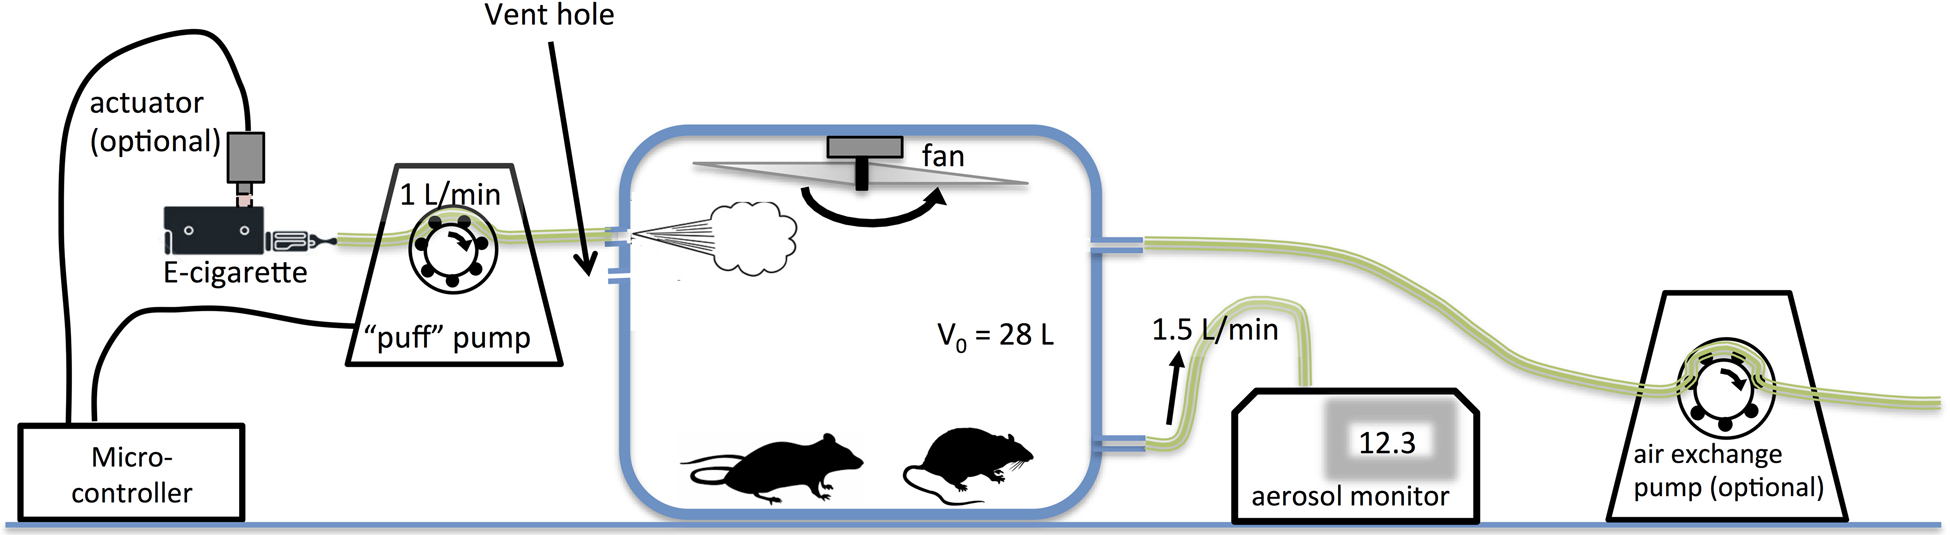
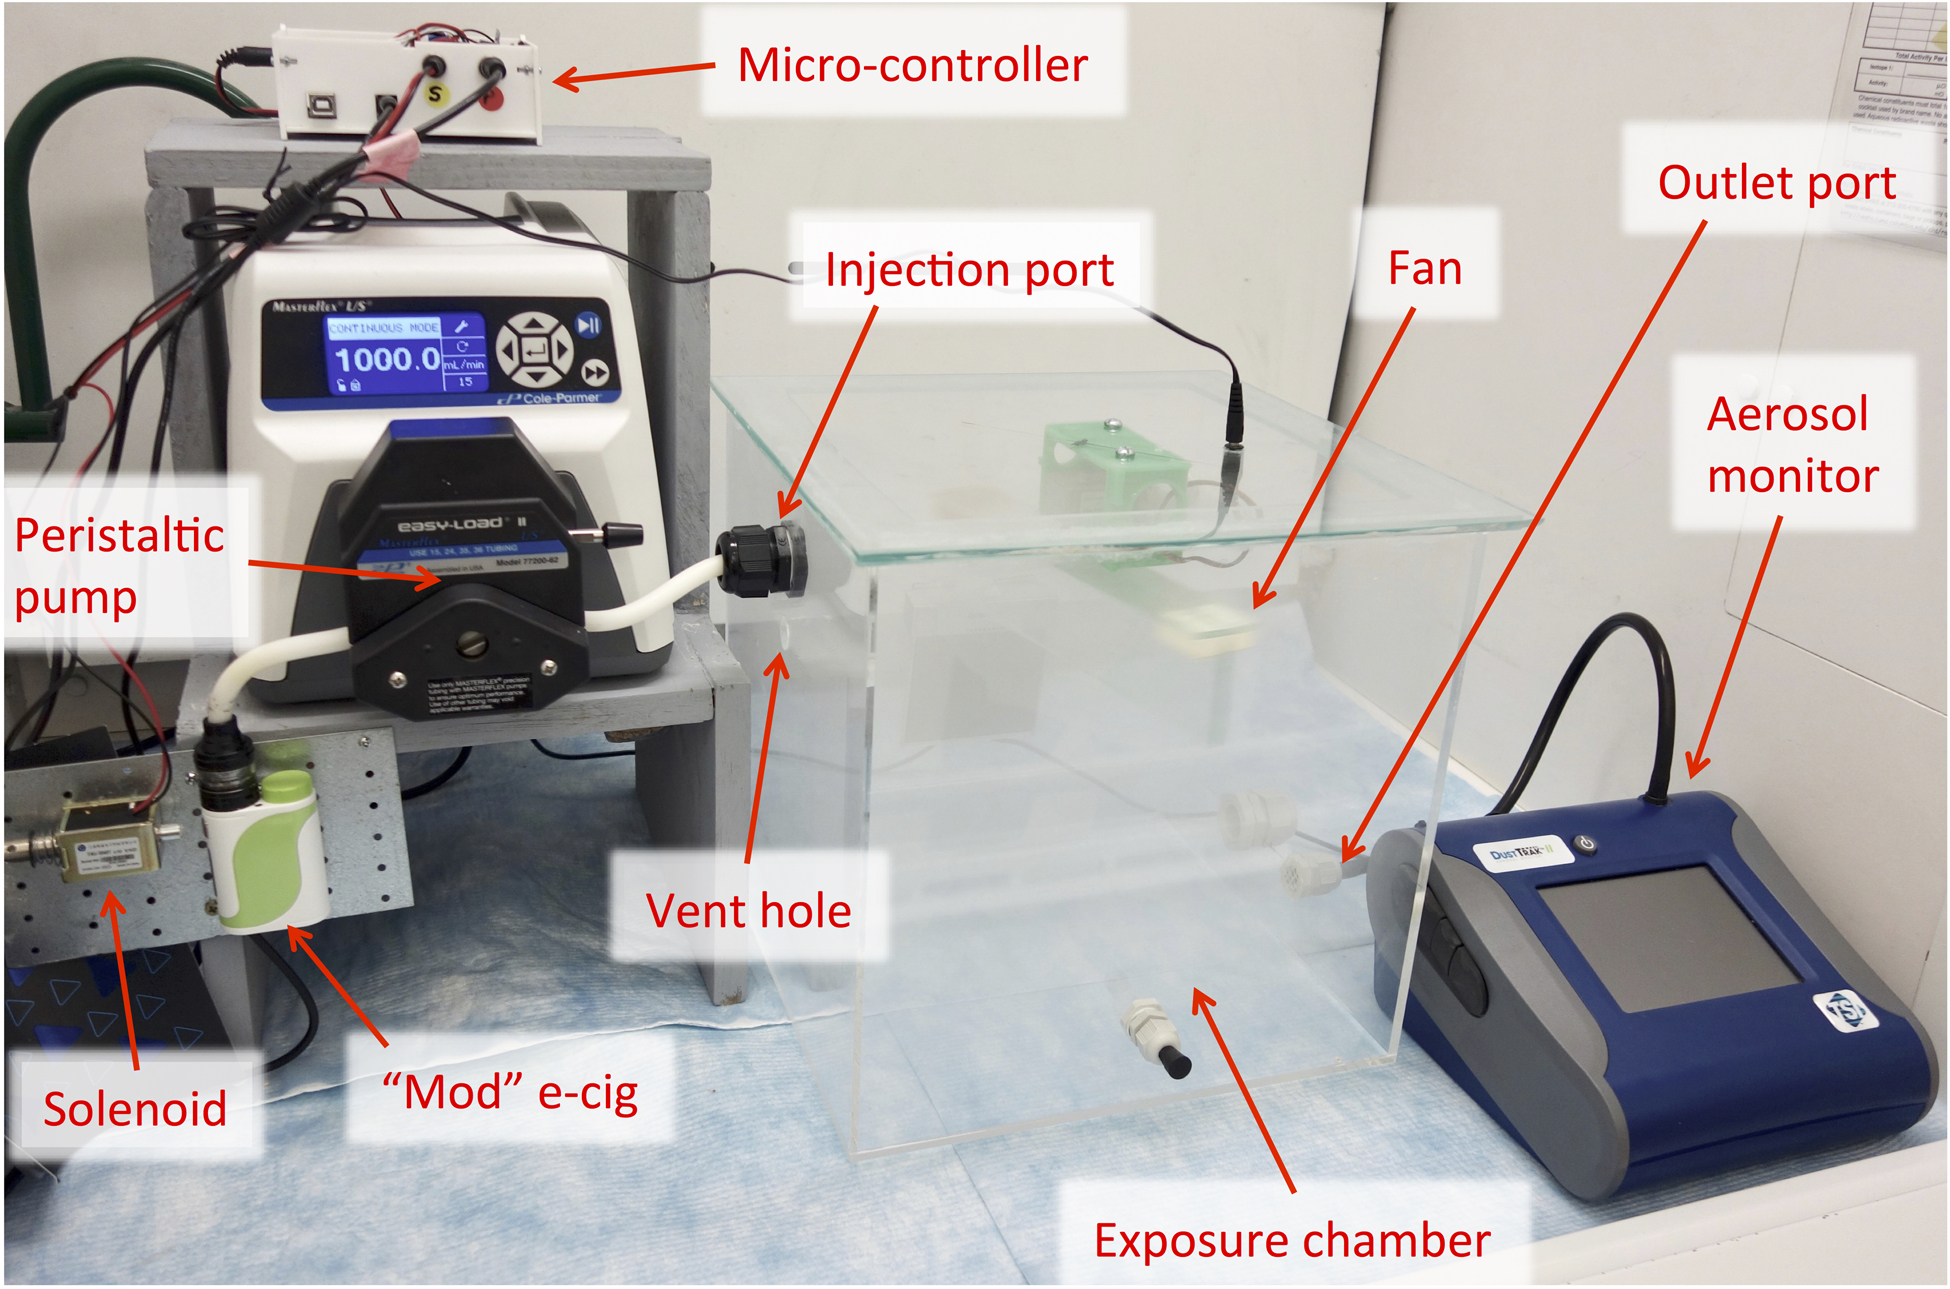
(a) Sketch of exposure system. Animals were not present in the experiments described in this paper and are only shown for illustrative purposes. (b) Photo of exposure chamber system (without an optional air exchange pump).
Holes were drilled into the sides of the exposure chamber to facilitate entry ports for e-cig aerosol and fresh air and exit ports to attach an aerosol concentration monitoring device and an optional air exchange pump. Holes were sealed with strain relief cable glands (Altech ATEX Strain Relief Cable Glands, Altech Corp, Flemington, NJ) to allow secure attachment of tubing. At the entry side, e-cig device mouthpieces were attached to peristaltic tubing (C-Flex, Cole-Parmer, Vernon Hills, IL) which was then connected to the exposure chamber entry port.
To mimic the intermittent pressure exerted by a human user’s suction on the e-cig mouthpiece and to achieve a programmable puff topography, a peristaltic pump (Masterflex L/S Digital Drive, 600 rpm with Masterflex L/S Easy-Load® II Head, 77200–62, and size 15 C-Flex tubing, PFL-Series 6424–15, all Cole Parmer, Vernon Hills, IL) was intermittently operated using a custom-built microcontroller. The flow rate during puffs was 1 L/min (Olmedo et al. 2016).
A constant air exchange rate was maintained by pumping air out of the chamber using the built-in pump of a light-scattering laser photometer (DustTrak 8530, TSI, Inc., Shoreview, MN) operated at 1.5 L/min. This aerosol monitor was connected to the chamber by putting the flexible 4-mm ID TSI-provided air sampling tubing over a larger 6.35-mm OD and 3-cm long thin-walled tubing that passed through a cable gland into the exposure chamber. We observed that direct insertion of the air sampling tubing into the gland resulted in lowered putative concentrations, presumably because tightening the cable gland compressed air flow. The monitor was operated without a size-selective impactor for several reasons: (a) we did not want to exclude any e-cig aerosol droplets from the measurement, (b) the cutoff-sizes of the impactors provided by the manufacturer were designed for a flow rate of 3 L/min and not for the 1.5 L/min we used, and (c) e-cig aerosol has a density different from the particles, for which the impactor was developed resulting in an unknown change in cutoff size (Huang and Tsai 2002). If desired, increased air exchange rates can be achieved by attaching a second peristaltic pump to a second exit port. Since at the time when we conducted our experiments the optional peristaltic pump shown in Figure 1a was not available to us, we used in a subset of our experiments an aeration pump (AP-4, Danner Manufacturing, Inc., Islandia NY) to achieve a higher air exchange rate of 3.65 L/min. A 16-mm ventilation hole allows exchange of air pumped into or out of the chamber with the atmosphere to avoid pressure disequilibration with the outside atmosphere.
A custom-built fan was attached to the cover plate, operated continuously during each exposure session to ensure uniform aerosol distribution. Its rotor consisted of a custom-built acrylic T-profile blade, constructed from a vertically oriented 3-mm thick acrylic panel (11” × 2”) that was glued with silicone to a horizontally oriented 3-mm thick panel (11” × 1.5”). To reinforce the connection, on each end of the rotor, cuboid plastic pieces were glued into the two corners formed where the vertical abutted the horizontal panel. A motor hub (39079 Tetrix MAX Motor Hub, Pitsco Education, Pittsburg, KS) was mounted onto the center of the horizontal rotor panel by drilling two holes into the panel and then attaching the hub to the panel using two machine screws which fit into threaded holes in the hub. The hub was then attached to an electric gear motor (Uxcell DC 12V 65RPM, Kwai Fong New Territories, Hong Kong).
Potential changes in chamber temperature were measured using a digital thermometer mounted to the inside vertical wall of the chamber (Thermo Fisher Traceable®, Waltham, MA). Atmospheric humidity and temperature measurements were made using a Traceable® digital humidy/temperature monitor (11-661-12, Thermo Fisher, Waltham, MA).
2.2. Control of puff topography
To create arbitrary puff topographies, we used the Arduino open-source electronics platform (www.arduino.cc). An “Arduino Uno” board was used to control a solenoid (large push-pull solenoid, Product ID 413, Adafruit Industries, LLC, New York, NY), which mechanically pushed the activation button of an open-system e-cig, and a peristaltic pump, which directed the aerosol from the e-cig mouthpiece into the exposure chamber. The peristaltic pump was programmed to run one second longer than the button was pushed, to withdraw aerosol still present in the tubing.
Arduino allows programming the electronic board via upload of code written in the Arduino programming language from a personal computer (Windows, Mac OS X or Linux operating systems). Figure A (Supplemental Material) shows the code we used to program the board. The board allows generating low-voltage signals on so-called pins, which we used to control the peristaltic pump and the solenoid. Since these signals are not always strong enough to power a device (the solenoid in our application), they may require amplification through separate electronic circuits. This circuit and additional electronic parts were assembled on a half-sized breadboard (Product ID: 64, Adafruit Industries, LLC, New York, NY). Figure B (Supplemental Material) shows the wiring diagram for the Arduino board and breadboard.
To control the solenoid, the signal on Pin 12 was used to control a TIP120 Power Darlington transistor, which could generate the relatively high currents (on the order of 1 Amp) needed to actuate the solenoid. A resistor (1 kΩ) was used to attenuate the signal from Pin 12. A flyback diode (1N4004) protected the transistor from the high voltages that would otherwise have been generated when the solenoid was switched off. To control the pump, the signal on Pin 13 was used to control a relay (Tolako 5v Relay Module) that short-circuited two pins on the pump’s remote control port. A DB25 D-sub Male Plug 25-pin Port Terminal Breakout PCB Board (Twinkle Bay) was used to connect the two short-circuiting wires to the pump’s female DB25 port. A real-time clock (DS3231 RTC Module, Diymore) was connected to the Arduino board because the Arduino internal clock is based on a resonator crystal, whose resonant frequency can fluctuate substantially, e.g., due to changes in ambient temperature.
2.3. Exposure assessment
To calibrate the aerosol monitor, we used gravimetric analysis of aerosol deposited onto a collection filter located downstream of the DustTrak light scattering chamber. We weighed the aerosol mass Δm deposited onto the internal membrane filter during a time period Δt which was long enough to collect a measurable amount of aerosol. The average aerosol concentration during that session was then calculated via where Q is the flow rate with which the aerosol monitor withdraws air from the chamber (which can be set at a constant value between 1.5 and 3 L/min), and the factor of 2/3 accounts for the clean air sheath flow, which is created within the monitor to reduce aerosol accumulation on optically sensitive components. The high aerosol levels in the chamber allowed us to collect sufficient aerosol on the membrane within a relatively short amount of time, e.g., 10 mg in about two hours. Thus, calibration could be performed with a laboratory precision analytic balance (XS105 DualRange, Mettler Toledo, Columbus, OH). Also because of the high aerosol concentrations generated, the internal pump was operated at its minimum flow rate, 1.5 L/min, to reduce contamination of different components of the aerosol monitor (e.g., optical chamber, tubing, protective filters of the pump) by the aerosol.
Aerosol was collected onto a 37 mm hydrophilic membrane filter (HAWP, 0.45 μm pore size, mixed cellulose ester membrane, Millipore, Burlington, MA). Gravimetric analyses performed with membranes of either 0.22 or 0.80 μm pore size yielded the same calibration factors indicating that the membranes retained the majority of the aerosol. We chose the 0.45-μm membrane, because the flow resistance of the 0.22-μm membrane resulted in early flow rate warnings from the DustTrak monitor and because the 0.45-μm membrane should theoretically filter out more aerosol than the 0.80-μm membrane, providing additional protection of the aerosol monitor’s downstream pump. We also performed experiments to measure directly potential membrane mass changes due to humidity differences that might affect measurements during a typical exposure session. Due to the large quantities of aerosol mass collected, changes in membrane mass due to absorption or desorption of humidity were found to be minor (<1 mg) and, for the purposes of this study, did not make it necessary to weigh the membranes in a humidity and temperature controlled environment. We also noted that use of a hydrophobic membrane (0.45-μm PTFE membrane, Fluoropore, Millipore, Waltham, MA) was not practical, because the e-cig liquid aerosol was repelled by the hydrophobic filter not allowing for efficient aerosol collection.
TSI, the DustTrak aerosol monitor manufacturer, recommends changing both the membrane filter (used for gravimetric analysis) and the filter that protects the aerosol-free sheath flow at the same time. The recommended interval is determined from the total mass of aerosol that is estimated to have entered the monitor based on the times series of the optically measured aerosol concentration. According to the instrument manual, the aerosol monitor prompts the user to change internal filters after measuring aerosol of a concentration of 1 mg/m3 for 350 hours, presumably at a flow rate of 3 L/min. This corresponds to a cumulative aerosol mass of 63 mg, at which the monitor’s display prompts the user to change filters.
3. MODEL FOR AEROSOL LEVELS IN THE CHAMBER
We developed a simple model to interpret measured aerosol levels in the exposure chamber. This model is based on a balance for the mass of aerosol present in the chamber similar to a model for indoor e-cig aerosol concentrations (Saffari et al. 2014):
| (1) |
where V0 (L) is the chamber volume, c (mg/m3) is the aerosol concentration in the mixed chamber, q (mg/min) is the aerosol source term, Qex (L/min) is the total flow rate (aerosol pump & optional air exchange pump) driving the air exchange rate, and the flux Fdep (mg/min) represents aerosol deposition. This flux is assumed to be proportional to the aerosol concentration: Fdep = k c where k (L/min) is a rate constant. Since it was beyond the scope of our study to model aerosol levels within a puff cycle, we assume q to be constant throughout an exposure session. If the entire aerosol mass produced by the e-cig per puff, mpuff (mg), entered the chamber (without accounting for possible losses to the tubing wall), the source term can be expressed as follows: q = mpuff/T where T = tpuff + tinter (s) is the period, tpuff is the puff time, and tinter is the interpuff time.
Starting with an aerosol-free chamber at time t = 0, the analytical solution to Eq. (1) for the aerosol concentration is given by
| (2) |
where
| (3) |
(min) is a characteristic time scale and
| (4) |
is the steady-state or maximum concentration. This means the aerosol concentration in the chamber (averaged over the period T) increases initially linearly to then approach a steady-state in a nonlinear fashion. According to Eq. (4), the steady-state concentration cmax can be controlled by changing the air exchange rate Qex and the rate q with which e-cig aerosol is supplied to the chamber. The initial slope (at time t = 0) of the concentration versus time curve is given by
| (5) |
This slope can be used to obtain an estimate for mpuff as follows:
| (6) |
4. TESTING OF THE EXPOSURE CHAMBER
4.1. Summary of exposure scenarios
For an open-system e-cig (iStick25, Eleaf USA, Santa Ana, CA), we defined baseline exposure conditions as those obtained for a puff time tpuff = 2 s, a period T = 60 s, an air exchange rate Qex = 1.5 L/min, and a power output P = 30 W. Conducting an exposure simulating experiment entailed measuring the aerosol concentration in the chamber for up to 20 min; however, experiments were terminated when the maximum aerosol concentration that could be measured with the aerosol monitor we used (400 mg/m3) was approached. We performed additional measurements in which we varied only one of the parameters from the baseline experiment: T = 30 s, P = 40 W, tpuff = 3 s, or Qex = 3.65 L/min. We did not use puff times greater than 3 s, which would be representative of more experienced users (Evans and Hoffman 2014), because larger puff times may result in overheating of an e-cig if the device is used over a long period of time (e.g. 60 min for animal exposure).
For a closed-system e-cig (BLU, Charlotte, NC), we measured baseline transient chamber aerosol levels for a puff time tpuff = 2 s, a period T = 60 s, and an air exchange rate Qex = 1.5 L/min. We performed additional measurements in which we varied only one of the parameters from the baseline experiment: tpuff = 3 s or T = 30 s.
All experiments were performed in triplicate. The first four columns of Table 1 summarize the parameters of the different exposure scenarios.
Table 1:
Overview of exposure chamber experiments. The four left columns indicate the parameters whose effects we studied: puff time tpuff, period T, power P and air exchange rate Qex. The three right columns show the mean (standard deviation) of the model parameters used to describe measured time-dependent aerosol levels: characteristic time τ, steady-state concentration cmax, and initial slope dc/dt |t=0.
| tpuff (s) | T (s) | P (W) * | Qex (L/min) | τ (min)† | cmax (mg/m3)† | dc/dt |t=0 (mg/(m3-min)) |
|---|---|---|---|---|---|---|
| Mod | ||||||
| 2 | 60 | 30 | 1.5 | 12.3 (1.4) | 177 (17) | 14.5 (1.9) |
| 2 | 30 | 30 | 1.5 | - | - | 26.7 (3.3) |
| 3 | 60 | 30 | 1.5 | - | - | 38.3 (6.8) |
| 2 | 60 | 40 | 1.5 | - | - | 35.4 (4.4) |
| 2 | 60 | 30 | 3.65 | 6.2 (0.6) | 66 (2) | 10.7 (1.3) |
| Cigalike | ||||||
| 2 | 60 | - | 1.5 | - | - | 52.5 (3.1) |
| 2 | 30 | - | 1.5 | - | - | 109.5 (2.2) |
| 3 | 60 | - | 1.5 | - | - | 67.8 (22.9) |
Power output P of the cigalike is unknown.
For the experiments in which aerosol levels increased linearly and not approaching a plateau, τ and cmax could not be determined.
4.2. Mathematical analysis of exposure experiments
For the experiments in which aerosol levels (averaged over the period T) depended nonlinearly on time, we fitted aerosol levels predicted by Eq. (2) to the measured data (using Excel’s SOLVER function) and used Eq. (5) to infer the initial slope dc/dt |t=0 from the fit parameters cmax and τ. For the experiments in which average aerosol levels increased linearly, we performed a linear regression to obtain dc/dt |t=0. For each set of triplicate experiments, we reported the mean and standard deviation of dc/dt |t=0, and if the data allowed fitting the nonlinear model we also reported the mean and standard deviation of cmax and τ.
The model presented in Section 3 was used to interpret the fitted values of cmax and τ in terms of more fundamental parameters. To that end, we obtained an order-of-magnitude estimate of the unknown deposition flux Fdep, by assuming that the aerosol droplets have a uniform particle diameter dp. Thus the settling velocity of the aerosol is given by where ρ is the density of the aerosol particulate matter, g is the gravitational acceleration, and μ is the dynamic viscosity of air (Tien and Ramarao 2007). Furthermore we assumed that the aerosol was deposited only onto the floor (and not to the walls or the ceiling) of the chamber. Thus Fdep = vs A0 c where A0 is the area of the chamber floor. With g = 9.81 m/s2, ρ = 1,000 kg/m3, dp = 200 nm and μ = 1.81 × 10⁻⁵ kg/(m-s), we obtain vs = 1.21 μm/s; and with A0 = 929 cm2, the deposition rate constant becomes k = vs A0 = 7 mL/min. Thus k is much smaller than Qex which in our chamber system is at least 1.5 L/min. In reality k is bigger because of aerosol deposition to the chamber walls and the nonuniform size distribution of the aerosol droplets. Larger droplets will deposit much faster than smaller ones and also contribute more to the deposition flux because they carry more mass. Thus it seems possible that the actual k is one to two orders of magnitude higher. If it was two orders of magnitude higher, k = 700 mL/min, k would still be less than half of Qex. Thus it seems reasonable to set k = 0 in Eqs. (3) and (4) when only seeking rough estimates for the characteristic time τ through τ ≈ V0/Qex and for the maximum concentration cmax through cmax ≈ mpuff/(QexT).
4.3. Results and discussion of exposure chamber tests
Figure 2 shows results for the open-system e-cig. For the baseline experiments, time-averaged aerosol levels increased in a nonlinear fashion. The nonlinear regression yielded a maximum concentration cmax = 177 mg/m3 and a characteristic time τ = 12.3 min. The latter value is similar to the characteristic time that one can theoretically estimate by assuming aerosol deposition was negligible. With V0 = 28 L, Qex = 1.5 L/min, and k = 0, one obtains τ = V0 / Q = 19 min according to Eq. (3). From the initial slope, one can calculate from Eq. (6) the mass of aerosol injected per puff, mpuff = 0.38 mg, which is close to the ballpark of published data on the aerosol mass released per puff from an e-cig. E.g., Gillman et al. (2016) measured 1.5 to 28 mg/puff. The fact that we infer a lower value could be related to the use of a 2-s puff time while Gillman et al. used 4 s.
Figure 2:
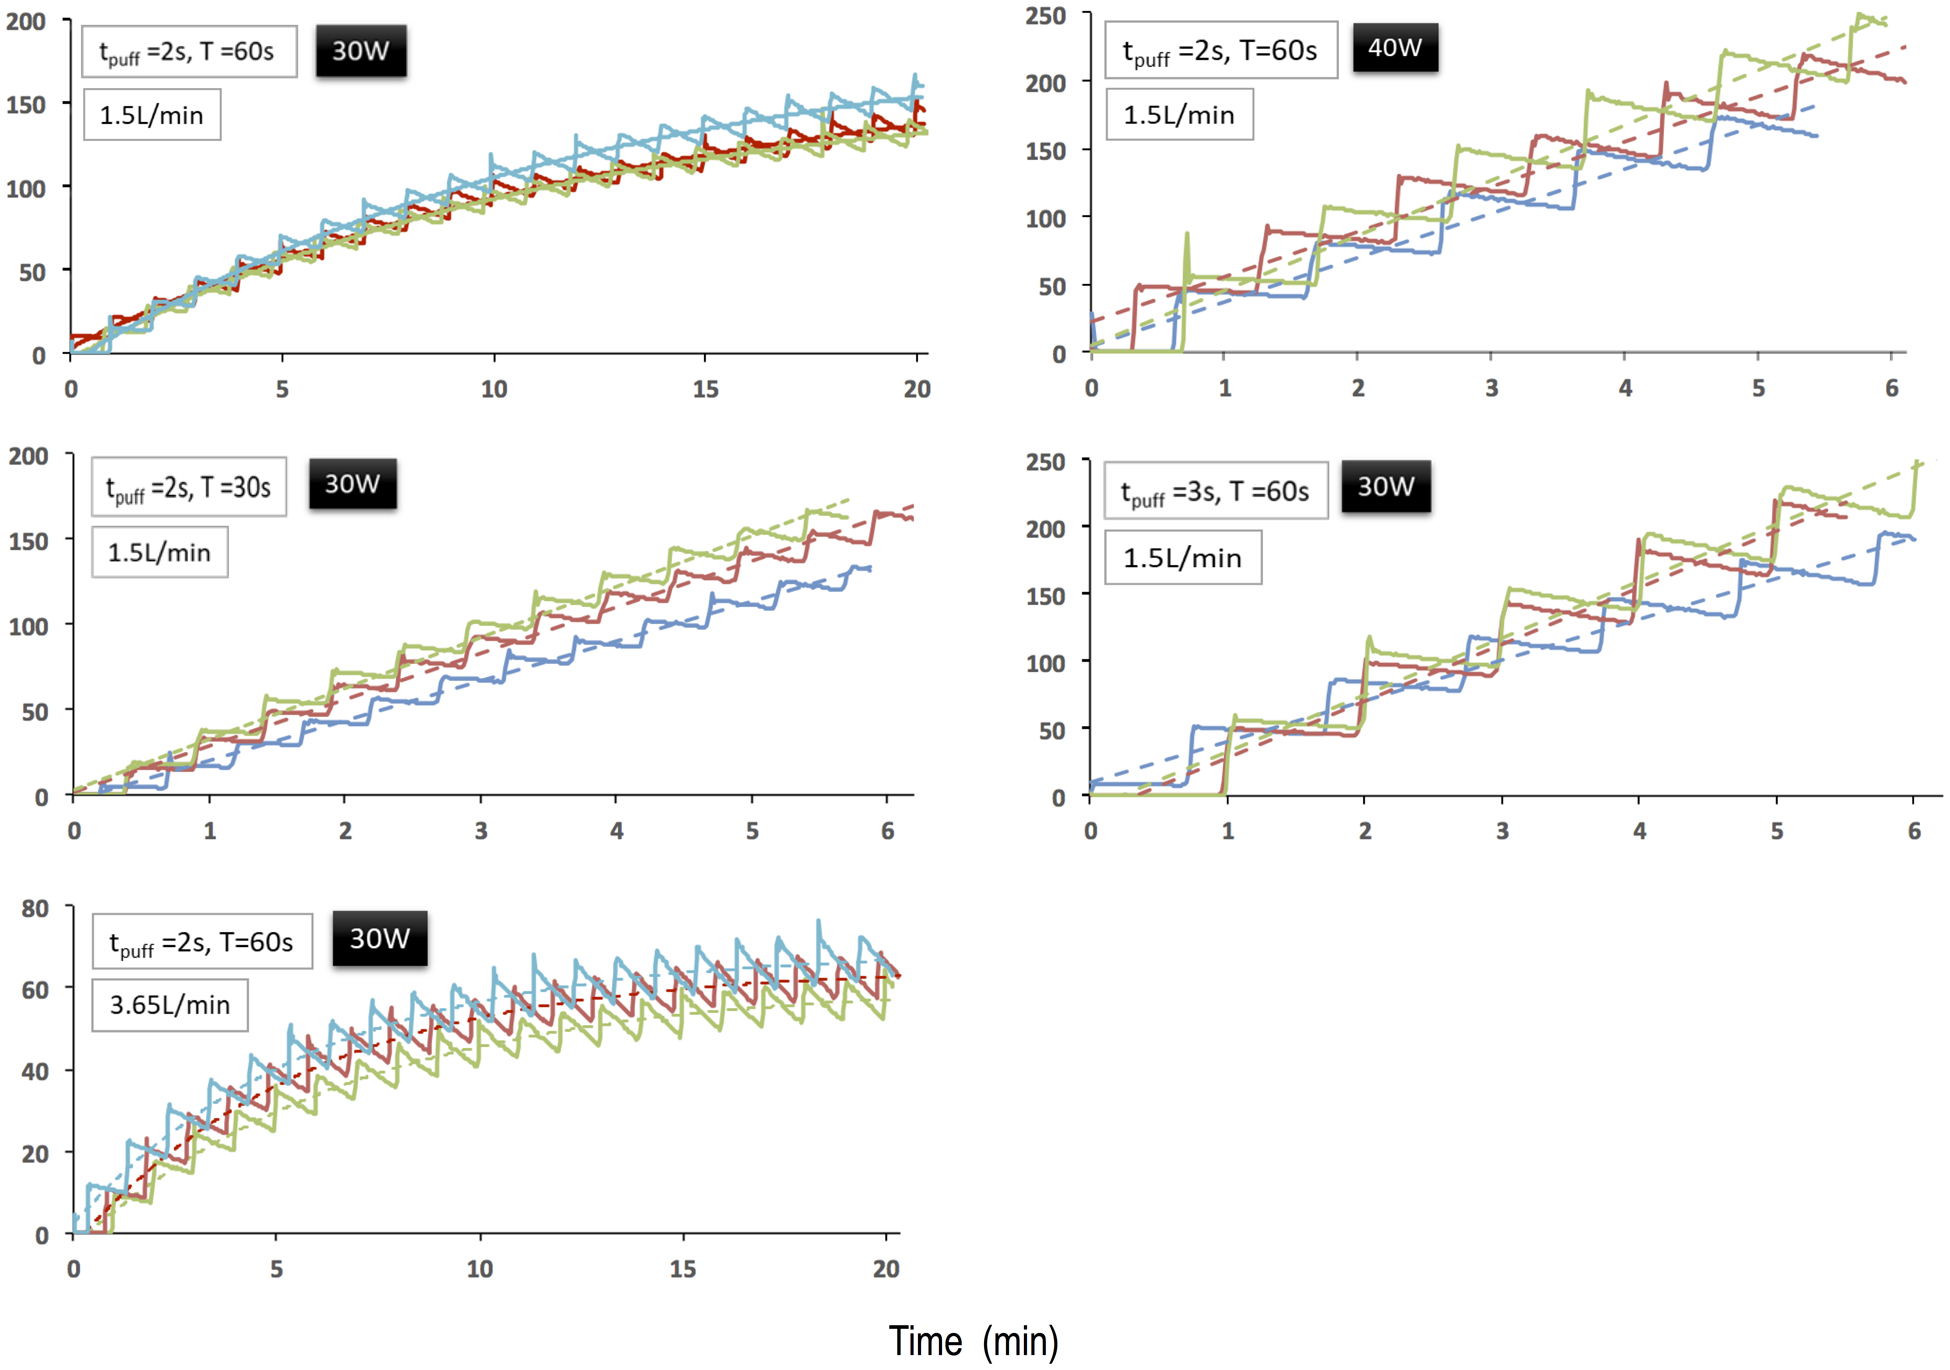
Measured (solid lines) and modeled (dashed lines) aerosol levels (mg/m3) for the experiments, in which aerosol from an open-system e-cig was injected into the chamber.
The three scenarios, in which either the period T was decreased, puff time Tpuff was increased, or power P was increased, resulted as expected in more rapid increases in aerosol levels. The aerosol monitor would have maxed out if we had attempted to obtain a steady-state concentration in the chamber. Since the measured concentration versus time curves can obviously be described by a linear model, we used linear regression to determine the slopes of the c(t) curves. When doubling the number of puffs per unit time (T = 30 s) and therefore doubling the rate q with which aerosol mass was supplied to the chamber, the initial slope dc/dt |t=0 was about twice as high as expected from Eq. (6): 14.5 vs. 26.7 mg/(m3-min). Increasing the puff time tpuff from 2 to 3 sec resulted in a slope that was about three times higher compared to the baseline case. Therefore aerosol production increased nonlinearly. Increasing power P from 30 to 40 W also resulted in a larger slope, because more aerosol is generated when power is increased (Sleiman et al. 2016). For P = 40 W and tpuff = 3 s, the aerosol mass per puff, mpuff, is closer to the range reported by Gillman et al., though still smaller perhaps because they still used a longer puff time.
When increasing the air exchange rate from Qex = 1.5 to 3.65 L/min, the initial slope was similar to the one observed for the baseline case: 14.5 versus 10.7 mg/(m3-min), and the difference between the means was not statistically significant (p=0.052). As expected the steady-state concentration cmax was lower than the one of the baseline case: 66 versus 177 mg/m3. This is becuse increasing air exchange dilutes the aerosol in the chamber. If aerosol deposition was negligible (k = 0), the steady-state concentration cmax should scale inversely with flow rate Qex according to Eq. (4). With this assumption, the ratio of flow rates Qex, 3.65/1.5 = 2.4, should be equal to the ratio of inverse steady-state concentrations cmax, 177/66 = 2.7. While the agreement between the two ratios is not perfect, it is remarkable how well our model predicts the scaling of steady-state concentration with flow rate, despite the assumption k = 0. The fitted characteristic time was 6.2 min and, similar to the baseline case, quite close to the value that one can theoretically estimate if aerosol deposition was negligible: τ = V0 / Qex = 8.5 min.
Figure 3 shows results for the closed-system e-cig. For all experiments, the aerosol monitor would have maxed out quickly. Trends similar to those observed for the open-system e-cig were observed. A decrease in period T and an increase in puff time Tpuff resulted in more rapid increases in aerosol levels. Specifically decreasing the period T by a factor of 2 resulted in an almost perfect two-fold increase in the initial rate dc/dt |t=0 as predicted by Eq. (6): 53 vs. 110 mg/(m3-min).
Figure 3:
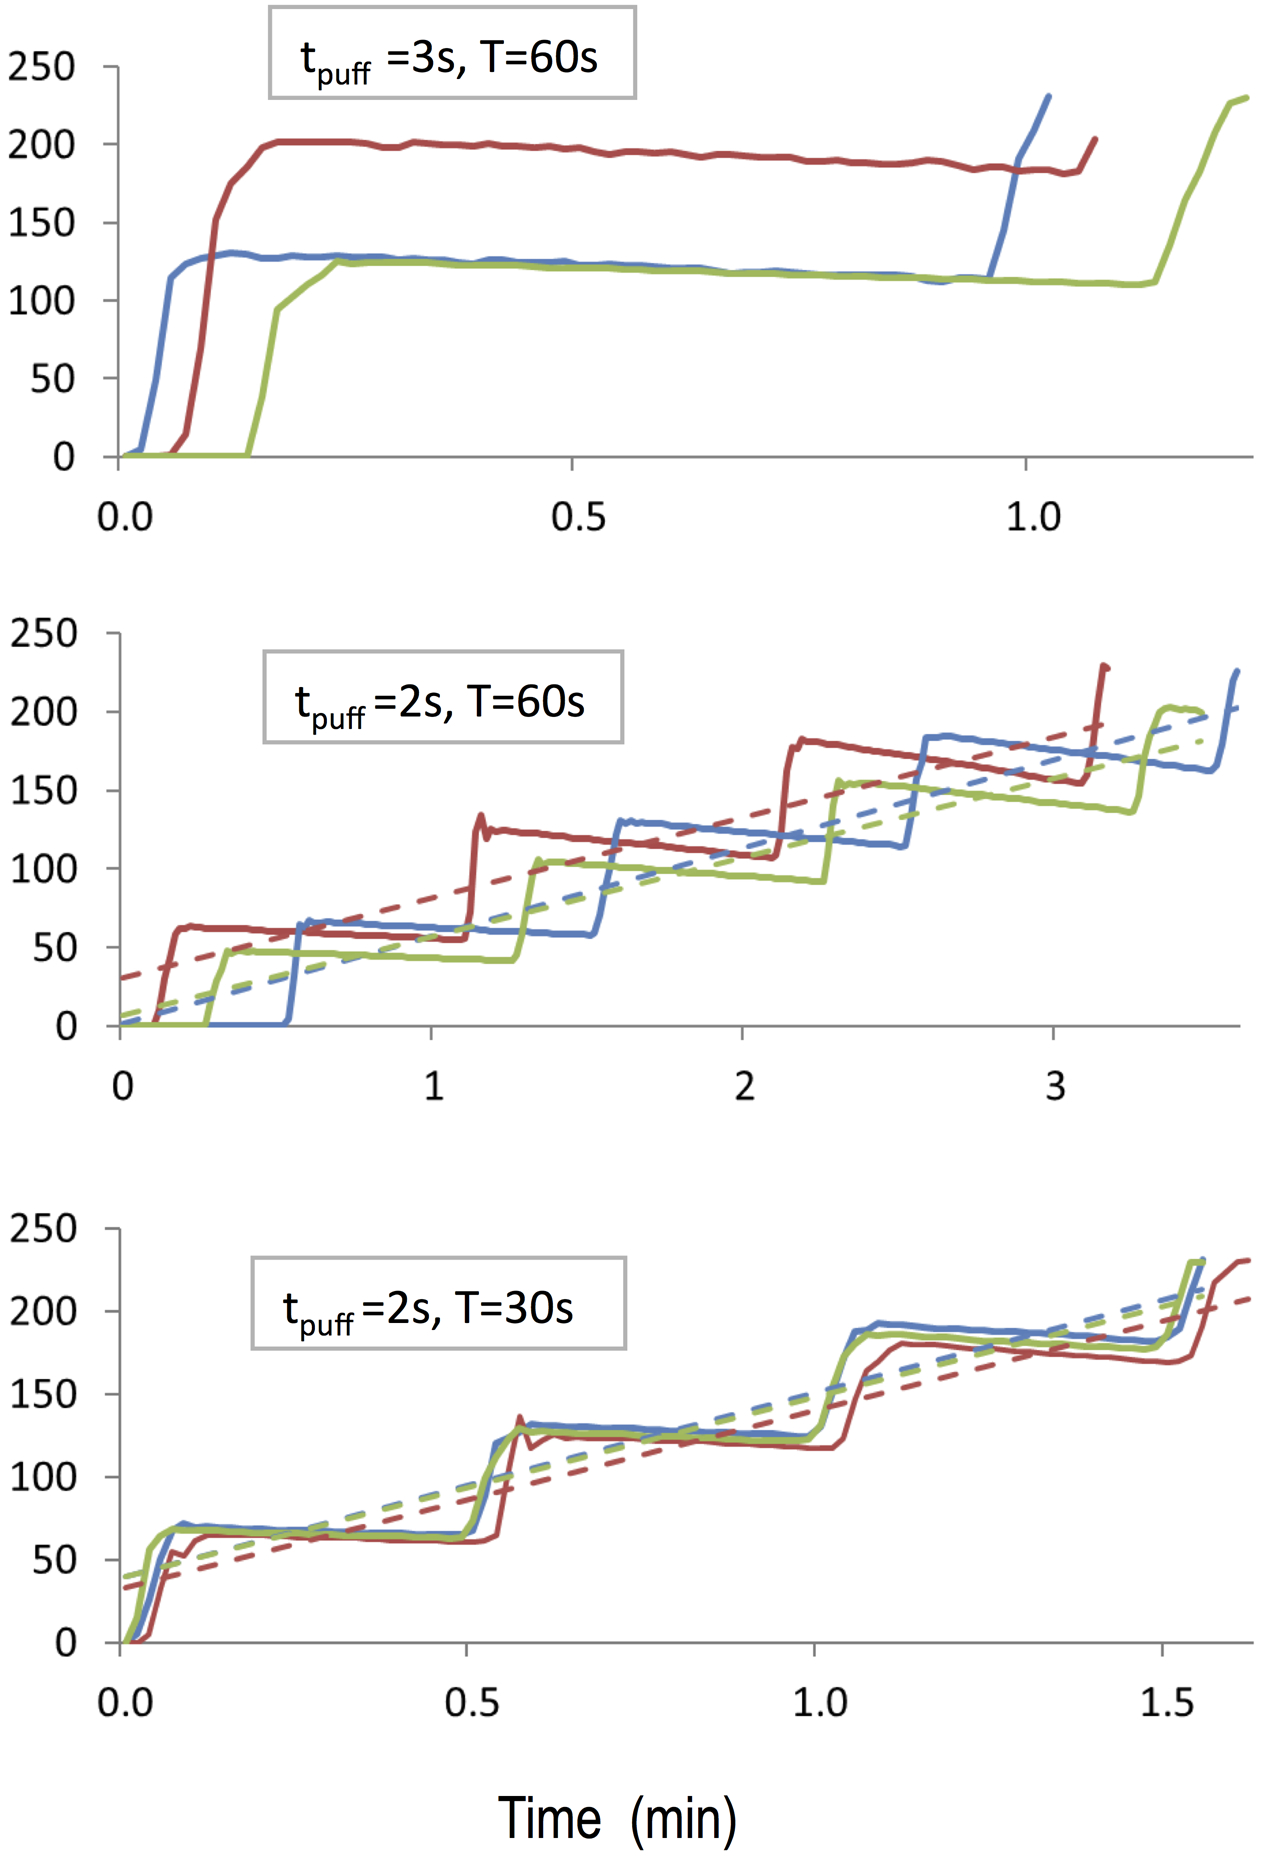
Measured (solid lines) and modeled (dashed lines) aerosol levels (mg/m3) for the experiments in which aerosol from a closed-system e-cig was injected into the chamber.
4. DISCUSSION AND CONCLUSIONS
We have shown that e-cig aerosol can be generated in a custom-built chamber designed for exposure of small rodents to e-cig aerosol. We generated aerosol from both a closed-system and open-system e-cig. While we presented measured aerosol concentrations for only two e-cigs, our system is flexible enough to be adapted to a number of vaping devices. For example, we have used this system to successfully administer aerosol to the chamber from JUUL devices, the most popular e-cig brand (Huang et al. 2018) (results not shown).
Commercially available e-cig delivery systems cost between $15,000 to $30,000 depending on attachments, pumps, valves, electronic monitors, and other accessories. In contrast, our exposure chamber can be built for less than $1,500, a significant saving. Cost breakdown includes roughly $60 for the Arduino board, solenoid, DB-25 connector, bread board and parts mounted thereon, about $60 for the three power supplies/transformers to drive the Arduino, solenoid and fan motor, and about $170 to construct the acrylic chamber, lid and fan, including the cable glands, fan motor and hub. While we utilized a programmable peristaltic pump which was already in our lab to puff the e-cig (about $2,700), this feature was not utilized; instead we activated the pump directly using its remote control port. A less expensive, non-programmable peristaltic pump (< $1,200) can be used if it can be remote-controlled.
Puff time tpuff, puff period T, power P and air exchange rate Qex can efficiently be used to control the characteristic time τ and the steady-state aerosol concentration cmax. While we did not examine different chamber volumes V0, this volume can also be used to control τ and cmax.
Our mathematical model can be used to explain aerosol concentrations measured in other custom-built or commercial exposure chambers. For instance, our model explains why aerosol levels measured by Zhao et al. (2016) in a vaping chamber with V0 = 7 L and air exchange rate Qex = 7 L/min reached steady state after about 1 min. According to Eq. (3), the characteristic time, which is on the order of the time to steady state, was also 1 min (neglecting aerosol deposition, k = 0).
E-cig aerosol concentrations created in our environmental chamber can exceed 400 mg/m3 (the maximum concentration measurable with the aerosol monitor we used) and are high when compared to ambient air pollution levels, which can, e.g., be quantified by PM2.5, i.e., particulate matter with aerodynamic diameter <2.5 μm. In the US, the current National Ambient Air Quality Standard (NAAQS) for PM2.5 is 12 μg/m3 (EPA 2019). Nephelometers, which are usually used in studies of ambient air pollution, may not able to measure directly the high aerosol concentrations that can be achieved in various e-cig exposure chambers. Aerosol dilution techniques (Ingebrethsen et al. 2012), however, could be employed to measure these high concentrations using nephelometers.
The aerosol monitor displayed flow rate alerts (indicating increased flow resistance) earlier than expected from the user manual. We suspect that the aerosol monitor we used is more often used to measure aerosol consisting primarily of solid particulate matter. Since solid matter is usually much denser than e-liquid, deposited e-cig aerosol occupies a much larger volume fraction of the membrane filter than solid-matter aerosol. Therefore, flow resistance should be higher for e-cig aerosol than for solid particulate matter for equal amounts of mass deposited, explaining early flow rate alerts.
Due to the high aerosol levels in the chamber, large amounts of mass are directed into the optical chamber of the aerosol monitor, requiring increased maintenance of the monitor when compared to applications in which environmental PM2.5 is measured. If PM2.5 at the NAAQS level was to be measured at the flow rate of 1.5 L/min we used, it would take 7 years to collect the 63 mg of aerosol, for which the aerosol monitor we used would require the user to change filters. However, if e-cig aerosol at a concentration of 400 mg/m3 was to be collected, filter change would be requested only after 2 hours. Since e-cig aerosol has a smaller density than environmental PM2.5, internal filters may even need to be changed earlier.
The simple analytical model presented in Section 3 can provide rough estimates for the characteristic time τ with which aerosol levels change in the chamber, e.g., due to the step aerosol input used in our experiments. It also seems that maximum aerosol concentrations cmax can be estimated from Eq. (4) if the aerosol mass released per puff is known, or vice versa. If more accurate estimates of τ and cmax were to be sought, our model could be improved by accounting for aerosol deposition on the chamber walls and the ceiling as well as for a nonuniform aerosol size distribution.
We were also able to infer the characteristic time τ with which aerosol levels changed in the chamber from an exposure session in which aerosol supply was stopped at a time t0 to then observe the subsequent gradual decline in aerosol levels due to continued air exchange. According to Eq. (1) aerosol levels should be exponentially decaying, . However, the slope of the log-transformed concentration time series, which should be equal to −1/τ, changed gradually with time indicating that the decay was not purely exponential, perhaps because the aerosol is size-distributed. Nonetheless the initial slope of the decay curve corresponded well with the one fitted to Eq. (2) in support of our overall modeling approach.
Our measured e-cig aerosol concentrations were typically much higher than environmental e-cig aerosol concentrations, which have been reported to range between 30 and 800 μg/m3 (Czogala et al. 2014, Saffari et al. 2014, Soule et al. 2017), albeit some of these reported concentrations came from uncalibrated nephelometers that assumed gravimetric calibration factor would be similar to those found with tobacco smoke and thus are actually unconstrained (Czogala et al. 2014, Soule et al. 2017). To establish smaller aerosol concentrations in our chamber, one could increase the air exchange rate Qex, lower the rate with which aerosol is supplied to the chamber, or increase the period T according to Eq. (4). It should be noted that most animal experiments utilize higher exposures (e.g., 100-fold) to account for an animal-to-human uncertainty factor (Dankovic et al. 2015). Therefore the levels we measured in the chamber are appropriate for animal experiments.
In ongoing work, we have used our exposure chamber to examine uptake of metals in various murine tissues and fluids via inhalation of e-cig aerosol at different concentrations. Significantly elevated metal concentrations were measured in selected tissue from exposed mice as compared to unexposed control mice (not shown). These exposures did not utilize nicotine-containing e-liquid. In the case of nicotine containing aerosol delivery, cotinine could be used as a biomarker of exposure (Johnson et al. 2019).
Supplementary Material
ACKNOWLEDGMENT
Research reported in this publication was supported by NIEHS and FDA Center for Tobacco Products (CTP) (grant R21ES029777) and by NIEHS (grant P30ES009089). The content is solely the responsibility of the authors and does not necessarily represent the official views of the NIH or the Food and Drug Administration.
Footnotes
DISCLOSURE STATEMENT
The authors report no potential conflict of interest.
REFERENCES
- Aherrera A, Olmedo P, Grau-Perez M, Tanda S, Goessler W, Jarmul S, Chen R, Cohen JE, Rule AM and Navas-Acien A (2017). “The association of e-cigarette use with exposure to nickel and chromium: A preliminary study of non-invasive biomarkers.” Environ Res 159: 313–320. [DOI] [PubMed] [Google Scholar]
- Alasmari F, Crotty Alexander LE, Drummond CA and Sari Y (2018). “A computerized exposure system for animal models to optimize nicotine delivery into the brain through inhalation of electronic cigarette vapors or cigarette smoke.” Saudi Pharm J 26(5): 622–628. [DOI] [PMC free article] [PubMed] [Google Scholar]
- Bitzer ZT, Goel R, Reilly SM, Foulds J, Muscat J, Elias RJ and Richie JP Jr. (2018). “Effects of Solvent and Temperature on Free Radical Formation in Electronic Cigarette Aerosols.” Chem Res Toxicol 31(1): 4–12. [DOI] [PMC free article] [PubMed] [Google Scholar]
- Brikmanis K, Petersen A and Doran N (2017). “E-Cigarette Use, Perceptions, and Cigarette Smoking Intentions in a Community Sample of Young Adult Nondaily Cigarette Smokers.” Psychology of Addictive Behaviors 31(3): 336–342. [DOI] [PMC free article] [PubMed] [Google Scholar]
- Cai J, Yan BZ, Ross J, Zhang DN, Kinney PL, Perzanowski MS, Jung K, Miller R and Chillrud SN (2014). “Validation of MicroAeth (R) as a Black Carbon Monitor for Fixed-Site Measurement and Optimization for Personal Exposure Characterization.” Aerosol and Air Quality Research 14(1): 1–9. [DOI] [PMC free article] [PubMed] [Google Scholar]
- Charlson RJ, Ahlquist NC, Selvidge H and MacCready PB Jr. (2012). “Monitoring of atmospheric aerosol parameters with the integrating nephelometer.” Journal of the Air Pollution Control Association 19: 937–942. [Google Scholar]
- Cooper M, Harrell MB and Perry CL (2016). “A Qualitative Approach to Understanding Real-World Electronic Cigarette Use: Implications for Measurement and Regulation.” Prev Chronic Dis 13: E07. [DOI] [PMC free article] [PubMed] [Google Scholar]
- Czogala J, Goniewicz ML, Fidelus B, Zielinska-Danch W, Travers MJ and Sobczak A (2014). “Secondhand Exposure to Vapors From Electronic Cigarettes.” Nicotine & Tobacco Research 16(6): 655–662. [DOI] [PMC free article] [PubMed] [Google Scholar]
- Dankovic DA, Naumann BD, Maier A, Dourson ML and Levy LS (2015). “The scientific basis of uncertainty factors used in setting occupational exposure limits.” J Occup Environ Hyg 12 Suppl 1: S55–68. [DOI] [PMC free article] [PubMed] [Google Scholar]
- Dunbar ZR, Das A, O’Connor RJ, Goniewicz ML, Wei B and Travers MJ (2018). “Brief Report: Lead Levels in Selected Electronic Cigarettes from Canada and the United States.” Int J Environ Res Public Health 15(1). [DOI] [PMC free article] [PubMed] [Google Scholar]
- EPA. (2019). “NAAQS Table.” Retrieved July 10, 2019, from https://www.epa.gov/criteria-air-pollutants/naaqs-table.
- Evans SE and Hoffman AC (2014). “Electronic cigarettes: abuse liability, topography and subjective effects.” Tob Control 23 Suppl 2: ii23–29. [DOI] [PMC free article] [PubMed] [Google Scholar]
- Geiss O, Bianchi I and Barrero-Moreno J (2016). “Correlation of volatile carbonyl yields emitted by e-cigarettes with the temperature of the heating coil and the perceived sensorial quality of the generated vapours.” Int J Hyg Environ Health 219(3): 268–277. [DOI] [PubMed] [Google Scholar]
- Gillman IG, Kistler KA, Stewart EW and Paolantonio AR (2016). “Effect of variable power levels on the yield of total aerosol mass and formation of aldehydes in e-cigarette aerosols.” Regul Toxicol Pharmacol 75: 58–65. [DOI] [PubMed] [Google Scholar]
- Havel CM, Benowitz NL, Jacob P 3rd and St Helen G (2017). “An Electronic Cigarette Vaping Machine for the Characterization of Aerosol Delivery and Composition.” Nicotine Tob Res 19(10): 1224–1231. [DOI] [PMC free article] [PubMed] [Google Scholar]
- Heintzenberg J, Wiedensohler A, Tuch TM, Covert DS, Sheridan P, Ogren JA, Gras J, Nessler R, Kleefeld C, Kalivitis N, Aaltonen V, Wilhelm RT and Havlicek M (2006). “Intercomparisons and aerosol calibrations of 12 commercial integrating nephelometers of three manufacturers.” Journal of Atmospheric and Oceanic Technology 23(7): 902–914. [Google Scholar]
- Hess CA, Olmedo P, Navas-Acien A, Goessler W, Cohen JE and Rule AM (2017). “E-cigarettes as a source of toxic and potentially carcinogenic metals.” Environmental Research 152: 221–225. [DOI] [PMC free article] [PubMed] [Google Scholar]
- Huang CH and Tsai CJ (2002). “Influence of impaction plate diameter and particle density on the collection efficiency of round-nozzle inertial impactors.” Aerosol Science and Technology 36(6): 714–720. [Google Scholar]
- Huang J, Duan Z, Kwok J, Binns S, Vera LE, Kim Y, Szczypka G and Emery SL (2018). “Vaping versus JUULing: how the extraordinary growth and marketing of JUUL transformed the US retail e-cigarette market.” Tob Control. [DOI] [PMC free article] [PubMed] [Google Scholar]
- Ingebrethsen BJ, Cole SK and Alderman SL (2012). “Electronic cigarette aerosol particle size distribution measurements.” Inhalation Toxicology 24(14): 976–984. [DOI] [PubMed] [Google Scholar]
- Jensen RP, Luo W, Pankow JF, Strongin RM and Peyton DH (2015). “Hidden formaldehyde in e-cigarette aerosols.” N Engl J Med 372(4): 392–394. [DOI] [PubMed] [Google Scholar]
- Jensen RP, Strongin RM and Peyton DH (2017). “Solvent chemistry in the electronic cigarette reaction vessel.” Sci Rep 7: 42549. [DOI] [PMC free article] [PubMed] [Google Scholar]
- Johnson JM, Naeher LP, Yu X, Sosnoff C, Wang L, Rathbun SL, De Jesus VR, Xia B, Holder C, Muilenburg JL and Wang JS (2019). “A biomonitoring assessment of secondhand exposures to electronic cigarette emissions.” Int J Hyg Environ Health 222(5): 816–823. [DOI] [PMC free article] [PubMed] [Google Scholar]
- Kosmider L, Sobczak A, Fik M, Knysak J, Zaciera M, Kurek J and Goniewicz ML (2014). “Carbonyl Compounds in Electronic Cigarette Vapors: Effects of Nicotine Solvent and Battery Output Voltage.” Nicotine & Tobacco Research 16(10): 1319–1326. [DOI] [PMC free article] [PubMed] [Google Scholar]
- Larcombe AN, Janka MA, Mullins BJ, Berry LJ, Bredin A and Franklin PJ (2017). “The effects of electronic cigarette aerosol exposure on inflammation and lung function in mice.” Am J Physiol Lung Cell Mol Physiol 313(1): L67–l79. [DOI] [PubMed] [Google Scholar]
- Laube BL, Afshar-Mohajer N, Koehler K, Chen G, Lazarus P, Collaco JM and McGrath-Morrow SA (2017). “Acute and chronic in vivo effects of exposure to nicotine and propylene glycol from an E-cigarette on mucociliary clearance in a murine model.” Inhal Toxicol 29(5): 197–205. [DOI] [PMC free article] [PubMed] [Google Scholar]
- Lauterstein DE, Tijerina PB, Corbett K, Oksuz BA, Shen SS, Gordon T, Klein CB and Zelikoff JT (2016). “Frontal cortex transcriptome analysis of mice exposed to electronic cigarettes during early life stages.” International Journal of Environmental Research and Public Health 13(4). [DOI] [PMC free article] [PubMed] [Google Scholar]
- Lechasseur A, Jubinville E, Routhier J, Berube JC, Hamel-Auger M, Talbot M, Lamothe J, Aubin S, Pare ME, Beaulieu MJ, Bosse Y, Duchaine C and Morissette MC (2017). “Exposure to electronic cigarette vapors affects pulmonary and systemic expression of circadian molecular clock genes.” Physiol Rep 5(19). [DOI] [PMC free article] [PubMed] [Google Scholar]
- McGrath-Morrow SA, Hayashi M, Aherrera A, Lopez A, Malinina A, Collaco JM, Neptune E, Klein JD, Winickoff JP, Breysse P, Lazarus P and Chen G (2015). “The effects of electronic cigarette emissions on systemic cotinine levels, weight and postnatal lung growth in neonatal mice.” PLoS One 10(2): e0118344. [DOI] [PMC free article] [PubMed] [Google Scholar]
- National Academies of Sciences, E. and Medicine (2018). Public Health Consequences of E-Cigarettes. Washington, DC, The National Academies Press. [PubMed] [Google Scholar]
- Olfert IM, DeVallance E, Hoskinson H, Branyan KW, Clayton S, Pitzer CR, Sullivan DP, Breit MJ, Wu Z, Klinkhachorn P, Mandler WK, Erdreich BH, Ducatman BS, Bryner RW, Dasgupta P and Chantler PD (2018). “Chronic exposure to electronic cigarettes results in impaired cardiovascular function in mice.” J Appl Physiol (1985) 124(3): 573–582. [DOI] [PMC free article] [PubMed] [Google Scholar]
- Olmedo P, Goessler W, Tanda S, Grau-Perez M, Jarmul S, Aherrera A, Chen R, Hilpert M, Cohen JE, Navas-Acien A and Rule AM (2018). “Metal Concentrations in e-Cigarette Liquid and Aerosol Samples: The Contribution of Metallic Coils.” Environmental Health Perspectives 126(2). [DOI] [PMC free article] [PubMed] [Google Scholar]
- Olmedo P, Navas-Acien A, Hess C, Jarmul S and Rule A (2016). “A direct method for e-cigarette aerosol sample collection.” Environmental Research 149: 151–156. [DOI] [PMC free article] [PubMed] [Google Scholar]
- Qasim H, Karim ZA, Silva-Espinoza JC, Khasawneh FT, Rivera JO, Ellis CC, Bauer SL, Almeida IC and Alshbool FZ (2018). “Short-Term E-Cigarette Exposure Increases the Risk of Thrombogenesis and Enhances Platelet Function in Mice.” J Am Heart Assoc 7(15). [DOI] [PMC free article] [PubMed] [Google Scholar]
- Saffari A, Daher N, Ruprecht A, De Marco C, Pozzi P, Boffi R, Hamad SH, Shafer MM, Schauer JJ, Westerdahl D and Sioutas C (2014). “Particulate metals and organic compounds from electronic and tobacco-containing cigarettes: comparison of emission rates and secondhand exposure.” Environmental Science-Processes & Impacts 16(10): 2259–2267. [DOI] [PubMed] [Google Scholar]
- Shi H, Fan X, Horton A, Haller ST, Kennedy DJ, Schiefer IT, Dworkin L, Cooper CJ and Tian J (2019). “The Effect of Electronic-Cigarette Vaping on Cardiac Function and Angiogenesis in Mice.” Sci Rep 9(1): 4085. [DOI] [PMC free article] [PubMed] [Google Scholar]
- Sleiman M, Logue JM, Montesinos VN, Russell ML, Litter MI, Gundel LA and Destaillats H (2016). “Emissions from Electronic Cigarettes: Key Parameters Affecting the Release of Harmful Chemicals.” Environmental Science & Technology 50(17): 9644–9651. [DOI] [PubMed] [Google Scholar]
- Smith D, Aherrera A, Lopez A, Neptune E, Winickoff JP, Klein JD, Chen G, Lazarus P, Collaco JM and McGrath-Morrow SA (2015). “Adult Behavior in Male Mice Exposed to E-Cigarette Nicotine Vapors during Late Prenatal and Early Postnatal Life.” PLoS One 10(9): e0137953. [DOI] [PMC free article] [PubMed] [Google Scholar]
- Soule EK, Maloney SF, Spindle TR, Rudy AK, Hiler MM and Cobb CO (2017). “Electronic cigarette use and indoor air quality in a natural setting.” Tob Control 26(1): 109–112. [DOI] [PMC free article] [PubMed] [Google Scholar]
- Soulet S, Pairaud C and Lalo H (2017). “A Novel Vaping Machine Dedicated to Fully Controlling the Generation of E-Cigarette Emissions.” Int J Environ Res Public Health 14(10). [DOI] [PMC free article] [PubMed] [Google Scholar]
- Sussan TE, Gajghate S, Thimmulappa RK, Ma JF, Kim JH, Sudini K, Consolini N, Cormier SA, Lomnicki S, Hasan F, Pekosz A and Biswal S (2015). “Exposure to Electronic Cigarettes Impairs Pulmonary Anti-Bacterial and Anti-Viral Defenses in a Mouse Model.” Plos One 10(2). [DOI] [PMC free article] [PubMed] [Google Scholar]
- Talih S, Balhas Z, Salman R, Karaoghlanian N and Shihadeh A (2016). ““Direct Dripping”: A High-Temperature, High-Formaldehyde Emission Electronic Cigarette Use Method.” Nicotine Tob Res 18(4): 453–459. [DOI] [PMC free article] [PubMed] [Google Scholar]
- Tien C and Ramarao BV (2007). Granular Filtration of Aerosols and Hydrosols. 2nd Edition, Elsevier Science. [Google Scholar]
- Wagner NJ, Camerota M and Propper C (2017). “Prevalence and Perceptions of Electronic Cigarette Use during Pregnancy.” Maternal and Child Health Journal 21(8): 1655–1661. [DOI] [PMC free article] [PubMed] [Google Scholar]
- Wang TW, Asman K, Gentzke AS, Cullen KA, Holder-Hayes E, Reyes-Guzman C, Jamal A, Neff L and King BA. (2018). “Tobacco Product Use Among Adults — United States, 2017.” from https://www.cdc.gov/mmwr/volumes/67/wr/mm6744a2.htm. [DOI] [PMC free article] [PubMed]
- Williams M and Talbot P (2019). “Design Features in Multiple Generations of Electronic Cigarette Atomizers.” Int J Environ Res Public Health 16(16). [DOI] [PMC free article] [PubMed] [Google Scholar]
- Williams M, Villarreal A, Bozhilov K, Lin S and Talbot P (2013). “Metal and Silicate Particles Including Nanoparticles Are Present in Electronic Cigarette Cartomizer Fluid and Aerosol.” Plos One 8(3). [DOI] [PMC free article] [PubMed] [Google Scholar]
- Zelikoff JT, Parmalee NL, Corbett K, Gordon T, Klein CB and Aschner M (2018). “Microglia activation and gene expression alteration of neurotrophins in the hippocampus following early-life exposure to e-cigarette aerosols in a murine model.” Toxicological Sciences 162(1): 276–286. [DOI] [PMC free article] [PubMed] [Google Scholar]
- Zhao D, Navas-Acien A, Ilievski V, Slavkovich V, Olmedo P, Adria-Mora B, Domingo-Relloso A, Aherrera A, Kleiman NJ, Rule AM and Hilpert M (2019). “Metal concentrations in electronic cigarette aerosol: Effect of open-system and closed-system devices and power settings.” Environ Res 174: 125–134. [DOI] [PMC free article] [PubMed] [Google Scholar]
- Zhao J, Pyrgiotakis G and Demokritou P (2016). “Development and characterization of electronic-cigarette exposure generation system (Ecig-EGS) for the physico-chemical and toxicological assessment of electronic cigarette emissions.” Inhal Toxicol 28(14): 658–669. [DOI] [PMC free article] [PubMed] [Google Scholar]
Associated Data
This section collects any data citations, data availability statements, or supplementary materials included in this article.