

Abstract
Background
Long-term exposure to pollution has been shown to increase risk of cardiovascular disease (CVD) and mortality, and may contribute to the increased risk of CVD among individuals with higher social risk.
Methods
Data from the community-based Heart Strategies Concentrating on Risk Evaluation (HeartSCORE) study were used to quantify Cumulative Social Risk (CSR) by assigning a score of 1 for the presence of each of 4 social risk factors: racial minority, single living, low income, and low educational status. 1-year average air pollution exposure to PM2.5 was estimated using land-use regression models. Associations with clinical outcomes were assessed using Cox models, adjusting for traditional CVD risk factors. The primary clinical outcome was combined all-cause mortality and nonfatal CVD events.
Results
Data were available on 1933 participants (mean age 59 years, 66% female, 44% Black). In a median follow up time of 8.3 years, 137 primary clinical outcome events occurred. PM2.5 exposure increased with higher CSR score. PM2.5 was independently associated with clinical outcome (adjusted hazard ratio [HR]: 1.19 [95% CI: 1.00, 1.41]). Participants with ≥2 CSR factors had an adjusted HR of 2.34 (1.48–3.68) compared to those with CSR = 0. The association was attenuated after accounting for PM2.5 (HR: 2.16; [1.34, 3.49]). Mediation analyses indicate that PM2.5 explained 13% of the risk of clinical outcome in individuals with CSR score ≥ 2.
Conclusion
In a community-based cohort study, we found that the association of increasing CSR with higher CVD and mortality risks is partially accounted for by exposure to PM2.5 environmental pollutants.
Keywords: Social risk, Environmental pollutants, Risk factors
Background
Disparities in health outcomes remain a challenge in the United States [1, 2]. Such disparities are driven by social factors which include ethnicity, income, education, and single living status [3–7]. Multiple epidemiological studies have reported that an accumulation of social risk factors increases the likelihood of cardiovascular disease (CVD) events and deaths [5, 8, 9]. This relationship is thought to be mediated by a myriad of intermediary variables, such as limited healthcare access and utilization, residence in physical and social localities that are detrimental to health, and a combination of health-related behavior and risk factor burden [8, 10–12].
Socially disadvantaged people have increased exposure to unhealthy physical environments [13–15]. Extant evidence indicate that minorities and those who are at increased social risk are more likely to reside in areas close to environmental pollution sources [16, 17]. In addition, studies show that long-term exposure to environmental pollutants, such as ambient fine particulate matter (particles with median aerodynamic diameter < 2.5 μm, [PM2.5]), is associated with significantly increased risk for CVD morbidity and mortality and reduced life-expectancy [18–20]. However, the exact contribution of exposure to environmental pollutants to the association between social risk factors and CVD risk largely remains to be clarified.
Accordingly, we sought to evaluate how much long-term exposure to environmental pollutants contributes to increased risk of CVD and mortality in individuals with accumulating social risk factors. We used data from the communit-based Heart Strategies Concentrating on Risk Evaluation (HeartSCORE) study to investigate associations among cumulative social risk (CSR), two common components of urban air pollutants (PM2.5 and black carbon [BC]), and the risk of incident CVD and mortality.
Methods
Study population
The design of HeartSCORE has been previously described [21]. In brief, HeartSCORE is an ongoing community-based prospective cohort study of racial disparities in CVD that enrolled 2000 participants based in Western Pennsylvania beginning in 2003. The study population is comprised of Black (44%) and White (56%) participants, as well as other minority groups (2.6%). Participants were 45–75 years of age at study entry, had to live in the greater Pittsburgh area, and had to undergo yearly follow-up. Those with co-morbidities that resulted in a life expectancy of less than 5 years were excluded.
Data collection
Demographic and medical histories were collected at the baseline visit. Participants completed detailed demographic and lifestyle questionnaires including information on self-reported race, marital/co-habiting status, education, income, and smoking. BMI was evaluated by a standard study measurement of weight and height. Blood pressure was measured twice using a manual sphygmomanometer and an appropriately sized cuff after 5 min of rest in a seated position. The average of two readings was taken. Hypertension was defined as a systolic blood pressure ≥ 140 mmHg or a diastolic pressure ≥ 90 mmHg, history of physician-diagnosed hypertension, or current use of anti-hypertensive medication. Lipid panel and glucose were measured in fasting venous blood sample drawn using standard laboratory techniques at the University of Pittsburgh Medical Center clinical laboratory. Diabetes mellitus was defined as fasting glucose ≥126 mg/dL or a history of previously diagnosed diabetes treated with diet, oral agents, and/or insulin.
Cumulative social risk (CSR)
Cumulative social risk (CSR) was quantified by assigning a score of one for the presence of each of four social factors, as described previously [8, 22, 23] 9 i) racial minority ii) single living status, iii) low income, and iv) low educational level. Single living status included those who were not married or cohabiting. Low income was defined as those making <$20,000 a year or those having trouble paying for their basic needs. Participants were classified as low educational level if they did not complete a high school diploma or other equivalent.
Environmental exposure
Exposure to urban PM2.5 and BC was estimated for the year prior to each individual’s baseline assessment, using modified version of land-use regression (LUR) model as previously reported [24–26]. Hybrid LUR models were derived from 37 sampling sites distributed across Greater Pittsburgh area during summer (2012) and winter (2013). Geographic information system (GIS) was used to localize covariates that capture variability in pollution source (e.g., industrial emission, population density) [24]. Hybrid LUR models predicting spatial variation in PM2.5 and BC were developed as a function of the GIS-based source density indicators using pollution data from the 37 sampling sites [25]. Particiapnts’ addresses were geocoded using ArcGIS software. The LUR models were then used to estimate the mean concentrations of PM2.5 and BC at each participant’s residential address, for the 1-year period preceding date of study entry. Daily regulatory data from a centrally-located U.S. EPA Air Quality System monitor were used to adjust for secular trends in concentration of pollutants [24].
Clinical outcomes
The primary outcome of interest outcome was a composite of nonfatal CVD events and all-cause mortality. CVD events were defined as nonfatal myocardial infarction, stroke and coronary revascularization (i.e., percutaneous coronary intervention or coronary artery by pass graft). CVD events were monitored by semiannual questionnaires and during annual follow-up study visits. Events were judicated by an independent review of medical records. Mortality was ascertained by reviewing of death certificates.
Statistical methods
We grouped individuals into the following four categories: CSR = 0, CSR = 1, CSR = 2 and CSR ≥ 3. We assessed the association between CSR and environmental pollutants by plotting the median values of the environmental pollutants across CSR categories. We calculated the p-values for trend across CSR categories using the non-parametric Kruskal-Wallis test. We fitted interaction terms between CSR and race in order to evaluate if there was significant effect-modification of the association between CSR and environmental pollutants by race. We used Cox-regression model to determine the association of PM2.5 and BC with risk of nonfatal CVD and all cause mortality, with adjustment for established CVD risk factors, namely, age, sex, smoking, systolic blood pressure, diabetes, body mas index, total cholesterol, and HDL-cholesterol. We calculated hazard ratios (HRs) and 95% confidence intervals (95% CIs). We similarly determined the association between CSR and clinical outcome using Cox-regression models. We performed a mediation analyses to assess the potential role of air pollution in explaining the association between CSR and clinical outcomes by adding PM2.5 or BC to Cox proportional-hazards models relating CSR and the primary outcome, in a model adjusted for CVD risk factors. The mediation analyses were conducted using the method described by Ananth and VanderWeele, based on the estimated direct and indirect effects calculated for CSR, as computed on the risk difference scale [27]. All analyses were performed using Stata software (Stata Corp., version 11, Texas, USA). P-values < 0.05 were considered statistically significant.
Results
Data on CSR were available in up to 1933 participants. The mean (SD) age of participants was 59.0 (7.5) years, with study comprising 66% female and 44% Black individuals (Table 1). In a median follow up time of 8.3 years, (inter-quertile range: 7.1–9.2 years), 137 primary clinical outcome events occurred. Overall, participants with higher CSR score displayed higher levels of traditional CVD risk factors. In addition, increasing number of CSR scores was associated with increased exposure to PM2.5. Individuals with CSR score of 0, 1, 2 and ≥ 3 had mean PM2.5 concentrations of 15.6, 15.8, 16.0 and 16.3 μg/m3, respectively, P for trend < 0.001, (Table 1 & Figure). There was a similar pattern of association for BC and CSR (Table 1 & Fig. 1). The associations between CSR and environmental pollutants were not significantly different between Black and White participants (P for interaction > 0.05, Additional file 2: Figure S1). Of the components of CSR, ethnicity, income and single living status were similarly associated with PM2.5 concentrations, while low education was not statistically associated with PM2.5 in univariate models (Additional file 1: Table S1). CSR and PM2.5 correlatd with CVD risk factors. Both CSR and PM2.5 were similarly associated with higher blood pressure and higher glucose concentrations, although the association between CSR and systolic blood pressure was stronger (Additional file 1: Table S2).
Table 1.
Baseline characteristics of participants included in study by categories of cumulative social risk*
| Variable | N | Overall N = 1933 | CSR = 0 N = 661 | CSR = 1 N = 565 | CSR = 2 N = 429 | CSR ≥ 3 N = 278 | p-value |
|---|---|---|---|---|---|---|---|
| Age (years) | 1933 | 59.0 (7.5) | 59.9 (7.3) | 59.0 (7.7) | 57.8 (7.4) | 58.9 (7.4) | < 0.0001 |
| Sex (male) | 1933 | 664 (34.4) | 295 (44.7%) | 204 (36.1%) | 88 (20.5%) | 77 (27.7%) | < 0.0001 |
| Components of cumulative social risk | |||||||
| Race (minority) | 1933 | 854 (44.2) | 0 (0.0%) | 247 (43.7%) | 331 (77.0%) | 276 (99.3%) | < 0.0001 |
| Income (< low income) | 1933 | 556 (28.8) | 0 (0.0%) | 98 (17.3%) | 183 (42.6%) | 275 (98.9%) | < 0.0001 |
| Single living | 1933 | 823 (42.6) | 0 (0.0%) | 209 (37.0%) | 339 (78.8%) | 275 (98.9%) | < 0.0001 |
| Education (<high school) | 1933 | 44 (2.3) | 0 (0.0%) | 11 (1.9%) | 7 (1.6%) | 26 (9.4%) | < 0.0001 |
| Environmental pollutants | |||||||
| PM2.5 (ug/m3) | 1661 | 15.9 (0.8) | 15.6 (0.7) | 15.8 (0.7) | 16.0 (0.7) | 16.3 (0.8) | < 0.0001 |
| BC (Abs) | 1661 | 1.2 (0.1) | 1.1 (0.1) | 1.2 (0.1) | 1.2 (0.1) | 1.2 (0.1) | < 0.0001 |
| Cardiovascular risk factors | |||||||
| Current smoking | 1928 | 212 (11.0) | 43 (6.5%) | 45 (8.0%) | 64 (14.9%) | 60 (21.6%) | < 0.0001 |
| Systolic BP (mmHg) | 1931 | 136.8 (19.7) | 133.7 (18.5) | 136.0 (18.6) | 138.2 (21.1) | 143.7 (20.8) | < 0.0001 |
| Diabetes (%) | 1923 | 199 (10.3) | 37 (5.6%) | 49 (8.7%) | 54 (12.6%) | 59 (21.3%) | < 0.0001 |
| Hypertension (%) | 1930 | 819 (42.4) | 199 (30.2%) | 230 (40.9%) | 222 (51.6%) | 168 (60.4%) | < 0.0001 |
| BMI (kg/m2) | 1912 | 30.2 (6.3) | 28.4 (5.2) | 30.0 (6.3) | 31.1 (6.1) | 33.1 (7.8) | < 0.0001 |
| Total Cholesterol (mg/dl) | 1921 | 213.1 (42.8) | 214.9 (41.5) | 214.1 (41.6) | 212.9 (43.6) | 207.0 (46.7) | 0.076 |
| HDL-cholesterol (mg/dl) | 1921 | 57.6 (15.0) | 56.8 (15.5) | 57.3 (14.3) | 59.1 (15.1) | 57.7 (15.1) | 0.086 |
*Values are mean (SD) or N (%)
Minority = Blacks in this study; PM2.5 = particles with median aerodynamic diameter < 2.5 μm; BC = black carbon, CSR = cumulative social risk
Fig. 1.
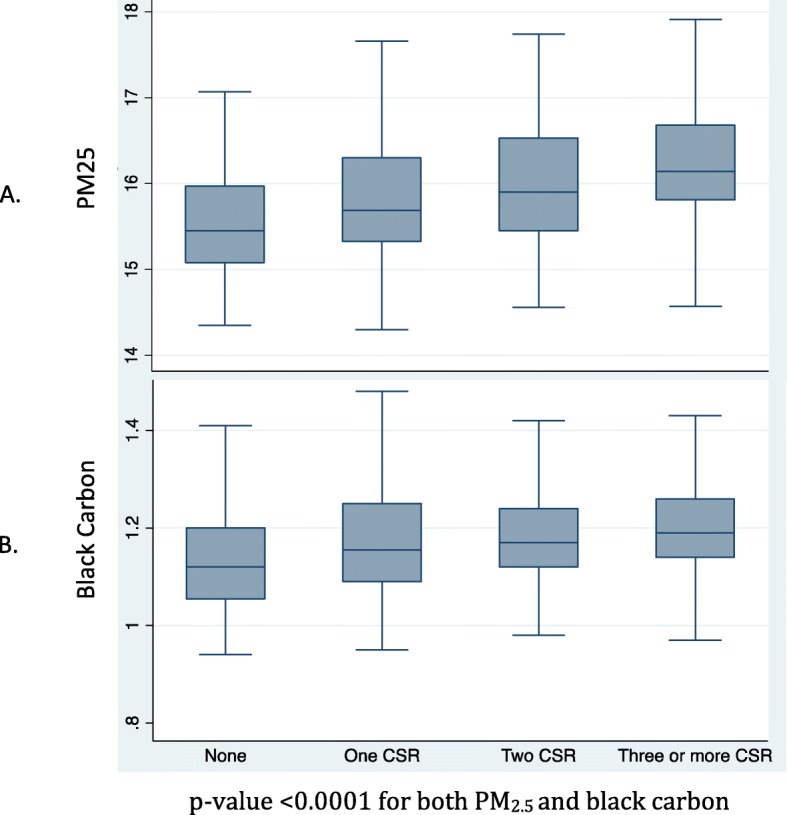
Box plot of PM and black carbon by categories of cumulative social risk. p-value < 0.0001 for both PM2.5 and black carbon
Exposure to PM2.5 was associated with an increased risk of all-cause mortality and CVD (Table 2a). After adjusting for traditional CVD risk factors (HR: 1.19; 95% CI: 1.00,1.41, p = 0.04). BC exposure was not associated with statistically significant increase in risk (HR: 1.12; 95% CI: 0.96,1.31, p = 0.14) (Table 2b).
Table 2.
Association of a) PM2.5, and b) BC, with combined all-cause mortality and nonfatal CVD (MI, stroke or coronary revascularization) outcomes (N = 1620, N cases = 137)
| a) PM2.5 | |||
|---|---|---|---|
| Adjustment | HR (95% CI) per 1 SD higher in PM2.5 | Z-value | P-value |
| Age & Sex | 1.19 (1.01,1.39) | 2.1 | 0.04 |
| Above + smoking | 1.17 (1.00,1.37) | 1.95 | 0.05 |
| Above + race | 1.14 (0.96,1.34) | 1.53 | 0.13 |
| Above + SBP | 1.13 (0.96,1.33) | 1.48 | 0.14 |
| Above + Diabetes | 1.15 (0.97,1.35) | 1.65 | 0.1 |
| Above + BMI | 1.16 (0.98,1.38) | 1.76 | 0.08 |
| Above + Total cholesterol | 1.18 (1.00,1.40) | 1.94 | 0.05 |
| Above + HDL-c | 1.19 (1.00,1.41) | 2 | 0.05 |
| Above + TG | 1.19 (1.00,1.41) | 2.02 | 0.04 |
| b) Black Carbon | |||
| Adjustment | HR (95% CI) per 1 SD higher in BC | Z-value | P-value |
| Age & Sex | 1.11 (0.95,1.29) | 1.35 | 0.18 |
| Above + smoking | 1.11 (0.95,1.29) | 1.31 | 0.19 |
| Above + race | 1.09 (0.94,1.27) | 1.14 | 0.25 |
| Above + SBP | 1.10 (0.94,1.28) | 1.16 | 0.24 |
| Above + Diabetes | 1.09 (0.93,1.27) | 1.1 | 0.27 |
| Above + BMI | 1.10 (0.94,1.28) | 1.19 | 0.24 |
| Above + Total cholesterol | 1.11 (0.95,1.30) | 1.37 | 0.17 |
| Above + HDL-c | 1.12 (0.96,1.30) | 1.39 | 0.16 |
| Above + TG | 1.12 (0.96,1.31) | 1.46 | 0.14 |
Participants with 1, and ≥ 2 CSR scores had age- and sex- adjusted HR of 1.67 (1.06–2.63) and 2.85 (1.84–4.40) for nonfatal CVD event and all-cause mortality, respectively, compared to those with CSR = 0 (Table 3a) The HRs were 1.59 (1.01–2.52) and 2.34 (1.49,3.68), respectively, after adjustment for traditional CVD risk factors in the Full Model. There was similar pattern of association when CSR was fitted as continuous variable (Table 3a).
Table 3.
Association of cumulative social risk with risk of combined all-cause mortality or CVD outcomes, with adjustment for a) traditional CVD risk factors, b) further adjustment for PM2.5 or BC in mediation analyses. (N = 1622, N cases = 137)
| a) Traditional CVD risk factors | ||||||
|---|---|---|---|---|---|---|
| CSR = 1 vs. CSR = 0 | CSR ≥ 2 vs. CSR = 0 | Test for trend | ||||
| Adjustment | HR (95% CI) | Chi-2 | HR (95% CI) | Chi-2 | HR (95% CI) | Chi-2 |
| Age & sex | 1.67 (1.06,2.63) | 4.80 | 2.85(1.84,4.40) | 22.28 | 1.69(1.36,2.10) | 22.75 |
| Model 1 | 1.68 (1.06,2.65) | 4.93 | 2.60(1.67,4.04) | 18.06 | 1.61(1.29,2.00) | 18.40 |
| Model 2 | 1.66(1.05,2.62) | 4.67 | 2.45(1.57,3.82) | 15.60 | 1.56(1.25,1.94) | 15.84 |
| Model 3 | 1.56(0.99,2.48) | 3.65 | 2.20(1.40,3.45) | 11.83 | 1.48(1.18,1.84) | 11.97 |
| Model 4 | 1.57(0.99,2.48) | 3.69 | 2.24(1.42,3.52) | 12.04 | 1.49(1.19,1.86) | 12.18 |
| Full Model | 1.59(1.01,2.52) | 3.96 | 2.34(1.48,3.68) | 13.32 | 1.52(1.22,1.91) | 13.47 |
| b) Mediation analyses | ||||||
| Full Model + PM2.5 | 1.54(0.97,2.45) | 3.35 | 2.16(1.34,3.49) | 9.92 | 1.47(1.16,1.86) | 10.05 |
| Full Model + BC | 1.56(0.99,2.48) | 3.61 | 2.25(1.42,3.58) | 11.90 | 1.50(1.19,1.88) | 12.04 |
Model 1 = Age & Sex + Smoking
Model 2 = Model 1 + SBP
Model 3 = Model 2 + Diabetes
Model 4 = Model 3 + BMI
Full Model = Model 4 + lipid markers (total cholesterol, HDL-c, TG)
The degree of attenuation in the association between CSR and risk of combined all-cause mortality and CVD outcomes when adjusting for PM2.5 was comparable to the effect of adjustment for SBP
Mediation analyses indicate that PM2.5 explained 13% of the relative risk of CVD and all cause mortality in individuals with CSR score ≥ 2 (compared to those with CSR score = 0). The corresponding value for BC was 7%
Mediation analysis was performed by adding PM2.5 or BC to the full model separately (Table 3b). The HR of nonfatal CVD and mortality for participants with CSR ≥ 2 (compared to those with CSR score = 0) were attenuated to 2.16 (1.34,3.49) upon further adjustment for PM2.5. This indicates that PM2.5 explained 13% of the relative risk of nonfatal CVD and all-cause mortality in individuals with CSR score ≥ 2. The HR was attenuated to smaller degree with adjustment for BC (HR 2.25, 95% CI: 1.42,3.58; Table 3b).
Sensitivity analyses taking CSR in four ordinal categories (i.e., CSR = 0, 1, 2, or ≥ 3) yielded comparable results (Additional file 1: Table S3.). Mediation analyses indicated that PM2.5 explained 21% of the relative risk of CVD and all cause mortality in individuals with CSR score ≥ 3 (compared to those with CSR score = 0). The corresponding value for BC was 11%.
Discussion
In a community-based study of Black and White participants, we found that individuals with higher social risk had higher degree of exposure to environmental pollutants, PM2.5 and BC, without evidence of significant effect modification by race. Individuals with increased social risk had substantially higher risk of nonfatal CVD and all-cause mortality. The latter association was partially explained by exposure to PM2.5.
Multiple epidemiological studies have shown links between social inequality and environment pollution [15, 28, 29]. Furthermore, prior studies have shown that exposure to ambient fine particulate matter increases risk of CVD [4, 18, 20]. In 2010, the American Heart Association released a scientific statement deeming PM2.5 a modifiable CVD risk factor [18]. Our study contributes toward a better understanding of the mechanistic pathways of increased CVD and mortality in individuals with higher number of social risk factors. Our findings suggest that exposure to PM2.5 may explain approximately 13% of the increased risk in these participants. The mediating effect of PM2.5 is comparable to that of blood pressure in our data, which is known to play an important role in CVD risk in the socially disadvantaged [30]. These findings highlight the potential importance of exposure to PM2.5 pollutants in mediating adverse outcomes in socially disadvantaged people.
Our findings may have clinical, public health, and policy implications, suggesting that physicians should consider discussions with patients regarding avoidance of environmental pollutant exposure in addition to optimizing other modifiable risk factors such as blood pressure, blood glucose control, and dyslipidemia, especially in socially disadvantaged patients. However, exposure to environmental pollutants is partly related to factors that are usually outside the individual’s control. From a public health and policy perspective, our study highlights the importance of measures that promote cleaner air in neighborhoods as part of the efforts to address social disparities in CVD risk. Further large-scale prospective data is needed, however, to characterize the relative impact of CSR on environmental pollutants and other intermediate CVD risk factors and their relative contribution to CVD and mortality outcomes. Such data can help policy makers in prioritization of resources.
The strengths of the present study merit some consideration. First, this is a community-based study with approximately equal representation of Black and White participants. The study participants were not selected based on preexisting disease, therefore making the findings more applicable to broad populations. Second, our study population was generally associated with a long residence in their current homes, which provided a reliable measure of pollution exposure over time. Third, we were able to use spatial models for air pollution concentrations from a large number of concentration measures collected across the area.
Our investigation has several limitations. First, our sample was drawn from a single geographic area (the Greater Pittsburgh area), which may limit the generalizability of our findings. Second, we did not assess indoor sources of PM2.5 and thus may have underestimated the contribution of PM2.5 to CVD and mortality risk. However, an important portion of indoor pollution is derived from outdoors [31]. Third, in assessing CSR we dichotomized income and education instead of assessing them in multiple categories; we also assumed that all the components of social risk contribute equally to CSR which may not be necessarily correct. However, this approach has been previously used to simplify complex social exposures and has been shown to be valid in predicting risk of clinical outcomes [8, 22]. Finally, we were not able to evaluate CVD and all-cause mortality separately due to lack of power.
Conclusion
We found that increased CSR was associated with an increased risk of nonfatal CVD and all-cause mortality. This association was partially accounted for by exposure to fine particulate matter, specifically PM2.5. These findings suggest that neighborhood environmental factors are potential targets for intervention at the individual and societal level to reduce adverse health outcomes. Future larger studies are needed to confirm these findings and test that public health effects of relevant interventions.
Supplementary information
Additional file 1. Table S1. Association of social risk and PM2.5 with blood pressure levels and blood glucose concentration. Table S2. Comparisons of the association of social risk and PM2.5 with blood pressure and glucose. Table S3. Association of cumulative social risk with risk of combined all-cause mortality or CVD outcomes, with adjustment for a) traditional CVD risk factors, b) further adjustment for PM2.5 or BC in mediation analyses. (N = 1622, N cases = 137)
Additional file 2. Figure S1. Box plot of PM2.5 and black carbon by categories of cumulative social risk, stratified by race
Acknowledgements
We thank Drs Jane Clougherty, Sheila Tripathy, and Ellen Kinnee for their contribution by modeling exposure to environmental pollutants for particiapnts of the the HeartSCORE study.
Abbreviations
- BC
Black carbon
- CSR
Cumulative social risk
- CVD
Cardiovascular disease
- GIS
Geographic information system
- HeartSCORE
Heart strategies concentrating on risk evaluation
- HR
Hazard ratio
- LUR
Land-Use regression
- PM2.5
Particles with median aerodynamic diameter < 2.5 μm
Authors contribution
All authors have read and approved the manuscript, and ensure that this is the case.AC - Conceived project and wrote the first draft, JBE – critically revised the manuscript, DS and AA critically revised the manuscript, AA was involved in setting up the study, SR – is the PI of HeartSCORE study, critically revised manuscript, SE – Conceived project, performed statistical analyses, and crtically revised manuscript. SR and SE had full access to the data and take responsibility for the integrit of the data.
Funding
This study was funded by the Pennsylvania Department of Health (ME-02-384) and National Institutes of Health (R01HL089292). The funder had no role in the design of the study and collection, analysis, and interpretation of data and in writing the manuscript please clearly state this.
Availability of data and materials
The datasets used and/or analysed during the current study are available from the corresponding author on reasonable request.
Ethics approval and consent to participates
The study was approved by University of Pittsburgh Institutonal Review Board, and each participant provided written conset to be included in the study.
Consent for publication
Not applicable.
Competing interests
All authors declared none.
Footnotes
Publisher’s Note
Springer Nature remains neutral with regard to jurisdictional claims in published maps and institutional affiliations.
Supplementary information
Supplementary information accompanies this paper at 10.1186/s12872-020-01329-z.
References
- 1.Mensah GA, Mokdad AH, Ford ES, Greenlund KJ, Croft JB. State of disparities in cardiovascular health in the United States. Circulation. 2005;111(10):1233–1241. doi: 10.1161/01.CIR.0000158136.76824.04. [DOI] [PubMed] [Google Scholar]
- 2.Cruz-Flores S, Rabinstein A, Biller J, et al. Racial-ethnic disparities in stroke care: the American experience: a statement for healthcare professionals from the American Heart Association/American Stroke Association. Stroke. 2011;42(7):2091–2116. doi: 10.1161/STR.0b013e3182213e24. [DOI] [PubMed] [Google Scholar]
- 3.Anderson Roger T., Sorlie Paul, Backlund Eric, Johnson Norman, Kaplan George A. Mortality Effects of Community Socioeconomic Status. Epidemiology. 1997;8(1):42–47. doi: 10.1097/00001648-199701000-00007. [DOI] [PubMed] [Google Scholar]
- 4.Erqou S, Clougherty JE, Olafiranye O, et al. Particulate matter air pollution and racial differences in cardiovascular disease Risk Highlights. Arterioscler Thromb Vasc Biol. 2018;38(4):935–942. doi: 10.1161/ATVBAHA.117.310305. [DOI] [PMC free article] [PubMed] [Google Scholar]
- 5.Erqou S, Echouffo-Tcheugui JB, Kip KE, Aiyer A, Reis SE. Association of cumulative social risk with mortality and adverse cardiovascular disease outcomes. BMC Cardiovasc Disord. 2017;17(1):110. doi: 10.1186/s12872-017-0539-9. [DOI] [PMC free article] [PubMed] [Google Scholar]
- 6.Lynch JW, Kaplan GA, Cohen RD, Tuomilehto J, Salonen JT. Do cardiovascular risk factors explain the relation between socioeconomic status, risk of all-cause mortality, cardiovascular mortality, and acute myocardial infarction? Am J Epidemiol. 1996;144(10):934–942. doi: 10.1093/oxfordjournals.aje.a008863. [DOI] [PubMed] [Google Scholar]
- 7.Clark AM, DesMeules M, Luo W, Duncan AS, Wielgosz A. Socioeconomic status and cardiovascular disease: risks and implications for care. Nat Rev Cardiol. 2009;6(11):712–722. doi: 10.1038/nrcardio.2009.163. [DOI] [PubMed] [Google Scholar]
- 8.Caleyachetty R, Echouffo-Tcheugui JB, Shimbo D, Zhu W, Muennig P. Cumulative social risk and risk of death from cardiovascular diseases and all-causes. Int J Cardiol. 2014;177(3):1106–1107. doi: 10.1016/j.ijcard.2014.08.088. [DOI] [PubMed] [Google Scholar]
- 9.Nandi A, Glymour MM, Kawachi I, VanderWeele TJ. Using marginal structural models to estimate the direct effect of adverse childhood social conditions on onset of heart disease, diabetes, and stroke. Epidemiology. 2012;23(2):223–232. doi: 10.1097/EDE.0b013e31824570bd. [DOI] [PMC free article] [PubMed] [Google Scholar]
- 10.Pollitt RA, Rose KM, Kaufman JS. Evaluating the evidence for models of life course socioeconomic factors and cardiovascular outcomes: a systematic review. BMC Public Health. 2005;5(1):7. doi: 10.1186/1471-2458-5-7. [DOI] [PMC free article] [PubMed] [Google Scholar]
- 11.Brewer LC, Cooper LA. Race, discrimination, and cardiovascular disease. Virtual Mentor 2014;16(6):455–460. http://www.ncbi.nlm.nih.gov/pubmed/25090666. Accessed March 27, 2018. [PMC free article] [PubMed]
- 12.Nelson A. Unequal treatment: confronting racial and ethnic disparities in health care. J Natl Med Assoc 2002;94(8):666–668. http://www.ncbi.nlm.nih.gov/pubmed/12152921. Accessed March 27, 2018. [PMC free article] [PubMed]
- 13.Cesaroni G, Badaloni C, Romano V, Donato E, Perucci CA, Forastiere F. Socioeconomic position and health status of people who live near busy roads: the Rome longitudinal study (RoLS) Environ Health. 2010;9(1):41. doi: 10.1186/1476-069X-9-41. [DOI] [PMC free article] [PubMed] [Google Scholar]
- 14.Bell Michelle L., Ebisu Keita. Environmental Inequality in Exposures to Airborne Particulate Matter Components in the United States. Environmental Health Perspectives. 2012;120(12):1699–1704. doi: 10.1289/ehp.1205201. [DOI] [PMC free article] [PubMed] [Google Scholar]
- 15.Hajat Anjum, Diez-Roux Ana V., Adar Sara D., Auchincloss Amy H., Lovasi Gina S., O’Neill Marie S., Sheppard Lianne, Kaufman Joel D. Air Pollution and Individual and Neighborhood Socioeconomic Status: Evidence from the Multi-Ethnic Study of Atherosclerosis (MESA) Environmental Health Perspectives. 2013;121(11-12):1325–1333. doi: 10.1289/ehp.1206337. [DOI] [PMC free article] [PubMed] [Google Scholar]
- 16.Jones MR, Diez-Roux AV, Hajat A, et al. Race/ethnicity, residential segregation, and exposure to ambient air pollution: the multi-ethnic study of atherosclerosis (MESA) Am J Public Health. 2014;104(11):2130–2137. doi: 10.2105/AJPH.2014.302135. [DOI] [PMC free article] [PubMed] [Google Scholar]
- 17.Su JG, Jerrett M, de Nazelle A, Wolch J. Does exposure to air pollution in urban parks have socioeconomic, racial or ethnic gradients? Environ Res. 2011;111(3):319–328. doi: 10.1016/j.envres.2011.01.002. [DOI] [PubMed] [Google Scholar]
- 18.Brook RD, Rajagopalan S, Pope CA, et al. Particulate matter air pollution and cardiovascular disease: an update to the scientific statement from the American Heart Association. Circulation. 2010;121(21):2331–2378. doi: 10.1161/CIR.0b013e3181dbece1. [DOI] [PubMed] [Google Scholar]
- 19.Brook RD, Cakmak S, Turner MC, et al. Long-term fine particulate matter exposure and mortality from diabetes in Canada. Diabetes Care. 2013;36(10):3313–3320. doi: 10.2337/dc12-2189. [DOI] [PMC free article] [PubMed] [Google Scholar]
- 20.Pope CA, Burnett RT, Thurston GD, et al. Cardiovascular mortality and long-term exposure to particulate air pollution: epidemiological evidence of general pathophysiological pathways of disease. Circulation. 2004;109(1):71–77. doi: 10.1161/01.CIR.0000108927.80044.7F. [DOI] [PubMed] [Google Scholar]
- 21.Bambs CE, Kip KE, Mulukutla SR, et al. Sociodemographic, clinical, and psychological factors associated with attrition in a prospective study of cardiovascular prevention: the heart strategies concentrating on risk evaluation study. Ann Epidemiol. 2013;23(6):328–333. doi: 10.1016/j.annepidem.2013.02.007. [DOI] [PMC free article] [PubMed] [Google Scholar]
- 22.Caleyachetty R, Echouffo-Tcheugui JB, Muennig P, Zhu W, Muntner P, Shimbo D. Association between cumulative social risk and ideal cardiovascular health in US adults: NHANES 1999–2006. Int J Cardiol. 2015;191:296–300. doi: 10.1016/j.ijcard.2015.05.007. [DOI] [PubMed] [Google Scholar]
- 23.Caleyachetty R, Tehranifar P, Genkinger JM, Echouffo-Tcheugui JB, Muennig P. Cumulative social risk exposure and risk of cancer mortality in adulthood. BMC Cancer. 2015;15(1):945. doi: 10.1186/s12885-015-1997-z. [DOI] [PMC free article] [PubMed] [Google Scholar]
- 24.Tunno BJ, Michanowicz DR, Shmool JLC, et al. Spatial variation in inversion-focused vs 24-h integrated samples of PM2.5 and black carbon across Pittsburgh, PA. J Expo Sci Environ Epidemiol. 2016;26(4):365–376. doi: 10.1038/jes.2015.14. [DOI] [PMC free article] [PubMed] [Google Scholar]
- 25.Michanowicz DR, Shmool JLC, Tunno BJ, et al. A hybrid land use regression/AERMOD model for predicting intra-urban variation in PM2.5. Atmos Environ. 2016;131:307–315. doi: 10.1016/J.ATMOSENV.2016.01.045. [DOI] [Google Scholar]
- 26.Erqou S, Clougherty JE, Olafiranye O, et al. Particulate matter air pollution and racial differences in cardiovascular disease risk. Arterioscler Thromb Vasc Biol. 2018;38(4):935–942. doi: 10.1161/ATVBAHA.117.310305. [DOI] [PMC free article] [PubMed] [Google Scholar]
- 27.Ananth CV, VanderWeele TJ. Placental abruption and perinatal mortality with preterm delivery as a mediator: disentangling direct and indirect effects. Am J Epidemiol. 2011;174:99–108. doi: 10.1093/aje/kwr045. [DOI] [PMC free article] [PubMed] [Google Scholar]
- 28.Hajat A, Hsia C, O’Neill MS. Socioeconomic disparities and air pollution exposure: a global review. Curr Environ Heal Reports. 2015;2(4):440–450. doi: 10.1007/s40572-015-0069-5. [DOI] [PMC free article] [PubMed] [Google Scholar]
- 29.Clougherty JE, Shmool JLC, Kubzansky LD. The role of non-chemical stressors in mediating socioeconomic susceptibility to environmental chemicals. Curr Environ Heal Reports. 2014;1(4):302–313. doi: 10.1007/s40572-014-0031-y. [DOI] [Google Scholar]
- 30.Connen D, Glynn RJ, Ridker PM, Buring JE, Albert MA. Socioeconomic status, blood pressure progression, and incident hypertension in a prospective cohort of female health professionals. Eur Heart J. 2009;30(11):1378–1384. doi: 10.1093/eurheartj/ehp072. [DOI] [PMC free article] [PubMed] [Google Scholar]
- 31.Tunno BJ, Dalton R, Cambal L, Holguin F, Lioy P, Clougherty JE. Indoor source apportionment in urban communities near industrial sites. Atmos Environ. 2016;139:30–36. doi: 10.1016/J.ATMOSENV.2016.04.039. [DOI] [Google Scholar]
Associated Data
This section collects any data citations, data availability statements, or supplementary materials included in this article.
Supplementary Materials
Additional file 1. Table S1. Association of social risk and PM2.5 with blood pressure levels and blood glucose concentration. Table S2. Comparisons of the association of social risk and PM2.5 with blood pressure and glucose. Table S3. Association of cumulative social risk with risk of combined all-cause mortality or CVD outcomes, with adjustment for a) traditional CVD risk factors, b) further adjustment for PM2.5 or BC in mediation analyses. (N = 1622, N cases = 137)
Additional file 2. Figure S1. Box plot of PM2.5 and black carbon by categories of cumulative social risk, stratified by race
Data Availability Statement
The datasets used and/or analysed during the current study are available from the corresponding author on reasonable request.