Abstract
Healing of soft biological tissues is the process of self-recovery or self-repair after injury or damage to the extracellular matrix (ECM). In this work, we assume that healing is a stress-driven process, which works at recovering a homeostatic stress metric in the tissue by replacing the damaged ECM with a new undamaged one. For that, a gradient-enhanced continuum healing model is developed for three-dimensional anisotropic tissues using the modified anisotropic Holzapfel–Gasser–Ogden constitutive model. An adaptive stress-driven approach is proposed for the deposition of new collagen fibres during healing with orientations assigned depending on the principal stress direction. The intrinsic length scales of soft tissues are considered through the gradient-enhanced term, and growth and remodelling are simulated by a constrained-mixture model with temporal homogenization. The proposed model is implemented in the finite-element package Abaqus by means of a user subroutine UEL. Three numerical examples have been achieved to illustrate the performance of the proposed model in simulating the healing process with various damage situations, converging towards stress homeostasis. The orientations of newly deposited collagen fibres and the sensitivity to intrinsic length scales are studied through these examples, showing that both have a significant impact on temporal evolutions of the stress distribution and on the size of the damage region. Applications of the approach to carry out in silico experiments of wound healing are promising and show good agreement with existing experiment results.
Keywords: soft tissue, non-local damage, growth and remodelling, wound healing, anisotropic hyperelasticity, constrained mixture
1. Introduction
Soft biological tissues, such as arteries, skin and tendons, have the ability to grow and change through the formation of new constituents and removal of existing constituents [1]. Prediction of the underlying mechanisms of healing in damaged soft tissues through computational models is an important topic of research with a large number of potential applications.
Healing of soft biological tissues is the process of self-recovery or self-repair of the injured or damaged extracellular matrix (ECM), involving a complex interplay of components, and is usually divided into four stages, which overlap in time and which can last for several months or years [2]. These stages are haemostasis, inflammation, proliferation and remodelling [2,3]. It was reported that the first three stages (from haemostasis to proliferation) may last several weeks, and the final stage of remodelling may take from weeks to years. The description of healing can be found in appropriate references such as Comellas et al. [4] and Cumming et al. [5].
Computational modelling can provide insight into healing of soft tissues from both short-term and long-term perspectives. The first mathematical models of wound healing were developed in the 1990s [6–8]. Tepole & Kuhl [9] and Valero et al. [10] comprehensively reviewed computational models of dermal wound healing. Numerical approaches to healing can be divided into two types:
-
—
One focusing on the underlying cellular and biochemical mechanisms, including the simulation of wound contraction [11,12] and angiogenesis [13,14], inflammation and proliferation using discrete/continuum approaches [5,15,16]. For instance, Tepole [16] presented a continuum healing model by combining growth and remodelling (G&R) and systems biology.
-
—
A more phenomenological approach focusing on the change of material properties during the remodelling phase [17–20]. G&R can be modelled with collagen fibre reorientation [21–24] or continuous turnover of constituents [1,25,26].
The constrained-mixture computational method was first introduced by Humphrey & Rajagopal [25] and has been widely employed by others. Cyron et al. [27] introduced a temporally homogenized model that can significantly reduce the computational cost of the G&R approach. More recently, Latorre & Humphrey [28] developed a new rate-independent G&R approach, speeding up the numerical resolution compared with the general constrained-mixture theory.
Continuum damage mechanics (CDM) [29] provides another phenomenological approach suited for healing, as the loss or reduction of material or mass can be described with a damage function. However, it is known that local continuum damage models are significantly mesh dependent [30], and, more importantly, the physically inherent intrinsic length scale, such as the length of collagen fibres, cannot be considered in local damage models. The difficulty caused by the local damage model can be overcome by integral-type or gradient-type non-local damage models. Wafenschmidt et al. [30] first proposed a gradient-enhanced large-deformation continuum damage model based on the previous work of Dimitrijevic & Hackl [31,32]. Ferreira et al. [33] also presented an integral-type non-local averaging damage model for anisotropic hyperelastic materials. But these damage models have not considered the healing process in the long term. To simulate remodelling in bone tissue, Fernández et al. [34] also proposed a model with diffusion terms to address localization problems.
Comellas et al. [4] first developed a homeostasis-driven remodelling model for healing in soft tissues based on CDM. In their approach, the healing process was simulated by a continuously recoverable damage variable [4]. In our previous work [35], a two-dimensional non-local continuum healing model was presented. It combined a gradient-enhanced damage model and a temporally homogenized G&R model. It considered the intrinsic length scales of soft tissues through the gradient-enhanced approach. However, our previous work only addressed two-dimensional cases and a neo-Hookean hyperelastic model was used, so three-dimensional and anisotropic effects were not considered. This did not permit the healing of soft biological tissues with collagen fibre deposition to be simulated. Moreover, studies addressing the effect of intrinsic length scales for soft-tissue healing are scarce. To address this lack, we present a three-dimensional gradient-enhanced anisotropic healing model resulting from the extension of our former two-dimensional isotropic model.
The paper is organized as follows: §2 introduces the material and methods, including general equations for the gradient-enhanced model in §2.1, constitutive model in §2.2 and the finite-element (FE) implementation in §2.3. Section 3 shows the numerical examples. Finally, discussions and conclusions are given in §4.
2. Material and methods
2.1. General equations for gradient-enhanced healing model
2.1.1. Basic kinematics
Let describe the motion of the body which transforms referential placements to their spatial counterparts , in which κ(0) and κ(t) are the initial reference configuration and current configuration, respectively. The deformation gradient and the Jacobian which maps the referential volume dV onto the current volume dv are defined as
| 2.1 |
and
| 2.2 |
Considering the G&R process, the change of volume can be captured by an inelastic growth deformation gradient describing the change of size and shape of the differential volume element by deposition or degradation of mass. Therefore, as the elastic deformation is denoted as and the total deformation at any time t is decomposed multiplicatively [27],
| 2.3 |
2.1.2. Gradient-enhanced healing model with G&R
The general strain energy function per unit reference volume at each G&R time is assumed to be written as
| 2.4 |
where is the original (undamaged) strain energy density and is the strain energy density for the newly deposited fibres produced through G&R [36], depending on the elastic deformation gradient .
In equation (2.4), ρ0 is the mass density per unit reference volume at t = 0 in the reference configuration and ρg(t) denotes the change of mass density caused by G&R only (inelastic deformation). The total mass density ρ per unit reference volume at time t can be computed as ρ(t) = Q(t)ρ0 + ρg(t). Q(t) ∈ (0, 1] is the mass fraction existing at t = 0 that survives until time t [37] and f(d) represents a function of the damage variable d that measures the degree of material stiffness loss. It is at least twice differentiable and satisfies the following conditions:
| 2.5 |
Following the approach of Dimitrijevic & Hackl [31,32], a gradient-enhanced non-local free energy term is added to the strain energy given in equation (2.4)
| 2.6 |
In equation (2.6), cd represents the gradient parameter that defines the degree of gradient regularization and the internal length scale. Physically, this parameter is related to the average length of microstructural components in the soft tissue. Three other variables are introduced:
-
—
the field variable ϕ, which transfers the values of the damage parameter across the element boundaries to make it non-local by nature,
-
—
the energy-related penalty parameter βd, which approximately enforces the local damage field and the non-local field to coincide,
-
—
parameter γd, which is used as a switch between the local and enhanced model.
2.1.3. Total potential energy and variational form
The general total potential energy for the non-local damage model is
| 2.7 |
where is the body force vector per unit reference volume of Ω and are the tractions on the boundary Ω.
Minimization of the potential energy with respect to the primal variables and ϕ results in a coupled nonlinear system of equations, which may be written as
| 2.8 |
and
| 2.9 |
where is the first Piola–Kirchhoff stress and Y is the scalar damage quantity defined as
| 2.10 |
and
| 2.11 |
Corresponding spatial quantities in equation (2.10) and (2.11) are given by
| 2.12 |
and
| 2.13 |
where .
Substituting equations (2.2), (2.12) and (2.13) into equations (2.8) and (2.9), the variational forms in spatial description are
| 2.14 |
and
| 2.15 |
2.2. Constitutive model
2.2.1. Hyperelastic part of the free energy
As introduced in §2.1.2, the local part of the strain energy function in equation (2.4) includes the undamaged (original) part and the G&R produced part . The turnover time of the isotropic part is assumed to be much longer than that of the anisotropic part. Therefore, G&R is only considered in the anisotropic part and the growth of the isotropic part is ignored in this paper.
For the undamaged part , the modified anisotropic Holzapfel–Gasser–Ogden (MA-HGO) hyperelastic constitutive model [38] is used. It is written as
| 2.16 |
in which and are the isotropic and anisotropic parts, respectively, and can be expressed as
| 2.17 |
and
| 2.18 |
where μ0 and κ0 are the shear and bulk moduli of the soft isotropic matrix, respectively. is the first invariant of , where is the right Cauchy–Green tensor, which is defined as . k1 and k2 are the positive material constants, which can be determined from experiments. Ii is the anisotropic invariant describing the deformation of the reinforcing fibre and can be defined as , in which is a unit vector aligned with the reinforcing fibre in the reference configuration.
For the G&R produced part , the direction of newly deposited fibres may change during the healing process. For simplicity, the fibre directions (the fibre families are defined in §2.2.3) are expressed through a finite number of fibre families in which the strain energy of each fibre family can be written as
| 2.19 |
Substituting equations (2.17), (2.18) and (2.19) into equation (2.6), the final expression of the total strain energy function can be written as
| 2.20 |
and the corresponding Cauchy stress is
| 2.21 |
where
| 2.22 |
| 2.23 |
| 2.24 |
in which is the left Cauchy–Green tensor, is defined as and is the identity matrix. is the Cauchy stress for newly deposited fibres.
To describe the evolution of damage and healing, a time-dependent healing parameter H(d,t) is defined as
| 2.25 |
The healing parameter H(d,t) takes values between 0 and 1. When H(d,t) = 0 the tissue is completely damaged and its local stiffness is null, whereas when H(d,t) = 1 the tissue is completely healed with newly produced tissue replacing the previously damaged one.
2.2.2. Damage evolution
The detailed evolution of the damage variable d can be found in the work of Dimitrijevic & Hackl [31,32] and Waffenschmidt et al. [30]. In the following, we give a brief description of some basic and essential formulations.
Following standard thermodynamic considerations [31,32], the damage conjugate driving force q is defined as
| 2.26 |
The damage condition at any time of the loading process is based on an energy release rate threshold condition [39],
| 2.27 |
where r1 represents the threshold value which triggers damage evolution.
The differential equation of damage evolution is subjected to Kuhn–Tucker optimality conditions [31,32],
| 2.28 |
2.2.3. Adaptive fibre growth model during healing
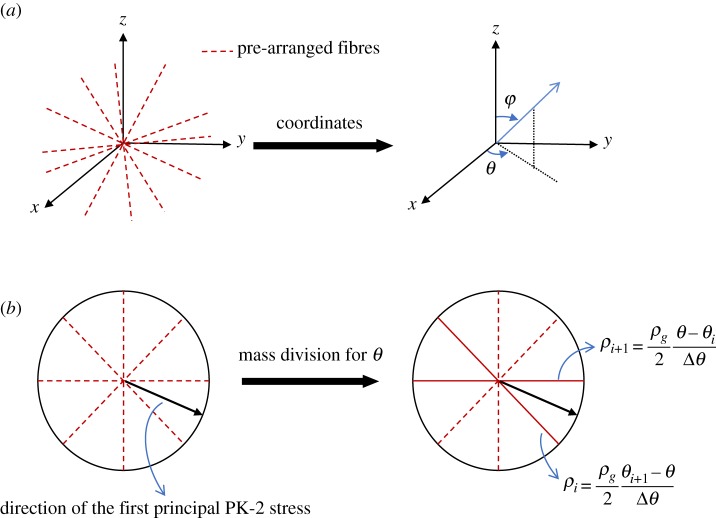
We assume that the direction of newly deposited fibres depends on the direction of the first principal PK-2 stress. Although the deposition of new fibres in healing may occur in any possible direction, for the sake of simplicity, a finite number of possible directions are used to approximately describe the new fibres. Then the increase of mass is distributed across the pre-arranged different fibre families, depending on the angle of newly deposited fibres. These finite numbers of fibre families consist of uniformly pre-arranged fibres with directions in the range θ (0° ≤ θ ≤ 180°) for the polar angles and φ (−90° < φ ≤ 90°) for the azimuthal angles in the local spherical coordinate system, as shown in figure 1a. The angle intervals between two neighbouring fibres in the polar and azimuthal directions are defined as
| 2.29 |
where nfibre is the number of fibre families defined in both the polar and azimuthal directions.
Figure 1.
Illustration of fibre deposition in pre-arranged directions. (a) Orientations of pre-arranged fibres and (b) the process of mass distribution between the different fibre families. (Online version in colour.)
If the direction of the first principal PK-2 stress is and , the interval which contains the current and can be found as
| 2.30 |
In that general situation, the mass of newly deposited fibre is divided among the two pre-arranged directions (θi, φi) and (θi+1, φi+1), and the corresponding mass in each direction is derived as shown in figure 1b,
| 2.31 |
According to this scheme, new fibres will be adaptively deposited in directions depending on the local stress state.
2.2.4. Computation of growth deformation
According to Braeu et al. [36], the inelastic growth deformation gradient can be written as
| 2.32 |
in which the second-order tensor defines the growth direction and is normalized without loss of generality such that .
The direction of growth deformation is aligned with the direction of newly deposited fibres, which is also the direction of the first principal PK-2 stress and can be denoted by the polar angle θ and the azimuthal angle φ. Therefore, the second-order tensor (in a Cartesian coordinates system) can be written as
| 2.33 |
In equation (2.32), the mass production rate is governed by the difference between the current co-rotated Cauchy stress tensor and a (typically constant) homeostatic stress proposed by Braeu et al. [36]
| 2.34 |
where 〈 · 〉 = (| · | + ·)/2 is the Macaulay bracket and is a gain-type second-order tensor, which may be written as
| 2.35 |
and is a generic rate function (describing additional deposition or damage processes affecting the net mass production driven by other factors such as chemical degradation and/or mechanical fatigue processes), which is not stress mediated and is not considered in this paper.
2.3. Finite-element implementation
Using the FE method, the coupled nonlinear system of equations is discretized. The tri-quadratic serendipity interpolation is used for both the geometry and the field variables , and the tri-linear interpolation is used for the non-local field ϕ. The general process of numerical implementation is summarized in table 1. In the following, we only give details on the FE implementation for the healing process. For more details on general FE implementation, readers can refer to the work by Waffenschmidt et al. [30].
Table 1.
Steps of the numerical implementation at the Gauss point level for the gradient-enhanced continuum healing model.
| 0. Initialization at t = 0 and n = 0 |
| Mechanical damage dn = 0 and healing function Hn = 0 |
| 1. Algorithm at each load increment n |
| 1.1. Given: Total deformation gradient tensor , elastic deformation , inelastic deformation and material properties |
| 1.2. Compute driving force from equation (2.26) |
| 1.3. Check damage condition from equation (2.27), if go to 1.5, else go to 1.4 |
| 1.4. Update damage dn+1 = dn + Δd from equation (2.28) |
| 1.5. Update healing function Hn+1 |
| 1.6. Compute the stress state for the present step |
| 1.7. Update the directions of newly deposited fibres |
| 1.8. Update the directions of growth deformation |
| 1.9. Compute tangent moduli ,2dy/dg, dy/dϕ and in equations (2.39)–(2.41) |
2.3.1. Finite-element discretization
Isoparametric interpolations of geometry variables , field variables and non-local field ϕ are, respectively, written as
| 2.36 |
where ξ denotes the coordinates in the reference element and and are the nodal displacements and nodal non-local damage variables, respectively.
The FE interpolations of equation (2.36) are introduced into the coupled nonlinear system of equations (2.14) and (2.15). In order to solve the coupled nonlinear system of equations, an increment-iterative Newton–Raphson-type scheme is adopted,
| 2.37 |
where
| 2.38 |
| 2.39 |
| 2.40 |
| 2.41 |
In the above equations, the tangent terms , 2dy/dg, dy/dϕ and are similar to the ones derived by Waffenschmidt et al. [30] and is a new time-dependent tangent stress–strain matrix in the damage and healing process given by
| 2.42 |
where the detailed expression of and can be found in Nolan et al. [38].
2.3.2. Computation of G&R parameters
The mass density of a given family of collagen fibres ρ(t) at time increment n + 1 is obtained by the finite difference scheme,
| 2.43 |
in which Q(t) describes the continuous degradation of existing collagen, which may be written as
| 2.44 |
where Tt describes the average turnover time, that is, the period within which a mass increment is degraded and replaced by a new mass increment, and τ is the time when growth occurs.
Bringing equation (2.43) into equation (2.25)
| 2.45 |
The total deformation obtained from equation (2.37) can be further split into
| 2.46 |
where the growth deformation can be calculated based on its rate from equation (2.32).
3. Results
The gradient-enhanced healing model is implemented within the commercial FE software Abaqus/Standard by means of a user subroutine UEL. Three different numerical examples are shown below to illustrate damage and healing effects in soft tissues with this model. In each example, an exponential damage function f(d) = e−d is adopted but any other damage function satisfying equation (2.5) could also be used.
3.1. Uniaxial tension
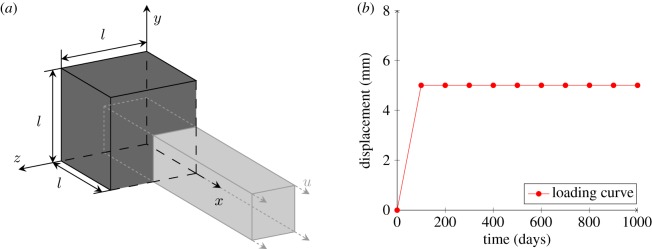
The first example is shown in figure 2a. A cube with 10 mm edge subjected to a uniaxial tensile loading is defined. As shown in figure 2b, the displacement increases continuously during 0–100 days and is maintained constant after the 100th day. The healing process is assumed to begin from time . Only one FE is used in this first example. The hyperelastic parameters are from Nolan et al. [38], reinforced fibres are assumed to lie in the x − y plane and the initial fibre orientation angle is θ = ± 30°. The parameters for damage and healing are shown in table 2.
Figure 2.
Geometry and displacement used in the uniaxial tensile case study. (a) Geometric model and (b) loading curve. (Online version in colour.)
Table 2.
Hyperelastic, damage and healing parameters used in uniaxial tension.
| type | description | symbol | value | unit |
|---|---|---|---|---|
| hyperelastic | shear modulus | μ0 | 0.05 | MPa |
| bulk modulus | κ0 | 1 | MPa | |
| anisotropic material constant | k1 | 1 | MPa | |
| anisotropic material constant | k2 | 0.1 | — | |
| fibre orientation angles | θi | [± 30, ± 20, ± 10] | deg | |
| damage | damage threshold | r1 | [0.1, 0.14, 0.2] | MPa |
| degree of regularization | cd | 1 | MPa−1 mm2 | |
| penalty parameter | βd | [0.1, 1.0, 10] | MPa−1 | |
| (non-) local switch | γd | 1 | — | |
| healing | turnover time | Tt | 101 | days |
| gain parameter | kσ | [0.05, 0.10, 0.15]/Tt | days−1 | |
| angle interval | Δθ/Δφ | 45 | deg |
Here, we set the values of homeostatic stress lower than the maximum stress reached after damage [39,40], so that G&R works at reducing this stress by converging towards the homeostatic stress, consequently inducing healing.
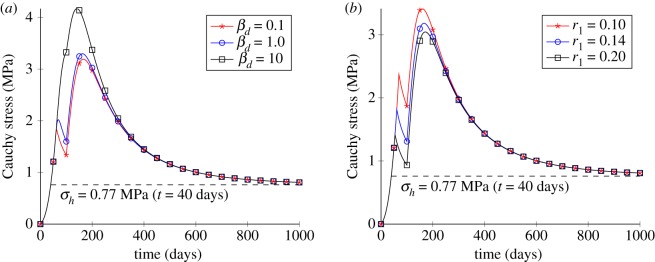
First, the sensitivity analysis of damage parameters includes the penalty parameter βd and the damage threshold r1, as shown in figure 3a,b, respectively. Figure 3a shows the influence of different penalty parameters βd on the damage behaviour. The results highlight that a larger βd leads to a smoother variation of stress after damage. Moreover, there is a discontinuous jump of the Cauchy stress at around 100 days for βd = 0.1, and this jump vanishes as βd increases. Obviously, βd has some influence on the evolution of damage. Figure 3b shows the influence of the damage threshold r1. It can be seen that, as r1 increases, the stress value at the beginning of damage is increased too; this indicates that r1 reflects the ability of the soft tissue to sustain damage initiation.
Figure 3.
Results for the uniaxial tensile test with different parameter values. (a) Temporal variations of the stress for different values of the penalty parameter βd and (b) temporal variations of the stress for different values of the damage threshold r1. (Online version in colour.)
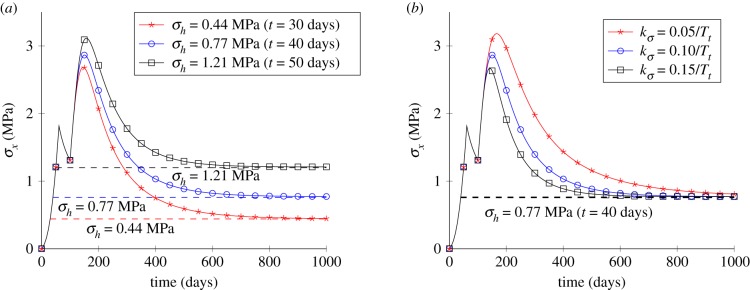
The effect of homeostatic stress is tested by trying three different homeostatic stresses: σh = 0.44 MPa (), σh = 0.77 MPa () and σh = 1.21 MPa (). The gain parameter is set to kg = 0.10/Tt. The Cauchy stress in the x-direction is shown in figure 4a. In figure 4a, it can be observed that σx first increases while the tissue stiffens at the beginning of the healing process and finally converges to the homeostatic stress for the three different homeostatic stresses. Figure 4b shows the influence of the gain parameter. Results show that larger gain parameters lead to a faster convergence to the homeostatic stress, indicating a faster healing speed.
Figure 4.
Results for the uniaxial tensile test with different parameter values. (a) Temporal variations of the stress for different values of the homeostatic stress and (b) temporal variations of the stress for different values of the gain parameter. (Online version in colour.)
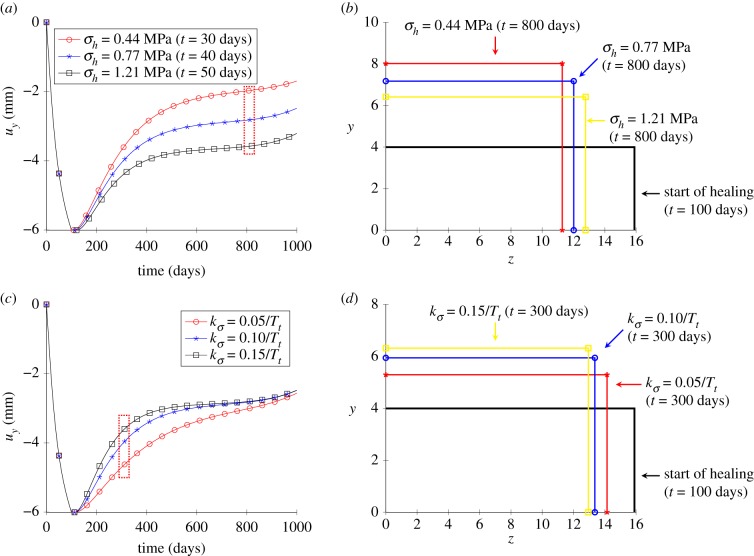
Figure 5 illustrates the variations of displacement uy and the deformation in the y − z plane for different values of homeostatic stress σh and gain parameter . Figure 5b,d shows a cross section of the cube after and of healing, respectively. As no loading is applied in the y- and z-directions, all the deformations induced by healing are volume changes. Figure 5a,b shows that a larger growth deformation is produced with a lower σh, which means a larger value of stress difference is required to be recovered. Figure 5c,d indicates that, with a large gain parameter, the healing rate is faster and the homeostatic stress is reached faster. Moreover, a larger inelastic deformation is obtained for the same healing time.
Figure 5.
Results for the uniaxial tensile test. (a) Time variations in displacement along the y direction for different homeostatic stresses, (b) cross-sectional view of the deformation (y–z plane) for different homeostatic stresses, (c) displacement in the y direction for different gain parameters and (d) deformation from the section view (y–z plane) for different gain parameters. (Online version in colour.)
Furthermore, we investigate the effect of new fibre deposition by comparing two models.
-
—Model 1: The proposed model in this paper with the strain energy function
3.1 -
—Model 2: The strain energy function without adaptive deposition of new fibres
3.2
The comparison of σx temporal variations between model 1 and model 2 is shown in figure 6. For two models, the homeostatic stress and gain parameters are set to σh = 0.77 MPa and , respectively. There is a significantly larger σx value with model 1. In model 2, the directions of newly deposited fibres are fixed (θ = ±30° in this example). Comparatively, in model 1, fibres are adaptively deposited in the direction of the first principal stress (x-axis in this example) but only deposited in the direction of the initial fibres (θ = ± 30° in this example) for model 2. So larger σx are reached in model 1 under the same displacement loading.
Figure 6.
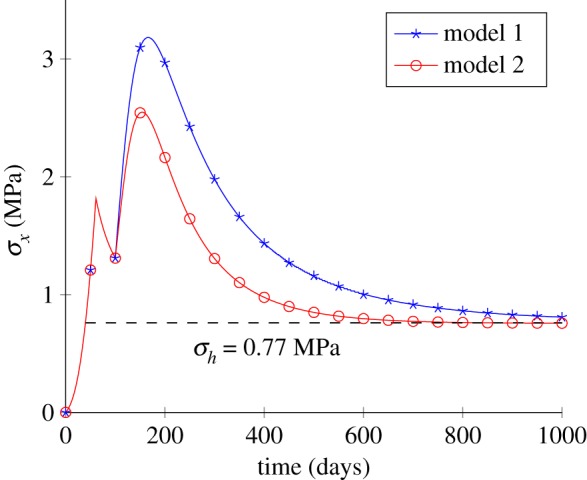
Comparison of the responses between two growth models. (Online version in colour.)
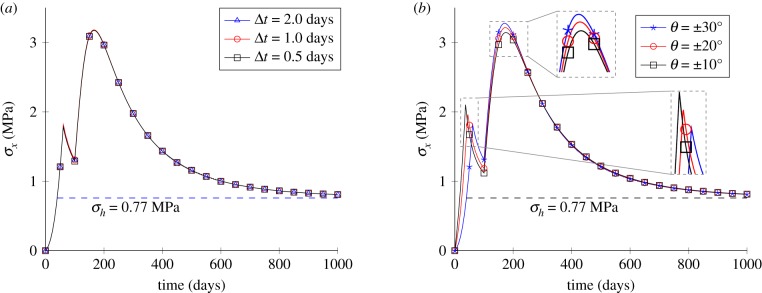
Finally, the sensitivity to the time step Δt and fibre orientation angles θ are shown in figure 7. For both cases, the homeostatic stress and gain parameters are set to σh = 0.77 MPa and , respectively. Results in figure 7a show that different Δt values do not affect the convergence of the results and Δt = 1 days were used for all following cases. The anisotropic effect is tested by changing the fibre orientation angles θ with the same value of σh, as shown in figure 7b; the results show an obvious difference for different prescribed θ, and convergence can be reached for all cases of θ.
Figure 7.
Parameter sensitivity analysis for the uniaxial tensile test. (a) The time-step size and (b) the fibre orientation angles. (Online version in colour.)
3.2. Open-hole plate
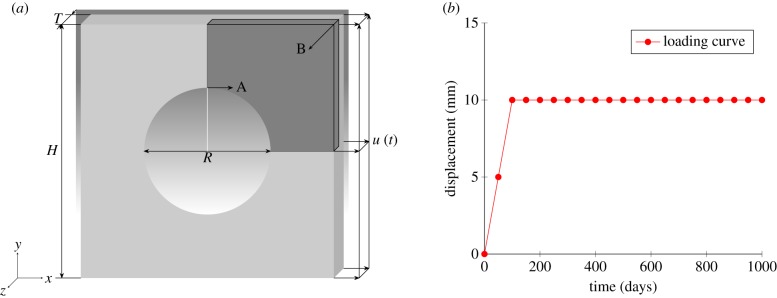
The second numerical example is a rectangular plate with a hole, subjected to displacement loading. The geometry and the loading curve are shown in figure 8. The hyperelastic and damage material properties are reported in table 3. Because of symmetry, only 1/8 of the plate is analysed. The initial fibres are laid in the x–y plane, and, in this example, the homeostatic stress is set as the stress state obtained at , with an average Cauchy stress on the right-hand side of σh equal to 0.035 MPa.
Figure 8.
Geometry and displacement applied for the open-hole plate. (a) Geometry and (b) loading curve. (Online version in colour.)
Table 3.
Geometry, hyperelastic, damage and healing parameters in the open-hole plate.
| type | description | symbol | value | unit |
|---|---|---|---|---|
| geometry | height | H | 100 | mm |
| thickness | Th | 10 | mm | |
| diameter | R | 50 | mm | |
| hyperelastic | shear modulus | μ0 | 0.5 | MPa |
| bulk modulus | κ0 | 1 | MPa | |
| anisotropic material constant | k1 | 1 | MPa | |
| anisotropic material constant | k2 | 0.1 | — | |
| fibre orientation angles | θi | ±30 | deg | |
| damage | damage threshold | r1 | 0.006 | MPa |
| penalty parameter | βd | 0.03 | MPa−1 | |
| degree of regularization | cd | 1 | MPa−1 · mm2 | |
| (non-) local switch | γd | 1 | — | |
| healing | turnover time | Tt | 200 | days |
| gain parameter | kσ | 1.5/Tt | days−1 | |
| angle interval | Δθ/Δφ | [5,10,20,30] | deg |
First, the sensitivity analysis of the number of the pre-arranged fibre families in each direction is investigated. Results in figure 9 illustrate that, generally, the temporal variations in the average stress converge similarly to the decreasing angle intervals Δθ and Δφ. Moreover, a larger difference due to the changes in Δθ and Δφ can be found at the initial stage of healing (–) than at the homeostatic stage (–600 days). Moreover, the computational cost increases with decreasing Δθ and Δφ, as a larger number of possible directions are included. For instance, the CPU time (PC with Intel Xeon E5-2650, 2.40 GHz, 32 GB RAM) was 25.03 h and 4.19 h for the cases Δθ = Δφ = 10° and Δθ = Δφ = 30°, respectively. The following results are based on the case Δθ = Δφ = 30°.
Figure 9.
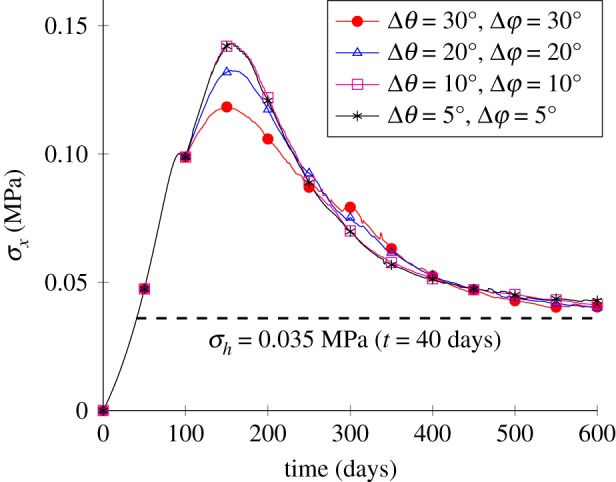
Sensitivity analysis of the angle interval. (Online version in colour.)
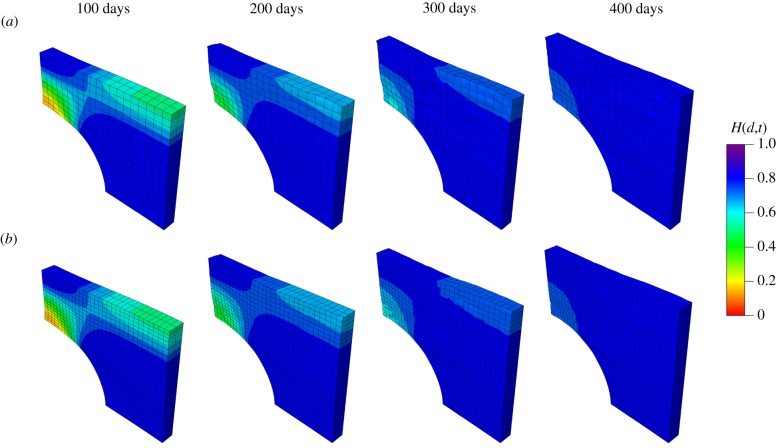
To characterize the non-local healing model, two different meshes were used to check mesh dependence. The average Cauchy stress σx on the right-hand side is shown in figure 10, and the evolution of the time-dependent healing function H(d,t) is shown throughout the healing process in figure 11 for two different mesh sizes (594 elements and 1588 elements). The computed stress values and damage fields show that the approach can achieve very close results with different meshes, demonstrating mesh independence.
Figure 10.
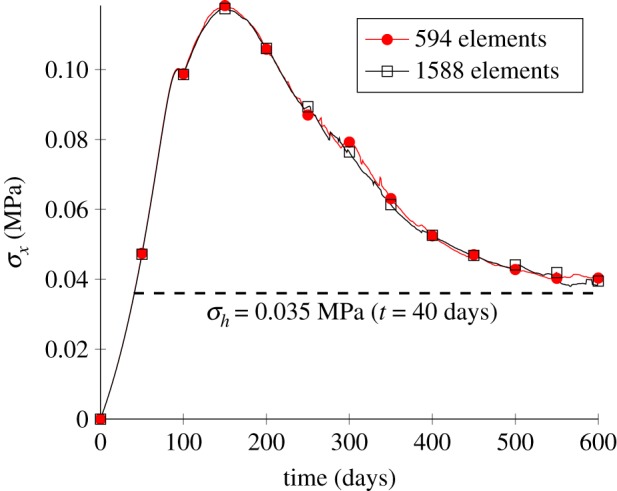
The average Cauchy stress in the x-direction, σx, of the right-hand side for two mesh sizes. (Online version in colour.)
Figure 11.
Evolution of the fields H(d,t). (a) Results with a coarse mesh of 594 elements and (b) results obtained with a fine mesh of 1588 elements. (Online version in colour.)
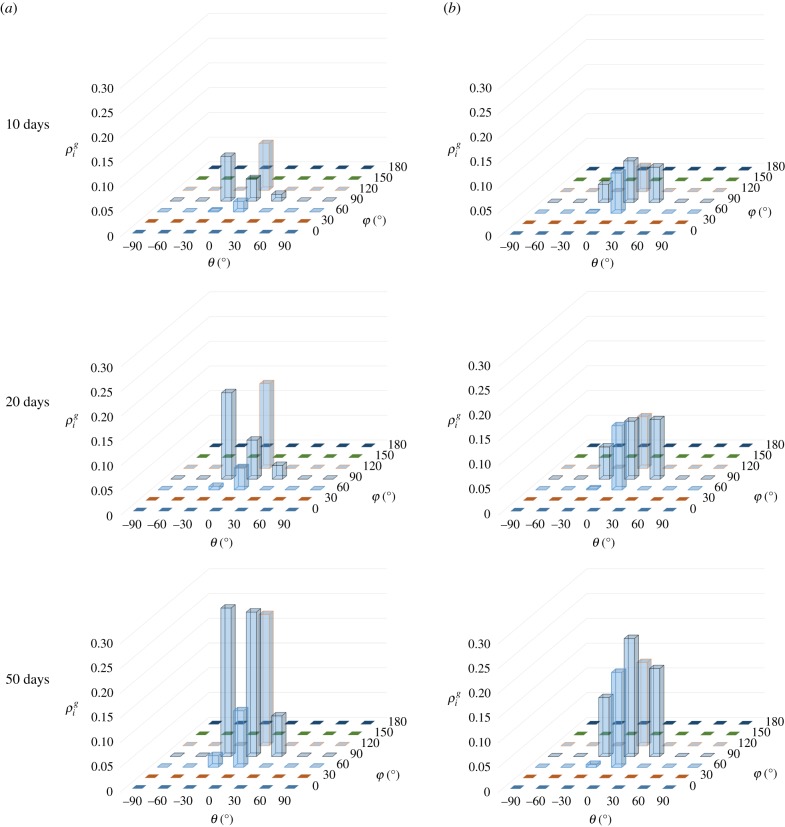
The process of deposition of new fibres in healing is shown in figure 12, in which two points, A and B, are selected, as shown in figure 8. The mass density with different directions (represented by θ and φ) is shown at different times. Initially, at the beginning of healing (), no new fibres are produced for both point A and point B. After the healing starts, the mass densities are continuously increased with time for both point A and point B. Some differences in mass density for point A and point B can be found during the healing process, caused by different stress states.
Figure 12.
The evolution of mass density of the newly deposited fibres at different points. (a) Point A and (b) point B. (Online version in colour.)
3.3. Simulation of wound healing
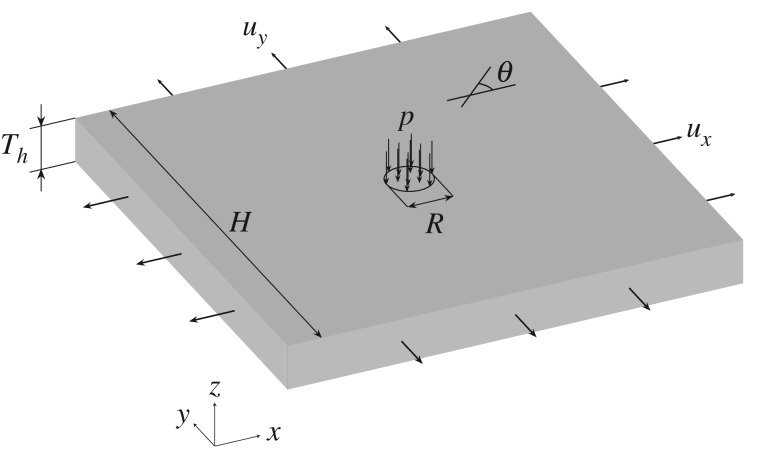
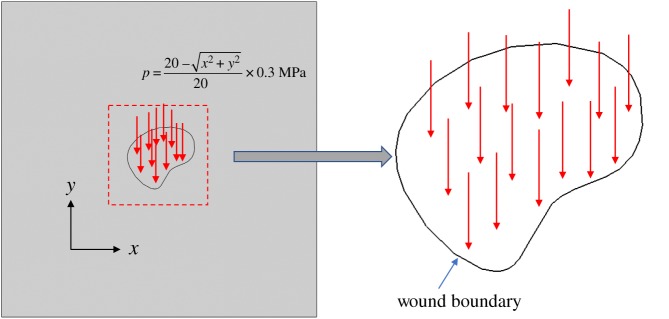
For the third numerical example, we simulate wound healing after a sudden insult produced by a concentrated load. The geometry of the problem is shown in figure 13. Material parameters, obtained from the literature [41,42], are reported in table 4. The numerical implementation includes three steps. First, the plate is stretched biaxially by 10% in both the x- and y-directions to induce a pre-stress σpre, which is regarded as the homeostatic stress in this example. Second, a pressure () is applied in the 10-mm-radius central circular area (where the centre of the circle is the coordinate origin), as shown in figure 13, producing mechanical damage (wound). Finally, the applied pressure p is removed but the pre-stress is maintained, in order to investigate the long-term effect of the healing process without the impact of the short-term pressure producing the wound.
Figure 13.
Geometry and loading for the wound-healing problem.
Table 4.
Geometry, hyperelastic, damage and healing parameters in the wound-healing problem.
| type | description | symbol | value | unit |
|---|---|---|---|---|
| geometry | height | H | 100 | mm |
| thickness | Th | 10 | mm | |
| hyperelastic | shear modulus | μ0 | 0.2 | MPa |
| bulk modulus | κ0 | 10 | MPa | |
| anisotropic material constant | k1 | 0.03 | MPa | |
| anisotropic material constant | k2 | 3 | — | |
| fibre orientation angles | θ | ± 30 | deg | |
| damage | damage threshold | r1 | 0.035 | MPa |
| penalty parameter | βd | 0.01 | MPa−1 | |
| degree of regularization | cd | [0.01,1] | MPa−1 mm2 | |
| (non-) local switch | γd | 1 | — | |
| healing | turnover time | Tt | 28 | days |
| gain parameter | kσ | 0.10/Tt | days−1 | |
| angle interval | Δθ/Δφ | 45 | deg |
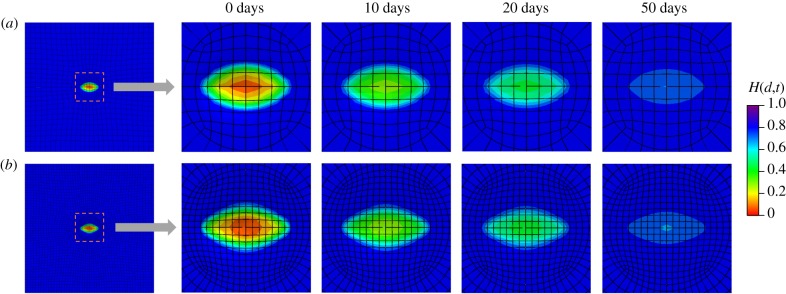
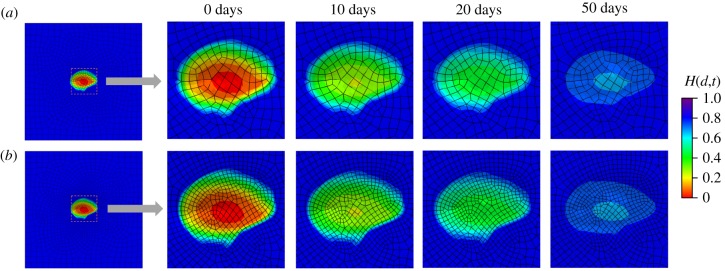
Similar to the second example, mesh dependence is investigated by comparing two cases (740 elements and 4230 elements). The variations in the damage fields during the healing process are shown in figures 14 and 15 for the top view and the cross-sectional view, respectively. In the results of this example, the ‘0 days’ time refers to the time when pressure p is removed and the healing starts immediately after the ‘0 days’ time. The healing parameter H(d,t) is similar for both meshes. Results in figure 14 show a healing process which is comparable to in vivo wound healing of rats reported in [43], in terms of both duration and size of the damage area, although the gain parameter and the internal length scales are set arbitrarily.
Figure 14.
Evolution of the fields H(d,t) from the top view. (a) Results obtained with a coarse mesh of 740 elements and (b) results obtained with a fine mesh of 4230 elements. (Online version in colour.)
Figure 15.
Evolution of the fields H(d,t) from a cross-sectional view. (a) Results obtained with a coarse mesh of 740 elements and (b) results obtained with a fine mesh of 4230 elements. (Online version in colour.)
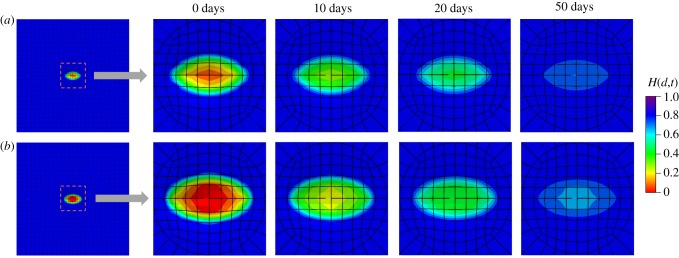
The effect of internal length scales in the healing process is investigated by setting different cd values (cd is a parameter related to the average length of the microstructural components in the soft tissues). Healing fields H(d,t) in figure 16 (top view) and figure 17 (cross-sectional view) show that a higher cd leads to less damage for both the damage and healing processes. This can be explained as a larger cd value leads to a larger area of ‘activated zone’ [31,32]; hence, the changes in the damage variable have an influence on a relatively larger region, and the concentration of damage under the same applied loading will be relatively smaller, hence damage will be reduced as well.
Figure 16.
Evolution of the fields H(d,t) from the top view. (a) Results with cd = 1 and (b) results with cd = 0.01. (Online version in colour.)
Figure 17.
Evolution of the fields H(d,t) from a cross-sectional view. (a) Results with cd = 1 and (b) results with cd = 0.01. (Online version in colour.)
A residual deformation in the vertical direction at can be observed in figure 15. As damage happens, the tissue stiffness in the damaged region is decreased and deformation occurs under pre-stretched conditions. In order to illustrate the source of residual deformation, four cases are tested: (i) no damage without pre-stretch, (ii) damage without pre-stretch, (iii) no damage with pre-stretch, and (iv) damage with pre-stretch (situation used in our model). Results shown in figure 18 highlight that the residual deformation in the vertical direction only occurs in case (iv). The residual deformation can be recovered under pre-stretch, as shown in figure 17, because the stiffness is progressively recovered during G&R.
Figure 18.
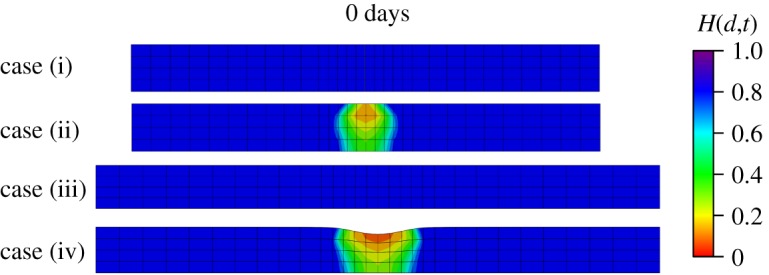
The deformations in cross-sectional view for four different cases when . (Online version in colour.)
Figure 19 shows the difference between both models of newly deposited fibres at different locations. Two points are selected and their locations are shown in figure 20. Point A is closer to the damage region than point B. Results show that there is a significant difference in the directions and mass densities at the two points. At the initial stage of healing from to , fibres are deposited in a larger range of directions for point A, while less scattered fibre directions are found in point B. The reason for this may be that point A has more damage and a more complex distribution of stress.
Figure 19.
The evolution of mass density of the newly deposited fibres at different points. (a) Point A and (b) point B. (Online version in colour.)
Figure 20.
The locations of the observation points. (Online version in colour.)
Moreover, non-symmetric wound healing is modelled. As shown in figure 21, an irregular region is considered to apply a pressure , while other parameters are similar to the symmetric wound-healing example. Evolutions of non-symmetric H(d,t) patterns from a top view and a cross-sectional view for two different meshes are shown in figures 22 and 23, respectively. It can be seen in figures 22 and 23 that the results of H(d,t) from 3868 elements and 6764 elements are close in both the top and cross-sectional views, showing that the size of mesh has little effect on H(d,t), and the performance on mesh independence of the proposed model is again illustrated. The ability of the proposed model in modelling non-symmetric and complex wound healing is demonstrated.
Figure 21.
Geometry and loading for non-symmetric wound healing. (Online version in colour.)
Figure 22.
Evolution of the fields H(d,t) from the top view for non-symmetric wound healing. (a) Results obtained with a coarse mesh of 3868 elements and (b) results obtained with a fine mesh of 6764 elements. (Online version in colour.)
Figure 23.
Evolution of the fields H(d,t) from a cross-sectional view for non-symmetric wound healing. (a) Results obtained with a coarse mesh of 3868 elements and (b) results obtained with a fine mesh of 6764 elements. (Online version in colour.)
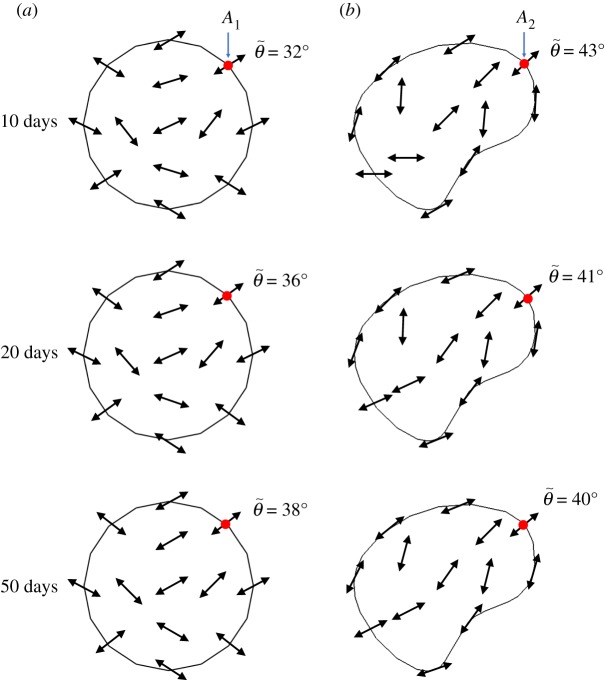
Moreover, the evolutions of fibre orientations for both symmetric and non-symmetric cases are shown in the wound regions at different times in figure 24, in which the average directions of fibres are represented by arrows; the average direction angle can be calculated according to
| 3.3 |
where θ and ρg are the angle and mass density for individual fibres, respectively. The results show that fibres are deposited across the entire damaged area, but the directions of the newly deposited fibres differ from one location to another. The values of the average fibre angles for two selected points A1 and A2 are illustrated in figure 24. For symmetric wound healing, symmetrical deposition directions can be observed, and the changes in the directions for newly deposited fibres are not significant during the healing process. Comparatively, non-symmetric wound healing produces more complex patterns of fibre deposition; obviously, the damage pattern has more impact on the fibres' orientations in healing. The evolution of fibre orientations in figure 24 with the mass change in figure 19 together provide insight into the mechanisms of scar formation in wound healing.
Figure 24.
The evolution of the direction of newly deposited fibres in the x–y plane for symmetric and non-symmetric wound healing at different points. (a) Symmetric wound healing and (b) non-symmetric wound healing. (Online version in colour.)
4. Discussions and conclusion
Coupling damage, intrinsic length scales, anisotropic hyperelasticity and G&R in a three-dimensional model is challenging. Aiming to address these challenges, a gradient-enhanced continuum healing model has been developed for three-dimensional soft biological tissues in this paper.
One advantage of the model is its ability to perform three-dimensional simulations of the healing process non-locally owing to the introduction of a gradient-enhanced variable. The importance of including the non-local terms is demonstrated for both physical and numerical aspects. Physically, the intrinsic length scales can be included in the constitutive model, and their effects are shown through different numerical examples. For instance, in the wound-healing example, a larger internal length scale leads to a lower level of damage in the healing process, which can be accounted for by the theory of the ‘activated zone’ [31,32]. Numerically, good mesh independence is achieved in the healing simulations. Very good agreement for the damage distribution at different times is obtained in both the open-hole plate and wound-healing examples, showing that the mesh-dependence issue of traditional local models is well addressed even with this three-dimensional anisotropic hyperelastic G&R model.
Another advantage of the proposed model is its ability to simulate the process of adaptive fibre deposition during healing. Models of adaptation for soft biological tissues sometimes include possible fibre reorientation by changing the fibre directions under mechanical stimuli [21,22]. Constrained-mixture models usually set fixed directions for fibres [28]. In this paper, we first presented a new adaptive fibre deposition equation and integrated it into the proposed non-local healing approach. Compared with existing models [21,22,28], the unique advantage is that it can simulate the deposition of new fibres with updated directions related to the stress computed at each time step (although some pre-arranged directions are used for the sake of simplification in the computational implementation). It is demonstrated that this process of deposition of new fibres in different directions, rather than changing the directions of existing fibres, can be significant in stress distribution.
Based on the proposed model, the effects of some important factors in 3D healing can be considered; for instance, the rate of healing, the value of intrinsic length scales, the value of the homeostatic stress, etc. The deformation due to growth can also be computed to illustrate the change of inelastic deformation in healing [35].
Regarding applications, the two-dimensional isotropic healing model presented previously by the same authors was suitable for problems that can be simplified using a plane-strain or plane-stress assumption, such as balloon angioplasty [35]. However, in many problems, three-dimensional effects have to be taken into account, such as the three-dimensional evolution of damage and anisotropic effects due to collagen fibres, and the three-dimensional healing model presented in this paper appears essential to deal with general applications involving patient-specific problems for instance. Wound healing of soft biological tissues seems very interesting, as shown in the last numerical example. The analysis of parameter sensitivity showed significant effects of intrinsic length scales on the region of damage. This is the first time that a homeostasis-driven non-local continuum model has been used to simulate wound healing in skin. Experiments of in vivo wound healing of skin in rats reported in the literature [43] showed temporal evolutions of the damaged zone similar to our model predictions. Numerical simulations proposed in this paper are based on CDM; therefore, problems involving discontinuities, e.g. cut injury of soft tissue, cannot be directly addressed by the proposed model. However, the proposed model is still workable for some complex but continuous wound patterns. For instance, non-axisymmetric wound healing is shown in §3.3; therefore, the potential of this model in modelling post-surgical would healing is still highly relevant. It should be noted that wound healing is a complex process and we only considered the influence of mechanical stimuli in this work. More factors, such as chemical terms, could be included in equation (2.34) to complete the model. Computational and experimental challenges related to wound-healing studies were reviewed by Valero et al. [10]. After further validations, our model would be useful as a complement to healing experiments, which are usually very long, to analyse the impacts of mechanical or chemical factors on wound healing, for instance through the design of in silico experiments.
A main limitation of this work is the determination of subject-specific material parameters. Generally, hyperelastic parameters can be identified from experimental data and abundant literature exists on this topic [44]. But the identification of other parameters, for instance internal length scales, such as the gradient parameter cd, damage threshold r1 and the penalty parameter βd, will require inverse analyses and appropriate experiments. For instance, the damage threshold r1, which reflects the response of soft tissues to damage initiation, will vary between tissues, such as skin, arteries, tendons, etc. According to the sensitivity analysis provided in §3.1, it was found that r1 determines the time of damage initiation but does not have much influence on healing in the longer term. The damage threshold can be determined by in vitro experimental measurements for different kinds of tissues, and the effects of inter-individual variability can be predicted by sensitivity analyses. For instance, the wound-healing experiments in rats reported by [43] could provide essential data about the evolution of the area of damage to identify the healing parameters. The choice of the PK-2 principal stress direction in computing the growth directions is another limitation, as PK-2 stress has no physical meaning. We used the PK-2 stress only for the sake of computational convenience. Computational developments are currently on-going to use the Cauchy stress in future studies. Moreover, the use of UEL presents some limitations such as the definition of slave surfaces in contact analyses. Therefore, self-contact problems cannot be addressed with the current model.
In summary, we have coupled damage, intrinsic length scales, anisotropic hyperelasty and G&R in a three-dimensional model to simulate healing of soft tissues. Mesh-dependence issues are addressed by a non-local gradient-enhanced approach and a new adaptive fibre deposition approach has been integrated into the non-local healing model. Important developments are currently in progress for applying the proposed model to different applications, such as balloon angioplasty [45] or prediction of aneurysm rupture [46].
Supplementary Material
Supplementary Material
Supplementary Material
Supplementary Material
Acknowledgements
We thank the anonymous reviewer whose insightful comments on an earlier version of the manuscript helped to improve the arguments, clarity and presentation of our work.
Data accessibility
The data supporting this article have been uploaded as part of the electronic supplementary material.
Authors' contributions
D.Z. implemented the computational model, performed the numerical simulations and drafted the manuscript. S.A. and Y.H. co-contributed the main idea and helped draft the manuscript. H.Y. helped in the implementation of numerical computation. S.J.M. helped in the coding of the damage model in UEL. K.H. helped in the modelling in damage mechanics. All authors contributed to writing the manuscript and have approved the final version.
Competing interests
We declare we have no competing interests.
Funding
The research leading to this paper is funded by ERC-2014-CoG-BIOLOCHANICS (647067), NSFC-ERC (grant no. 11711530644), NSFC (grant no. 11572077), Open Fund from the State Key Laboratory of Structural Analysis for Industrial Equipment (GZ1708, GZ19105) and DUT-BSU (grant no. DBJI1903).
References
- 1.Rao I. 2011. Modeling of growth and remodeling in soft biological tissues with multiple constituents. Mech. Res. Commun. 38, 24–28. ( 10.1016/j.mechrescom.2010.11.003) [DOI] [Google Scholar]
- 2.de Oliveira Gonzalez AC, Costa TF, de Araújo Andrade A, Medrado ARAP. 2016. Wound healing—a literature review. Anais Brasileiros de Dermatologia 91, 614–620. ( 10.1590/abd1806-4841.20164741) [DOI] [PMC free article] [PubMed] [Google Scholar]
- 3.Hashim PW, Ferneini AM. 2018. Wound healing, pp. 37–45. Cham, Switzerland: Springer International Publishing. [Google Scholar]
- 4.Comellas E, Gasser TC, Bellomo FJ, Oller S. 2016. A homeostatic-driven turnover remodelling constitutive model for healing in soft tissues. J. R. Soc. Interface 13, 20151081 ( 10.1098/rsif.2015.1081) [DOI] [PMC free article] [PubMed] [Google Scholar]
- 5.Cumming BD, McElwain D, Upton Z. 2009. A mathematical model of wound healing and subsequent scarring. J. R. Soc. Interface 7, 19–34. ( 10.1098/rsif.2008.0536) [DOI] [PMC free article] [PubMed] [Google Scholar]
- 6.Sherratt JA, Murray JD. 1990. Models of epidermal wound healing. Proc. R. Soc. Lond. B 241, 29–36. ( 10.1098/rspb.1990.0061) [DOI] [PubMed] [Google Scholar]
- 7.Tranquillo RT, Murray J. 1992. Continuum model of fibroblast-driven wound contraction: inflammation-mediation. J. Theor. Biol. 158, 135–172. ( 10.1016/S0022-5193(05)80715-5) [DOI] [PubMed] [Google Scholar]
- 8.Pettet G, Byrne H, McElwain D, Norbury J. 1996. A model of wound-healing angiogenesis in soft tissue. Math. Biosci. 136, 35–63. ( 10.1016/0025-5564(96)00044-2) [DOI] [PubMed] [Google Scholar]
- 9.Tepole AB, Kuhl E. 2013. Systems-based approaches toward wound healing. Pediatr. Res. 73, 553 ( 10.1038/pr.2013.3) [DOI] [PMC free article] [PubMed] [Google Scholar]
- 10.Valero C, Javierre E, García-Aznar J, Menzel A, Gomez-Benito M. 2015. Challenges in the modeling of wound healing mechanisms in soft biological tissues. Ann. Biomed. Eng. 43, 1654–1665. ( 10.1007/s10439-014-1200-8) [DOI] [PubMed] [Google Scholar]
- 11.Murphy KE, Hall CL, Maini PK, McCue SW, McElwain DS. 2012. A fibrocontractive mechanochemical model of dermal wound closure incorporating realistic growth factor kinetics. Bull. Math. Biol. 74, 1143–1170. ( 10.1007/s11538-011-9712-y) [DOI] [PubMed] [Google Scholar]
- 12.Valero C, Javierre E, García-Aznar JM, Gómez-Benito MJ. 2014. A cell-regulatory mechanism involving feedback between contraction and tissue formation guides wound healing progression. PLoS ONE 9, e92774 ( 10.1371/journal.pone.0092774) [DOI] [PMC free article] [PubMed] [Google Scholar]
- 13.Schugart RC, Friedman A, Zhao R, Sen CK. 2008. Wound angiogenesis as a function of tissue oxygen tension: a mathematical model. Proc. Natl Acad. Sci. USA 105, 2628–2633. ( 10.1073/pnas.0711642105) [DOI] [PMC free article] [PubMed] [Google Scholar]
- 14.Valero C, Javierre E, García-Aznar J, Gómez-Benito M, Menzel A. 2015. Modeling of anisotropic wound healing. J. Mech. Phys. Solids 79, 80–91. ( 10.1016/j.jmps.2015.03.009) [DOI] [Google Scholar]
- 15.Callaghan T, Khain E, Sander LM, Ziff RM. 2006. A stochastic model for wound healing. J. Stat. Phys. 122, 909–924. ( 10.1007/s10955-006-9022-1) [DOI] [Google Scholar]
- 16.Tepole AB. 2017. Computational systems mechanobiology of wound healing. Comput. Methods Appl. Mech. Eng. 314, 46–70. ( 10.1016/j.cma.2016.04.034) [DOI] [Google Scholar]
- 17.Ateshian G, Humphrey J. 2012. Continuum mixture models of biological growth and remodeling: past successes and future opportunities. Annu. Rev. Biomed. Eng. 14, 97–111. ( 10.1146/annurev-bioeng-071910-124726) [DOI] [PubMed] [Google Scholar]
- 18.Menzel A, Kuhl E. 2012. Frontiers in growth and remodeling. Mech. Res. Commun. 42, 1–14. ( 10.1016/j.mechrescom.2012.02.007) [DOI] [PMC free article] [PubMed] [Google Scholar]
- 19.Ambrosi D. et al. 2011. Perspectives on biological growth and remodeling. J. Mech. Phys. Solids 59, 863–883. ( 10.1016/j.jmps.2010.12.011) [DOI] [PMC free article] [PubMed] [Google Scholar]
- 20.Humphrey JD. 2003. Continuum biomechanics of soft biological tissues. Proc. R. Soc. Lond. A 459, 3–46. ( 10.1098/rspa.2002.1060) [DOI] [Google Scholar]
- 21.Kuhl E, Garikipati K, Arruda EM, Grosh K. 2005. Remodeling of biological tissue: mechanically induced reorientation of a transversely isotropic chain network. J. Mech. Phys. Solids 53, 1552–1573. ( 10.1016/j.jmps.2005.03.002) [DOI] [Google Scholar]
- 22.Menzel A. 2007. A fibre reorientation model for orthotropic multiplicative growth. Biomech. Model. Mechanobiol. 6, 303–320. ( 10.1007/s10237-006-0061-y) [DOI] [PubMed] [Google Scholar]
- 23.Kroon M. 2010. A continuum mechanics framework and a constitutive model for remodelling of collagen gels and collagenous tissues. J. Mech. Phys. Solids 58, 918–933. ( 10.1016/j.jmps.2010.03.005) [DOI] [Google Scholar]
- 24.Sáez P, Pena E, Doblaré M, Martínez M. 2013. Hierarchical micro-adaptation of biological structures by mechanical stimuli. Int. J. Solids Struct. 50, 2353–2370. ( 10.1016/j.ijsolstr.2013.03.029) [DOI] [Google Scholar]
- 25.Humphrey J, Rajagopal K. 2002. A constrained mixture model for growth and remodeling of soft tissues. Math. Models Methods Appl. Sci. 12, 407–430. ( 10.1142/S0218202502001714) [DOI] [Google Scholar]
- 26.Ateshian GA. 2007. On the theory of reactive mixtures for modeling biological growth. Biomech. Model. Mechanobiol. 6, 423–445. ( 10.1007/s10237-006-0070-x) [DOI] [PMC free article] [PubMed] [Google Scholar]
- 27.Cyron C, Aydin R, Humphrey J. 2016. A homogenized constrained mixture (and mechanical analog) model for growth and remodeling of soft tissue. Biomech. Model. Mechanobiol. 15, 1389–1403. ( 10.1007/s10237-016-0770-9) [DOI] [PMC free article] [PubMed] [Google Scholar]
- 28.Latorre M, Humphrey JD. 2018. Critical roles of time-scales in soft tissue growth and remodeling. APL Bioeng. 2, 026108 ( 10.1063/1.5017842) [DOI] [PMC free article] [PubMed] [Google Scholar]
- 29.Kachanov L. 1958. Time of the rupture process under creep conditions. Izy Akad. Nank. SSR Otd Tech. Nauk. 8, 26–31. [Google Scholar]
- 30.Waffenschmidt T, Polindara C, Menzel A, Blanco S. 2014. A gradient-enhanced large-deformation continuum damage model for fibre-reinforced materials. Comput. Methods Appl. Mech. Eng. 268, 801–842. ( 10.1016/j.cma.2013.10.013) [DOI] [Google Scholar]
- 31.Dimitrijevic B, Hackl K. 2008. A method for gradient enhancement of continuum damage models. Tech. Mech. 28, 43–52. [Google Scholar]
- 32.Dimitrijevic B, Hackl K. 2011. A regularization framework for damage–plasticity models via gradient enhancement of the free energy. Int. J. Numer. Methods Biomed. Eng. 27, 1199–1210. ( 10.1002/cnm.1350) [DOI] [Google Scholar]
- 33.Ferreira J, Parente M, Jabareen M, Jorge RN. 2017. A general framework for the numerical implementation of anisotropic hyperelastic material models including non-local damage. Biomech. Model. Mechanobiol. 16, 1119–1140. ( 10.1007/s10237-017-0875-9) [DOI] [PubMed] [Google Scholar]
- 34.Fernández J, García-Aznar J, Martínez R. 2012. Numerical analysis of a diffusive strain-adaptive bone remodelling theory. Int. J. Solids Struct. 49, 2085–2093. ( 10.1016/j.ijsolstr.2012.04.009) [DOI] [Google Scholar]
- 35.He Y, Zuo D, Hackl K, Yang H, Mousavi SJ, Avril S. 2019. Gradient-enhanced continuum models of healing in damaged soft tissues. Biomech. Model. Mechanobiol. 18, 1443–1460. [DOI] [PubMed] [Google Scholar]
- 36.Braeu F, Seitz A, Aydin R, Cyron C. 2017. Homogenized constrained mixture models for anisotropic volumetric growth and remodeling. Biomech. Model. Mechanobiol. 16, 889–906. ( 10.1007/s10237-016-0859-1) [DOI] [PubMed] [Google Scholar]
- 37.Valentin A, Humphrey JD, Holzapfel GA. 2013. A finite element-based constrained mixture implementation for arterial growth, remodeling, and adaptation: theory and numerical verification. Int. J. Numer. Methods Biomed. Eng. 29, 822–849. ( 10.1002/cnm.2555) [DOI] [PMC free article] [PubMed] [Google Scholar]
- 38.Nolan D, Gower A, Destrade M, Ogden R, McGarry J. 2014. A robust anisotropic hyperelastic formulation for the modelling of soft tissue. J. Mech. Behav. Biomed. Mater. 39, 48–60. ( 10.1016/j.jmbbm.2014.06.016) [DOI] [PubMed] [Google Scholar]
- 39.Simo JC, Ju J. 1987. Strain- and stress-based continuum damage models-i. Formulation. Int. J. Solids Struct. 23, 821–840. ( 10.1016/0020-7683(87)90083-7) [DOI] [Google Scholar]
- 40.Humphrey JD, Dufresne ER, Schwartz MA. 2014. Mechanotransduction and extracellular matrix homeostasis. Nat. Rev. Mol. Cell Biol. 15, 802 ( 10.1038/nrm3896) [DOI] [PMC free article] [PubMed] [Google Scholar]
- 41.Badel P, Avril S, Sutton MA, Lessner SM. 2014. Numerical simulation of arterial dissection during balloon angioplasty of atherosclerotic coronary arteries. J. Biomech. 47, 878–889. ( 10.1016/j.jbiomech.2014.01.009) [DOI] [PMC free article] [PubMed] [Google Scholar]
- 42.Famaey N, Sommer G, Vander Sloten J, Holzapfel GA. 2012. Arterial clamping: finite element simulation and in vivo validation. J. Mech. Behav. Biomed. Mater. 12, 107–118. ( 10.1016/j.jmbbm.2012.03.010) [DOI] [PubMed] [Google Scholar]
- 43.Xie Y, Liao X, Zhang J, Yang F, Fan Z. 2018. Novel chitosan hydrogels reinforced by silver nanoparticles with ultrahigh mechanical and high antibacterial properties for accelerating wound healing. Int. J. Biol. Macromol. 119, 402–412. ( 10.1016/j.ijbiomac.2018.07.060) [DOI] [PubMed] [Google Scholar]
- 44.Avril S, Evans S. 2017. Material parameter identification and inverse problems in soft tissue biomechanics. Cham, Switzerland: Springer. [Google Scholar]
- 45.Lally C, Dolan F, Prendergast P. 2005. Cardiovascular stent design and vessel stresses: a finite element analysis. J. Biomech. 38, 1574–1581. ( 10.1016/j.jbiomech.2004.07.022) [DOI] [PubMed] [Google Scholar]
- 46.Mousavi SJ, Farzaneh S, Avril S. 2018. Computational predictions of damage propagation preceding dissection of ascending thoracic aortic aneurysms. Int. J. Numer. Methods Biomed. Eng. 34, e2944 ( 10.1002/cnm.2944) [DOI] [PubMed] [Google Scholar]
Associated Data
This section collects any data citations, data availability statements, or supplementary materials included in this article.
Supplementary Materials
Data Availability Statement
The data supporting this article have been uploaded as part of the electronic supplementary material.


