Abstract
Background
The goal of this study was to review relevant case-control studies to determine the association of tumor necrosis factor-α (TNF-α) gene polymorphisms and coronary artery disease (CAD) susceptibility.
Methods
Using appropriate keywords, we identified relevant studies using PubMed, Cochrane, Embase, CNKI, VANFUN, and VIP. Key pertinent sources in the literature were also reviewed, and all articles published through April 2019 were considered for inclusion. Based on eligible studies, we performed a meta-analysis of association between 308G/A, 238G/A, 857C/T, 863C/A and 1031 T/C polymorphisms in TNF-α and risk of CAD.
Results
We found 25 studies that were consistent with this meta-analysis, including 7697 patients in the CAD group and 9655 control patients. TNF-α 308G/A locus A showed no significant association with CAD susceptibility by the five models in the analysis of the overall population, European, African, South Asian, and North Asian patients. TNF-α 863C/A locus A and 1031 T/C locus C exhibited no significant association with CAD susceptibility. TNF-α 238G/A locus A had no significant association with CAD susceptibility in the overall population. However, TNF-α 238G/A locus A showed significant association with higher CAD susceptibility in the subgroup of Europeans and north Asians. TNF-α 857C/T locus T had no significant association with CAD susceptibility in the analysis of the overall population and Europeans. In the north Asian population, TNF-α 857C/T locus T was associated with lower CAD susceptibility by the heterozygote model.
Conclusion
TNF-α 308G/A, 857C/T, 863C/A, and 1031 T/C has no significant association with CAD susceptibility. TNF-α 238G/A locus A has significant association with CAD susceptibility in Europeans and north Asians, but has no significant association in the overall population. Studies with a larger sample size are required to confirm the association between TNF-α 238G/A and CAD susceptibility.
Keywords: Tumor necrosis factor-α, Gene polymorphisms, Coronary artery disease, Meta-analysis
Background
Coronary artery disease (CAD) refers to a heart disease caused by ischemia and hypoxia of myocardial cells following coronary artery stenosis or blockage due to coronary atherosclerosis (AS). Globally, CAD is an important cause of mortality and morbidity, with approximately 9 million deaths between 2007 and 2017 [1]. At present, the major risk factors for CAD confirmed in clinical studies include age, gender, poor diet and lifestyle habits, metabolic syndrome (including obesity or overweight, hypertension, type 1 or type 2 diabetes and dyslipidemia), smoking, drinking, psychosocial factors and genetic factors. Studies [2, 3] showed that the risk of developing CAD in an individual is modulated by an interplay between genetic and lifestyle factors. In the future, genetic testing can be expected to enable precision medicine approaches by identifying subgroups of patients at increased risk of CAD or those with a specific driving pathophysiology in whom a therapeutic or preventive approach is most useful.
Tumor necrosis factor (TNF) is a proinflammatory cytokine in vivo with extensive biological activities. Human TNF gene, located in the short arm of chromosome 6, is a 7 kb DNA sequence composed of TNFA and TNFB, encoding TNF-α and TNF-β, respectively, each containing 4 exons and 3 introns. At present, many scholars agree that there is an interactive feedback loop between acute or chronic inflammatory reactions, the dynamics of atherosclerotic plaques, platelet aggregation, activation of the coagulation system and lipid metabolism disorders. Inflammatory response may be an important trigger mechanism, and there are many kinds of inflammatory biomarkers in serum, including C-reactive protein, intercellular adhesion molecule, p-selectin, amyloid A protein, fibrinogen, e-selectin, pregnancy-related plasma protein-a, serum interleukin-6, and TNF-α [4–6]. Studies have shown that the presence of TNF-α gene polymorphism may affect gene transcription and expression levels, and is associated with a variety of diseases such as rheumatoid arthritis, type 1 diabetes, type 2 diabetes, ankylosing spondylitis, sarcoidosis, and silicosis [7–9]. The aim of this study was to perform a meta-analysis of all available literature to obtain updated evidence about association between TNF-α polymorphisms and CAD susceptibility.
Methods
Search strategy
To identify studies pertaining to the associations between 308G/A, 238G/A, 857C/T, 863C/A and 1031 T/C polymorphisms in TNF-α and risk of CAD, we reviewed the Cochrane library, PubMed, Embase, CNKI, VANFUN, and VIP databases for relevant articles published through April 2019. We also reviewed the references of all identified articles to look for additional studies. Search terms were as follows: gene polymorphisms, gene, polymorphism, variant, genotype, tumor necrosis factor-α, TNF-α, coronary artery disease, CAD, angina, myocardial infarction, ischemic heart disease, tumor necrosis factor and TNF. These terms were used in combination with “AND” or “OR”. This literature review was performed independently by two investigators, with a third resolving any disputes as needed. The detailed search strategy of PubMed: (“gene polymorphisms” or “gene” or “polymorphism” or “variant” or “genotype”) and (“tumor necrosis factor-α” or “TNF-α” or “tumor necrosis factor” or “TNF”) and (“coronary artery disease” or “CAD” or “angina” or “myocardial infarction” or “ischemic heart disease”) AND Humans [Mesh]Search.
Following the PICOS (Participants, Interventions, Comparisons, Outcomes and Study design) principle, the key search terms included (P) patients with CAD; (I) detection the gene polymorphisms of TNF-α; (C/O) compare the gene polymorphisms of TNF-α between the CAD group and the control group; (S) case-control studies or cohort study.
Study selection criteria
Eligible studies met the following criteria: [1] case-control or cohort studies [2]; the subjects in the case group were patients with CAD [3]; the participants in the control group did not have CAD [4]; 308G/A, 238G/A, 857C/T, 863C/A and 1031 T/C of TNF-α were studied; 4) English or Chinese language.
Studies were excluded for meeting the following criteria: [1] duplicate articles or results [2]; apparen tdata errors [3]; case reports, theoretical research, conference reports, systematic reviews, meta-analyses, and other forms of research or comment not designed in a randomized controlled manner [4]; irrelevant outcomes [5]; lack of a control group.
Two investigators independently determined whether studies met the inclusion criteria, with a third resolving any disputes as needed.
Data extraction and quality assessment
For each included study, two categories of information were extracted: basic information and primary clinical outcomes. Basic information relevant to this meta-analysis included: author names, year of publication, country, ethnicity, and sample size. Primary outcomes relevant to this analysis included frequency of genotypes (308G/A, 238G/A, 857C/T, 863C/A and1031T/C of TNF-α) in the CAD group and the control group. This data extraction was performed independently by two investigators, with a third resolving any disputes as needed.
We used Newcastle–Ottawa Scale (NOS) to assess the quality of eligible studies. The version of case-control studies included a set of questions: adequacy of case definition, representativeness of cases, selection of controls, definition of controls, matched age and sex, additional factors, ascertainment of exposure, case and controls (the same ascertainment method), cases and control (the same non-response rate).
Statistical analysis
STATA v12.0 (TX, USA) was used for all analyses. Heterogeneity in study results was assessed using chi-squared and I2tests and appropriate analytic models (fixed-effects or random-effects) were determined. A chi-squared P ≤ 0.05 and an I2 > 50% indicated high heterogeneity and the random-effects model was used in this case. A chi-squared P > 0.05 and an I2 ≤ 50% indicated acceptable heterogeneity and the fixed-effects model was used. Egger’s test and Begg’s test were used to determine whether there was publication bias. Under ideal conditions (such as random mating, no selection, mutation, or migration), if the population is in line with the Hardy-Weinberg equilibrium (HWE), the proportion of certain characteristic genes will remain unchanged in inheritance. HWE is closely related to genotyping quality. HWE is a common hypothesis. In the meta-analysis of genetic association study, it is necessary to test whether the genotype distribution of the control group conforms to HWE. If the HWE genetic balance test was not provided in the original text or not performed on the control group, we used Stata v12.0 to carry out manual detection and extracted the corresponding results (P value). Five commonly used gene models were selected for meta-analysis: the allelic model (A vs. C); homozygote model (AA vs. CC); heterozygote model (AC vs. CC); dominant model (AA + ACvs.CC); regressive model (AA vs. AC+ CC). OR and 95% CI were used to analyze all the indexes.
Results
Overview of included studies
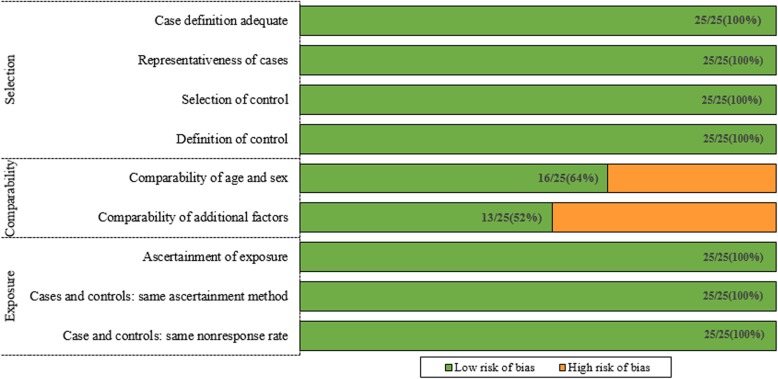
We reviewed a total of 1115 articles identified by our initial keyword search, of which 1026 were excluded following title/abstract review. The complete full texts of the remaining 89 articles were assessed, excluding 64 articles that did not meet the study inclusion criteria. Reasons for exclusion of these studies were theoretical research [3], lack of clinical outcomes [10], duplicate articles [5], and lack of a control group [11]. We ultimately identified a total of 25 case-control studies [10–34] that met the inclusion criteria for this meta-analysis, including 7697 patients in the CAD group and 9655 in the control group. The study selection process is outlined in Fig. 1. Table 1 summarizes the basic information for each study, including author names, year of publication, country, ethnicity, and sample size. Seven studies involved Eurpeans, 14 involved north Asians, 3 involved south Asians, 2 involved Africans, and 1 involved North Americans. The risk of bias assessed by NOS is presented in Fig. 2.
Fig. 1.
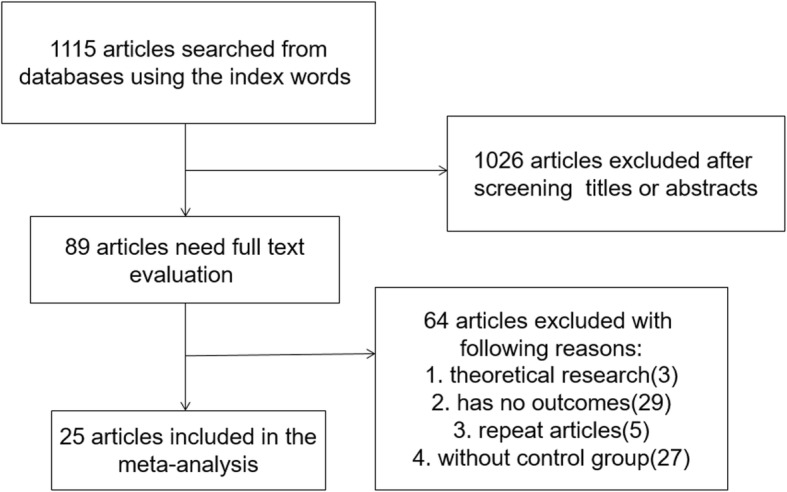
Literature search and selection strategy
Table 1.
The basic characteristics description of included studies
| Study | Country | No. of patients | Age | Gender | Genetic testing method | Ethnicity | |||
|---|---|---|---|---|---|---|---|---|---|
| Case group | Control group | Case group | Control group | Case group | Control group | ||||
| S. M. Herrmann et al. 1998 a | Northern Ireland | 641 | 710 | – | – | – | – | Polymerase chain reaction-single-strand conformation polymorphism | European |
| S. M. Herrmann et al. 1998 b | France | 446 | 531 | – | – | – | – | Polymerase chain reaction-single-strand conformation polymorphism | European |
| Li Yan et al. 2004 | China | 210 | 186 | Polymerase chain reaction-single-strand conformation polymorphism | North Asian | ||||
| A.M. Bennet et al. 2006 | Sweden | 1213 | 1561 | 52~67 | 53~68 | 852 M | 1054 M | – | European |
| Liu Yan et al. 2011 | China | 438 | 330 | – | – | – | – | high resolution melting | North Asian |
| Zhang Lei et al. 2011 | China | 107 | 115 | – | – | – | – | high resolution melting | North Asian |
| Ho-Chan Cho et al. 2013 | South Korea | 197 | 404 | 61.4 | 62.01 | 130 M | 263 M | – | North Asian |
| Qi Xiaoming et al. 2014 | China | 207 | 274 | – | – | – | – | high resolution melting | North Asian |
| Liu Yan et al. 2009 | China | 286 | 202 | – | – | – | – | matrix assisted laser desorption ionization time | North Asian |
| Liang Hao et al. 2011 | China | 121 | 138 | – | – | 84 M | 92 M | Polymerase chain reaction-single-strand conformation polymorphism | North Asian |
| Xiang Xiaping et al. 2004 | China | 162 | 182 | – | – | – | – | Enzyme - linked immunosorbent assay with double antibody sandwich | North Asian |
| Li Yan et al. 2003 | China | 112 | 158 | – | – | – | – | – | North Asian |
| Sun Yujie et al. 2007 | China | 121 | 115 | 64.9 | 50.4 | 84 M | 74 M | Polymerase chain reaction-single-strand conformation polymorphism | North Asian |
| Pan Min et al. 2008 | China | 90 | 115 | 65.6 | 64.06 | 65 M | 70 M | Polymerase chain reaction-single-strand conformation polymorphism | North Asian |
| Zhao Xiaolei et al. 2015 | China | 783 | 749 | 64.82 | 59.74 | 497 M | 477 M | – | North Asian |
| Lakhdar Ghazouani et al. 2009 | Tunisia | 418 | 406 | 58.1 | 56.7 | 87F | 107F | – | African |
| Indranil Banerjee et al. 2007 | India | 210 | 232 | 59 | 56 | 166 M | 166 M | Polymerase chain reaction-single-strand conformation polymorphism | South Asian |
| Elena Sandoval-Pinto et al. 2016 | Mexico | 251 | 164 | 65 | 58 | 187 M | 71 M | Enzyme - linked immunosorbent assay with double antibody sandwich | North American |
| Yuting Cheng et al. 2015 | China | 247 | 304 | 61.13 | 61.31 | 120F | 152F | – | North Asian |
| I. SBARSI et al. 2007 | Italy | 248 | 241 | 61.8 | – | 197 M | – | Polymerase chain reaction-single-strand conformation polymorphism | European |
| Robertina Giacconi et al. 2006 | Italy | 105 | 190 | 71.9 | 76 | 72 M | 123 M | – | European |
| R. A. Allen et al. 2001 | UK | 180 | 250 | 59~63 | 37 | 117 M | 124 M | – | European |
| P. E. Morange et al. 2008 | Germany | 136 | 1264 | 67 | 61 | 100 M | 923 M | – | European |
| Liping Hou et al. 2009 | China | 804 | 905 | – | – | – | – | – | North Asian |
| Aparna A. Bhanushali et al. 2013 | India | 100 | 150 | 48 | 50 | 80 M | 70 M | – | South Asian |
| Gul Zareen Asifa et al. 2013 | Pakistan | 310 | 310 | 54.3 | 53.2 | – | – | – | South Asian |
F:female, M: male
Fig. 2.
Risk of bias by domain (in bold) and question in twenty-six case-control studies using the Newcastle–Ottawa Scale
Meta-analysis of TNF-α308G/a polymorphisms and CAD susceptibility
In total, 19 studies with 7036 patients in the CAD group and 8940 controls reported on the association between TNF-α 308G/A and CAD susceptibility. For studies without significant heterogeneity (chi-squared P > 0.05 and I2 < 50%), the fixed-effects model was chosen to analyze the all the comparison models except the dominant model and allelic model in the subgroup analysis of South Asians. The results of Begg’s test (p > 0.05) suggested that there was no significant publication bias among the study results.
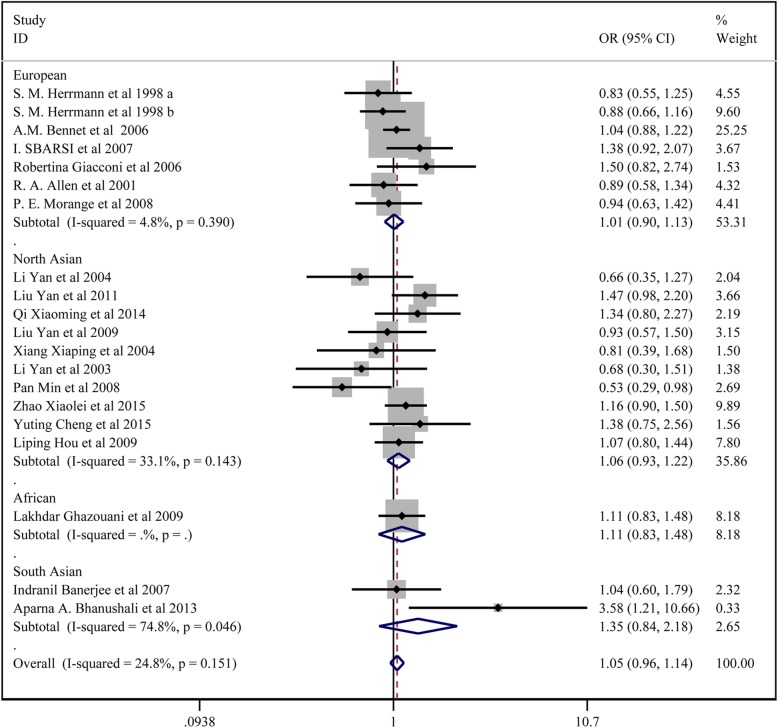
The results showed that TNF-α 308G/A locus A had no significant association with CAD susceptibility: the allelic model (A vs. G) (OR:1.047, 95% CI:0.973–1.126); the homozygote model (AA vs. GG) (OR:1.106,95% CI:0.888–1.377); the dominant model (AA + GA vs. GG) (OR: 1.046,95% CI:0.963–1.136); the regressive model (AA vs.GA + GG) (OR: 1.102,95% CI: 0.886–1.370); the heterozygote model (GA vs. GG) (OR: 1.037,95%CI:0.950–1.131). In the subgroup analysis, there was no significant association between TNF-α 308G/A locus A and CAD by the five models.
All the above results are presented in Fig. 3, Fig. 4 and Table 2.
Fig. 3.
Forest plot for the dominant model of TNF-α 308G/A polymorphisms associated with CAD
Fig. 4.
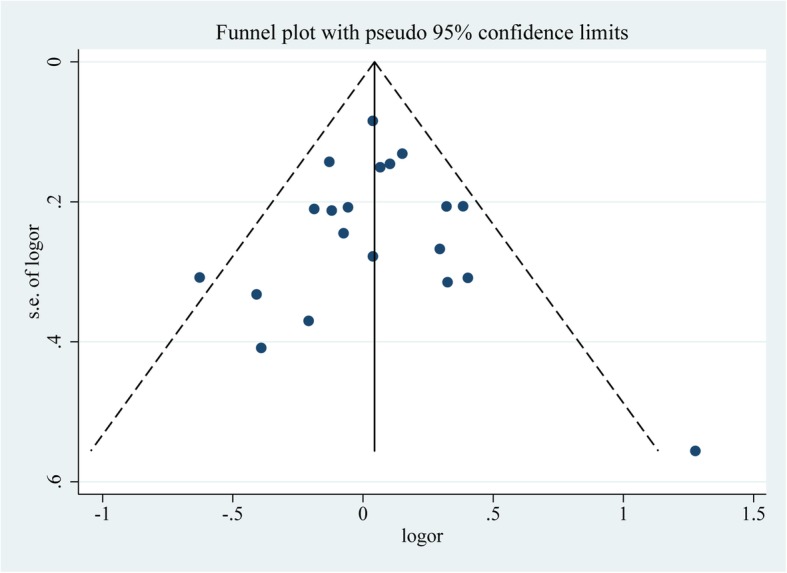
Funnel plot analysis of the included studies onTNF-α 308G/A polymorphisms
Table 2.
Meta-analysis of TNF-α 308G/A polymorphisms and CAD susceptibility
| Genetic Model | Subgroup analysis | N (case/control) | OR(95% CI) | P* | I2 | P# | P value | |
|---|---|---|---|---|---|---|---|---|
| Begg | Egger | |||||||
| AA vs GG + GA | ||||||||
| overall | 6522/8196 | 1.102 (0.886,1.370) | 0.209 | 22.0% | 0.383 | 0.322 | 0.106 | |
| European | 2472/4076 | 1.118 (0.810,1.544) | 0.087 | 45.7% | 0.496 | 0.881 | 0.102 | |
| North Asian | 3322/3332 | 1.135 (0.821,1.570) | 0.349 | 10.0% | 0.443 | 0.624 | 0.907 | |
| African | 418/406 | 0.705 (0.320,1.553) | – | – | 0.385 | – | – | |
| South Asian | 310/382 | 3.880 (0.401,37.525) | 0.894 | 0.0% | 0.242 | 0.317 | – | |
| HWE | 5814/7737 | 1.096 (0.835,1.438) | 0.210 | 23.1% | 0.510 | 0.329 | 0.042 | |
| NO HWE | 708/459 | 1.112 (0.773,1.601) | 0.127 | 57.1% | 0.567 | 0.317 | – | |
| AA+GA vs GG | ||||||||
| overall | 6522/8196 | 1.046(0.963,1.136) | 0.151 | 24.8% | 0.290 | 0.770 | 0.973 | |
| European | 2472/4076 | 1.008 (0.899,1.130) | 0.390 | 4.8% | 0.890 | 0.881 | 0.804 | |
| North Asian | 3322/3332 | 1.065 (0.927,1.222) | 0.143 | 33.1% | 0.374 | 0.128 | 0.138 | |
| African | 418/406 | 1.109 (0.833,1.476) | – | – | 0.478 | – | – | |
| South Asian | 310/382 | 1.352 (0.839,2.179) | 0.046 | 74.8% | 0.216 | 0.317 | – | |
| HWE | 5814/7737 | 1.033 (0.948,1.126) | 0.175 | 23.6% | 0.459 | 0.791 | 0.972 | |
| NO HWE | 708/459 | 1.219 (0.896,1.658) | 0.152 | 51.3% | 0.208 | 0.317 | – | |
| AA vs GG | ||||||||
| overall | 6522/8196 | 1.106 (0.888,1.377) | 0.226 | 20.5% | 0.367 | 0.373 | 0.132 | |
| European | 2472/4076 | 1.105 (0.798,1.530) | 0.118 | 41.0% | 0.548 | 0.453 | 0.097 | |
| North Asian | 3322/3332 | 1.147 (0.829,1.587) | 0.274 | 22.1% | 0.407 | 0.624 | 0.822 | |
| African | 418/406 | 0.739 (0.333,1.638) | – | – | 0.456 | – | – | |
| South Asian | 310/382 | 4.018 (0.415,38.903) | 0.869 | 0.0% | 0.230 | 0.317 | – | |
| HWE | 5814/7737 | 1.088 (0.828,1.431) | 0.234 | 20.8% | 0.545 | 0.329 | 0.048 | |
| NO HWE | 708/459 | 1.138 (0.790,1.641) | 0.121 | 58.5% | 0.488 | 0.317 | – | |
| GA vs GG | ||||||||
| overall | 6522/8196 | 1.037 (0.950,1.131) | 0.258 | 15.7% | 0.418 | 0.673 | 0.958 | |
| European | 2472/4076 | 0.999 (0.887,1.124) | 0.352 | 10.1% | 0.981 | 0.881 | 0.707 | |
| North Asian | 3322/3332 | 1.049 (0.903,1.218) | 0.288 | 16.9% | 0.531 | 0.531 | 0.398 | |
| African | 418/406 | 1.154 (0.859,1.549) | – | – | 0.179 | – | – | |
| South Asian | 310/382 | 1.281 (0.790,2.076) | 0.061 | 71.4% | 0.315 | 0.317 | – | |
| HWE | 5814/7737 | 1.027 (0.940,1.122) | 0.226 | 19.1% | 0.557 | 0.850 | 0.671 | |
| NO HWE | 708/459 | 1.389 (0.839,2.298) | 0.641 | 0.0% | 0.201 | 0.317 | – | |
| A vs G | ||||||||
| overall | 6522/8196 | 1.047 (0.973,1.126) | 0.065 | 34.7% | 0.222 | 0.721 | 0.673 | |
| European | 2472/4076 | 1.017 (0.920,1.124) | 0.303 | 16.6% | 0.741 | 0.453 | 0.312 | |
| North Asian | 3322/3332 | 1.071 (0.947,1.211) | 0.071 | 43.1% | 0.276 | 0.128 | 0.120 | |
| African | 418/406 | 1.043 (0.816,1.332) | – | – | 0.636 | – | – | |
| South Asian | 310/382 | 1.400 (0.887,2.210) | 0.037 | 77.0% | 0.149 | 0.317 | – | |
| HWE | 5814/7737 | 1.034 (0.957,1.116) | 0.122 | 28.9% | 0.399 | 0.850 | 0.628 | |
| NO HWE | 708/459 | 1.172 (0.927,1.481) | 0.039 | 76.6% | 0.185 | 0.317 | – | |
*P value of Heterogeneity chi-squared
#P value of Pooled statistic
Meta-analysis of TNF-α 238G/a polymorphisms and CAD susceptibility
In total, 12 studies with 5167 patients in the CAD group and 7103 controls reported on the association of TNF-α 238G/A and CAD susceptibility. For studies without significant heterogeneity (chi-squared P > 0.05 and I2 < 50%), the fixed-effects model was chosen to analyze the all the comparison models except the dominant model and the heterozygote model in the subgroup analysis of the overall population, north Asians and HWE, and the allelic model in the subgroup analysis of HWE. The results of Begg’s test (p > 0.05) suggested that there was no significant publication bias among the study results.
The results showed that TNF-α 238G/A locus A had no significant association with CAD susceptibility: the allelic model (A vs. G) (OR:1.088, 95% CI:0.950–1.244); the homozygote model (AA vs. GG) (OR:1.506, 95% CI:0.835–2.715); the dominant model (AA + GA vs. GG) (OR: 1.072, 95% CI:0.931–1.235); the regressive model (AA vs. GA + GG) (OR: 1.437, 95% CI: 0.821–2.662); the heterozygote model (GA vs GG) (OR: 1.165, 95% CI:0.914–1.485).
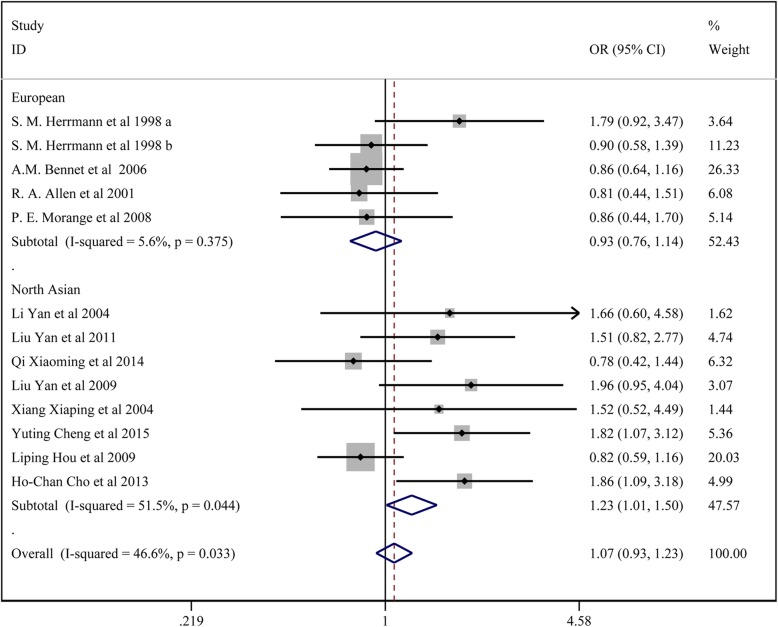
In the subgroup analysis, TNF-α 238G/A locus A showed significant association with higher CAD susceptibility in the subgroup of Europeans: the homozygote model (AA vs. GG) (OR:2.961, 95% CI:1.113–7.9879); the regressive model (AA vs. GA + GG) (OR: 2.985, 95% CI: 1.121–7.946). TNF-α 238G/A locus A had significant association with higher CAD susceptibility in the subgroup of HWE: the homozygote model (AA vs. GG) (OR:2.838, 95% CI:1.260–6.394); the regressive model (AA vs. GA + GG) (OR: 2.832, 95% CI: 1.258–6.375).TNF-α 238G/A locus A exhibited significant association with higher CAD susceptibility in the subgroup of North Asian: the dominant model (AA + GA vs. GG) (OR:1.231, 95% CI:1.010–1.500).TNF-α 238G/A locus A displayed significant association with higher CAD susceptibility in the subgroup of no HWE: the dominant model (AA + GA vs. GG) (OR: 1.686, 95% CI:1.060–2.681); the heterozygote model (GA vs. GG) (OR: 2.265, 95% CI:1.307–3.926).
All the above results are presented in Fig. 5 and Table 3.
Fig. 5.
Forest plot for the dominant model of TNF-α 238G/A polymorphisms associated with CAD
Table 3.
Meta-analysis of TNF-α 238G/A polymorphisms and CAD susceptibility
| Genetic Model | Subgroup analysis | N (case/control) | OR(95%CI) | P* | I2 | P# | P value | |
|---|---|---|---|---|---|---|---|---|
| Begg | Egger | |||||||
| AA vs GG + GA | ||||||||
| overall | 4827/6875 | 1.478 (0.821,2.662) | 0.624 | 0.0% | 0.193 | 0.161 | 0.034 | |
| European | 2108/3686 | 2.985 (1.121,7.946) | 0.691 | 0.0% | 0.209 | 0.624 | 0.902 | |
| North Asian | 2522/2785 | 0.947 (0.443,2.023) | 0.659 | 0.0% | 0.888 | 0.188 | 0.038 | |
| HWE | 3934/5941 | 2.832 (1.258,6.375) | 0.903 | 0.0% | 0.012 | 0.677 | 0.848 | |
| NO HWE | 696/530 | 0.602 (0.236,1.537) | 0.721 | 0.0% | 0.289 | 0.317 | – | |
| AA+GA vs GG | ||||||||
| overall | 4827/6875 | 1.072 (0.931,1.235) | 0.033 | 46.6% | 0.331 | 0.300 | 0.041 | |
| European | 2108/3686 | 0.929 (0.758,1.138) | 0.375 | 5.6% | 0.475 | 0.327 | 0.440 | |
| North Asian | 2522/2785 | 1.231 (1.010,1.500) | 0.044 | 51.5% | 0.040 | 0.621 | 0.148 | |
| HWE | 3934/5941 | 1.020 (0.879,1.184) | 0.052 | 45.0% | 0.791 | 0.186 | 0.110 | |
| NO HWE | 696/530 | 1.686 (1.060,2.681) | 0.586 | 0.0% | 0.027 | 0.317 | – | |
| AA vs GG | ||||||||
| overall | 4827/6875 | 1.506 (0.835,2.715) | 0.658 | 0.0% | 0.173 | 0.161 | 0.033 | |
| European | 2108/3686 | 2.961 (1.113,7.879) | 0.691 | 0.0% | 0.030 | 0.624 | 0.927 | |
| North Asian | 2522/2785 | 0.980 (0.458,2.097) | 0.680 | 0.0% | 0.958 | 0.188 | 0.037 | |
| HWE | 3934/5941 | 2.838 (1.260,6.394) | 0.934 | 0.0% | 0.012 | 0.677 | 0.893 | |
| NO HWE | 696/530 | 0.629 (0.246,1.608) | 0.705 | 0.0% | 0.333 | 0.317 | – | |
| GA vs GG | ||||||||
| overall | 4827/6875 | 1.165 (0.914,1.485) | 0.007 | 56.2% | 0.218 | 0.100 | 0.040 | |
| European | 2108/3686 | 0.890 (0.706,1.121) | 0.343 | 11.1% | 0.322 | 0.327 | 0.391 | |
| North Asian | 2522/2785 | 1.409 (0.981,2.024) | 0.014 | 60.2% | 0.063 | 0.805 | 0.160 | |
| HWE | 3934/5941 | 1.053 (0.837,1.325) | 0.039 | 47.6% | 0.659 | 0.186 | 0.156 | |
| NO HWE | 696/530 | 2.265 (1.307,3.926) | 0.651 | 0.0% | 0.004 | 0.317 | – | |
| A vs G | ||||||||
| overall | 4827/6875 | 1.088 (0.950,1.244) | 0.096 | 35.8% | 0.222 | 0.246 | 0.040 | |
| European | 2108/3686 | 0.979 (0.807,1.189) | 0.416 | 0.0% | 0.833 | 0.142 | 0.509 | |
| North Asian | 2522/2785 | 1.201 (0.995,1.450) | 0.084 | 44.1% | 0.057 | 0.805 | 0.117 | |
| HWE | 3934/5941 | 1.055 (0.914,1.217) | 0.077 | 40.7% | 0.465 | 0.243 | 0.087 | |
| NO HWE | 696/530 | 1.377 (0.918,2.065) | 0.538 | 0.0% | 0.122 | 0.317 | – | |
*P value of Heterogeneity chi-squared
#P value of Pooled statistic
Meta-analysis of TNF-α 857C/T polymorphisms and CAD susceptibility
In total, 9 studies with3843 patients in the CAD group and 5616 in the control group reported on the association of TNF-α 857C/T and CAD susceptibility. For studies with no significant heterogeneity (chi-squared test P > 0.05 and I2 < 50%), the fixed-effects model was chosen to analyze all the comparison models. The results of Begg’s test (p > 0.05) revealed no significant publication bias among the study results.
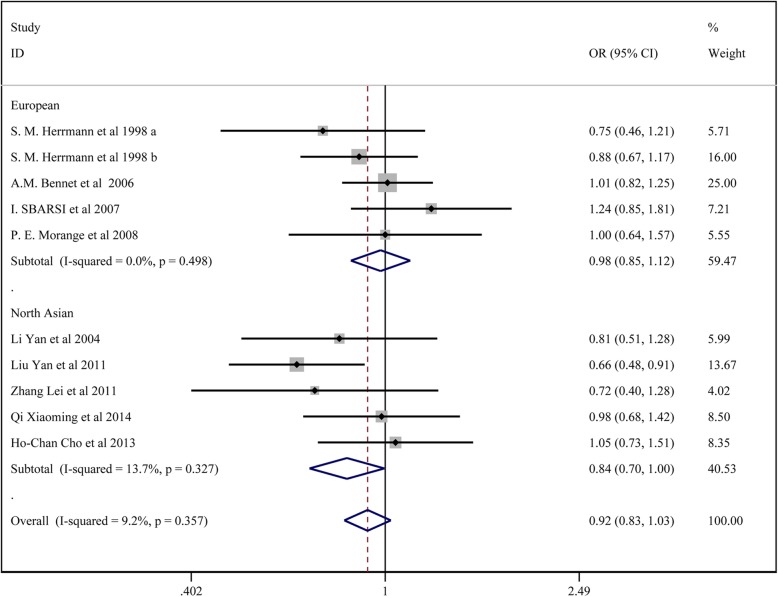
The results showed no significant association between TNF-α 857C/T locus T and CAD susceptibility: the allelic model (T vs. C) (OR:0.949, 95% CI:0.862–1.045); the homozygote model (TT vs. CC) (OR:1.105, 95%CI:0.820–1.488); the dominant model (TT + CT vs. CC) (OR: 0.920, 95% CI:0.825–1.027); the regressive model (TTvs.CC+ CT) (OR: 1.124, 95% CI: 0.836–1.510); the heterozygote model (CT vs. CC) (OR: 0.904, 95% CI:0.807–1.012). In the subgroup analysis, there was no significant association between TNF-α 857C/T and CAD by the five models in Europeans, HWE and no HWE. In the north Asian population, TNF-α 857C/T locus T was associated with lower CAD susceptibility by the heterozygote model (CT vs. CC) (OR: 0.812, 95% CI:0.676–0.976), the dominant model (TT + CT vs. CC) (OR: 0.835, 95% CI:0.701–0.996);
All the above results are presented in Fig. 6 and Table 4.
Fig. 6.
Forest plot for the dominant model of TNF-α 857C/T polymorphisms associated with CAD
Table 4.
Meta-analysis of TNF-α 857C/T polymorphisms and CAD susceptibility
| Genetic Model | Subgroup analysis | N (case/control) | OR(95%CI) | P* | I2 | P# | P value | |
|---|---|---|---|---|---|---|---|---|
| Begg | Egger | |||||||
| TT vs CC + CT | ||||||||
| overall | 3494/5279 | 1.124 (0.836,1.510) | 0.437 | 0.0% | 0.440 | 1.000 | 0.769 | |
| European | 2139/3566 | 1.135 (0.753,1.710) | 0.752 | 0.0% | 0.546 | 0.624 | 0.577 | |
| North Asian | 1158/1309 | 1.112 (0.726,1.703) | 0.132 | 43.5% | 0.627 | 0.624 | 0.994 | |
| HWE | 1844/3078 | 1.230 (0.866,1.748) | 0.466 | 0.0% | 0.247 | 0.881 | 0.960 | |
| NO HWE | 1453/1797 | 0.901 (0.519,1.564) | 0.305 | 15.9% | 0.711 | 0.602 | 0.839 | |
| TT + CT vs CC | ||||||||
| overall | 3494/5279 | 0.920 (0.825,1.027) | 0.357 | 9.2% | 0.137 | 0.283 | 0.467 | |
| European | 2139/3566 | 0.978 (0.851,1.125) | 0.498 | 0.0% | 0.758 | 0.327 | 0.810 | |
| North Asian | 1158/1309 | 0.835 (0.701,0.996) | 0.327 | 13.7% | 0.045 | 0.624 | 0.992 | |
| HWE | 1844/3078 | 0.909 (0.793,1.041) | 0.230 | 26.1% | 0.167 | 0.881 | 0.641 | |
| NO HWE | 1453/1797 | 0.942 (0.784,1.132) | 0.428 | 0.0% | 0.524 | 0.117 | 0.006 | |
| TT vs CC | ||||||||
| overall | 3494/5279 | 1.105 (0.820,1.488) | 0.368 | 8.0% | 0.513 | 0.858 | 0.833 | |
| European | 2139/3566 | 1.140 (0.755,1.721) | 0.704 | 0.0% | 0.534 | 0.624 | 0.643 | |
| North Asian | 1158/1309 | 1.067 (0.693,1.644) | 0.109 | 47.1% | 0.767 | 0.624 | 0.972 | |
| HWE | 1844/3078 | 1.209 (0.848,1.724) | 0.383 | 5.8% | 0.295 | 0.881 | 0.996 | |
| NO HWE | 1453/1797 | 0.890 (0.511,1.547) | 0.291 | 19.1% | 0.679 | 0.602 | 0.872 | |
| CT vs CC | ||||||||
| overall | 3494/5279 | 0.904 (0.807,1.012) | 0.605 | 0.0% | 0.081 | 0.474 | 0.429 | |
| European | 2139/3566 | 0.966 (0.836,1.116) | 0.610 | 0.0% | 0.637 | 0.327 | 0.689 | |
| North Asian | 1158/1309 | 0.812 (0.676,0.976) | 0.649 | 0.0% | 0.026 | 1.000 | 0.695 | |
| HWE | 1844/3078 | 0.881 (0.765,1.015) | 0.466 | 0.0% | 0.080 | 0.652 | 0.632 | |
| NO HWE | 1453/1797 | 0.946 (0.782,1.145) | 0.513 | 0.0% | 0.569 | 0.602 | 0.247 | |
| T vs C | ||||||||
| overall | 3494/5279 | 0.949 (0.862,1.045) | 0.181 | 28.6% | 0.288 | 0.371 | 0.496 | |
| European | 2139/3566 | 0.994 (0.878,1.126) | 0.442 | 0.0% | 0.926 | 0.624 | 0.901 | |
| North Asian | 1158/1309 | 0.886 (0.762,1.032) | 0.108 | 47.2% | 0.119 | 1.000 | 0.718 | |
| HWE | 1844/3078 | 0.952 (0.846,1.071) | 0.109 | 42.2% | 0.416 | 0.652 | 0.796 | |
| NO HWE | 1453/1797 | 0.943 (0.798,1.114) | 0.330 | 9.7% | 0.490 | 0.117 | 0.223 | |
*P value of Heterogeneity chi-squared
#P value of Pooled statistic
Meta-analysis of TNF-α 863C/a polymorphisms and CAD susceptibility
In total, 10 studies with3225 patients in the CAD group and 4784 controls reported on the association of TNF-α 863C/A and CAD susceptibility. For studies with no significant heterogeneity (chi-squared test, P > 0.05 and I2 < 50%), the fixed-effects model was chosen to analyze the regressive model and homozygote model, while other models were analyzed using the random-effects model. The results of Begg’s test (p > 0.05) showed no significant publication bias in the results of the regressive model and homozygote model.
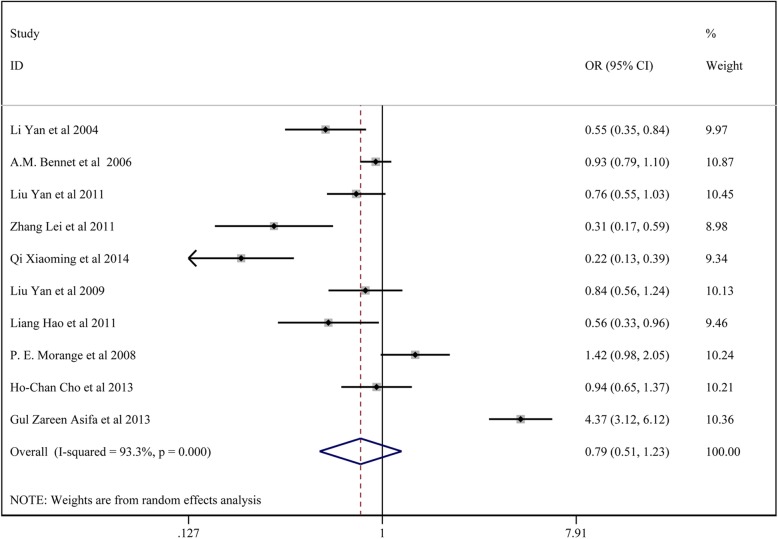
The results showed no significant association between TNF-α 863C/A locus A and CAD susceptibility: the allelic model (A vs. C) (OR:0.803, 95% CI:0.584–1.103); the homozygote model (AA vs. CC) (OR:0.838, 95% CI:0.612–1.145); the dominant model (AA + CA vs. CC) (OR: 0.793, 95% CI:0.512–1.227); the regressive model (AA vs.CA + CC) (OR:0.828, 95% CI: 0.608–1.129); the heterozygote model (CA vs. CC) (OR: 0.805, 95% CI:0.584–1.103).
All the above results are presented in Fig. 7 and Table 5.
Fig. 7.
Forest plot for the dominant model of TNF-α 863C/A polymorphisms associated with CAD
Table 5.
Meta-analysis of TNF-α 863C/A polymorphisms and CAD susceptibility
| Genetic Model | N (case/control) | OR(95%CI) | P* | I2 | P# | P value | |
|---|---|---|---|---|---|---|---|
| Begg | Egger | ||||||
| AA vs CC + CA | 3144/4491 | 0.828 (0.608,1.129) | 0.478 | 0.0% | 0.234 | 0.466 | 0.016 |
| AA+CA vs CC | 3144/4491 | 0.793 (0.512,1.227) | 0.000 | 93.3% | 0.298 | 0.020 | 0.390 |
| AA vs CC | 3144/4491 | 0.838 (0.612,1.145) | 0.450 | 0.0% | 0.267 | 0.348 | 0.035 |
| CA vs CC | 3144/4491 | 0.805 (0.513,1.265) | 0.000 | 93.3% | 0.347 | 0.032 | 0.426 |
| A vs C | 3144/4491 | 0.803 (0.584,1.103) | 0.000 | 90.6% | 0.176 | 0.012 | 0.204 |
*P value of Heterogeneity chi-squared
#P value of Pooled statistic
Meta-analysis of TNF-α 1031 T/C polymorphisms and CAD susceptibility
In total, 9 studies with 3851 patients in the CAD group and 3936 controls reported on the association between TNF-α 1031 T/C and CAD susceptibility.
For studies with no significant heterogeneity (chi-squared test, P > 0.05 and I2 < 50%), the fixed-effects model was chosen to analyze all the comparison model except the regressive model and homozygote model. The results of Begg’s test (p > 0.05) showed no significant publication bias among the study results.
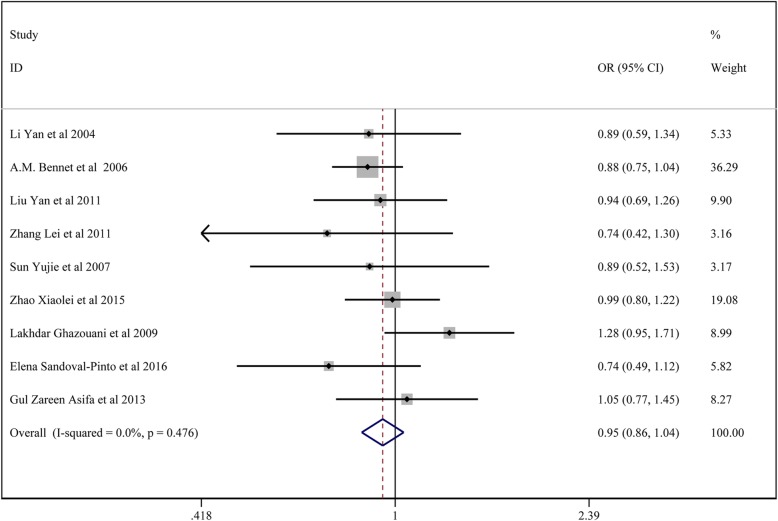
The results showed no significant association between TNF-α 1031 T/C locus C and CAD susceptibility: the allelic model (C vs. T) (OR:0.973, 95% CI:0.898–1.054); the homozygote model (CC vs. TT) (OR:0.999, 95% CI:0.666–1.498); the dominant model (CC + CT vs. TT) (OR: 0.945, 95% CI:0.860–1.039); regressive model (CCvs.TT+ CT) (OR: 1.020, 95% CI: 0.677–1.539); the heterozygote model (CT vs. TT) (OR: 0.929, 95% CI:0.842–1.025).
All the above results are presented in Fig. 8 and Table 6.
Fig. 8.
Forest plot for the dominant model of TNF-α 1031 T/C polymorphisms associated with CAD
Table 6.
Meta-analysis of TNF-α 1031 T/C polymorphisms and CAD susceptibility
| Genetic Model | N (case/control) | OR(95%CI) | P* | I2 | P# | P value | |
|---|---|---|---|---|---|---|---|
| Begg | Egger | ||||||
| CC vs TT + CT | 3781/3845 | 1.020 (0.677,1.539) | 0.013 | 58.6% | 0.923 | 0.602 | 0.458 |
| CC + CT vs TT | 3781/3845 | 0.945 (0.860,1.039) | 0.476 | 0.0% | 0.243 | 0.466 | 0.786 |
| CC vs TT | 3781/3845 | 0.999 (0.666,1.498) | 0.018 | 56.5% | 0.997 | 0.602 | 0.465 |
| CT vs TT | 3781/3845 | 0.929 (0.842,1.025) | 0.401 | 4.1% | 0.141 | 0.175 | 0.951 |
| C vs T | 3781/3845 | 0.973 (0.898,1.054) | 0.248 | 21.9% | 0.505 | 1.000 | 0.624 |
*P value of Heterogeneity chi-squared
#P value of Pooled statistic
Discussion
Atherosclerosis is the pathological basis of coronary heart disease, and inflammation plays a crucial role in the occurrence and development of atherosclerosis. Inflammation plays an important role in the formation, growth, rupture, and/or wear and tear of atherosclerotic plaques and the formation of blood clots. In particular, acute cardiovascular events such as heart failure, nausea and arrhythmia, cardiogenic shock and even cardiac arrest caused by plaque rupture and secondary acute thrombosis leading to complete occlusion of blood vessels are common clinical emergencies with sudden onset and high mortality. Therefore, the occurrence and development of coronary heart disease is a process of chronic inflammatory response.
TNF-α is an important proinflammatory cytokine mediating inflammatory response and immune regulatory response in vivo. TNF-α can affect the development of coronary heart disease through the following ways: [1] participation in the inflammatory response of atherosclerotic plaques, the formation and rupture of plaques, leading to coronary heart disease and even acute myocardial infarction [2]. Direct injury to vascular endothelial cells can increase their permeability, and blood cholesterol can easily penetrate the intima and deposit in the wall of the vessels [3]. Promotion of proto-oncogene transcription, production of platelet-derived growth factors, disruption of the balance between blood coagulation and anti-blood coagulation, and promotion of thrombosis [4]. Inhibiting lipoprotein enzyme activity is not conducive to lipid dissolution and deposition in the vascular wall, promoting the formation of arteriosclerosis and aggravating the damage of the vascular wall. TNF-α polymorphic loci are located in the promoter region of − 308, − 238, − 163, − 244,-857, − 836, − 1031 and other loci. The presence of these gene polymorphisms may affect gene transcription and expression levels and be associated with various diseases.
In previous studies, Fengtian et al. [35] included 14 studies and found no association between T-1031C, C-857 T and C-863A and CAD risk. Karely et al. [36] included 27 articles, and found a significant association between TNF-a G308A and CHD in the whole population, and between the variant G238A and CHD in the Asian population.
In our study, we found that TNF-α 308G/A locus A had no significant association with CAD susceptibility by the five models in the analysis of the overall population, Europeans, Africans, south Asians, and north Asians, which is contrary to the conclusion of Karely Pulido-Gomez. TNF-α 863C/A locus A and 1031 T/C locus C showed no significant association with CAD susceptibility, which is consistent with the conclusion of Fengtian HUANGFU. TNF-α 238G/A locus A had no significant association with CAD susceptibility in the overall population. However, TNF-α 238G/A locus A displayed significant association with higher CAD susceptibility in the subgroup of Europeans and north Asians. The association of TNF-α 238G/A in Asians is consistent with the study by Karely Pulido-Gomez. TNF-α 857C/T locus T had no significant association with CAD susceptibility in the analysis of the overall population and Europeans. In the north Asian population, TNF-α 857C/T locus T was associated with lower CAD susceptibility.
However, there are certain limitations to the present analysis, which are as follows: [1] only English and Chinese articles were included [2]; individual studies had different exclusion/inclusion criteria [3]; the severity of CAD was varied in different studies [4]; the number of included studies was limited, and some of the studies had a small sample size [5]; pooled data were analyzed, as individual patient data was not available, precluding more in-depth analyses.
Conclusion
Our results indicate that TNF-α 308G/A, 857C/T, 863C/A, and 1031 T/C are not associated with CAD susceptibility. TNF-α 238G/A locus A has significant association with CAD susceptibility In Europeans and north Asians, but has no significant association in the overall population. In the north Asian population, TNF-α 857C/T locus T was associated with lower CAD susceptibility. Larger-sample studies are required to confirm the association between TNF-α 238G/A and 857C/T and CAD susceptibility.
Acknowledgements
None.
Abbreviations
- ACS
Acute coronary syndrome
- AS
Atherosclerosis
- CAD
Coronary artery disease
- HWE
Hardy-Weinberg equilibrium
- NOS
Newcastle–Ottawa Scale
- PICOS
Participants, Interventions, Comparisons, Outcomes and Study design
- TNF
Tumor necrosis factor
- TNF-α
Tumor necrosis factor-α
Authors’ contributions
RH and ZX have made substantial contributions to conception and design of the study, written the manuscript; SZ, YL, FL, YG and JX searched literature, extracted data from the collected literature and analyzed the data; RH revised the manuscript. All authors approved the final version of the manuscript.
Funding
No funding was received for this study.
Availability of data and materials
All data generated or analysed during this study are included in this published article.
Ethics approval and consent to participate
Not applicable.
Consent for publication
Not applicable.
Competing interests
There is no competing interest.
Footnotes
Publisher’s Note
Springer Nature remains neutral with regard to jurisdictional claims in published maps and institutional affiliations.
Contributor Information
Rui Huang, Email: biaes8@163.com.
Su-Rui Zhao, Email: air7hm@163.com.
Ya Li, Email: k1a03w@163.com.
Fang Liu, Email: eanhwb@163.com.
Yue Gong, Email: a86fij@163.com.
Jun Xing, Email: ia6ucz@163.com.
Ze-Sheng Xu, Email: CZ-XZS@163.com.
References
- 1.Said MA, van de Vegte YJ, Zafar MM, van der Ende MY, Raja GK, Verweij N, et al. Contributions of interactions between lifestyle and genetics on coronary artery disease risk. Curr Cardiol Rep. 2019;21(9):89. doi: 10.1007/s11886-019-1177-x. [DOI] [PMC free article] [PubMed] [Google Scholar]
- 2.Musunuru K, Kathiresan S. Genetics of common. Complex Coronary Artery Disease Cell. 2019;177(1):132–145. doi: 10.1016/j.cell.2019.02.015. [DOI] [PubMed] [Google Scholar]
- 3.Khera AV, Kathiresan S. Genetics of coronary artery disease: discovery, biology and clinical translation. Nat Rev Genet. 2017;18(6):331–344. doi: 10.1038/nrg.2016.160. [DOI] [PMC free article] [PubMed] [Google Scholar]
- 4.Nedwin GE, Naylor SL, Sakaguchi AY, Smith D, Jarrett-Nedwin J, Pennica D, et al. Human lymphotoxin and tumor necrosis factor genes: structure, homology and chromosomal localization. Nucleic Acids Res. 1985;13(17):6361–6373. doi: 10.1093/nar/13.17.6361. [DOI] [PMC free article] [PubMed] [Google Scholar]
- 5.Christodoulidis G, Vittorio TJ, Fudim M, Lerakis S, Kosmas CE. Inflammation in coronary artery disease. Cardiol Rev. 2014;22(6):279–288. doi: 10.1097/CRD.0000000000000006. [DOI] [PubMed] [Google Scholar]
- 6.Ghazouani L, Ben Hadj Khalifa S, Abboud N, Ben Hamda K, Ben Khalfallah A, Brahim N, et al. TNF-alpha -308G>a and IL-6 -174G>C polymorphisms in Tunisian patients with coronary artery disease. Clin Biochem. 2010;43(13–14):1085–1089. doi: 10.1016/j.clinbiochem.2010.05.005. [DOI] [PubMed] [Google Scholar]
- 7.Hajeer AH, Hutchinson IV. Influence of TNFalpha gene polymorphisms on TNFalpha production and disease. Hum Immunol. 2001;62(11):1191–1199. doi: 10.1016/S0198-8859(01)00322-6. [DOI] [PubMed] [Google Scholar]
- 8.Koch W, Kastrati A, Bottiger C, Mehilli J, von Beckerath N, Schomig A. Interleukin-10 and tumor necrosis factor gene polymorphisms and risk of coronary artery disease and myocardial infarction. Atherosclerosis. 2001;159(1):137–144. doi: 10.1016/S0021-9150(01)00467-1. [DOI] [PubMed] [Google Scholar]
- 9.Chu H, Yang J, Mi S, Bhuyan SS, Li J, Zhong L, et al. Tumor necrosis factor-alpha G-308 a polymorphism and risk of coronary heart disease and myocardial infarction: a case-control study and meta-analysis. J Cardiovasc Dis Res. 2012;3(2):84–90. doi: 10.4103/0975-3583.95359. [DOI] [PMC free article] [PubMed] [Google Scholar]
- 10.Giacconi R, Cipriano C, Muti E, Costarelli L, Malavolta M, Caruso C, et al. Involvement of −308 TNF-alpha and 1267 Hsp70-2 polymorphisms and zinc status in the susceptibility of coronary artery disease (CAD) in old patients. Biogerontology. 2006;7(5–6):347–356. doi: 10.1007/s10522-006-9049-3. [DOI] [PubMed] [Google Scholar]
- 11.Cheng Y, An B, Jiang M, Xin Y, Xuan S. Association of Tumor Necrosis Factor-alpha Polymorphisms and Risk of coronary artery disease in patients with non-alcoholic fatty liver disease. Hepat Mon. 2015;15(3):e26818. doi: 10.5812/hepatmon.26818. [DOI] [PMC free article] [PubMed] [Google Scholar]
- 12.Herrmann SM, Ricard S, Nicaud V, Mallet C, Arveiler D, Evans A, et al. Polymorphisms of the tumour necrosis factor-alpha gene, coronary heart disease and obesity. Eur J Clin Investig. 1998;28(1):59–66. doi: 10.1046/j.1365-2362.1998.00244.x. [DOI] [PubMed] [Google Scholar]
- 13.Bennet AM, van Maarle MC, Hallqvist J, Morgenstern R, Frostegard J, Wiman B, et al. Association of TNF-alpha serum levels and TNFA promoter polymorphisms with risk of myocardial infarction. Atherosclerosis. 2006;187(2):408–414. doi: 10.1016/j.atherosclerosis.2005.09.022. [DOI] [PubMed] [Google Scholar]
- 14.Cho HC, Yu G, Lee MY, Kim HS, Shin DH, Kim YN. TNF-alpha polymorphisms and coronary artery disease: association study in the Korean population. Cytokine. 2013;62(1):104–109. doi: 10.1016/j.cyto.2013.02.008. [DOI] [PubMed] [Google Scholar]
- 15.Qi X, Zhang R. Genetic polymorphisms of TNF-α and its receptor genes detected by high resolution melting technology in the patients with coronary artery disease. Chin J Clin Lab Sci. 2014;32(6):405–409. [Google Scholar]
- 16.Liu Y, Jin W. Association between single nucleotide polymorphism in tumor necrosis factor- gene promoter and coronary heart diseas. J Diagn Concepts Pract. 2009;8(5):506–509. [Google Scholar]
- 17.Liang H. Genetic polymorphisms of the intedeukin—land tumor necrosis factor is associated with coronary heart disease. Zhengzhou University. 2007.
- 18.Xiang P, Li Y. Study on plasma TNF α level and TNFα polymorphisms in patients with coronary heart disease. Lab Med. 2004;19(5):434–437. [Google Scholar]
- 19.Li Y. Association between gene polymorphisms of inflammatory cytokines and susceptibility of coronary heart disease. Wuhan University. 2004.
- 20.Liu Y. Relationship between tumor necrosis factor-a gene risk and risk of coronary artery disease in Shanghai Han population. J of Shanghai Jiaotong University. 2011;31(5):592–597. [Google Scholar]
- 21.Zhang L. Assciation of tumoe necrosis factor a gene polymorphism, porphyromonas gingivalis with chronic periodontitis and coronary heart disease. Xin Jiang Medical University 2011.
- 22.Li Y. Analysis of tumor necrosis factor gene polymorphism in 112 elderly patients with coronary heart disease. Chin J Geriatr. 2003;22(9):568–569. [Google Scholar]
- 23.Shu Y. Association of −1031 polymorphism of TNF-a gene promoter region with coronary heart disease. J of Pub Health and Prev Med. 2007;18(5):9–11. [Google Scholar]
- 24.Pan M, Liu Z. Association of TNF-C(863) a single nucleotide polymorphism with serum level and coronary heart disease. Clinical Medicine of China. 2008;24(1):16–18. [Google Scholar]
- 25.Zhao X, Lin M. Association of TNF-α gene polymorphisms with coronary artery disease in Guangdong population. Modern Preventive Medicine. 2015;42(13):2389–2392. [Google Scholar]
- 26.Ghazouani L, Khalifa SB, Abboud N, Addad F, Khalfallah AB, Brahim N, et al. 308G>a and -1031T>C tumor necrosis factor gene polymorphisms in Tunisian patients with coronary artery disease. Clin Chem Lab Med. 2009;47(10):1247–1251. doi: 10.1515/CCLM.2009.287. [DOI] [PubMed] [Google Scholar]
- 27.Banerjee I, Pandey U, Hasan OM, Parihar R, Tripathi V, Ganesh S. Association between inflammatory gene polymorphisms and coronary artery disease in an Indian population. J Thromb Thrombolysis. 2009;27(1):88–94. doi: 10.1007/s11239-007-0184-8. [DOI] [PubMed] [Google Scholar]
- 28.Sandoval-Pinto E, Padilla-Gutierrez JR, Valdes-Alvarado E, Garcia-Gonzalez IJ, Valdez-Haro A, Munoz-Valle JF, et al. Association of the -1031T>C polymorphism and soluble TNF-alpha levels with acute coronary syndrome. Cytokine. 2016;78:37–43. doi: 10.1016/j.cyto.2015.11.014. [DOI] [PubMed] [Google Scholar]
- 29.Sbarsi I, Falcone C, Boiocchi C, Campo I, Zorzetto M, De Silvestri A, et al. Inflammation and atherosclerosis: the role of TNF and TNF receptors polymorphisms in coronary artery disease. Int J Immunopathol Pharmacol. 2007;20(1):145–154. doi: 10.1177/039463200702000117. [DOI] [PubMed] [Google Scholar]
- 30.Allen RA, Lee EM, Roberts DH, Park BK, Pirmohamed M. Polymorphisms in the TNF-alpha and TNF-receptor genes in patients with coronary artery disease. Eur J Clin Investig. 2001;31(10):843–851. doi: 10.1046/j.1365-2362.2001.00907.x. [DOI] [PubMed] [Google Scholar]
- 31.Morange PE, Tregouet DA, Godefroy T, Saut N, Bickel C, Rupprecht HJ, et al. Polymorphisms of the tumor necrosis factor-alpha (TNF) and the TNF-alpha converting enzyme (TACE/ADAM17) genes in relation to cardiovascular mortality: the AtheroGene study. J Mol Med (Berl) 2008;86(10):1153–1161. doi: 10.1007/s00109-008-0375-6. [DOI] [PubMed] [Google Scholar]
- 32.Hou L, Huang J, Lu X, Wang L, Fan Z, Gu D. Polymorphisms of tumor necrosis factor alpha gene and coronary heart disease in a Chinese Han population: interaction with cigarette smoking. Thromb Res. 2009;123(6):822–826. doi: 10.1016/j.thromres.2008.07.016. [DOI] [PubMed] [Google Scholar]
- 33.Bhanushali AA, Das BR. Promoter variants in interleukin-6 and tumor necrosis factor alpha and risk of coronary artery disease in a population from Western India. Indian J Hum Genet. 2013;19(4):430–436. doi: 10.4103/0971-6866.124371. [DOI] [PMC free article] [PubMed] [Google Scholar]
- 34.Asifa GZ, Liaquat A, Murtaza I, Kazmi SA, Javed Q. Tumor necrosis factor-alpha gene promoter region polymorphism and the risk of coronary heart disease. ScientificWorld J. 2013;2013:203492. doi: 10.1155/2013/203492. [DOI] [PMC free article] [PubMed] [Google Scholar]
- 35.Huangfu F, Zhao X, Wang X, Tang L, Jiang J. There is no association between TNF-alpha gene polymorphisms and the risk of coronary artery heart disease: a meta-analysis. J Cardiovasc Surg. 2017;58(5):770–778. doi: 10.23736/S0021-9509.16.09352-6. [DOI] [PubMed] [Google Scholar]
- 36.Pulido-Gomez K, Hernandez-Diaz Y, Tovilla-Zarate CA, Juarez-Rojop IE, Gonzalez-Castro TB, Lopez-Narvaez ML, et al. Association of G308A and G238A polymorphisms of the TNF-alpha gene with risk of coronary heart disease: systematic review and meta-analysis. Arch Med Res. 2016;47(7):557–572. doi: 10.1016/j.arcmed.2016.11.006. [DOI] [PubMed] [Google Scholar]
Associated Data
This section collects any data citations, data availability statements, or supplementary materials included in this article.
Data Availability Statement
All data generated or analysed during this study are included in this published article.


