Abstract
RAF family kinases are RAS-activated switches that initiate signaling through the MAP kinase cascade to control cellular proliferation, differentiation and survival1–3. RAF activity is tightly regulated, and inappropriate activation is a frequent cause of cancer4–6. At present, the structural basis for RAF regulation is poorly understood. Here we describe autoinhibited and active state structures of full-length BRAF in complexes with MEK1 and a 14-3-3 dimer, determined using cryo electron microscopy (cryo-EM). A 4.1Å resolution cryo-EM reconstruction reveals an inactive BRAF/MEK1 complex restrained in a cradle formed by the 14-3-3 dimer, which binds the phosphorylated S365 and S729 sites that flank the BRAF kinase domain. The BRAF cysteine-rich domain (CRD) occupies a central position that stabilizes this assembly, but the adjacent RAS-binding domain (RBD) is poorly ordered and peripheral. The 14-3-3 cradle maintains autoinhibition by sequestering the membrane-binding CRD and blocking dimerization of the BRAF kinase domain. In the active state, these inhibitory interactions are released and a single 14-3-3 dimer rearranges to bridge the C-terminal pS729 binding sites of two BRAFs, driving formation of an active, back-to-back BRAF dimer. Our structural snapshots provide a foundation for understanding normal RAF regulation and its mutational disruption in cancer and developmental syndromes.
RAF activity is restrained by a complex interplay involving phosphorylation events, binding to 14-3-3 proteins, and intramolecular autoinhibitory interactions1,3. The mammalian RAF kinases ARAF, BRAF and CRAF share three conserved regions (CR1, CR2 and CR3, Fig. 1a). The N-terminal CR1 region contains the RBD and CRD domains, while the C-terminal CR3 region contains the serine/threonine kinase domain and a motif that when phosphorylated, serves as a binding site for 14-3-3 proteins. The intervening CR2 region consists of a second 14-3-3 recognition site (Fig. 1a). 14-3-3s are dimeric proteins that bind specific serine- or threonine-phosphorylated motifs in diverse signaling proteins7. In the absence of activating interactions with RAS, RAF proteins are thought to be maintained in an autoinhibited state that involves intramolecular interaction of the CR1 region with the kinase domain, and by binding of 14-3-3 proteins to the phosphorylated CR2 (pS365 in BRAF) and C-terminal (pS729 in BRAF) 14-3-3 binding sites1,3. RAF is recruited to the plasma membrane and activated in a process that involves binding of GTP-bound RAS to its RBD domain. The adjacent CRD is also important for RAS-driven recruitment and activation8,9. Structurally, the CRD is a C1 domain, a small modular domain found in many lipid- or membrane-activated signaling proteins10. Normal RAF activation requires dimerization of the kinase domain11, and active RAFs form both homo- and hetero dimers12,13. MEK1 and MEK2 are the only known RAF substrates, and MEKs in turn selectively phosphorylate ERK1 and ERK2, the terminal kinases in the RAS/MAP kinase cascade. Recent work has revealed that BRAF is pre-associated with MEK in the quiescent state14,15. Prior structural studies of BRAF and other family members have been restricted to isolated domains or fragments of these proteins16–18. To aid in developing an integrated structural understanding of the normal regulation of RAFs and their pathological activation in cancer, we sought to prepare and structurally characterize intact BRAF in autoinhibited and active states in complexes with MEK1 and 14-3-3 proteins.
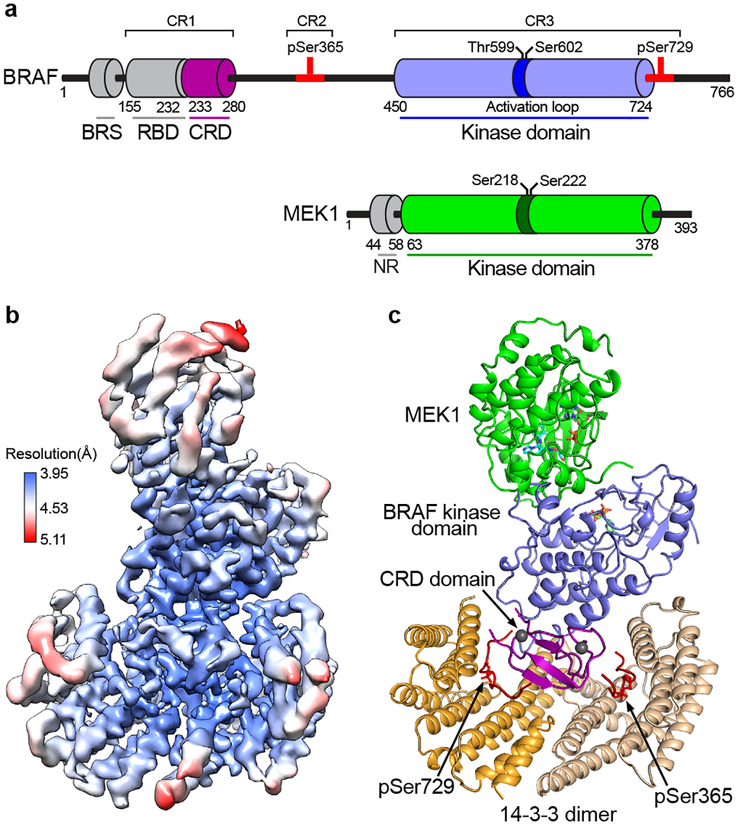
Figure 1. Structure of an autoinhibited BRAF/MEK1AA/14-3-3 complex.
a, Schematic showing the domain organization of BRAF and MEK1. Key regulatory phosphorylation sites are indicated above the schematics and residue numbers for domain boundaries are shown below. b, Single-particle reconstruction cryo-EM density map derived from imaging of the full-length BRAF/MEKAA/14-3-3 complex, colored according to local resolution. c, Ribbon diagram showing the overall structure of the complex. BRAF and MEK1 domains are colored as in panel a, and the two subunits of the 14-3-3 dimer are shown in orange and tan. Segments of BRAF containing the pS365 and pS729 regulatory sites bind opposite sides of the 14-3-3 dimer, and are shown in red. The CRD domain occupies a central location in the complex, with contacts to both 14-3-3 subunits, both the pS365 and pS729 regulatory segments, and the BRAF kinase domain. Abbreviations: BRS, BRAF-specific domain, which is unique to BRAF; RBD, RAS-binding domain; CRD, cysteine-rich domain.
Overall structure of autoinhibited BRAF
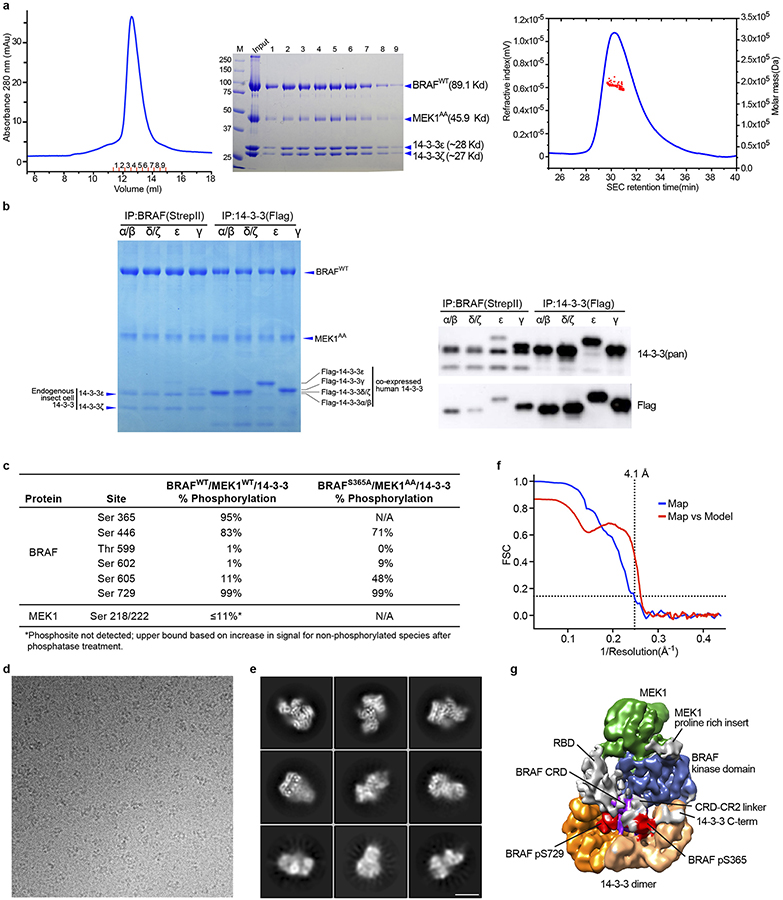
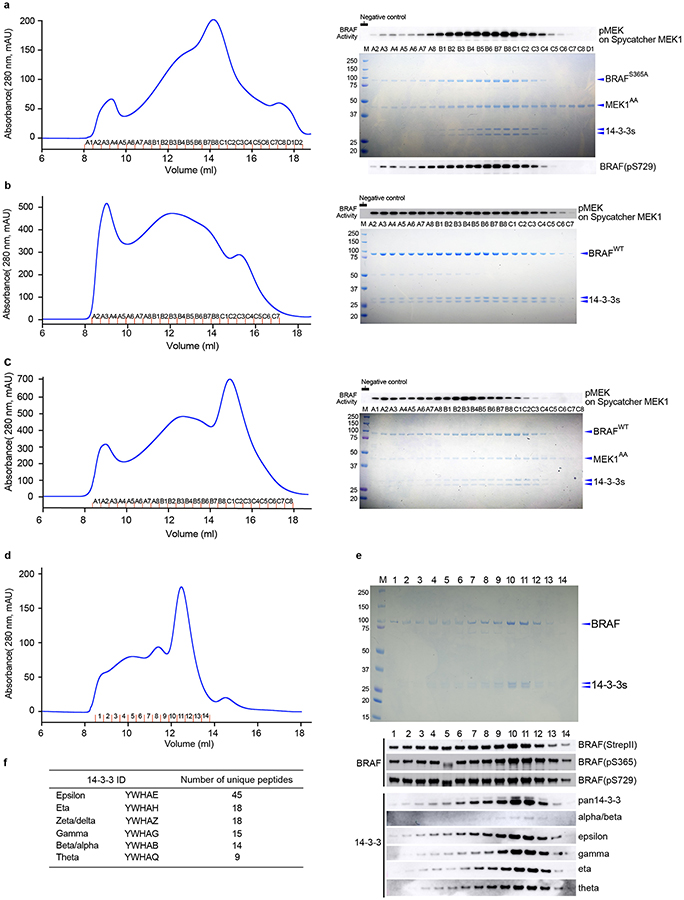
Co-expression of full-length wild-type BRAF with full-length MEK1 (wild type, MEK1WT or with alanine mutations in activation segment phosphorylation sites, MEK1AA) in insect cells yielded well-defined complexes that also contained insect cell-derived 14-3-3ε,ζ dimers (see Methods and Extended Data Fig. 1a). Co-expression of human 14-3-3 isoforms with BRAF and MEK1 did not fully displace the insect cell 14-3-3s and led to increased heterogeneity (Extended Data Fig. 1b). Accordingly, we exploited binding of the abundant and highly conserved endogenous 14-3-3 proteins. This approach allowed us to isolate “monomeric” complexes that contained a single chain of each of BRAF, MEK1 and the two 14-3-3 subunits (Extended Data Fig. 1a). Consistent with an autoinhibited state, we found that both the S365 and S729 sites on BRAF were highly phosphorylated while those on the activation segment were not (Extended Data Fig. 1c). To eliminate potential heterogeneity due to phosphorylation of the MEK1 activation loop, we employed the MEK1AA mutant for structure determination.
Cryo-EM imaging of the 192 kDa BRAF/MEK1AA/14-3-3ε,ζ complex prepared in the presence of the ATP analog ATP-γS and MEK inhibitor GDC-0623 revealed well-dispersed particles with 2D class averages showing obvious secondary structure features (Extended Data Fig. 1d,e). Approximately 8400 micrograph movies afforded single-particle reconstructions of this complex at a nominal resolution of 4.1Å (Fig. 1b, Extended Data Fig. 1f), as detailed further in Methods and Extended Data Table 1.
The cryo-EM map revealed a compact structure with inactive BRAF secured in a 14-3-3 “cradle” by extensive interactions with the 14-3-3 dimer (Fig. 1c). The 14-3-3 engages both cognate sites in BRAF; the phosphorylated CR2 site (pS365) is bound in the recognition groove on one side of the 14-3-3 dimer, while the C-terminal (pS729) motif is bound in the groove on the opposite side of the dimer. The BRAF CRD domain is particularly central to the overall architecture of the complex. It contacts both subunits of the 14-3-3 dimer, both the pS365 and pS729 binding motifs, and the C-lobe of the BRAF kinase domain. The BRAF kinase domain is oriented with its active site facing away from the 14-3-3 domain, allowing it to coordinate MEK1 in a “face-to-face” orientation. Both MEK1 and BRAF kinase domains exhibit stereotypical inactive conformations, with their regulatory αC-helices displaced from their active positions. The N-terminal BRS and RBD domains of BRAF are not clearly defined in the cryo-EM map. A reconstruction filtered to 5Å resolution and contoured at a lower level revealed density adjacent to the CRD that corresponds to the RBD domain (Extended Data Fig. 1g) but did not provide sufficient detail to allow positioning of an RBD model.
The 14-3-3 dimer organizes inactive BRAF
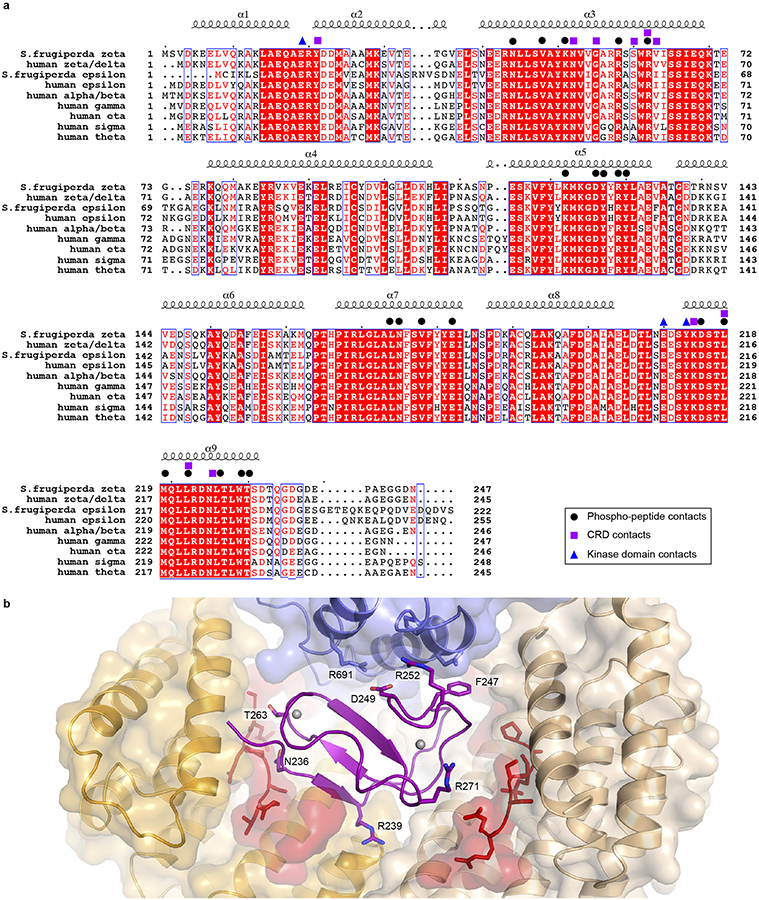
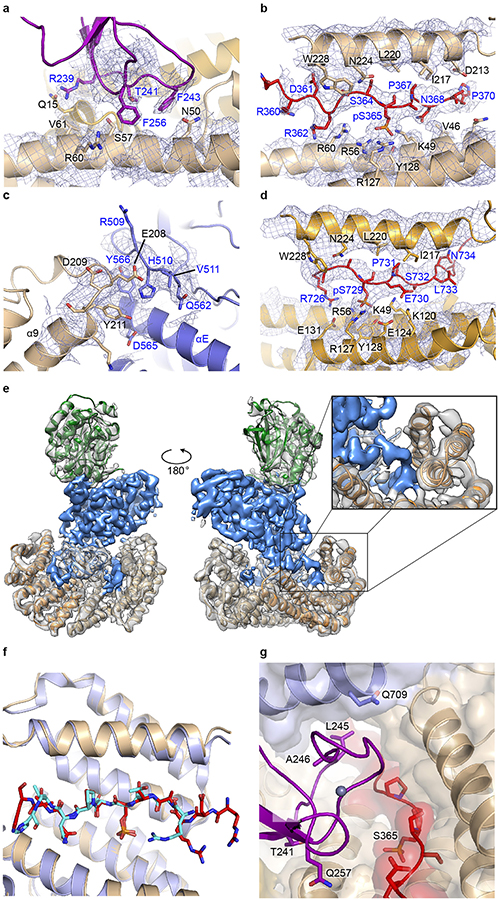
Our BRAF complexes contain an approximately equimolar ratio of the ε and ζ isoforms (Extended Data Fig. 1a), and we expect that each side of the 14-3-3 dimer is a mixture of the two isoforms in our reconstructions. For simplicity and convenience, our model is constructed using the Spodoptera frugiperda 14-3-3ζ sequence for both subunits, but with residue numbering corresponding to the human 14-3-3ζ isoform. The 14-3-3 dimer interacts with every ordered domain of BRAF, and interacting residues are highly conserved across all 14-3-3 isoforms (Extended Data Fig. 2a). The most N-terminal portion of BRAF that is well defined in the cryo-EM maps is the CRD domain. The ~50 residue CRD domain fold contains a small β-sheet and is stabilized by two zinc coordination sites (Fig. 1c). The domain binds in the center of the 14-3-3 cradle, with contacts to both subunits of the dimer (Extended Data Fig. 2b). Interestingly, two loops of the CRD domain that are expected to mediate association of the domain with the membrane17,19,20 (residues 239–245 and 253–260) make extensive contact with the 14-3-3 domain in the autoinhibited complex (Extended Data Fig. 3a). Prior mutagenesis studies with the CRAF CRD have identified two residues in this region that are important for binding to 14-3-321. The corresponding residues in BRAF (R239 and T241) are indeed found at the interface with the 14-3-3 domain (Extended Data Fig. 3a).
The poorly conserved linker connecting the CRD domain and CR2 region is not visible in our map, but the phosphorylated CR2 segment is well-defined in the phosphopeptide recognition groove on one side of the 14-3-3 dimer (Extended Data Fig. 3b). The ordered CR2 segment extends from Q359 to I371, with pS365 roughly at its center. Beyond I371, the linker that connects CR2 to the kinase domain is not visible. The BRAF kinase C-lobe contacts both 14-3-3 subunits but interacts most extensively with the pS365-binding subunit, packing against its α9 helix and α8-α9 loop (Extended Data Fig. 3c). This portion of the 14-3-3 domain also contacts H510 and adjacent residues in the N-terminal lobe of the kinase domain. We observe continuous density connecting the C-terminus of the BRAF kinase domain with the pS729 14-3-3 binding motif, which occupies the recognition groove on the opposite side of the 14-3-3 dimer (Extended Data Fig. 3d,e). BRAF residues S732-A736 thread between the CRD and 14-3-3 domain as they exit the recognition groove and weak density for a few additional residues indicates that the BRAF C-terminus passes across a hydrophobic surface on the CRD domain before it becomes substantially disordered. The interactions of the 14-3-3 domain with the CR2 segment in the present structure are similar to those observed in a crystal structure of human 14-3-3ζ in complex with a CRAF peptide22 (Extended Data Fig. 3f).
The autoinhibited BRAF/MEK kinase module
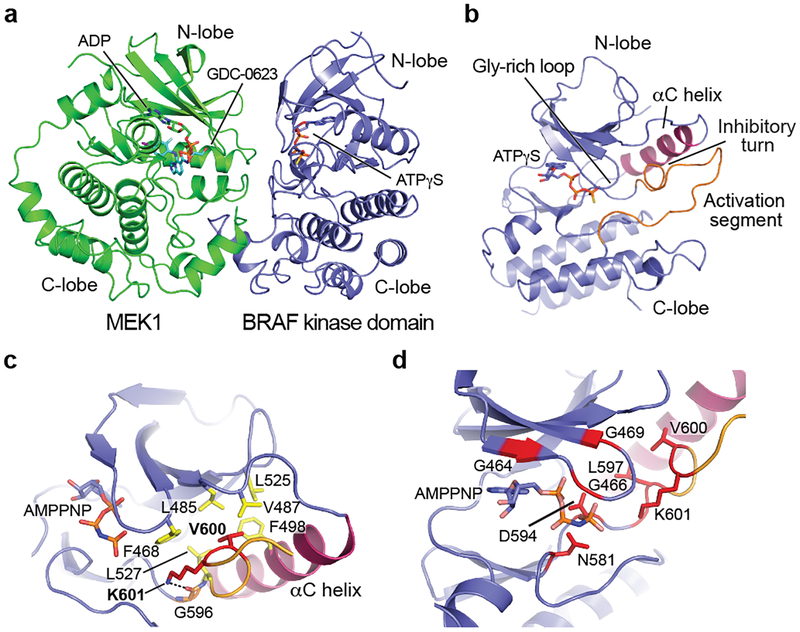
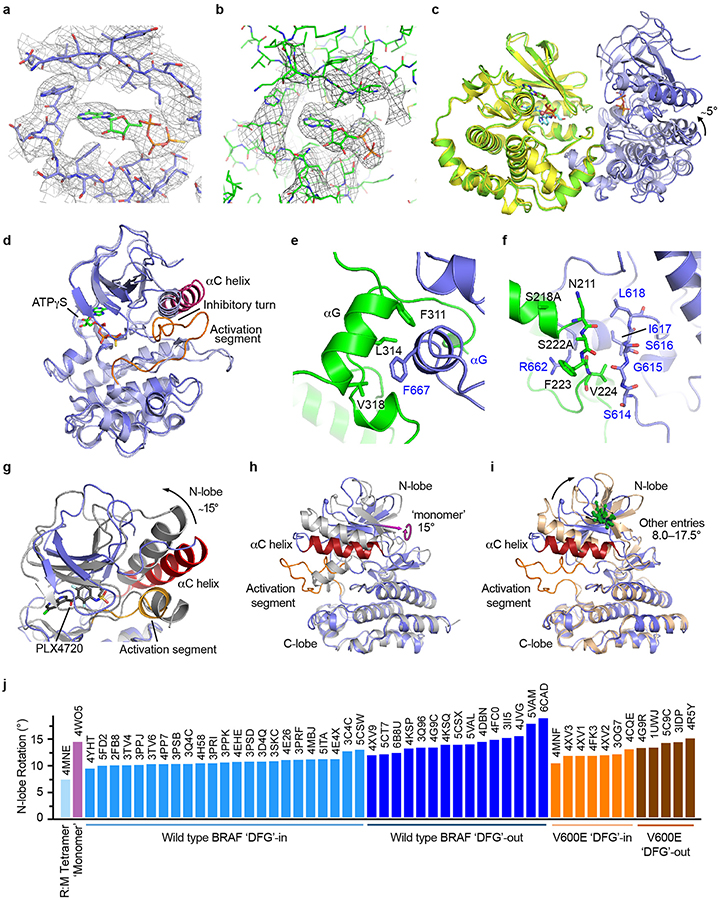
The BRAF and MEK1 kinase domains bind with their active site clefts juxtaposed, and both kinases exhibit inactive conformations (Fig. 2a). Density for ATP-γS is visible in the BRAF active site cleft (Extended Data Fig. 4a). There is also density for bound nucleotide in the MEK active site that appears to be ADP (Extended Data Fig. 4b). The inactive conformation of MEK1 and the face-to-face kinase orientation seen here is similar to that previously observed for the isolated kinase domains of BRAF and MEK114. However, the BRAF kinase domain in the prior structure adopted an active but nucleotide-free conformation, as compared with the inactive, nucleotide-bound state in the present structure (Extended Data Fig. 4c,d). BRAF coordinates MEK1 via an extensive interface involving primarily the C-lobes of both kinases, including the kinase activation segments, which interact in an antiparallel manner (Extended Data Fig. 4e, f).
Figure 2. Conformation of the autoinhibited BRAF kinase domain and location of oncogenic mutations.
a, BRAF coordinates MEK1 in a face-to-face orientation, with extensive contact between the kinase C-lobes. Both kinases adopt an inactive, αC-out conformation. b, Overall view of the autoinhibited BRAF kinase domain. The C-helix (purple) is propped in an outward, inactive conformation by the inhibitory turn in the activation segment (orange). ATP-γS is bound in the active site cleft. c, Detailed view of the structure and interactions of the inhibitory turn. Residue V600, the most common site of oncogenic mutations, is part of a cluster of hydrophobic residues (yellow) that stabilize this inactive conformation. K601 also stabilizes this configuration; it hydrogen bonds with G596 in the DFG motif and packs with F468 in the glycine-rich loop. d, Oncogenic mutations (red) cluster in the inhibitory turn or residues that coordinate ATP. Panels a and b are drawn from the cryo-EM structure; panels c and d from the crystal structure of the autoinhibited kinase domain complex.
In the BRAF kinase domain, the outward inactive position of the αC-helix is enforced by residues 598–602 in the activation segment, which form a helix-like turn that we refer to as the “inhibitory turn” (Fig. 2b). The inhibitory turn packs together with hydrophobic residues in the glycine-rich loop, C-helix, and β3 strand to stabilize the inactive state. This inhibitory arrangement resembles that observed in the inactive states of other kinases including CDK2, Src, and EGFR. A superficially similar configuration has been observed in crystal structures of the BRAF kinase domain crystallized with sulfonamide-class inhibitors23, but direct comparison with the present structure reveals marked differences in the activation segment and in the relative orientation of the N- and C-lobes of the kinase domain (Extended Data Fig. 4g,h). The inhibitor-bound conformation is ~15° more open as compared with the nucleotide-bound inactive state observed in the present structure. This difference prompted us to systematically examine the relative N- and C-lobe orientation in more than 50 BRAF kinase structures available in the Protein Data Bank. Strikingly, all previous BRAF kinase structures, none of which contain ATP or an ATP analog, exhibit a markedly more open active site cleft (due to N-lobe rotations of 8–17°) as compared with the autoinhibited, nucleotide-bound structure described here (Extended Data Fig. 4i,j).
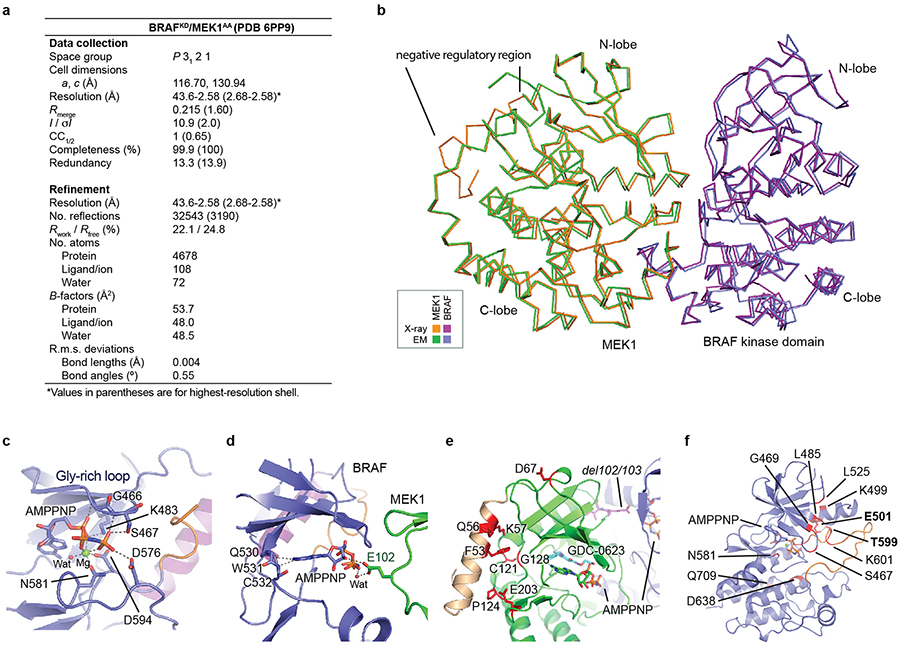
We also obtained a higher resolution view of the autoinhibited BRAF kinase domain by co-expressing it with full-length MEK1AA in insect cells and crystallizing the purified complex in the presence of GDC-0623 and ATP analog AMP-PNP (Extended Data Fig. 5a). The resulting 2.6 Å crystal structure superimposes closely on the corresponding portion of the autoinhibited BRAFWT/MEK1AA/14-3-3 cryo-EM structure (r.m.s.d. 0.56 Å, Extended Data Fig. 5b), and the regions of interest discussed above are highly similar. The crystal structure reveals in detail interactions that stabilize the inhibitory turn in the BRAF kinase domain (Fig. 2c), and interactions with the bound nucleotide (Extended Data Fig. 5c). Strikingly, oncogenic mutations in the BRAF kinase domain cluster in a small region containing both the inhibitory turn and nucleotide-binding residues (Fig. 2d). Considering the extent of interactions with nucleotide and the unique N-lobe orientation observed in both the cryo-EM and the crystal structure, we hypothesize that ATP binding is an essential feature of the autoinhibited state. Interestingly, we also observe a hydrogen bond between MEK1 residue E102 and the ribose group of the AMP-PNP bound to the BRAF kinase domain (Extended Data Fig. 5d).
The MEK1 portion of the crystal structure includes an N-terminal helix that is the site of rare activating mutations in cancer and in a “RASopathy” known as cardio-cutaneo-facial syndrome, a genetic developmental disorder stemming from aberrant MAP kinase pathway signaling24. This α-helix packs across the back of the N-lobe (Extended Data Fig. 5b,e), apparently contributing to the stability of the inactive αC-out conformation of MEK, as seen in previous work25. For reasons we do not understand, this helix is not resolved in the cryo-EM map of the autoinhibited complex.
Inhibitory mechanisms of the 14-3-3 dimer
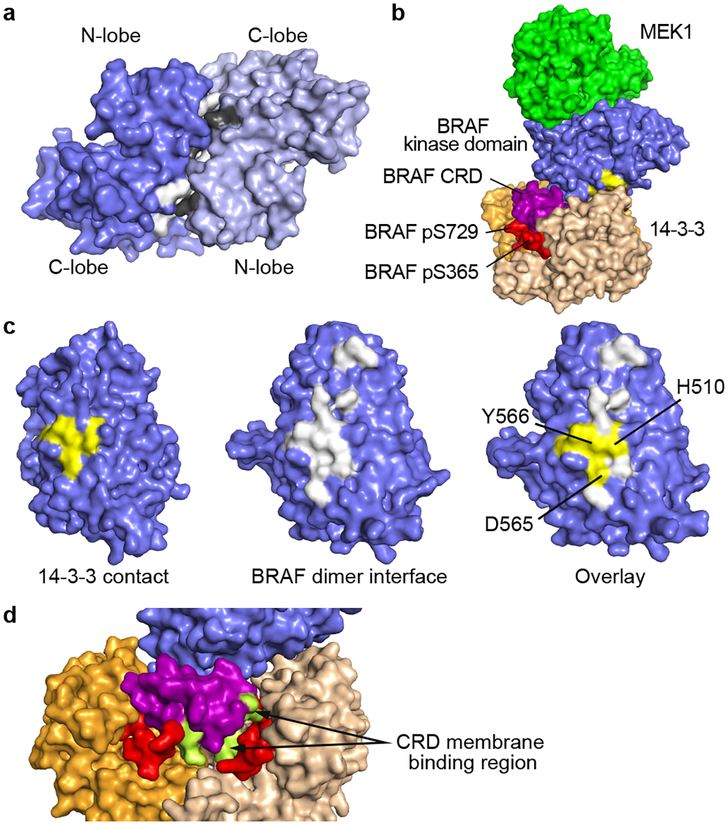
The crystal structure described above shows that the MEK1 and the BRAF kinase domains can adopt their mutually inhibited conformations absent any interactions with the 14-3-3 protein. This raises the question of the role of the 14-3-3 dimer in BRAF inhibition. Our structure suggests that rather than inducing an inactive conformation in the kinase domain, the 14-3-3 maintains the inhibited state by sterically blocking formation of the BRAF kinase domain dimer that is required for BRAF activation11. In the autoinhibited cryo-EM structure, the surface corresponding to the BRAF dimer interface is obstructed by the bound 14-3-3 dimer (Fig. 3, a–c). In particular, dimer interface residues H510, D565, and Y566 are all in contact with the 14-3-3 domain in the autoinhibited structure. Additionally, the 14-3-3 domain sequesters the CRD domain, which is crucial for Ras-driven activation and membrane recruitment of BRAF. In the autoinhibited complex, the surface corresponding to the membrane-binding loops of the CRD is largely occluded in the autoinhibited complex (Fig. 3d).
Figure 3. The 14-3-3 domain blocks the BRAF dimer interface and occludes the membrane-binding region of the CRD domain.
a, Surface representation of an active BRAF kinase domain dimer, with interface residues shaded white for one subunit and gray for the opposite subunit (drawn from PDB entry 4MNE). b, Oblique view of the autoinhibited BRAF complex, with BRAF kinase domain residues that contact the α8-α9 loop of the 14-3-3 domain shaded yellow. c, Comparison of the 14-3-3 contact (left panel) and the BRAF dimer interface (center panel). The respective surfaces are overlaid in the right panel, demonstrating that the 14-3-3 interaction will sterically interfere with BRAF kinase dimerization. d, Surface view of the complex in the region of the CRD, with the putative membrane-binding loops of the CRD shaded green.
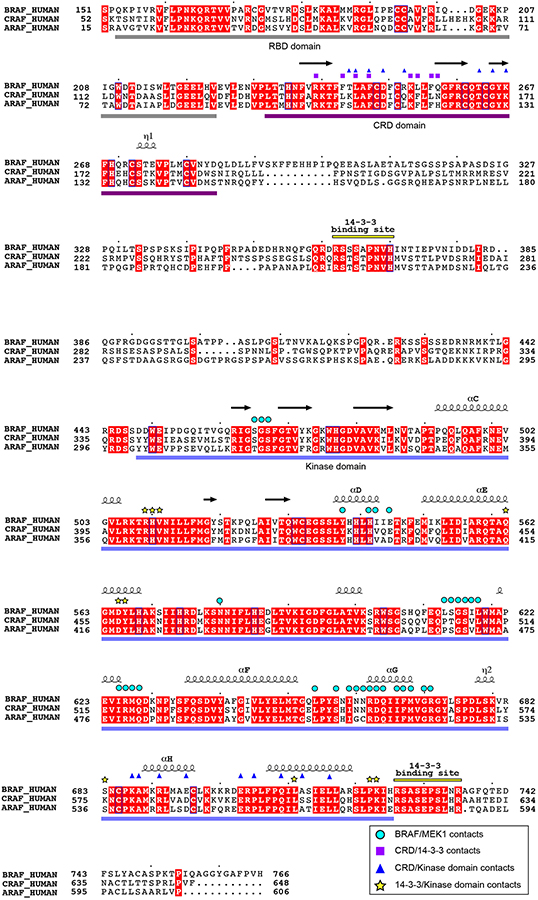
The overall architecture of autoinhibited BRAF is likely shared with both ARAF and CRAF, as key interdomain contacts are highly conserved (Extended Data Fig. 6). Consistent with our structural findings, early structure-function studies established a key role for the CRD in maintaining RAF in an autoinhibited state21,26. An alanine scanning mutagenesis study of the CRAF CRD domain identified mutations in 11 surface exposed residues that increased RAS(G12V)-dependent activation of CRAF, including two that fully activated CRAF in the absence of mutant RAS27. All 11 of the corresponding residues in BRAF are located at interdomain contacts in the present structure (Extended Data Fig. 2b). Perhaps most compellingly, the BRAF CRD domain is a hot-spot for germline mutations that cause Noonan Syndrome and related RASopathies28. Altered residues map to sites of contact with the 14-3-3 or kinase domain in the present structure, providing a structural rationale for their activating effects (Extended Data Fig. 3g).
Structures of active BRAF complexes
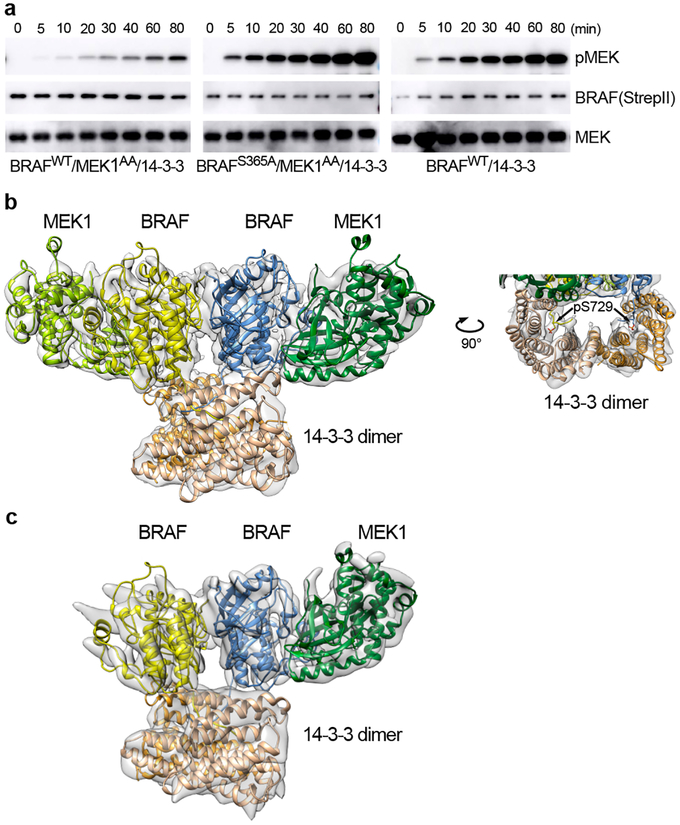
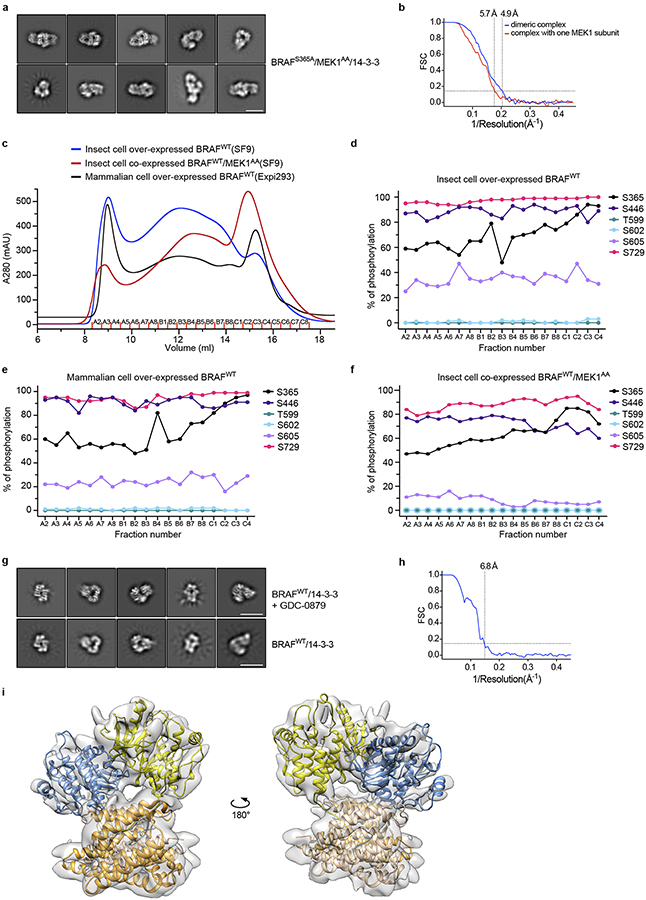
The autoinhibited structure described above reveals a clear role for phosphorylation of both S365 and S729 in RAF autoinhibition. To further explore the role of these modifications in RAF regulation, we prepared S365A, S729A, and S365A/S729A BRAF variants and expressed them with or without co-expression of MEK1 in insect cells. While we obtained soluble, stable BRAF/MEK1/14-3-3 complexes with BRAFS365A (Extended Data Fig. 7a), expression experiments with BRAFS729A and BRAFS365A/S729A yielded little BRAF that was largely aggregated and did not co-purify with 14-3-3 proteins (data not shown). Size-exclusion chromatography of the BRAFS365A sample revealed a broad peak containing BRAFS365A, MEK1AA, and the 14-3-3 dimer. Examination of the phosphorylation state of the BRAFS365A in this peak revealed near stoichiometric phosphorylation of S729, but little phosphorylation of activation segment sites T599 and S602 (Extended Data Fig. 1c). Nevertheless, the purified complex was highly active in MEK phosphorylation assays (Figure 4a, Extended Data Fig. 7a), and cryo-EM imaging of the complex revealed 2D class averages consistent with larger, dimeric complexes (Extended Data Fig. 8a).
Figure 4. Structure and activity of active, dimeric BRAF/MEK1/14-3-3 complexes.
a, Kinase activity assays for autoinhibited and active BRAF complexes. Time course of phosphorylation of an exogenous, kinase-dead MEK1 substrate is measured by western blotting for pS218/222 MEK for the autoinhibited wild-type monomer complex (left panel), the BRAFS365A complex (center panel), and a wild-type BRAF/14-3-3 complex prepared without co-expression of MEK1 in insect cells (right panel). Blots for BRAF (anti-strepII) and MEK are provided as loading controls for enzyme and substrate, respectively. For gel source data, see Supplementary Figure 1. b, Cryo-EM structure of the active, dimeric BRAFS365A/MEK1AA/14-3-3 complex. In this active configuration, the 14-3-3 dimer bridges the S729-phosphorylated tails of the back-to-back BRAF dimer (right panel). Portions of BRAF N-terminal to the kinase domain are not visible in the reconstruction. c, The same preparations also contained BRAFS365A/MEK1AA/14-3-3 complexes containing only one MEK1 subunit. The overall organization of the remaining subunits is closely similar, but the 14-3-3 dimer pivots to the side of the missing MEK. See also Extended Data Fig. 8.
A three-dimensional reconstruction at ~5 Å resolution of the predominant species in this BRAFS365A/MEK1/14-3-3 sample revealed an active, back-to-back BRAF kinase dimer, with MEK1 bound to each BRAF kinase domain (Fig. 4b, Extended Data Fig. 8b). A single 14-3-3 dimer bridges the phosphorylated pS729 sites at the C-termini of the two BRAF kinase domains. We do not observe interpretable density for BRAF regions preceding the kinase domain, nor for the C-terminus beyond S734. We built a model into this cryo-EM map by domain-wise rigid body fitting of the previously reported active MEK/BRAF kinase domain complex (PDB ID 4MNE) and the 14-3-3 dimer from the autoinhibited complex described here. The BRAF/MEK kinase domain portion of the structure exhibits the same overall organization as the prior structures, and inspection of the cryo-EM map confirms that the BRAF C-helix is in its inward position as expected for the active dimer.
Three dimensional classification of particles from the same set of images allowed reconstruction of a second particle similar to the one described above, but with only a single MEK1 bound to the BRAF dimer (Fig. 4c). In this “MEK-lite” complex, the 14-3-3 dimer cants to the side of the missing MEK, assuming a more asymmetric position with respect to the back-to-back BRAF kinase domain dimer.
We also expressed wild-type BRAF alone (without MEK co-expression) in both insect and mammalian (HEK293) cells and obtained soluble BRAF in complex with endogenous 14-3-3 proteins using both expression systems (Extended Data Fig. 7, b–f). Mass spectrometry-based quantitation of phosphorylation in elution fractions revealed near-stoichiometric phosphorylation of S729 and a high level of S365 phosphorylation in peak fractions, but negligible phosphorylation of both T599 and S602 in both mammalian and insect-cell produced BRAF (Extended Data Fig. 8c–f). The BRAF/14-3-3 complex was highly active in a MEK phosphorylation assay (Fig. 4a, Extended Data Fig. 7b).
Cryo-EM imaging of the mammalian-expressed complex revealed predominant 2D class averages consistent with a 14-3-3-bound BRAF dimer, as did imaging of the same sample supplemented with RAF inhibitor GDC-0879 (Extended Data Fig. 8g). We obtained a 3D reconstruction of the inhibitor-bound BRAF/14-3-3 complex at a nominal resolution of 7 Å, which confirmed the dimeric state of the complex (Extended Data Fig. 8h,i). As with the MEK-bound dimer, the BRAF kinase domain forms the expected symmetrical, back-to-back dimer in this structure and we do not observe the N-terminal domains of BRAF. Despite the fact that the 14-3-3 dimer bridges the pS729 sites of the two kinase domains, it adopts a highly asymmetric position with respect to the kinase dimer (Extended Data Fig. 8i). In this skewed position, the 14-3-3 dimer approaches the active site cleft and intrudes into the MEK-binding region of one BRAF kinase domain, but not the other.
Discussion
In the quiescent state, BRAF, MEK1, and a 14-3-3 dimer form a tightly integrated signaling device. In light of their extensive interactions, we propose that the RAF/MEK/14-3-3 complex, rather than RAF per se, serves as the RAS-activated switch that initiates signaling through the MAP kinase cascade. Phosphorylation of both 14-3-3 binding sites and engagement by a 14-3-3 dimer is required for maturation of RAF into its regulated, inactive state. Our structural and biochemical findings argue that MEK also contributes to the stability of the inactive state of BRAF, but we do not exclude the possibility that RAFs can assemble into an autoinhibited 14-3-3 complex without MEK. The essential role of pS729 in both the autoinhibited and active states of the kinase and its stoichiometric phosphorylation in our purified complexes leads us to suggest that this site is a structural phosphorylation required for proper assembly and regulation of BRAF complexes. Of note, phosphorylation on T599 and S602 is widely thought to play a crucial role in BRAF activation29, but we find little to no phosphorylation on these sites in active BRAF/14-3-3 dimers. The potential role of activation loop phosphorylation in RAF regulation merits further study.
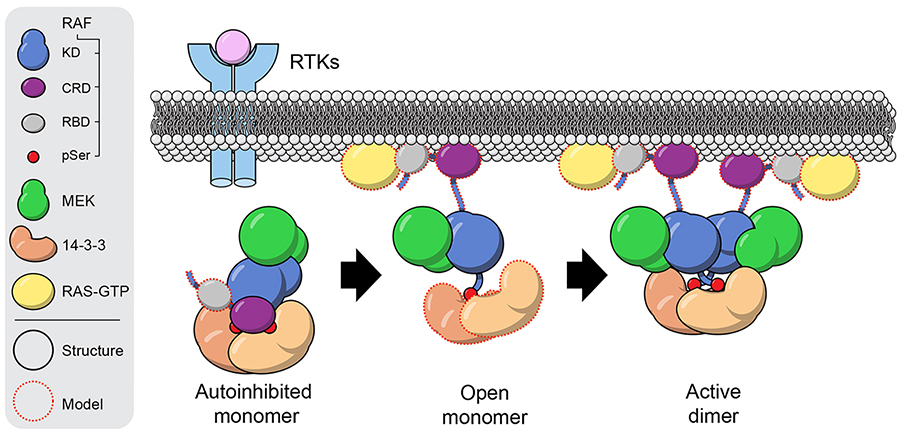
The structures described here provide views of RAF in its quiescent and activate states and in light of prior functional dissection of RAF regulation, they outline a model for RAF activation (Extended Data Fig. 9). In the autoinhibited state, the RBD is exposed, allowing recruitment of the quiescent complex to the membrane by activated RAS. In contrast, the CRD and its membrane binding surface is largely buried by interactions with the 14-3-3 dimer and other segments of RAF, suggesting that its “extraction” upon RAS binding and membrane localization is the key event promoting release of the inhibitory position of the 14-3-3 domain. Released from its inhibitory position, the 14-3-3 dimer can rearrange to bridge the pS729 sites in the C-terminal tails of two BRAFs, driving formation of the active BRAF dimer. Once activated, BRAF can phosphorylate MEK, promoting its release14. Steric effects of the 14-3-3 domain could also modulate affinity for MEK, as evidenced by the asymmetric position it assumes upon MEK release.
The inactive-state structures described here reveal the bona fide inactive conformation of BRAF and thereby provide a structural foundation for understanding its activation by mutations in cancer. Oncogenic mutations in V600 and K601 in the inhibitory turn are not compatible with the structural context of these residues, providing a rationale for their activating effect via destabilization of the inhibitory turn (Fig. 2c). Other less common oncogenic BRAF mutations occur in residues that participate directly in coordination of ATP and its associated divalent cation (Fig. 2d), and they may destabilize the autoinhibited state by weakening interactions with ATP and/or by disrupting interactions of the glycine-rich loop with the inhibitory turn in the activation segment. Many of the same BRAF residues are also altered in RASopathies28 (Extended Data Fig. 5f). Outside the kinase domain, somatic point mutations in or near the CR2 phosphorylation site occur in CRAF and ARAF in diverse cancers including lung adenocarcinoma30. These mutations ablate the CR2 14-3-3 binding site, promoting formation of the active RAF dimer as we observe here with the BRAFS365A mutant. The KIAA1549:BRAF truncation/fusion oncoprotein found in pediatric low-grade gliomas lacks the entire CR1 and CR2 regions of BRAF, and is therefore constitutively active31.
The integral nature of the RAF/MEK/14-3-3 switch has important pharmacologic implications. It is well established that certain MEK and RAF inhibitors can stabilize or destabilize their interaction14,32–34. However, the notion that the RAF/MEK/14-3-3 complex, distinct from the isolated RAF and MEK kinases, may represent a relevant pharmacologic receptor for a broader range of inhibitors has not, to our knowledge, been systematically explored. Arguably the most perplexing aspect of RAF inhibitor pharmacology is the paradoxical activation of the MAP kinase pathway by certain RAF kinase inhibitors4,35,36. Diverse RAF inhibitors disrupt autoinhibitory interactions of the BRAF kinase with its N-terminal region37, and some promote dimerization of the isolated BRAF kinase domain23. Considering the extensive interactions of BRAF with ATP in the autoinhibited state, we speculate that RAF inhibitors may promote conformational activation by displacing ATP from quiescent RAF. Whether this leads to observed paradoxical pathway activation will in turn depend upon ensuing cellular events, potentially including changes in RAF phosphorylation state, RAS-binding, membrane localization and 14-3-3 rearrangements, and on the potency of a particular agent as an inhibitor of activated RAF dimers.
Many questions regarding RAF regulation remain. The structures described here and the ability to prepare full-length autoregulated and active BRAF will inform and enable detailed mechanistic studies of RAF activation and inhibitor pharmacology. In the long term, a deeper understanding of RAF regulation should aid in development of more effective and better tolerated therapeutics for RAF-driven cancers.
Methods
Preparation of BRAF/14-3-3 complexes from insect cells (Sf9).
Recombinant baculovirus expressing full-length human BRAF with an N-terminal His8-tag and a C-terminal StrepII tag was prepared using baculoviral transfer vector pAc8. Recombinant baculovirus expressing BRAF variant S365A was produced in the same manner. For protein production using the baculovirus/insect cell expression system, liter-scale cultures of Sf9 cells (4 liters total for a typical preparation) were infected with high-titer viral stocks expressing wild type or mutant BRAF (1% of final culture volume). Cells were harvested 65–72 h post-infection, lysed in lysis buffer (50 mM Tris pH 7.4, 150 mM NaCl, 2 mM MgCl2, 0.5 mM TCEP, 50 μM ATP-γS and protease inhibitor cocktail (ThermoFisher Scientific), and applied to Ni-NTA agarose beads (Qiagen). After washing with Buffer A supplemented with 20 mM imidazole (Buffer A contains 50 mM Tris pH 7.4, 150 mM NaCl, 2 mM MgCl2, 0.5 mM TCEP, 10 μM ATP-γS), bound proteins were eluted with Buffer A supplemented with 500 mM imidazole and adjusted to pH 8.0. Eluent was applied to a prepacked StrepTrap HP column (GE Lifescience) and washed with Buffer A adjusted to pH 8.0 (Buffer A’). Bound proteins were eluted with Buffer A’ supplemented with 10 mM desthiobiotin. The eluted complex was concentrated to approximately 2 mg/ml using an Amicon Ultra concentrator (50 MWCO, Millipore) and further purified by size-exclusion chromatography (SEC) on a Superdex 200 Increase 10/300 column or Superose 6 increase 10/300 (GE Lifescience) in Buffer A. Analysis of the purified samples by SDS-PAGE revealed the baculovirus-expressed BRAF co-purified at a high stoichiometry with insect-cell derived 14-3-3ε and 14-3-3ζ.
Preparation of BRAF/MEK/14-3-3 complexes from insect cells (Sf9).
Recombinant baculovirus expressing full length human MEK1 (either wild type or S218A/S222A) fused with an N-terminal His6-tag was prepared using baculoviral transfer vector pAc8. BRAF/MEK1/14-3-3 complexes (either wild type or with the desired BRAF and/or MEK mutants) were prepared by co-expression in insect cells using separate baculoviruses for MEK1 and BRAF. Liter-scale cultures (4 L total for a typical preparation) were co-infected with high-titer viral stocks expressing the desired BRAF and MEK1 variants at a 1:1.5 ratio (by volume, 1% culture volumes of BRAF virus, 1.5% of MEK1), and cells were harvested by centrifugation 65–72 h post-infection. BRAF/MEK/14-3-3 complexes were purified from cell pellets as described above for BRAF/14-3-3 complexes, but all buffers were supplemented with MEK inhibitor GDC-0623 to a final concentration of 2 μM. As with BRAF alone, co-expressed BRAF and MEK1 co-purified with insect-cell derived 14-3-3 ε and ζ.
Preparation of the BRAF/14-3-3 complex from mammalian cells (HEK293)
Full-length human BRAF bearing an N-terminal His8-tag and a C-terminal StrepII tag was cloned into pcDNA™5/FRT/TO vector. For protein production, liter-scale suspension cultures (2L total for a typical preparation) of HEK293 cells (Expi293F, ThermoFisher Scientific) were transfected using Expi293™ expression system according to the manufacturer’s protocol (ThermoFisher Scientific). Cells were harvested by centrifugation 48–60 h post-transfection. BRAF/14-3-3 complexes were purified from mammalian cell pellets as described above for isolation BRAF/14-3-3 from insect cells. Analysis of the purified sample by SDS-PAGE revealed that BRAF co-purified with mammalian cell-derived 14-3-3 isoforms.
Preparation of Spycatcher-MEK1 from insect cells (Hi5)
We prepared kinase-dead MEK1 (fused to Spycatcher to alter its electrophoretic mobility) for use as a substrate in in vitro BRAF activity assays. Recombinant baculovirus encoding full length human MEK1D190N bearing an N-terminal His6-tag for purification and a C-terminal Spy-tag was prepared using baculoviral transfer vector pAc8. For protein production, liter-scale cultures (2 liter total for a typical preparation) were infected with high-titer viral stocks expressing Spy-tagged MEK1D190N (1% of final culture volume). Cells were harvested 55–65 h post-infection, lysed in MEK lysis buffer (50 mM HEPES pH 7.4, 150 mM NaCl, 2 mM MgCl2, 0.5 mM TCEP), applied to Ni-NTA agarose beads (Qiagen). After washing with MEK lysis buffer supplemented with 20 mM imidazole, bound proteins were eluted with lysis buffer supplemented with 500 mM imidazole and adjusted to pH 7.4. To ensure that MEK1 was not phosphorylated, eluted protein was treated with Lambda phosphatase overnight at 4°C before further purification by size-exclusion chromatography on a Superdex 75 Increase 10/300 column in SEC Buffer (50 mM Tris pH 8.0, 150 mM NaCl, 2 mM MgCl2, 1 mM TCEP). Pooled SEC fractions containing Spy-tagged MEK1D190N were incubated with Spycatcher protein for covalent linkage, as described previously38. Analysis of the purified Spycatcher-MEKD190N protein by SDS-PAGE confirmed that it migrated as expected for a ~55kDa protein. Mass spectrometry and western blotting with pMEK1/2 antibody confirmed little or no phosphorylation on the MEK1 activation loop (S218 and S222).
Size-exclusion chromatography with multiangle light scattering (SEC-MALS).
The BRAFWT/MEK1AA/14-3-3 complex was applied to a Superdex 200 10/300 GL column (GE Healthcare) in 50 mM Tris-HCl pH 7.5, 150 mM NaCl, 2 mM MgCl2, 0.5 mM TCEP, 10 μM ATP-γS, 2 μM GDC-0623. In-line multi-angle light scattering analysis was performed with an OptiLab rEX refractive index detector followed by a miniDAWN TREOS light scattering detector, and data were analyzed with ASTRA (Wyatt Technology).
Kinase activity assay.
BRAF activity in SEC elution fractions was measured by diluting an aliquot of each fraction five-fold, and adding 1 μl of the diluted sample to 14 μl of a reaction mixture containing assay buffer (50 mM Tris pH 7.5, 150 mM NaCl, 10 mM MgCl2, 0.5 mM TCEP, and 1 mM sodium vanadate) supplemented with 2.67 μM Spycatcher-MEK1D190N as a substrate. Kinase reactions were started by addition of 5 μl of 4 mM ATP in assay buffer. After incubation for 20 minutes at 25°C, reactions were stopped by addition of SDS-PAGE sample buffer and heating to 95°C. Reaction products were resolved on a Novex™ 12% Tris-Glycine Midi gel (Invitrogen), and subsequently western blotted with anti-phosphoMEK1/2(S218/222) antibody (Cell Signaling Technology) to detect phosphorylation of the ~55 kDa Spycatcher-MEK substrate.
Time-course kinase assays of BRAFWT/MEKAA/14-3-3, BRAFS365A/MEKAA/14-3-3 and BRAFWT/14-3-3 samples were performed using the same reaction buffer and substrate concentrations described above, but each sample was diluted to 100 nM, and 20 μl was used in a final reaction volume of 200 μl (final enzyme concentration was 10 nM in the reaction mixture). After initiating the assay by addition of ATP, 20 μl aliquots were removed from the reaction at the designated time points and stopped by mixing with an equal volume of 5X SDS-PAGE sample buffer and heating to 95°C. Reaction products were analyzed by SDS-PAGE and western blotting for phosphoMEK1/2 as described above.
Pull-down assay for 14-3-3 association.
Recombinant baculoviruses expressing full-length human 14-3-3 β/α, γ, δ/ζ or ε and bearing an N-terminal Flag-tag were prepared using baculoviral transfer vector pAc8. BRAFWT and MEKAA were co-expressed with each of the four different human 14-3-3 isoforms in insect cells by co-infection. 100 ml of co-infected Sf9 cells were harvested 55–65 h post-infection, lysed in lysis buffer, then parallel aliquots of clarified lysate were applied to Strep-Tactin®XT magnetic beads (IBA GmbH) or Anti-DYKDDDDK magnetic Agarose (anti-FLAG, Pierce™). After washing beads with lysis buffer, bound proteins were eluted with SDS-PAGE sample buffer and resolved on 8% Bis-Tris PAGE gels. Parallel gels were western blotted using anti-14-3-3 (pan) and anti-Flag antibodies (Cell Signaling Technology).
Cryo-EM data acquisition and processing.
BRAFWT/MEK1AA/14-3-3 complex in SEC buffer (50 mM Tris-HCl pH 7.5, 150 mM NaCl, 2 mM MgCl2, 0.5 mM TCEP, 10 μM ATP-γS, 2 μM GDC-0623) was applied to glow-discharged holey carbon grids (Quantifoil R1.2/1.3, 400 mesh) and vitrified using a FEI Vitrobot Mark IV. Frozen hydrated samples were imaged on an FEI Titan Krios at 300 kV with a Gatan Quantum Image Filter with K2 Summit direct detection camera in super-resolution mode with a total exposure dose of ~50 electrons. 35 frames per movie were collected at a magnification of 130,000×, corresponding to 0.53 Å per pixel. In total, 8440 micrographs were collected at defocus values ranging from −1.8 to −3.3 μm from two data collections of 4097 and 4343 images (of which 1628 images in the later collection were tilted by 25° in an attempt to increase observed orientations). The movie frames were motion-corrected and dose-weighted by MotionCor239, downsampled to 1.06 Å per pixel and CTF parameters were estimated by CTFFIND440. Particle picking was carried out using crYOLO41 and template based particle picking within Relion42 giving 3,531,955 initial particles. Following successive rounds of 2D and 3D classification 427,592 particles were selected. Additional two rounds of 3D classification led to the final reconstruction of 4.1 Å from 165,298 particles. Per particle motion correction “particle polishing” alongside per particle CTF refinement was trialed with no improvement in resolution or map quality. Maps used for figures were filtered according to local resolution with b-factor sharpening within Relion42. Models were fit into the map using Coot43 and further refined with PHENIX44 and REFMAC545. Statistics for the final refinement are presented in Extended Data Table 1.
BRAFS365A/MEK1AA/14-3-3 complex in SEC buffer (50 mM Tris-HCl pH 7.5, 150 mM NaCl, 2 mM MgCl2, 0.5 mM TCEP, 10 μM ATP-γS, 2 μM GDC-0623) was applied to glow-discharged holey carbon grids (Quantifoil R1.2/1.3, 400 mesh) and vitrified using a Leica EM GP. Frozen hydrated samples were imaged on an FEI Talos Arctica at 200 kV with K3 Summit direct detection camera in counting mode with a total exposure dose of ~50 electrons. 42 frames per movie were collected at a magnification of 36,000×, corresponding to 1.11 Å per pixel. 3146 micrographs were collected at defocus values ranging from −2.0 to −3.0 μm. Initial particle picking was carried with crYOLO41 and ab-initio models were generated in cryoSPARC46 showing two distinct classes, one showing back-to-back BRAF kinase dimer, with MEK1 bound to each BRAF kinase domain, while the other only had a single MEK1 bound (“MEK-lite”). All following steps were carried out within Relion42. Reference based picking resulted 2,008,323 particles. Following 2D classification 1,441,851 particles were subjected to a guided 3D classification using single copies of the dimeric and “MEK-lite” as reference models. 705,222 dimer particles were then subjected to a further round of standard 3D classification leaving 425,135 particles. Following Bayesian polishing and 3D refinement this resulted in a reconstruction of 4.9 Å. In addition, 736,629 particles were identified as “MEK-lite” and following further 3D classification 595,672 particles were subjected to Bayesian polishing and 3D refinement resulting in a 5.7 Å reconstruction. Models were built for both reconstructions by rigid-body fitting the BRAF and MEK1 kinase domains from PDB entry 4MNE using Coot43. The 14-3-3 domain was modeled by rigid-body fitting of the insect cell 14-3-3 zeta domain from the autoinhibited BRAF/MEK/14-3-3 structure described here; each subunit of the 14-3-3 dimer was fit independently. C-terminal pS729 tails were manually built for each structure, with reliance on the autoinhibited structure for placement of pS729. For both reconstructions, cryo-EM maps were deposited in the Electron Microscopy Data Bank and polyalanine models were deposited in the Protein Data Bank. Data collection and image processing statistics for both structures are presented in Extended Data Table 1.
The mammalian cell-produced BRAFWT/14-3-3 complex in SEC buffer (50 mM Tris-HCl pH 7.5, 150 mM NaCl, 2 mM MgCl2, 0.5 mM TCEP, 10 μM ATP-γS, 2 μM GDC-0623) with/without 1μM GDC-0879 was applied to glow-discharged holey carbon grids (Quantifoil R1.2/1.3, 400 mesh) and vitrified using a Leica EM GP. Frozen hydrated samples were imaged on an FEI Titan Krios at 300 kV with a Gatan Quantum Image Filter with K3 Summit direct detection camera in counting mode with a total exposure dose of ~70 electrons. 50 frames per movie were collected at a magnification of 105,000×, corresponding to 0.85 Å per pixel. 4002 and 4418 micrographs per sample (with and without 1μM GDC-0879) were collected at defocus values ranging from −1.7 to −2.7 μm. The movies were downsampled to 1.7 Å and particle picking was carried out on the GDC-0879 sample with crYOLO41 giving 365,083 particles. Following two rounds of 2D classification 234,539 particles remained. Two further rounds of 3D classification within Relion42, using an initial model derived from cryoSPARC46, resulted in 66,215 particles leading to a 6.8 Å reconstruction after 3D refinement. The BRAFWT/14-3-3 model was constructed by rigid-body fitting the BRAF and MEK1 kinase domains from PDB entry 4MNE using Coot43. The 14-3-3 domain was modeled by rigid-body fitting of the human 14-3-3 zeta domain (PDB Entry 3NKX). Each subunit of the 14-3-3 dimer was fit independently, and the C-terminal pS729 tails were manually built. The cryo-EM map has been deposited in the Electron Microscopy Data Bank and the polyalanine model has been deposited in the Protein Data Bank. Data collection and image processing statistics for this structure are presented in Extended Data Table 1.
Expression and purification of the BRAF/MEK kinase domain complex.
For insect cell expression of the BRAF kinase domain in complex with MEK1, two recombinant baculovirus species were employed. The first was prepared using baculoviral transfer vector pFastBac Dual and encoded the BRAF kinase domain (BRAF residues 445–723, fused to an N-terminal His6-tag and a C-terminal chitin-binding domain) and human chaperone CDC37. The second baculovirus encoded full-length human MEK1AA, as described above. For protein production, liter-scale suspension cultures of Sf9 cells were co-infected with both viruses. Cells were harvested 60–66 hours post-infection and resuspended in lysis buffer (50 mM Tris pH 8.0, 250 mM NaCl, 5% glycerol and 20mM imidazole, 1 mM TCEP) with protease inhibitor cocktail (Roche). Resuspended cells were disrupted by sonication on wet ice, and the lysate was clarified by ultracentrifugation at 40,000 rpm for two hours. Clarified lysate was batch-bound to Ni-NTA beads and washed extensively with binding buffer before elution with elution buffer (50 mM Tris pH 8.0, 250 mM NaCl, 250 mM imidazole, 1 mM TCEP). The elution fractions were pooled and treated with 1:1000 molar ratio of TEV protease and 100 mM β-mercaptoethanesulfonic acid (MESNA) overnight to cleave N-terminal and C-terminal tags, and further purified by size-exclusion chromatography (Superdex 200 10/300, GE Healthcare) in storage buffer (50 mM HEPES pH 7.5, 150 mM NaCl, 1 mM TCEP). The fractions were analyzed by SDS-PAGE, and fractions corresponding to the BRAF/MEK kinase domain complex were pooled, concentrated to 8 mg/ml, and flash frozen.
BRAF/MEK kinase domain crystallization and structure determination.
For crystallization, an aliquot of the BRAF/MEK kinase complex was incubated with 5 mM MgCl2, 2 mM Adenosine 5′-(β,γ-imido)triphosphate (AMPPNP), and 0.2 mM GDC-0623 in storage buffer at 4°C overnight. Rod-shaped crystals suitable for structure determination were obtained by vapor diffusion in hanging drops using a reservoir solution consisting of 100 mM Bis-Tris pH 6.5, 200 mM ammonium sulfate, and 22% PEG 3350 at room temperature. Crystals were harvested and flash frozen in liquid nitrogen using additional 20% glycerol as a cryoprotectant. X-ray diffraction data were collected at 100 K using NE-CAT beamline ID-24-C at the Advance Photon Source, Argonne National Laboratory, at a wavelength of 0.979 Å. Data were integrated and merged using XDS47 and scaled using Aimless in the CCP4 suite48. The structure was phased by molecular replacement in PHASER49 using the relevant domains of the autoinhibited cryo-EM structure and PDB entry 4MNE as initial search models. GDC-0623 was placed into positive density in an initial Fo-Fc map and included in subsequent rounds of refinement using PHENIX.REFINE50. Successive manual refinement was performed using COOT43. The structure was refined to Rwork/Rfree values of 0.22/0.25 at a resolution of 2.58 Å. Data collection and refinement statistics are presented in Extended Data Figure 5a.
Mass spectrometry analysis.
BRAF complexes were digested separately with trypsin and Lys-C, desalted by C18, dried by vacuum centrifugation, and analyzed in triplicate by CE-MS using a ZipChip autosampler and CE instrument (908 Devices, Boston, MA) interfaced to a QExactive HF mass spectrometer (ThermoFisher Scientific, Waltham, MA). Peptides were loaded for 20 seconds on an HR chip and electrophoresis performed at 700 V/cm for 10 minutes, with pressure assist activated at 1 min. To identify BRAF phosphopeptides, digests were analyzed by data-dependent MS/MS. The five most abundant ions in each MS scan (60K resolution) were subjected to MS/MS (15K resolution, 30% collision energy). Dynamic exclusion was activated with a repeat count of 1 and an exclusion duration of 6 seconds. MS/MS spectra were converted to .mgf format using multiplierz software51,52, and searched against a database of BRAF using Mascot 2.6.1. Search parameters specified trypsin or Lys-C specificity with up to two missed cleavages, variable oxidation of methionine, variable phosphorylation of serine, threonine, or tyrosine, fixed carbamidomethylation of cysteine, and precursor and product ion tolerances of 10 ppm and 25 mmu, respectively. Identified sites of phosphorylation were confirmed using mzStudio software53. In experiments to determine stoichiometry of phosphorylation, digests were analyzed by CE-MS (MS1 scans with 15K resolution), with precursor peak areas used for quantification according to the following equations:
| (1) |
| (2) |
| (3) |
Correction factors for ionization efficiency were determined in separate experiments using either BRAF protein digests or synthetic BRAF peptide standards. Peptides were treated +/− alkaline phosphatase (pptase) and analyzed in triplicate by CE-MS as described above. After normalizing for loading amounts (using non-phosphorylatable BRAF peptides VFLPNK and LIDIAR for BRAF digests or a spiked standard peptide for BRAF synthetics), correction factors were calculated according to:
| (4) |
Because discovery experiments did not detect phosphorylation of MEK1 activation loop sites 218/222 (peptide 206LCDFGVSGQLIDSMANSFVGTR227) we estimated an upper bound of phosphorylation of these residues by analyzing digests +/− pptase treatment as above. In these experiments, we used targeted SIM scans of 206LCDFGVSGQLIDSMANSFVGTR227 and normalization peptides, and then calculated MEK1 activation loop phosphorylation as:
| (5) |
Data analysis and peak integration were performed using mzStudio software53.
To identify 14-3-3 proteins, MS/MS spectra from data-dependent CE-MS analyses of trypsin and Lys-C digested BRAF complexes were converted to .mgf format using multiplierz software51,52, and searched against a forward-reverse human protein database (uniprot) with Mascot 2.6.1 (same search parameters described above). Data were filtered to ~1% FDR, and peptide sequences mapped to genes using the multiplierz pep2gene tool52.
Sequence alignments.
For Extended Data Figs. 2a and 6, sequences were aligned using ClustalW and figures were prepared with ESPript 3.054.
Structural biology applications used in this project were compiled and configured by SBGrid55.
Extended Data
Extended Data Table 1.
Cryo-EM data collection, refinement and validation statistics.
| BRAFWT/MEK1AA/14-3-3 | BRAFS365A/MEK1AA/14-3-3 | BRAFWT/14-3-3 | ||
|---|---|---|---|---|
| (EMD-0541) (PDB 6NYB) | with two MEK (EMD-20550) (PDB 6Q0J) | with one MEK (EMD-20552) (PDB 6Q0T) | (EMD-20551) (PDB 6Q0K) | |
| Data collection and processing | ||||
| Magnification | 130,000 x | 36,000 x | 36,000 x | 105,000 x |
| Voltage (kV) | 300 | 200 | 200 | 300 |
| Electron exposure (e-/Å2) | ~50 | ~50 | ~50 | ~70 |
| Defocus range (μm) | −1.8 – −3.3 | −2.0 – −3.0 | −2.0 – −3.0 | −1.7 – −2.7 |
| Pixel size (Å) | 1.06 (2x binned) | 1.11 | 1.11 | 1.7 (2x binned) |
| Symmetry imposed | C1 | C1 | C1 | C1 |
| Initial particle images (no.) | 3,531,955 | 2,008,323 | 2,008,323 | 365,083 |
| Final particle images (no.) | 165,298 | 425,135 | 595,672 | 66,215 |
| Map resolution (Å) 0.143 FSC threshold | 4.1 | 4.9 | 5.7 | 6.8 |
| Refinement | ||||
| Initial model used (PDB code) | 5FD2, 4MNE, 6PP9, 4FJ3, 1 FAR, 3NKX | 4MNE, 6NYB | 4MNE, 6NYB | 4MNE, 3NKX |
| Map sharpening B factor (Å2) | −225 | |||
| Model composition | ||||
| Non-hydrogen atoms | 8811 | |||
| Protein residues | 1097 | |||
| Ligands | 3 | |||
| Metals | 3 | |||
| B factors (Å2) | ||||
| Protein | 125.4 | |||
| Ligand | 146.2 | |||
| R.m.s. deviations | ||||
| Bond lengths (Å) | 0.014 | |||
| Bond angles (°) | 1.750 | |||
| Validation | ||||
| MolProbity score | 2.18 | |||
| Clashscore | 6.69 | |||
| Poor rotamers (%) | 3.66 | |||
| Ramachandran plot | ||||
| Favored (%) | 94.43 | |||
| Allowed (%) | 5.39 | |||
| Disallowed (%) | 0.19 | |||
| Model vs Data | ||||
| CC (mask) | 0.74 | |||
| CC (box) | 0.75 | |||
| CC (peaks) | 0.62 | |||
| CC (volume) | 0.73 | |||
| Mean CC for ligands | 0.77 | |||
Extended Data Figure 1. Biochemical characterization of purified BRAF complexes and cryo-EM analysis of the autoinhibited BRAF/MEK1AA/14-3-3 complex.
a, The full-length, autoinhibited BRAF/MEK1AA/14-3-3ε,ζ complex used for cryo-EM structure determination. The elution profile from SEC on a Superdex 200 column is shown in the left panel, Coomassie-stained SDS-PAGE analysis of elution fractions is shown in the center panel, and multi-angle light scattering analysis (SEC-MALS) is shown in the right panel. SEC-MALS indicated a molar mass of 196 kDa; the calculated molecular weight of the complex is 192 kDa. b, Analysis of co-expression of human 14-3-3 isoforms with BRAF and MEK1AA in insect cells. Strep-tagged BRAF, MEK1AA and the indicated FLAG-tagged human 14-3-3 isoforms were co-expressed in Sf9 cells and BRAF/MEK/14-3-3 complexes were affinity-isolated from clarified lysates with either Strep-TactinXT (left four lanes) or anti-FLAG (right four lanes) magnetic beads. Parallel gels were blotted with an anti-14-3-3 antibody that recognizes all 14-3-3 isoforms (upper blot) or with an anti-FLAG antibody (lower blot). Note that even in the presence of robust over expression of these human isoforms, BRAF preferentially associated with the endogenous insect cell 14-3-3 proteins (as seen in the Strep-TactinXT-precipitated lanes of the Coomassie-stained gel). c, Mass spectrometry-based quantitation of selected phosphorylation sites in wild type and S365A BRAF complexes purified for structural analysis. d, Portion of a representative micrograph used for the autoinhibited BRAF/MEK1AA/14-3-3 reconstruction described here. e, Representative 2D class averages for the autoinhibited BRAF/MEK1AA/14-3-3 reconstruction. Scale bar is 10 nm. f, Fourier shell correlation (FSC) curves for the reconstruction. The horizontal line indicates a correlation of 0.143; the FSC curve for two half-maps (blue) the crosses this threshold at a resolution of 4.1Å. A correlation curve for the map versus the atomic model is plotted in red. g, The autoinhibited BRAF/MEK1AA/14-3-3 cryo-EM map filtered to 5 Å resolution and contoured at a lower level to reveal weaker density corresponding to the RBD domain. Map surface is colored by domain as in Fig. 1 in the main text. Unassigned densities (gray) can be ascribed to the RBD domain and other poorly structured elements as indicated. For gel source data, see Supplementary Figure 1. Experiments in panels a and b were repeated at least twice with similar results. Imaging experiments in d and e were repeated 4 times with similar results.
Extended Data Figure 2. 14-3-3 domain sequence alignment and interactions of the CRD domain in the autoinhibited state.
a, Sequence alignment of insect cell (Spodoptera frugiperda) and human 14-3-3 isoforms. Secondary structure is indicated above the alignment. Identically conserved residues are shaded red. Symbols above the alignment indicate contacts with the BRAF CRD domain (violet squares), kinase domain (blue triangles), and pS365 or pS729 segments (black circles). b, Interactions of the CRD domain. Domains contacting the CRD are shown with a transparent surface and the CRD domain is shown as a violet ribbon with gray spheres representing bound zinc atoms. Sidechains are shown for CRD residues that correspond to 7 (of 11 total) residues identified in an alanine scanning mutagenesis study of the CRAF CRD domain27. Alanine mutations in the corresponding residues increased RAS(G12V)-dependent activation of CRAF. Two mutations in this study fully activated CRAF in the absence of RAS(G12V); the corresponding BRAF residues are F247 and D249. F247 makes hydrophobic contacts with both the kinase C-lobe and the 14-3-3 domain, while D249 is positioned to form a salt-bridge with R691 in the kinase C-lobe. The remaining four residues are also at sites of interdomain contacts but are not illustrated (T241, K253, Q262 and K267).
Extended Data Figure 3. Interactions of the 14-3-3 dimer with BRAF in the autoinhibited state.
a-d, Cryo-EM density is shown at key sites of interaction that stabilize the autoinhibited complex, and domains are colored as in Figure 1. a, A portion of the interface between the CRD and 14-3-3 domain. b, The pS365 segment (CR2) bound in the recognition groove of the 14-3-3 domain. c, Contact between the α8-α9 loop of the 14-3-3 domain and the BRAF kinase domain. d, The C-terminal pS729 segment coordinated in the opposite recognition groove of the 14-3-3 dimer. The map is contoured at the same level in panels a-d. e, Front and back views of the reconstruction. We observe continuous density connecting the C-terminus of the BRAF kinase and the pS729 14-3-3 binding site (inset). f, Comparison of the binding mode of the pS365 segment in the present structure with that in a previously determined crystal structure of an isolated CRAF peptide bound to 14-3-3ζ (PDB entry 3NKX). The corresponding region of the present structure (with the pS365 segment shown with orange carbon atoms and the 14-3-3 domain in tan) is superimposed on the 3NKX crystal structure (shown in blue and cyan), revealing a close correspondence in conformations of the bound peptides. g, The BRAF CRD is a hotspot for RASopathy mutations, which map to sites of contact between the CRD (purple), kinase (blue), and 14-3-3 domains (tan), and are expected to destabilize the autoinhibited assembly. Sites of RASopathy mutations are shown in stick form and labeled. RASopathy mutations in the BRAF kinase domain (Q709) and CR2 region (red, S365) are also expected to destabilize these inhibitory intramolecular contacts.
Extended Data Figure 4. Additional views and analysis of the BRAF and MEK kinase domains in the autoinhibited BRAF/MEK1AA/14-3-3 complex.
a, Cryo-EM density map in the region of the BRAF active site showing bound ATP-γS. b, Cryo-EM density map in the region of the MEK1 active site indicating bound ADP, which is likely hydrolyzed from ATP-γS. Maps in panels a and b are contoured at the same level. c, Superposition of the BRAF/MEK1 component of the present autoinhibited cryo-EM structure (green and dark blue) with the previously reported crystal structure of a BRAF and MEK1 kinase domain complex (yellow and light blue, PDB entry 4MNE). The superposition is based on the MEK component of the structures, and it reveals a relative rotation of BRAF of approximately 5° about the C-lobe contact. d, Superposition of the BRAF kinase domain from the present structure with that of prior isolated BRAF/MEK kinase complex (PDB entry 4MNE). Note that the present structure (dark blue, with C-helix colored purple and the activation segment orange) exhibits key features of an autoinhibited state (C-helix out, with an inhibitory turn in the activation segment), whereas the prior structure (light blue) adopts an overall active conformation. e, Detailed view of a portion of the C-lobe contact between BRAF (blue) and MEK1 (green). f, Portions of the BRAF (blue) and MEK1 (green) activation segments interact in an anti-parallel orientation. Activating phosphorylation sites in the MEK1 activation loop are substituted with alanine in this structure (S218A, S222A), but neither residue is positioned appropriately for phosphorylation by BRAF. Note that our discussion of these interactions relies in part on the crystal structures referenced to build the atomic model, as the cryo-EM map in this region does not unambiguously define all sidechain conformations. g-j, Comparison of BRAF kinase domain conformations and relative N- and C-lobe orientations. g, Sulfonamide-containing BRAF inhibitors perturb the inactive conformation of BRAF. The BRAF kinase domain in the present structure (blue ribbon, with C-helix colored red and the activation segment orange) is superimposed on the structure of the BRAF kinase domain crystallized as a monomer with PLX4720 (gray, PDB ID 4WO5). The superposition is based on the C-lobes of both kinases, revealing an altered orientation of the N-lobe in the inhibitor-bound structure (a rotation of ~15°). Note also that the inhibitory turn in the activation segment helix is replaced by a short helix in the PLX4720 complex. h, Alternate view of the superposition shown in panel g, highlighting the axis of rotation (pink arrow) between the N-lobes. i, As in panel h, but with a representative inhibitor-bound dimeric BRAF structure superimposed (5CSW, a dabrafenib complex). The rotation axes for N-lobe rotations of dimer structures are shown as green arrows. Note that the orientation of the rotation axis is similar for all of the dimer structures, but almost orthogonal to that of the monomer structure in panel h. In both h and i, the Cα atoms of K522 are shown as spheres as a point of reference. j, Relative N-lobe rotation of WT and V600E BRAF crystal structures available in the Protein Data Bank (PDB) are compared with the present nucleotide-bound, autoinhibited structure. As illustrated in panels h and i, C-lobes of the BRAF kinase domains were superimposed, and the rotation required to bring the kinase N-lobes into register were calculated using PyMol. With the exception of 4MNE, all structures compared were determined in complex with inhibitors.
Extended Data Figure 5. Additional analysis of the autoinhibited BRAF/MEK kinase domain crystal structure.
a, Crystallographic data collection and refinement statistics for the structure of the BRAF kinase domain (BRAFKD) in complex with MEK1AA, AMPPNP and MEK inhibitor GDC-0623. Data were recorded from a single crystal. b, The autoinhibited BRAF/MEK kinase domain crystal structure is superimposed on the corresponding region of the autoinhibited cryo-EM structure. c, ATP-analog AMPPNP is extensively coordinated in the autoinhibited state. Hydrogen bonds from coordinating residues are indicated by dashed lines. d, MEK1 residue E102 in the β3-αC loop is positioned to form a hydrogen bond with a ribose hydroxyl of the nucleotide bound in the BRAF active site. e, Rare but recurrent oncogenic mutations in MEK1 map to the region of the N-terminal helix. A small, in-frame deletion of two residues (E102/I103) in the β3-αC loop maps to the region of the interface between BRAF and MEK1. f, RASopathy mutations in BRAF illustrated in the inactive conformation of the kinase domain. As with oncogenic mutations in many of the same residues, RASopathy-associated mutations will perturb nucleotide binding and/or the stability of the inhibitory turn. Interestingly, residues E501 and T599 form a hydrogen bond (dashed line) that appears to contribute to the stability of the inhibitory turn.
Extended Data Figure 6. RAF sequence alignment.
Human ARAF, BRAF and CRAF sequences are aligned and identically conserved residues are shaded red. Secondary structure elements are indicated above the alignment. Symbols above the alignment indicate residues that in the autoinhibited structure lie in the interface with MEK1 (blue circles), the CRD/14-3-3 interface (violet squares), the CRD/kinase domain interface (blue triangles), and the 14-3-3/kinase domain interface (yellow stars).
Extended Data Figure 7. Purification and characterization of wild type and S365A BRAF complexes.
a, BRAFS365A was co-expressed with MEK1AA in insect cells, purified by serial Ni-NTA agarose and StrepTrapHP affinity chromatography, and subjected to SEC on Superose 6. The SEC elution trace is shown in the left panel with a Coomassie-stained SDS-PAGE gel of elution fractions to the right. A parallel gel was blotted with an antibody against pS729 (lower right). BRAF activity in each fraction was measured in a MEK phosphorylation assay (upper right, see Methods for assay details.). b and c, Side-by-side comparison of BRAFWT complexes isolated from insect cells without (panel b) and with (panel c) co-expression of MEK1AA. Complexes were purified by serial Ni-NTA agarose and StrepTrapHP affinity chromatography and subjected to SEC on Superose 6. The SEC elution traces are shown in the left panels with Coomassie-stained SDS-PAGE gels of elution fractions to the right. BRAF activity in each fraction was measured in a MEK phosphorylation assay as described above (upper right). Note that co-expression of MEK1 markedly decreases the void peak and allows isolation of a late-eluting peak (~15 ml) with little MEK-phosphorylation activity that corresponds to the autoinhibited BRAF/MEK1/14-3-3 monomer complex (panel c, fractions B8-C3). d, BRAFWT was expressed in mammalian HEK293 cells, purified by serial Ni-NTA agarose and StrepTrapHP affinity chromatography, and subjected to SEC on Superdex 200. e, Elution fractions from the BRAFWT/14-3-3 SEC run in panel d are analyzed by SDS-PAGE and western blotting, revealing that BRAF co-purifies with endogenous human 14-3-3 proteins. Fractions were also blotted for total BRAF (anti-StrepII), pS365 and pS729. f, Mass spectrometry analysis of trypsin and Lys-C protease digests of peak fractions of the BRAF/14-3-3 complex from HEK293 cells revealed multiple peptide sequences that mapped uniquely to six of the seven human 14-3-3 isoforms. The δ and α isoforms are phosphorylation variants of ζ and β, respectively. For gel source data, see Supplementary Figure 1. SEC experiments were repeated at least 3 times (a-e), activity assays 2 (a) and 1 (b, c) times, and blotting 2 times (e) with similar results.
Extended Data Figure 8. Cryo-EM imaging of dimeric, active-state BRAF complexes and mass spectrometry-based measurement of phosphorylation stoichiometry in BRAF/14-3-3 and BRAF/MEK1/14-3-3 complexes.
a, Representative 2D-class averages for the BRAFS365A/MEK1AA/14-3-3 complex. Scale bar is 10 nm. b, Fourier Shell Correlation (FSC) curves for the BRAFS365A/MEK1AA/14-3-3 reconstructions presented in Fig. 4 in the main text. c, Size-exclusion chromatography (Superose 6) traces for the indicated affinity-isolated BRAF complexes, prepared using insect or mammalian cells as described in Extended Data Fig. 7 and Methods. SEC experiments were repeated at least three times with similar results. d-f, Percent phosphorylation of selected BRAF sites in successive elution fractions is plotted for each sample analyzed in panel c. Fractional phosphorylation of these sites was measured using a mass spectrometry-based assay (see Methods). d, Insect cell-produced BRAFWT/14-3-3 complex. e, Mammalian cell-produced BRAFWT/14-3-3 complex. f, Insect cell-produced BRAFWT/MEK1AA/14-3-3 complex prepared by BRAF and MEK1 co-expression. In d-f, note the high fractional phosphorylation of S729 in all samples, and the negligible phosphorylation of activation segment sites T599 and S602. g, Representative 2D-class averages for BRAFWT/14-3-3 complexes prepared from mammalian cells with (upper row) and without (lower row) addition of BRAF inhibitor GDC-0879 (1 μM). Both samples yielded class averages indicative of the same particle architecture, but those of the drug-treated sample revealed better-defined secondary structure. Scale bar is 10 nm. h, FSC curve for the BRAFWT/14-3-3 reconstruction. i, Single-particle reconstruction of the mammalian cell-produced BRAFWT/14-3-3 complex treated with GDC-0879. The reconstruction reveals a back-to-back BRAF kinase domain dimer with a 14-3-3 dimer bridging between its C-terminal pS729 tails. Comparison of these front and back views reveals the highly asymmetric position of the 14-3-3 dimer with respect to the dimerized kinase domains. Imaging experiments in panels a and g were repeated 2 times with independent preparations with similar results.
Extended Data Figure 9. Structural snapshots outline a model for RAF activation.
The RBD domain is exposed in the context of the autoinhibited BRAF/MEK/14-3-3 monomer complex, allowing high-affinity binding to farnesylated, GTP-loaded RAS at the plasma membrane. We propose that “extraction” of the CRD domain upon binding to prenylated RAS at the membrane is a key step in RAF activation. Without the stabilizing interactions of the CRD domain, the 14-3-3 domain can release from the BRAF kinase domain and pS365 segment to form an “open” monomer. We expect the RAF/MEK kinase module of the open monomer to maintain its inactive, ATP-bound conformation as observed in the crystal structure described here. Finally, the 14-3-3 domain can rearrange to bind the C-terminal pS729 sites of two open RAF molecules, driving formation of the active, back-to-back RAF dimer. As illustrated here, the stoichiometry of 14-3-3 binding changes upon activation, but we do not exclude the possibility that a second 14-3-3 dimer remains associated with the complex, for example by bridging the pS365 segments. Symbols: KD, RAF kinase domain; Red circles (pSer) represent the pS365 and pS729 14-3-3 binding segments.
Supplementary Material
Acknowledgements
This work was supported in part by the PLGA fund at the Pediatric Brain Tumor Foundation, by Novartis Institutes for Biomedical Research, and by NIH grants P50 CA165962 (M.J.E.), PO1 CA154303 (M.J.E.) and R50 CA221830 (E.P.). Cryo-EM imaging for the autoinhibited structure was carried out at the University of Massachusetts Medical School Cryo-EM Core Facility, and we thank Drs. C. Xu and K. Song for their guidance in image acquisition. Active-state structures were imaged at the Harvard Cryo-EM Center for Structural Biology. Diffraction data for the BRAF/MEK1 kinase complex crystal structure were recorded at beamline 24-ID-C of the Northeast Collaborative Access Team at the Advanced Photon Source, Argonne National Laboratory, which is supported in part by the Department of Energy and NIH grant GM124165. We thank M. Kostic for critical reading and editing of the manuscript.
Footnotes
Competing Interests: This work was supported in part by a sponsored research agreement from Novartis Institutes for Biomedical Research (NIBR) and M.J.E. has been a consultant to NIBR.
Data Availability
Three-dimensional cryo-EM density maps have been deposited in the Electron Microscopy Data Bank (EMDB) with accession codes EMD-0541, EMD-20550, EMD-20552, and EMD-20551. Atomic coordinates corresponding to these cryo-EM reconstructions have been deposited in the Protein Data Bank (PDB) with accession codes 6NYB, 6Q0J, 6Q0T, and 6Q0K. Structure factors and atomic coordinates for the BRAFKD/MEK1AA crystal structure have been deposited in the PDB with accession code 6PP9.
References
- 1.Lavoie H & Therrien M Regulation of RAF protein kinases in ERK signalling. Nature reviews. Molecular cell biology 16, 281–298, doi: 10.1038/nrm3979 (2015). [DOI] [PubMed] [Google Scholar]
- 2.Simanshu DK, Nissley DV & McCormick F RAS Proteins and Their Regulators in Human Disease. Cell 170, 17–33, doi: 10.1016/j.cell.2017.06.009 (2017). [DOI] [PMC free article] [PubMed] [Google Scholar]
- 3.Terrell EM & Morrison DK Ras-Mediated Activation of the Raf Family Kinases. Cold Spring Harb Perspect Med 9, doi: 10.1101/cshperspect.a033746 (2019). [DOI] [PMC free article] [PubMed] [Google Scholar]
- 4.Holderfield M, Deuker MM, McCormick F & McMahon M Targeting RAF kinases for cancer therapy: BRAF-mutated melanoma and beyond. Nature reviews. Cancer 14, 455–467, doi: 10.1038/nrc3760 (2014). [DOI] [PMC free article] [PubMed] [Google Scholar]
- 5.Sanchez-Vega F et al. Oncogenic Signaling Pathways in The Cancer Genome Atlas. Cell 173, 321–337 e310, doi: 10.1016/j.cell.2018.03.035 (2018). [DOI] [PMC free article] [PubMed] [Google Scholar]
- 6.Davies H et al. Mutations of the BRAF gene in human cancer. Nature 417, 949–954, doi: 10.1038/nature00766 (2002). [DOI] [PubMed] [Google Scholar]
- 7.Gardino AK, Smerdon SJ & Yaffe MB Structural determinants of 14-3-3 binding specificities and regulation of subcellular localization of 14-3-3-ligand complexes: a comparison of the X-ray crystal structures of all human 14-3-3 isoforms. Semin Cancer Biol 16, 173–182, doi: 10.1016/j.semcancer.2006.03.007 (2006). [DOI] [PubMed] [Google Scholar]
- 8.Ghosh S et al. The cysteine-rich region of raf-1 kinase contains zinc, translocates to liposomes, and is adjacent to a segment that binds GTP-ras. J Biol Chem 269, 10000–10007 (1994). [PubMed] [Google Scholar]
- 9.Hekman M et al. Associations of B- and C-Raf with cholesterol, phosphatidylserine, and lipid second messengers: preferential binding of Raf to artificial lipid rafts. J Biol Chem 277, 24090–24102, doi: 10.1074/jbc.M200576200 (2002). [DOI] [PubMed] [Google Scholar]
- 10.Leonard TA & Hurley JH Regulation of protein kinases by lipids. Curr Opin Struct Biol 21, 785–791, doi: 10.1016/j.sbi.2011.07.006 (2011). [DOI] [PMC free article] [PubMed] [Google Scholar]
- 11.Rajakulendran T, Sahmi M, Lefrancois M, Sicheri F & Therrien M A dimerization-dependent mechanism drives RAF catalytic activation. Nature 461, 542–545, doi: 10.1038/nature08314 (2009). [DOI] [PubMed] [Google Scholar]
- 12.Weber CK, Slupsky JR, Kalmes HA & Rapp UR Active Ras induces heterodimerization of cRaf and BRaf. Cancer research 61, 3595–3598 (2001). [PubMed] [Google Scholar]
- 13.Rushworth LK, Hindley AD, O’Neill E & Kolch W Regulation and role of Raf-1/B-Raf heterodimerization. Mol Cell Biol 26, 2262–2272, doi: 10.1128/MCB.26.6.2262-2272.2006 (2006). [DOI] [PMC free article] [PubMed] [Google Scholar]
- 14.Haling JR et al. Structure of the BRAF-MEK complex reveals a kinase activity independent role for BRAF in MAPK signaling. Cancer cell 26, 402–413, doi: 10.1016/j.ccr.2014.07.007 (2014). [DOI] [PubMed] [Google Scholar]
- 15.Diedrich B et al. Discrete cytosolic macromolecular BRAF complexes exhibit distinct activities and composition. EMBO J 36, 646–663, doi: 10.15252/embj.201694732 (2017). [DOI] [PMC free article] [PubMed] [Google Scholar]
- 16.Nassar N et al. The 2.2 A crystal structure of the Ras-binding domain of the serine/threonine kinase c-Raf1 in complex with Rap1A and a GTP analogue. Nature 375, 554–560, doi: 10.1038/375554a0 (1995). [DOI] [PubMed] [Google Scholar]
- 17.Mott HR et al. The solution structure of the Raf-1 cysteine-rich domain: a novel ras and phospholipid binding site. Proceedings of the National Academy of Sciences of the United States of America 93, 8312–8317 (1996). [DOI] [PMC free article] [PubMed] [Google Scholar]
- 18.Wan PT et al. Mechanism of activation of the RAF-ERK signaling pathway by oncogenic mutations of B-RAF. Cell 116, 855–867 (2004). [DOI] [PubMed] [Google Scholar]
- 19.Improta-Brears T, Ghosh S & Bell RM Mutational analysis of Raf-1 cysteine rich domain: requirement for a cluster of basic aminoacids for interaction with phosphatidylserine. Mol Cell Biochem 198, 171–178 (1999). [DOI] [PubMed] [Google Scholar]
- 20.Travers T et al. Molecular recognition of RAS/RAF complex at the membrane: Role of RAF cysteine-rich domain. Sci Rep 8, 8461, doi: 10.1038/s41598-018-26832-4 (2018). [DOI] [PMC free article] [PubMed] [Google Scholar]
- 21.Clark GJ et al. 14-3-3 zeta negatively regulates raf-1 activity by interactions with the Raf-1 cysteine-rich domain. J Biol Chem 272, 20990–20993 (1997). [DOI] [PubMed] [Google Scholar]
- 22.Molzan M et al. Impaired binding of 14-3-3 to C-RAF in Noonan syndrome suggests new approaches in diseases with increased Ras signaling. Mol Cell Biol 30, 4698–4711, doi: 10.1128/MCB.01636-09 (2010). [DOI] [PMC free article] [PubMed] [Google Scholar]
- 23.Thevakumaran N et al. Crystal structure of a BRAF kinase domain monomer explains basis for allosteric regulation. Nature structural & molecular biology 22, 37–43, doi: 10.1038/nsmb.2924 (2015). [DOI] [PubMed] [Google Scholar]
- 24.Rauen KA The RASopathies. Annu Rev Genomics Hum Genet 14, 355–369, doi: 10.1146/annurev-genom-091212-153523 (2013). [DOI] [PMC free article] [PubMed] [Google Scholar]
- 25.Fischmann TO et al. Crystal structures of MEK1 binary and ternary complexes with nucleotides and inhibitors. Biochemistry 48, 2661–2674, doi: 10.1021/bi801898e (2009). [DOI] [PubMed] [Google Scholar]
- 26.Michaud NR, Fabian JR, Mathes KD & Morrison DK 14-3-3 is not essential for Raf-1 function: identification of Raf-1 proteins that are biologically activated in a 14-3-3- and Ras-independent manner. Mol Cell Biol 15, 3390–3397 (1995). [DOI] [PMC free article] [PubMed] [Google Scholar]
- 27.Daub M et al. The RafC1 cysteine-rich domain contains multiple distinct regulatory epitopes which control Ras-dependent Raf activation. Mol Cell Biol 18, 6698–6710 (1998). [DOI] [PMC free article] [PubMed] [Google Scholar]
- 28.Sarkozy A et al. Germline BRAF mutations in Noonan, LEOPARD, and cardiofaciocutaneous syndromes: molecular diversity and associated phenotypic spectrum. Hum Mutat 30, 695–702, doi: 10.1002/humu.20955 (2009). [DOI] [PMC free article] [PubMed] [Google Scholar]
- 29.Zhang BH & Guan KL Activation of B-Raf kinase requires phosphorylation of the conserved residues Thr598 and Ser601. EMBO J 19, 5429–5439, doi: 10.1093/emboj/19.20.5429 (2000). [DOI] [PMC free article] [PubMed] [Google Scholar]
- 30.Imielinski M et al. Oncogenic and sorafenib-sensitive ARAF mutations in lung adenocarcinoma. The Journal of clinical investigation 124, 1582–1586, doi: 10.1172/JCI72763 (2014). [DOI] [PMC free article] [PubMed] [Google Scholar]
- 31.Pfister S et al. BRAF gene duplication constitutes a mechanism of MAPK pathway activation in low-grade astrocytomas. The Journal of clinical investigation 118, 1739–1749, doi: 10.1172/JCI33656 (2008). [DOI] [PMC free article] [PubMed] [Google Scholar]
- 32.Hatzivassiliou G et al. Mechanism of MEK inhibition determines efficacy in mutant KRAS-versus BRAF-driven cancers. Nature 501, 232–236, doi: 10.1038/nature12441 (2013). [DOI] [PubMed] [Google Scholar]
- 33.Ishii N et al. Enhanced inhibition of ERK signaling by a novel allosteric MEK inhibitor, CH5126766, that suppresses feedback reactivation of RAF activity. Cancer research 73, 4050–4060, doi: 10.1158/0008-5472.CAN-12-3937 (2013). [DOI] [PMC free article] [PubMed] [Google Scholar]
- 34.Lito P et al. Disruption of CRAF-mediated MEK activation is required for effective MEK inhibition in KRAS mutant tumors. Cancer cell 25, 697–710, doi: 10.1016/j.ccr.2014.03.011 (2014). [DOI] [PMC free article] [PubMed] [Google Scholar]
- 35.Karoulia Z, Gavathiotis E & Poulikakos PI New perspectives for targeting RAF kinase in human cancer. Nature reviews. Cancer 17, 676–691, doi: 10.1038/nrc.2017.79 (2017). [DOI] [PMC free article] [PubMed] [Google Scholar]
- 36.Hymowitz SG & Malek S Targeting the MAPK Pathway in RAS Mutant Cancers. Cold Spring Harb Perspect Med 8, doi: 10.1101/cshperspect.a031492 (2018). [DOI] [PMC free article] [PubMed] [Google Scholar]
- 37.Jin T et al. RAF inhibitors promote RAS-RAF interaction by allosterically disrupting RAF autoinhibition. Nat Commun 8, 1211, doi: 10.1038/s41467-017-01274-0 (2017). [DOI] [PMC free article] [PubMed] [Google Scholar]
- 38.Zakeri B, Fierer JO, Celik E, Chittock EC, Schwarz-Linek U, Moy VT, Howarth M. Peptide tag forming a rapid covalent bond to a protein, through engineering a bacterial adhesin. Proc Natl Acad Sci U S A 109(12), E690–697 (2012). [DOI] [PMC free article] [PubMed] [Google Scholar]
- 39.Zheng SQ, Palovcak E, Armache JP, Verba KA, Cheng Y, Agard DA MotionCor2: anisotropic correction of beam-induced motion for improved cryo-electron microscopy. Nat Methods. 14, 331–332 (2017). [DOI] [PMC free article] [PubMed] [Google Scholar]
- 40.Rohou A and Grigorieff N CTFFIND4: Fast and accurate defocus estimation from electron micrographs. J Struct Biol. 192, 216–21 (2015). [DOI] [PMC free article] [PubMed] [Google Scholar]
- 41.Wagner T, Merino F, Stabrin M, Moriya T, Antoni C, Apelbaum A, Hagel P, Sitsel O, Raisch T, Prumbaum D, Quentin D, Roderer D, Tacke S, Siebolds B, Schubert E, Shaikh TR, Lill P, Gatsogiannis C, Raunser S. SPHIRE-crYOLO: A fast and well-centering automated particle picker for cryo-EM. Commun Biol. 2, 218 (2019). [DOI] [PMC free article] [PubMed] [Google Scholar]
- 42.Zivanov J, Nakane T, Forsberg BO, Kimanius D, Hagen WJ, Lindahl E, Scheres SH. New tools for automated high-resolution cryo-EM structure determination in RELION-3 Elife. November 9;7 pii: e42166. doi: 10.7554/eLife.42166 (2018). [DOI] [PMC free article] [PubMed] [Google Scholar]
- 43.Emsley P, Lohkamp B, Scott WG, Cowtan K Features and development of Coot. Acta Crystallogr D Biol Crystallogr. 66, 486–501 (2010). [DOI] [PMC free article] [PubMed] [Google Scholar]
- 44.Adams PD, Afonine PV, Bunkóczi G, Chen VB, Davis IW, Echols N, Headd JJ, Hung LW, Kapral GJ, Grosse-Kunstleve RW, McCoy AJ, Moriarty NW, Oeffner R, Read RJ, Richardson DC, Richardson JS, Terwilliger TC, Zwart PH PHENIX: a comprehensive Python-based system for macromolecular structure solution. Acta Crystallogr D Biol Crystallogr. 66, 213–221 (2010). [DOI] [PMC free article] [PubMed] [Google Scholar]
- 45.Murshudov GN et al. REFMAC5 for the refinement of macromolecular crystal structures. Acta Crystallogr. Sect. D Biol. Crystallogr 67, 355–367 (2011). [DOI] [PMC free article] [PubMed] [Google Scholar]
- 46.Punjani A, Rubinstein JL, Fleet DJ, Brubaker MA. cryoSPARC: algorithms for rapid unsupervised cryo-EM structure determination Nat Methods. 3, 290–296 (2017). [DOI] [PubMed] [Google Scholar]
- 47.Kabsch W XDS. Acta Crystallogr. D66, 125–132 (2010). [DOI] [PMC free article] [PubMed] [Google Scholar]
- 48.Potterton E, Briggs P, Turkenburg M, and Dodson E A graphical user interface to the CCP4 program suite Acta. Cryst D59 1131–1137 (2003). [DOI] [PubMed] [Google Scholar]
- 49.McCoy AJ, Grosse-Kunstleve RW, Adams PD, Winn MD, Storoni LC, and Read RJ Phaser crystallographic software. J. Appl. Crystallogr 40, 658–674 (2007). [DOI] [PMC free article] [PubMed] [Google Scholar]
- 50.Afonine PV, Grosse-Kunstleve RW, Echols N, Headd JJ, Moriarty NW, Mustyakimov M, Terwilliger TC, Urzhumtsev A, Zwart PH, and Adams PD Towards automated crystallographic structure refinement with phenix.refine. Acta Crystallogr D Biol Crystallogr 68, 352–67(2012). [DOI] [PMC free article] [PubMed] [Google Scholar]
- 51.Alexander WM; Ficarro SB; Adelmant G; Marto JA Multiplierz v2.0: A python-based ecosystem for shared access and analysis of native mass spectrometry data. Proteomics 17, (2017). [DOI] [PubMed] [Google Scholar]
- 52.Parikh JR; Askenazi M; Ficarro SB; Cashorali T; Webber JT; Blank NC; Zhang Y; Marto JA Multiplierz: An extensible api based desktop environment for proteomics data analysis. BMC Bioinformatics 10, 364 (2009). [DOI] [PMC free article] [PubMed] [Google Scholar]
- 53.Ficarro SB; Alexander WM; Marto JA Mzstudio: A dynamic digital canvas for user-driven interrogation of mass spectrometry data. Proteomes 5, 20 (2017). [DOI] [PMC free article] [PubMed] [Google Scholar]
- 54.Robert X and Gouet P Deciphering key features in protein structures with the new ENDscript server. Nucl. Acids Res 42(W1), W320–W324 (2014). (freely accessible online). [DOI] [PMC free article] [PubMed] [Google Scholar]
- 55.Morin A, Eisenbraun B, Key J, Sanschagrin PC, Timony MA, Ottaviano M, Sliz P. Collaboration gets the most out of software. Elife. September 10;2:e01456 (2013) [DOI] [PMC free article] [PubMed] [Google Scholar]
Associated Data
This section collects any data citations, data availability statements, or supplementary materials included in this article.


