

Abstract
As surface ligands play a critical role in the colloidal stability and optoelectronic properties of semiconductor nanocrystals, we used solution NMR experiments to investigate the surface coordination chemistry of Ge nanocrystals synthesized by a microwave-assisted reduction of GeI2 in oleylamine. The as-synthesized Ge nanocrystals are coordinated to a fraction of strongly bound oleylamide ligands (with covalent X-type Ge–NHR bonds) and a fraction of more weakly bound (or physisorbed) oleylamine, which readily exchanges with free oleylamine in solution. The fraction of strongly bound oleylamide ligands increases with increasing synthesis temperature, which also correlates with better colloidal stability. Thiol and carboxylic acid ligands bind to the Ge nanocrystal surface only upon heating, suggesting a high kinetic barrier to surface binding. These incoming ligands do not displace native oleylamide ligands but instead appear to coordinate to open surface sites, confirming that the as-prepared nanocrystals are not fully passivated. These findings will allow for a better understanding of the surface chemistry of main group nanocrystals and the conditions necessary for ligand exchange to ultimately maximize their functionality.
Graphical Abstract

Comprehensive solution NMR experiments reveal the binding modes of the native ligands to Ge nanocrystals synthesized via microwave-assisted reduction in oleylamine.
Introduction
Nanocrystals of Ge, a group IV semiconductor, have been investigated as an alternative to Si nanocrystals for many years as a result of their superior absorption coefficient, charge transport capabilities, narrow bulk band gap (0.67 eV at 300 K), and fairly large Bohr exciton radius (ca. 24 nm), which allows for a size-tunable band gap.1,2 These collective properties make Ge nanocrystals appealing for a range of optoelectronic applications, including bioimaging and solar energy conversion.3–5 It is well established that the properties of semiconductor nanocrystals are highly dependent on the surface ligands that fill out the coordination shell of their surface atoms.6–10 The long-chain aliphatic native ligands that are typically present from the nanocrystal synthesis (e.g., C18 oleylamine) impart solution dispersibility in nonpolar organic solvents; however, many potential applications of Ge nanocrystals require the exchange of such native ligands with new ligands that will, for example, improve their charge mobility and conductivity in nanocrystal solids,11 or allow them to be dispersed in polar, biologically relevant media.12
Beginning with the work of Boyle et al. in 2005,13 synthesizing colloidal Ge nanocrystals by the high-temperature chemical reduction of Ge(II) and/or Ge(IV) precursors in long-chain aliphatic primary amines has become common practice,12,14–16 resulting in nanocrystals passivated by surface-coordinated amine ligands. While only a few ligand exchange reactions on these Ge nanocrystals have been reported thus far, it has been demonstrated that the native primary amine ligands can be at least partially exchanged with thiols,12,17 polyethyleneimine,11 and polysulfides18 via room temperature exchange reactions. When colloidal Ge nanocrystals are synthesized by the chemical reduction of GeI2 in oleylamine by microwave heating, instead of conventional heating, the resulting nanocrystals are similarly supported by surface oleylamine ligands;19,20 however, it was reported that these native oleylamine ligands can only be efficiently exchanged with thiols after surface reduction with hydrazine followed by heating the nanocrystals in neat thiol.1 In order to rationally design and execute ligand exchange reactions for Ge and other main group nanocrystals moving forward, a better understanding of the fundamental coordination chemistry of the nanocrystal surface must be achieved.
Herein, we use solution NMR spectroscopy to determine the binding mode of the native oleylamine ligands to Ge nanocrystals synthesized via microwave-assisted reduction. Based on exchange reactions with various amine/ammonium, thiol, and carboxylic acid ligands, we posit that the as-synthesized Ge nanocrystals are coordinated to a fraction of strongly bound oleylamide ligands (with covalent, X-type Ge–NHR bonds) and a fraction of more weakly bound (or physisorbed) oleylamine. Metal–amide surface ligands have been previously speculated to support other main group (i.e., In, Ga, Bi, Sb and Sn) nanocrystals prepared by the reduction of metal amide precursors formed in situ,21,22 and have been experimentally confirmed in the case of Si nanocrystals;23 however, this provides the first evidence for their existence in Ge nanocrystals.
Experimental
Chemicals and General Considerations.
All chemicals were used without any further purification, except toluene-d8. Oleylamine (cis-9-octadecen-1-amine (CAS registry number 112-90-3)) was purchased from TCI America (>50% amine) and was used after degassing under reduced pressure at 150 °C for a minimum of 120 min. A 1H NMR spectrum of oleylamine after vacuum drying at 150 °C gives an integrated [CH2]:[NH2] ratio of 14.5, which is very close to the theoretical ratio of 15. This suggests the technical grade oleylamine is fairly pure, as no other functional groups are observed in the NMR spectrum (Fig. S1†),21 although we cannot rule out the presence of small amounts of impurities, such as amides and nitroalkanes, that have been previously reported to be in technical grade oleylamine.24 In addition, a Raman spectrum of the technical grade oleylamine exhibits two bands in the frequency range of C=C stretches (~1650 cm–1), suggesting a mixture of cis and trans isomers, with an intensity ratio of 5:1 (Fig. S2†).24 Germanium(II) iodide (GeI2) was purchased from Prof. Richard Blair’s laboratory (University of Central Florida) and was characterized by powder X-ray diffraction to be phase-pure.25 Methanol, toluene and hexane were purchased from Fisher Scientific, purified using a commercial solvent purification system, and stored in a glove box under argon. Toluene-d8 (99+%) was purchased from Acros Organics and was freeze-pump-thawed 3x to degas and prevent particle oxidation. Undec-10-ene-1-amine (95%) was purchased from Enamine. Undec-10-ene-1-thiol was synthesized according to a procedure outlined by Knauf et al.26 10-undecenoic acid (99%) was purchased from Alfa Aesar. Fuming hydrochloric acid (HCl) (37%) was purchased from EMD Millipore. Deuterium oxide (D2O) (99.6%) was purchased from Cambridge Isotope Laboratories. All syntheses, purifications, and ligand titrations were performed using air-free techniques.
Ge Nanocrystal Synthesis and Purification.
All Ge nanocrystal syntheses were carried out in a CEM microwave reactor (Discover SP). A typical synthesis involves the addition of 130.6 mg of GeI2 (0.40 mmol) into a 35 mL microwave reaction tube (purchased from CEM) followed by the addition of 8 mL (24.3 mmol) of degassed oleylamine using a calibrated pipet in an Ar-filled glovebox. The sealed contents of the microwave tube are sonicated in a water bath until complete dissolution of the GeI2 is achieved. The dissolution of GeI2 results in a yellow colored solution. Typical reaction conditions involve heating the system for 60 min at 210 °C, 230 °C, 250 °C and 270 °C. The dark brown product is isolated in the glove box without exposure to ambient conditions. The Ge nanocrystals were purified 2 to 4 cycles using methanol as anti-solvent, and toluene and hexanes as nonpolar solvents by centrifugation (8500 rpm or 10016 rcf) for 5–10 min. The colorless supernatant is discarded, and the brown precipitate is dispersed in ca. 4 mL of hexanes (~7–10 mg/mL).
Powder X-Ray Diffraction (XRD).
Powder X-ray diffraction (PXRD) patterns were collected by drop-casting the suspension of Ge nanocrystals in hexane onto a quartz substrate or silicon (Si510) single-crystal zero-background holder. The dark brown thin film upon hexanes evaporation was then scanned on a Bruker D8 Advance diffractometer (Cu Kα, 40 kV, 40 mA). The step size of the measurement was 0.02° in the 2θ range 20°−75°. The obtained data were compared to the (PDF # 04–0545 – cubic Ge) Powder Diffraction File from the International Center for Diffraction Data (ICDD) database. To determine the crystallite size of the nanocrystals, the Scherrer method has been performed by fitting (Pseudo-Voigt) the (220) reflection applying Jade 6.0 software.
Transmission Electron Microscopy (TEM).
Electron-transparent specimens were prepared by drop-casting dilute suspensions of Ge nanocrystals dispersed in hexanes onto lacy carbon supported by a 400-mesh copper grid (Ted Pella). The grids were dried overnight under an incandescent lamp followed by oven drying at 85 °C to minimize any contamination during electron beam irradiation. The TEM imaging of the samples was performed using a JEOL-JEM 2500SE TEM (JEOL Ltd. Tokyo, Japan) at the Advanced Materials Characterizations and Testing Laboratory (AMCaT) at the University of California, Davis. This instrument is operated at 200 kV and is equipped with a Schottky field-emission electron gun (FEG) and a retractable 1k × 1k Gatan Multiscan CCD camera (model 794). Digital Micrograph software provided by Gatan Inc. was used to capture images. To determine the average particle diameter and respective standard deviation, 200 individual nanocrystals were imaged from different sample areas and multiple sample grids. Particle sizes were measured from intensity line profiles across individual particles in one consistent direction using the Image J software package.
Raman Spectroscopy.
Raman of the oleylamine was collected using a Renishaw RM1000 laser Raman microscope (514 nm) with a motorized stage. Samples were prepared by casting a drop of dried and degassed technical grade oleylamine on a Si substrate. To ensure reproducibility, different areas of the sample were scanned. The fitting and intensities of the peaks associated with the cis and trans C=C stretches, were calculated using the Igor Pro from WaveMetrics software.
FT-IR Spectroscopy.
FT-IR measurements were carried out with a Bruker Alpha spectrometer. Hexanes suspensions of Ge nanocrystals were dispensed directly onto the attenuated total reflection (ATR)-crystal and allowed to air-dry.
Thermogravimetric Analysis (TGA).
TGA measurements were collected on a TA Instruments TGA Q50 instrument, using sample sizes of ~5 mg in an alumina crucible under flowing nitrogen. Prior to analysis, TGA samples were prepared by drying hexanes dispersions of oleylamine-capped Ge nanocrystals under reduced pressure at 60 °C overnight using Schlenk techniques. Then, the powders were placed in the alumina crucible in a purged nitrogen glove bag under dynamic positive pressure, sealed in a vial for transportation, and then quickly placed into the instrument to minimize air exposure and prevent oxidation.
Nuclear Magnetic Resonance Spectroscopy (NMR).
Samples were prepared by evaporating hexanes dispersions on a Schlenk line in a J. Young NMR tube and redispersing them in 0.7 mL of dried and degassed toluene-d8 with 0.3 μmol of a ferrocene standard inside a purged nitrogen glove bag under dynamic positive pressure to prevent oxidation. Additionally, all new ligands were titrated into the NMR tube in a nitrogen glove bag under the same air-free conditions. All NMR spectra were collected on a Varian 600 MHz VNMRS spectrometer with 32 scans, a relaxation delay of 5 s, an acquisition time of 5.4 s, and a tip angle of 30°, such that the pulse sequence generously exceeded the vinyl C-H and ferrocene T1 times. T1 data indicate that this should enable integration fidelity > 95%. The ferrocene peak was referenced to δ = 4.06 ppm when residual toluene is referenced. Therefore, all ferrocene peaks were referenced to this value and normalized for integration. Diffusion ordered NMR spectroscopy (DOSY) measurements were performed using the Varian Bipolar Pulse Pair Stimulated Echo with Convection Compensation (Dbppste_cc) sequence. The relaxation delay was set to 30 s, the acquisition time was set to 5.4 s, and 64 increments were collected with 32 scans each. Diffusion coefficients were calculated by fitting the Stejskal–Tanner equation to the signal intensity decay. Further details on this method are presented in the ESI†. The NMR spectra of the free ligands were collected on a Varian 500 MHz VNMRS spectrometer with 16 scans, a relaxation delay of 5 s, an acquisition time of 5.1 s, and a tip angle of 45°. 2D 1H-13C Heteronuclear Single Quantum Coherence (HSQC) NMR spectra were collected on a Varian 600 MHz VNMRS spectrometer with 64 scans, 1.5 s relaxation delay, 0.2 s acquisition time, acquired size of (1352, 256), spectral size of (2048, 2048), and 90° sine square correction for f1 and f2.
Results and Discussion
The Ge nanocrystals used here were synthesized by the microwave-assisted reduction of GeI2 in oleylamine, without additional ligands or solvents, at a series of reaction temperatures (i.e., 210, 230, 250, and 270 °C) for 1 h.1,19,27,28 The nanocrystal products all adopted the expected cubic structure of Ge, as assessed by powder X-ray diffraction, with nanocrystal sizes that increase with increasing reaction temperature (Figs. S4–S5†). The resulting nanocrystals were purified by four dispersion/precipitation cycles with one cycle of toluene and methanol, followed by three cycles of hexanes and methanol, except for the Ge nanocrystals synthesized at 210 °C, which were only washed twice because of their relatively poor colloidal stability. Indeed, we qualitatively observed that suspensions of Ge nanocrystals synthesized at higher temperatures generally possessed better colloidal stability. FT-IR spectra of the resulting nanocrystals confirm that oleylamine acts as the passivating ligand (Fig. S6†).
To better understand the effect that reaction temperature has on colloidal stability, and ligand binding to the Ge nanocrystals, solution 1H NMR spectra were collected from Ge nanocrystal samples synthesized at 210, 230, 250, and 270 °C. It is observed that the peak shapes of the resonances associated with the alkenyl protons of the native oleylamine ligands (δ = 5.4–5.7 ppm) asymmetrically broaden with increasing reaction temperature, accompanied by a downfield shift (Fig. 1). This broadening and downfield shift generally imply a ligand interaction with the nanocrystal surface.29,30 Deconvolution of the peaks associated with the alkenyl protons of oleylamine into two populations of ligand species (i.e., strongly bound oleylamine at δ ≈ 5.64 ppm and less strongly bound, or physisorbed, oleylamine at δ ≈ 5.59 ppm) is given in Fig. 1. This analysis was repeated at least 5 times and averaged to return an 18 ± 1%, 51 ± 2%, and 70 ± 2% strongly bound fraction for the Ge nanocrystals synthesized at 230, 250, and 270 °C, respectively, thereby demonstrating that the number fraction of strongly bound oleylamine increases with higher synthetic temperatures. Due to the colloidal instability of the nanocrystals synthesized at 210 °C, the 1H NMR peak intensity is too small to reliably integrate a strongly bound ligand fraction. Nonetheless, based on a qualitative visual inspection of the chemical shift and peak shape, there is a larger fraction of free or loosely bound oleylamine present in the suspension of Ge nanocrystals synthesized at 210 °C. The overall ligand density of native oleylamine for the most colloidally stable Ge nanocrystals synthesized at 270 °C were calculated using thermogravimetric analysis to be between 1.3–1.8 oleylamine nm−2 when considering either just the strongly bound oleylamine or the total oleylamine population, respectively. This range of oleylamine surface densities is well below that of a theoretical monolayer of 2.8 oleylamine nm−2 calculated for this particle size using an oleylamine footprint of 0.36 nm2.31 The low surface coverage is consistent with previously published conclusions based on property measurements that these Ge nanocrystals are incompletely passivated.1
Fig. 1.
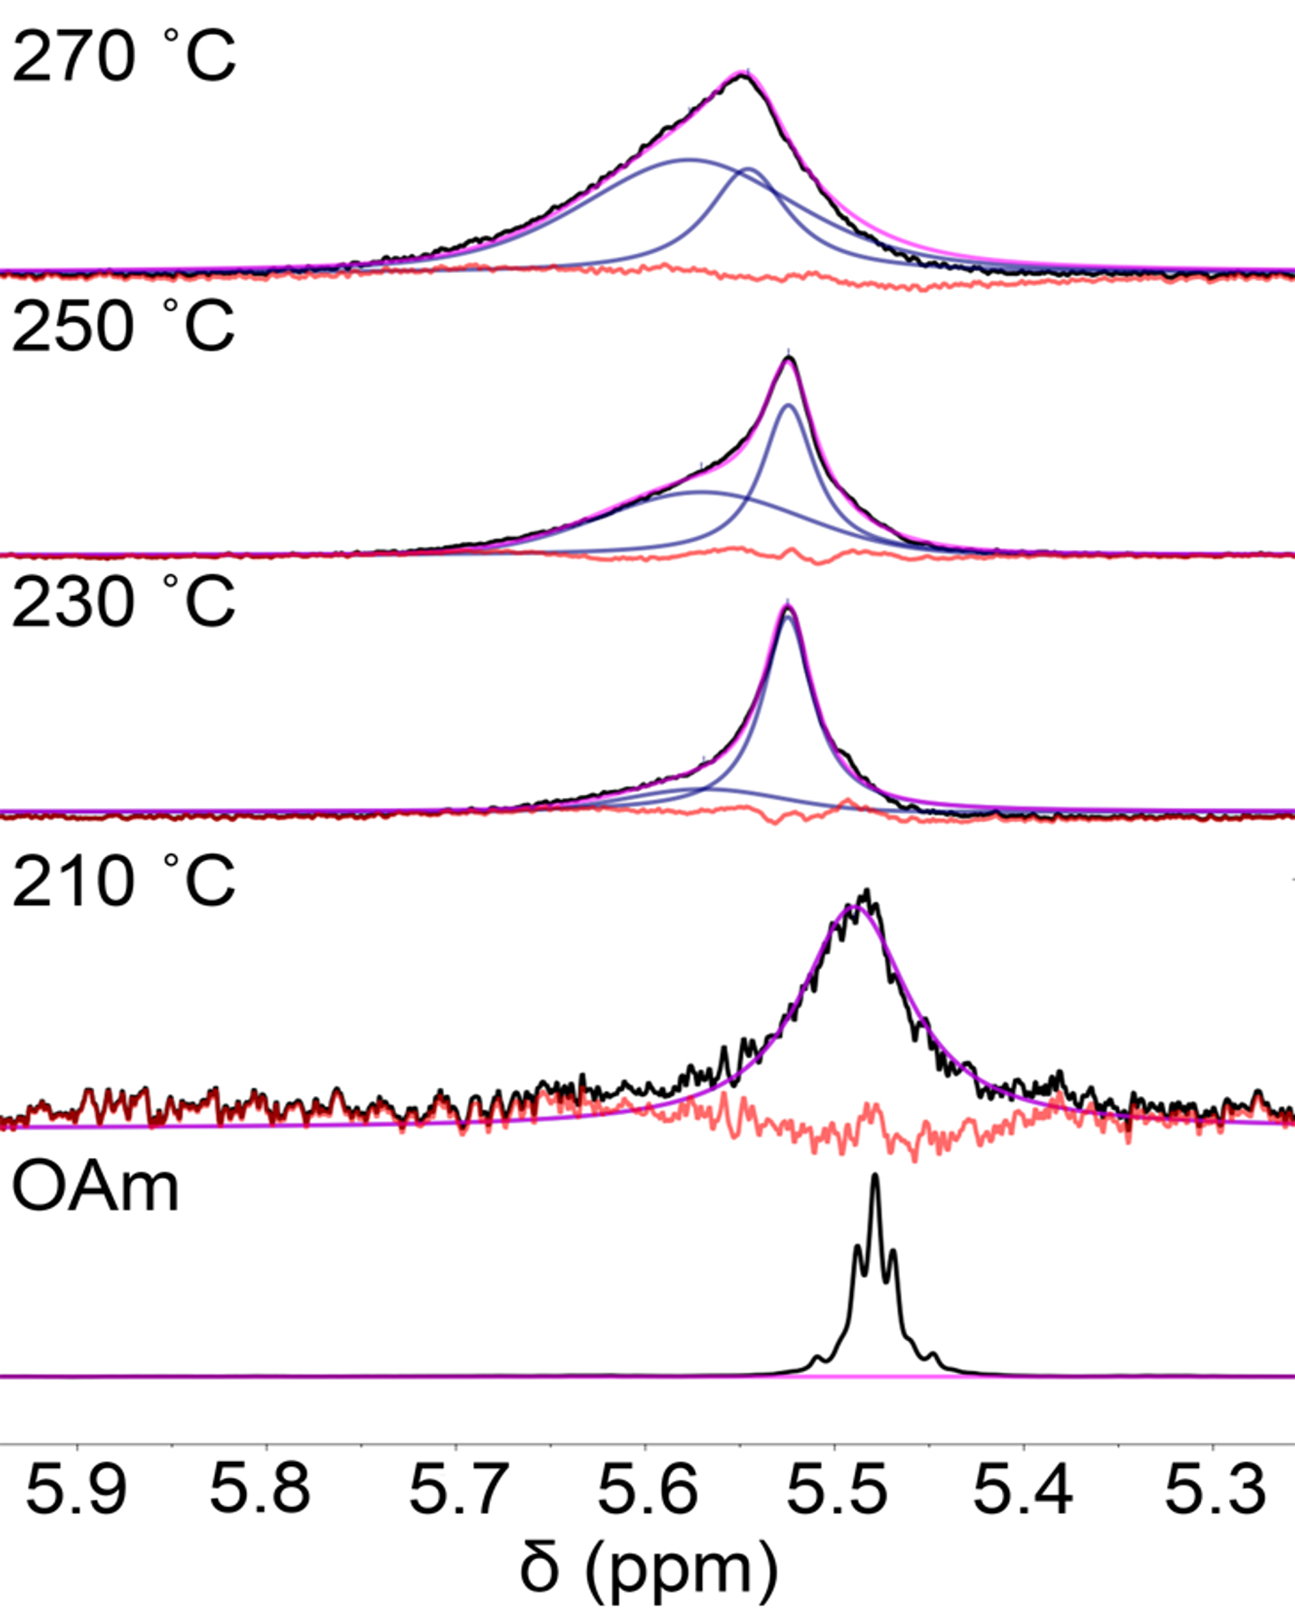
Room-temperature 600 MHz 1H NMR spectra and fitting of the bound (δ ≈ 5.64 ppm) and physisorbed/free (δ ≈ 5.59 ppm) peaks of the alkenyl region that show the peak broadening and change in chemical shift associated with ligand binding of oleylamine (OAm), which is more prominent for nanocrystals synthesized at higher temperatures. The 1H NMR spectrum of free oleylamine in toluene-d8 is given for comparison.
In order to corroborate the increasing fraction of strongly bound oleylamine for nanocrystals synthesized at higher temperatures, diffusion ordered NMR spectroscopy (DOSY) was performed to calculate diffusion coefficients and solvodynamic diameters using the Stokes-Einstein equation.29 A more detailed explanation of this technique is outlined in the ESI†. The experimentally determined diffusion coefficients and calculated solvodynamic diameters are presented in Table 1 and Fig. S3 a–c†, which indicate that all the Ge nanocrystal suspensions have significantly smaller diffusion coefficients for oleylamine (< 300 μm s–1) than free oleylamine by itself (887 ± 2 μm s–1). The smaller oleylamine diffusion coefficients in the nanocrystal suspensions imply the ligands are interacting with the Ge nanocrystal surfaces, returning a weighted mean diffusion coefficient between the bound and unbound states. As such, the calculated solvodynamic diameters are smaller than the expected diameters because the solvodynamic diameters are calculated using a diffusion coefficient that includes both bound and physisorbed/free oleylamine, giving an overall larger diffusion coefficient for oleylamine than expected for a strictly bound state and, therefore, a smaller solvodynamic diameter. More importantly, the diffusion coefficients decrease with increasing synthetic temperature, which reflect and confirm that there is a higher fraction of strongly bound oleylamine in Ge nanocrystal samples synthesized at higher temperatures, directly correlating with the better colloidal stability of those suspensions.
Table 1.
Summary of Diffusion Coefficients and Calculated Solvodynamic Diameters using DOSY NMR, and Expected Diameters
| Synthetic temperature | Oleylamine diffusion coefficient (μm s−1) | Calculated solvodynamic diameter (nm) | Expected diameter (nm)a |
|---|---|---|---|
| free oleylamine | 887 ± 2 | ||
| 210 °C | 277 ± 50 | 2.8 | 4.9 – 5.4 |
| 230°C | 187 ± 4 | 4.2 | 5.4 – 5.9 |
| 250 °C | 165 ± 3 | 4.8 | 6.0 – 6.5 |
| 270 °C | 119 ± 5 | 6.6 | 7.0 – 7.5 |
Expected diameter = core Ge nanocrystal size from TEM + 1.5–2 nm estimated from oleylamine ligand shell, which is predicted to be about half of the ligand length.32
We then shifted our attention to ligand exchange reactions on the Ge nanocrystals, beginning with a primary alkylamine. If the native oleylamine ligands are bound to the Ge nanocrystal surface through a dative L-type ligand interaction, it is expected that an incoming primary amine could displace the native ligand. Undeceneamine was selected for ligand exchange, because of its spectroscopically distinct vinylic proton resonances that do not overlap with the internal alkenyl proton resonances of oleylamine.26 This permits the binding of oleylamine and undeceneamine to be followed concurrently and thereby allows all changes in ligand binding to be monitored. Upon titrating increasing amounts of the new undeceneamine ligand into a Ge nanocrystal suspension at room temperature, the peaks corresponding to the vinylic protons of undeceneamine shift upfield (Fig. 2). This behavior has previously been attributed to physisorbed, or weakly bound “interdigitated” ligands,33 and as more undeceneamine is introduced, the ratio of free to interdigitated ligand increases as more amine competes for those physisorbed “sites”. If strongly bound, undeceneamine is expected to have broad peaks downfield from the free peaks; this is not observed. Upon titration with undeceneamine, the alkenyl resonances for the less strongly bound oleylamine also undergo a chemical shift upfield, increasing the separation between the peaks for the strongly bound and progressively more free oleylamine ligands. For all the Ge nanocrystal samples synthesized at various temperatures, the broad peak associated with strongly bound oleylamine does not significantly change shape or intensity upon undeceneamine titration, implying that the incoming undeceneamine ligands are not displacing the strongly bound native oleylamine ligands, but rather are only competing for binding with weakly physisorbed oleylamine. Therefore, undeceneamine does not bind tightly to the nanocrystal surface and does not ligand exchange with strongly bound oleylamine.
Fig. 2.
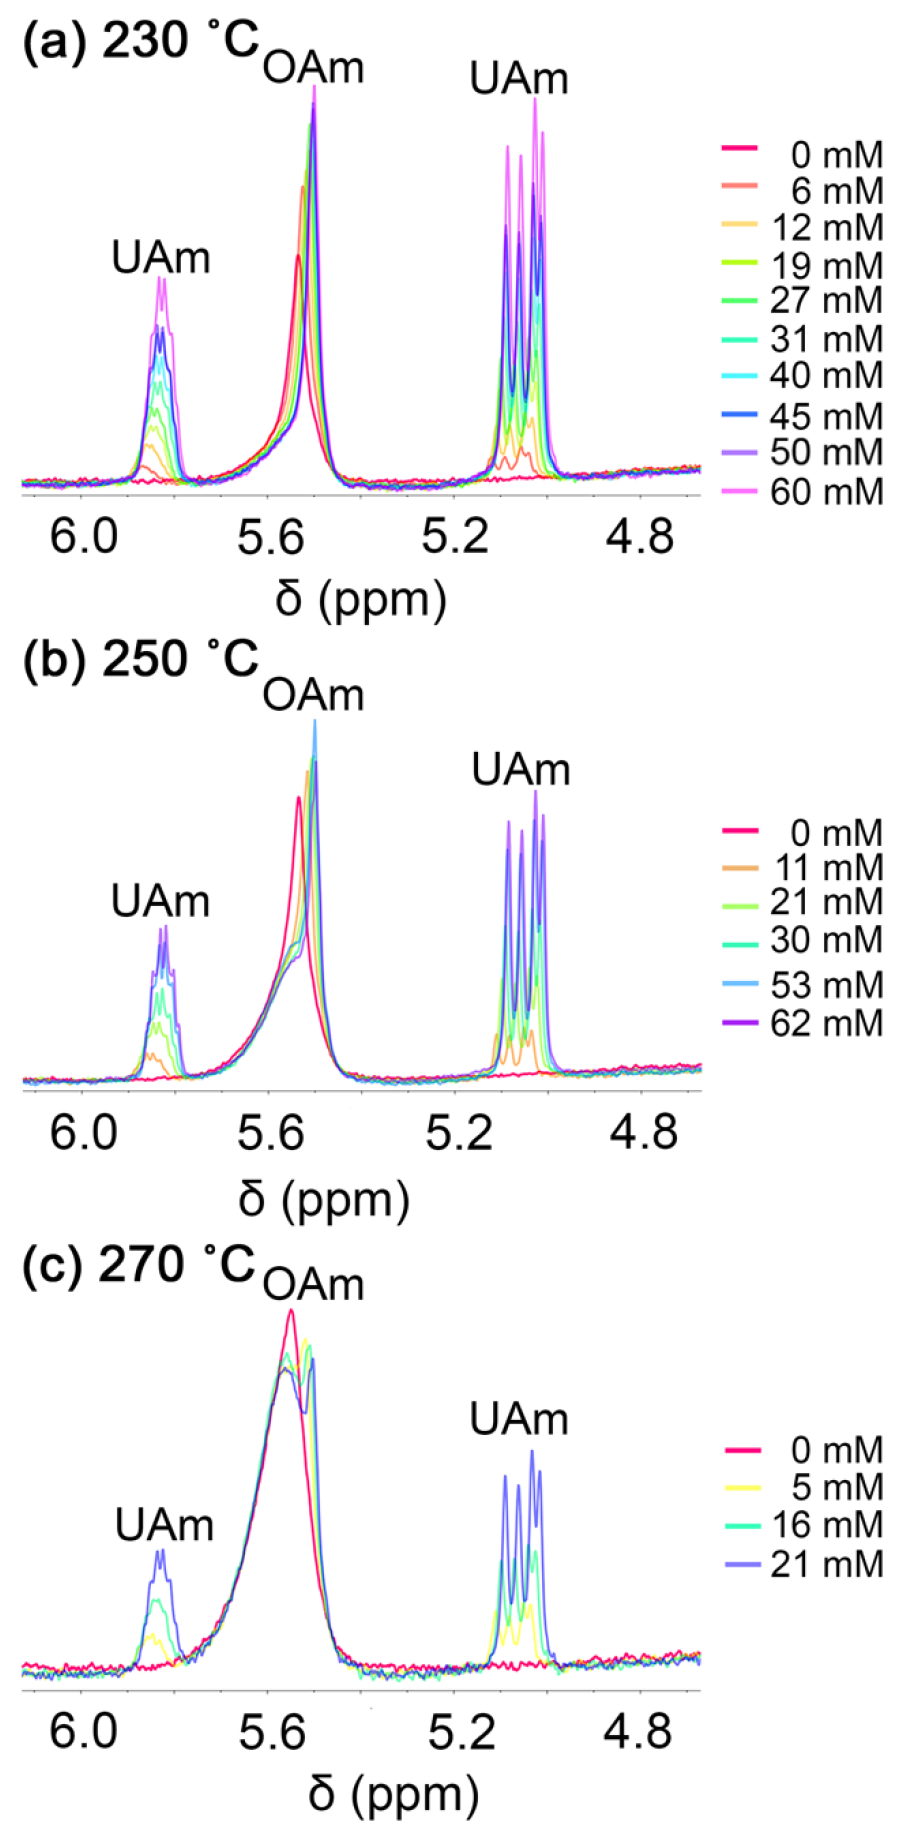
Room-temperature 600 MHz 1H NMR spectra of Ge nanocrystal suspensions in toluene–d8 (7 mg/mL) for samples synthesized at (a) 230 °C, (b) 250 °C, and (c) 270°C. The as-synthesized nanocrystals are capped with native oleylamine (OAm) ligands and the suspensions are titrated with increasing amounts of undeceneamine (UAm) (0–62 mM).
DOSY was performed and diffusion coefficients were calculated for the undeceneamine titration experiments shown in Fig. 2. The diffusion coefficients for undeceneamine were calculated to be 768 ± 20, 908 ± 10, and 963 ± 30 μm s–1 for the suspensions of Ge nanocrystals synthesized at 230, 250, and 270 °C, respectively, compared to the diffusion coefficient of free undeceneamine, which is 1335 ± 8 μm s–1. The comparatively high diffusion coefficients for undeceneamine in the nanocrystal suspensions reflect that undeceneamine is not binding strongly as a ligand to the Ge nanocrystal surface, which agrees with the 1H NMR results. The diffusion coefficients for oleylamine after the undeceneamine titration were 301 ± 10, 232 ± 5, and 137 ± 4 μm s–1, for the nanocrystals synthesized at 230, 250, and 270 °C, respectively. The diffusion coefficient and solvodynamic diameter based on oleylamine changes more with undeceneamine titration for nanocrystal samples synthesized at lower temperatures, because the fraction of strongly bound oleylamine is lower (vide supra). Variable-temperature 1H NMR was then performed on the suspension of Ge nanocrystals synthesized at 270 °C that had been titrated with undeceneamine. The variable-temperature 1H NMR showed that at higher temperatures (e.g., 90 °C), the peaks corresponding to weakly bound oleylamine shift upfield suggesting less ligand entanglement with the surface upon heating (Fig. S7†). The bound fraction of oleylamine becomes harder to integrate as the temperature cools; nonetheless, the strongly bound fraction of oleylamine remains fairly consistent at the various temperatures probed (Table S1†).
To validate that the amine ligand exchange behavior is not unique to undeceneamine and is not influenced by the terminal vinylic group, dodecylamine was titrated into a suspension of Ge nanocrystals synthesized at 250 °C (Fig. S8†). Dodecylamine does not possess spectroscopically unique NMR peaks that allow for easy integration; however, upon the titration of dodecylamine, a peak separation and upfield chemical shift of the alkenyl protons corresponding to weakly bound oleylamine is observed as before. This is consistent with dodecylamine competing for binding with physisorbed oleylamine. Moreover, the fraction of strongly bound oleylamine remains statistically unchanged before and after titration with dodecylamine. Since saturated primary alkylamines also do not exchange the strongly bound native oleylamine, the vinylic group of undeceneamine is not involved in the ligand exchange behavior, as expected.
To further probe the nature of the native oleylamine ligand binding, cetyltrimethylammonium bromide (CTAB) was next introduced in a 1H NMR titration experiment. Wheeler et al. previously showed that plasma-synthesized, hydride-terminated Ge nanocrystals that are functionalized with oleylamine result in ionic ligand binding of oleylammonium cations to a negatively charged Ge surface.34 While undeceneamine and docecylamine should both be able to displace ionically bound oleylammonium ligands via proton exchange, we further verified that this binding mode is not operative here through titration with CTAB, which would also enable ligand exchange of cationic oleylammonium species if they are present on the nanocrystal surface. Upon titration of CTAB into a dichloromethane-d2 suspension of Ge nanocrystals synthesized at 250 °C, there appears to be no major changes to the alkenyl resonances of oleylamine; however, this peak (ca. 5.33 ppm) overlaps with the residual solvent peak (ca. 5.32 ppm) (Fig. S9†). Due to this peak overlap, DOSY was utilized to probe changes in the diffusion coefficient for bound oleylamine and CTAB. The diffusion coefficient of oleylamine in dichloromethane-d2 did not change significantly upon CTAB titration (i.e., 184 ± 5 μm s–1 vs. 184 ± 8 μm s–1 before and after CTAB titration). Similarly, the diffusion coefficient of CTAB in the titration was determined to be 842 ± 3 μm s–1, compared to 841 ± 3 μm s–1 for free CTAB in dichloromethane-d2. Due to the identical diffusion coefficients of CTAB in the presence of Ge nanocrystals and that of free CTAB, we can conclude that CTAB is not binding to the nanocrystal surface.
The complete lack of ligand exchange observed for the strongly bound native oleylamine ligand fraction on the Ge nanocrystal surface with either neutral primary amines or ammonium cations suggests that neither a dative L-type nor ionic bonding motif are operative. Instead, this implies that the strongly bound native ligands are binding as oleylamide, with a covalent X-type Ge–NHR bond, which is calculated to be ca. 60 kcal/mol.35 Indeed, N–H bond dissociation has been theoretically predicted to occur on Ge(100)-2×1 surfaces to give covalent Ge–N bonds,36 which may be occurring during the microwave-assisted synthesis of these Ge nanocrystals. The generation of H2 has been experimentally observed during the microwave-assisted reduction of GeI2 in oleylamine,27 which could result from this N–H bond dissociation.
To explore exchange reactions with more acidic ligands, thiols and carboxylic acids were next titrated into a suspension of Ge nanocrystals synthesized at 250 °C. Thiols have previously been used as a supporting ligands for Ge nanocrystals to provide colloidal stability and electronic passivation.1 In that work, dodecanethiol was installed on the Ge nanocrystal synthesis by first reducing off the native ligands with hydrazine and subsequently heating the nanocrystals at 150 °C in an excess of thiol. Here, undecenethiol was titrated into a suspension of Ge nanocrystals at room temperature and it was observed that the alkenyl peaks from oleylamine in the 1H NMR spectrum did not change. Likewise, the resonances corresponding to the vinylic protons on undecenethiol did not shift upfield with increasing concentration, as was observed with undeceneamine, and there is no evidence of undecenethiol binding as an X-type thiolate via proton exchange with oleylamide (Fig. 3). This implies that at room temperature there is no ligand exchange or interaction with the Ge nanocrystals. Variable-temperature 1H NMR of the Ge nanocrystal suspension titrated with undecenethiol revealed a reduction in free undecenethiol with a concomitant appearance of bound undecenethiol upon heating to 90 °C, as evidenced by small resonances downfield of the free species (at ca. 5.13 and 5.92 ppm, Fig. 3b). The amount of undecenethiol that binds is small and therefore integration is approximate; nonetheless, total binding of undecenethiol is ca. 14% relative to free undecenethiol. Consistent with this result, after heating the Ge nanocrystal suspension titrated with undecenethiol at 90 °C for 2 h, two diffusion coefficients were detected for undecenethiol – 72 ± 10 μm s−1 for bound undecenethiol(ate) and 1051 ± 11 μm s−1 for free undecenethiol. The diffusion coefficient for oleylamine remains virtually unchanged after heating the Ge nanocrystal suspension titrated with undecenethiol, with diffusion coefficients of 146 ± 5 and 144 ± 5 μm s−1 before and after heating, respectively. In combination with 1H NMR, this suggests that there is a high kinetic barrier for ligand exchange with undecenethiol even with an exergonic thermodynamic driving force,1 and that the incoming thiol ligands may be occupying uncoordinated surface sites as X-type thiolates (via deprotonation by physisorbed oleylamine) rather than exchanging oleylamide.
Fig. 3.
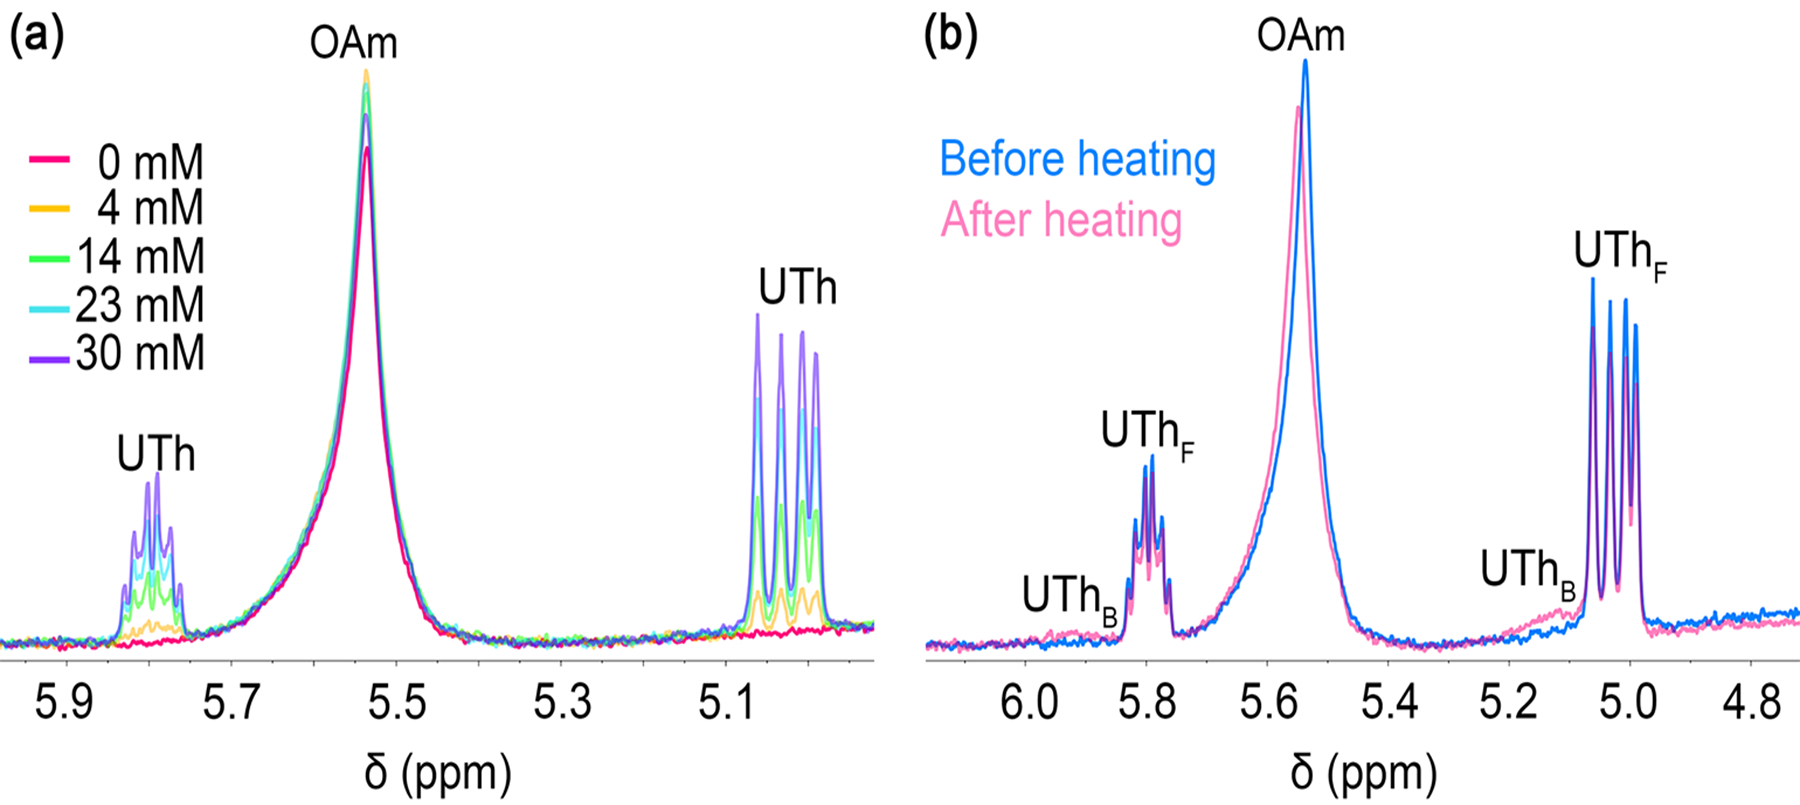
(a) Room-temperature 600 MHz 1H NMR spectra of Ge nanocrystal suspension in toluene-d8 (7 mg/mL). The as-synthesized nanocrystals are capped with native oleylamine ligands and the suspension is titrated with increasing amounts of free undecenethiol (UTh) (0–30 mM). (b) Superimposed room-temperature 1H NMR spectra of the suspension before and after heating at 90 °C for ca. 15 min, which shows both free (F) and a small fraction of bound (B) peaks for undecenethiol (δ ≈ 5.13 and 5.92 ppm).
In order to further investigate the ligand exchange processes for Ge nanocrystals, undecenoic acid was investigated as an even more acidic ligand (Fig. 4). The 1H NMR resonances corresponding to the vinylic protons of undecenoic acid show a slight upfield chemical shift with increasing concentration at room temperature, however, the change in chemical shift is not as dramatic as that observed with the undeceneamine titration. With increasing concentrations of undecenoic acid, the alkenyl oleylamine peak shifts slightly upfield and a set of small peaks appear downfield of the free acid (at ca. 5.14 and 5.93 ppm) that correspond to strongly bound X-type undecenoate. The suspension of titrated Ge nanocrystals was then heated in situ, and with increasing temperature, the two peaks corresponding to strongly bound undecenoate more clearly emerge downfield of their free species (Fig. 5). After 14 h of heating at 90 °C, ca. 43% of the undecenoic acid present is bound relative to the free fraction (Table S2†). After heating with titrated undecenoic acid, the oleylamine alkenyl peak shape does not change greatly, suggesting that undecenoic acid also may be primarily binding as X-type undecenoate (via deprotonation by physisorbed oleylamine) to undercoordinated or available surface sites rather than exchanging the strongly bound oleylamide species. Diffusion coefficients for undecenoic acid in the Ge nanocrystal suspension were collected before and after heating to compare ligand binding (Table 2). The bound undecenoate peaks correspond to a diffusion coefficient of 109 ± 6 μm s–1, which is much lower than that of free undecenoic acid (945 ± 10 μm s–1), revealing that undecenoic acid is indeed binding to the Ge nanocrystals upon heating. The diffusion coefficient of oleylamine actually decreases upon heating the Ge nanocrystal suspension, implying a slightly higher fraction of oleylamine binding, (i.e., 187 μm s–1 vs. 161 μm s–1 before and after heating). Again, this demonstrates that the kinetic barrier to ligand exchange of the native oleylamide ligands is large, even with highly acidic ligands.
Fig. 4.
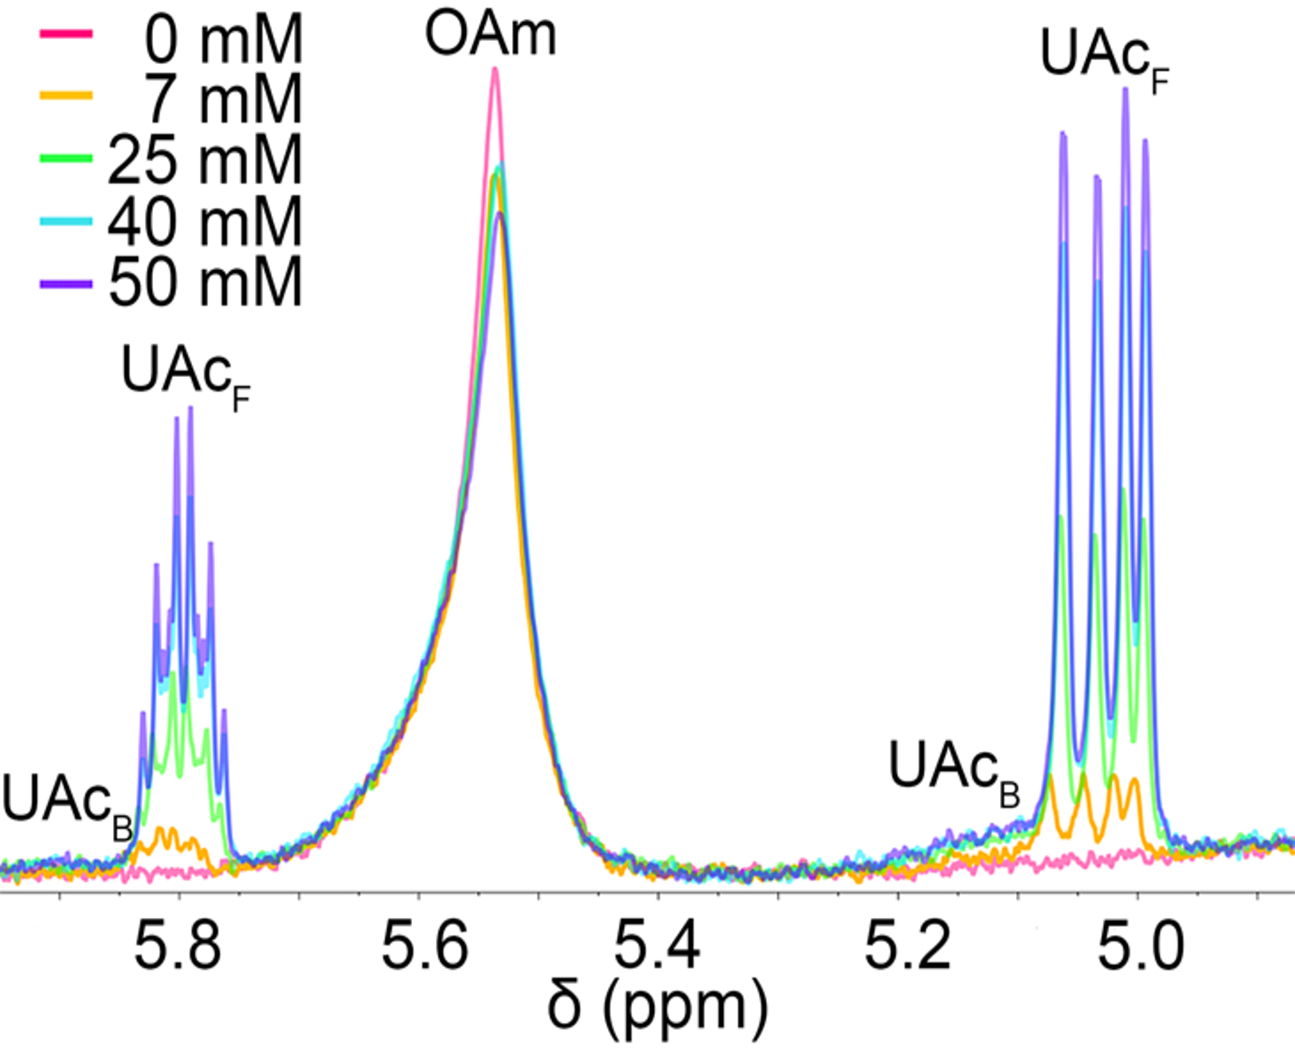
Room-temperature 600 MHz 1H NMR spectra of Ge nanocrystal suspension in toluene-d8 (7 mg/mL). The as-synthesized nanocrystals are capped with native oleylamine ligands and the suspension is titrated with increasing amounts of undecenoic acid (UAc) (0–50 mM).
Fig. 5.
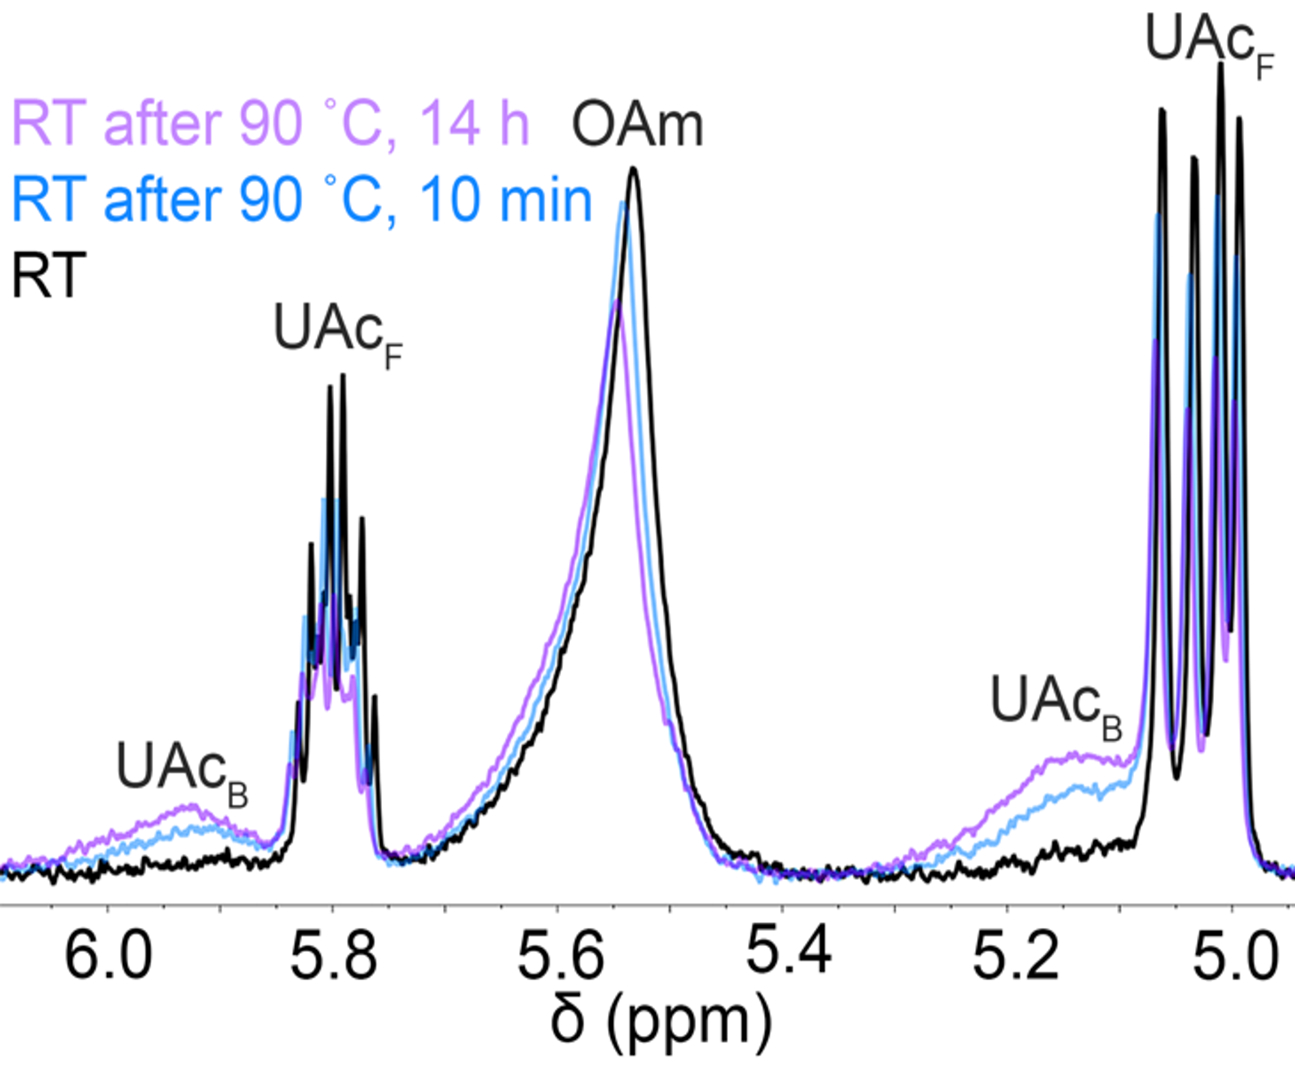
600 MHz 1H NMR spectra of 7 mg/mL Ge nanocrystal suspensions capped with oleylamine, titrated with 50 mM undecenoic acid in toluene-d8 at room temperature (black), heated to 90 °C and cooled back to room temperature for ca. 10 min (blue), and heated to 90 °C for 14 h and cooled back to room temperature (purple). The blue and purple spectrum shows the presence of strongly bound undecenoic acid after cooling (ca. 5.14 and 5.93 ppm
Table 2.
Summary of Diffusion Coefficients for Oleylamine and Undecenoic Acid and the Solvodynamic Diameters Determined Using DOSY NMR for Ge Nanocrystals Synthesized at 250 °C
| Ligand exchange temperature | As-synthesized oleylamine diffusion coefficient (μm s−1) |
Oleylamine diffusion coefficient after titration (μm s−1) | Undecenoic acid diffusion coefficient after titration (μm s−1) | Solvodynamic diameter based on oleylamine (nm) |
|---|---|---|---|---|
| Room temperature | 187 ± 4 | 168 ± 3 | 551 ± 10 | 4.6 |
| 90 °C for 14 h | 187 ± 4 | 161 ± 4 | 109 ± 6 (bound), 676 ± 10 (free) | 4.8 |
In an effort to explore the effect of stronger acids on oleylamine-capped Ge nanocrystals synthesized at 250 °C, we attempted to partially strip the strongly bound oleylamide ligands via HCl titration. Upon the addition of aqueous HCl (1.2 mM) and heating at 80 °C for 4 h, 0.97 mM of the bound oleylamide becomes physisorbed/free. Additionally, the growth of a sharper peak upfield from the alkenyl protons is observed (Fig. S10†), which can be attributed to oleylammonium R-NH3+ protons (as confirmed by an HSQC spectrum showing that these protons are not connected to oleyl-based carbon, Fig. S11†). This titration experiment demonstrates that the strongly bound oleylamide ligands can be removed in the presence of a strong acid that is able to kinetically access the nanocrystal surface.
Conclusions
In conclusion, we investigated the surface chemistry of Ge nanocrystals synthesized via a microwave reduction of GeI2 in oleylamine at various temperatures. We conclude that the strongly bound native ligands were oleylamides, possessing a covalent X-type Ge–NHR bond, and that the fraction of these strongly bound ligands on the surface increased with increasing synthesis temperatures and translated into more colloidally stable nanocrystal suspensions. A high kinetic barrier to ligand exchange with thiol and carboxylic acid ligands exists, and ligand binding is only observed upon heating without the displacement, or exchange, of a significant amount of the native oleylamide ligands. This confirms that the Ge nanocrystals, as synthesized, do not possess fully passivated surfaces. The oleylamide ligands can be stripped from the nanocrystal surface upon addition of HCl. These findings lead to a better understanding of the surfaces of these Ge nanocrystals, and by extension other main group nanocrystals postulated to possess M–NHR surface ligands, which will allow for rational surface modification procedures to maximize nanocrystal functionality for a given application.
Supplementary Material
Acknowledgements
The surface chemistry was supported by a grant to R. L. B. from the U.S. Department of Energy, Office of Science, Basic Energy Sciences, under Award # DE-FG02-11ER46826. S. R. S. acknowledges support from the Graduate Research Fellowship Program of the National Science Foundation. We thank the NSF (DBI-0821671, CHE-0840366) and the NIH (S10 RR25432) for NMR instrumentation at USC. S. M. K. and K. T. acknowledge the National Science Foundation under CHE-1710110 for funding material preparation and the Advanced Materials and Characterization Laboratory (AMCaT) at UC Davis for the use of the transmission electron microscope.
Footnotes
Conflicts of interest
There are no conflicts to declare.
Electronic Supplementary Information (ESI) available. See DOI: 10.1039/x0xx00000x
Notes and references
- 1.Muthuswamy E, Zhao J, Tabatabaei K, Amador MM, Holmes MA, Osterloh FE and Kauzlarich SM, Chem. Mater, 2014, 26, 2138–2146. [Google Scholar]
- 2.Fok E, Shih M, Meldrum A and Veinot JGC, Chem. Commun, 2004, 386. [DOI] [PubMed] [Google Scholar]
- 3.Li F, Wang J, Sun S, Wang H, Tang Z and Nie G, Small, 2015, 11, 1954–1961. [DOI] [PubMed] [Google Scholar]
- 4.Luo J-W, Franceschetti A and Zunger A, Nano Lett, 2008, 8, 3174–3181. [DOI] [PubMed] [Google Scholar]
- 5.Kortshagen U, Anthony R, Gresback R, Holman Z, Ligman R, Liu C-Y, Mangolini L and Campbell SA, Pure Appl. Chem, 2008, 80, 1901–1908. [Google Scholar]
- 6.Smock SR, Williams TJ and Brutchey RL, Angew. Chem. Int. Ed, 2018, 57, 11711–11715. [DOI] [PMC free article] [PubMed] [Google Scholar]
- 7.Bullen C and Mulvaney P, Langmuir, 2006, 22, 3007–3013. [DOI] [PubMed] [Google Scholar]
- 8.Greaney MJ, Couderc E, Zhao J, Nail BA, Mecklenburg M, Thornbury W, Osterloh FE, Bradforth SE and Brutchey RL, Chem. Mater, 2015, 27, 744–756. [Google Scholar]
- 9.Buckley JJ, Couderc E, Greaney MJ, Munteanu J, Riche CT, Bradforth SE and Brutchey RL, ACS Nano, 2014, 8, 2512–2521. [DOI] [PubMed] [Google Scholar]
- 10.Greaney MJ, Joy J, Combs BA, Das S, Buckley JJ, Bradforth SE and Brutchey RL, J. Chem. Phys, 2019, 151, 074704. [DOI] [PubMed] [Google Scholar]
- 11.Ruddy DA, Erslev PT, Habas SE, Seabold JA and Neale NR, J. Phys. Chem. Lett, 2013, 4, 416–421. [DOI] [PubMed] [Google Scholar]
- 12.Lambert TN, Andrews NL, Gerung H, Boyle TJ, Oliver JM, Wilson BS and Han SM, Small, 2007, 3, 691–699. [DOI] [PubMed] [Google Scholar]
- 13.Gerung H, Bunge SD, Boyle TJ, Brinker CJ and Han SM, Chem. Commun, 2005, 1914–1916. [DOI] [PubMed] [Google Scholar]
- 14.Vaughn DD, Bondi JF and Schaak RE, Chem. Mater, 2010, 22, 6103–6108. [Google Scholar]
- 15.Ruddy DA, Johnson JC, Smith ER and Neale NR, ACS Nano, 2010, 4, 7459–7466. [DOI] [PubMed] [Google Scholar]
- 16.Alan Esteves RJ, Hafiz S, Demchenko DO, Özgür Ü and Arachchige IU, Chem. Commun, 2016, 52, 11665–11668. [DOI] [PubMed] [Google Scholar]
- 17.Holmes AL, Hütges J, Reckmann A, Muthuswamy E, Meerholz K and Kauzlarich SM, J. Phys. Chem. C, 2015, 119, 5671–5678. [Google Scholar]
- 18.Kerr AT, Placencia D, Gay ME, Boercker JE, Soto D, Davis MH, Banek NA and Foos EE, J. Phys. Chem. C, 2017, 121, 22597–22606. [Google Scholar]
- 19.Muthuswamy E, Iskandar AS, Amador MM and Kauzlarich SM, Chem. Mater, 2012, 25, 1416–1422. [Google Scholar]
- 20.Bernard A, Zhang K, Larson D, Tabatabaei K and Kauzlarich SM, Inorg. Chem, 2018, 57, 5299–5306. [DOI] [PubMed] [Google Scholar]
- 21.He M, Protesescu L, Caputo R, Krumeich F and Kovalenko MV, Chem. Mater, 2015, 27, 635–647. [Google Scholar]
- 22.Kravchyk K, Protesescu L, Bodnarchuk MI, Krumeich F, Yarema M, Walter M, Guntlin C and Kovalenko MV, J. Am. Chem. Soc, 2013, 135, 4199–4202. [DOI] [PubMed] [Google Scholar]
- 23.Carroll GM, Limpens R and Neale NR, Nano Lett, 2018, 18, 3118–3124. [DOI] [PubMed] [Google Scholar]
- 24.Baranov D, Lynch MJ, Curtis AC, Carollo AR, Douglass CR, Mateo-Tejada AM and Jonas DM, Chem. Mater, 2019, 31, 1223–1230. [Google Scholar]
- 25.Restrepo DT, Lynch KE, Giesler K, Kuebler SM and Blair RG, Mater. Res. Bull, 2012, 47, 3484–3488. [Google Scholar]
- 26.Knauf RR, Lennox JC and Dempsey JL, Chem. Mater, 2016, 28, 4762–4770. [Google Scholar]
- 27.Tabatabaei K, Holmes AL, Newton KA, Muthuswamy E, Sfadia R, Carter SA and Kauzlarich SM, Chem. Mater, 2019, 31, 7510–7521. [Google Scholar]
- 28.Tabatabaei K, Lu H, Nolan BM, Cen X, McCold CE, Zhang X, Brutchey RL, van Benthem K, Hihath J and Kauzlarich SM, Chem. Mater, 2017, 29, 7353–7363. [Google Scholar]
- 29.Hens Z and Martins JC, Chem. Mater, 2013, 25, 1211–1221. [Google Scholar]
- 30.Marbella LE and Millstone JE, Chem. Mater, 2015, 27, 2721–2739. [Google Scholar]
- 31.Mourdikoudis S and Liz-Marzán LM, Chem. Mater, 2013, 25, 1465–1476. [Google Scholar]
- 32.Geva N, Shepherd JJ, Nienhaus L, Bawendi MG and Van Voorhis T, J. Phys. Chem. C, 2018, 122, 26267–26274. [Google Scholar]
- 33.Fritzinger B, Capek RK, Lambert K, Martins JC and Hens Z, J. Am. Chem. Soc, 2010, 132, 10195–10201. [DOI] [PubMed] [Google Scholar]
- 34.Wheeler LM, Nichols AW, Chernomordik BD, Anderson NC, Beard MC and Neale NR, Nano Lett, 2016, 16, 1949–1954. [DOI] [PubMed] [Google Scholar]
- 35.Kachian JS, Wong KT and Bent SF, Acc. Chem. Res, 2010, 43, 346–355. [DOI] [PubMed] [Google Scholar]
- 36.Prayongpan P and Michael Greenlief C, Surf. Sci, 2009, 603, 1055–1069. [Google Scholar]
Associated Data
This section collects any data citations, data availability statements, or supplementary materials included in this article.