

Abstract
An estimated 3.3 million people are living with a traumatic brain injury (TBI)-associated morbidity. Currently, only invasive and sacrificial methods exist to study neurochemical alterations following TBI. Nuclear magnetic resonance methods—magnetic resonance imaging (MRI) and spectroscopy (MRS)—are powerful tools which may be used non-invasively to diagnose a range of medical issues. These methods can be utilized to explore brain functionality, connectivity, and biochemistry. Unfortunately, many of the commonly studied brain metabolites (e.g., N-acetyl-aspartate, choline, creatine) remain relatively stable following mild to moderate TBI and may not be suitable for longitudinal assessment of injury severity and location. Therefore, a critical need exists to investigate alternative biomarkers of TBI, such as acrolein. Acrolein is a byproduct of lipid peroxidation and accumulates following damage to neuronal tissue. Acrolein has been shown to increase in post-mortem rat brain tissue following TBI. However, no methods exist to noninvasively quantify acrolein in vivo. Currently, we have characterized the T1 and T2 of acrolein via NMR saturation recovery and Carr-Purcell-Meiboom-Gill experiments, accordingly, to maximize the signal-to-noise ratio of acrolein obtained with MRS. Additionally, we have quantified acrolein in water and whole-brain phantom using PRESS MRS and standard post-processing methods. With this potential novel biomarker for assessing TBI, we can investigate methods for predicting acute and chronic neurological dysfunction in humans and animal models. By quantifying and localizing acrolein with MRS, and investigating neurological outcomes associated with in vivo measures, patient-specific interventions could be developed to decrease TBI-associated morbidity and improve quality of life.
1. Introduction
Traumatic brain injuries (TBIs) remain a major public health concern; however, advancements in the quantitative assessment of these injuries are lacking. In 2010, 2.5 million TBI-associated emergency department visits, hospitalizations, and deaths were reported in the United States [1]. However, this is largely an underestimate since many TBIs, especially mild TBI, go unreported. The economic burden associated with these injuries is estimated at $76.5 billion, including both direct and indirect medical costs [1]. The Centers for Disease Control and Prevention define TBI as “a disruption in the normal function of the brain that can be caused by a bump, blow, or jolt to the head, or penetrating injury” [2]. Consequently, TBIs may result from a variety of events including contact sports, military training and combat, automobile accidents, and falls. Additionally, TBI severity exists along a spectrum: mild, moderate, and severe. Depending on the severity of an insult, symptoms can range from mild headache and malaise to epilepsy and severe cognitive impairment, or even death. Due to the wide range of complications associated with TBI sequalae, it is critical to develop quantitative and noninvasive methods to further understand the prognosis of, and implement patient-specific therapies for, these injuries. Doing so could provide a means to (1) determine location(s) of the injury, (2) quantify the severity of injury, (3) monitor recovery, (4) assess the efficacy of treatments and rehabilitation therapies, and (5) improve the quality of life. However, no methods currently exist to noninvasively and quantitatively evaluate and monitor TBI.
Magnetic resonance spectroscopy (MRS) is a noninvasive nuclear magnetic resonance (NMR) technique that can be used to investigate the chemical profile of a specific body region. Clinically, MRS has been used to assist in the classification of brain tumors, altered brain metabolism, and multiple sclerosis [3–5]. These brain diseases can be classified by determining the concentration of metabolites in the range of 1–4 parts per million (ppm) on a 1H (proton) NMR spectrum. The most common brain metabolites include N-acetyl aspartate (NAA), choline (Cho), creatine (Cr), myo-inositol (mI), glutamate/glutamine (Glx), and lactate (Lac). Because MRS is both noninvasive and quantitative, it is a promising method for monitoring brain health following a TBI. However, the most commonly studied brain metabolites, listed above, show varying and minimal-to-no change following mild to moderate TBIs, making it difficult to translate this technique to the clinic [6,7]. Additionally, other factors may contribute to changes in these brain metabolites such as diet, sleep, and exercise, again making it difficult to form conclusions and translate to the clinic [8–11]. Because the commonly studied brain metabolites remain relatively stable following TBI and can be influenced by many outside factors, it is necessary to investigate novel MRS biomarkers of brain injury.
Acrolein, an α,β-unsaturated aldehyde, has damaging effects on cellular functions. Exogenously, acrolein is released into the environment when fats and oils are burned at high temperatures. Endogenously, acrolein is a byproduct of lipid peroxidation and is released when axons and myelin are damaged. In the brain, acrolein can cause membrane damage and disrupt mitochondrial functions, ultimately resulting in significant oxidative stress and cellular dysfunction and/or death [12–15]. Acrolein can persist in the body from hours to days following injury, making it a prime candidate for clinical MRS analysis and follow-up [14,16,17]. In rat brain tissue, acrolein has been shown to increase following contact and blast TBIs; however, current methods to quantify acrolein remain largely sacrificial [13,18–20]. Less invasive methods have been attempted to quantify an acrolein byproduct, 3-HPMA, in urine. While successful in animal studies and in human subjects, methods are unable to specifically localize acrolein, a key piece of information required to predict functional loss and guide treatments [21]. Recent studies have discovered promising blood biomarkers for TBI [22,23]. However, similar to urine 3-HPMA, many blood biomarkers are not specific to the CNS, are only elevated acutely in cases of more severe TBI, and therefore have not been used clinically. Thus, it is crucial to investigate alternative biomarkers using different methodologies that will not only provide temporal, but also spatial resolution.
Although a majority of MRS research focuses on the spectral range of 0–4 ppm, there has been increasing interest in metabolites downfield of 4 ppm, including larger macromolecules and aldehydes. Based on findings from the Human Metabolome Database, acrolein, an aldehyde, shows resonances at 6.4 ppm and 9.3 ppm [24]. However, acrolein has not yet been investigated using the more clinically relevant method, MRS. Additionally, acrolein levels have been shown to peak between 24–72 hours post-TBI, making it a prime biomarker candidate for TBI given the time window commonly associated with the development and reporting of symptoms [19,25]. Notably, acrolein can be monitored over extended periods of time given its long half-life [16,26].
Current methods to assess TBI are qualitative, invasive, and/or nonspecific. By using acrolein as a biomarker for TBI and standard MRS protocols, it is possible to map injury location and quantify injury severity. With knowledge of injury location and severity, patient-specific treatment and rehabilitation strategies can be developed to enhance recovery and decrease long-term morbidity. Additionally, implementation of MRS does not rely on patient factors such as language, age, etc. and can thus be used in any clinical setting with access to an MRI. However, to become clinically translatable, methods must be developed and validated to noninvasively quantify acrolein with both high sensitivity and specificity. Using acrolein as a biomarker for TBI is novel and requires extensive experimentation before in vivo validation. In this work, we present results from NMR and pre-clinical 7 tesla (T) MRS experiments. Results from these experiments will guide the development of MRS protocols that can be used for in vivo experiments with rodents for eventual implementation in human subject protocols.
2. Materials and Methods
2.1. NMR Experimentation
Experiments for T1 and T2 relaxometry were conducted in an ARX300 (7T) NMR system (Bruker, Billerica, MA, USA). Neat acrolein (Sigma Aldrich, Cat. # 4S8501) was diluted to 90 mM in D2O at 294 K. T1 relaxometry was performed using an inversion recovery sequence; eight-point measurements were acquired, with inversion times of 0.01, 2.5, 5, 8, 12, 18, 30, and 50 seconds. T2 relaxometry was performed using the Carr-Purcell-Meiboom-Gill (CPMG) sequence with PROJECT suppression of J modulation [27]; eight-point measurements were acquired, with delay times (between adjacent pulses) of 0.08054, 0.8054, 2.416, 4.832, 8.054, 16.108, 24.162, and 32.216 seconds. Both the T1 and T2 experiments were performed in triplicate, and resulting spectra were averaged across the three trials. MestReNova [28] was used to calculate T1 and T2 relaxation times by fitting the curves with a three-parameter exponential fit.
Additional experiments were conducted in an AV800 (18.8T) NMR system (Bruker, Billerica, MA, USA). 1M acrolein was diluted to 900 mM using D2O as the solvent. 1D 1H and NOESY experiments were conducted at 800 MHz, and the 1D 13C spectrum was obtained at 200 MHz. MestReNova was used for all data processing.
2.2. MRS Experimentation
Corresponding to the 7T static magnetic field of the ARX300 NMR system, localized MRS experiments were conducted in a 7T pre-clinical MRI system (Bruker BioSpec 70/30 USR, Billerica, MA, USA). Neat acrolein was diluted with MilliQ water to create three solutions: 1 M, 100 mM, and 10 mM. Solutions were prepared in 1.5 mL Eppendorf tubes and secured and centered in a circularly polarized mouse head 1H volume coil (RF RES 300 1H 023 M.BR QSN TR, Bruker, Billerica, MA, USA). Standard Point RESolved Spectroscopy (PRESS) was used for all MRS experiments. Based on our results from NMR experiments and the long T1 and T2 expected from aldehydes, repetition time (TR) was adjusted for MRS experimentation using the following equation where T1,water = 4 seconds, T1,acrolein = 12 seconds, and X = scaling factor:
| (1) |
The scaling factor, X, was then used to determine the appropriate TR where TRstd = TR of the standard PRESS sequence, X = scaling factor determined in Eq. 1, and TRacrolein = calculated TR for acrolein experiments:
| (2) |
Initial experiments were conducted to alter the TE and flip angle. However, there was no improvement in signal-to-noise ratio (SNR) and, therefore, only TR was altered for all following experiments. PRESS parameters were adjusted (TE = 16.5 ms; TR = 6000 ms; 256 averages; 3 × 3 × 3 mm3 voxel; flip angle = 90°/180°/180°; pulse BW = 5.4/2.4/2.4 kHz, spoiler gradient duration 3 ms, read/phase/slice spoiler gradient strengths 56.0/−56.0/56.0 mT/m around first refocusing pulse, 6.6/79.2/79.2 mT/m around second refocusing pulse, t = 25:36 minutes. Standard localizing, B0 mapping, and shimming procedures were completed prior to PRESS imaging. Data quality was checked using TopSpin (Bruker, Billerica, MA, USA) and later visualized and analyzed using MestReNova, which has the capabilities to fit and quantify metabolites not available in TARQUIN. Data from PRESS experiments were Fourier transformed and peaks were integrated using water as an internal reference.
Phantoms were developed to simulate normal brain tissue. To prepare a whole-brain phantom for acrolein injection and 7T MRS experimentation, measurements were calculated using percent values indicated on the “Braino” MRS phantom (GE Medical Systems, Milwaukee, WI, USA). Potassium phosphate monobasic anhydrous, 0.68% w/v (VWR Life Sciences, Cat. # 0781–500G), L-glutamic acid monosodium salt monohydrate, 0.234% w/v (Alfa Aesar, Cat. # A12919), N-acetyl-L-aspartic acid, 0.219% w/v (Sigma Aldrich, Cat. # 00920–5G), myo-inositol, 0.135% w/v (Dot Scientific, Cat. # DS154040–100), g sodium hydroxide, 0.226% w/v (pH buffer; BDH, Cat. #BDH9292–500G), creatine, 0.15% (Spectrum, Cat. # CR105), choline chloride, 0.05% w/v (Dot Scientific, Cat. # DSC1040–100), DL-lactic acid lithium salt, 0.05% w/v (MP Biomedicals, Cat. #100824), gadolinium, 0.047% w/v (contrast agent; Sigma Aldrich, Cat. # 381667), and sodium azide, 0.1% w/v (preservative; Dot Scientific, Cat. # DSS24080–250) were measured using an analytical balance and dissolved with RODI water to make a 200 mL solution. The solution was equally portioned into 30 mL bottles, equating to 40 mL per bottle when filled to the brim. Metabolite concentrations were verified using a rat head/mouse body 1H volume coil (RF RES 300 1H 075/040 QSN TR, Bruker, Billerica, MA, USA) and a standard PRESS sequence (TE=16.5 ms; TR=2500 ms; 256 averages; 3 × 3 × 3 mm3 voxel). Data were processed and visualized using TARQUIN to compare whole-brain phantom metabolic concentrations to normal human neurometabolic concentrations [29]. 400 μL of 1 M stock acrolein was subsequently injected into the 40 mL whole brain phantom, creating a 10 mM solution. The phantom was centered in the volume coil and PRESS imaging was completed. Creatine (0.15% w/v) was used as the internal reference for whole-brain phantom analysis.
2.3. Statistical Analysis
An unpaired, unequal variances, two-tailed t-test (α = 0.05) was performed to determine if there was a significant difference between average human brain metabolic concentrations and metabolic concentrations in the whole-brain phantom. concentrations in the whole-brain phantom.
3. Results
The whole-brain phantom was validated first using 7T MRS. Using water as an internal reference, the calculated concentrations of metabolites in the whole-brain phantom were not significantly different from average metabolic values of the human brain (Fig. 1; p = 0.75).
Fig 1.

Whole-brain phantom spectral validation. Spectrum from the whole-brain phantom was obtained using a standard PRESS sequence on a Bruker pre-clinical 7T MRI system with the Bruker rat head/mouse body coil. Data were fitted using TARQUIN and a human brain basis set. Metabolites were not statistically different when comparing average human brain and whole-brain phantom values (p = 0.75) validating the use of whole-brain phantoms in future phantom analyses.
From the 7T NMR acrolein experiments, T1 for the proton peaks at 9.3 ppm equated to 13.31 seconds and T1 for the proton peaks between 6.3–6.6 ppm equated to 11.19 seconds (Fig. 2). T2 for the proton peaks at 9.3 ppm equated to 11.17 seconds and T2 for the proton peaks between 6.3–6.6 ppm equated to 9.26 seconds (Fig. 3).
Fig 2.

Calculation of T1 for each selected peak region performed by fitting the curves with a three-parameter exponential fit, with delay time τ and relaxation rate R = 1/T1. T1 for the proton peaks at 9.3 ppm equals 13.31 s, and T1 for the proton peaks between 6.3–6.6 ppm equals 11.19 s.
Fig 3.
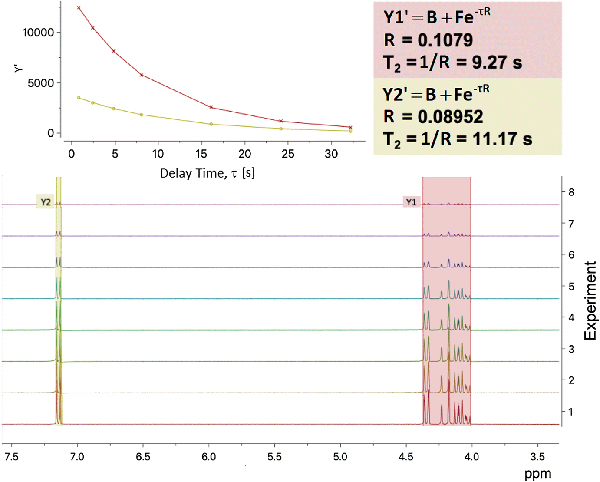
Calculation of T2 for each selected peak region performed by fitting the curves with a three-parameter exponential fit, with delay time τ and relaxation rate R = 1/T2. T2 for the proton peaks at 9.3 ppm equals 11.17 s, and T2 for the proton peaks between 6.3–6.6 ppm equals 9.26 s.
PRESS spectra obtained from different dilutions of acrolein in the 7T scanner are shown in Fig. 4. For whole-brain phantom, 10 mM acrolein was detectable at 7T (Fig. 5). Results from water and whole-brain phantoms are summarized in Table 1. 1D 1H and NOESY experiments conducted at 800 MHz are shown in Supplemental Figs. 1 and 2, and the 1D 13C spectrum obtained at 200 MHz is displayed in
Fig 4.

PRESS spectrum obtained from 7T/300 MHz Bruker pre-clinical MRI system. Acrolein was diluted to three concentrations: 10 mM, 100 mM, and 1 M. Acrolein peaks are located at 6.3 ppm, 6.5 ppm, and ppm. The spectrum confirms the sensitivity of a 7T pre-clinical MRI system to detect acrolein signal using PRESS.
Fig 5.

Spectrum from a 10-mM solution of acrolein injected into a whole-brain phantom. The spectrum relays the relative magnitude of signal obtained from acrolein compared to normal brain metabolites.
Table 1 |.
Results from Acrolein Peak Integration
| Solution Concentration |
Phantom Type | Reference Peak | 6.3–6.6 ppm Integration |
9.25–9.4 ppm Integration |
|---|---|---|---|---|
| 10 mM | Water | Water | 0.04 | 0.01 |
| 100 mM | Water | Water | 0.09 | 0.03 |
| 1 M | Water | Water | 0.84 | 0.27 |
| 10 mM | Whole-brain | Creatine | 0.17 | 0.16 |
Acrolein peaks were manually integrated for all solutions using MestReNova. The complex multiplet was integrated between 6.3 and 6.6 ppm. The doublet was integrated between 9.25 and 9.4 ppm. Water was used as an internal reference for the water phantom and creatine was used as the internal reference for the whole-brain phantom.
Discussion
With the increasing awareness of TBI in military training and combat and contact sports, and the associated long-term disabilities associated with these injuries, it is critical to investigate novel methods to better localize and quantify injury severity. Doing so could offer valuable clinical insight to specialize patient treatment and rehabilitation plans. While some MRI methods, such as functional MRI and diffusion tensor imaging, require intensive data processing, MRS data can be analyzed in the matter of minutes and include brain region spatialization and analysis of metabolite concentrations. Studies analyzing metabolites in the 0–4 ppm range show relatively inconsistent data regarding concentration changes following TBI, confirming the need to investigate alternative biomarkers.
Acrolein, an endogenous neurotoxin, is a prime candidate for investigating TBI as it is known to increase in brain tissue following physical damage to neuronal tissue. We have demonstrated that acrolein can be quantified in a pre-clinical MRI system, suggesting further applications in animal and human studies. Using data obtained from ex vivo NMR experiments, in vivo MRS protocols can be adjusted to improve the SNR of acrolein, thereby decreasing the limit of detection from millimolar concentrations to micromolar. An analysis of peak-specific SNR from the 7T MRS experiments can be viewed in Supplemental Figs. 4–9. However, there remains a drop in signal when comparing NMR and MRS data. The large drop in signal can result from magnetic field inhomogeneities, gradient imperfections, sample concentration, acrolein purity and stability, and is confounded by the long acrolein-associated T2 compared to TE. Given acrolein is a small and mobile molecule, it has a high rate of molecular motion resulting in longer T1 relaxation [33]. Previous studies have reported long relaxation times associated with aldehydes, substantiating the long T1 and T2 of acrolein [30–32]. Similarly, given acrolein’s small molecular weight, size, and high rate of molecular motion, the T2 relaxation time is also long, though expectedly shorter than T1 [34].
By obtaining T1 and T2, TR can be adapted to ensure acrolein reaches a desired magnetization for facilitating adequate signal. T1 refers to the time it takes for the protons of a particular molecule or metabolite to relax longitudinally, to which they are tipped using radiofrequency pulses, back to the z-plane of the magnetic field. Because acrolein is a reactive, small aldehyde, its T1 relaxation time is quite long, thereby lengthening TR, and consequently, scan time (t=25:36). Although the scan time is longer than typical spectroscopic imaging procedures, it can provide invaluable information regarding the precise location of an injury and relative concentration of acrolein following TBI. This procedure would be most valuable for patients who require rehabilitation following initial hospitalization as spatial acrolein maps could be used to indicate primary regions of injury for patient-specific rehabilitation plans.
To date, no MRS methods have been validated to give ground truth in vivo metabolic concentrations, and the true, physiological levels of brain metabolites remain unknown [35]. This is in part due to the inability to perform invasive in vivo procedures to extract exact tissue concentrations. Methods do exist to quantify metabolites ex vivo, however, these values are not a true representation of physiological levels. To address these issues, quantitative methods have been developed to produce relative metabolite concentrations. The three most common methods for in vivo spectroscopy are 1) use of a phantom with known metabolic concentrations (i.e., an external reference), 2) use of an internal reference (e.g., water or creatine), or 3) use a basis set provided by a post-processing software [36].
The most widely used method is the use of an internal reference. Water exists in all biological tissues, including the brain. Because of its abundance, the water peak typically overshadows peaks of interest. To combat this problem, water is normally suppressed in parallel with the MRS pulse sequence. However, if a non-water-suppressed scan is completed, the known concentration of unsuppressed water (i.e., 80 M in human brain) can be used as an internal reference [37–39]. Creatine, a known brain metabolite, may also be used as an internal reference; results using this method are reported as ratios to creatine (e.g., Glx:Cr) [36]. Creatine has been reported to remain stable in many TBI studies, hence its frequent use as a reference [40–41]. However, some studies have reported changes in creatine following TBI [42].
Figures 4 and 5 depict the relative concentrations of acrolein using the internal reference methods described. Discrepancies between acrolein concentrations in the water phantom versus the whole-brain phantom result from use of a different reference molecule (i.e., water vs. creatine). Because creatine levels are not consistent across TBI MRS studies, best practice would be to conduct a non-water-suppressed reference scan and use water as an internal reference for acrolein concentration calculations [42].
The possibility remains that signal will drop too significantly when transitioning protocols to phantoms to animal models and human subjects. In the case that acrolein is undetectable, byproducts can be investigated, such as 3-HPMA. Additionally, acrolein is scavenged by the antioxidant, glutathione (GSH) which has been measured using MRS methods in human subjects. Acrolein has been shown to deplete GSH stores, and it can be hypothesized that GSH would decrease in the brain following TBI. However, GSH also scavenges other free radicals, making it impossible to conclude that a decrease in GSH corresponds solely to an increase in acrolein. However, using both 3-HPMA and GSH, it is possible to indirectly quantify acrolein since 3-HPMA is a direct byproduct of the reaction between GSH and acrolein. An additional alternative would be the use of a human 7T MRI system. These systems are becoming increasingly popular for use in clinical research as the higher magnetic field greatly improves the SNR and quality of the data obtained. As 7T systems increase in popularity and use, it would be possible to implement animal-based protocols devised and tested with 7T pre-clinical MRI systems (e.g., Bruker) on human subjects.
Overall, the quantification of acrolein using MRS, and potentially magnetic resonance spectroscopic imaging (MRSI), could provide valuable information regarding the location and severity of brain damage. MRS typically uses a single voxel which can be placed in any region of interest; whereas, MRSI can be used to quantify metabolites across the entire brain. Future work must be done to improve the SNR of acrolein first using a single voxel, followed by translation to MRSI protocols. Using MRSI also increases the scan time – a feature that must be considered when developing techniques for clinical use. However, the benefit of discerning precise injury location may vastly outweigh the disadvantage of lengthened scan time required to obtain the spectra. Additionally, animal studies must be completed to 1) correlate injury severity with the normalized concentration of acrolein using the unsuppressed water signal as a reference, 2) establish a time course of acrolein in vivo, over time, and 3) develop a model that can predict the severity of injury based on the concentration of acrolein observed. Lastly, it is critical to develop a basis set for acrolein in the context of human brain MRS. This would allow for the use of brain-specific MRS tools, such as Tarquin and LCModel, for more accurate fitting of acrolein peaks in relation to other brain metabolites [43–44]. Additionally, this would eliminate the need for an unsuppressed water reference scan, thereby decreasing scan time and making it more feasible for clinical applications.
Due to the high incidence and prevalence of TBI, particularly at mild severity, and its association with long-term disabilities, it is crucial to investigate methods that can assist with the diagnosis, treatment, and rehabilitation of patients. Using acrolein as a biomarker for TBI, and adjusted MRS methods, it is possible to create a map of injury severity across the brain. By doing so, a physician could assess where the most severe damage is located and implement patient-specific regimens for treatment and therapy. In addition, these methods could be used to evaluate the efficacy of pharmaceuticals developed to reverse existing, or prevent further damage, following TBI.
Supplementary Material
Acknowledgements
This work was supported in part by the National Institutes of Health (Grant Nos. NS073636 and 1 R21 NS090244–01 to R.S.) and a Project Development Team within the ICTSI NIH/NCRR (Grant Number UL1TR001108). The authors gratefully acknowledge support from the Purdue University Center for Cancer Research, NIH grant P30 CA023168. We would also like to acknowledge the Purdue NMR Facility, including Dr. Huaping Mo and Dr. John Harwood, for their expert guidance with experimental design and implementation, and Dr. Gregory Tamer for continued assistance with the 7T Bruker system.
Footnotes
The authors have no conflicts of interest to declare.
Publisher's Disclaimer: This Author Accepted Manuscript is a PDF file of an unedited peer-reviewed manuscript that has been accepted for publication but has not been copyedited or corrected. The official version of record that is published in the journal is kept up to date and so may therefore differ from this version.
References
- 1.Centers for Disease Control and Prevention. Report to Congress on Traumatic Brain Injury in the United States; Epidemiology and Rehabilitation (National Center for Injury Prevention and Control; Division of Unintentional Injury Prevention, 2015), https://www.cdc.gov/traumaticbraininjury/pdf/TBI_Report_to_Congress_Epi_and_Rehab-a.pdf. Accessed 10 August 10 2018 [DOI] [PubMed] [Google Scholar]
- 2.Taylor CA, Bell JM, Breiding MJ. MMWR Surveill. Summ 66, SS-9 (2017). [DOI] [PMC free article] [PubMed] [Google Scholar]
- 3.Vicente J, Fuster-Garcia E, Tortajada S, García-Gómez JM, Davies N, Natarajan K, Wilson M, Grundy RG, Wesseling P, Monleón D, Celda B, Robles M, Peet AC, Eur. J. Cancer 49, 658 (2013). [DOI] [PubMed] [Google Scholar]
- 4.Ulmer S, Backens M, Ahlhelm FJ, J. Comput. Assist. Tomogr 40, 1 (2016). [DOI] [PubMed] [Google Scholar]
- 5.Richards TL, Am. J. Roentgenol 57, 1073 (1991). [DOI] [PubMed] [Google Scholar]
- 6.Vagnozzi R, Signoretti S, Cristofori L, Alessandrini F, Floris R, Isgrò E, Ria A, Marziale S, Zoccatelli G, Tavazzi B, Del Bolgia F, Sorge R, Broglio SP, McIntosh TK, Lazzarino G, Brain 133, 3232 (2010). [DOI] [PubMed] [Google Scholar]
- 7.Poole VN, Abbas K, Shenk TE, Breedlove EL, Breedlove KM, Robinson ME, Leverenz LJ, Nauman EA, Talavage TM, Dydak U, Dev. Neuropsychol 39, 459 (2014). [DOI] [PubMed] [Google Scholar]
- 8.Zhu H, Barker PB, Methods Mol. Biol 711, 203 (2011). [DOI] [PMC free article] [PubMed] [Google Scholar]
- 9.Desseilles M, Dang-Vu T, Schabus M, Sterpenich V, Maquet P, Schwartz S, Sleep 31, 777 (2008). [DOI] [PMC free article] [PubMed] [Google Scholar]
- 10.Simon DW, McGeachy MJ, Bayir H, Clark RSB, Loane DJ, Kochanek PM, Nat. Publ. Gr 13, 171 (2017). [DOI] [PMC free article] [PubMed] [Google Scholar]
- 11.Dennis A, Thomas AG, Rawlings NB, Near J, Nichols TE, Clare S, Johansen-Berg H, Stagg CJ, Front. Physiol 6, 1 (2015). [DOI] [PMC free article] [PubMed] [Google Scholar]
- 12.Hall ED, Wang JA, Bosken JM, Singh IN, J. Bioenerg. Biomembr 48, 169 (2016). [DOI] [PMC free article] [PubMed] [Google Scholar]
- 13.Shao C, Roberts KN, Markesbery WR, Scheff SW, Lovell MA, Free Radic. Biol. Med 41, 77 (2006). [DOI] [PubMed] [Google Scholar]
- 14.Shi R, Rickett T, Sun W, Mol. Nutr. Food Res 55, 1320 (2011). [DOI] [PMC free article] [PubMed] [Google Scholar]
- 15.Shi R, Page JC, Tully M, Free Radic. Res 49, 888 (2015). [DOI] [PMC free article] [PubMed] [Google Scholar]
- 16.Integrated Risk Information System. Toxicology review of acrolein CAS No. 107–02-8. (United States Environmental Protection Agency, 2003), https://cfpub.epa.gov/ncea/iris/iris_documents/documents/toxreviews/0364tr.pdf. Accessed August 15 2018 [Google Scholar]
- 17.Ghilarducci DP, Tjeerdema RS, Rev. Environ. Contam. Toxicol 144, 95 (1995). [DOI] [PubMed] [Google Scholar]
- 18.Walls MK, Race N, Zheng L, Vega-Alvarez S, Acosta G, Park J, Shi R, J. Neurosurg 124, 675 (2016). [DOI] [PMC free article] [PubMed] [Google Scholar]
- 19.Ansari MA, Roberts KN, Scheff SW, Free Radic. Biol. Med 45, 443 (2008). [DOI] [PMC free article] [PubMed] [Google Scholar]
- 20.Hamann K, Durkes A, Ouyang H, Uchida K, Pond A, Shi R, J. Neurochem 107, 712 (2008). [DOI] [PMC free article] [PubMed] [Google Scholar]
- 21.Tully M, Tang J, Zheng L, Acosta G, Tian R, Hayward L, Race N, Mattson D, Shi R, Front. Neurol 9, 420 (2018). [DOI] [PMC free article] [PubMed] [Google Scholar]
- 22.Agoston DV, Shutes-David A, Peskind ER, Brain Inj. 31, 1195 (2017). [DOI] [PubMed] [Google Scholar]
- 23.Kawata K, Liu CY, Merkel SF, Ramirez SH, Tierney RT, Langford D, Neurosci. Biobehav. Rev 68, 460 (2016). [DOI] [PMC free article] [PubMed] [Google Scholar]
- 24.Human Metabolome Database 1H NME Spectrum HMDB0041822. (HMDB, 2014), http://www.hmdb.ca/spectra/nmr_one_d/2100. Accessed August 10 2018 [Google Scholar]
- 25.Luo J, Uchida K, Shi R, Neurochem. Res 30, 291 (2005). [DOI] [PubMed] [Google Scholar]
- 26.Chen WY, Zhang J, Ghare S, Barve S, Mcclain C, Joshi-Barve S, Cell. Mol. Gastroenterol. Hepatol 2, 685 (2016). [DOI] [PMC free article] [PubMed] [Google Scholar]
- 27.Aguilar JA, Nilsson M, Bodenhausen G, Morris GA, Chem. Commun 48, 811 (2012). [DOI] [PubMed] [Google Scholar]
- 28.Willcott MR, J. Am. Chem. Soc 131, 13180 (2009). [Google Scholar]
- 29.Minati L, Aquino D, Bruzzone MG, Erbetta A, J. Med. Phys 35, 154 (2010). [DOI] [PMC free article] [PubMed] [Google Scholar]
- 30.Freeman R, Hill HDW, J. Chem. Phys 51, 3367 (1969). [Google Scholar]
- 31.Vaish SK, Singh A, Singh AK, Mehrotra NK, Indian J. Pure Ap. Phy 43, 295 (2005). [Google Scholar]
- 32.Guenneau F, Mutzenhardt P, Grandclaude D, Canet D, J. Magn. Reson 140, 250 (1999). [DOI] [PubMed] [Google Scholar]
- 33.Bloembergen N, Purcell EM, Pound RV, Phys. Rev 73, 7 (1948). [Google Scholar]
- 34.Kaiser R, J. Chem. Phys 42, 1838 (1965). [Google Scholar]
- 35.Dhamala E, Abdelkefi I, Nguyen M.Hennessy JT, Nadeau H, J. Near, NMR Biomed 32, 3 (2019). [DOI] [PubMed] [Google Scholar]
- 36.Xin L, Tkáč I, Anal. Biochem 529 (2017). [DOI] [PubMed] [Google Scholar]
- 37.Zhu H, Barker PB, Methods Mol. Biol 711 (2011). [DOI] [PMC free article] [PubMed] [Google Scholar]
- 38.Alger JR, Top. Magn. Reson. Imaging 21, 2 (2010). [DOI] [PMC free article] [PubMed] [Google Scholar]
- 39.Tong Z, Yamaki T, Harada K, Houkin K, J. Magn. Reson. Imaging, 22, 7 (2004). [DOI] [PubMed] [Google Scholar]
- 40.Stovell MG, Yan J, Sleigh A, Mada M, Carpenter AT, Hutchinson PJA, Carpenter KLH, Front. Neurol 8, 426 (2017). [DOI] [PMC free article] [PubMed] [Google Scholar]
- 41.Vagnozzi R, Signoretti S, Cristofori L, Alessandrini F, Floris R, Isgrò E, Ria A, Marziale S, Zoccatelli G, Tavazzi B, Bolgia F, Sorge R, Broglio S, McIntosh T, Lazaarino G, Brain, 133, 11 (2010). [DOI] [PubMed] [Google Scholar]
- 42.Gasparovic C, Yeo R, Mannell M, Ling J, Elgie R, Phillips J, Doezema D, Mayer AR, J. Neurotrauma, 26, 10 (2009). [DOI] [PMC free article] [PubMed] [Google Scholar]
- 43.Wilson M, Reynolds G, Kauppinen RA, Arvanitis TN, Peet AC, Magn. Reson. Med 65 (2011). [DOI] [PubMed] [Google Scholar]
- 44.Provencher S, Magn. Reson. Med 30, 672 (1993). [DOI] [PubMed] [Google Scholar]
Associated Data
This section collects any data citations, data availability statements, or supplementary materials included in this article.