

Abstract
Background
Mental health problems and mental health related mortality have increased among adolescents, particularly girls. These trends have implications for etiology and prevention and suggest new and emerging risk factors in need of attention. The present study estimated age, period, and cohort effects in depressive symptoms among US nationally representative samples of school attending adolescents from 1991 to 2018.
Methods
Data are drawn from 1991 to 2018 Monitoring the Future yearly cross-sectional surveys of 8th, 10th, and 12th grade students (N = 1,260,159). Depressive symptoms measured with four questions that had consistent wording and data collection procedures across all 28 years. Age–period–cohort effects estimated using the hierarchical age–period–cohort models.
Results
Among girls, depressive symptoms decreased from 1991 to 2011, then reversed course, peaking in 2018; these increases reflected primarily period effects, which compared to the mean of all periods showed a gradual increase starting in 2012 and peaked in 2018 (estimate = 1.15, p < 0.01). Cohort effects were minimal, indicating that increases are observed across all age groups. Among boys, trends were similar although the extent of the increase is less marked compared to girls; there was a declining cohort effect among recently born cohorts, suggesting that increases in depressive symptoms among boys are slower for younger boys compared to older boys in recent years. Trends were generally similar by race/ethnicity and parental education, with a positive cohort effect for Hispanic girls born 1999–2004.
Conclusions
Depressive symptoms are increasing among teens, especially among girls, consistent with increases in depression and suicide. Population variation in psychiatric disorder symptoms highlight the importance of current environmental determinants of psychiatric disorder risk, and provide evidence of emerging risk factors that may be shaping a new and concerning trend in adolescent mental health.
Keywords: Depression, Age-period-cohort, Adolescent, Suicide, Time trend
Introduction
Depression is a multi-dimensional construct that includes a variety of symptoms characterized by mood-related changes in affect, behavior, cognition, as well as physiological changes [1], and is part of a broader constellation of experiences that constitute well-being. While evidence suggests that the incidence of depressive symptoms among youth remained stable from the 1960s through 1990s [2], evidence is growing to indicate that aspects of depression have been increasing among youth in more recent years. Mojtabai et al. reported increases in the 12-month prevalence of major depressive episodes (MDE) from 8.7 to 12.5% among adolescents from 2005 to 2015 [3], with the largest increases since 2012 [4]. While adolescent suicide remains a rare event, from 1999 to 2014 suicide rates tripled among girls aged 10–14 (0.5–1.5/100,000) and increased among older adolescents and boys as well [5], and suicide-related behavior has increased among high school students since 2012 as well [6]. A broader understanding of the underlying dimensions of depressive symptoms, which are more prevalent than depressive disorders but can be associated with distress and impairment [7], is a particularly pressing need.
Trends over time in various aspects of depressive symptoms have received considerable attention in the literature over the years, yet remain inadequately understood. For example, sales of prescription medication to treat depressive and related mood disorders, among both adolescents and adults, increased substantially starting in the mid 1990s [8], as did outpatient visits to psychiatric clinics for treatment of depression [9, 10]. Whether this is an effect of increased awareness and attention or an actual increase in prevalence, or some of both, remains difficult to untangle. Many studies examining trends over time rely on different individuals interviewed at different ages about lifetime history [11–14], precluding firm inference about trends given potential cohort effects and inaccurate recall. Cross-cohort and prospective follow-up studies have indicated relatively stable (or even decreasing) [15] incidence and symptom distribution of depression [16–19]; but these studies are focused mainly on adults and do not include data on more recent cohorts of adolescents. Based on a meta-analysis of children and adolescents from birth cohorts of 1965 through 1996, Costello et al. [2] reported that there was no evidence for an increase in the prevalence of depression or depressive symptoms in the prior 30-year period. Prevalence data reported in a 2015 meta-analysis also found no effect of year of data collection on depression prevalence, although no data from the US from the past decade were included [20]. Thus, more updated information is needed; adolescents in the past decade are in an environment of rapid change in technology (including social media) [21–24], health (e.g., decreased sleep, [25] increased obesity [26]), and other changes that may influence aspects of depressive symptoms.
Given the lack of ubiquitous treatment for depressive disorders, understanding trends in depressive symptoms in the general population (as opposed to treated samples) is an important component of surveillance. Increases in depressive symptoms may signal that environmental risk factors are increasing in prevalence or magnitude, or could signal new and emerging risk factors that need to be addressed (e.g., online bullying) [27–31]. Trends over time in other developmental and behavioral health indicators in adolescence, including substance use [32], risk preference [33], and sleep [25], also suggest the need to evaluate whether distributions are changing over time.
One central inferential problem in attempting to understand trends over time in depressive symptoms in adolescents is the extent to which trends reflect age, period, or cohort effects [34–36]. There are clearly age trends in depressive symptoms across adolescence [12, 37], such that they escalate during early adolescence. Yet age trends can vary across different birth cohorts, as risk factors shift and emerge. Furthermore, historical trends can be specific to certain cohorts or more pervasive and occur across multiple ages/cohorts during the same measurement period. Understanding whether historical time trends are specific to certain birth cohorts (cohort effect) or more generally applicable across the full age-span of adolescence (period effect) is important for theoretical and applied purposes and for correctly identifying the potential cultural and social mechanisms contributing to the historical change. Age–period–cohort (APC) analyses provide a methodological approach to separating variance attributable to ages, periods, and cohorts [34–36]; such analyses have not yet been conducted regarding adolescent depressive symptoms, leaving important gaps in our understanding.
To address these gaps, we use US national data from the monitoring the future study spanning 28 years. This includes a total of 446,244 students across grade and year sampled to be nationally representative of 8th, 10th, and 12th graders each year between 1991 and 2018. We use APC models to conduct formal separation of time trends into age, period, and cohort effects, focusing on depressive symptoms that generally align with cognitive aspects of depression including demoralization and sadness [38, 39]. It is noteworthy that the survey procedures and items assessing depressive symptoms in this data set have remained constant across 28 years, allowing for the most rigorous investigation into time trends in depressive symptoms conducted to date.
Methods
Sample
Monitoring the Future (MTF) includes an annually conducted cross-sectional national survey, since 1991, of 8th, 10th, and 12th grade students in ~ 400 US public and private schools in the 48 contiguous United States [40]. Included measurement years were 1991 through 2018, consisting of birth cohorts 1973–2005 and ages 13 through 18. Schools are selected under a multi-stage random sampling design, and are invited to participate for 2 years. Schools that decline participation are replaced with schools that are similar on geographic location, size, and urbanicity. The overall school participation rates (including replacements of schools that decline to participate) range from 90 to 99% for all study years. Student response rates have ranged from 85.0 to 87.3%, and averaged 86.5%, with no systematic trend. Almost all non-response is due to absenteeism; less than 1% of students refuse to participate. Self-administered questionnaires are given to students. Detailed description of design and procedures are provided elsewhere [40, 41]. The present study focuses on students who were randomized to a questionnaire that included questions regarding depressive symptoms, including a random one-half of the 8th and 10th graders and a random one-sixth of the 12th graders. The sample was restricted to those aged 13 through 18 (i.e., individual’s aged less than 13 and over 18 were removed from the analysis, due to small numbers leading to unreliable estimates). The total eligible sample size was 512,283 (229,772 8th graders, 213,743 10th graders, 68,768 12th graders). The Institutional Review Board of University of Michigan approved the study procedures, and the Institutional Review Board of Columbia University approved the secondary data analysis for this paper.
Measures
Depressive symptoms
Four items were used to measure depressive symptoms, 1 (Disagree) to 5 (Agree) after the stem questions “How much do you agree or disagree with each of the following statements”: “Life often seems meaningless”, “The future often seems hopeless”, “It feels good to be alive”, and “I enjoy life as much as anyone”. The latter two questions were reverse coded for analysis. Psychometric analyses suggest that they have high internal reliability, and previous studies of these data suggest construct validity because they are associated with substance use and other mental health symptoms scales [42–45]. Cronbach’s alpha for the scale ranged from 0.75 (1992) to 0.81 (2016), averaged across the three grades. These items map onto two symptoms of major depressive episodes based on DSM-5 [46] (feelings of worthlessness, recurrent thoughts of death) and are similar to items in other depressive symptom scales commonly used in survey research [47]. Items are related to cognitive aspects of depressive symptoms, and map onto constructs such as demoralization articulated by Dohrenwend and others [39]. Scores were summed to create a total score. Sensitivity analysis examined trends based on dichotomized scores, at the 75th and 90th percentile, estimated across all years and stratified by sex. Respondents missing data on one of the four items (2.48%) were imputed with the mean value of the other three; respondents missing data on two or more of the four items (0.65%) were excluded from the analysis. In the overall unweighted sample, scores ranged from 4 to 20 with a mean of 7.80 (SD = 3.76) and a median of 7.0, indicating that the mean and median scores were close to the “disagree somewhat” response (2 on the response scale).
Demographics
Analyses were stratified by respondent-identified sex (male: 48%), race/ethnicity (non-Hispanic White: 63%; non-Hispanic Black: 12%; Hispanic: 12%; Asian: 4%; Other 9%), and parental education (a proxy for socio-economic status), measured as the highest level of education of either the mother or the father (less than 4 year college [42%], college degree or grad school [52%], did not know [6%]). Respondents missing on demographics were excluded from analyses stratified by that demographic, and were retained for all other analyses in which data were available.
Statistical analysis
We began by estimating mean depressive symptoms by grade and year, across the 28 years of data collection. We used a piecewise cubic spline to smoothly estimate the nonlinear historical trend across the 28 years. We then proceeded to age–period–cohort modeling. We used hierarchical age–period–cohort (HAPC) models, implemented in SAS software, as described by Yang and colleagues [35, 48, 49]. HAPC models are two-level multi-level models. On level one is age, modeled here as a categorical variable with age of 15 years as the reference group. Thus, we estimate the extent to which depressive symptoms vary across developmental age. Then, we also assess the extent to which depressive symptoms vary across historical time, across two dimensions of time: period, and cohort. Period (categorical year of data collection) and cohort (categorical year of birth [period of data collection minus current age in years]) are estimated as random effects in the model. Period effects provide information on the variation in depressive symptoms that is constant across all ages at a particular historical time. Cohort effects provide information on the variation in depressive symptoms that is constant across a birth cohort observed at various time periods and ages. Thus, a positive cohort effect, for example, indicates that variation across period and cohort is greater among those born in a particular year. Models were stratified by sex, race/ethnicity, and parental education. Sensitivity analyses examined depressive symptoms at 75th and 90th percentile cut points.
Results
Descriptive trends in depressive symptoms by year from 1991 to 2018
Figure 1 shows the mean depressive symptom score by year, for each year from 1991 through 2018 (each mean and standard deviation is also provided in Supplementary Table 1). Among girls, depressive symptoms showed a general downward trend, with some fluctuation, across study years from 1991 through 2007. Beginning in 2012, depressive symptoms increased in the total sample by year through 2018, from 7.67 (SD = 3.85) in 2012 to 9.18 in 2018 (SD = 4.34). Among boys, depressive symptoms remained relatively stable through 2004, decreased though 2012, and then increased from 7.26 (SD = 3.50) in 2012 to 8.39 (SD = 3.93) in 2018. In terms of standard deviations, the overall standard deviation across years for depressive symptoms was 3.88 among girls and 3.67 among boys, indicating that the increases observed from 2012 to 2018 among girls was approximately 0.50 standard deviations; among boys, the increase from 2012 to 2018 was approximately 0.33 standard deviations. Supplementary Fig. 1 shows results stratified by grade; increases in recent years were observed for all grades for both boys and girls.
Fig. 1.

Mean depressive affect symptoms by year among US adolescent girls and boys, 1991–2018
We also estimated the percentage of adolescents in the 75th and top 90th percentile of depressive symptoms score by year, with results in Supplementary Figs. 2 and 3. Among girls, 20.8% were in the top 75th percentile in 1999, and 36.7% were in the top 75th percentile in 2018. Among boys, 19.8% were in the top 75th percentile in 2012, and 30% were in the top 75th percentile in 2018. Among girls, 7.7% were in the top 90th percentile in 2007, and 16.9% were in the top 90th percentile in 2018. Among boys, 5.8% were in the top 90th percentile in 2012, and 10.4% were in the top 90th percentile in 2018.
Age, period, and cohort effects in depressive symptoms
Figure 2 shows age, period, and cohort effects in depressive symptoms among girls. Estimate for period and cohort can be interpreted as the average effect of the parameter compared to all other periods and cohorts, at the reference group for age (reference group for age is 15 years). Those aged 15 years had higher depressive symptoms compared with all other ages included. Period effects indicated peaks in depressive symptoms in 2014 through 2018. Period effects demonstrated that compared to 2007, mean scores significantly declined through 2012, and then began increasing, with significant period effects through 2018. Few cohort effects were observed, although compared to those born in 1990, girls born in 2001 had significantly higher cohort effects (estimate = 0.18, p < .01). In totality this indicates that depressive symptom scores are increasing for all adolescent girls after 2012, with little variation in the rate of increase by birth cohort.
Fig. 2.
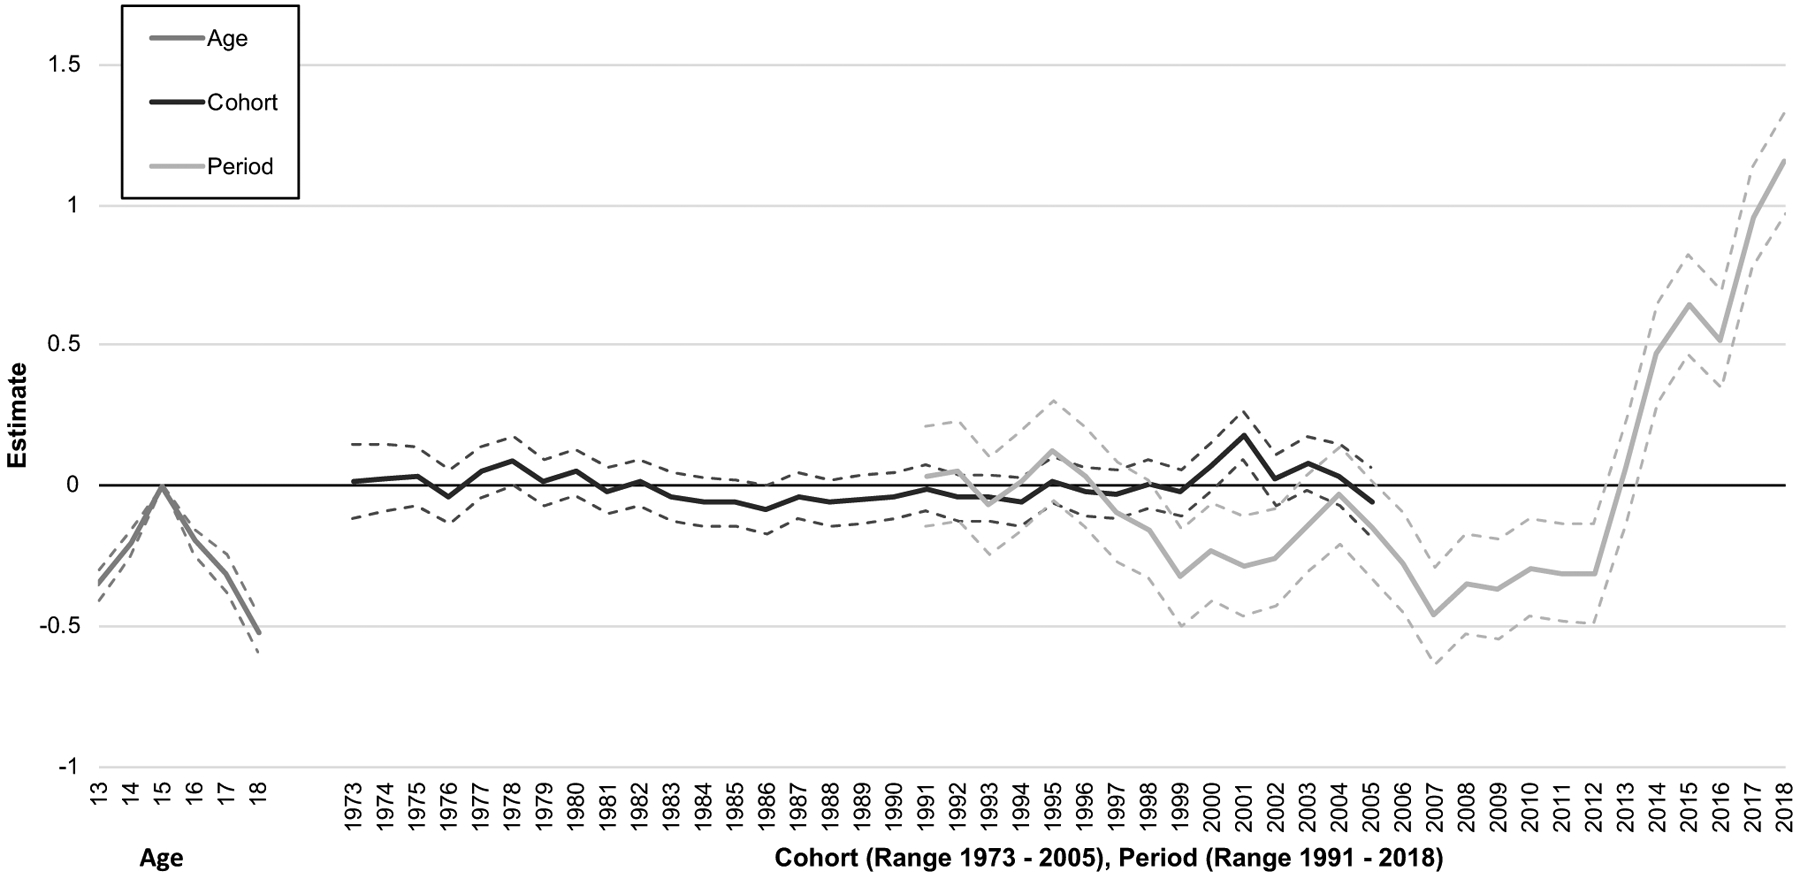
Age, period, and cohort effects in depressive symptoms among adolescent girls aged 13–18 years in the US, 1991–2018
Figure 3 shows age, period, and cohort effects in depressive symptoms among boys. Regarding age effects, those 17 years old had the highest depressive symptoms, with a mean that was approximately 0.16 (95% CI 0.09–0.23) points higher than for 15 year old boys. Period effects showed a general decline compared to 2007 until 2012 at which point depressive symptoms increased sharply through 2018. Cohort effects showed that boys born after 2001 had lower depressive symptoms compared to boys born in 1990, controlling for the period effect. In totality this indicates that depressive symptom scores are increasing for all adolescent boys, with the rate of increase being lower for boys in younger born cohorts compared to older born cohorts.
Fig. 3.
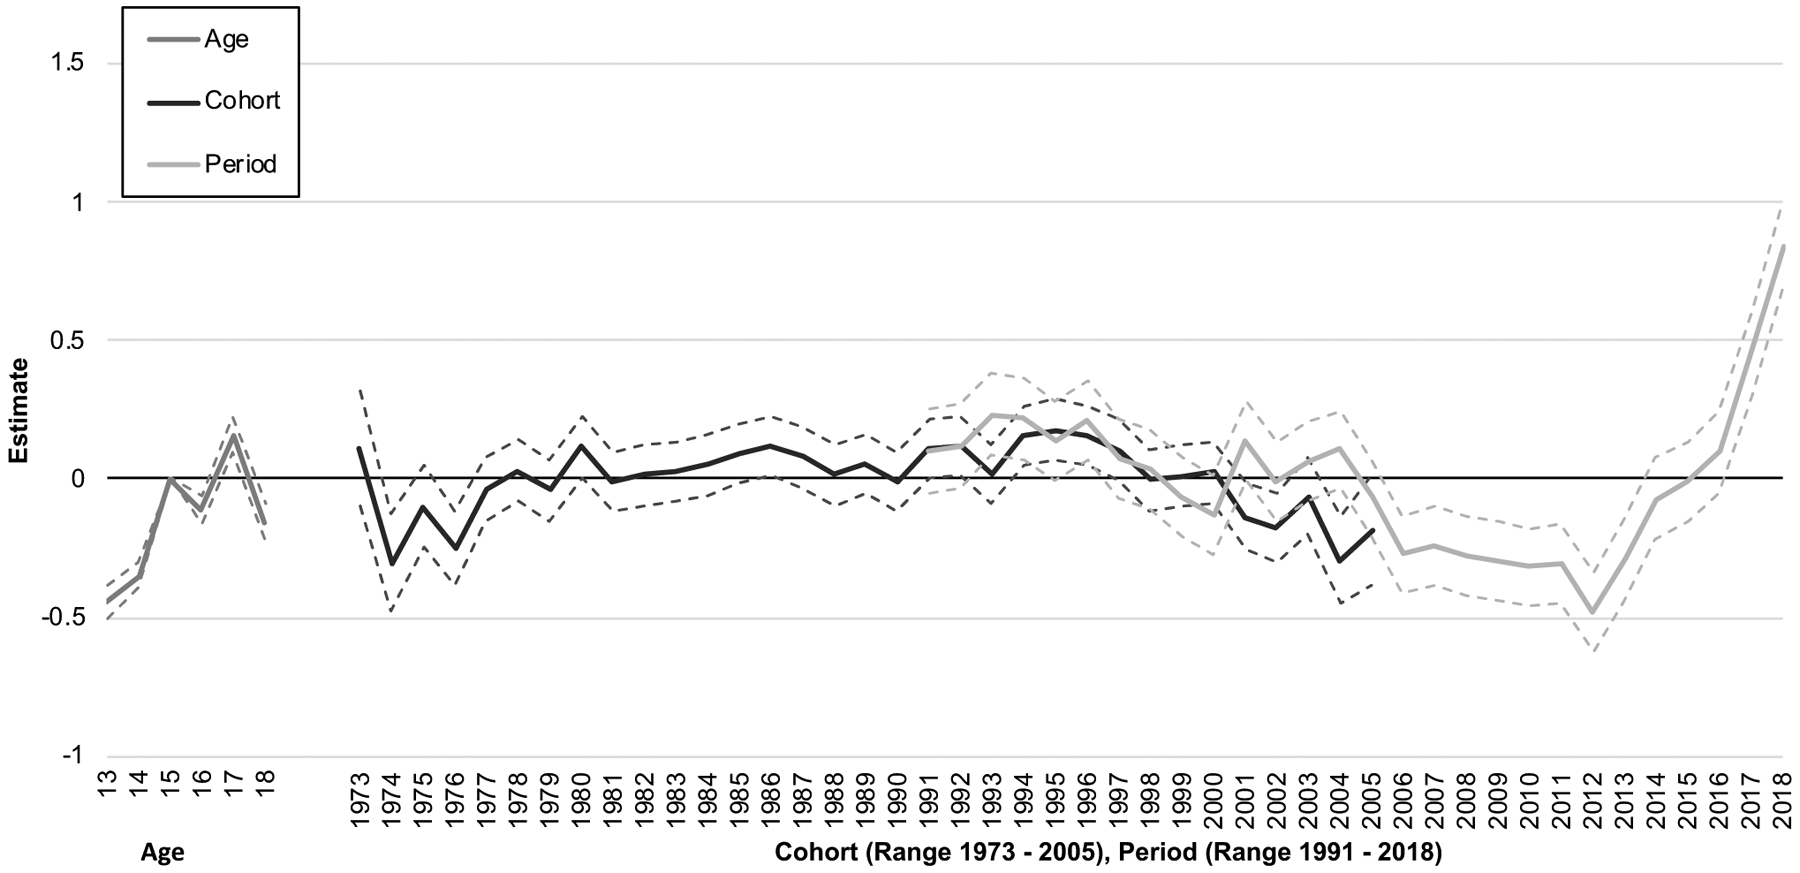
Age, period, and cohort effects in depressive affect symptoms among boys aged 13–18 years in the US, 1991–2018
Supplementary figures: trends by race and highest level of parental education
Regarding race/ethnicity, among girls, there was a significant increase in depressive symptoms manifesting as a period effect in recent years among White, Black and Hispanic girls. There was also a positive cohort effect for Hispanic girls in cohorts born between 1999 and 2004. This indicates that during the period of overall increases in depressive symptoms, cohorts born between 1999 and 2004 had more of an increase compared with other cohorts. Among boys (Supplementary Fig. 5), trends by race/ethnicity were similar to overall trends. Regarding parental education period effects, results for both girls (Supplementary Fig. 6) and boys (Supplementary Fig. 7) were similar to the overall sample.
Supplementary figures: trends using dichotomous measures of depressive symptoms
Supplementary Figs. 8 and 9 show age, period, and cohort effects for those above the 75th percentile of depressive symptoms among girls and boys, respectively, and Supplementary Figs. 10 and 11 show the effects for those about the 90th percentile among girls and boys, respectively. Period effects in recent years were strong and consistent across boys and girls for both measures. There was also the emergence of a positive cohort effect for girls born in the early 2000s when using the dichotomized measure, both at the 75th and the 90th percentile.
Discussion
Symptoms of depression are increasing among US students aged 13–18 years through 2018, with the largest increases occurring among girls since 2012. This conclusion is based on national trends among adolescents from 1991 to 2018 in the United States, using annual cross-sectional self-report data from almost a half-million adolescents with consistent sampling frames and measurement of depressive symptoms. These results are consistent with two other national data sources of adolescents, both of which have documented substantial and significant increases in depression and suicidal behavior, beginning around 2012, and affecting girls more than boys [3, 6].
Distinguishing among age, period, and cohort effects, we found clear age effects for girls and boys, with depressive symptoms increasing for both across adolescence, peaking at the age of 15 and 17 years, respectively. After factoring out variance by age, we were able to focus directly on period and cohort effects. For girls, period effects for depressive symptoms showed a decreasing trend from 1991 to 2012, and then a reverse in course, peaking in 2018; over and above these period increases, there was little additional contribution of birth cohort, suggesting that increases are occurring across all age groups. Boys also showed a similar period effect with declines between the mid-1990s and mid-2000s before starting to increase sharply in 2012/3, peaking in 2018; however, these recent increases for boys were countered by cohort effects showing decreasing depressive symptoms, such that increases in boys’ depressive symptoms in more recent cohorts are less than in the earlier cohorts. Importantly, these age, period, and cohort effects for girls and boys were found to be largely consistent by race/ethnicity and parental education. One notable difference is the emergence of a cohort effect specific to Hispanic girls, with those born between 1999 and 2004 evidencing greater increases in depressive symptoms compared to other cohorts, during a time in which symptoms were increasing across all age groups.
While increases in depressive symptoms are a cause for concern, we note that the range of change in depressive symptoms across time was relatively modest until recent years. While increases in depressive symptoms are a cause for concern, we note that the range of change in depressive symptoms across time was relatively modest until recent years. This relative stability in symptoms of depressive symptoms through most years covered here corresponds to evidence from other longitudinal studies and meta-analyses [2, 16, 20]. Indeed, among girls, depressive symptoms slightly decreased from 1991 through approximately 2006, and among both sexes, depressive symptoms slightly decreased from approximately 2000 to 2011. Treatment utilization for depression among adolescents has increased over the past two decades; Olfson et al., for example, report that the proportion of adolescents receiving outpatient mental health services (not specific to depression) increased from 9.2% in 1996–1998 to 13.3% in 2010–2012 [50]. Our results are in line with other population-based studies suggesting that these increases in service utilization may, at least in part, reflect increases in ascertainment and referral patterns. However, the sharp increases in depressive symptoms since 2008 for girls and more recently for boys are particularly concerning. While mean differences indicate an increase of about a quarter to a half of a point, we note that at the population level, this may translate to broader population health effects. Further, the results are consistent with other emerging evidence regarding recent increases in major depression and suicide among adolescents [3–5]; while depressive symptoms are not a clinical disorder and a distal antecedent from completed suicide, on the whole these results are consistent with emerging evidence that adolescents are experiencing deterioration in mental health.
The evaluation of symptom variation through age–period–cohort analysis revealed several insights that are not readily visible when examining means over time. For example, based on the age–period–cohort model, both boys and girls had a substantial increase in depressive symptoms beginning in 2012 regardless of age (i.e., a period effect); but boys had a concomitant decrease by cohort. This downward trend in cohort effects for boys suggests that the period increase in depressive symptoms affected older boys more than younger boys. In contrast, there is both a positive period effect without a concomitant cohort effect for girls, thus the visible increase in the trend in symptoms for the most recent period has affected all girls similarly regardless of age.
The increases in mental health problems in adolescence stand in contrast to trends in substance use in adolescence. Binge drinking among adolescents is at historic lows, across multiple national data sources [4, 40, 51]. While an epidemic of addiction and opioid overdose continues to plague adults in the US, heroin use in adolescence is lower than at any point in the last 20 years, and non-medical prescription opioid use has declined since 2009 [40, 52, 53]. Twenge and colleagues [54] suggested that delayed maturation (termed “slow life strategy”) [55, 56] for today’s adolescents compared with previous generations underlie a general lower level of activities associated with adulthood (e.g., getting a driver’s license, working for pay, dating) [54]. The connections between these population level trends and deteriorating mental health have not been fully explored, yet the overall landscape of adolescent lives seem to be shifting toward increased distress in ways that are important to understand for prevention efforts. However, it is important to note that social change is gradual, and began before the observation period of the cohorts in our data, thus any suggestion that these social changes are involved in current increases in depressive symptoms is premature and speculative. Nonetheless, given that we found the primacy of period effects over cohort effects, the causes of increased depressive symptoms are likely more endemic to US youth than cohort-specific. Comprehensive efforts to test hypotheses that integrate explanatory mechanisms are needed.
The period effect indicates that depressive symptoms have been increasing across all cohorts in school from 2012 onward, peaking in 2018, especially among girls. While we do not have data on the reasons underlying these period effects, several possible hypotheses can be speculated. Heavy smart phone and social media use among adolescents are associated with worse mental health [21–23, 57], although the most reliable data indicate that smart phone use has both positive and negative effects on mental health, and modest ones at that [58, 59]. Online bullying is increasing in the US [60], and recent studies demonstrate an association between online bullying and harassment with anxiety and depressive symptoms and suicidal ideation in adolescents [29, 61, 62], especially girls. Average hours of adolescent sleep per night have been declining over the past two decades [25], and sleep disturbance is correlated with (indeed it is a symptom of) depression [63]. Regarding cohort effects, the Great Recession hit hard when the most recent MTF cohorts were young children [64], and there is evidence that severe economic downturns are more challenging for younger than older children [65]. Biological hypotheses are also possible, including the strong cohort effects in age of menarche [66], a transition marked with increases in depression symptomatology. Such hypotheses are especially salient, however, given that the depressive symptom period effects are greater among girls compared to boys at this point.
Limitations of the study are noted. The MTF survey includes four questions capturing aspects of depressive symptoms, but these four items are not clinical measures and they are based on self-report. While question wording is invariant across time, we cannot rule out trends in student comfort in revealing depressive symptoms or acknowledging their experiences of depression as potentially contributing, at least in part, to observed increases. Students are instructed that responses will remain confidential; further, the Monitoring the Future study has many questions that are sensitive in nature and we have found no evidence of systematic trends that would be consistent with changing willingness to be candid [40]. We include only two symptoms of depression in the present report, namely feelings of worthlessness and recurrent thoughts of death; we do not have diagnostic algorithms for major depressive episodes, and we do not have information on whether adolescents have utilized services for depressive symptoms. However, our results are consistent with other national sources with information on depressive episodes and suicide-related behavior [3, 6], underscoring that the results that we present here are meaningful indicators of adolescent mental health. Further, it remains a minority of individuals with depression or any mental health problem who access treatment services [67], suggesting that treatment utilization is unlikely to have a large impact on population mean symptoms. Further, an advantage of our measure of depressive symptoms is the identical wording and placement of questions across 28 years of data collection, as well as large sample size. Another noteworthy limitation given our emphasis on APC analyses is that MTF is designed to sample and thus represent 8th, 10th, and 12th graders rather than the full age range of 13–18 year. Modal ages for 8th, 10th, and 12th grade are 14, 16, and 18 years, respectively. Thus, our samples of those at other ages years may be less representative, and results of the APC models may not generalize to the full age range of adolescence (APC models that theoretically include a broader range of ages may have different cohort and period trends). Finally, the Monitoring the Future study excludes those who have dropped out of high school. This should have minimal effect on the data from ages 13–16 years, and likely modest effect on those aged 17–18 years given that the majority of adolescents at this age remain in school [40].
In summary, 28-year trends through 2018 in depressive symptoms in adolescence suggest recent increases for both boys and girls, with particularly strong increases for girls in the most recent birth cohorts. There is no evidence of this historical trend subsiding, with depressive symptoms peaking for both girls and boys in 2018. Depression remains among the largest contributors to the global burden of disease, and onset is most likely to occur in adolescence [68]. A continued focus on understanding population-level trends and determinants of these outcomes is critical to achieving public mental health success.
Supplementary Material
Acknowledgements
Monitoring the Future study is funded by National Institute on Drug Abuse Grant R01001411.
Footnotes
Electronic supplementary material The online version of this article (https://doi.org/10.1007/s00127-019-01697-8) contains supplementary material, which is available to authorized users.
Conflict of interest The authors report no conflicts of interest and have no financial relationships with commercial interests.
References
- 1.Angold A (1988) Childhood and adolescent depression: I. Epidemiological and aetiological aspects. Br J Psychiatry 152:601–617 [DOI] [PubMed] [Google Scholar]
- 2.Costello EJ, Erkanli A, Angold A (2006) Is there an epidemic of child or adolescent depression? J Child Psychol Psychiatry 47(12):1263–1271 [DOI] [PubMed] [Google Scholar]
- 3.Mojtabai R, Olfson M, Han B (2016) National trends in the prevalence and treatment of depression in adolescents and young adults. Pediatrics. 10.1542/peds.2016-1878 [DOI] [PMC free article] [PubMed] [Google Scholar]
- 4.Substance Abuse and Mental Health Services Administration (2017) Key substance use and mental health indicators in the United States: Results from the 2016 National Survey on Drug Use and Health Rockville, MD: Cent Behav Heal Stat Qual Subst Abus Ment Heal Serv Adm. https://www.samhsa.gov/data/sites/default/files/NSDUH-FFR1-2016/NSDUH-FFR1-2016.htm. Accessed 23 Mar 2019 [Google Scholar]
- 5.Curtin SC, Warner M, Hedegaard H (2016) Increases in suicide in the United States, 1999–2014 NCHS data brief, no 241. National Center for Health Statistics, Hyattsville, MD: [PubMed] [Google Scholar]
- 6.CDC (2016) Trends in the prevalence of suicide–related behavior national YRBS: 1991–2015. https://www.cdc.gov/healthyyouth/data/yrbs/pdf/trends/2015_us_suicide_trend_yrbs.pdf. Accessed 23 Mar 2019
- 7.Cloninger CR (2012) Healthy personality development and well-being. World Psychiatry 11(2):103–104 [DOI] [PMC free article] [PubMed] [Google Scholar]
- 8.Olfson M, Marcus SC (2009) National patterns in antidepressant medication treatment. Arch Gen Psychiatry 66(8):848 10.1001/archgenpsychiatry.2009.81 [DOI] [PubMed] [Google Scholar]
- 9.Marcus SC, Olfson M (2010) National trends in the treatment for depression from 1998 to 2007. Arch Gen Psychiatry 67(12):1265–1273. 10.1001/archgenpsychiatry.2010.151 [DOI] [PubMed] [Google Scholar]
- 10.Olfson M, Marcus SC, Druss B, Elinson L, Tanielian T, Pincus HA (2002) National trends in the outpatient treatment of depression. JAMA 287(2):203–209 [DOI] [PubMed] [Google Scholar]
- 11.Lewinsohn PM, Rohde P, Seeley JR, Fischer SA (1993) Age-cohort changes in the lifetime occurrence of depression and other mental disorders. J Abnorm Psychol Abnorm Psychol 102(1):110–120. 10.1037/0021-843x.102.1.110 [DOI] [PubMed] [Google Scholar]
- 12.Kessler RC, Berglund P, Demler O et al. (2003) The epidemiology of major depressive disorder: results from the National Comorbidity Survey Replication (NCS-R). JAMA 289(23):3095–3105. 10.1001/jama.289.23.3095 [DOI] [PubMed] [Google Scholar]
- 13.Klerman GL, Lavori PW, Rice J et al. (1985) Birth-cohort trends in rates of major depressive disorder among relatives of patients with affective disorder. Arch Gen Psychiatry 42(7):689–693. 10.1001/archpsyc.1985.01790300057007 [DOI] [PubMed] [Google Scholar]
- 14.Klerman GL (1989) Increasing rates of depression. JAMA 261(15):2229 10.1001/jama.1989.03420150079041 [DOI] [PubMed] [Google Scholar]
- 15.Eaton WW, Kalaydjian A, Scharfstein DO, Mezuk B, Ding Y (2007) Prevalence and incidence of depressive disorder: the Baltimore ECA follow-up, 1981–2004. Acta Psychiatr Scand 116(3):182–188. 10.1111/j.1600-0447.2007.01017.x [DOI] [PMC free article] [PubMed] [Google Scholar]
- 16.Murphy JM, Laird NM, Monson RR, Sobol AM, Leighton AH (2000) Incidence of depression in the Stirling County Study: historical and comparative perspectives. Psychol Med 30(3):505–514. 10.1017/s0033291799002044 [DOI] [PubMed] [Google Scholar]
- 17.Keyes KM, Nicholson R, Kinley J et al. Age, period, and cohort effects in psychological distress in the United States and Canada. Am J Epidemiol. 2014. 10.1093/aje/kwu029 [DOI] [PMC free article] [PubMed] [Google Scholar]
- 18.Murphy JM, Laird NM, Monson RR, Sobol AM, Leighton AH (2000) A 40-year perspective on the prevalence of depression: the Stirling County Study. Arch Gen Psychiatry 57(3):209–215. 10.1001/archpsyc.57.3.209 [DOI] [PubMed] [Google Scholar]
- 19.Simpson KR, Meadows GN, Frances AJ, Patten SB (2012) Is mental health in the Canadian population changing over time? Can J Psychiatry 57(5):324–331. 10.1177/070674371205700508 [DOI] [PubMed] [Google Scholar]
- 20.Polanczyk GV, Salum GA, Sugaya LS, Caye A, Rohde LA (2015) Annual research review: a meta-analysis of the worldwide prevalence of mental disorders in children and adolescents. J Child Psychol Psychiatry Allied Discip. 10.1111/jcpp.12381 [DOI] [PubMed] [Google Scholar]
- 21.Levenson JC, Shensa A, Sidani JE, Colditz JB, Primack BA (2016) The association between social media use and sleep disturbance among young adults. Prev Med (Baltim) 85:36–41. 10.1016/j.ypmed.2016.01.001 [DOI] [PMC free article] [PubMed] [Google Scholar]
- 22.Rosenthal SR, Buka SL, Marshall BDL, Carey KB, Clark MA (2016) Negative experiences on facebook and depressive symptoms among young adults. J Adolesc Heal 59(5):510–516. 10.1016/j.jadohealth.2016.06.023 [DOI] [PubMed] [Google Scholar]
- 23.Shensa A, Escobar-Viera CG, Sidani JE, Bowman ND, Marshal MP, Primack BA (2017) Problematic social media use and depressive symptoms among US young adults: a nationally-representative study. Soc Sci Med 182:150–157. 10.1016/j.socscimed.2017.03.061 [DOI] [PMC free article] [PubMed] [Google Scholar]
- 24.Twenge JM, Joiner TE, Rogers ML, Martin GN. Increases in depressive symptoms, suicide-related outcomes, and suicide rates among US adolescents after 2010 and links to increased new media screen time. Clin Psychol Sci. 2017. 10.1177/2167702617723376 [DOI] [Google Scholar]
- 25.Keyes KM, Maslowsky J, Hamilton A, Schulenberg J. The great sleep recession: changes in sleep duration among US adolescents, 1991–2012. Pediatrics. 2015. 10.1542/peds.2014-2707 [DOI] [PMC free article] [PubMed] [Google Scholar]
- 26.Robinson WR, Utz RL, Keyes KM, Martin CL, Yang Y. Birth cohort effects on abdominal obesity in the United States: the silent generation, baby boomers and generation X. Int J Obes. 2013. 10.1038/ijo.2012.198 [DOI] [PMC free article] [PubMed] [Google Scholar]
- 27.Messias E, Kindrick K, Castro J (2014) School bullying, cyberbullying, or both: correlates of teen suicidality in the 2011 CDC youth risk behavior survey. Compr Psychiatry 55(5):1063–1068. 10.1016/j.comppsych.2014.02.005 [DOI] [PMC free article] [PubMed] [Google Scholar]
- 28.Holfeld B, Sukhawathanakul P (2017) Associations between internet attachment, cyber victimization, and internalizing symptoms among adolescents. Cyberpsychol Behav Soc Netw 20(2):91–96. 10.1089/cyber.2016.0194 [DOI] [PubMed] [Google Scholar]
- 29.Patchin JW, Hinduja S (2017) Digital self-harm among adolescents. J Adolesc Health 61(6):761–766. 10.1016/j.jadohealth.2017.06.012 [DOI] [PubMed] [Google Scholar]
- 30.Bottino SMB, Bottino CMC, Regina CG, Correia AVL, Ribeiro WS (2015) Cyberbullying and adolescent mental health: systematic review. Cad Saude Publica 31(3):463–475. 10.1590/0102-311x00036114 [DOI] [PubMed] [Google Scholar]
- 31.Holt MK, Vivolo-Kantor AM, Polanin JR et al. (2015) Bullying and suicidal ideation and behaviors: a meta-analysis. Pediatrics 135(2):e496–e509. 10.1542/peds.2014-1864 [DOI] [PMC free article] [PubMed] [Google Scholar]
- 32.Miech RA, Johnston LD, O’Malley PM, Bachman JG, Schulenberg JE, Patrick ME (2018) Monitoring the future national survey results on drug use, 1975–2017: volume I, secondary school students The University of MichiganInstitute for Social Research, Ann Arbor, MI: http://monitoringthefuture.org/pubs.html#monographs Accessed 6 Aug 2018 [Google Scholar]
- 33.Keyes KM, Jager J, Hamilton A, O’Malley PM, Miech R, Schulenberg JE (2015) National multi-cohort time trends in adolescent risk preference and the relation with substance use and problem behavior from 1976 to 2011. Drug Alcohol Depend 10.1016/j.drugalcdep.2015.06.031 [DOI] [PMC free article] [PubMed] [Google Scholar]
- 34.Keyes KM, Utz RL, Robinson W, Li G (2010) What is a cohort effect? Comparison of three statistical methods for modeling cohort effects in obesity prevalence in the United States, 1971–2006. Soc Sci Med. 10.1016/j.socscimed.2009.12.018 [DOI] [PMC free article] [PubMed] [Google Scholar]
- 35.Reither ENEN, Land KCKC, Jeon SYSY et al. (2015) Clarifying hierarchical age-period-cohort models: a rejoinder to bell and jones. Soc Sci Med 145:125–128. 10.1016/j.socscimed.2015.07.013 [DOI] [PMC free article] [PubMed] [Google Scholar]
- 36.Yang Y, Land K (2013) Age-period-cohort analysis: new models, methods, and empirical applications. Chapman & Hall/CRC, Boca Raton [Google Scholar]
- 37.Merikangas KR, He JP, Burstein M et al. (2010) Lifetime prevalence of mental disorders in US adolescents: results from the National Comorbidity Survey Replication–Adolescent Supplement (NCS-A). J Am Acad Child Adolesc Psychiatry 49(10):980–989. 10.1016/j.jaac.2010.05.017 [DOI] [PMC free article] [PubMed] [Google Scholar]
- 38.Cantwell DP, Baker L (1991) Manifestations of depressive affect in adolescence. J Youth Adolesc 20(2):121–133 [DOI] [PubMed] [Google Scholar]
- 39.Dohrenwend BP, Shrout PE, Egri G, Mendelsohn FS (1980) Non-specific psychological distress and other dimensions of psycho-pathology: measures for use in the general population. Arch Gen Psychiatry 10.1001/archpsyc.1980.01780240027003 [DOI] [PubMed] [Google Scholar]
- 40.Miech R, Johnston LD, O’Malley PM, Bachman JG, Schulenberg J (2016) Monitoring the future national survey results on drug use, 1975–2015, secondary school students. Ann Arbor Inst Soc Res Univ Michigan 1:636 [Google Scholar]
- 41.Bachman JG, Johnston LD, O’Malley PM, Schulenberg J, Miech R (2015) The monitoring the future project after four decades: design and procedures. Institute for Social Research, University of Michigan, Ann Arbor, MI [Google Scholar]
- 42.Maslowsky J, Schulenberg JE, O’Malley PM, Kloska DD (2013) Depressive symptoms, conduct problems, and risk for polysubstance use among adolescents: results from US national surveys. Ment Heal Subst Use 7(2):157–169. 10.1080/17523281.2013.786750 [DOI] [PMC free article] [PubMed] [Google Scholar]
- 43.Maslowsky J, Schulenberg JE, Zucker RA (2014) Influence of conduct problems and depressive symptomatology on adolescent substance use: developmentally proximal versus distal effects. Dev Psychol 50(4):1179–1189. 10.1037/a0035085 [DOI] [PMC free article] [PubMed] [Google Scholar]
- 44.Merline A, Jager J, Schulenberg JE (2008) Adolescent risk factors for adult alcohol use and abuse: stability and change of predictive value across early and middle adulthood. Addiction 103:84–99. 10.1111/j.1360-0443.2008.02178.x [DOI] [PMC free article] [PubMed] [Google Scholar]
- 45.Schulenberg J, Zarrett N (2006) Mental health during emerging adulthood: continuity and discontinuity in courses, causes, and functions In: Arnett JJ, Tanner JL (eds) Emerging adults in America: coming of age in the 21st century. American Psychological Association, Washington, pp 135–172 [Google Scholar]
- 46.American Psychiatric Association (2013) Diagnostic and statistical manual of mental disorders: DSM-5. American Psychiatric Association. 10.1176/appi.books.9780890425596.744053 [DOI] [Google Scholar]
- 47.Radloff LS. The CES-D, Scale (1977) A self-report depression scale for research in the general population. Appl Psychol Meas. 10.1177/014662167700100306 [DOI] [Google Scholar]
- 48.Yang Y, Land K (2013) Mixed effects models: hierarchical APC-cross-classified random effects models (HAPC-CCREM), Part II: Advanced analyses In: Yang Y, Land K (eds) Age-period-cohort analysis: new models, methods and empirical applications. Chapman & Hall/CRC Interdisciplinary Statistics, Boca Raton, pp 231–284 [Google Scholar]
- 49.Yang Y, Land KC (2006) A mixed models approach to age-period-cohort analysis of repeated cross-section surveys: trends in verbal test scores In: Stolzenberg RM (ed) Sociological methodology, vol 36 Blackwell Publishing, Boston [Google Scholar]
- 50.Olfson M, Druss BG, Marcus SC (2015) Trends in mental health care among children and adolescents. N Engl J Med 372(21):2029–2038. 10.1056/NEJMsa1413512 [DOI] [PubMed] [Google Scholar]
- 51.CDC (2016) Trends in the prevalence of alcohol use national YRBS: 1991–2015. https://www.cdc.gov/healthyyouth/data/yrbs/pdf/trends/2015_us_alcohol_trend_yrbs.pdf. Accessed 5 Oct 2017 [Google Scholar]
- 52.CDC (2016) Trends in the prevalence of marijuana, cocaine, and other illegal drug use national YRBS: 1991–2015. https://www.cdc.gov/healthyyouth/data/yrbs/pdf/trends/2015_us_drug_trend_yrbs.pdf. Accessed 6 Oct 2017 [Google Scholar]
- 53.Martins SS, Segura LE, Santaella-Tenorio J et al. (2017) Prescription opioid use disorder and heroin use among 12–34 year-olds in the United States from 2002 to 2014 . Addict Behav. 10.1016/j.addbeh.2016.08.033 [DOI] [PMC free article] [PubMed] [Google Scholar]
- 54.Twenge JM, Park H (2017) The decline in adult activities among US adolescents, 1976–2016. Child Dev. 10.1111/cdev.12930 [DOI] [PubMed] [Google Scholar]
- 55.Figueredo A, Vasquez G, Brumbach BH et al. (2006) Consilience and life history theory: from genes to brain to reproductive strategy. Dev Rev 26(2):243–275 [Google Scholar]
- 56.Mittal C, Griskevicius V (2014) Sense of control under uncertainty depends on people’s childhood environment: a life history theory approach. J Pers Soc Psychol 107(4):621–637. 10.1037/a0037398 [DOI] [PubMed] [Google Scholar]
- 57.Twenge JM (2017) Have smartphones destroyed a generation? The Atlantic. https://www.theatlantic.com/magazine/archive/2017/09/has-the-smartphone-destroyed-a-generation/534198/. Accessed 23 Mar 2019 [Google Scholar]
- 58.Przybylski AK, Weinstein N (2017) A large-scale test of the goldi-locks hypothesis: quantifying the relations between digital-screen use and the mental well-being of adolescents. Psychol Sci. 10.1177/0956797616678438 [DOI] [Google Scholar]
- 59.Odgers C (2018) Smartphones are bad for some teens, not all. Nature. 10.1038/d41586-018-02109-8 [DOI] [PubMed] [Google Scholar]
- 60.Kessel Schneider S, O’Donnell L, Smith E (2015) Trends in cyberbullying and school bullying victimization in a regional census of high school students, 2006–2012. J Sch Health 85(9):611–620. 10.1111/josh.12290 [DOI] [PubMed] [Google Scholar]
- 61.Bauman S, Toomey RB, Walker JL (2013) Associations among bullying, cyberbullying, and suicide in high school students. J Adolesc 36(2):341–350. 10.1016/j.adolescence.2012.12.001 [DOI] [PubMed] [Google Scholar]
- 62.Bonanno RA, Hymel S (2013) Cyber bullying and internalizing difficulties: above and beyond the impact of traditional forms of bullying. J Youth Adolesc 42(5):685–697. 10.1007/s10964-013-9937-1 [DOI] [PubMed] [Google Scholar]
- 63.Tsuno N, Besset A, Ritchie K (2005) Sleep and depression. J Clin Psychiatry 66(10):1254–1269. 10.4088/JCP.v66n1008 [DOI] [PubMed] [Google Scholar]
- 64.Johnson MK, Staff J, Patrick ME, Schulenberg JE (2017) Adolescent adaptation before, during and in the aftermath of the Great Recession in the USA. Int J Psychol 52(1):9–18. 10.1002/ijop.12389 [DOI] [PMC free article] [PubMed] [Google Scholar]
- 65.Elder GH (1999) Children of the great depression: social change in life experience. Westview, Boulder [Google Scholar]
- 66.Krieger N, Kiang MV, Kosheleva A, Waterman PD, Chen JT, Beckfield J (2015) Age at menarche: 50-year socioeconomic trends among US-born black and white women. Am J Public Heal 105(2):388–397. 10.2105/AJPH.2014.301936 [DOI] [PMC free article] [PubMed] [Google Scholar]
- 67.Hasin DS, Goodwin RD, Stinson FS, Grant BF (2005) Epidemiology of major depressive disorder: results from the National Epidemiologic Survey on Alcoholism and Related Conditions. Arch Gen Psychiatry 62(10):1097–1106. 10.1001/archpsyc.62.10.1097 [DOI] [PubMed] [Google Scholar]
- 68.WHO (2008) The global burden of disease: 2004 update, Table A2: burden of disease in DALYs by cause, sex and income group in WHO regions, estimates for 2004. The World Health Organization, Geneva: http://www.who.int/healthinfo/global_burden_disease/GBD_report_2004update_AnnexA.pdf. Accessed 23 Mar 2019 [Google Scholar]
Associated Data
This section collects any data citations, data availability statements, or supplementary materials included in this article.