

Abstract
Many plant and animal species are changing their latitudinal and/or altitudinal distributions in response to climate change, but whether fungi show similar changes is largely unknown. Here, we use historical fungal fruit body records from the European Alps to assess altitudinal changes in fungal fruiting between 1960 and 2010. We observe that many fungal species are fruiting at significantly higher elevations in 2010 compared to 1960, and especially so among soil-dwelling fungi. Wood-decay fungi, being dependent on the presence of one or a few host trees, show a slower response. Species growing at higher elevations changed their altitudinal fruiting patterns significantly more than lowland species. Environmental changes in high altitudes may lead to proportionally stronger responses, since high-altitude species live closer to their physiological limit. These aboveground changes in fruiting patterns probably mirror corresponding shifts in belowground fungal communities, suggesting parallel shifts in important ecosystem functions.
Keywords: fungi, distributional shifts, global warming, fungal fruiting, altitudinal gradient, ecological response
1. Introduction
Ongoing climate change affects the functioning, productivity and distribution of organisms [1–3]. Many species' ranges have shifted polewards and upwards in altitude as a response to warmer climates [4,5], as documented for birds [6], plants [7–11], mammals [12,13] and insects [14,15]. However, other factors like drought [16] and land-use/land-cover changes [17,18] may also cause shifts in altitudinal distributions, and their relative contributions can be difficult to tease apart from climate change [19]. Species with different traits, ecologies and distributions may show different responses [9]. For example, species with shorter life cycles and better dispersal ability may show quicker responses to environmental change [9,20]. It has also been shown that plant species with high altitudinal distributions respond more strongly to climate changes than species from lowland communities [9]. The resulting redistribution of species around the globe is an urgent but challenging management concern [21].
In terrestrial ecosystems, fungi play pivotal roles as decomposers and recyclers of organic matter and mycorrhizal symbionts with plant roots. While the activity of saprotrophic fungi reduces soil organic material and releases CO2 into the atmosphere, the activity of mycorrhizal fungi may have an opposite effect, leading to enhanced carbon sequestration [22]. Different responses by these two functional guilds to climate change could, therefore, have important, though opposing, consequences for ecosystem processes, including carbon sequestration and nutrient cycling. As for plants, soil fungal communities show marked turnover in species composition along altitudinal gradients, as revealed by DNA-analyses of belowground fungal communities [23–25]. However, no one has investigated, to our knowledge, whether fungi are changing their altitudinal ranges [26]. Since historical substrate samples are not widely available, it is unfortunately not possible to analyse past distributional changes for fungi using DNA-based approaches in their microbial stage (i.e. belowground or within substrates).
Here, we take advantage of two national datasets of fungal fruit body records from Switzerland and Austria, to explore altitudinal distributions in mushroom occurrence between 1960 and 2010. We hypothesize that fungi, like many other organismal groups, show signs of warming-induced, upward altitudinal shifts over time (hypothesis H1). As shown for plants [9], distributional shifts for fungi may also be trait-specific and we hypothesize that ectomycorrhizal (EcM) fungi show slower responses than the more free-living saprotrophic fungi (H2). Saprotrophic species can be divided into litter and soil versus wood-inhabiting fungi, where we expect the latter group to likewise be more constrained by substrate presence (i.e. dead wood of specific plants) and show a slower response compared to litter and soil saprotrophs (H3). Furthermore, since fungi residing and fruiting at higher altitudes may be closer to their fundamental physiological limit, we hypothesize that species residing at higher altitudes will respond more strongly than species with lower distributions (H4), consistent with patterns seen for some plants.
2. Material and methods
(a). Data
The high number and wide altitudinal range of fungal records from Austria and Switzerland allowed us to study temporal changes in fruiting patterns along an elevational gradient from 114 to 2599 masl (see maps and further data description in electronic supplementary material). The national fungal record databases of Austria and Switzerland consist of collections from a variety of sources, including professional mycologists and herbarium data, as well as amateur but verified collections. The identity of the collector for each record is not known, preventing any statistical accounting for collector effects. We analysed altitudinal changes in fruiting patterns of 5606 fungal observations from the 118 most intensively collected species from the Austrian and Suisse national datasets between 1960 and 2010 CE. We restricted our analyses to Agaricomycetes (i.e. to basidiomycete species producing annual or perennial macroscopic fruit bodies). Only observations with proper annotation of date and geographical coordinates were included. We further split the data into ectomycorrhizal (EcM) species (56 species) and saprotrophic (31 wood-decaying species and 31 litter and soil species), with each species being recorded more than 904 times (electronic supplementary material, table S1). The annotation of nutritional modes, based on information from the FunGuild database [27] as well as literature, is shown in electronic supplementary material, table S1. There was an overall increase in the number of fungal records during the period 1960–2010 (electronic supplementary material, figure S6.1), which may influence the results (see discussion below and in electronic supplementary material).
(b). Statistical analysis
We used linear mixed-effects models (LMM) to quantify how the fruiting elevation of individual fungal species and nutritional modes vary over time and depending on species life-history characteristics. Two primary models were used: (i) an LMM with a random effect for species, and temporal trends conditional on nutritional modes (EcM, litter/soil decomposers, and wood decomposers); and (ii) an LMM with species-specific temporal trends and species level random intercepts. The response variable in each model was the mean altitude of mushroom fruiting for each species in each year, and the predictor variable was year of collection. We chose to model changes in the mean altitude of species because it is likely to be less sensitive to outliers arising from inconsistent sampling effort, and core distributional shifts have been found to correlate with other aspects such as leading edges [26]. All models were fitted in a Bayesian framework using the brms package [28] in R [29], which uses Stan software [30] for parameter estimation. To quantify the significance of the trends over time, the probability that the posterior distribution of each regression coefficient overlapped zero was calculated. Model code and further explanation is given in the appendix and on github (https://diezj.github.io/fungi-altitude/).
3. Results and discussion
When considering all 118 species together, as well as partitioned into EcM and saprotrophic species, we observed trends towards upward shifts in mean altitude of fruiting during the period 1960–2010 (figure 1). These trends averaged 2.2 m yr−1 for EcM species and litter/soil saprotrophs, and 0.66 m for wood decomposers. When analysed for species-specific responses, many individual species also showed significant trends towards increased elevation of fruiting over time (figure 2). Hence, in support of our first hypothesis (H1), many fungi, like other organismal groups [5], show signs of an increased altitudinal distribution, which might be associated with recent warming. From the late nineteenth century until the end of the twentieth century, temperatures in the Alps have risen at a rate about twice the Northern Hemispheric mean, amounting to a total annual mean temperature increase of about 2°C [28–30]. Precipitation changes, however, vary across regions, periods and season [31]. However, there have also been significant changes in land use and land cover across the Alps during the last century, which could also have contributed to the observed changes. Alpine farming and forest pasturing were, for centuries, depressing the upper tree line, but since the mid-twentieth century, alpine farming has declined considerably [17]. In parallel, the forest area has increased, especially on abandoned agricultural land.
Figure 1.
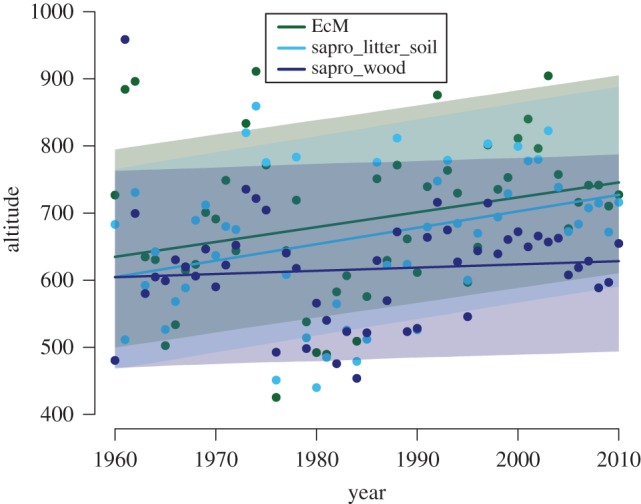
Overall trends in mean altitude of mushroom collections over time for ectomycorrhizal species (EcM, green points), saprotrophic litter and soil species (light blue points), and saprotrophic wood-inhabiting species (dark blue points). There were significant trends over time for all groups. (Online version in colour.)
Figure 2.

Species-specific trends over time in the mean altitude of fruiting, where species are grouped according to their nutritional modes/ecology. Means and 95% credible intervals are shown; species to the right of the zero-line tended to be collected at higher elevations over the period 1960–2010 CE. (Online version in colour.)
Since EcM fungi are closely associated with plants and likely constrained by their host plant distributions, we assumed that EcM fungi might have a slower upward shift compared with the more free-living saprotrophic fungi (H2). In contrast to this expectation, EcM fungi and litter and soil saprotrophs showed rather similar responses (figure 2). Out of 56 EcM species, 47 species increased in altitude over time (26 of these significantly so; p < 0.05). Likewise, most litter and soil saprotrophs also increased in altitude over time (26 out of 31; 16 being statistically significant). However, out of the 31 wood-decomposer species, many of which have long-lasting annual or perennial fruit bodies (26), only 19 showed a positive slope (7 being significant). Hence, wood-decomposer fungi, and especially those forming longer-lasting fruit bodies, showed slower or negative response, in support of our hypothesis H3. Many wood-decomposers are host-specific or bound to a few plant species, which could partly explain their more restricted responses in upward movement.
We also wanted to assess whether species residing at higher altitudes show stronger responses compared to species with lower elevation distributions (H4). In support of this, species with higher altitudinal distributions show stronger upward shifts (figure 3a). Likewise, species with broader altitudinal ranges also had larger upward shifts in altitudinal fruiting patterns (figure 3b). Again, we observed similar trends for EcM and saprotrophic fungi for these relationships. The distribution of high-altitude species may be close to their physiological limit and they may therefore respond strongly under environmental change. Species residing at higher altitudes may also be better adapted to temperature stress and frost compared to low altitude species experiencing more stable conditions. Due to their putative higher stress tolerance, high-altitude species may be more responsive to environmental change. A similar trend has been observed for plants [18], where warmth-demanding plants did not move upward more frequently than expected by chance, while snow-bed species have become more common on summits. In support of the generality of this trend, it has been observed that plant species having a mountainous distribution shifted more drastically in altitudinal distribution compared with plants with more ubiquitous distributions [9], and lowland species experience a greater ‘lag' in responses due to higher climate velocity in less topographically steep terrain [32,33]. However, the stronger shift in fruiting patterns of high-altitude fungi could also simply be due to an anomalous warming at higher elevations for the Alps [34], and not because of differences in intrinsic species traits.
Figure 3.

Species-specific relationships between the altitudinal trend over time (y-axes) and species' (a) mean altitude of fruiting and (b) their altitudinal range. The trends over time (y-axes) are the slopes of regression models relating mean altitude to year, between 1960 and 2010. This shows how much the species are moving up or down in altitude on average (moving up if slope is greater than 0 and down if slope <0). (Online version in colour.)
Assessing range shifts based on historical observations is complicated by the potential for sampling biases [35,36]. In this dataset, there has been a large increase in the number of records of most of the 118 species during the period 1960–2010 (electronic supplementary material, figure S6.1), and if the sampling effort has systematically moved upwards during the same period, this may help explain the observed patterns. However, we observed no significant relationship between the number of observations of a species and its estimated trend of change (slope) over time (electronic supplementary material, §6.1), indicating that intensity of sampling per se did not appear to affect the estimated trends. Additionally, if changes in altitudinal sampling behaviour is a strong driver for the observed patterns, one might expect rather uniform responses across species, which was not the case; although most species show an increase in mean fruiting elevation, some species show an opposite pattern. The observed variation in species-specific responses corresponds well with what have been observed earlier in fungal phenology studies [37], and underlines that analysis on a community level (figure 1) can mask highly variable species-specific responses (figure 2). Furthermore, the proportion of collections that were made above the mean elevation did not increase over time, suggesting no systematic bias toward higher elevation collections over time (electronic supplementary material, §6.2). Finally, a null model, in which year of collection was randomized within species collections, suggested that the observed altitudinal trend over time is not the result of biased sampling (figure 4).
Figure 4.

Results from a null model suggesting that the observed significant trend in altitude through time is not spurious due to the increased sampling over time. We randomized 1000 times the years of collections while maintaining the skewed sampling intensity through time for each species, and ran mixed-effects models with species random effects and a fixed effect of year. (a) Distribution of slopes estimated from null models, along with true slope (blue). (b) In green are model runs with p < 0.05. Blue lines represent the values calculated on the raw dataset (in b, p < 0.001). (Online version in colour.)
Notably, fungal fruit body collections are presence-only data and represent only a small, though important, part of the fungal life cycle connected to sexual reproduction. However, we expect that patterns observed using large datasets of fruit body records stretching over longer periods in time also reflect parallel changes in belowground activity and distributions, since these fungi complete their life cycle and establish by spores spreading from the fruit bodies. DNA-based analysis is now a critical tool in fungal ecology for directly analysing belowground communities [38], but since soil samples have not been collected and preserved over similar time periods, historical fruit body observations are currently the only way to assess long-term altitudinal changes in fungal fruiting.
Supplementary Material
Acknowledgements
We acknowledge John-Arvid Grytnes for comments on an earlier draft, and the constructive comments from Jonathan Lenoir, the editor and an anonymous reviewer.
Data accessibility
The analysed data are available at the Dryad Digital Repository: https://doi.org/10.6086/D1TQ14 [39].
Authors' contributions
J.D., H.K., C.A., E.H. and U.B. developed the ideas for the study, J.D. and C.A. processed and analysed the data, I.K.-G., S.E., B.S.-I. and K.H. provided the data, C.A., U.B. and H.K. secured funding, H.K and J.D. drafted the manuscript and all authors revised and commented.
Competing interests
We declare to have no competing interests.
Funding
We acknowledge the original data providers to the two national fungal databases, the Research council of Norway (grant no. ES500181) and the Swiss National Science Foundation (grant project ‘Linking European Fungal Ecology with Climate Variability') for funding.
References
- 1.Parmesan C. 2006. Ecological and evolutionary responses to recent climate change. Annu. Rev. Ecol. Evol. System. 37, 637–669. ( 10.1146/annurev.ecolsys.37.091305.110100) [DOI] [Google Scholar]
- 2.Pecl GT, et al. 2017. Biodiversity redistribution under climate change: impacts on ecosystems and human well-being. Science 355, eaai9214 ( 10.1126/science.aai9214) [DOI] [PubMed] [Google Scholar]
- 3.Walther GR, Beissner S, Burga CA. 2005. Trends in the upward shift of alpine plants. J. Veg. Sci. 16, 541–548. ( 10.1111/j.1654-1103.2005.tb02394.x) [DOI] [Google Scholar]
- 4.Chen IC, Hill JK, Ohlemuller R, Roy DB, Thomas CD. 2011. Rapid range shifts of species associated with high levels of climate warming. Science 333, 1024–1026. ( 10.1126/science.1206432) [DOI] [PubMed] [Google Scholar]
- 5.Hickling R, Roy DB, Hill JK, Fox R, Thomas CD. 2006. The distributions of a wide range of taxonomic groups are expanding polewards. Global Change Biol. 12, 450–455. ( 10.1111/j.1365-2486.2006.01116.x) [DOI] [Google Scholar]
- 6.Hitch AT, Leberg PL. 2007. Breeding distributions of north American bird species moving north as a result of climate change. Conserv. Biol. 21, 534–539. ( 10.1111/j.1523-1739.2006.00609.x) [DOI] [PubMed] [Google Scholar]
- 7.Beckage B, Osborne B, Gavin DG, Pucko C, Siccama T, Perkins T. 2008. A rapid upward shift of a forest ecotone during 40 years of warming in the Green Mountains of Vermont. Proc. Natl Acad. Sci. USA 105, 4197–4202. ( 10.1073/pnas.0708921105) [DOI] [PMC free article] [PubMed] [Google Scholar]
- 8.Du HB, Liu J, Li MH, Buntgen U, Yang Y, Wang L, Wu Z, He HS. 2018. Warming-induced upward migration of the alpine treeline in the Changbai Mountains, northeast China. Global Change Biol. 24, 1256–1266. ( 10.1111/gcb.13963) [DOI] [PubMed] [Google Scholar]
- 9.Lenoir J, Gegout JC, Marquet PA, de Ruffray P, Brisse H. 2008. A significant upward shift in plant species optimum elevation during the 20th century. Science 320, 1768–1771. ( 10.1126/science.1156831) [DOI] [PubMed] [Google Scholar]
- 10.Rumpf SB, Hulber K, Klonner G, Moser D, Schutz M, Wessely J, Willner W, Zimmermann NE, Dullinger S. et al. 2018. Range dynamics of mountain plants decrease with elevation. Proc. Natl Acad. Sci. USA 115, 1848–1853. ( 10.1073/pnas.1713936115) [DOI] [PMC free article] [PubMed] [Google Scholar]
- 11.Pauli H, Gottfried M, Reiter K, Klettner C, Grabherr G. 2007. Signals of range expansions and contractions of vascular plants in the high Alps: observations (1994–2004) at the GLORIA master site Schrankogel, Tyrol, Austria. Global Change Biol. 13, 147–156. ( 10.1111/j.1365-2486.2006.01282.x) [DOI] [Google Scholar]
- 12.Buntgen U, Greuter L, Bollmann K, Jenny H, Liebhold A, Galván JD, Stenseth NC, Andrew C, Mysterud A. 2017. Elevational range shifts in four mountain ungulate species from the Swiss Alps. Ecosphere 8, e01761 ( 10.1002/ecs2.1761) [DOI] [Google Scholar]
- 13.Moritz C, Patton JL, Conroy CJ, Parra JL, White GC, Beissinger SR. 2008. Impact of a century of climate change on small-mammal communities in Yosemite National Park, USA. Science 322, 261–264. ( 10.1126/science.1163428) [DOI] [PubMed] [Google Scholar]
- 14.Johnson DM, Buntgen U, Frank DC, Kausrud K, Haynes KJ, Liebhold AM, Esper J, Stenseth NC. 2010. Climatic warming disrupts recurrent Alpine insect outbreaks. Proc. Natl Acad. Sci. USA 107, 20 576–20 581. ( 10.1073/pnas.1010270107) [DOI] [PMC free article] [PubMed] [Google Scholar]
- 15.Konvicka M, Maradova M, Benes J, Fric Z, Kepka P. 2003. Uphill shifts in distribution of butterflies in the Czech Republic: effects of changing climate detected on a regional scale. Global Ecol. Biogeogr. 12, 403–410. ( 10.1046/j.1466-822X.2003.00053.x) [DOI] [Google Scholar]
- 16.Crimmins SM, Dobrowski SZ, Greenberg JA, Abatzoglou JT, Mynsberge AR. 2011. Changes in climatic water balance drive downhill shifts in plant species' optimum elevations. Science 331, 324–327. ( 10.1126/science.1199040) [DOI] [PubMed] [Google Scholar]
- 17.Gehrig-Fasel J, Guisan A, Zimmermann NE. 2007. Tree line shifts in the Swiss Alps: climate change or land abandonment? J. Veg. Sci. 18, 571–582. ( 10.1111/j.1654-1103.2007.tb02571.x) [DOI] [Google Scholar]
- 18.Grytnes JA, et al. 2014. Identifying the driving factors behind observed elevational range shifts on European mountains. Global Ecol. Biogeogr. 23, 876–884. ( 10.1111/geb.12170) [DOI] [Google Scholar]
- 19.Guo F, Lenoir J, Bonebrake TC. 2018. Land-use change interacts with climate to determine elevational species redistribution. Nat. Commun. 9, 1315 ( 10.1038/s41467-018-03786-9) [DOI] [PMC free article] [PubMed] [Google Scholar]
- 20.Urban MC, Tewksbury JJ, Sheldon KS. 2012. On a collision course: competition and dispersal differences create no-analogue communities and cause extinctions during climate change. Proc. R. Soc. B 279, 2072–2080. ( 10.1098/rspb.2011.2367) [DOI] [PMC free article] [PubMed] [Google Scholar]
- 21.Bonebrake TC, et al. 2018. Managing consequences of climate-driven species redistribution requires integration of ecology, conservation and social science. Biol Rev. 93, 284–305. ( 10.1111/brv.12344) [DOI] [PubMed] [Google Scholar]
- 22.Clemmensen KE, et al. 2013. Roots and associated fungi drive long-term carbon sequestration in boreal forest. Science 339, 1615–1618. ( 10.1126/science.1231923) [DOI] [PubMed] [Google Scholar]
- 23.Bahram M, Polme S, Koljalg U, Zarre S, Tedersoo L. 2012. Regional and local patterns of ectomycorrhizal fungal diversity and community structure along an altitudinal gradient in the Hyrcanian forests of northern Iran. New Phytol. 193, 465–473. ( 10.1111/j.1469-8137.2011.03927.x) [DOI] [PubMed] [Google Scholar]
- 24.Geml J, Pastor N, Fernandez L, Pacheco S, Semenova TA, Becerra AG, Wicaksono CY, Nouhra ER. 2014. Large-scale fungal diversity assessment in the Andean Yungas forests reveals strong community turnover among forest types along an altitudinal gradient. Mol. Ecol. 23, 2452–2472. ( 10.1111/mec.12765) [DOI] [PubMed] [Google Scholar]
- 25.Susan G, Woodward S, Taylor AFS. 2015. Strong altitudinal partitioning in the distributions of ectomycorrhizal fungi along a short (300 m) elevation gradient. New Phytol. 206, 1145–1155. ( 10.1111/nph.13315) [DOI] [PubMed] [Google Scholar]
- 26.Lenoir J, Svenning JC. 2015. Climate-related range shifts: a global multidimensional synthesis and new research directions. Ecography 38, 15–28. ( 10.1111/ecog.00967) [DOI] [Google Scholar]
- 27.Nguyen NH, Song ZW, Bates ST, Branco S, Tedersoo L, Menke J, Schilling JS, Kennedy PG. 2016. FUNGuild: an open annotation tool for parsing fungal community datasets by ecological guild. Fungal Ecol. 20, 241–248. ( 10.1016/j.funeco.2015.06.006) [DOI] [Google Scholar]
- 28.Bürkner PD. 2017. brms: an R package for Bayesian multilevel models using Stan. J. Stat. Softw. 80, 1–28. ( 10.18637/jss.v080.i01) [DOI] [Google Scholar]
- 29.R Core Team. 2019. R: a language and environment for statistical computing. Vienna, Austria: R Foundation for Statistical Computing; See https://www.R-project.org/ [Google Scholar]
- 30.Carpenter B, et al. 2017. Stan: a probabilistic programming language. J. Stat. Softw. 76, 1–32. ( 10.18637/jss.v076.i01) [DOI] [PMC free article] [PubMed] [Google Scholar]
- 31.Auer I, et al. 2007. HISTALP: historical instrumental climatological surface time series of the Greater Alpine Region. Int. J. Climatol. 27, 17–46. ( 10.1002/joc.1377) [DOI] [Google Scholar]
- 32.Bertrand R, Lenoir J, Piedallu C, Riofrío-Dillon G, de Ruffray P, Vidal C, Pierrat JC, Gégout JC. 2011. Changes in plant community composition lag behind climate warming in lowland forests. Nature 479, 517–520. ( 10.1038/nature10548) [DOI] [PubMed] [Google Scholar]
- 33.Bertrand R, Riofrío-Dillon G, Lenoir J, Drapier J, de Ruffray P, Gégout J-C, Loreau M. 2016. Ecological constraints increase the climatic debt in forests. Nat. Commun. 7, 12643 ( 10.1038/ncomms12643) [DOI] [PMC free article] [PubMed] [Google Scholar]
- 34.Gobiet A, Kotlarski S, Beniston M, Heinrich G, Rajczak J, Stoffel M. 2014. 21st century climate change in the European Alps: a review. Sci. Total Environ. 493, 1138–1151. ( 10.1016/j.scitotenv.2013.07.050) [DOI] [PubMed] [Google Scholar]
- 35.Verheyen K, et al. 2018. Observer and relocation errors matter in resurveys of historical vegetation plots. J. Veg. Sci. 29, 812–823. ( 10.1111/jvs.12673) [DOI] [Google Scholar]
- 36.Kapfer J, Hédl R, Jurasinski G, Kopecký M, Schei FH, Grytnes J-A. 2016. Resurveying historical vegetation data: opportunities and challenges. Appl. Veg. Sci. 20, 164–171. ( 10.1111/avsc.12269) [DOI] [PMC free article] [PubMed] [Google Scholar]
- 37.Kauserud H, et al. 2012. Warming-induced shift in European mushroom fruiting phenology. Proc. Natl Acad. Sci. USA 109, 14 488–14 493. ( 10.1073/pnas.1200789109) [DOI] [PMC free article] [PubMed] [Google Scholar]
- 38.Lindahl BD, et al. 2013. Fungal community analysis by high-throughput sequencing of amplified markers: a user's guide. New Phytol. 199, 288–299. ( 10.1111/nph.12243) [DOI] [PMC free article] [PubMed] [Google Scholar]
- 39.Diez J, Kauserud H, Andrew C, Haegaard E, Krisai-Greilhuber I, Senn-Irlet B, Høiland K, Egli S, Büntgen U. 2020. Data from: Altitudinal upwards shifts in fungal fruiting in the Alps. Dryad Digital Repository. ( 10.6086/D1TQ14) [DOI] [PMC free article] [PubMed]
Associated Data
This section collects any data citations, data availability statements, or supplementary materials included in this article.
Data Citations
- Diez J, Kauserud H, Andrew C, Haegaard E, Krisai-Greilhuber I, Senn-Irlet B, Høiland K, Egli S, Büntgen U. 2020. Data from: Altitudinal upwards shifts in fungal fruiting in the Alps. Dryad Digital Repository. ( 10.6086/D1TQ14) [DOI] [PMC free article] [PubMed]
Supplementary Materials
Data Availability Statement
The analysed data are available at the Dryad Digital Repository: https://doi.org/10.6086/D1TQ14 [39].