Supplemental Digital Content is available in the text
Keywords: meta-analysis, paraquat, prediction, severity index, survival
Abstract
Background:
Severity index and plasma paraquat (PQ) concentration can predict the prognosis of patients with PQ poisoning. However, the better parameter is yet to be systematically investigated and determined. Thus, we conduct this systematic review and meta-analysis to investigate the prognostic value of severity index and plasma PQ concentration in patients with PQ poisoning.
Methods:
We searched PubMed, Embase, Web of Science, ScienceDirect, and Cochrane Library to identify all relevant papers that were published up to March 2019. All diagnostic studies that compared severity index and plasma PQ concentration to predict mortality in patients with PQ poisoning were enrolled in this meta-analysis. Odds ratios (ORs) with 95% confidence intervals (CIs) for individual trials were pooled using a random-effect model. We also aggregated heterogeneity testing, sensitivity analysis, and publication bias analysis.
Results:
Ultimately, seven studies involving 821 patients were included. The pooled OR with a 95% CI of severity index was 24.12 (95% CI: 9.34–62.34, P < .001), with an area under the curve of 0.88 (95% CI: 0.85–0.90), sensitivity of 0.84 (95% CI: 0.74–0.91), and specificity of 0.81 (95% CI: 0.75–0.87). Meanwhile, the pooled OR with 95% CI of plasma PQ concentration was 34.39 (95% CI: 14.69–80.56, P < .001), with an area under the curve of 0.94 (95% CI: 0.91–0.96), sensitivity of 0.86 (95% CI: 0.75–0.93), and specificity of 0.89 (95% CI: 0.76–0.95). Sensitivity analysis demonstrated the stability of the results of our meta-analysis. No significant publication bias was observed in this meta-analysis.
Conclusion
: Overall, this study indicated that severity index and plasma PQ concentration have relatively high-prognostic value in patients with PQ poisoning, and that the sensitivity and specificity of plasma PQ concentration are superior to those of severity index.
1. Introduction
Paraquat (1,1′-dimethyl-4,4′-bipyridinium dichloride; PQ) is a widely used nonselective herbicide that is commonly used in agriculture. PQ ingestion occurs frequently in the agricultural countryside, either accidentally or as a suicide attempt. PQ is extremely toxic to humans and animals, and PQ poisoning results in multiple organ dysfunctions and rapid onset of death within days of ingestion due to excessive production of reactive oxygen species and the subsequent fulminant inflammatory response.[1] Therapy has concentrated on reducing PQ absorption from the gastrointestinal tract, increasing its elimination, and minimizing its toxicity; approaches include gastric lavage, activated catharsis, fluid infusion, absorption, charcoal hemoperfusion, and immunosuppressive therapy.[2–4] At present, no special antidote is available to inhibit toxicity, and the survival of PQ poisoning is 20% to 50%.[5–7]
Establishing a quick, simple, and accurate assessment of the prognosis is critical. The early identification of inevitable deaths can help spare hopeless or minimally poisoned patients from needless aggressive treatment. Moreover, assessment of the clinical effect of any new therapy should be based on poisoned severity. Plasma PQ concentration and the severity index of PQ poisoning (SIPP), calculated by multiplying the time since the PQ ingestion (hour) by the plasma PQ concentration (milligram per liter), are recognized as the most potentially valuable prognostic indicators for patients with PQ poisoning.[8–14] However, the better approach is yet to be systematically investigated and determined. Considering that meta-analyses benefit synthesized data from individual studies for a specified outcome, we systematically conducted a meta-analysis to clarify the predictive accuracy of SIPP for the prognosis of patients with PQ poisoning.
2. Materials and methods
2.1. Study design and registration
This study is reported in compliance with the Preferred Reporting Items for Systematic Reviews and Meta-Analyses (PRISMA) checklist.[15] Institutional review board approval was not required. The systematic review and meta-analysis were pre-registered at the International Prospective Register of Systematic Reviews in April 2019 with the registry number CRD42019131405.
2.2. Search strategy
We searched PubMed, Embase, Web of Science, ScienceDirect, and Cochrane Library to identify all relevant papers that were published up to March 2019. Studies that compared severity index and plasma PQ concentration to predict mortality in patients with PQ poisoning were selected. The following terms were used in the databases: severity index and paraquat (Search strategy in Supplemental Table 1). No restrictions were placed on language or year of publication.
2.3. Inclusion and exclusion criteria
Original studies were included if they met the following inclusion criteria: patients with definite PQ poisoning diagnosis; studies reporting associations of severity index, plasma PQ concentration, and prognosis after PQ ingestion; death was the end point of prognosis; prospective or retrospective diagnostic studies involving humans; and published articles without language restrictions. Clear observable data for sufficient data were provided to calculate the number of true-positive, false-positive, false-negative, and true negative cases. Exclusion criteria were as follows: animal experiments, duplicate studies, reviews, abstracts, case reports, and informal publication. Studies with incomplete data were also excluded.
2.4. Data extraction
Two investigators blinded and independently extracted data from the included studies using predesigned data-extraction forms and compared data to achieve maximum reliability. The following patient-specific characteristics were collected: first author's last name, years of publication, study region, study design, sample size, mortality, follow-up, language of publication, severity index, and plasma PQ concentration. Discrepancies among the investigators were resolved by consensus.
2.5. Risk of bias
Methodological quality and risk of bias were assessed independently by two investigators who followed the checklist of Quality Assessment of Diagnostic Accuracy Studies 2 (QUADAS-2).[16] QUADAS-2 consists of four domains: patient selection, index test, reference standard, and flow and timing. Each domain was assessed for risk of bias, and the first three domains were also assessed for applicability. Each domain comprises a set of signaling questions that should be marked as “yes,” “no,” or “unclear.” Any discrepancy was resolved by consensus or third-party adjudication if needed.
2.6. Statistical analysis
STATA 12.0 software (StataCorp LP, College Station, TX) was used to analyze data and data synthesis. Pooled odds ratio (OR) with 95% confidence intervals (CIs) represent the predictive value of severity index for survival in patients with PQ poisoning. Potential heterogeneity among included studies was addressed by the estimation of Cochrane Q statistics and I2 statistics, with I2 < 25%, 50% to 75%, or >75% considered as low, moderate, and high heterogeneity, respectively.[17] Data were synthesized using a fixed-effect model; however, for a value of I2 > 50%, a random-effect model was used. Meta-regression analysis will be conducted to investigate the source of heterogeneity if heterogeneity exists. Publication bias was assessed by Begg rank correlation and Egger linear regression methods.[18,19]P-values < .05 were considered to indicate a statistically significant result.
3. Result
3.1. Literature search
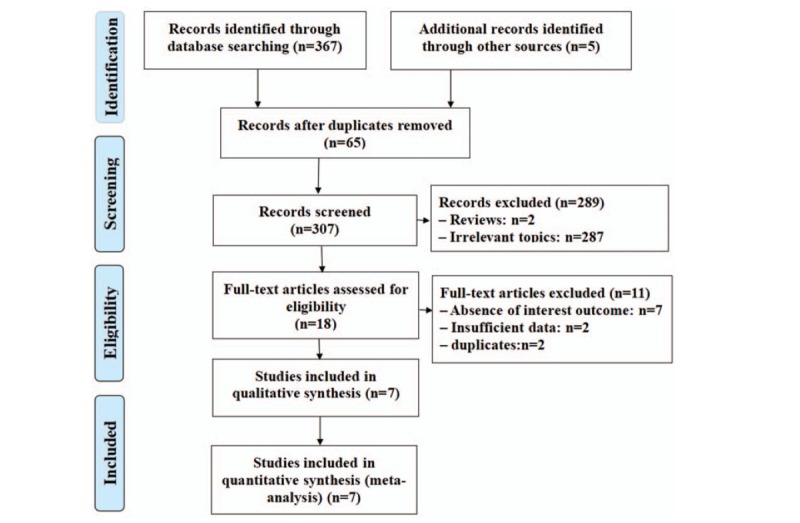
Figure 1 is a detailed flow diagram of the literature search and screening process according to the inclusion/exclusion criteria. A total of 372 relevant records were initially identified from electronic databases based on the search strategy, of which 65 duplicates were excluded. After browsing the titles and abstracts, 289 records were excluded because of irrelevant records (n = 287) or being reviews (n = 2). Another 18 full-text records were excluded because of insufficient data (n = 2), absence of interest outcome (n = 7), or duplicates (n = 2). Finally, seven studies[8–14] with more detailed and sufficient evaluation meeting our entry criteria were retrieved for further analysis.
Figure 1.

Flowchart for study selection.
3.2. Characteristics of the included studies
Table 1 shows the characteristics of the seven included studies,[8–14] all of which were retrospective and published from 2006 to 2018. In terms of the study location, five studies[8,9,12–14] were conducted in China, one was in Taiwan,[10] and one was in Korea.[11] Sample sizes ranged from 64 to 202, and the mean sample size was 117.
Table 1.
Characteristics of included studies.

3.3. Quality assessment
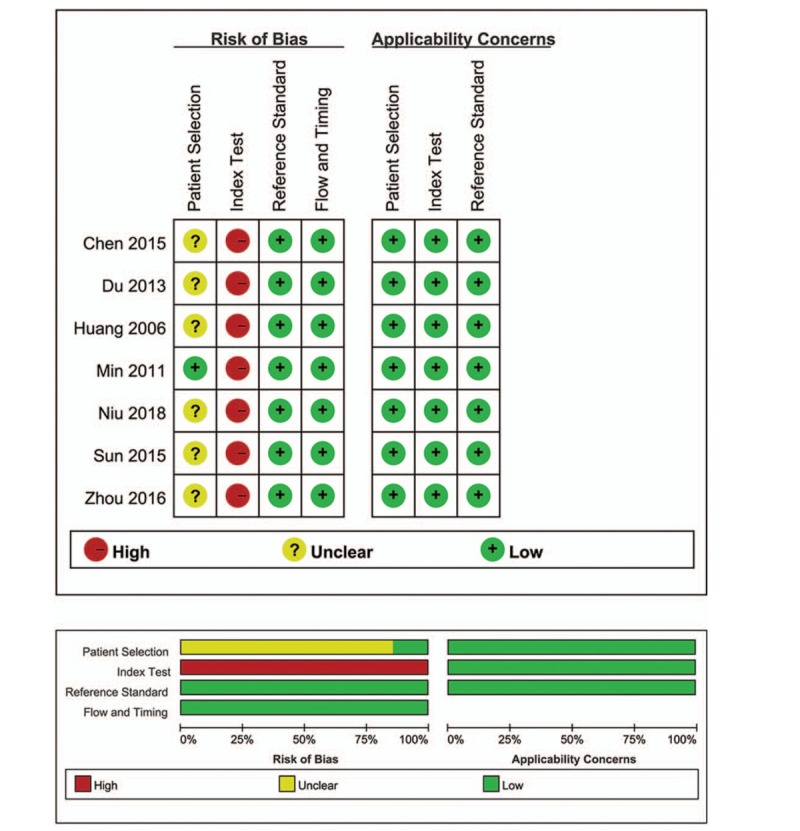
The quality assessment based on QUADAS-2 is presented in Figure 2. The patient-selection risk of bias domain in six studies was labeled as unknown because the authors did not report whether the subjects were consecutively enrolled, and the index test was labeled as high risk because the diagnostic threshold was not prespecified. These omissions may have introduced some bias.
Figure 2.

Risk of bias and applicability concerns.
3.4. Meta-analysis of survival
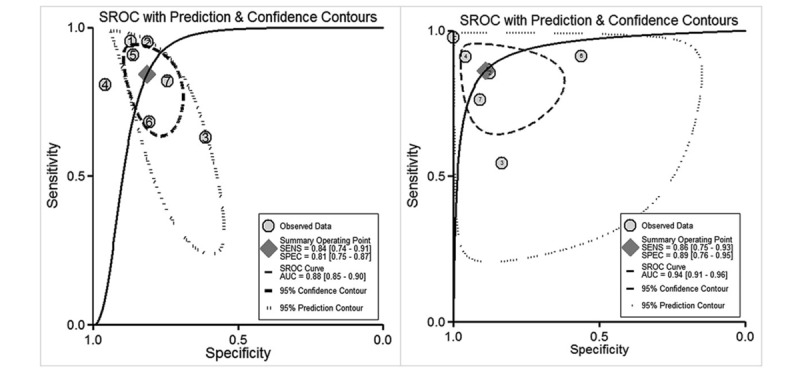
As shown in Figures 3 and 4, the pooled OR with 95% CI of severity index was 24.12 (95% CI: 9.34–62.34, P < .001), with area under the curve of 0.88 (95% CI: 0.85–0.90), sensitivity of 0.84 (95% CI: 0.74–0.91), and specificity of 0.81 (95% CI: 0.75–0.87). The pooled OR with 95% CI of plasma PQ concentration was 34.39 (95% CI: 14.69–80.56, P < .001), with an area under the curve of 0.94 (95% CI: 0.91–0.96), sensitivity of 0.86 (95% CI: 0.75–0.93), and specificity of 0.89 (95% CI: 0.76–0.95).
Figure 3.

Forest plot of severity index (A) and plasma PQ concentration (B) for mortality. PQ = paraquat.
Figure 4.

Summary receiver-operating-characteristic curves for estimating the testing accuracy of severity index (A) and plasma PQ concentration (B) for mortality. PQ = paraquat.
3.5. Heterogeneity, sensitivity analysis, and publication-bias assessment
This meta-analysis revealed high heterogeneity in the relationship between severity index, plasma PQ concentration, and survival (I2 = 81.7%, P < .001; I2 = 67.6.7%, P = .005, respectively). Meta-regression analyses were conducted based on mortality percentage (≥58.2% vs <58.2%), published year (before 2015 vs after 2015), sample size (≥117 vs <117), and study region (China vs other regions), but they did not account for the source of heterogeneity (Table 2).
Table 2.
Meta-regression analysis of potential sources of heterogeneity.

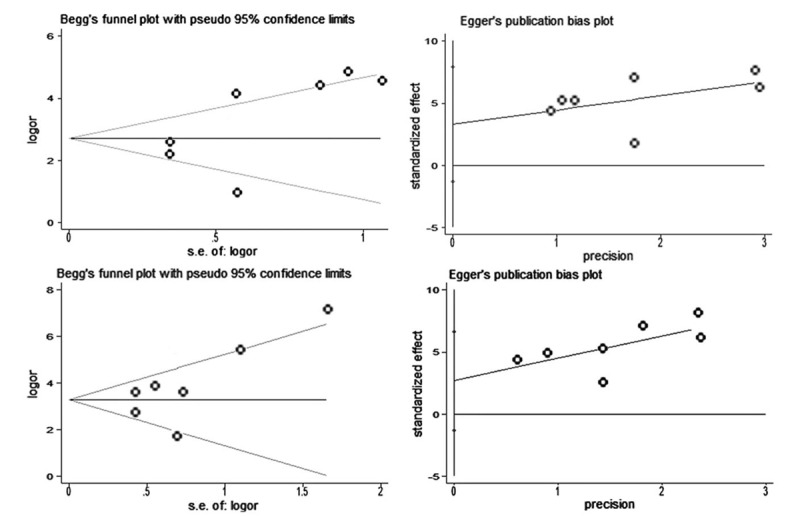
Sensitivity analysis demonstrated the conclusion was not affected by the exclusion of any single study (Fig. 5). No evidence of significant publication bias was observed for severity index (Begg test P = .548, Fig. 5A; Egger test P = .125, Fig. 5B) and plasma PQ concentration (Begg test P = .230, Fig. 6C; Egger test P = .142, Fig. 6D).
Figure 5.

Sensitivity analysis of severity index (A) and plasma PQ concentration (B) for mortality. PQ = paraquat.
Figure 6.

Funnel plot of the publication bias test for severity index ((A) Begg test and (B) Egger test) and plasma PQ concentration ((C) Begg test and (D) Egger test).
4. Discussion
To the best of our knowledge, this review is the first comprehensive, systematic meta-analysis to investigate the predictive value of severity index and plasma PQ concentration for the prognosis of PQ poisoning patients. Our results indicated that severity index and plasma PQ concentration have relatively high-prognostic value in patients with PQ poisoning, and that the prognostic value of plasma PQ concentration is superior to that of severity index.
The clinical prognosis of acute PQ poisoning is usually determined by the degree of PQ exposure, and plasma PQ concentration has been regarded as the best prognostic indicator.[20,21] However, this assessment method has been questioned because some studies indicate that plasma PQ concentration is not as reliable as reported.[22–24] Gil et al[22] reported that plasma PQ concentration is not a good predictor of non-survivors in the low-plasma PQ level because some patients with low-PQ concentration still die. The phenomenon may be explained by the pharmacokinetics of PQ. Plasma concentration initially peaks within the first few hours after PQ exposure and then decreases with a steep gradient, with a distribution half-life of 5 hours.[24] During this short period, plasma PQ concentration has obvious variations even with slight changes in time interval from PQ exposure to plasma PQ measurements. The prognosis in acute PQ poisoning largely depends on the time from ingestion to plasma PQ measurements.
In theory, the severity index calculated by multiplying the time from ingestion to plasma PQ measurements by the plasma PQ concentration may be more reliable to evaluate the prognosis of acute PQ poisoning. Contrary to our expectations, the prognostic value of plasma PQ concentration is superior to that of severity index. We speculate that estimates of time from ingestion to plasma PQ measurements are often unobtainable or unreliable in many intoxicated patients. Patients may not remember the exact time of ingestion and thus provide general descriptions such as “after breakfast” or “approximately two hours ago.”
Although our results and conclusions seem to be relatively consistent and robust, they should be interpreted in light of a number of limitations. First, despite an exhaustive search of literature, the number of eligible studies was low. Second, we believe that potential language and publication biases may have been present in this meta-analysis because we sought published studies written only in English and Chinese. Third, significant heterogeneity was observed in pooled-analysis in retrospective studies. Fourth, detailed information, including the time from ingestion to blood sample measurement of plasma PQ concentration and blood sample collection before hemoperfusion therapy, should be included in the original article.
In conclusion, this study indicated that severity index and plasma PQ concentration have relatively high prognostic value in patients with PQ poisoning, and that the sensitivity and specificity of plasma PQ concentration are superior to those of severity index. Considering the limitations of this meta-analysis, this conclusion should be interpreted with caution. Additional clinical studies with larger sample sizes should be conducted to reduce the study heterogeneity and further verify this conclusion.
Author contributions
Conceptualization: Zong Xun Cao, Shun Yi Feng.
Data curation: Yong Zhao, Jie Gao, Cheng Pu Wu, Yan Zhao Zhai, Meng Zhang, Shen Nie.
Project administration: Yong Li.
Software: Shun Yi Feng.
Writing – original draft: Zong Xun Cao, Yong Zhao.
Writing – review & editing: Shun Yi Feng.
Supplementary Material
Footnotes
Abbreviations: CI = confidence interval, OR = odds ratio, PQ = paraquat, QUADAS-2 = Quality Assessment of Diagnostic Accuracy Studies 2 tool.
How to cite this article: Cao ZX, Zhao Y, Gao J, Feng SY, Wu CP, Zhai YZ, Zhang M, Nie S, Li Y. Comparison of severity index and plasma paraquat concentration for predicting survival after paraquat poisoning: a meta-analysis. Medicine. 2020;99:6(e19063).
The authors have no funding and conflicts of interest to disclose.
Supplemental Digital Content is available for this article.
References
- [1].Suntres ZE. Role of antioxidants in paraquat toxicity. Toxicology 2002;180:65–77. [DOI] [PubMed] [Google Scholar]
- [2].Gao J, Cao Z, Feng S, et al. Patients with mild paraquat poisoning treated with prolonged low-dose methylprednisolone have better lung function: a retrospective analysis. Medicine (Baltimore) 2018;97:e0430. [DOI] [PMC free article] [PubMed] [Google Scholar]
- [3].Rodrigues da Silva M, Schapochnik A, Peres Leal M, et al. Beneficial effects of ascorbic acid to treat lung fibrosis induced by paraquat. PLoS One 2018;13:e0205535. [DOI] [PMC free article] [PubMed] [Google Scholar]
- [4].Sun S, Jiang Y, Wang R, et al. Treatment of paraquat-induced lungbinjury with an anti-C5a antibody: potential clinical application. Crit Care Med 2018;46:e419–25. [DOI] [PMC free article] [PubMed] [Google Scholar]
- [5].Elenga N, Merlin C, Le Guern R, et al. Clinical features and prognosis of paraquat poisoning in French Guiana: a review of 62 cases. Medicine (Baltimore) 2018;97:e9621. [DOI] [PMC free article] [PubMed] [Google Scholar]
- [6].Wu WP, Lai MN, Lin CH, et al. Addition of immunosuppressive treatment to hemoperfusion is associated with improved survival after paraquat poisoning: a nationwide study. PLoS One 2014;9:e87568. [DOI] [PMC free article] [PubMed] [Google Scholar]
- [7].Tan JT, Letchuman Ramanathan G, Choy MP, et al. Paraquat poisoning: experience in hospital taiping (year 2008–october 2011). Med J Malaysia 2013;68:384–8. [PubMed] [Google Scholar]
- [8].Chen XB, Mo J, Xu T, et al. Comparison of prognostic indicators of acute paraquat poisoning. Chin Gen Pract 2015;18:2089–91. [Google Scholar]
- [9].Du Y, Mou Y. Predictive value of 3 methods in severity evaluation and prognosis of acute paraquat poisoning. Zhong Nan Da Xue Xue Bao Yi Xue Ban 2013;38:737–42. [DOI] [PubMed] [Google Scholar]
- [10].Huang NC, Hung YM, Lin SL, et al. Further evidence of the usefulness of Acute Physiology and Chronic Health Evaluation II scoring system in acute paraquat poisoning. Clin Toxicol (Phila) 2006;44:99–102. [DOI] [PubMed] [Google Scholar]
- [11].Min YG, Ahn JH, Chan YC, et al. Prediction of prognosis in acute paraquat poisoning using severity scoring system in emergency department. Clin Toxicol (Phila) 2011;49:840–5. [DOI] [PubMed] [Google Scholar]
- [12].Niu Ld, Zhang JX, Hao TQ, et al. The value of assessing the severity and prognosis of plasma paraquat concentration and paraquat poisoning severity index at admission in patients with poisoning. PractHosp Clin J 2018;15:87–9. [Google Scholar]
- [13].Sun L, Yan P, Liu Y, et al. Analysis of prognostic value of initial serum paraquat concentration in patients with paraquat poisoning. Zhonghua Lao Dong Wei Sheng Zhi Ye Bing Za Zhi 2015;33:697–700. [PubMed] [Google Scholar]
- [14].Zhou DC, Zhang H, Luo ZM, et al. Prognostic value of hematological parameters in patients with paraquat poisoning. Sci Rep 2016;6:36235. [DOI] [PMC free article] [PubMed] [Google Scholar]
- [15].McInnes MDF, Moher D, Thombs BD, et al. Preferred reporting items for a systematic review and meta-analysis of diagnostic test accuracy studies: the PRISMA-DTA statement. JAMA 2018;319:388–96. [DOI] [PubMed] [Google Scholar]
- [16].Whiting PF, Rutjes AW, Westwood ME, et al. QUADAS-2: a revised tool for the quality assessment of diagnostic accuracy studies. Chin Gen Pract 2011;155:529–36. [DOI] [PubMed] [Google Scholar]
- [17].Higgins JP, Thompson SG, Deeks JJ, et al. Measuring inconsistency in meta-analyses. BMJ 2003;327:557–60. [DOI] [PMC free article] [PubMed] [Google Scholar]
- [18].Egger M, Davey Smith G, Schneider M, et al. Bias in meta-analysis detected by a simple, graphical test. BMJ 1997;315:629–34. [DOI] [PMC free article] [PubMed] [Google Scholar]
- [19].Begg CB, Mazumdar M. Operating characteristics of a rank correlation test for publication bias. Biometrics 1994;50:1088–101. [PubMed] [Google Scholar]
- [20].Feng S, Gao J, Li Y. A retrospective analysis of leucocyte count as a strong predictor of survival for patients with acute paraquat poisoning. PLoS One 2018;13:e0201200. [DOI] [PMC free article] [PubMed] [Google Scholar]
- [21].Senarathna L, Eddleston M, Wilks MF, et al. Prediction of outcome after paraquat poisoning by measurement of the plasma paraquat concentration. QJM 2009;102:251–9. [DOI] [PMC free article] [PubMed] [Google Scholar]
- [22].Gil HW, Kang MS, Yang JO, et al. Association between plasma paraquat level and outcome of paraquat poisoning in 375 paraquat poisoning patients. Clin Toxicol (Phila) 2008;46:515–8. [DOI] [PubMed] [Google Scholar]
- [23].Proudfoot AT, Stewart MS, Levitt T, et al. Paraquat poisoning: significance of plasma-paraquat concentrations. Lancet 1979;2:330–2. [DOI] [PubMed] [Google Scholar]
- [24].Seok S, Kim YH, Gil HW, et al. The time between paraquat ingestion and a negative dithionite urine test in an independent risk factor for death and organ failure in acute paraquat intoxication. J Korean Med Sci 2012;27:993–8. [DOI] [PMC free article] [PubMed] [Google Scholar]
Associated Data
This section collects any data citations, data availability statements, or supplementary materials included in this article.


