

Supplemental Digital Content is available in the text
Keywords: biomarker, kawasaki disease, meta-analysis, neutrophil-to-lymphocyte ratio
Abstrat
Background:
In recent years, many studies focused on the association between the neutrophil-to-lymphocyte ratio (NLR) and the risk of intravenous immunoglobulin (IVIG)-resistant Kawasaki disease (rKD), with inconsistent results. Therefore, we aimed to investigate the role of NLR as a biomarker in detecting rKD.
Methods:
We searched PubMed, EMBASE, the Cochrane Central Register of Controlled Trials, and China National Knowledge Infrastructure through May 18th, 2019. Meta-disc 1.4 and STATA 15.1 were used to perform this metaanalysis in a fixed/random-effect model.
Results:
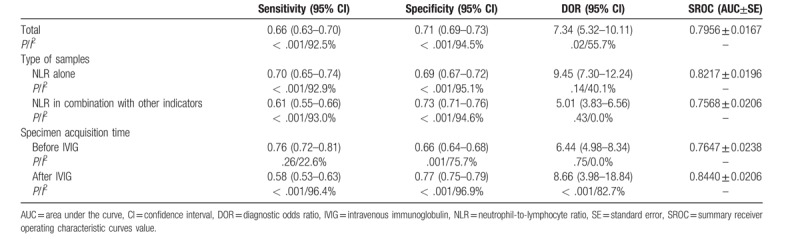
A total of 7 relevant studies were eligible to analyze pooled accuracy. The overall performance of NLR detection was: pooled sensitivity, 0.66 (95% confidence interval [CI], 0.63 – 0.70); pooled specificity, 0.71 (95%CI, 0.69 – 0.73); and area under the summary receiver operating characteristic curves value (SROC), 0.7956. The meta-regression analysis showed that the type of samples was the sources of heterogeneity. The subgroup analysis suggested that NLR detection after the initial treatment of IVIG had the largest area under curve of SROC in all the subgroups: pooled sensitivity, 0.58 (95%CI, 0.53 – 0.63); pooled specificity, 0.77 (95%CI, 0.75 – 0.79); and SROC, 0.8440.
Conclusions:
This is the first meta-analysis demonstrated that NLR might be a biomarker for detecting rKD, especially NLR value after the initial treatment of IVIG. More well-designed researches need to be done to launch the application of NLR for predicting rKD in the clinic.
1. Introduction
Kawasaki disease (KD) is a self-limited systemic vasculitis of unknown cause that is associated with the development of coronary artery lesions (CALs) in children.[1] KD is currently the most common cause of acquired heart disease in children in many countries.[2–4] Timely initial treatment with intravenous immunoglobulin (IVIG) has reduced the risk of CAL from 25% to approximately 4%.[5] Approximately 10% to 20% patients with KD had persistent or recurrent fever after the initial treatment of IVIG, which is defined as IVIG-resistant KD (rKD).[5] Patients with rKD may be at higher risk of developing CALs than IVIG-responsive patients.[6,7] The combination of IVIG and other anti-inflammatory therapies as the intensive initial treatment may reduce the occurrence of IVIG resistance or CAL.[8–12] Therefore, it is important to predict patients with rKD early so that they might benefit from more aggressive treatment.
Japanese researchers have constructed several risk-scoring systems that use general laboratory data to predict IVIG resistance in KD patients’ risk scores.[13–15] However, these risk-scoring systems are not sufficiently accurate for clinical use in countries other than Japan.[16,17] Better predictive biomarkers must be developed for more widespread use.
Many recent studies focused on the association between the neutrophil-to-lymphocyte ratio (NLR) and the risk of rKD.[18–20] However, the results were inconsistent. Therefore, we collected all published case-control studies to gather evidence on the diagnostic performance of the NLR for distinguishing rKD.
2. Materials and methods
2.1. Study protocol
We performed this analysis by a predetermined protocol according to the recommendations of Deeks.[21] The data collection and reporting followed the preferred reporting items for systematic reviews and meta-analyses statement.[22] It is a systematic literature research so that ethical approval was not necessary.
2.2. Search strategy
We searched multiple databases, including PubMed, EMBASE, the Cochrane Central Register of Controlled Trials, and China National Knowledge Infrastructure (CNKI) through May 18, 2019, to identify relevant studies. Keyword search terms were (‘mucocutaneous lymph node syndrome’ OR ‘KD OR ‘Kawasaki syndrome’) AND (‘neutrophils’ OR ‘neutrophil’) AND (‘lymphocytes’ OR ‘lymphocyte’ OR ‘lymphoid’). PubMed database was searched as follows: (mucocutaneous lymph node syndrome [MeSH Terms] OR KD OR Kawasaki syndrome) AND (neutrophils [MeSH Terms] OR neutrophil) AND (Lymphocytes [MeSH Terms] OR Lymphocyte OR Lymphoid) AND (Lymphocytes [MeSH] Terms] OR Lymphocyte OR Lymphoid). Search terms for EMBASE, CENTRAL, and CNKI with corresponding publication numbers can be found in the Supplementary Appendix. Languages were limited to English and Chinese.
2.3. Study selection
We preliminarily excluded studies by title and abstract. Then we retrieved potentially relevant studies by full manuscripts and assessed for compliance with inclusion and exclusion criteria.
Criteria for inclusion:
-
(1)
All patients of KD were confirmed by KD diagnosis criteria;
-
(2)
Randomized controlled or non-randomized controlled, retrospective or prospective trials evaluating NLR in blood samples;
-
(3)
Contained the data which can calculate true positive (TP), false positive (FP), false negative (FN), and true negative (TN), such as sensitivity, specificity, and essential sample size;
-
(4)
All studies had patients with rKD as the experimental group and non-rKD as the control group;
-
(5)
Blood samples were obtained in the acute phase of KD before or after initial IVIG treatment;
-
(6)
Full text published in English or Chinese.
Criteria for exclusion:
-
(1)
Conferences articles, editorials, abstracts, letters, reviews, expert opinions, or case reports without controls;
-
(2)
No available data to construct a 2 × 2 table;
-
(3)
Duplicated reports.
2.4. Data collection and assessment of study quality
Two investigators (Xiaolan Zheng, Gang Wu) screened and assessed the eligibility of reports at the title and abstract level independently following the inclusion and exclusion criteria., and a third reviewer (Yifei Li) determining the divergences according to inclusion or exclusion criteria, and the quality of reports; studies that met all the inclusion criteria were selected for further analysis. The quality assessment of all enrolled studies was independently conducted by 2 investigators (Xiaolan Zheng, Peng Yue) according to the 14-item Quality Assessment of Diagnostic Accuracy Studies (QUADAS) list,[23] and any disagreement was settled by discussion. All the assessments were only reported in descriptive forms due to a well-conducted study might score poorly once related parts were missing among the methods and results. Finally, 2 investigators (Xiaolan Zheng, Fan Ma) extracted the date which can calculate TP, FP, FN, and TN, such as sensitivity, specificity, and essential sample size.
2.5. Evaluation indicators
The following indicators of NLR were measured: sensitivity, specificity, diagnostic odds ratio (DOR), and area under the summary receiver operating characteristic curves value (SROC). Sensitivity was represented by the proportion of patients with rKD that was correctly identified by the positive results of NLR. Specificity was represented by the non-rKD cases that were correctly identified by the negative results of NLR. DOR was an independent indicator indicating that patients with positive test results are much more likely to have rKD than patients with negative test results. The higher the DOR, the better the discriminatory ability of the test was.[24] The SROC was plotted by the combination of sensitivity and specificity, and the area under the curve (AUC) value was then calculated as a global measurement of test performance. The closer the AUC was to 1, the better the test performance.[25] We used Meta-DiSc 1.4 to check for asymmetry of the SROC curve, and fit an asymmetrical SROC curve if the coefficient b is significantly less than or greater than zero.[26]
2.6. Publication bias
We used stata statistical software (STATA, version 15.1) to obtain a quantitative analysis of all the publication bias according to the Deeks test. An asymmetric distribution of data points in the Deeks plot with a quantified result of P < .05 indicated the presence of potential publication bias.[27]
2.7. Heterogeneity and Meta-regression
Exploring heterogeneity was a critical issue of the analysis. Threshold effect was one of the primary causes of heterogeneity, which arises when differences in sensitivities and specificities occur due to different cut-offs used in different studies to define a positive (or negative) test result.[26] We used meta-disc 1.4 to compute of Spearman correlation coefficient between the logit of sensitivity and logit of 1-specificity. A strong positive correlation would suggest threshold effect. A curvilinear shape in the SROCs indicated the presence of a threshold effect. If heterogeneity due to threshold effect were present, the accuracy data can be pooled by fitting a SROC curve and summarising that curve by means of the AUC.[26] Then, studies with inappropriate thresholds will be excluded and the remaining studies will be included for meta-analysis. Heterogeneity of pooling sensitivity and specificity was examined by the X2 test. Heterogeneity of pooling DOR was examined by the Cochran Q test. Heterogeneity was considered as statistically significant when P < .05. The I2 test was also performed in every pooling analysis in order to quantitatively estimate the proportion of total variation across studies, which was attributable to heterogeneity rather than chance. Results utilized random effects model when I2 was higher than 50%, which was considered as evidence of high heterogeneity.[28] Furthermore, we carried out the meta-regression analysis using STATA 15.1 to identify the potential factors that might cause the heterogeneities other than threshold effect. The meta-regression could determine the correlation between the potential factors and the existing heterogeneities. A significant difference with a P value < .05 indicated that the factor should have a dramatic impact on the homogeneity.
2.8. Sensitivity analysis
We used STATA 15.1 to conducted sensitivity analysis for every study to determine the influence of individual trials on the results.
2.9. Statistical analysis
We used Meta-Disc Version 1.4 to perform the data analysis and threshold analysis. Besides, publication bias, meta-regression analysis, and sensitivity analysis were conducted by STATA Version 15.1 (Stata Corporation, College Station, Texas). We utilized the fixed effects model for homogenous results analysis, while the random effects model was utilized for the heterogeneous (I2 > 50%) results analysis. The data were presented using a forest map.
3. Results
3.1. Search results
Initially, 254 potentially relevant papers were retrieved by the aforementioned search method, and 19 articles were considered interesting after review of the titles and abstracts. However, 3 reviews were excluded after reading the complete articles, 5 studies lacked available data to construct a 2 × 2 table, and 4 articles lacked rKD patients as controls. Finally, 7 studies[18–20,29–32] were included in the meta-analysis. The process of study selection is illustrated in Figure 1.
Figure 1.
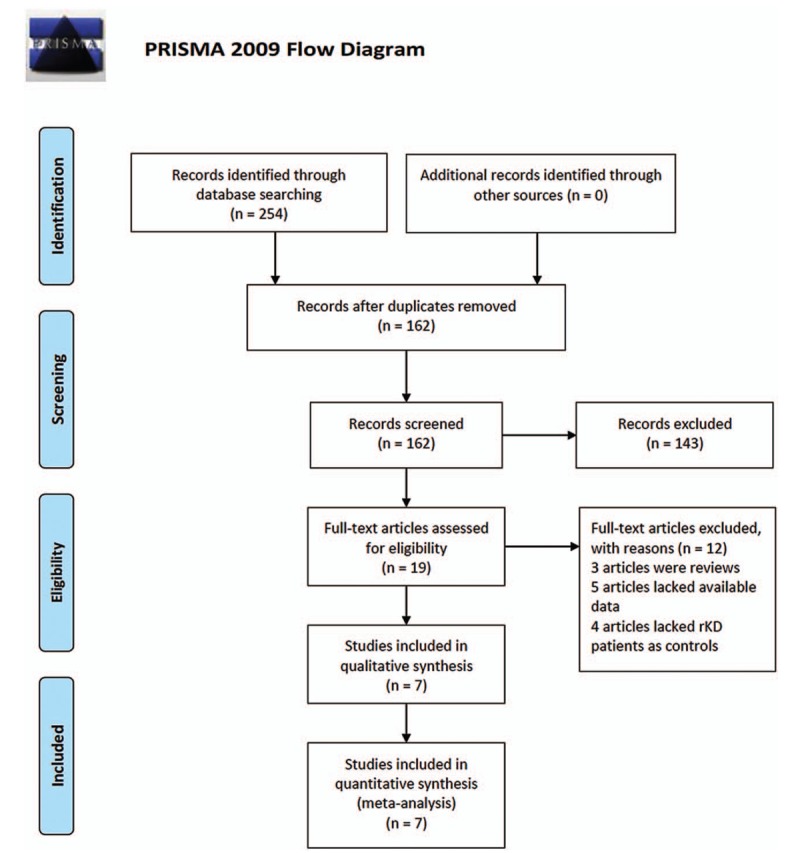
Flow diagram of the study selection process. From: Moher D, Liberati A, Tetzlaff J, Altman DG, The PRISMA Group (2009). Preferred Reporting Items for Systematic Reviews and Meta-Analyses: The PRISMA Statement. PLoS Med. 6(7): e1000097. doi:10.1371/journal.pmed1000097. For more information, visit www.prisma-statement.org.
3.2. Study characteristics
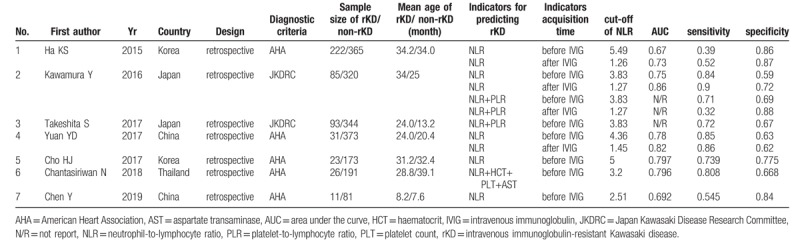
The 7 published reports enrolled a total of 2338 children: 491 rKD patients and 1847 non-rKD patients. All included studies were retrospective trials. All patients were treated with IVIG (single dose 2 g kg-1) in the acute phase of KD. Five reports[18,29–32] used the American Heart Association (AHA) diagnostic criteria.[1] Two studies[19,20] used the Japan Kawasaki Disease Research Committee (JKDRC) diagnostic criteria.[33] Although KD patients with persistent or recurrent fever after the first IVIG treatment was defined as rKD patients in all studies, the duration of persistent or recurrent fever was inconsistent in the definitions. Two studies defined persistent or recurrent fever as lasting 24 hours,[19,20] 2 studies defined persistent or recurrent fever as lasting 36 hours,[29,31] and 3 studies defined persistent or recurrent fever as lasting 48 hours.[18,30,32]
Three studies[18,19,29] reported the diagnostic performance of the NLR for rKD before and after the first IVIG treatment, and the remaining 4 studies[20,30–32] just evaluated the diagnostic performance of the NLR before IVIG treatment. One study[19] reported the diagnostic performance of NLR alone and in combination with the platelet-to-lymphocyte ratio (PLR). Four studies[18,29,30,32] reported the diagnostic performance of the NLR only, and 2 studies[20,31] reported the diagnostic performance of the NLR in combination with other indicators, such as the PLR, hematocrit, platelet count (PLT), and aspartate transaminase (AST). There were 2 reports from China, 2 reports from Japan, 2 reports from Korea, and 1 report from Thailand. The total KD sample size of 3 studies was much smaller (n < 400) compared to the remaining 4 studies (n ≥400). The basic characteristics of the included studies are shown in Table 1.
Table 1.
Characteristics of studies in meta-analysis.
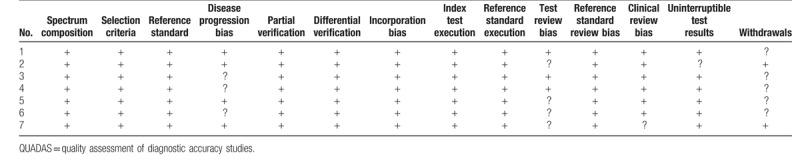
3.3. Study quality
The quality assessment of the included studies was accomplished according to the QUADAS list of questions, and the results are shown in Table 2.
Table 2.
QUADAS criteria of included studies.
3.4. Diagnostic accuracy of NLR
First, we analyzed all of the included studies for the overall diagnostic performance of the NLR in detecting rKD. However, the Spearman correlation coefficient was 0.779 (P < .05) which suggests that a threshold effect was present. Because the coefficient b was significantly less than or greater than zero (P = .02), we fitted an asymmetrical SROC curve, and the calculated AUC value was 0.7899 ± 0.0141 (Supplementary Figure 1). A review of the baseline data revealed that the cut-offs of the NLR before IVIG in 5 studies were approximately 4 but not in 2 studies (Table 1). Therefore, these 2 studies were excluded, and the remaining studies were included to analyze the overall diagnostic performance of the NLR in detecting rKD. The Spearman correlation coefficient was 0.624 (P > .05), which suggested no threshold effect. The pooled sensitivity was 0.66 (95% CI, 0.63 – 0.70) with significant heterogeneity (P < .001, X2 = 119.68, I2 = 92.5%) (Fig. 2A). The pooled specificity was 0.71 (95% CI, 0.69 to 0.73) with noticeable heterogeneity (P < .001, x2 = 162.38, I2 = 94.5%) (Fig. 2B). The pooled DOR was 7.34 (95% CI, 5.32 – 10.11) with significant heterogeneity (P = .016, Cochran Q = 20.30, I2 = 55.7%) (Fig. 2C), and the SROC value was 0.7956 ± 0.0167 (Fig. 2D).
Figure 2.
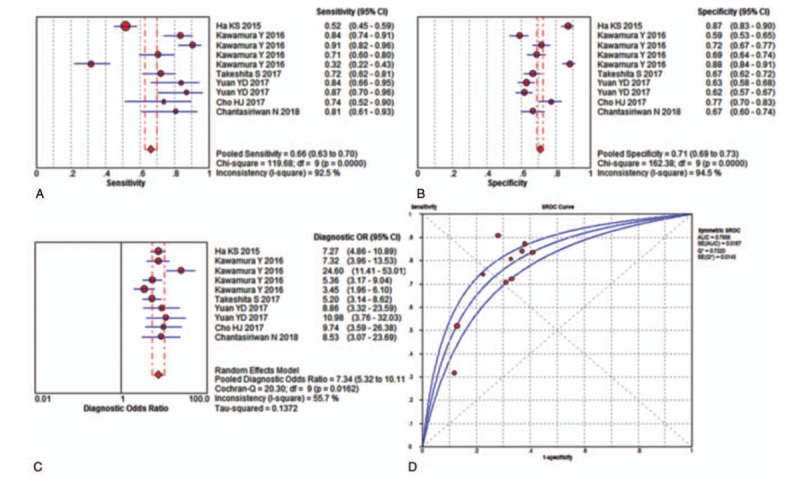
Performance of NLR detection for the diagnosis of rKD. (A) Pooled sensitivity. (B) Pooled specificity. (C) Overall DOR. (D) The SROCs for all datasets. The point estimates from each study are shown as solid squares. The pooled estimates are shown as a solid diamond. Effect sizes were pooled by random-effect models. Each square in the SROC represents 1 study. Sample size is indicated by the size of the square. Error bars represent 95% CIs. CI = confidence interval, DOR = diagnostic odds ratio, NLR = neutrophil-to-lymphocyte ratio, OR = odds ratio, rKD = intravenous immunoglobulin-resistant Kawasaki disease, SROC = summary receiver operating characteristic curves value.
Next, we performed a meta-regression analysis to identify the potential factors underlying the heterogeneities other than the threshold effect. A review of the baseline data and the original data that produced the procedure, the type of samples (the NLR alone and the NLR in combination with other indicators), countries (Korea, Japan, China, and Thailand), total KD sample sizes (n < 400 and n ≥400), specimen acquisition time (before IVIG and after IVIG), KD diagnostic criteria (AHA and JKDRC), and the duration of persistent or recurrent fever in the definitions of rKD (24 hours, 36 hours, and 48 hours ) were taken into account in the meta-regression to determine the origins of the heterogeneities. The results (Fig. 3) demonstrated that the type of samples was a dramatic impact factor on the homogeneity of the enrolled studies (P = .03, t = −2.54, 95% CI (0.2851, 0.9423)) (Fig. 3A). Country was not a dramatic impact factor on the homogeneity (P = .78, t = 0.29, 95% CI (0.6344, 1.8005)) (Fig. 3B). The total KD sample size was also not a dramatic impact factor on the homogeneity (P = .66, t = −0.48, 95% CI (0.2447, 2.5145)) (Fig. 3C). The meta-regression also found that specimen acquisition time was not a dramatic impact factor (P = .62, t = 0.51, 95% CI (0.5189, 2.7984)) (Fig. 3D). The diagnostic criteria of KD did not dramatically impact the results (P = .47, t = −0.76, 95% CI (0.3388, 1.7256)) (Fig. 3E), and the duration of persistent or recurrent fever in the definitions of rKD was not a dramatic impact factor (P = .59, t = 0.57, 95% CI (0.6812, 1.8836)) (Fig. 3F).
Figure 3.
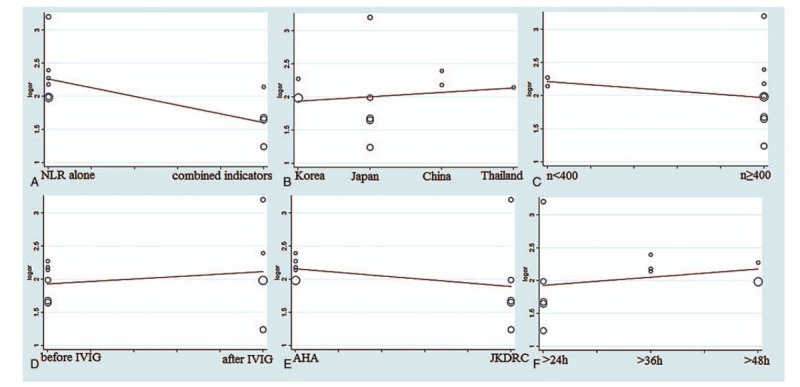
The meta-regression of the enrolled studies. (A) For the type of samples, the meta-regression detected it was a dramatic impact on the homogeneity of the enrolled studies, P = .03, t = -2.54, 95%CI (0.2851, 0.9423). (B) For the countries, the meta-regression did not find it was a dramatic impact on the homogeneity of the enrolled studies, P = .78, t = 0.29, 95%CI (0.6344, 1.8005). (C) For the total KD sample sizes, the meta-regression did not detect it was a dramatic impact on the homogeneity of the enrolled studies, P = .64, t = -0.48, 95%CI (0.2447, 2.5145). (D) For the specimen acquisition time, the meta-regression did not detect it was a dramatic impact on the homogeneity of the enrolled studies, P = .62, t = 0.51, 95%CI (0.5189 2.7984). (E) For the diagnostic criteria of KD, the meta-regression did not detect it was a dramatic impact on the homogeneity of the enrolled studies, P = .47, t = -0.76, 95%CI (0.3388, 1.7256). (F) For the duration of persistent or recurrent fever in the definitions of rKD, the meta-regression did not detect it was a dramatic impact on the homogeneity of the enrolled studies, P = .59, t = 0.57, 95%CI (0.6812, 1.8836). AHA = American Heart Association, CI = confidence interval, IVIG = intravenous immunoglobulin, JKDRC = Japan Kawasaki Disease Research Committee, NLR = neutrophil-to-lymphocyte ratio, or = odds ratio, rKD = intravenous immunoglobulin-resistant Kawasaki disease.
3.5. Subgroup analysis
We performed subgroup analyses according to the sample type (the NLR alone and the NLR in combination with other indicators) and the specimen acquisition time (before IVIG and after IVIG). All of the results are shown in Table 3 and Supplementary Figures 2 to 5. The subgroup analyses suggested that the subgroup NLR alone had a larger AUC of SROC than the subgroup NLR in combination with other indicators: pooled sensitivity, 0.70 (95% CI, 0.65 – 0.74); pooled specificity, 0.69 (95% CI, 0.67 – 0.72); and SROC, 0.8217 ± 0.0196 (Supplementary Figure 2). The subgroup after IVIG had a larger AUC of SROC than the subgroup before IVIG: pooled sensitivity, 0.58 (95% CI, 0.53 – 0.63); pooled specificity, 0.77 (95% CI, 0.75 – 0.79); and SROC, 0.8440 ± 0.0206 (Supplementary Figure 5).
Table 3.
Subgroup analysis results of included studies.
3.6. Sensitivity analysis
We used STATA 15.1 for meta-analysis random-effects estimates to systematically and qualitatively analyze the sensitivity across included studies. We did not detect any significant impact from any single research study and confirmed the results of the overall performance of the NLR (Fig. 4).
Figure 4.
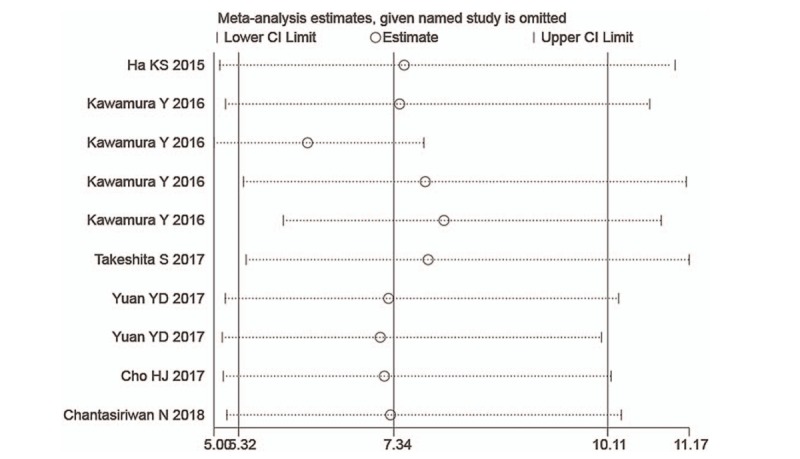
Sensitivity analysis of the individual trials on the results of NLR. Not any single study was detected to incur undue weight in the analysis. NLR = neutrophil-to-lymphocyte ratio.
3.7. Publication bias
We used Deeks funnel plot asymmetry test to evaluate the publication bias of the included studies. Each dot in these plots represents 1 study. The distance between each dot and the vertical line suggested bias in each study. The absence of any asymmetric distribution suggested no publication bias. The asymmetric distribution indicated that publication bias existed. Deeks tests revealed no significant publication bias among the included evaluation pooled results of the overall performance of NLR (P = .60, 95% CI, -17.3403 to 27.9277) (Fig. 5).
Figure 5.
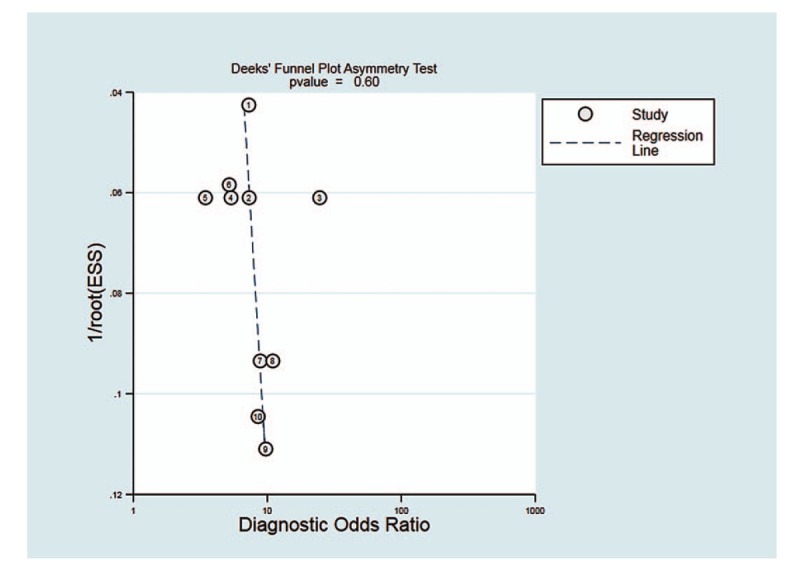
Deeks funnel plot for the assessment of potential publication bias. The funnel graphs plot the square root of the effective sample size (1/ESS1/2) against the DOR. Each circle represents each study in the meta-analysis. Asymmetry of the circle distribution between regression lines indicates potential publication bias. This funnel plot indicates no publication bias with a P value > .05. DOR = diagnostic odds ratio, ESS = effective sample size.
4. Discussion
rKD was significantly associated with coronary events and major adverse cardiac events.[34] The early prediction of rKD may enable clinicians to use more aggressive treatment to prevent the occurrence of CAL. We performed this meta-analysis to assess the diagnostic accuracy of the NLR for the detection of rKD and found that the overall diagnostic sensitivity and specificity of the NLR for diagnosis rKD were 0.66 and 0.71, respectively. The AUC of SROC was 0.7956. These findings suggest that the NLR may be used as a biomarker for detecting rKD.
The meta-regression analysis indicated that the type of sample had a dramatic impact on the homogeneity of the enrolled studies (P = .03, Fig. 3A). The subgroup analysis found that the NLR alone had the higher diagnostic accuracy compared to the NLR in combination with other indicators. Several risk-scoring systems (Kobayashi, Egami, and Sano scoring systems) are mainly composed of various laboratory indicators that use general laboratory data, such as total bilirubin (TB), neutrophils, C-reactive protein (CRP), serum sodium, PLT, AST, and alanine aminotransferase (ALT) (13–15). These risk-scoring systems are limited by regions and are not suitable for global promotion. Clinicians need more convenient and feasible indicators to predict rKD. Previous studies[35–38] have shown that many laboratory indicators, such as TB, ALT, CRP, albumin, and N-terminal pro-brain natriuretic peptide (NT-proBNP), are associated with rKD. However, there is no useful single biomarker in existence. In 2016, Baek et al[39] performed a meta-analysis and found that laboratory predictive factors for rKD included higher TB, polymorphonuclear leukocyte, pro-brain natriuretic peptide, AST, ALT, CRP, lower sodium and albumin. Two years later, Li et al[40] performed a meta-analysis and indicated that increased erythrocyte sedimentation rate, decreased hemoglobin and PLT might be risk factors for predicting rKD. Neither meta-analysis assessed the diagnostic accuracy of the indicators, and neither analysis mentioned the NLR. Our study is the first meta-analysis to assess the diagnostic accuracy of the NLR in detecting rKD.
To allow clinicians to implement medical measures earlier, it is better to predict rKD earlier. Therefore, we performed a subgroup analysis by the specimen acquisition time. Although the NLR after initial treatment of IVIG had a larger AUC than before IVIG, the gap between the 2 was not large (0.8440 vs 0.7647, respectively). Due to the small number of studies included in both groups, there was inevitably some bias in the results. More research is needed to confirm the results.
The NLR was recently reported to be a powerful indicator of systemic inflammation, sepsis, and cardiovascular diseases.[41–43] Neutrophil counts reflect ongoing inflammation, and lymphocyte counts are a marker of immune regulatory response.[32] The NLR is a combination of neutrophils and lymphocytes, and it may be used as a marker of balance between inflammation and immune regulation.[41] We found that rKD patients had a significantly higher NLR than nonrKD patients in all of the studies included in our meta-analysis, which indicates that rKD patients might have a more severe inflammatory course. However, the immunological basis of IVIG resistance is not clear, partially because the mechanism of action of IVIG is poorly understood.[5] Host genetic factors, such as polymorphisms in the Fc gamma receptors, may play a role in IVIG response and resistance.[44,45]
A previous study[46] suggested the NLR as a useful marker to predict CAL in patients with KD. However, there was only 1 study[18] that reported a similar conclusion in all of the included studies. Therefore, we did not perform an analysis of the value of NLR in predicting CAL. More studies are needed to clarify the diagnostic value of NLR in predicting CAL.
There are several limitations of this meta-analysis. First, the number of included studies was small (n = 7), and all of the studies were performed in Asian populations, which means that these results may not generalize to other populations. Second, fewer than ten studies were included in this study, and the results of meta-regression and subgroup analyses must be treated with caution.
In conclusion, despite these limitations, this report is the first meta-analysis to show that the NLR could be used as a biomarker for detecting rKD, especially the NLR value after the initial treatment of IVIG. More well-designed research must be conducted to launch the application of the NLR for predicting rKD in the clinic.
Author contributions
Conceptualization: Xiaolan Zheng, Yifei Li.
Data curation: Xiaolan Zheng, Gang Wu, Yifei Li.
Formal analysis: Gang Wu, Xiaolan Zheng, Peng Yue, Fan Ma.
Investigation: Gang Wu, Xiaolan Zheng, Yi Zhang, Yifei Li.
Methodology: Yi Zhang, Fan Ma.
Project administration: Yifei Li.
Software: Xiaolan Zheng, Fan Ma.
Supervision: Xiaolan Zheng, Yifei Li.
Validation: Xiaolan Zheng, Yifei Li.
Visualization: Xiaolan Zheng, Yifei Li.
Writing – original draft: Xiaolan Zheng.
Writing – review & editing: Yifei Li.
Supplementary Material
Supplementary Material
Supplementary Material
Footnotes
Abbreviations: AUC = area under curve, CAL = coronary artery lesions, IVIG = intravenous immunoglobulin, KD = Kawasaki disease, NLR = neutrophil-to-lymphocyte ratio, rKD = intravenous immunoglobulin-resistant Kawasaki disease, SROC = summary receiver operating characteristic curves value.
How to cite this article: Wu G, Yue P, Ma F, Zhang Y, Zheng X, Li Y. Neutrophil-to-lymphocyte ratio as a biomarker for predicting the intravenous immunoglobulin-resistant Kawasaki disease. Medicine. 2020;99:6(e18535).
This work was supported by grants from the National Natural Science Foundation of China (No. 81700360) and the Technology Project of Sichuan Province of China (No. 2018JY0603).
The authors have no conflicts of interest to disclose.
Supplemental Digital Content is available for this article.
References
- [1].Newburger JW, Takahashi M, Gerber MA, et al. Diagnosis, treatment, and long-term management of Kawasaki disease: a statement for health professionals from the committee on rheumatic fever, endocarditis and Kawasaki disease, council on cardiovascular disease in the Young, American Heart Association. Circulation 2004;110:2747–71. [DOI] [PubMed] [Google Scholar]
- [2].Dietz SM, van Stijn D, Burgner D, et al. Dissecting Kawasaki disease: a state-of-the-art review. Eur J Pediatr 2017;176:995–1009. [DOI] [PMC free article] [PubMed] [Google Scholar]
- [3].Singh S, Bhattad S, Gupta A, et al. Mortality in children with Kawasaki disease: 20 years of experience from a tertiary care centre in North India. Clin Exp Rheumatol 2016;34:S129–33. [PubMed] [Google Scholar]
- [4].Singh S, Vignesh P, Burgner D. The epidemiology of Kawasaki disease: a global update. Arch Dis Child 2015;100:1084–8. [DOI] [PubMed] [Google Scholar]
- [5].McCrindle BW, Rowley AH, Newburger JW, et al. Diagnosis, treatment, and long-term management of Kawasaki disease: a scientific statement for health professionals from the American Heart Association. Circulation 2017;135:e927–99. [DOI] [PubMed] [Google Scholar]
- [6].Muta H, Ishii M, Furui J, et al. Risk factors associated with the need for additional intravenous gamma-globulin therapy for Kawasaki disease. Acta paediatrica 2006;95:189–93. [DOI] [PubMed] [Google Scholar]
- [7].Tremoulet AH, Best BM, Song S, et al. Resistance to intravenous immunoglobulin in children with Kawasaki disease. J Pediatr 2008;153:117–21. [DOI] [PMC free article] [PubMed] [Google Scholar]
- [8].Kanai T, Ishiwata T, Kobayashi T, et al. Ulinastatin, a urinary trypsin inhibitor, for the initial treatment of patients with Kawasaki disease: a retrospective study. Circulation 2011;124:2822–8. [DOI] [PubMed] [Google Scholar]
- [9].Kobayashi T, Saji T, Otani T, et al. Efficacy of immunoglobulin plus prednisolone for prevention of coronary artery abnormalities in severe Kawasaki disease (RAISE study): a randomised, open-label, blinded-endpoints trial. Lancet 2012;379:1613–20. [DOI] [PubMed] [Google Scholar]
- [10].Ogata S, Ogihara Y, Honda T, et al. Corticosteroid pulse combination therapy for refractory Kawasaki disease: a randomized trial. Pediatrics 2012;129:e17–23. [DOI] [PubMed] [Google Scholar]
- [11].Tremoulet AH, Jain S, Jaggi P, et al. Infliximab for intensification of primary therapy for Kawasaki disease: a phase 3 randomised, double-blind, placebo-controlled trial. Lancet 2014;383:1731–8. [DOI] [PubMed] [Google Scholar]
- [12].Galeotti C, Kaveri SV, Cimaz R, et al. Predisposing factors, pathogenesis and therapeutic intervention of Kawasaki disease. Drug Discov Today 2016;21:1850–7. [DOI] [PMC free article] [PubMed] [Google Scholar]
- [13].Egami K, Muta H, Ishii M, et al. Prediction of resistance to intravenous immunoglobulin treatment in patients with Kawasaki disease. J Pediatr 2006;149:237–40. [DOI] [PubMed] [Google Scholar]
- [14].Kobayashi T, Inoue Y, Takeuchi K, et al. Prediction of intravenous immunoglobulin unresponsiveness in patients with Kawasaki disease. Circulation 2006;113:2606–12. [DOI] [PubMed] [Google Scholar]
- [15].Sano T, Kurotobi S, Matsuzaki K, et al. Prediction of non-responsiveness to standard high-dose gamma-globulin therapy in patients with acute Kawasaki disease before starting initial treatment. Eur J Pediatr 2007;166:131–7. [DOI] [PubMed] [Google Scholar]
- [16].Sleeper LA, Minich LL, McCrindle BM, et al. Evaluation of Kawasaki disease risk-scoring systems for intravenous immunoglobulin resistance. J Pediatr 2011;158: 831-35.e3. [DOI] [PMC free article] [PubMed] [Google Scholar]
- [17].Fu PP, Du ZD, Pan YS. Novel predictors of intravenous immunoglobulin resistance in Chinese children with Kawasaki disease. Pediatr Infect Dis J 2013;32:e319–23. [DOI] [PubMed] [Google Scholar]
- [18].Ha KS, Lee J, Jang GY, et al. Value of neutrophil-lymphocyte ratio in predicting outcomes in Kawasaki disease. Am J Cardiol 2015;116:301–6. [DOI] [PubMed] [Google Scholar]
- [19].Kawamura Y, Takeshita S, Kanai T, et al. The combined usefulness of the neutrophil-to-lymphocyte and platelet-to-lymphocyte ratios in predicting intravenous immunoglobulin resistance with Kawasaki disease. J Pediatr 2016;178: 281-84 e1. [DOI] [PubMed] [Google Scholar]
- [20].Takeshita S, Kanai T, Kawamura Y, et al. A comparison of the predictive validity of the combination of the neutrophil-to-lymphocyte ratio and platelet-to-lymphocyte ratio and other risk scoring systems for intravenous immunoglobulin (IVIg)-resistance in Kawasaki disease. PLoS One 2017;12:e0176957. [DOI] [PMC free article] [PubMed] [Google Scholar]
- [21].Deeks JJ. Systematic reviews in health care: systematic reviews of evaluations of diagnostic and screening tests. BMJ 2001;323:157–62. [DOI] [PMC free article] [PubMed] [Google Scholar]
- [22].Moher D, Liberati A, Tetzlaff J, et al. Preferred reporting items for systematic reviews and meta-analyses: the PRISMA statement. PLoS medicine 2009;6:e1000097. [DOI] [PMC free article] [PubMed] [Google Scholar]
- [23].Whiting P, Rutjes AW, Reitsma JB, et al. The development of QUADAS: a tool for the quality assessment of studies of diagnostic accuracy included in systematic reviews. BMC Med Res Methodol 2003;3:25. [DOI] [PMC free article] [PubMed] [Google Scholar]
- [24].Glas AS, Lijmer JG, Prins MH, et al. The diagnostic odds ratio: a single indicator of test performance. J Clin Epidemiol 2003;56:1129–35. [DOI] [PubMed] [Google Scholar]
- [25].Moses LE, Shapiro D, Littenberg B. Combining independent studies of a diagnostic test into a summary ROC curve: data-analytic approaches and some additional considerations. Stat Med 1993;12:1293–316. [DOI] [PubMed] [Google Scholar]
- [26].Zamora J, Abraira V, Muriel A, et al. Meta-DiSc: a software for meta-analysis of test accuracy data. BMC Med Res Methodol 2006;6:31. [DOI] [PMC free article] [PubMed] [Google Scholar]
- [27].Deeks JJ, Macaskill P, Irwig L. The performance of tests of publication bias and other sample size effects in systematic reviews of diagnostic test accuracy was assessed. J Clin Epidemiol 2005;58:882–93. [DOI] [PubMed] [Google Scholar]
- [28].Higgins JP, Thompson SG. Quantifying heterogeneity in a meta-analysis. Stat Med 2002;21:1539–58. [DOI] [PubMed] [Google Scholar]
- [29].Xue LJ, Wu R, Du GL, et al. Effect and Safety of TNF Inhibitors in Immunoglobulin-Resistant Kawasaki Disease: a Meta-analysis. Clin Rev Allergy Immunol 2017;52:389–400. [DOI] [PubMed] [Google Scholar]
- [30].Cho HJ, Bak SY, Kim SY, et al. High neutrophil: lymphocyte ratio is associated with refractory Kawasaki disease. Pediatr Int 2017;59:669–74. [DOI] [PubMed] [Google Scholar]
- [31].Chantasiriwan N, Silvilairat S, Makonkawkeyoon K, et al. Predictors of intravenous immunoglobulin resistance and coronary artery aneurysm in patients with Kawasaki disease. Paediatr Int Child Health 2018;38:209–12. [DOI] [PubMed] [Google Scholar]
- [32].Chen Y, Hua Y, Zhang C, et al. Neutrophil-to-lymphocyte ratio predicts intravenous immunoglobulin-resistance in infants under 12-months old with Kawasaki disease. Front Pediatr 2019;7:81. [DOI] [PMC free article] [PubMed] [Google Scholar]
- [33].Ayusawa M, Sonobe T, Uemura S, et al. Revision of diagnostic guidelines for Kawasaki disease (the 5th revised edition). Pediatr Int 2005;47:232–4. [DOI] [PubMed] [Google Scholar]
- [34].Miura M, Kobayashi T, Kaneko T, et al. Association of severity of coronary artery aneurysms in patients with Kawasaki disease and risk of later coronary events. JAMA Pediatr 2018;172:e180030. [DOI] [PMC free article] [PubMed] [Google Scholar]
- [35].Kim HK, Oh J, Hong YM, et al. Parameters to guide retreatment after initial intravenous immunoglobulin therapy in kawasaki disease. Korean Circ J 2011;41:379–84. [DOI] [PMC free article] [PubMed] [Google Scholar]
- [36].Kuo HC, Liang CD, Wang CL, et al. Serum albumin level predicts initial intravenous immunoglobulin treatment failure in Kawasaki disease. Acta paediatrica 2010;99:1578–83. [DOI] [PubMed] [Google Scholar]
- [37].Lee SM, Lee JB, Go YB, et al. Prediction of resistance to standard intravenous immunoglobulin therapy in kawasaki disease. Korean Circ J 2014;44:415–22. [DOI] [PMC free article] [PubMed] [Google Scholar]
- [38].Park HM, Lee DW, Hyun MC, et al. Predictors of nonresponse to intravenous immunoglobulin therapy in Kawasaki disease. Korean J Pediatr 2013;56:75–9. [DOI] [PMC free article] [PubMed] [Google Scholar]
- [39].Baek JY, Song MS. Meta-analysis of factors predicting resistance to intravenous immunoglobulin treatment in patients with Kawasaki disease. Korean J Pediatr 2016;59:80–90. [DOI] [PMC free article] [PubMed] [Google Scholar]
- [40].Li X, Chen Y, Tang Y, et al. Predictors of intravenous immunoglobulin-resistant Kawasaki disease in children: a meta-analysis of 4442 cases. Eur J Pediatr 2018;177:1279–92. [DOI] [PMC free article] [PubMed] [Google Scholar]
- [41].Park JJ, Jang HJ, Oh IY, et al. Prognostic value of neutrophil to lymphocyte ratio in patients presenting with ST-elevation myocardial infarction undergoing primary percutaneous coronary intervention. Am J Cardiol 2013;111:636–42. [DOI] [PubMed] [Google Scholar]
- [42].de Jager CP, van Wijk PT, Mathoera RB, et al. Lymphocytopenia and neutrophil-lymphocyte count ratio predict bacteremia better than conventional infection markers in an emergency care unit. Crit care 2010;14:R192. [DOI] [PMC free article] [PubMed] [Google Scholar]
- [43].Gunes A, Ece A, Sen V, et al. Correlation of mean platelet volume, neutrophil-to-lymphocyte ratio, and disease activity in children with juvenile idiopathic arthritis. Int J Clin Exp Med 2015;8:11337–41. [PMC free article] [PubMed] [Google Scholar]
- [44].Shendre A, Wiener HW, Zhi D, et al. High-density genotyping of immune loci in Kawasaki disease and IVIG treatment response in European-American case-parent trio study. Genes Immun 2014;15:534–42. [DOI] [PMC free article] [PubMed] [Google Scholar]
- [45].Shrestha S, Wiener HW, Olson AK, et al. Functional FCGR2B gene variants influence intravenous immunoglobulin response in patients with Kawasaki disease. J Allergy Clin Immunol 2011;128:677–80. [DOI] [PMC free article] [PubMed] [Google Scholar]
- [46].Demir F, Karadeniz C, Ozdemir R, et al. Usefulness of neutrophil to lymphocyte ratio in prediction of coronary artery lesions in patients with Kawasaki disease. Balkan Med J 2015;32:371–6. [DOI] [PMC free article] [PubMed] [Google Scholar]
Associated Data
This section collects any data citations, data availability statements, or supplementary materials included in this article.