Abstract
Esterases catalyze the hydrolysis of esters to form a carboxylic acid and alcohol. These enzymes play a key role in both the detoxification of xenobiotic compounds and the metabolism of drugs and prodrugs. Numerous fluorogenic probes have been developed to monitor esterase activity. Most are based on an aromatic alcohol, and the others are based on an aromatic acid. These restrictions leave unexplored the specificity of esterases for aliphatic esters. Here, we report on the use of esters of thiopheneacetic acid coupled with the luminescence of terbium(III) as the basis for a continuous assay of esterase activity. This probe allows for wide variation of the alcohol moiety and the detection of its hydrolysis at sub-micromolar concentrations. The assay verifies steady-state kinetic parameters for catalysis by pig liver esterase from either initial rates or the integration of progress curves, and its utility is evident with unpurified esterases in bacterial and human cell lysates.
Graphical Abstract

Esterases (EC 3.1.1.X), found throughout plants, animals, and microorganisms, are a diverse subgroup of the α,β-hydrolase fold class of enzymes that catalyze the hydrolysis of an ester to a carboxylic acid and an alcohol. Many act on not only a wide array of esters but also amides, thioesters, phosphoric acid esters, acid anhydrides, and even a limited number of carbamates. Their true substrate scope remains unclear.1,2 Regardless, this broad substrate tolerance grants esterases the ability to detoxify and eliminate xenobiotic compounds, and in that context their promiscuity is suspected to bestow an evolutionary advantage.3 From a therapeutic perspective, this promiscuity enables the use of ester prodrugs in which a carboxylate-containing drug is masked as an ester to improve permeability and then unmasked by esterase-mediated hydrolysis to generate the active drug.4 Many drugs employ this strategy, including the antiviral oseltamivir (Tamiflu®), the antihypertensive enalapril (Vasotec®), and the thrombin inhibitor dabigatran etexilate (Pradaxa®).4–6 Esterases are also employed synthetically for chiral resolution, and their industrial uses include catalyzing hydrolysis and transesterification reactions of a variety of substrates.7
Given the utility of esterases, many strategies have been developed to probe esterase activity. The majority of continuous assays rely on a chromophoric alcohol core whose emission is quenched or shifted when conjugated to an acyl group but manifested upon hydrolysis (Figure 1A). Such probes have facilitated the discovery of orthogonal enzyme–ester pairs,8 esterase activity profiling,9 and development of structure–activity relationships of esterases,10 among many other applications.11 Although these probes allow for the variation of the acyl portion of the ester, the alcohol moiety is a large, essential component of the chromophore and thus invariant.
Figure 1.
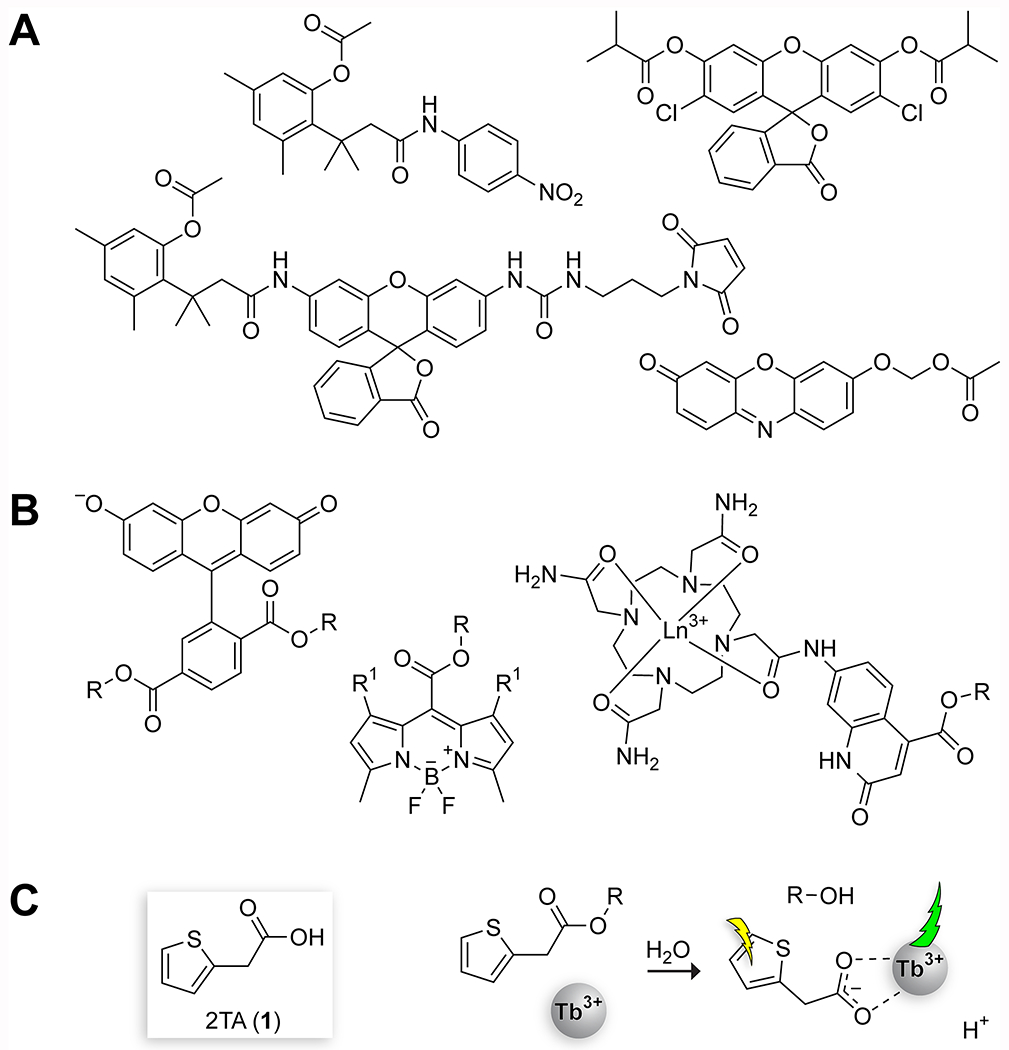
Probes to monitor esterase activity. (A) Probes developed in our laboratory that are based on a core chromophoric alcohol and a condensed acid.17–20 (B) Probes based on a core chromophoric acid and a condensed alcohol.13–15 (c) Basis for the probe developed herein. The coordination mode of the 2TA·Tb3+ complex in aqueous media is unknown.
Only a limited number of techniques have been described that allow for the free variation of the alcohol. The most established technique is the potentiometric monitoring of pH, where ester cleavage results in an increase of the pH of the medium and this increase acts as a proxy for esterase activity.12 This technique is applicable for essentially any ester type but is susceptible to interference from other processes that alter the pH and is limited in sensitivity. Hence, this method cannot be employed in a complex matrix such as cell lysate. Out of the vast array of probes for esterase activity, only three allow for variation of the alcohol moiety of the ester (Figure 1B).13–15 All derive from a sterically demanding aromatic acid. Consequently, the large-scale screening of esterase specificity continues to rely on the pH method.16
We sought to develop a probe for esterase activity that is based on an ester derived from the condensation of an unhindered aliphatic carboxylic acid and virtually any alcohol. Because fluorogenic molecules necessitate large, conjugated π systems to generate fluorescence, we chose to base our assay on terbium sensitization. Terbium is an oxophilic lanthanide that is poorly luminescent in aqueous solution. But upon coordination of a molecular “antenna”, terbium can generate an intense photoluminescent signal through transfer of excitation energy from the antenna to the terbium ion.21 Carboxylate-containing compounds are effective sensitizers but esters are not (excepting esters that form part of a β-diketone pair).22–26 The potential of terbium sensitization to act as the basis for an ester activity probe has been exploited only once—in the cleavage of an aromatic ester, which alters the ratio of two lanthanides within a complex.14 Here, we report on esters of a small acyl group, 2-thiopheneacetic acid (2TA; 1), as versatile substrates for a continuous spectrophotometric assay of esterase activity in which both components (acid and alcohol) can be aliphatic (Figure 1C).
MATERIALS AND METHODS
Chemicals.
All chemicals were obtained from Sigma–Aldrich (St. Louis, MO) or Fisher Scientific (Waltham, MA) and used without further purification unless noted otherwise.
Conditions.
All procedures were performed in air at ambient temperature (~22 °C) and pressure (1.0 atm) unless indicated otherwise.
Chemical synthesis.
Detailed conditions of the ester synthesis and associated spectroscopic data are reported in the Supporting Information.
Time-resolved Luminescence Measurements.
All time-resolved luminescence measurements were made using the time-resolved fluorescence setting on a Tecan Infinite M1000 plate reader and an opaque white or black flat-bottomed, half-volume, 96-well plate. Readings were made with a 50-μs lag time and 1000-μs integration time. Unless noted otherwise, measurements were made with λex = 285 nm (band-width: 7 nm) and λem = 547 nm (band-width: 5 nm). Intensities are reported in relative fluorescence units (RFU) or as a fold-change over the emission of a blank solution without analyte. Emission and excitation spectra were also acquired with this instrument using the above time-resolved settings.
Linearity and Limit of Detection.
The linearity of the assay was assessed through preparation of three independent stock solutions of 2TA at 175.8, 200.5, and 218.7 μM. Dilutions of these 3 stocks ranging from 1:40000 to 1:1333 were prepared in 100 μL of assay buffer. The emission from each solution was measured, and a plot of emission intensity versus concentration was constructed. The slope, intercept, and R2 value were determined. The limit of detection (LOD) was determined with eq 1,23 where μblank is the average emission of the blank sample, σblank is the standard deviation of the emission measurements of 3 blank solutions, b is the intercept of the calibration curve, and m is the slope of the calibration curve).
| (1) |
Job Plot.
The molar fraction of Tb3+ and 2TA was varied inversely so as to maintain a constant total molar concentration of 100 μM (e.g., 0 μM Tb3+ with 100 μM 2TA, 10 μM Tb3+ with 90 μM 2TA, etc.). As a control, the same samples were prepared without any 2TA, and the luminescence intensity of these blank samples was subtracted. The resulting plot was fitted to eq 2, where c is the molar response of the [Tb3+m2TAn] complex, χTb3+ is the mole fraction of Tb3+, m is the number of Tb3+ ions in the complex, and n is the number of 2TA molecules in the complex.27 The variables c, m, and n were fitted to eq 3 by nonlinear least squares regression using R software.28
| (2) |
The mole fraction of Tb3+ was then determined with eq 3.
| (3) |
Apparent Kd Determination.
The affinity of Tb3+ for 2TA in Triton X-100–tri-n-octylphosphine oxide (TOPO) micellar medium was estimated in 5 mM HEPES–NaOH buffer, pH 7.4, containing 2TA (50 μM), TOPO (350 μM), Triton X-100 (0.1% w/v), and TbCl3 (25–8000 μM). Each 100-μL sample was prepared in triplicate, and its emission intensity determined. The data were fitted to the Hill equation (eq 4) and eq 5, where h is the Hill coefficient, I is the emission intensity at a given concentration, Imin is the minimum emission intensity, Imax is the maximum emission intensity, and ΔF is the fraction of 2TA that is bound to Tb3+, by nonlinear regression using R software.
| (4) |
| (5) |
Enzyme Kinetics.
Pig liver esterase (PLE) from Sigma–Aldrich (product E3019) was prepared as per the manufacturer’s recommendations to a concentration of 300 nM, then diluted to the desired final concentration of 15 nM. Its actual concentration was determined by UV–vis spectroscopy using an extinction coefficient of 87110 M−1cm−1 at 280 nm and molecular mass of 62 kDa, which are based on UniProt sequence Q29550. Note that the purity of this commercial preparation was not determined. The values of steady-state kinetic parameters that are based on this enzyme concentration are internally consistent and comparable to values published previously, but could be imprecise due to impurity of the commercial preparation.
The substrate was added at nominal levels varying from 10 μM to 150 μM. Progress curves were acquired, corrected for instrument drift through comparison to an enzyme-containing blank, baseline-subtracted, and then converted to concentrations using the slope determined from a standard curve. Kinetic parameters were determined from initial rates (where <10% of the substrate was consumed). From a plot of initial rates Vo at substrate concentration [S]0, a fit was constructed to the Michaelis–Menten equation (eq 6) by nonlinear least squares regression using R software. In eq 6, Vo is the initial velocity, [S]0 is the added substrate concentration, KM is the Michaelis constant, Vmax = kcat[E] is the maximum velocity, [E] is the enzyme concentration, and kcat is the apparent first-order rate constant. (See the Supporting Information for exact parameters and the R script.)
| (6) |
In addition, the integrated Michaelis–Menten equation (eq 7) was used to determine the kinetic parameters directly from the progress curves. In eq 7, [P] is the product concentration at time t, and W represents the LambertW function.29,30 Three progress curves at the same nominal substrate concentration (which was at least twofold greater than the expected value of KM) were averaged together. The data at ≤80% substrate consumption31 was then transferred into R software, and fitted to eq 7 by using the script in the Supporting Information.
| (7) |
Esterase Assay in a Bacterial Cell Lysate.
Bacillus subtilis OI1085 was inoculated at 1% v/v into 15 mL of Luria–Bertani medium from an overnight culture. The culture was grown to log phase (OD600 nm = 0.4–0.8) then removed from the shaker. Cells were pelleted by centrifugation at 3260g for 3 min, and the supernatant was removed. The cell pellet was resuspended in 15 mL of water, then pelleted again. The resulting pellet was resuspended in 1.5 mL of water (thereby concentrating the cells 10-fold), and 45 μL of this suspension was combined with 5 μL of ester substrate and 50 μL of 2× assay buffer (which was 10 mM HEPES–NaOH buffer, pH 7.4, containing 8 mM TbCl3, 700 μM TOPO, and 0.2% w/v Triton X-100), and the luminescence was then measured immediately. A blank solution lacking the analyte but including 45 μL of cell suspension, 5 μL of water, and 50 μL of 2× assay buffer was also prepared in triplicate. A calibration curve was prepared by combining 45 μL of cell suspension, a known amount of 2TA, 50 μL of 2× assay buffer, and water to a final volume of 100 μL. The luminescence of samples, blanks, and calibration-curve solutions was then monitored. The luminescence of the sample solutions was normalized against that of the blank solutions, and the concentration of liberated 2TA in the sample solutions was determined by using the slope of the calibration curve.
Esterase Assay in a Mammalian Cell Lysate.
HEK-293T cells (ATCC CR3216) were grown at 37 °C in DMEM until >85% confluent. The cells were then washed with PBS, trypsinized, pelleted by centrifugation at 180g for 3 min, resuspended in Hank’s Balanced Salt Solution (HBSS), and then pelleted again. The cells were then resuspended a final time in HBSS to a density of 107 cells per mL. Triton X-100 was added to a final concentration of 1% w/v, and the cells were placed on ice for 45 min to lyse. Ester substrate was then added. At the indicated time points, 10 μL of the mixture was removed and combined with 40 μL of water and 50 μL of 2× assay buffer (which was 10 mM HEPES–NaOH buffer, pH 7.4, containing 8 mM TbCl3, 700 μM TOPO, and 0.2% w/v Triton X-100), and the luminescence was then measured immediately. For both the HBSS and cell-lysate solutions, triplicate blank samples lacking the substrate were prepared concurrently and treated in the same manner to normalize for instrument drift.
RESULTS AND DISCUSSION
Terbium Sensitization of 2TA.
A solid-state complex of Tb3+ and 2TA in which 2TA acts as a bridging molecule between two lanthanide ions has been reported previously.32 This complex crystallizes in water and requires extensive heating to form, making it unsuitable to monitor 2TA in aqueous solution. Nevertheless, we reasoned that the affinity of 2TA for Tb3+ might be sufficient for an assay of 2TA in aqueous solution after optimization of buffer type and concentration, surfactant type and concentration, and synergic agent concentration (Table S1; Figures S1–S5).33,34 The addition of a synergic agent has been reported to increase the intensity of the emission by an order of magnitude or greater by displacing water in the lanthanide coordination sphere and thereby obviating pathways of nonradiative decay.35 TOPO was chosen as the synergic agent because TOPO is compatible with the inclusion of surfactants and is effective at neutral pH.34 The optimized assay condition is 5 mM HEPES–NaOH buffer, pH 7.4, containing TbCl3 (4 mM), Triton X-100 (0.1% w/v), and TOPO (350 μM), and our analyses suggest that this condition lies in a robust area in which small variations in the medium do not compromise assay sensitivity. Excitation is performed at 285 nm, as reported previously for Triton X-100–TOPO complexes with terbium,36 and the strong d–f transition at 547 nm serves as the emission wavelength. The derivation of this optimized condition is described below.
To determine whether esters of 2TA are effective sensitizers of Tb3+, we compared the properties of 2TA (1) and its ethyl ester, ethyl 2-thiopheneacetate (Et-2TA; 2). We began by comparing the excitation and emission spectra of 150 μM solutions of 2TA and Et-2TA in the assay buffer solution (Figure 2A). The excitation spectra (monitoring λem at 547 nm) were markedly different, with an intense, broad peak observed in the 2TA spectrum centered around 278 nm and an additional local maximum peak at 285 nm, whereas the Et-2TA spectrum overlapped completely with a “blank” excitation spectrum containing only the assay buffer. Based on these spectra, we used 285 nm as the excitation wavelength for the method with a broad bandwidth of 7 nm to take advantage of the broadness of the peak. The emission spectra (λex = 285 nm) of all samples showed the characteristic terbium luminescence peaks assignable to d–f trasitions.37 Once again, the blank and the Et-2TA spectra overlapped, suggesting that Et-2TA does not sensitize Tb3+.
Figure 2.
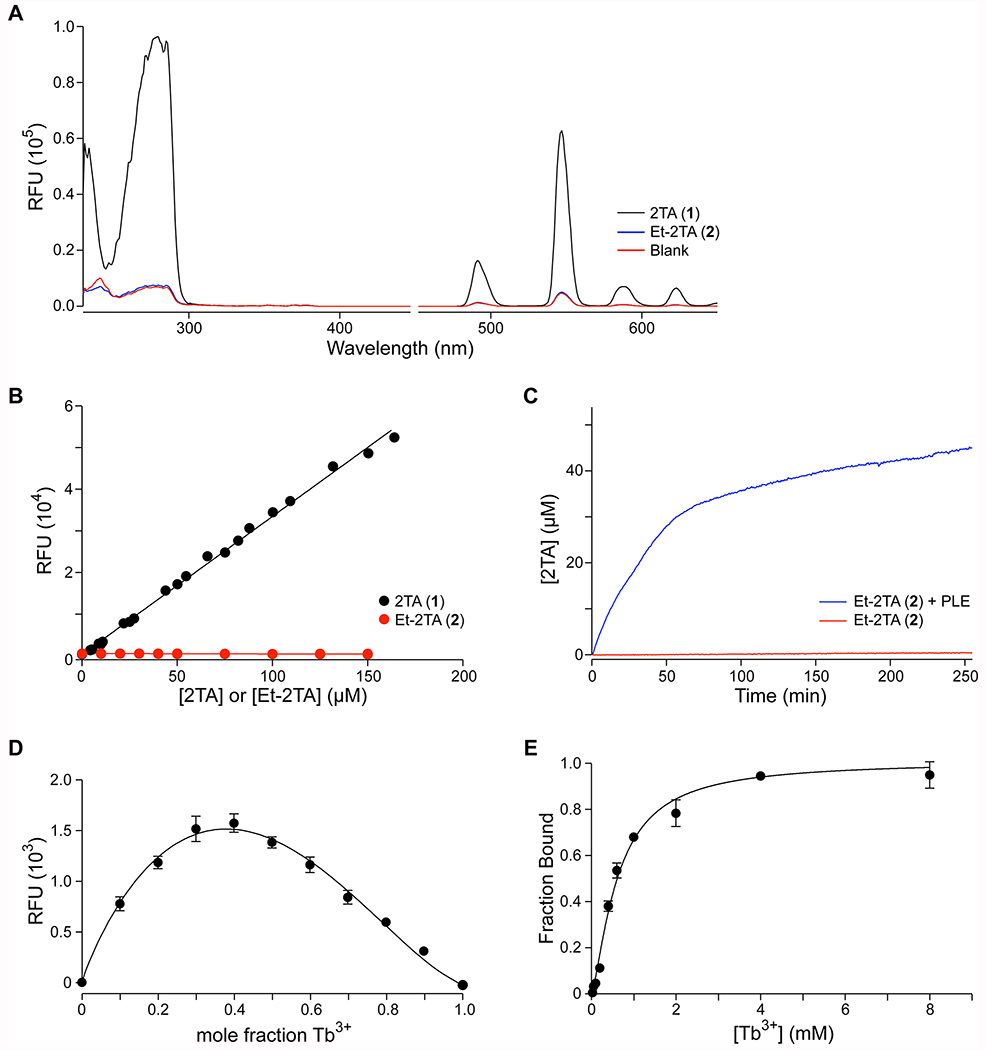
Using Tb3+ complexation to monitor the cleavage of 2TA esters. (A) Excitation (<450 nm) and emission (>450 nm) spectra of 2TA and Et-2TA (150 μM) in 5 mM HEPES–NaOH buffer, pH 7.4, containing TbCl3 (4 mM), Triton X-100 (0.1% w/v), and TOPO (350 μM). (B) Dependence of emission intensity on the concentration of 2TA (slope = 326; R2 = 0.9966) or Et-2TA (slope = −0.9; R2 = 0.9101). (C) Time-dependence of the effect of PLE on the production of 2TA from Et-2TA. (D) Job Plot of 2TA and Tb3+ (χ = 0.38 ± 0.03). (E) Titration of 2TA (50 μM) with Tb3+; data fitted with eq 4 (apparent Kd = 620 ± 24 μM; h = 1.40 ± 0.07). Values in panels D and E are the mean ± SD from triplicate measurements.
Next, we assessed the impact of concentration of the ester versus carboxylate analytes at a range of concentrations. The emission intensity at 547 nm of 2TA was linear from 4 to 164 μM 2TA (R2 = 0.9966, slope = 326.45) with a limit of detection (LOD) of 0.6 μM (Figure 2B). Across a range of concentration from 5 to 150 μM, Et-2TA actually showed a slight decrease in intensity (R2 = 0.9101, slope = −0.9), which was likely due to the ester absorbing some of the excitation energy but not transferring it to the terbium. As a final proof of concept, we compared the intensity of the emission of 45 μM Et-2TA over the course of 4 h, either with or without the addition of 28 nM PLE and converting the RFU reading to [2TA] using a calibration curve. We observed a rapid increase to a plateau in the intensity when the PLE was added, consistent with enzymatic hydrolysis of the ester substrate. Over the same time course, Et-2TA showed conversion below the limit of detection of the method (i.e., <0.6 μM).
The change in emission intensity with 2TA concentration was observed to be linear for at least 2 h after sample preparation (Figure S6). The change was also demonstrated to be linear in the presence of 50 mM NaCl or HBSS, suggesting that additives necessary for enzyme stability are tolerable (Figure S7). The slope is, however, lower as the solute concentration increases, corresponding to an increase in LOD. This lower slope is consistent with previous work and is likely due to either the absorbance of buffer additives or competition with other ions.25
Binding studies were used to determine the stoichiometry of the complex and the affinity of 2TA for Tb3+. The Job plot maximum was at a mole fraction of Tb3+ of 0.4 (Figure 2D), which is consistent with a complex containing 2 Tb3+ ions and 3 2TA ligands. A nonlinear regression fit of the data confirmed this maximum, indicating that the maximum is at a Tb3+ mole fraction of χ = 0.38 ± 0.03. (See the Supporting Information for a full description of the methodology.) This fit suggests that the 2TA acts as a bridging ion between two terbium(III) ions, consistent with previous studies of aliphatic carboxylates in conjugation with Tb3+.26,32 The binding curve of 50 μM 2TA in assay buffer titrated with Tb3+ was used to assess the affinity of 2TA for Tb3+. Its sigmoidal shape suggests cooperative binding (Figure 2E), which is consistent with 2TA bridging two Tb3+ ions.
A fit to eq 4 yielded an apparent Kd value of (620 ± 24) μM and a Hill coefficient of h = 1.40 ± 0.07, providing additional support for cooperative binding of Tb3+ ions. Although the dissociation constant is rather high, the use of 4 mM Tb3+ in the assay buffer ensures saturation of the available 2TA and maintenance of a strong signal even in situations in which other molecules also bind to the Tb3+ ion.
Alcohol Moiety Permissibility.
The above experiments confirmed that a simple ethyl ester was sufficient to rupture the required contact(s) of 2TA for terbium sensitization. Still, terbium is oxophilic and can bind to β-diketone moieties.38 We therefore constructed additional esters to determine the impact of various alcohol moieties on the assay. We anticipated that cyclohexyl ester 3 would peform similarly to ethyl ester 2, but we were uncertain whether hydroxyacetophenone ester 4 would bind Tb3+ as an ester due to its ketone moiety. Finally, we considered the diketo phenol ester 5, which contains a β-diketone moiety in the alcohol portion that will bind to Tb3+. Comparison of the excitation and emission spectra showed that esters 2–4 did not bind Tb3+ (Figure 3B). The changes in emission intensity with equimolar concentrations of 2TA and alcohol were linear for at least 2 h after sample preparation (Figure S8), though the emission intensity for 2TA plus hydroxyacetophenone (which is the basis for ester 4) was linear only through 75 μM (Table S2; Figure S8).
Figure 3.
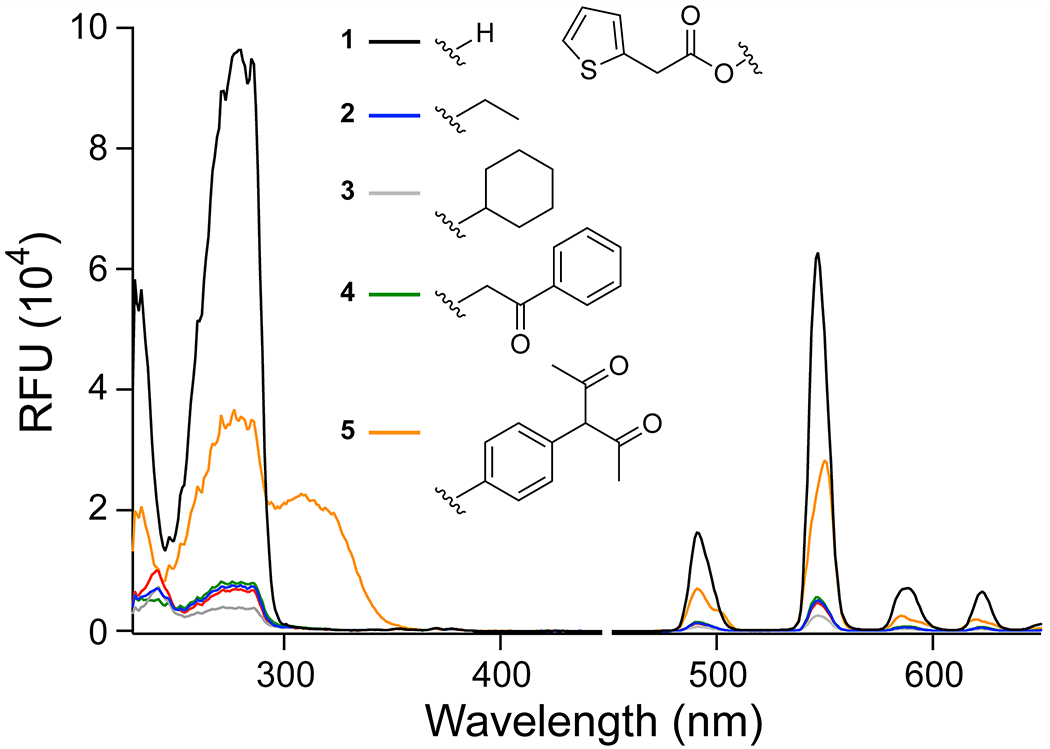
Spectra showing the effect of the alcohol moiety on the excitation (<450 nm) and emission (>450 nm) of 2TA (1) and its esters (2–5). Spectra were recorded in 5 mM HEPES–NaOH buffer, pH 7.4, containing 1–5 (150 μM), TbCl3 (4 mM), Triton X-100 (0.1% w/v), and TOPO (350 μM).
The behavior of ester 5 was distinct. Its excitation spectrum contained a unique maxima at 308 nm (Figure 3), suggesting that ester 5 forms a distinct complex with Tb3+. Incubation of this ester with PLE resulted in a decrease in emission intensity (Figure 4), likely because the liberated diketo moiety binds Tb3+ more tightly than does 2TA. The excitation and emission spectra of Tb3+ with the diketo phenol moiety alone confirmed that it does binds to Tb3+ independently of 2TA (Figure S9). Hence, we conclude that esters in which the liberated alcohol moiety binds to Tb3+ can be substrates for the assay but require independent calibration.
Figure 4.
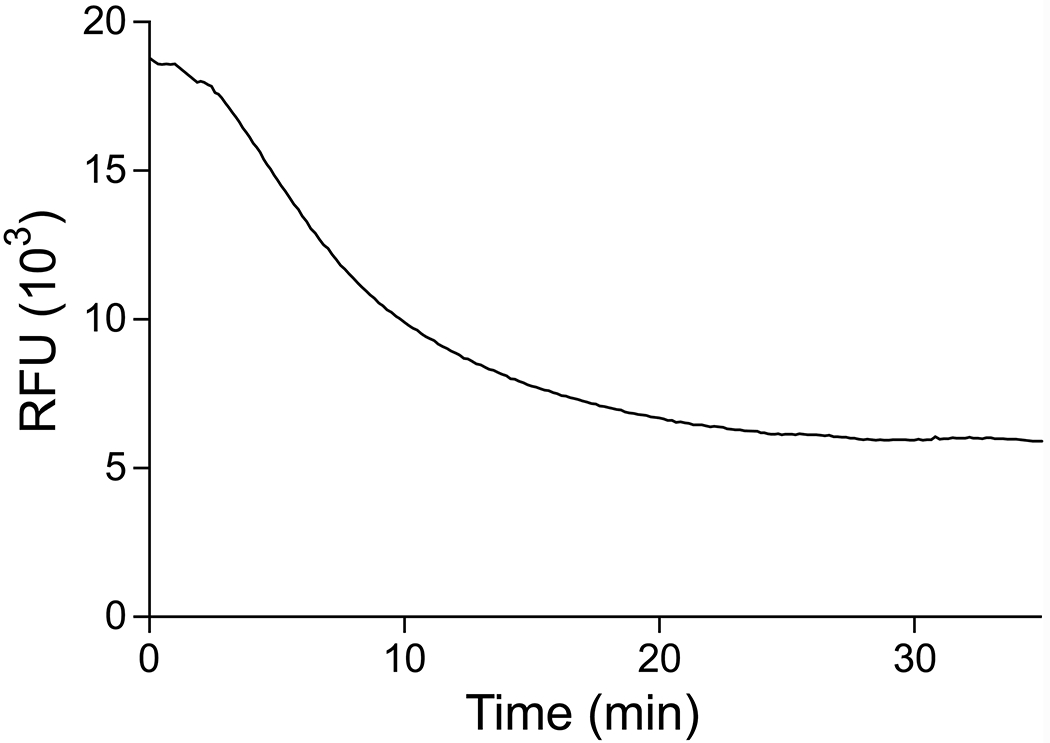
Time-course of emission intensity upon incubation of PLE and Tb3+ with ester 5, which yields an alcohol that binds to Tb3+. Data were recorded in 5 mM HEPES–NaOH buffer, pH 7.4, containing ester 5 (200 μM), TbCl3 (4 mM), PLE (560 nM), Triton X-100 (0.1% w/v), and TOPO (350 μM).
Enzyme Kinetics.
PLE is an esterase that obeys Michaelis–Menten kinetics,39 and has greater than 75% sequence identity with human liver carboxylesterase.1 We therefore used PLE to test the ability of the probe to report on steady-state kinetic parameters. The initial rate of the PLE-catalyzed hydrolysis of Et-2TA (2) was determined from progress curves generated from varying the ester concentrations from 7 to 196 μM and incubating with 28 nM PLE (Figure 5). Kinetic parameters were determined to be kcat = (1.05 ± 0.07) s−1 and KM = (30.2 ± 6.4) μM, and are in accord with those reported previously for fluorogenic substrates of PLE.19 Monitoring of the nonenzymatic hydrolysis of Et-2TA over 4 revealed no conversion of the substrate to product above the LOD (Figure S10).
Figure 5.
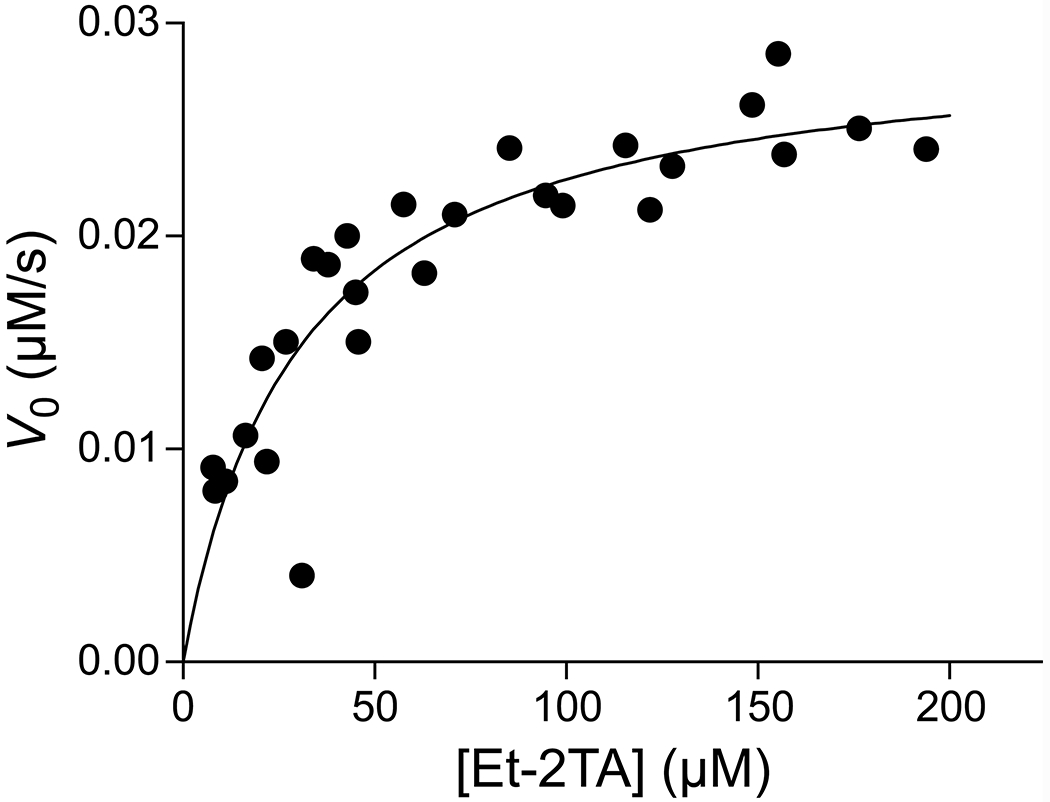
Graph of the initial rates used to determine steady-state kinetic parameters for the hydrolysis of Et-2TA (2) by PLE; kcat = (1.05 ± 0.07) s−1, KM = (30.2 ± 6.4) μM. Data were recorded in 5 mM HEPES–NaOH buffer, pH 7.4, containing 2 (7.84–194 μM), TbCl3 (4 mM), PLE (28.2 nM), Triton X-100 (0.1% w/v), and TOPO (350 μM).
The assay differentiates different PLE substrates, specifically, esters 2 and 3. Steady-state kinetic parameters for the PLE-catalyzed cleavage of both substrates were derived by fitting of the integrated Michaelis–Menten equation (Figure 6).40 The values were comparable to those from initial rates (Figure 5) as well as from the literature for the PLE-catalyzed cleavage of esters of primary and secondary alcohols.39 Notably, the parameters for ester 2 differed significantly from those for ester 3.
Figure 6.
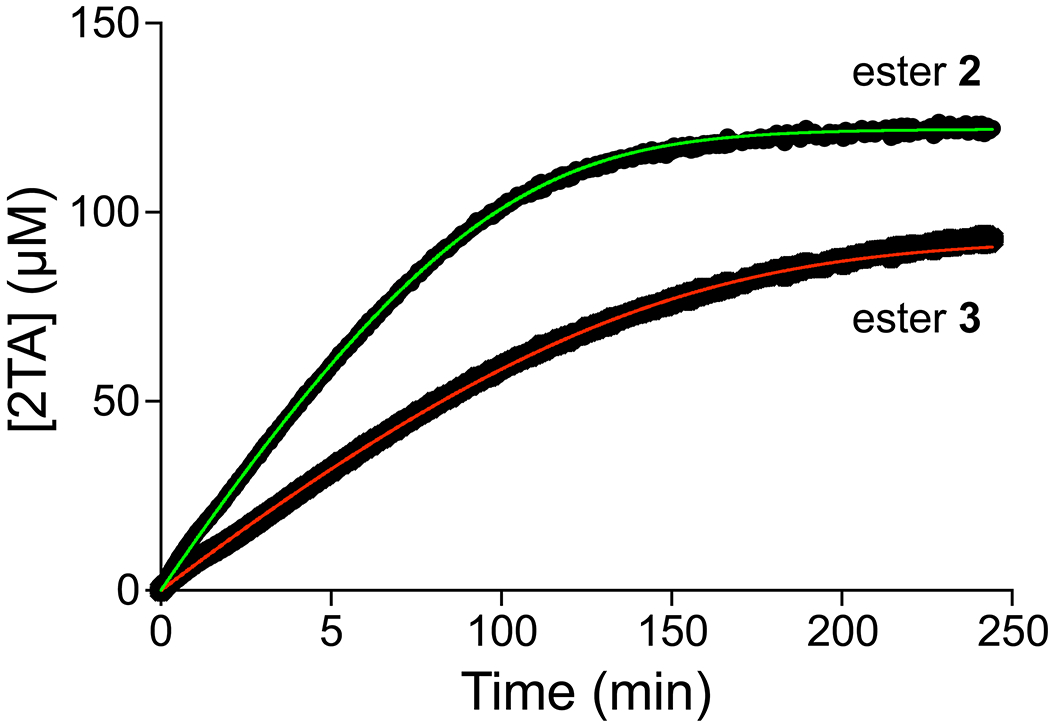
Time-course for the production of 2TA upon incubation of PLE and Tb3+ with ester 2 (kcat = 1.07 ± 0.01 s−1, KM = 45 ± 1 μM) or ester 3 (kcat = 0.58 ± 0.01 s−1, KM = 39 ± 1 μM). Emission intensity was recorded in 5 mM HEPES–NaOH buffer, pH 7.4, containing ester 2 or 3 (122 μM or 92.9 μM, respectively), TbCl3 (4 mM), PLE (27.4 nM), Triton X-100 (0.1% w/v), and TOPO (350 μM). Values are the average of three separate measurements.
Assays with Cell Lysates.
Finally, the assay was assessed for its ability to report on ester hydrolysis from unpurified enzymes. The change in emission intensity with 2TA concentration was observed to be linear in the presence of B. subtilis cell lysate (Figure S11). Moreover, B. subtilis lysate added to either 50 or 100 μM of Et-2TA demonstrated hydrolysis of 3.9 or 5.9 μM of that substrate, respectively, after 3 h (Figure 7). This hydrolysis rate is much faster than that of the uncatalyzed reaction, and indicates that the probe could be used to screen for ester hydrolysis in bacterial cell lysates.
Figure 7.
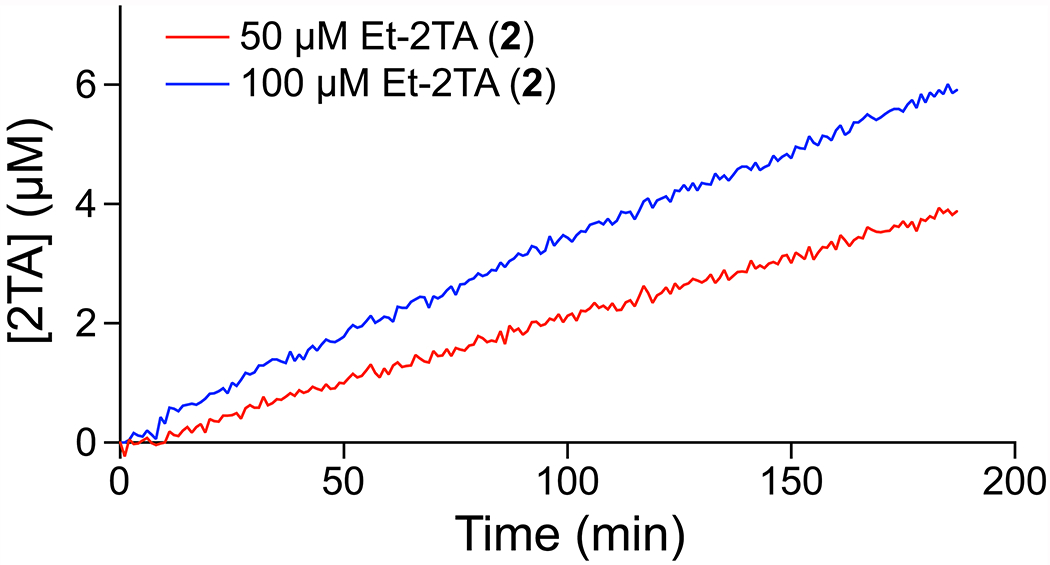
Time-course for the production of 2TA upon incubation of a B. subtilis cell lysate and Tb3+ with ester 2. Emission intensity was recorded in 5 mM HEPES–NaOH buffer, pH 7.4, containing ester 2 (50 or 100 μM), TbCl3 (4 mM), lysate, Triton X-100 (0.1% w/v), and TOPO (350 μM).
The assay was also able to detect esterase activity in a mammalian cell lysate. HEK-293T cells have been reported to have low esterase activity relative to other mammalian cells strains, such as Hep G2 cells, and have been used as hosts for overexpression and activity assay of human esterases.41,42 Thus, the detection of esterase activity in a HEK-293T cell lysate should demonstrate applicability of the assay to a wide array of mammalian cells. The change in emission intensity with 2TA concentration was observed to be linear in the presence of a HEK-293T cell lysate (Figure S12), though the dependence of 2TA concentration was less than that in the buffer alone, indicating some interference from cellular components. After 4 h of incubation, the amount of cleavage could not be distinguished clearly from that in the absence of lysate. After a 21-h incubation, however, ester hydrolysis was significantly greater in the sample containing cell lysate (Figure 8).
Figure 8.
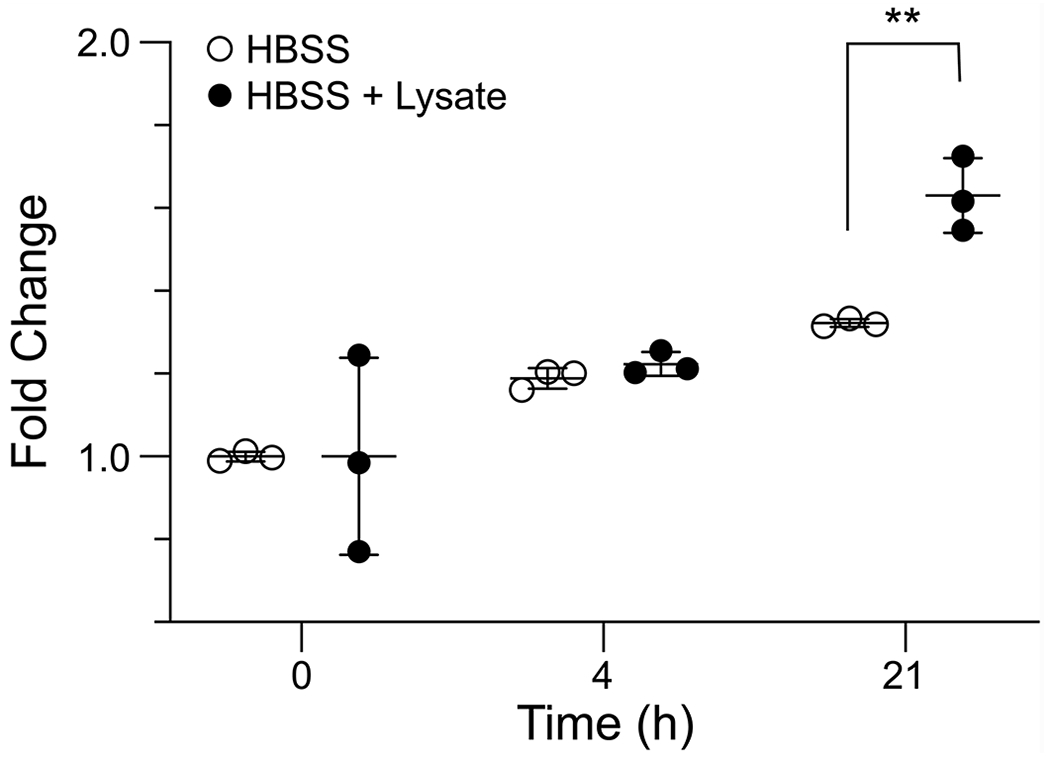
Bar graph for the change in emission intensity at 547 nm upon incubation of a HEK-293T cell lysate and Tb3+ in the presence of ester 2. Emission intensity was recorded in 5 mM HEPES–NaOH buffer, pH 7.4, containing ester 2 (50 μM), TbCl3 (4 mM), lysate, Triton X-100 (0.1% w/v), and TOPO (350 μM). Samples were monitored in triplicate. **, P-value of 0.004 determined by using Student’s t-test.
Conclusions.
Esterases are known to play important roles in biology and pharmacology. Extant continuous assays of esterase activity are, however, limited in that one or the other component of the ester substrate (that is, the acid or alcohol) must be aromatic. Here, we have introduced the first assay in which both components can be small and aliphatic. The new assay is based on the sensitization of Tb3+ upon production of 2-thiopheneacetic acid by esterase catalysis. The carboxylate product of ester hydrolysis induces a photoluminescent response that can be evaluated with a standard fluorometer with sensitivity in the sub-micromolar range. The acyl moiety of this probe is small and thus compatible with many esterases. The assay can be used to derive steady-state kinetic parameters from either initial rates or the integration of progress curves, and can discriminate between ester substrates. In addition, alcohol moieties that absorb at the excitation wavelength are still usable in the assay, as are esters containing alcohol moieties that chelate Tb3+ independently. Finally, interference from bacterial or human cell lysates affects the sensitivity of the assay only minimally.
Supplementary Material
ACKNOWLEDGMENTS
We are grateful to H. R. Kilgore (Massachusetts Institute of Technology) for helpful discussions. M.A.A.R. was supported by the Undergraduate Research Opportunities Program (UROP) at the Massachusetts Institute of Technology. This work was supported by the Merkin Institute for Transformative Technologies in Healthcare. Additional infrastructure was provided by Grant R01 GM044783 (NIH).
Footnotes
Supporting Information
Details of method optimization and chemical syntheses, Tables S1 and S2, Figures S1–S12, and scripts for nonlinear regressions in R (PDF)
The authors declare no competing financial interest.
REFERENCES
- (1).Satoh T; Hosokawa M Structure, function and regulation of carboxylesterases. Chem. Biol. Interact 2006, 162, 195–211. [DOI] [PubMed] [Google Scholar]
- (2).Hosokawa M Structure and catalytic properties of carboxylesterase isozymes involved in metabolic activation of prodrugs. Molecules 2008, 13, 412–431. [DOI] [PMC free article] [PubMed] [Google Scholar]
- (3).Testa B; Mayer JM The hydrolysis of carboxylic acid ester prodrugs In Hydrolysis in Drug and Prodrug Metabolism, Verlag Helvetica Chimica Acta: Zurich, Switzerland, 2003; pp 419–534. [Google Scholar]
- (4).Lavis LD Ester bonds in prodrugs. ACS Chem. Biol 2008, 3, 203–206. [DOI] [PubMed] [Google Scholar]
- (5).Huttunen KM; Raunio H; Rautio J Prodrugs—from serendipity to rational design. Pharmacol. Rev 2011, 63, 750–771. [DOI] [PubMed] [Google Scholar]
- (6).Rautio J; Meanwell NA; Di L; Hageman MJ The expanding role of prodrugs in contemporary drug design and development. Nat. Rev. Drug Discov 2018, 17, 559–587. [DOI] [PubMed] [Google Scholar]
- (7).Panda T; Gowrishankar BS Production and applications of esterases. Appl. Microbiol. Biotechnol 2005, 67, 160–169. [DOI] [PubMed] [Google Scholar]
- (8).Tian L; Yang Y; Wysocki LM; Arnold AC; Hu A; Ravichandran B; Sternson SM; Looger LL; Lavis LD Selective esterase–ester pair for targeting small molecules with cellular specificity. Proc. Natl. Acad. Sci. USA 2012, 109, 4756–4761. [DOI] [PMC free article] [PubMed] [Google Scholar]
- (9).Tallman KR; Levine SR; Beatty KE Profiling esterases in Mycobacterium tuberculosis using far-red fluorogenic substrates. ACS Chem. Biol 2016, 11, 1810–1815. [DOI] [PMC free article] [PubMed] [Google Scholar]
- (10).White A; Koelper A; Russell A; Larsen EM; Kim C; Lavis LD; Hoops GC; Johnson RJ Fluorogenic structure activity library pinpoints molecular variations in substrate specificity of structurally homologous esterases. J. Biol. Chem 2018, 293, 13851–13862. [DOI] [PMC free article] [PubMed] [Google Scholar]
- (11).Chyan W; Raines RT Enzyme-activated fluorogenic probes for live-cell and in vivo imaging. ACS Chem. Biol 2018, 13, 1810–1823. [DOI] [PMC free article] [PubMed] [Google Scholar]
- (12).Janes LE; Lowendahl AC; Kazlauskas RJ Quantitative screening of hydrolase libraries using pH indicators: Identifying active and enantioselective hydrolases. Chem.—Eur. J 1998, 4, 2324–2331. [Google Scholar]
- (13).Ueno T; Urano Y; Setsukinai K.-i.; Takakusa H; Kojima H; Ohkubo K; Fukuzumi S; Nagano T. Rational principles for modulating fluorescence properties of fluorescein. J. Am. Chem. Soc 2004, 126, 14079–14085. [DOI] [PubMed] [Google Scholar]
- (14).Tremblay MS; Halim M; Sames D Cocktails of Tb3+ and Eu3+ complexes: A general platform for the design of ratiometric optical probes. J. Am. Chem. Soc 2007, 129, 7570–7577. [DOI] [PubMed] [Google Scholar]
- (15).Kim S; Kim H; Choi Y; Kim Y A new strategy for fluorogenic esterase probes displaying low levels of non-specific hydrolysis. Chem. Eur. J 2015, 21, 9645–9649. [DOI] [PubMed] [Google Scholar]
- (16).Martínez-Martínez M; Coscolín C; Santiago G; Chow J; Stogios PJ; Bargiela R; Gertler C; Navarro-Fernández J; Bollinger A; Thies S; Méndez-García C; Popovic A; Brown G; Chernikova TN; García-Moyano A; Bjerga GEK; Pírez-Garcia P; Hai T; Del Pozo MV; Stokke R; Steen IH; Cui H; Xu X; Nocek BP; Alcaide M; Distaso M; Mesa V; Peláez AI; Sánchez J; Buchholz PCF; Pleiss J; Fernández-Guerra A; Glöckner FO; Golyshina OV; Yakimov MM; Savchenko A; Jaeger K-E; Yakunin AF; Streit WR; Golyshin PN; Guallar V; Ferrer M; The Inmare C Determinants and prediction of esterase substrate promiscuity patterns. ACS Chem. Biol 2018, 13, 225–234. [DOI] [PubMed] [Google Scholar]
- (17).Lavis LD; Chao T-Y; Raines RT Fluorogenic label for biomolecular imaging. ACS Chem. Biol 2006, 1, 252–260. [DOI] [PMC free article] [PubMed] [Google Scholar]
- (18).Levine MN; Lavis LD; Raines RT Trimethyl lock: A stable chromogenic substrate for esterases. Molecules 2008, 13, 204–211. [DOI] [PMC free article] [PubMed] [Google Scholar]
- (19).Lavis LD; Chao T-Y; Raines RT Synthesis and utility of fluorogenic acetoxymethyl ethers. Chem. Sci 2011, 2, 521–530. [DOI] [PMC free article] [PubMed] [Google Scholar]
- (20).Chyan W; Kilgore HR; Gold B; Raines RT Electronic and steric optimization of fluorogenic probes for biomolecular imaging. J. Org. Chem 2017, 82, 4297–4304. [DOI] [PMC free article] [PubMed] [Google Scholar]
- (21).Thibon A; Pierre VC Principles of responsive lanthanide-based luminescent probes for cellular imaging. Anal. Bioanal. Chem 2009, 394, 107–120. [DOI] [PubMed] [Google Scholar]
- (22).Taketatsu T Spectrophotofluorimetric determination of terbium, europium and samarium with pivaloyltrifluoroacetone and tri-n-octylphosphine oxide in micellar solution of nona-oxyethylene dodecyl ether. Talanta 1982, 29, 397–400. [DOI] [PubMed] [Google Scholar]
- (23).Arnaud N; Georges J Improved detection of salicylic acids using terbium-sensitized luminescence in aqueous micellar solutions of cetyltrimethylammonium chloride. Analyst 1999, 124, 1075–1078. [DOI] [PubMed] [Google Scholar]
- (24).Al-Kindy SM; Suliman FE Determination of ibuprofen in pharmaceutical formulations using time-resolved terbium-sensitized luminescence. Luminescence 2007, 22, 294–301. [DOI] [PubMed] [Google Scholar]
- (25).Esplin TL; Cable ML; Gray HB; Ponce A Terbium-macrocycle complexes as chemical sensors: Detection of an aspirin metabolite in urine using a salicylurate-specific receptor site. Inorg. Chem 2010, 49, 4643–4647. [DOI] [PubMed] [Google Scholar]
- (26).Marques LF; Cuin A; de Carvalho GSG; dos Santos MV; Ribeiro SJL; Machado FC Energy transfer process in highly photoluminescent binuclear hydrocinnamate of europium, terbium and gadolinium containing 1,10-phenanthroline as ancillary ligand. Inorganica Chim. Acta 2016, 441, 67–77. [Google Scholar]
- (27).Renny JS; Tomasevich LL; Tallmadge EH; Collum DB Method of continuous variations: Applications of Job plots to the study of molecular associations in organometallic chemistry. Angew. Chem., Int. Ed 2013, 52, 11998–12013. [DOI] [PMC free article] [PubMed] [Google Scholar]
- (28).R Core Team. R: A language and environment for statistical computing. R Foundation for Statistical Computing, Vienna, Austria, 2014. http://www.R-project.org/. [Google Scholar]
- (29).Corless RM; Gonnet GH; Hare DEG; Jeffrey DJ; Knuth DE On the Lambert W function. Adv. Comput. Math 1996, 5, 329–359. [Google Scholar]
- (30).Goličnik M On the Lambert W function and its utility in biochemical kinetics. Biochem. Eng. J 2012, 63, 116–123. [Google Scholar]
- (31).Liao F; Tian K-C; Yang X; Zhou Q-X; Zeng Z-C; Zuo Y-P Kinetic substrate quantification by fitting the enzyme reaction curve to the integrated Michaelis–Menten equation. Anal. Bioanal. Chem 2003, 375, 756–762. [DOI] [PubMed] [Google Scholar]
- (32).Cai L-Z; Chen W-T; Wang M-S; Guo G-C; Huang J-S Syntheses, structures and luminescent properties of four new 1D lanthanide complexes with 2-thiopheneacetic acid ligand. Inorg. Chem. Commun 2004, 7, 611–613. [Google Scholar]
- (33).Brittain HG Intermolecular energy transfer between lanthanide complexes in aqueous solution. 1. Transfer from terbium(III) to europium(III) complexes of pyridinecarboxylic acids. Inorg. Chem 1978, 17, 2762–2766. [Google Scholar]
- (34).Panigrahi BS Synergistic fluorescence enhancement of Tb with aromatic monocarboxylic acids and TOPO-Triton X-100: Role of Triton X-100 in synergism. Spectrochim. Acta 2000, A56, 1337–1344. [DOI] [PubMed] [Google Scholar]
- (35).Arnaud N; Georges J Comprehensive study of the luminescent properties and lifetimes of Eu3+ and Tb3+ chelated with various ligands in aqueous solutions: Influence of the synergic agent, the surfactant and the energy level of the ligand triplet. Spectrochim. Acta 2003, 59, 1829–1840. [DOI] [PubMed] [Google Scholar]
- (36).Peter S; Panigrahi BS; Viswanathan KS; Mathews CK Fluorescence enhancement of dysprosium, europium and terbium using sodium benzoate-trioctylphosphine oxide–Triton X-100. Anal. Chim. Acta 1992, 260, 135–141. [Google Scholar]
- (37).Martin LJ; Imperiali B The best and the brightest: Exploiting tryptophan-sensitized Tb3+ luminescence to engineer lanthanide-binding tags. Methods Mol. Biol 2015, 1248, 201–20. [DOI] [PubMed] [Google Scholar]
- (38).Bala M; Kumar S; Taxak VB; Boora P; Khatkar SP Terbium(III) complexes sensitized with β-diketone and ancillary ligands: Synthesis, elucidation of photoluminescence properties and mechanism. J. Mater. Sci. Mater. Electron 2016, 27, 9306–9313. [Google Scholar]
- (39).Barton P; Laws AP; Page MI Structure–activity relationships in the esterase-catalysed hydrolysis and transesterification of esters and lactones. J. Chem. Soc., Perkin Trans 2 1994, 2021–2029. [Google Scholar]
- (40).Goudar CT; Harris SK; McInerney MJ; Suflita JM Progress curve analysis for enzyme and microbial kinetic reactions using explicit solutions based on the Lambert W function. J. Microbiol. Methods 2004, 59, 317–326. [DOI] [PubMed] [Google Scholar]
- (41).Simplício AL; Coroadinha AS; Gilmer JF; Lamego J A methodology for detection and quantification of esterase activity. Methods Mol. Biol 2013, 984, 309–319. [DOI] [PubMed] [Google Scholar]
- (42).Lamego J; Ferreira P; Alves M; Matias A; Simplício AL Comparison of in vitro methods for carboxylesterase activity determination in immortalized cells representative of the intestine, liver and kidney. Mol. Cell. Probes 2015, 29, 215–222. [DOI] [PubMed] [Google Scholar]
Associated Data
This section collects any data citations, data availability statements, or supplementary materials included in this article.


