Abstract
Aims
For vancomycin treatment in obese patients, there is no consensus on the optimal dose that will lead to the pharmacodynamic target (area under the curve 400–700 mg h L−1). This prospective study quantifies vancomycin pharmacokinetics in morbidly obese and nonobese individuals, in order to guide vancomycin dosing in the obese.
Methods
Morbidly obese individuals (n = 20) undergoing bariatric surgery and nonobese healthy volunteers (n = 8; total body weight [TBW] 60.0–234.6 kg) received a single vancomycin dose (obese: 12.5 mg kg−1, maximum 2500 mg; nonobese: 1000 mg) with plasma concentrations measured over 48 h (11–13 samples per individual). Modelling, internal validation, external validation using previously published data and simulations (n = 10.000 individuals, TBW 60–230 kg) were performed using NONMEM.
Results
In a 3‐compartment model, peripheral volume of distribution and clearance increased with TBW (both p < 0.001), which was confirmed in the external validation. A dose of 35 mg kg−1 day−1 (maximum 5500 mg/day) resulted in a > 90% target attainment (area under the curve > 400 mg h L−1) in individuals up to 200 kg, with corresponding trough concentrations of 5.7–14.6 mg L−1 (twice daily dosing). For continuous infusion, a loading dose of 1500 mg is required for steady state on day 1.
Conclusion
In this prospective, rich sampling pharmacokinetic study, vancomycin clearance was well predicted using TBW. We recommend that in obese individuals without renal impairment, vancomycin should be dosed as 35 mg kg−1 day−1 (maximized at 5500 mg/day). When given over 2 daily doses, trough concentrations of 5.7–14.6 mg L−1 correspond to the target exposure in obese individuals.
Keywords: glycopeptides, morbid obesity, obesity, pharmacokinetics, pharmacology, vancomycin
What is already known about this subject
Obesity can dramatically impact the pharmacokinetics of antibiotics due to pathophysiological changes associated with being overweight.
For vancomycin, target 24‐h area under the curve values for efficacy and toxicity have been well established for Staphylococcus aureus infections and have been incorporated in current guidelines.
While there is ample evidence that both volume of distribution and clearance increase in obese individuals, there is conflicting evidence about how the vancomycin dose should exactly be adapted in obese patients.
What this study adds
This prospective, rich sampling pharmacokinetic study in a wide range of body weights (60–235 kg) shows that vancomycin volume of distribution and clearance can be predicted by total body weight using a linear (volume of distribution) or a power function with an exponent of 0.54 (clearance).
We recommend that in order to optimize exposure in obese individuals without renal impairment, vancomycin should be dosed as 35 mg kg−1 day−1 (maximized at 5500 mg day−1).
When divided over 2 doses day−1, trough concentrations between 5.7 and 14.6 mg L−1 are sufficient to obtain the target exposure.
For continuous infusion regimens, we recommend a fixed loading dose of 1500 mg for all body weights.
1. INTRODUCTION
Over recent decades, the worldwide prevalence of obesity (defined as a body mass index [BMI] ≥30 kg m−2) has dramatically increased.1 Since 1975, the percentage of obese men and women has increased from 3.2 and 6.4% to 10.8 and 14.9%, respectively. This corresponds with 641 million individuals being obese worldwide. If this trend continues, global obesity prevalence will reach 18–21% in 2025.1 Evidence suggests that these individuals are more prone to infections.2 As a consequence, clinicians are increasingly facing (severely) obese patients requiring antibiotic treatment. It has been well established that due to pathophysiological changes that are associated with overweight, such as an increased cardiac output, increase in adipose tissue, changes in renal function and impacted metabolic enzyme activity, the pharmacokinetics (PK) of drugs can be significantly impacted, often requiring dose adaptations.3, 4
Vancomycin is a glycopeptide antibiotic, introduced in clinical practice over 60 years ago. Since then, vancomycin has become a widely used agent predominantly for serious Gram‐positive infections and is considered first line treatment in methicillin‐resistant Staphylococcus aureus infections.5 For these indications, the drug is administered intravenously using intermittent or continuous infusion regimens, preceded by a loading dose in the latter setting.6, 7 Around 80% is excreted unchanged renally, mostly by glomerular filtration but other (active) excretion pathways might also play an important role.6 In S. aureus infections, vancomycin efficacy closely correlates with a total 24‐h area under the curve (AUC24h) over the minimal inhibitory concentration (MIC). Target AUC24h of vancomycin for efficacy for this indication have been well defined in the clinical setting, with thresholds of ≥345 to ≥451 mg h L−1 found over the years, based on MICs up to 1 mg L−1.8, 9, 10, 11, 12 A comprehensive practice guideline published in 2009 advocated an efficacy target of AUC24h/MIC ≥400 mg h L−1.13 To reach this target with intermittent dose regimens, a target steady state trough concentration of 15–20 mg L−1 was advised.13 There is, however, substantial evidence from other populations that lower trough concentration ranges might also be effective to reach the AUC24h target.14, 15 To date, this has not been studied for the obese population. Regarding vancomycin toxicity, 700 mg h L−1 was recently proposed as an AUC24h upper limit for the first 48 h of treatment.16 Another study found an increasing risk of nephrotoxicity with steady state AUC24h values over 1300 mg h L−1.17
With respect to dosing guidelines, according to the Food and Drug Administration (FDA) drug label, vancomycin should be given as a fixed dose of 2000 mg day−1 in adults with a normal renal function, without specific recommendations for obese patients.18 Since the FDA‐regimen has been shown to result in suboptimal exposure (AUC24h around 100–250 mg h L−1) in normal weight adults, more recent guidelines recommend 15–20 mg kg−1 every 8–12 h.13 This rather broad dosing regimen is also recommended for obese patients, thereby resulting in a large variability of dose regimens used for obese individuals in clinical practice13 and is based on studies that are mostly performed with sparse data based on routine therapeutic drug monitoring (TDM) peak and trough levels.19, 20, 21, 22, 23, 24 Most of these studies show that both volume of distribution and clearance increase in obese patients. Initially, total body weight (TBW) was shown to be the best predictor for vancomycin clearance.20, 21 However, these findings have been challenged by other studies conducted in obese patients, including the most recent.19, 22, 24
As a consequence, the exact dosing strategy for vancomycin in obese patients still remains to be established. This study aims to quantify the PK of vancomycin in morbidly obese and nonobese individuals. Using prospectively collected, rich data gathered over 48 h after a single dose in individuals over a wide range in body weight, we aim to identify covariates that best predict changes in vancomycin clearance and volume of distribution in obesity. The model is externally validated using independent data and is ultimately applied to guide vancomycin dosing in the (morbidly) obese, thereby optimizing target attainment.
2. METHODS
2.1. Subjects
Morbidly obese patients with an indication for bariatric surgery (BMI ≥40 kg m−2 or ≥35 kg m−2 with comorbidities), i.e. laparoscopic sleeve gastrectomy or gastric bypass, and nonobese healthy volunteers (BMI 18–25 kg m−2) were considered for inclusion in this study. Participants were excluded when they were known to have an allergy to glycopeptides, were pregnant or breastfeeding, were renally impaired (defined as estimated glomerular filtration rate of <60 mL min−1 1.73 m−2 (calculated using the Cockcroft–Gault [CG] formula with lean body weight [LBW] for obese25 or CG with TBW for nonobese) or had used potentially nephrotoxic drugs (for example aminoglycosides, loop diuretics, or nonsteroid anti‐inflammatory drugs) in the week before surgery. All participants provided written informed consent prior to inclusion. This clinical trial was approved by the local human research and ethics committee (Medical Research Ethics Committees United, Nieuwegein, The Netherlands, NL52260.100.16) and registered in the Dutch Trial Registry (NL5885/NTR6058), and was conducted in accordance with the principles of the Declaration of Helsinki and Good Clinical Practice guidelines.
2.2. Study design
Participants received a single intravenous infusion of vancomycin (obese patients: 12.5 mg kg−1, maximum 2500 mg; nonobese 1000 mg as fixed dose, all infused in 10 mg min−1). Obese patients received the infusion during or immediately after bariatric surgery. Blood samples were collected 0.25, 0.5, 1, 1.5, 2, 3, 4, 6 and 12 h after end of infusion. In the obese group, samples were also drawn during infusion, at 2 and 0.25 h before end of infusion. Additional samples were drawn around 24 h and, if the individual was still admitted, 48 h after start of infusion. Blood samples were collected in lithium‐heparin tubes, centrifuged at 1900 g for 5 min, after which plasma was stored at −80°C until analysis. For safety assessment, serum creatinine was measured before and 24 h after administration of vancomycin. Estimated glomerular filtration rate was calculated using Modification of Diet in Renal Disease (MDRD) or Chronic Kidney Disease Epidemiology Collaboration (CKD‐EPI) formulas, either the conventional CG formula (CG‐TBW) or CG calculated with LBW instead of TBW for obese (CG‐LBW). MDRD and CKD‐EPI were corrected for body surface area (BSA) by multiplying the result (in mL min−1 1.73 m−2) by BSA/1.73. Lastly, 24‐h urine was collected on the study day to measure 24‐h creatinine clearance as marker for the glomerular filtration rate (GFR).
2.3. Sample assay
Vancomycin plasma concentrations were measured using a validated, commercially available immune‐assay method (VANC3, Cobas System, Roche Diagnostics GmbH, Mannheim, Germany) with a limit of detection (LOD) of 1.5 mg L−1, lower limit of quantification (LLOQ) of 4 mg L−1 and upper limit of quantification of 80 mg L−1. Measured concentrations below LOD or LLOQ were reported in the dataset. Within‐run and interday variability was 3.7 and 4.4%, respectively.
2.4. PK analysis
PK parameters were analysed using nonlinear mixed‐effects modelling (NONMEM 7.4, ICON Development Solutions, Hanover, USA) and Pearl‐speaks‐NONMEM 4.8.126 using Pirana 2.9.7 (Certara USA, Inc, Princeton, USA).27, 28 One‐, 2‐ and 3‐compartmental models were evaluated with the ADVAN 1, 3 or 11 routine, respectively, using the first order conditional estimation method with interaction and addition of the LAPLACIAN method. Interindividual variability (IIV) and residual variability were assumed to be respectively log‐normally and normally distributed. NONMEM output was visualized with R 3.5.1 (Xpose package 4.6.1)29 and GraphPad Prism 6.0 (GraphPad Software, La Jolla, USA). Values below LOD were analysed using the M3 method as described elsewhere.30 Model building was performed in 3 stages: (1) selection of the structural model, i.e. a 1‐, 2‐ or 3‐compartmental model, (2) selection of the statistical error model (additive, proportional or a combined error model) and (3) a covariate analysis. Nested models were compared using the drop in objective function value (OFV, −2 log likelihood function), where a difference of 3.84 corresponds with a P‐value <.05 with 1 parameter difference. In addition, goodness of fit plots (GOF), such as observed vs population and individual predictions, or conditional weighted residuals vs time after dose or population predictions were used for diagnostic purposes. Lastly, parameter estimate precision, shrinkage, individual fits, and prediction‐corrected visual predictive checks (pcVPC)31 were evaluated to identify the best model.
Potential covariates were identified by assessing trends in plots of the individual posthoc parameter or the unexplained variability against the specific covariate. Covariates that were present in the dataset included TBW, LBW (calculated using the Janmahasatian formula32), adjusted body weight (ABW, calculated with correction factor 0.4 as described elsewhere33), BMI, ideal body weight (using the Devine formula34), sex, age, GFR (based on collection of 24‐h urine) and serum creatinine‐based estimations of GFR such as CG‐TBW, CG‐LBW, MDRD or CKD‐EPI (the latter 2 both normalized for BSA 1.73 m2 and de‐indexed for BSA by multiplying the original value by BSA/1.73). Covariates were implemented in the model using linear and power functions, standardized for a typical individual of 70 kg or median value of the covariate.35 Inclusion was considered when step‐by‐step inclusion resulted in a drop in OFV of at least −3.84 (P < .05) and backward deletion gave an OFV increase of at least 10.8 points (P < .001). Furthermore, the contribution of a covariate was judged based on the reduction in IIV and diagnostics described earlier.
2.5. Internal validation
The final model was internally validated by pcVPC based on 1000 simulations, split for obese and nonobese individuals. Parameter precision and robustness of the structural and final model were analysed by the sampling importance resampling procedure.36
2.6. External validation
Data from a previously published prospective study in which 6 obese (111–226 kg) and 4 nonobese (66–89 kg) individuals with normal renal function received a single infusion of 1000 mg vancomycin in 40 min,21 were used to externally validate our PK (covariate) model. In the external validation study, vancomycin concentrations were measured using a validated immuno‐assay with a LLOQ of 0.5 mg L−1. External validation was done using pcVPC based on 1000 simulations, split for obese and nonobese individuals. Bias and precision of the model was quantified by calculation of the median prediction error (MPE) and root mean squared error (RMSE) according to equations (1) and (2),
| (1) |
| (2) |
where PEi and RMSE are the prediction error for the ith observation and root mean squared error of all observations, where Cpred,i and Cobs,i represent the predicted and observed vancomycin concentration for the ith observation and N is total number of observations. MPE under 20% and RMSE under 5 mg L−1 were considered accurate.
2.7. Simulation based comparison of dosing strategies
To guide the optimal dosing strategy in the obese, simulations using the final model with IIV were performed with different dose regimens in 10 000 obese individuals (BMI >35 kg m−2) with a uniform weight distribution between 90 and 230 kg. AUC24h was calculated by implementing an AUC compartment equal to the central compartment in the NONMEM $DES subroutine. Based on literature, we chose a target for the probability of target attainment (PTA) and probability of toxicity (PTOX) an AUC24h of >400 mg h L−1 and AUC24h > 700 mg h L−1, respectively, both assessed at day 3 (when in steady state). We aimed for a PTA of at least 90% in obese individuals (BMI > 35 mg kg−2) with the lowest possible PTOX, as recommended by the European Medicine Agency. Simulated dose regimens consisted of continuous infusion regimens of 20, 25, 30, 35, 40 and 45 mg kg−1 day−1 (with or without a dose cap for the 24‐h dose) and 2000, 3000, 4000, 5000 and 6000 mg day−1 as fixed doses. In combination with the selected dose, loading doses of 500, 1000, 1500, 2000 or 2500 mg were evaluated. The loading doses, given as single infusions at a rate of 10 mg min−1, were followed by a continuous infusion starting 2 h after start of the loading dose. Different loading dose strategies were evaluated by comparing the mean and 95% confidence intervals of the AUC24h‐ratio per weight group, which is calculated by dividing the AUC24h at day 1 by the AUC24h at day 3. Ideally, the 95% confidence intervals of these ratios should contain 1, meaning that steady state is reached at day 1 and the loading dose is adequate.
2.8. Correlation of trough concentrations with achievement of target AUC24h
For the selected vancomycin dose, trough concentrations related to the optimal target attainment (AUC24h within the target of 400–700 mg h L−1) were investigated by simulations using the same weight distribution (n = 10 000). Administration of the dose over 2 or 3 administrations day−1 or a continuous infusion were investigated. At day 3, trough concentrations that corresponded to the 2.5–95 percentiles of the AUC24h within the target of 400–700 mg h L−1 were identified. This target AUC24h was chosen since the current consensus guideline describes that the recommended target trough concentrations correspond to AUC24h > 400 mg h L−1.13 Correlation between trough concentrations and AUC24h at day 3 was assessed by linear regression using R 3.5.1.
3. RESULTS
In total, 20 obese individuals with a median weight of 139.0 kg (range 110.6–234.6 kg) and 8 nonobese individuals with a median weight of 69.5 kg (range 60.0–84.7 kg) were included. Participant demographics are shown in Table 1. A total of 326 samples was collected (238 in obese and 88 in nonobese individuals), with a median of 12 samples (range 11–13) per participant. Twenty‐four samples (7%) were below LOD and handled according to the M3 method.30 Samples were collected up to 24 h in all cases. For 2 obese patients and all nonobese individuals vancomycin concentrations were obtained until 48 h after dosing. Measured vancomycin concentrations vs time are shown in Figure A1 in the appendix.
Table 1.
Summary of baseline characteristics
| Parameter | Morbidly obese group (n = 20) | Nonobese group (n = 8) |
|---|---|---|
| Weight (kg) | 139.0 (110.6–234.6) | 69.5 (60.0–84.7) |
| Height (cm) | 173.5 (159–189) | 182.5 (166–190) |
| BMI (kg m−2) | 45.5 (40.8–65.7) | 21.2 (20.4–25.0) |
| Age | 38.0 (23–54) | 25.5 (20–55) |
| Serum creatinine (μmol L−1)a | 72 (41–101) | 70 (60–86) |
| GFR (mL min−1) | 141.4 (80.7–260.7) | 117.9 (88.1–147.0) |
| MDRD (mL min−1) | 138.3 (89.5–220.6) | 115.4 (72.8–144.7) |
| CKD‐EPI (mL min−1) | 148.1 (95.5–221.6) | 125.3 (77.1–139.3) |
| CG‐TBW (mL min−1) | 249.2 (166.0–431.8) | 140.1 (87.9–157.3) |
| CG‐LBW (mL min−1) | 122.0 (83.1–191.0) | 140.1 (87.9–157.3) |
Data shown as median (range).
Serum creatinine as measured before administration of vancomycin.
BMI, body mass index; GFR, glomerular filtration rate measured using 24‐h creatinine clearance; MDRD, Modification of Diet in Renal Disease; CKD‐EPI, Chronic Kidney Disease Epidemiology Collaboration; CG‐TBW, Cockcroft–Gault (conventional); CG‐LBW, CG calculated with lean body weight instead of total body weight for obese.
3.1. PK analysis
A 3‐compartment model with first order elimination and a combined proportional and additive residual error model with IIV for clearance, V1 and V2 best described the data. Parameters of the structural model are shown in Table 2.
Table 2.
Pharmacokinetic parameter estimates of the structural and final (covariate) model
| Parameter | Structural model (RSE %) [95% CI] | Final model (RSE %) [95% CI] | |
|---|---|---|---|
| CL (L h −1 ) | 7.32 (14.0) [6.13–8.33] | ‐ | |
|
CL
70kg
|
|||
| CL70kg (L h−1) | ‐ | 5.72 (5.0) [5.34–6.10] | |
| θ1 | ‐ | 0.535 (20) [0.36–0.67] | |
| V1 (L) | 15.8 (27) [11.2–20.4] | ‐ | |
| V1 36.5yr ×(1 + θ2 * (Age − 36.5) ) | |||
| V136.5yr (L) | ‐ | 16.7 (18) [12.9–21.2] | |
| θ2 | ‐ | 0.0136 (31) [0.00575–0.0211] | |
| Q V1‐V2 (L h −1 ) | 16.2 (20) [13.0–21.4] | 15.8 (23) [11.6–21.7] | |
| V2 (L) | 13.2 (26) [9.48–17.2] | ‐ | |
|
V2
70kg;36.5yr
|
|||
| V270kg;36.5yr (L) | ‐ | 6.98 (17) [5.78–8.67] | |
| θ2 | ‐ | 0.0136 (31) [0.00575–0.0211] | |
| Q V1‐V3 (L h −1 ) | 4.37 (25) [2.88–6.07] | 5.21 (21) [3.83–6.63] | |
| V3 (L) | 19.7 (21) [14.9–26.3] | 19.5 (13) [15.0–24.1] | |
| Interindividual variability (%) a,b | |||
| CL | 31.9 (22) [25.3–41.6] | ‐ | |
| CL nonobese | ‐ | 5.28 FIX | |
| CL obese | ‐ | 24.7 (19) [18.4–32.3] | |
| V1 | 56.8 (44) [40.1–83.9] | 45.3 (24) [34.9–62.0] | |
| V2 | 37.1 (37) [23.4–50.9] | ‐ | |
| Residual error | |||
| Proportional error a , b | 0.0401 (21) [0.0253–0.0568] | 0.0392 (21) [0.0246–0.0541] | |
| Additive error (mg L −1 ) b | 1.03 (5.0) [0.923–1.13] | 1.07 (5.0) [0.960–1.16] | |
| OFV | 682.82 | 609.89 |
Shrinkage of interindividual variability in the final model are below 20% for all estimates
Calculated by
Proportional error is shown as σ
Epsilon shrinkage for the final model is 8%.
CL, clearance; V1, volume of distribution of central compartment; V2, volume of distribution of peripheral compartment 2; V3, volume of distribution of peripheral compartment 3; QV1‐V2, intercompartmental clearance between V1 and V2; QV1‐V3, intercompartmental clearance between V1 and V3; TBW, total body weight; OFV, objective function value; RSE, relative standard error based on covariance step in NONMEM; 95% CI, 95% confidence interval obtained from sampling importance resampling procedure.
Implementation of TBW with a linear relationship on V2 gave the largest reduction in OFV (−24.5; P < .001) and IIV (from 37.1 to 5.8%). In the model with TBW on V2, IIV on V2 was omitted from the model since this did not impact the OFV (+0.11). In the following step, the best results were obtained by inclusion of (1) TBW with a power function on clearance using an estimated exponent, (2) ABW and (3) LBW, both with linear functions. This resulted in OFV reductions of −17.4 (1), −18.9 (2) and −15.5 (3; P < .001 for all), resulting in a reduction in IIV from 29.3% to 21.2, 20.5 and 21.9%, respectively. No significant differences were visible in GOF plots between TBW, LBW and ABW‐models. Since TBW is more readily available in clinical practice and is therefore preferable in the light of model‐informed dose recommendations, we chose to include TBW on clearance. Inclusion of MDRD, CKD‐EPI, CG‐TBW, CG‐LBW or GFR (based on 24‐h creatinine clearance) did not significantly improve the model (P > .001). After inclusion of TBW on clearance, no remaining covariates could be identified for this parameter. Lastly, introduction of age as covariate on V1 and V2 resulted in a decrease of OFV with −19.4 points and improved GOF (P < .001).
Since IIV for clearance appeared to be significantly higher in the obese group, we estimated separate IIV values for both groups, resulting in an OFV drop of −11.8 and a resulting IIV on clearance of 5.3% and 24.7% for nonobese and obese subpopulations, respectively. While the IIV on clearance in the nonobese showed a high uncertainty and significant shrinkage, we decided to fix this parameter to 5.3% in the final model, since removing it from the model resulted in a penalty of 4 points increase in OFV. The final PK parameters of the resulting model are shown in Table 2. GOF plots for the final model are shown in Figure A2.
3.2. Internal validation
The pcVPC, shown in Figure 1 shows that the median and 2.5th and 97.5th percentiles of the prediction intervals correspond with the observations. The lower panel in Figure 1 shows that the model performs well in predicting the portion of observations that are below LOD. Confidence intervals of the model parameters based on the sampling importance resampling procedure are presented in Table 2.
Figure 1.
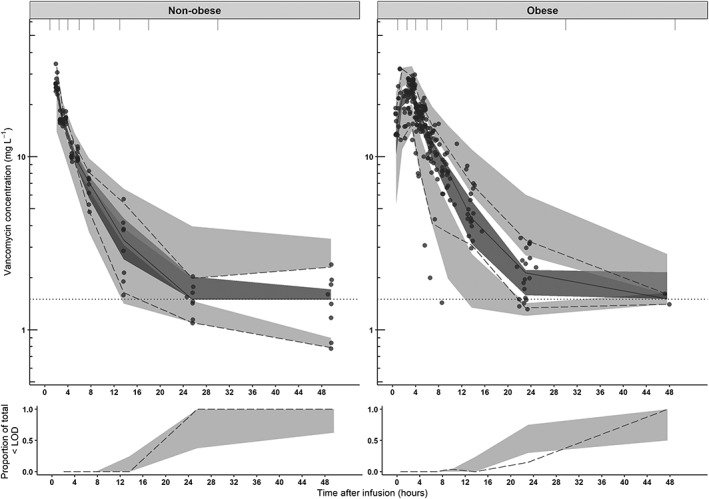
Prediction‐corrected visual predictive checks (pcVPC) of the final model split for nonobese (upper left panel) and obese (upper right panel) subgroups of the current study. The observed concentrations are shown as black circles, median, 2.5th and 97.5th percentiles of the observed data are shown as solid, lower and upper dashed lines. Grey shaded areas represent the 95% confidence intervals of the median (dark grey) and 2.5th and 97.5th percentiles (light grey) of simulated concentrations (n = 1000) based on the original dataset. The lower limit of detection (LOD) is depicted by the dotted grey line. Intervals of the bins are shown by the vertical ticks on the top of the plot. Lower panels show the observed proportion below the LOD (dashed line), where shaded areas represent the 95% confidence intervals based on simulated concentrations (n = 1000)
3.3. External validation
The pcVPCs of the external validation using data of the study from Blouin and colleagues (6 obese and 4 nonobese individuals) are shown in Figure 2. The VPC shows a good predictive performance of our model in the obese population without significant bias and good precision, while the model seems to slightly underpredict observations in nonobese individuals, mostly in higher concentrations (>20 mg L−1). This is shown by MPE and RMSE, where acceptance criteria (MPE < 20%, RMSE <5 mg L−1) are met only in the obese population (MPE for nonobese subgroup: −20.1%, obese subgroup: −0.171%, corresponding RMSE values 7.24 mg L−1 for the nonobese and 3.27 mg L−1 for the obese population).
Figure 2.
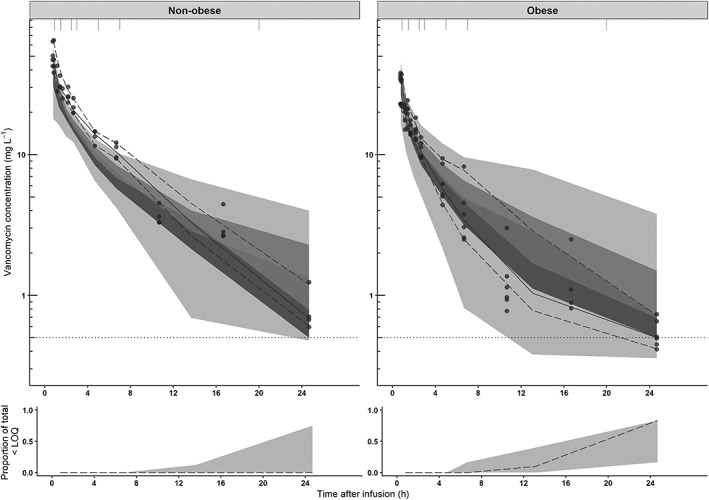
Prediction‐corrected visual predictive checks (pcVPC) of the final model split for nonobese (upper left panel) and obese (upper right panel) subgroups for the external dataset published by Blouin et al.21 The observed concentrations from the Blouin study are shown as black circles, median, 2.5th and 97.5th percentiles of the observed data are shown as solid, lower and upper dashed lines. Grey shaded areas represent the 95% confidence intervals of the median (dark grey) and 2.5th and 97.5th percentiles (light grey) of simulated concentrations (n = 1000) based on the original dataset. The lower limit of quantification (LOQ) is depicted by the dotted grey line. Intervals of the bins are shown by the vertical ticks on the top of the plot. Intervals of the bins are shown by the vertical ticks on the top of the plot. Lower panels show the observed proportion below the LOQ (dashed line), where shaded areas represent the 95% confidence intervals based on simulated concentrations (n = 1000)
3.4. Simulation based comparison of dosing strategies
Figure 3 shows the results of simulations in obese individuals ranging 90–230 kg upon weight‐based dose regimens. In Figure 3, the left column shows the resulting mean AUC24h with 95% percentiles, while in the right column PTA (AUC24h > 400) and PTOX (AUC24h > 700) at day 3 are presented. Figure A3 in the appendix shows the same plot for fixed dose regimens. Figure 3 shows that when the vancomycin dose is increased from 25 mg kg−1 day−1 to 45 mg kg−1 day−1, both chances of achieving an AUC24h > 400 and > 700 increase for all individuals. A high PTA could be achieved for all body weights using a dose regimen of 35 mg kg−1 day−1, maximized at 5500 mg day−1. For some weight categories where the PTA (AUC24h > 400) was below 90% (i.e. individuals <110 kg and >210 kg), PTA was still >80%, and in all cases the probability of reaching an AUC24h > 350 mg h L−1 was above 90% (data not shown). The highest PTOX (AUC24h > 700 mg h L−1) with this dose regimen is seen in individuals weighing around 150–160 kg. Notably, in this group still 94% of the individuals have an AUC24h < 900 mg h L−1. A fixed dose of 2000 mg day−1, the recommended dose in the FDA drug label, results in unacceptably low PTA for both nonobese and obese individuals (Figure A3, appendix). All weight‐based dosages evaluated in Figure 3 were maximized at 5500 mg day−1, based on Monte Carlo simulations with fixed dosages (Figure A3 in the appendix) where a suboptimal PTA (AUC24h > 400) is seen with dosages ≤5000 mg day−1, and considerable PTOX (AUC24h > 700) is seen with high body weights with 24‐h dosages ≥6000 mg. Figure 4 shows simulations with increasing loading doses in combination with a maintenance dose of 35 mg kg−1 day−1 illustrating that a loading dose of 1500 mg yields similar exposure at day 1 compared to day 3 without significant trends across body weights, with all mean AUC‐ratio's close to 1 and all corresponding 95% confidence intervals containing 1. No clinically significant influence of age on simulated vancomycin concentrations was found for 4 typical individuals with age ranging 20–50 years and a TBW of 130 kg (Figure A4 in appendix).
Figure 3.
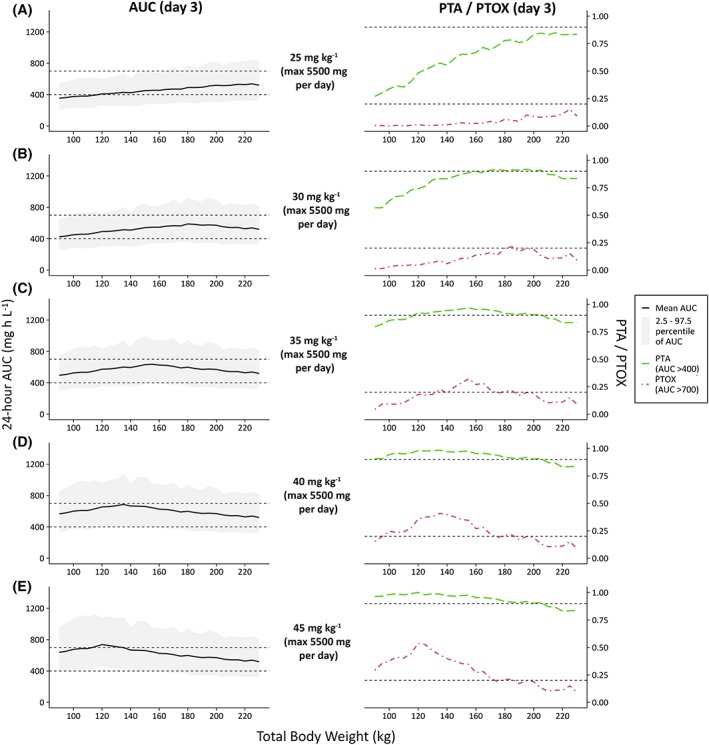
Twenty‐four‐hour area under the curve (AUC) values at day 3 (left column) and probability of target attainment (PTA, AUC24h > 400) or toxicity (PTOX, AUC24h > 700) (right column), shown vs weight (90–230 kg) for several dose regimens (n = 10 000 per dose regimen). (A–E) Increasing dose regimens from 25 mg kg−1 day−1 to 45 mg kg−1 day−1, all maximized at 5500 mg day−1. In the left plots, the solid black line and grey area indicate mean observed AUC with 2.5–97.5 percentiles. Dashed grey line represents target AUC levels (400 and 700 mg h L−1). In the right plots, the dashed green line and dot‐dashed red line indicate PTA and PTOX, respectively. Dashed grey lines represent the threshold for PTA (0.9) and, for reference, 20% PTOX (0.2). AUC, 24 h area under the curve at day 3; PTA, probability of target attainment (AUC > 400 mg h L−1) at day 3; PTOX, probability of toxicity (AUC > 700 mg h L−1) at day 3
Figure 4.
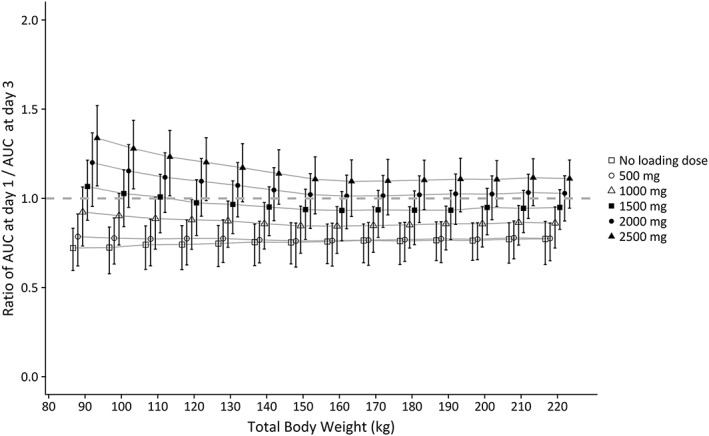
Mean ratio of AUC24h at day 1/AUC24h at day 3 with 95% confidence intervals, shown for different loading doses vs body weight (90–230 kg), based on Monte Carlo simulations (n = 10 000 per loading dose). Each line represents 1 loading dose regimen. All individuals received 35 mg kg−1 continuous infusion started 2 h after the loading dose (maximised at 5500 mg day−1). Grey dashed line represents a ratio of 1.AUC, 24‐h area under the curve
3.5. Correlation of trough concentrations with achievement of target AUC24h
A daily dose of 35 mg kg−1, maximized at 5500 mg day−1, was selected for simulation of trough concentrations at day 3 when given as intermittent or continuous infusion regimens. Figure 5 shows the AUC24h vs trough concentrations for obese individuals at day 3. There is a strong relationship between AUC at day 3 and trough concentrations, with R2 values of 0.92, 0.93 and 1.00 when the dose is given in 2‐ or 3‐times dosages or as continuous infusion, respectively. Trough concentrations corresponding to 95% AUC24h within target (400–700 mg h L−1) are 5.70–14.6 (dose divided over 2 administrations), 7.8–17.8 (dose divided over 3 administrations) and 17.5–28.3 (continuous infusion) mg L−1, as depicted by the red lines in Figure 5.
Figure 5.
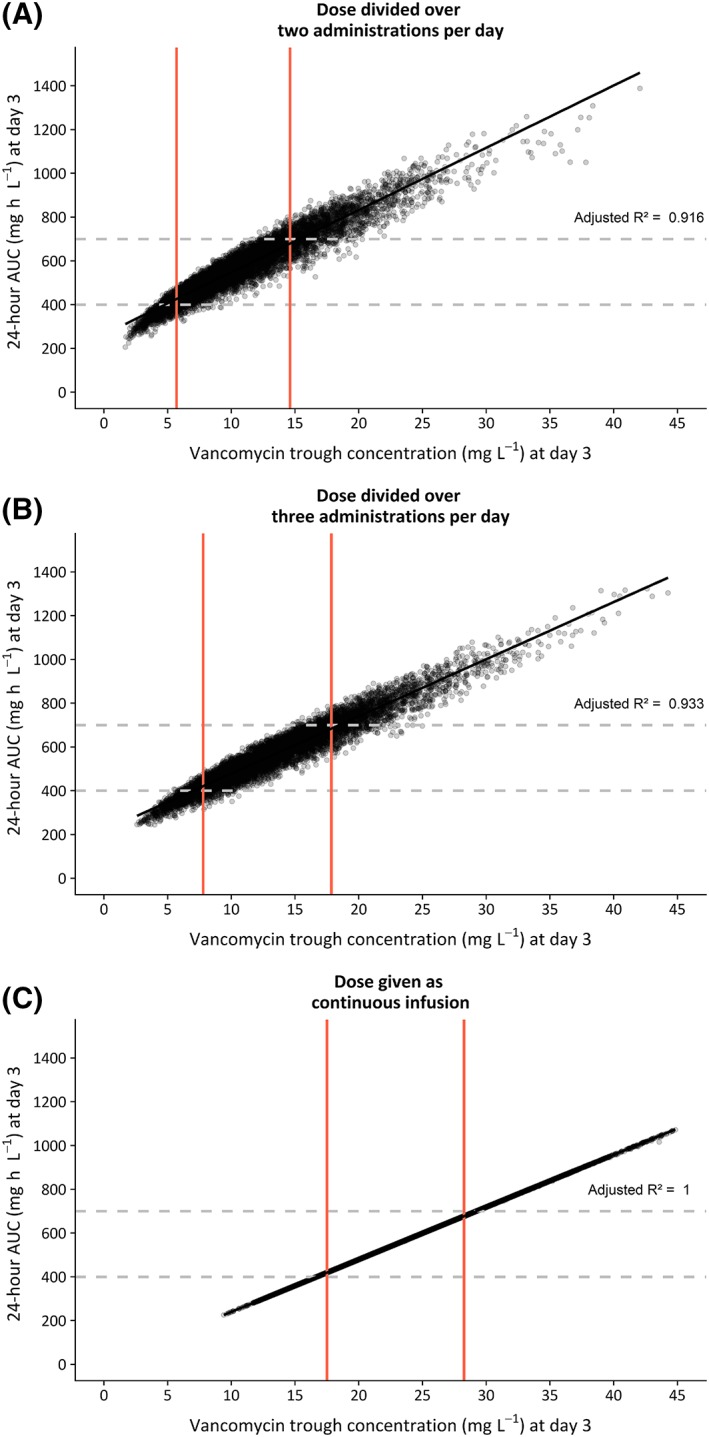
Twenty‐four‐hour area under the curve (AUC24h) at day 3 vs individual trough concentrations at day 3 (measured 0,5 h prior to the second dose) based on Monte Carlo simulation in obese patients (n = 10 000, weight ranging 90–230 kg), using the final model. Vancomycin dose was 35 mg kg−1 day−1, maximized at 5500 mg day−1, given over 2 infusions day−1 (A), 3 infusions day−1 (B) or as a continuous infusion regimen (C). Each dot represents 1 simulated individual. Dashed horizontal lines show the target AUC window (400–700 mg h L−1). Trough concentrations corresponding to 95% of AUC24h within this target are shown with red vertical lines. The black line represents the linear regression line, with corresponding adjusted R2 value shown in the graph
4. DISCUSSION
Our study shows that vancomycin PK is significantly altered by obesity. We found that in obese individuals up to 235 kg without renal impairment, vancomycin clearance could be predicted by TBW (Table 2) using a power function with estimated exponent of 0.54, which was confirmed by the external validation. Monte Carlo simulations incorporating IIV showed that in obese individuals, the target exposure (at least 90% AUC24h > 400) could be attained when vancomycin is dosed as 35 mg kg−1 day−1, maximized on 5500 mg day−1. Using this regimen, PTOX (AUC24h > 700) was <20% for most individuals, despite a slight trend in increasing exposure with increasing body weight. In theory, a dose regimen based on TBW scaled to 0.54 (in accordance with the relationship found between CL and TBW) would result in an equal exposure across body weights, but is in our opinion less suitable for use in daily practice. For continuous infusion regimens of 35 mg kg−1 day−1, a loading dose of 1500 mg is sufficient for reaching steady at day 1 for all weight categories. A fixed dose regimen of 2000 mg day−1 as dictated by the FDA drug label, leads to unacceptable low PTA under 25% across the whole population, as was described earlier.13
A strong aspect of our study is the prospective study design with intensive PK sampling in adults with a wide range of body weights across the included cohort from 60 to 235 kg, allowing for the characterisation of a 3‐compartment model. This is in contrast with other reports on vancomycin PK in obesity, that fully rely on TDM data, that consist mostly of peak and trough concentrations, making it difficult to estimate >1 compartment, thereby limiting the ability to adequately assess individual PK parameters.19, 22 Moreover, we used data from a previously performed study to externally validate our model.21 Our model showed a high precision without bias in describing the data in the obese subgroup. Therefore, taken these results together with our internal validation, we can conclude that our PK‐model shows an excellent performance in predicting vancomycin PK in the (morbidly) obese population up to 235 kg.
Our results on vancomycin clearance and volume of distribution in obese individuals puts forward what was known on vancomycin PK in obesity. Regarding clearance, predominantly retrospective studies also found a larger vancomycin clearance in obese compared to nonobese individuals.19, 20, 22, 24 One prospective rich sampling PK study in healthy obese individuals, similar to our study design but with only 6 obese individuals included, found a linear relationship of TBW with vancomycin clearance, in contrast to the power relationship as found in our study.21 One retrospective study in 108 obese and 596 nonobese patients, found no difference in absolute vancomycin clearance between both groups.23 This might be explained by the relatively low body weight in the obese group (mean TBW 94.3 kg). Other reports in which obese patients were included, show conflicting results on the best predictive covariate for vancomycin clearance, varying from CG with TBW,19 serum creatinine,24 or a combination of serum creatinine, age, TBW and sex.22 These results might be explained by differences in studied body weights or employed sampling schedules (i.e. use of TDM data vs intensive sampling). Considering the fact that vancomycin is predominantly excreted renally, it is interesting that we found TBW to be a better predictor than any of the renal function estimates including GFR based on 24‐h urine clearance. This might be explained by the lack of individuals with renal impairment in our study. In addition, in our PK model vancomycin clearance of a typical individual of 70 kg is 5.72 L h−1, corresponding to 95 mL min−1, which is slightly below the average GFR in our relatively young population. This is in line with what has been reported in other studies and suggests that other processes besides glomerular filtration also play a role.6 There is substantial evidence that obesity can influence both passive and active processes in the kidneys,37 which might explain why body weight is a better predictor for vancomycin clearance than renal function estimates in obese individuals without renal failure.
Results on vancomycin volume of distribution in obese seem to be more consistent across literature. Five studies reported on changes in volume of distribution, all describing an increase of volume of distribution with body weight in a linear fashion.19, 20, 21, 23, 24 No study reported age as a covariate for volume of distribution. In our study we found age as covariate for volume of distribution, even though its impact was limited. As a consequence, increasing age does not impact the proposed dose regimen.
It is well known that vancomycin PK exhibits large IIV and has a small therapeutic window, and therefore the 2009 consensus guideline recommends that TDM is routinely applied when treating patients with vancomycin.13 Our results further substantiate this recommendation for the obese populations, since our final PK model still shows considerable unexplained IIV for both clearance (25% in the obese subgroup) and volume of distribution (45% on V1). To obtain an adequate AUC24h between 400 and 700 mg h L−1, guidelines recommend to target trough concentrations between 15–20 mg L−1.13 We show that in obese individuals, steady state trough concentrations of 5.7–14.6 mg L−1 (when dosed 2 times daily) are sufficient to assure adequate exposure. This discrepancy with the guideline recommendation has been reported for several other special populations as well.14, 15 Plots with individual posthoc clearance and volume of distribution values visualized by colour (shown in Figure A5 in the appendix) point out that the variability in volume of distribution explains why we see this range in trough concentrations with similar AUC24 values. To circumvent this problem in translating trough concentrations to exposure, it might be preferable to measure the AUC directly using a limited sampling strategy (for example with peak‐and‐trough concentrations) along with the employment of Bayesian forecasting software. This recommendation has also been incorporated in the revision of the 2009 vancomycin TDM guideline, which is currently under development.38 If resources or knowledge is unavailable, clinicians should be aware that in obese individuals, trough concentrations below 15 mg L−1 do not necessarily correspond to a subtherapeutic exposures and therefore do not always require dose adjustments.
Some limitations apply to our study. First, our participants received only a single vancomycin infusion. Therefore, extension of our PK model to simulate continuous infusions should be done with caution. However, the maintenance dose is merely dependent on vancomycin clearance which can be adequately estimated in the current study design. Second, in interpreting the simulations, we chose a target PTA of 90% for selection of the best dose regimen, as advocated by the EMA.39 However, certain situations may call for a higher target PTA and therefore a higher dosage, for example in serious life‐threatening infections.39, 40 In addition, the target for PTA (AUC24 > 400 mg h L−1), has only been established for S. aureus infections. We still remain fairly ignorant as to the appropriate targets for other infections where vancomycin is indicated. Third, obese individuals underwent bariatric surgery during the PK study, which could theoretically interfere with the results. However, the concerning operations are performed laparoscopically, with a short duration (<1 h), and minimal blood loss (<50 mL). Therefore, we consider this influence to be negligible. Last, the participants in our study were, besides being obese, otherwise healthy individuals with adequate renal function. Therefore, one should apply caution in extrapolating of our results to individuals with renal impairment or critical illness and always perform TDM in these populations.
In conclusion, our study shows that in order to obtain optimal exposure with minimal risk on toxicity, vancomycin should be dosed as 35 mg kg−1 day−1 in obese individuals without renal impairment. For continuous infusion regimens, a loading dose of 1500 mg is sufficient for the whole population to obtain steady state at day 1.
COMPETING INTERESTS
Dr Brüggemann declares that he has no conflicts of interest with regards to this work. Outside of this work, he has served as consultant to and has received unrestricted research grants from Astellas Pharma Inc., F2G, Gilead Sciences, Merck Sharpe and Dohme Corp., and Pfizer Inc. All payments were invoiced by the Radboud University Medical Centre. All other authors declare no conflicts of interest.
CONTRIBUTORS
C.S., M.J.W., E.P.A.D., J.W.M., R.J.M.B, and C.A.J.K. designed the study, C.S., R.E.W and E.P.A.D. performed the study, C.S., R.E.W., S.C.G., C.A.J.K. analysed the data and C.S., R.E.W., S.C.G., M.J.W., E.P.A.D., J.W.M., R.J.M.B. and C.A.J.K. wrote the manuscript.
ACKNOWLEDGEMENTS
The authors would like to thank all study participants. The authors also thank Ingeborg Lange, Marieke van Donselaar, Angela Colbers, Brigitte Bliemer and Sylvia Samson for aiding in the recruitment of participants and conduct of the trial. This study was funded by an institutional research from The Netherlands Organization for Health Research and Development (ZonMW) under grant number 836041004.
APPENDIX A.
Figure A1.
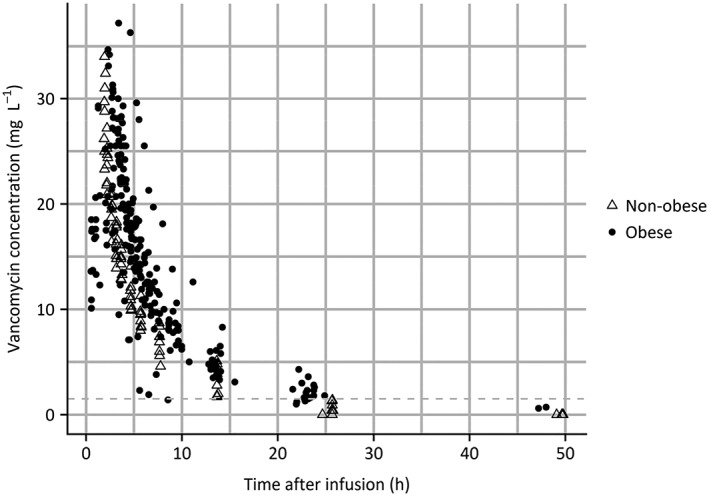
Measured vancomycin concentration vs time after infusion
Figure A2.
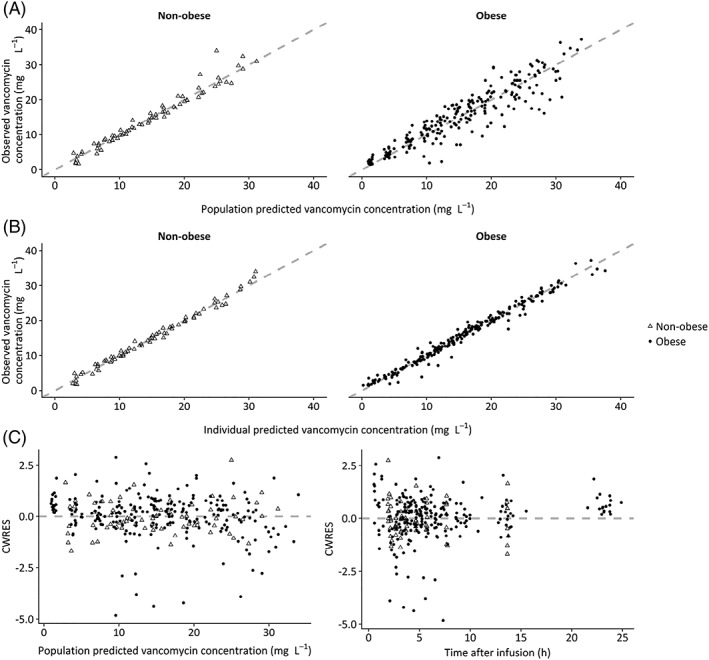
Goodness‐of‐fit plots of the final pharmacokinetic model for nonobese individuals
Figure A3.
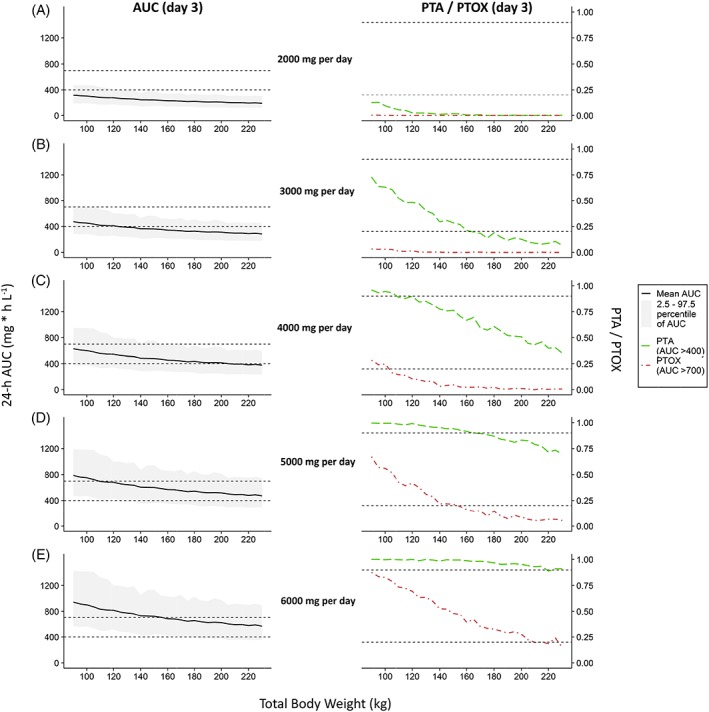
Simulation based comparison of 24‐h area under the curve (AUC) values at day 3 and probability of target attainment (PTA) or toxicity (PTOX) for fixed dose regimens
Figure A4.
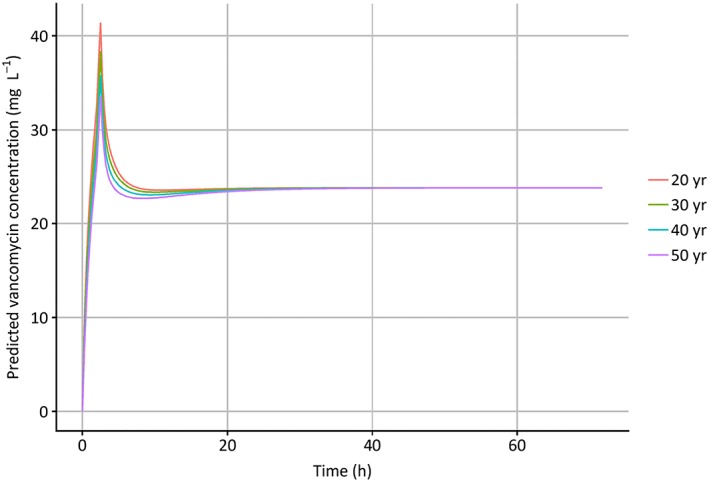
Predicted vancomycin concentration when administered to 4 individuals with a weight of 130 kg and varying age (20–50 years) after administration of a 1500 mg vancomycin dose (infusion rate 10 mg min−1) followed after 2 h by a continuous infusion of 35 mg kg−1 day−1
Figure A5.
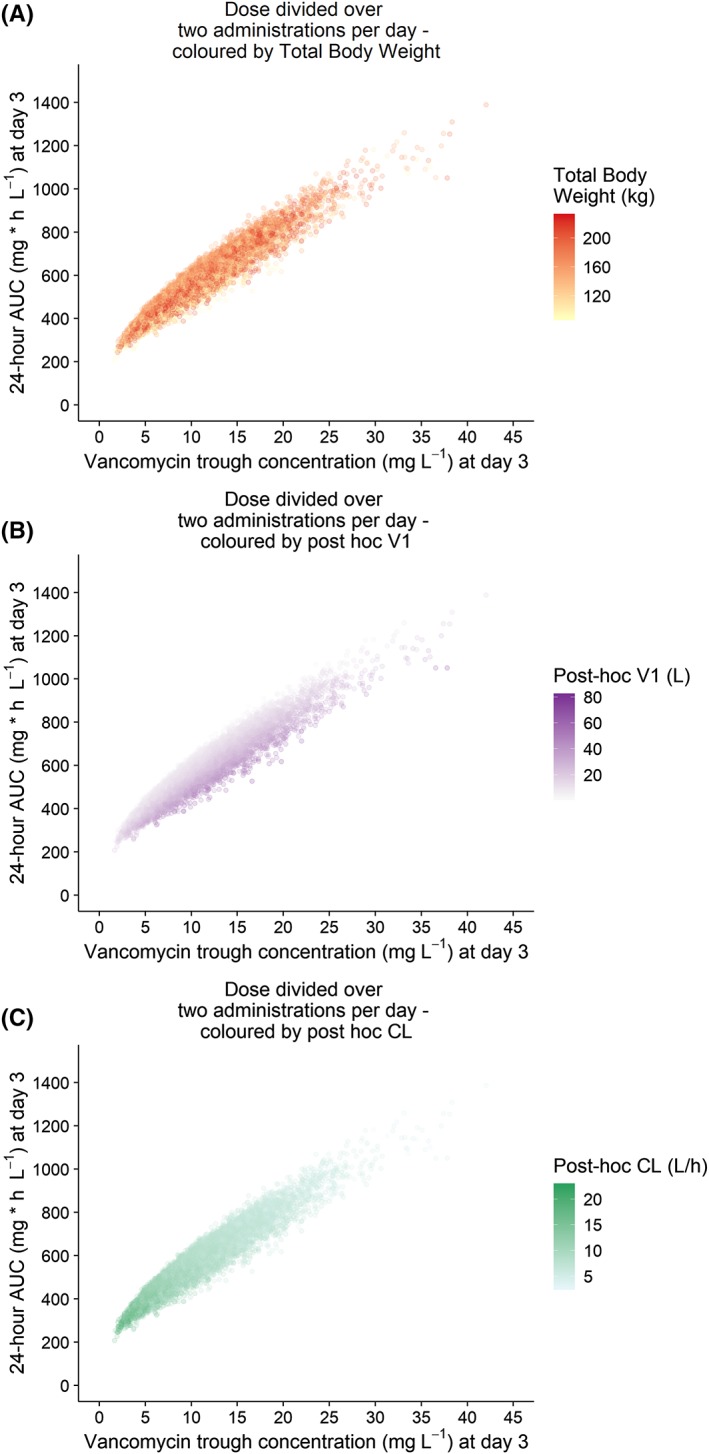
Twenty‐four‐hour area under the curve (AUC24h) at day 3 vs individual trough concentrations at day 3 based on Monte Carlo simulation in obese patients, using the final model, coloured by individual body weight, volume of distribution (V1) and clearance (CL)
Smit C, Wasmann RE, Goulooze SC, et al. Population pharmacokinetics of vancomycin in obesity: Finding the optimal dose for (morbidly) obese individuals. Br J Clin Pharmacol. 2020;86:303–317. 10.1111/bcp.14144
PI statement: The authors confirm that the shared Principal Investigators for this paper are Catherijne A.J. Knibbe, Roger J.M. Brüggemann and Eric P.A. van Dongen, and that Eric P.A. van Dongen had direct clinical responsibility for patients.
DATA AVAILABILITY STATEMENT
The data that support the findings of this study are available from the corresponding author upon reasonable request.
REFERENCES
- 1. Flegal KM, Kruszon‐Moran D, Carroll MD, Fryar CD, Ogden CL. Trends in obesity among adults in the United States, 2005 to 2014. JAMA. 2016;315(21):2284‐2291. [DOI] [PMC free article] [PubMed] [Google Scholar]
- 2. Falagas ME, Kompoti M. Obesity and infection. Lancet Infect Dis. 2006;6(7):438‐446. [DOI] [PubMed] [Google Scholar]
- 3. Smit C, De Hoogd S, Brüggemann RJM, Knibbe CAJ. Obesity and drug pharmacology: a review of the influence of obesity on pharmacokinetic and pharmacodynamic parameters. Expert Opin Drug Metab Toxicol. 2018;14(3):275‐285. [DOI] [PubMed] [Google Scholar]
- 4. Knibbe CAJ, Brill MJE, Van Rongen A, Diepstraten J, van der Graaf PH, Danhof M. Drug disposition in obesity: toward evidence‐based dosing. Annu Rev Pharmacol Toxicol. 2015;55(1):149‐167. [DOI] [PubMed] [Google Scholar]
- 5. Purrello SM, Garau J, Giamarellos E, et al. Methicillin‐resistant Staphylococcus aureus infections: a review of the currently available treatment options. J Glob Antimicrob Resist. 2016;7:178‐186. [DOI] [PubMed] [Google Scholar]
- 6. Marsot A, Boulamery A, Bruguerolle B, Simon N. Vancomycin: a review of population pharmacokinetic analyses. Clin Pharmacokinet. 2012;51(1):1‐13. [DOI] [PubMed] [Google Scholar]
- 7. Rybak MJ, Lomaestro BM, Rotschafer JC, et al. Vancomycin therapeutic guidelines: a summary of consensus recommendations from the infectious diseases Society of America, the American Society of Health‐System Pharmacists, and the Society of Infectious Diseases Pharmacists. Clin Infect Dis. 2009;49(3):325‐327. [DOI] [PubMed] [Google Scholar]
- 8. Moise PA, Forrest A, Bhavnani SM, Birmingham MC, Schentag JJ. Area under the inhibitory curve and a pneumonia scoring system for predicting outcomes of vancomycin therapy for respiratory infections by Staphylococcus aureus . Am J Health Syst Pharm. 2000;57(suppl_2):S4‐S9. [DOI] [PubMed] [Google Scholar]
- 9. Moise‐Broder PA, Forrest A, Birmingham MC, Schentag JJ. Pharmacodynamics of vancomycin and other antimicrobials in patients with Staphylococcus aureus lower respiratory tract infections. Clin Pharmacokinet. 2004;43(13):925‐942. [DOI] [PubMed] [Google Scholar]
- 10. Song KH, Kim HB, Kim HS, et al. Impact of area under the concentration‐time curve to minimum inhibitory concentration ratio on vancomycin treatment outcomes in methicillin‐resistant Staphylococcus aureus bacteraemia. Int J Antimicrob Agents. 2015;46(6):689‐695. [DOI] [PubMed] [Google Scholar]
- 11. Kullar R, Davis SL, Levine DP, Rybak MJ. Impact of vancomycin exposure on outcomes in patients with methicillin‐resistant staphylococcus aureus bacteremia: support for consensus guidelines suggested targets. Clin Infect Dis. 2011;52(8):975‐981. [DOI] [PubMed] [Google Scholar]
- 12. Zelenitsky S, Rubinstein E, Ariano R, et al. Vancomycin pharmacodynamics and survival in patients with methicillin‐resistant Staphylococcus aureus‐associated septic shock. Int J Antimicrob Agents. 2013;41(3):255‐260. [DOI] [PubMed] [Google Scholar]
- 13. Rybak M, Lomaestro B, Rotschafer JC, et al. Therapeutic monitoring of vancomycin in adult patients: a consensus review of the American Society of Health‐System Pharmacists, the Infectious Diseases Society of America, and the Society of Infectious Diseases Pharmacists. Am J Health Syst Pharm. 2009;66(1):82‐98. [DOI] [PubMed] [Google Scholar]
- 14. Neely MN, Youn G, Jones B, et al. Are vancomycin trough concentrations adequate for optimal dosing? Antimicrob Agents Chemother. 2013;58(1):309‐316. [DOI] [PMC free article] [PubMed] [Google Scholar]
- 15. Janssen EJH, Välitalo PAJ, Allegaert K, et al. Towards rational dosing algorithms for vancomycin in neonates and infants based on population pharmacokinetic modeling. Antimicrob Agents Chemother. 2016;60(2):1013‐1021. [DOI] [PMC free article] [PubMed] [Google Scholar]
- 16. Zasowski EJ, Murray KP, Trinh TD, et al. Identification of vancomycin exposure‐toxicity thresholds in hospitalized patients receiving intravenous vancomycin. Antimicrob Agents Chemother. 2017;62(1):1‐9. [DOI] [PMC free article] [PubMed] [Google Scholar]
- 17. Lodise TP, Lomaestro B, Graves J, Drusano GL. Larger vancomycin doses (at least four grams per day) are associated with an increased incidence of nephrotoxicity. Antimicrob Agents Chemother. 2008;52(4):1330‐1336. [DOI] [PMC free article] [PubMed] [Google Scholar]
- 18. ANI Pharmaceuticals Inc . VANCOCIN® HCl Vancomycin Hydrochloride for Injection USP ‐ Label. 2017: 1–18.
- 19. Adane ED, Herald M, Koura F. Pharmacokinetics of vancomycin in extremely obese patients with suspected or confirmed Staphylococcus aureus infections. Pharmacotherapy. 2015;35(2):127‐139. [DOI] [PubMed] [Google Scholar]
- 20. Bauer LA, Black DJ, Lill JS. Vancomycin dosing in morbidly obese patients. Eur J Clin Pharmacol. 1998;54(8):621‐625. [DOI] [PubMed] [Google Scholar]
- 21. Blouin RA, Bauer LA, Miller DD, Record KE, Griffen WO. Vancomycin pharmacokinetics in normal and morbidly obese subjects. Antimicrob Agents Chemother. 1982;21(4):575‐580. [DOI] [PMC free article] [PubMed] [Google Scholar]
- 22. Crass RL, Dunn R, Hong J, Krop LC, Pai MP. Dosing vancomycin in the super obese: less is more. J Antimicrob Chemother. 2018;73(11):3081‐3086. [DOI] [PubMed] [Google Scholar]
- 23. Ducharme MP, Slaughter RL, Edwards DJ. Vancomycin pharmacokinetics in a patient population: effect of age, gender, and body weight. Ther Drug Monit. 1994;16(5):513‐518. [DOI] [PubMed] [Google Scholar]
- 24. Vance‐Bryan K, Guay DR, Gilliland SS, Rodvold KA, Rotschafer JC. Effect of obesity on vancomycin pharmacokinetic parameters as determined by using a Bayesian forecasting technique. Antimicrob Agents Chemother. 1993;37(3):436‐440. [DOI] [PMC free article] [PubMed] [Google Scholar]
- 25. Demirovic JA, Pai AB, Pai MP. Estimation of creatinine clearance in morbidly obese patients. Am J Health Syst Pharm. 2009;66(7):642‐648. [DOI] [PubMed] [Google Scholar]
- 26. Lindbom L, Pihlgren P, Jonsson N. PsN‐toolkit‐‐a collection of computer intensive statistical methods for non‐linear mixed effect modeling using NONMEM. Comput Methods Programs Biomed. 2005;79(3):241‐257. [DOI] [PubMed] [Google Scholar]
- 27. Beal SL, Sheiner LB, Boeckmann A. NONMEM user's guide. San Francisco, CA: University of California; 1999. [Google Scholar]
- 28. Keizer RJ, Karlsson MO, Hooker A. Modeling and simulation workbench for NONMEM: tutorial on Pirana, PsN, and Xpose. CPT Pharmacometrics Syst Pharmacol. 2013;2(6):1‐9.e50. [DOI] [PMC free article] [PubMed] [Google Scholar]
- 29. R Core Team . R: A language and environment for statistical computing. 2015.
- 30. Beal SL. Ways to fit a PK model with some data below the quantification limit. J Pharmacokinet Pharmacodyn. 2001;28(5):481‐504. [DOI] [PubMed] [Google Scholar]
- 31. Bergstrand M, Hooker AC, Wallin JE, Karlsson MO. Prediction‐corrected visual predictive checks for diagnosing nonlinear mixed‐effects models. AAPS J. 2011;13(2):143‐151. [DOI] [PMC free article] [PubMed] [Google Scholar]
- 32. Janmahasatian S, Duffull SB, Ash S, Ward LC, Byrne NM, Green B. Quantification of lean bodyweight. Clin Pharmacokinet. 2005;44(10):1051‐1065. [DOI] [PubMed] [Google Scholar]
- 33. Bauer LA, Edwards WAD, Dellinger EP, Simonowitz DA. Influence of weight on aminoglycoside pharmacokinetics in normal weight and morbidly obese patients. Eur J Clin Pharmacol. 1983;24(5):643‐647. [DOI] [PubMed] [Google Scholar]
- 34. McCarron M, Devine B. Clinical pharmacy: case studies: case number 25 gentamicin therapy. Drug Intell Clin Pharm. 1974;8(11):650‐655. [Google Scholar]
- 35. Goulooze SC, Völler S, Välitalo PAJ, et al. The influence of normalization weight in population pharmacokinetic covariate models. Clin Pharmacokinet. 2019;58(1):131‐138. [DOI] [PMC free article] [PubMed] [Google Scholar]
- 36. Dosne A‐G, Bergstrand M, Harling K, Karlsson MO. Improving the estimation of parameter uncertainty distributions in nonlinear mixed effects models using sampling importance resampling. J Pharmacokinet Pharmacodyn. 2016;43(6):583‐596. [DOI] [PMC free article] [PubMed] [Google Scholar]
- 37. Brill MJE, Diepstraten J, Van Rongen A, Van Kralingen S, Van den Anker JN, Knibbe CAJ. Impact of obesity on drug metabolism and elimination in adults and children. Clin Pharmacokinet. 2012;51(5):277‐304. [DOI] [PubMed] [Google Scholar]
- 38. American Society of Hospital Pharmacy . Therapeutic monitoring of vancomycin: A revised consensus guideline and review of the American Society of Health‐System Pharmacists, the Infectious Diseases Society of America, the Pediatric Infectious Diseases Society and the Society of Infectious Diseases Pharmacists. https://www.ashp.org/-/media/assets/policy-guidelines/docs/draft-guidelines/draft-guidelines-ASHP-IDSA-PIDS-SIDP-therapeutic-vancomycin.ashx.: Accessed July 12th, 2019.
- 39. European Medicines Agency . Guideline on the use of pharmacokinetics and pharmacodynamics in the development of antimicrobial medicinal products.; 2016.
- 40. de Velde F, Mouton JW, de Winter BCM, van Gelder T, Koch BCP. Clinical applications of population pharmacokinetic models of antibiotics: challenges and perspectives. Pharmacol Res. 2018;134:280‐288. [DOI] [PubMed] [Google Scholar]
Associated Data
This section collects any data citations, data availability statements, or supplementary materials included in this article.
Data Availability Statement
The data that support the findings of this study are available from the corresponding author upon reasonable request.


