Abstract
Purpose:
To evaluate the quantitative accuracy and dose efficiency of simultaneous imaging of two contrast agents using dual-energy computed tomography (DECT), two imaging tasks each representing one potential clinical application were investigated in a phantom study: biphasic liver imaging with iodine and gadolinium, and small bowel imaging with iodine and bismuth.
Methods:
To separate and quantify mixtures of two contrast agents using a single DECT scan, mixed iodine and gadolinium samples were prepared with the contrast enhancement values corresponding to the late arterial (iodine) and the portal-venous (gadolinium) phase for biphasic liver imaging. Mixed iodine and bismuth samples were prepared mimicking the arterial (iodine) and the enteric (bismuth) enhancement for small bowel imaging. For comparison to the reference condition of performing two single-energy CT (SECT) scans, contrast samples were prepared separately to mimic separate scans in the arterial/venous phase and arterial/enteric enhancement. Samples were placed in a 35 cm wide water tank and scanned using a third-generation dual-source DECT scanner with three tube potential pairs: 80/Sn150, 90/Sn150, and 100/Sn150 kV, all with default dose partitioning between two x-ray beams to acquire DECT data. The same scanner operated in a single-energy mode acquired SECT data (120 kV). Total radiation dose (CTDIvol) was matched for the single-scan DECT and the two-scan SECT protocols. The DECT protocol was followed by a generic image-based three-material decomposition method to determine the material-specific images, based on which concentrations of each basis material were quantified and noise levels were measured. To compare with the SECT images directly acquired with the SECT protocol, the concentration values in each contrast-specific image were converted to CT numbers at 120 kV (i.e., virtual SECT (vSECT) images). The noise level and noise power spectra differences between the SECT and vSECT images were compared to evaluate the dose efficiency of the single-scan DECT protocol. The impact of dose partitioning in the DECT protocol on quantitative dual-contrast imaging performance was also studied.
Results:
For each imaging task, contrast materials were accurately quantified against the nominal concentrations using the DECT data with strong correlation (R2 ≥ 0.98 for both imaging tasks). Compared to the SECT protocol, the DECT protocol was not dose efficient. With the optimal x-ray tube potential pair 80/Sn150 kV, the noise level in vSECT images increased by 401%/488% (arterial/portal-venous) for the biphasic liver imaging task and by 10%/41% (arterial/enteric) for the small bowel imaging task compared to that in SECT images. The corresponding radiation dose increase is 2410%/3357% for the biphasic liver imaging task and 21%/99% for the small bowel imaging task, respectively, to achieve the same noise as that in SECT images. This could be improved by adjusting the dose partitioning in DECT.
Conclusions:
DECT can be used to simultaneously separate and quantify two contrast materials. However, compared to a two-scan SECT protocol, much higher radiation dose is needed in a single-scan DECT protocol to achieve the same image noise, especially for tasks involving the dual contrast of iodine and gadolinium.
Keywords: computed tomography (CT), dose efficiency, dual-contrast imaging, dual-energy CT (DECT), material decomposition, single-energy CT (SECT)
1. INTRODUCTION
Simultaneous imaging of two or more contrast agents has received much attention in recent years with two key clinical benefits claimed.1–5 First, it might reduce radiation dose by allowing omission of some of the scans. For example, biphasic liver imaging can be performed with a single computed tomography scan following sequential injections of iodine and gadolinium, with iodine enhancement corresponding to the late arterial phase and gadolinium to the portal-venous phase in liver parenchyma. Subsequent material decomposition analysis would then be used to separate the iodine (arterial phase) from the gadolinium (venous phase).6,7 Second, different from multiphase scans, which could suffer from misalignment between scans due to patient motion, different enhancement phases obtained from one single CT scan could have perfect or near perfect image alignment.
The use of two or more contrast agents has been primarily proposed and demonstrated using photon-counting-detector-based multienergy CT (MECT) systems in multiple simulation studies, and phantom and animal experiments.6–10 The use of dual-energy CT (DECT) to perform simultaneous imaging of two or more contrast agents (referred to as dual- or multicontrast imaging), however, has received less attention. With two contrast agents, a mixture of at least three materials (contrast materials and background materials) needs to be decomposed into the basis materials due to the take up of the contrast agent into biological tissues, such as blood or soft tissue. In principle, DECT can solve the three-material mixture problem when an additional physical constraint (e.g., volume conservation) is incorporated, assuming that the material of interest is known to be composed of only the three basis materials.11 Three-material decomposition has been widely used in clinical DECT systems for many applications that involve either no or only one contrast agent, such as decomposition of iodine, soft tissue, and fat in virtual noncontrast imaging of the liver12 and calcium, red marrow, and yellow marrow in bone mineral density quantification.13,14 For dual-contrast imaging, only a few qualitative experimental studies have been performed on commercially available DECT systems to explore its feasibility.15–21 The material separation demonstrated in these studies, while appearing to be successful, was either qualitative without analysis of quantitative accuracy,15–20 or quantitative but limited to small object sizes suitable only for preclinical applications.21 More importantly, one of the major motivations for performing simultaneous dual-contrast imaging is to reduce radiation dose.6–10 While it is well known that the process of material decomposition amplifies image noise and is therefore less dose efficient, the magnitude of this dose inefficiency has not been well established, particularly for the potential application of performing a single DECT scan to image two contrast agents vs performing two separate single-energy CT (SECT) scans.
The purpose of this study, therefore, is to determine (a) the quantification accuracy of the concentration for each basis material and (b) the dose efficiency of using DECT to separate and quantify mixtures of two unique contrast agents.
2. MATERIALS AND METHODS
2.A. Target clinical applications and protocols
2.A.1. Biphasic liver imaging
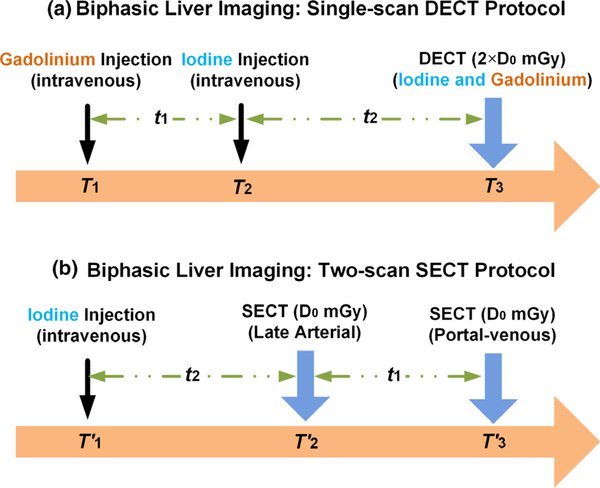
In the single-scan DECT protocol (hereafter referred to as the DECT protocol) for biphasic liver imaging [Fig. 1(a)], two intravenous contrast agents are injected with gadolinium at time T1 and iodine at time T2, and one DECT scan is performed at time T3. The time delay between the two injections (t1) and between iodine injection and DECT scan (t2) would be determined by the enhancement phases of interest. Essentially, a total delay time (t1 + t2) is required for a bolus of contrast material (gadolinium) to move all the way to the venous structures of the liver, and the second delay time (t2) is required for a bolus of contrast material (iodine) to move to the arterial structures of the liver. By this design, the iodine enhancement values would correspond to the late arterial phase and the gadolinium enhancement values would correspond to the portal-venous phase. Of note, the sequence of injecting gadolinium and iodine intravenous contrast agents may be reversed. After the DECT scan which is to simultaneously image the two contrast agents, material decomposition is followed to separate and quantify each of them (Section 2.D).
Fig. 1.
Potential clinical application of biphasic liver imaging: (a) single-scan dual energy computed tomography (CT) protocol and (b) two-scan single energy CT protocol; the total radiation dose levels were matched between the two protocols (CTDIvol: volume computed tomography dose index).
In the reference condition of performing two single-energy CT (SECT) scans [i.e., two-scan SECT protocol, hereafter referred to as the SECT protocol, Fig. 1(b)], one intravenous contrast agent (iodine) is injected at time . As labeled in Fig. 1(b), the delay time (t2) is required for a bolus of contrast material (iodine) to move to the arterial structures of the liver, and the additional delay time (t1) is required for the same bolus of contrast material to further move to the venous structures of the liver. Two SECT scans are performed, one at time for iodine enhancement corresponding to the late arterial phase and the other at time for iodine enhancement corresponding to the portal-venous phase. The radiation dose (CTDIvol) for each SECT scan (D0 mGy) is determined as half of the dose for the DECT scan (2 × D0 mGy), resulting in a matched total radiation dose between the two protocols, to evaluate the dose efficiency of the DECT protocol vs the SECT protocol (Section 2.E).
2.A.2. Small bowel imaging
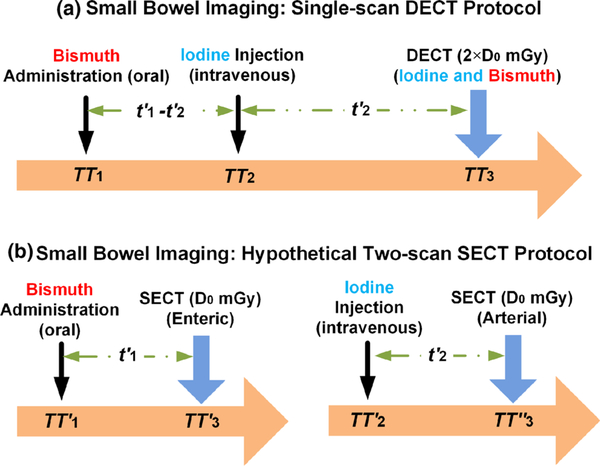
In the DECT protocol for small bowel imaging [Fig. 2(a)], bismuth oral contrast agent is administered at time TT1, iodine intravenous contrast agent is injected at time TT2, and one DECT scan is performed at time TT3. The time delay between the administration of bismuth and the injection of iodine , and between iodine injection and DECT scan would be determined by the enhancement phases of interest. Essentially, a delay time is required for oral contrast agent (bismuth) to move to the small bowel lumen, and a delay time is required for a bolus of contrast material (iodine) to move to the small bowel wall. By this design, the iodine enhancement values would correspond to the arterial phase and the bismuth enhancement values to the enteric phase. After the DECT scan which is to simultaneously image the two contrast agents, material decomposition is followed to separate and quantify each of them (Section 2.D).
Fig. 2.
Potential clinical application of small bowel imaging: (a) single-scan dual energy computed tomography protocol and (b) two-scan single energy CT protocol; the total radiation dose levels were matched between the two protocols.
For comparison to the reference condition, a hypothetical SECT protocol is designed for small bowel imaging where the bismuth oral contrast is administered at time and the iodine intravenous contrast is injected at time to the patients through two separate procedures, as illustrated in Fig. 2(b). Similarly, the delay time is required for bismuth and iodine to move to the small bowel lumen and the small bowel wall, respectively. Two SECT scans are performed, one at time for bismuth enhancement corresponding to the enteric phase and the other at time for iodine enhancement corresponding to the arterial phase. Again, the total radiation dose between the two protocols is matched as 2 × D0 mGy to evaluate the dose efficiency of the DECT protocol vs the SECT protocol (Section 2.E).
2.B. Experimental phantom design
2.B.1. Biphasic liver imaging
To determine the ability of the DECT protocol [Fig. 1(a)], followed by material decomposition, to separate and quantify mixtures of iodine and gadolinium contrast agents used for biphasic liver imaging, one set of mixed iodine and gadolinium samples was prepared using iodine-based Iohexol (Omnipaque 350, GE Healthcare, Princeton, NJ) and gadolinium-based gadopentetate dimeglumine (Magnevist, Bayer Healthcare, Whippany, NJ). For the reference condition of the SECT protocol [Fig. 1(b)], two sets of iodine contrast samples were prepared, with the enhancement values corresponding to the late arterial and portal-venous phases, respectively. Note that these two sets of iodine contrast samples were not mixed and were scanned separately, to mimic separate scans in the arterial/venous phases.
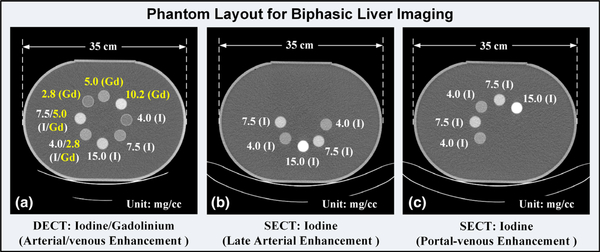
Contrast samples were poured into plastic cylindrical tubes (2.54 cm diameter and 7.00 cm length), which were placed in a 35 cm water tank (measured laterally) to simulate the attenuation of a medium-size patient. In the current study, the water tank was designed as a phantom to represent a human abdomen. Sample CT images illustrating the phantom layout with labeled material types and concentrations are shown in Fig. 3(a) for the DECT protocol, and 3b and 3c for the SECT protocol.
Fig. 3.
Sample computed tomography (CT) images showing the phantom layout for biphasic liver imaging: (a) mixed iodine and gadolinium samples with iodine contrast enhancement values corresponding to the late arterial phase and gadolinium to the portal-venous phase in the dual energy CT protocol, (b) one set of iodine samples corresponding to the late arterial phase enhancement in the single energy CT (SECT) protocol, and (c) the other set of iodine samples corresponding to the portal-venous phase in the SECT protocol.
2.B.2. Small bowel imaging
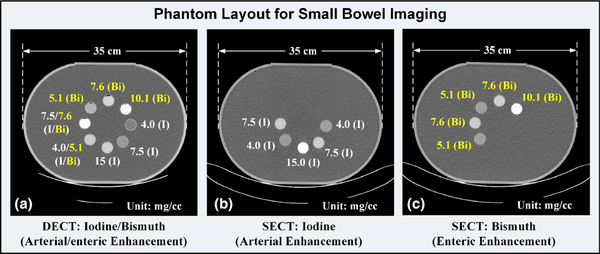
To determine the ability of the DECT protocol [Fig. 2(a)], followed by material decomposition, to separate and quantify mixtures of iodine and bismuth contrast agents used for small bowel imaging, a set of mixed iodine and bismuth samples was prepared using identical iodine-based Iohexol and bismuth-based bismuth subsalicylate (Pepto-Bismol, Proctor&Gamble, Cincinnati, Ohio), with the iodine representing the arterial enhancement and the bismuth representing the enteric enhancement. Note that the bismuth subsalicylate was used in the current study to mimic a bismuth-based oral contrast agent. For the reference condition of the SECT protocol [Fig. 2(b)], one set of iodine samples and one set of bismuth samples were prepared to mimic the arterial and enteric enhancements, respectively. Note that these two sets of contrast samples were not mixed and were scanned separately, to mimic separate scans in the arterial/enteric phases. The samples were contained in identical plastic cylindrical tubes and then placed in the identical water tank phantom, as for biphasic liver imaging. Sample CT images illustrating the phantom layout with labeled iodine and bismuth concentrations are shown in Fig. 4.
Fig. 4.
Sample computed tomography (CT) images showing the phantom layout for small bowel imaging: (a) mixed iodine and bismuth samples with iodine contrast enhancement values corresponding to the arterial phase and bismuth to the enteric phase in the dual energy CT protocol, (b) one set of iodine samples corresponding to the arterial phase enhancement in the single energy CT (SECT) protocol, and (c) one set of bismuth samples corresponding to the enteric phase enhancement in the SECT protocol.
2.C. Data acquisition
The phantoms prepared for the DECT protocol were scanned by a third-generation dual-source DECT (DS-DECT) scanner (SOMATOM Force, Siemens Healthineers) with three x-ray tube potential pairs (80/Sn150, 90/Sn150, and 100/Sn150 kV [Sn: 0.6 mm]), with identical radiation dose level and default dose partitioning between two x-ray beams (i.e., 58%, 63%, and 74% of the total dose were delivered to the low-energy beam, respectively). Spectra for selected DECT tube potentials are plotted in Figs. 5(a) and 5(b), along with the mass attenuation coefficient (MAC) curves for iodine, gadolinium, and water for the biphasic liver imaging task, and iodine, bismuth, and water for the small bowel imaging task. As noted in Fig. 5, the K-edge of the contrast material leads to a sudden increase of MAC across the K-edge energy. This material-specific K-edge discontinuity, for example, 50.2 keV for gadolinium, and 90.5 keV for bismuth, contributes to the intrinsic difference for each high-Z material in terms of attenuation characteristics beyond the two fundamental effects: photoelectric and Compton. Therefore, it is possible to distinguish multiple K-edge materials among each other and from other materials (i.e., water background) without obvious K-edge in diagnostic energy range. In order to fully utilize the K-edge effect, the discontinuity in the MAC curve should be captured by different energy beams, in particular with DECT that the low-energy beam corresponding to the attenuation below the K-edge and the high-energy beam to that above the K-edge. Note that there are too few photons in the low-energy x-ray beams below iodine’s K-edge energy (33.2 keV), so iodine is not typically considered as a K-edge material. The capability of performing quantitative dual-contrast imaging in DECT, therefore, depends on the other contrast agent’s K-edge, such as gadolinium (50.2 keV) in biphasic liver imaging and bismuth (90.5 keV) in small bowel imaging. How well the K-edge discontinuity is captured could be mathematically reflected by the condition number of the coefficient matrix, as will be discussed in Section 2.D. The phantoms prepared for the SECT protocol were scanned by the same DS-DECT scanner operated in a single-energy mode with a tube potential of 120 kV. The information about data acquisition geometry, radiation dose, and image reconstruction is summarized in Table I.
Fig. 5.
Mass attenuation coefficient (MAC) curves for (a) iodine (K-edge: 33.2 keV) and gadolinium (50.2 keV) for biphasic liver imaging task, and (b) iodine and bismuth (90.5 keV) for small bowel imaging task; the dual energy computed tomography spectra used for phantom scan and MAC curve for water were also plotted. Note: all plots share the same horizontal axis (Energy), while MAC curves use the primary vertical axis, and spectral curves use the secondary vertical axis.
Table I.
Data acquisition geometry, radiation dose, and image reconstruction in dual-energy computed tomography (DECT) and single-energy computed tomography (SECT).
| Contrast material(s) | Two contrast agents (iodine and gadolinium) or (iodine and bismuth) |
One contrast agent (iodine or bismuth) |
|||
|---|---|---|---|---|---|
| Tube potential (kV) | 80/Sn150 | 90/Sn150 | 100/Sn150 | 120 | |
| Mean energy (keV) | [52.2 98.7] | [55.8 98.7] | [58.9 98.7] | 64.4 | |
| Pitch | 0.6 | ||||
| Rotation time (s) | 0.5 | ||||
| Effective mAs | 665/316 | 486/286 | 407/199 | 164 for each scan | |
| Collimation (mm) | 96 × 0.6 | ||||
| Slice thickness/increment (mm) | 3.0/2.8 | ||||
| CTDIvol (mGy) | (80 kV + Sn150 kV): 12.8 + 9.2 = 22.0 |
(90 kV + Sn150 kV): 14.0 + 8.4 = 22.4 |
(100 kV + Sn150 kV): 16.4 + 5.8 = 22.2 |
(120 kV + 120 kV): 11.0 + 11.0 = 22.0 |
|
| Reconstruction kernel | Qr40 |
2.D. Basis material decomposition and quantitative accuracy analysis
The DECT protocol was followed by material decomposition to separate and quantify each contrast agent. In this study, a generic image-based material decomposition method was employed to determine the basis material concentrations at each pixel using two x-ray beam measurements and an additional physical constraint (e.g., volume conservation),5,22–25 as given by:
| (1) |
where and represent the contrast and the background material concentrations to be determined for each pixel, respectively, denotes the CT numbers, (Hounsfield unit: HU) of the pixel under consideration at energy EL and EH, each subtracting the CT numbers of the corresponding background material , A is the coefficient matrix determined beforehand by using a calibration procedure for the first ( and )and the second contrast material at EL and EH, and and are the mass density of the contrast materials in their pure forms. Here, two contrast materials, m1 and m2, imply iodine and gadolinium in biphasic liver imaging, respectively, and iodine and bismuth in small bowel imaging, respectively. The background material map in Eq. (1) is determined based on the volume conservation, assuming that the sum of the volumes of each basis material is equal to the volume of the mixture. Here, denotes the mass density of the background material in its pure form. Note that in the current phantom study, the background material is water with . The Eq. (1) can be simplified as
| (2) |
Suppose the measurement noise is given by and the corresponding noise in the solution of the linear system is , according to the definition of the condition number for a linear equation system, the upper bound of the relative noise, , is given by26,27
| (3) |
where cond(•) and ||•|| denote the condition number of a matrix and the norm of a vector, respectively. To quantify the noise magnification in the material decomposition process, a single figure of merit (FOM) is defined as , which incorporates the condition number of the coefficient matrix (A) and CT numbers in the DECT images. It should be noted that this FOM reflects the intrinsic property of the imaging system, essentially the DECT spectra, and does not rely on the radiation dose level and dose partitioning in DECT scan. To determine the FOM for noise magnification analysis, a maximum circular region of interest (ROI) without touching the boundary of each contrast sample was drawn to measure the signal and the noise (standard deviation) in each DECT image.
After material decomposition, ROIs were drawn in each material-specific image to measure the concentrations and noise level using the same ROI-drawing method aforementioned. Linear regression analysis was performed between the measured and the nominal contrast material concentration values. In each contrast-specific map, the root mean square error (RMSE) was calculated as:
| (4) |
where m represents the basis material type (iodine, gadolinium, or bismuth), p is the total number of pixels in all circular ROIs, and stand for the measured and nominal concentrations, respectively, in i’th pixel for m’th basis material.
2.E. Dose efficiency evaluation
To compare with the SECT images acquired directly with the SECT protocol, the mixture of contrast agent with water at a certain concentration value needed to be converted to CT numbers at 120 kV through a calibration procedure. The conversion at this particular x-ray tube potential or energy is to provide a fair comparison with the original SECT images acquired at 120 kV in the SECT protocol. The converted SECT images at 120 kV are referred hereafter to as virtual SECT (vSECT) images. The vSECT at 120 kV (mean energy: 70 keV) yields images with noise level close to optimum. Specifically, the vSECT image for late arterial phase in biphasic liver imaging is represented by iodine-specific image, while that for the portal-venous phase is represented by gadolinium-specific image. Similarly, the vSECT image for arterial enhancement in small bowel imaging is represented by iodine-specific image, while that for enteric enhancement is represented by bismuth-specific image. Thus, the conversion process can be described as:
| (5) |
where denotes the vSECT images at are the conversion factors/coefficients calibrated at a 120 kV x-ray beam for the two contrast materials in each imaging task, respectively. Note that Eq. (5) represents the CT number of a mixture of contrast agent with water at a concentration value of in which the water component is inherently included.
The difference in noise between vSECT images acquired with the DECT protocol, as well as the material decomposition process, and the original SECT images acquired with the SECT protocol at matched radiation dose was calculated as:
| (6) |
The dose difference could also be determined based on the noises in original SECT images and in vSECT images, as if the same image noise was targeted for two protocols28:
| (7) |
In addition to the calculation of noise level, the noise power spectra (NPS) of SECT and vSECT images were also generated from the water phantom scans. A total of 20 square ROIs (25 × 25 mm2) located on a 100 mm radius circle were extracted from the SECT/vSECT images obtained from the water scan. The NPS curves of each SECT/vSECT image were calculated using the method presented in Ref. [29] and then averaged among 20 ROIs and seven consecutive images.
2.F. Dose partitioning analysis
Note that all the DECT data were acquired at the default dose partitioning between two DECT x-ray beams. To further analyze the impact of dose partitioning on dual-contrast imaging, we derived the variance in vSECT images for each contrast material, as given by:
| (8) |
| (9) |
where |A| denotes the determinant of coefficient matrix A, and VL and VH represent the variances in low-energy image and high-energy image , respectively. Note the covariance term between two energy images and is negligible due to independent measurement of the dual-source system.
We assumed that the variance of the CT image is inversely proportional to the radiation dose used in the measurement. In DECT, we have:
| (10) |
| (11) |
where D(EL) and D(EH) represent the doses delivered to the low-energy and the high-energy x-ray beams, respectively, and k(EL) and k(EH) are the dose factors that could be determined experimentally.30
A dose partitioning factor α, the ratio between the dose delivered to the low-energy beam and the total dose (Dtot) is defined, and the doses delivered to two beams are given by:
| (12) |
| (13) |
Substituting Eqs. (10)–(13) into Eqs. (8) and (9), one can derive:
| (14) |
| (15) |
Differentiating V120kV,m1 and V120kV,m2 with respect to a separately and setting the derivatives to 0,,
| (16) |
| (17) |
one can derive that the optimized with minimum variances in are given by:
| (18) |
| (19) |
When the optimized dose partitioning factor is material dependent , the optimized value is determined as to minimize the combined variance , unless the noise property in one contrast-specific image is significantly more sensitive to the dose partitioning than the other, as given by:
| (20) |
3. RESULTS
3.A. Material decomposition images and quantitative analysis
3.A.1. Biphasic liver imaging with iodine and gadolinium
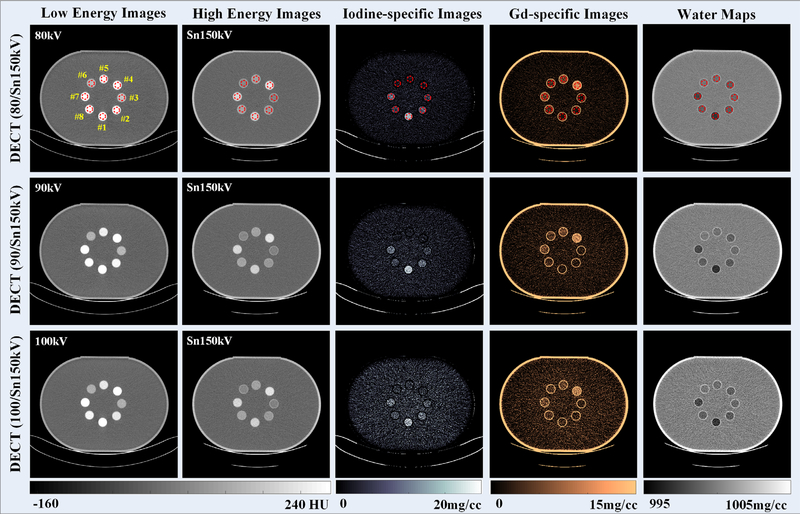
Figure 6 depicts DECT images reconstructed from low-energy and high-energy x-ray beams with three tube potential pairs. As expected, the CT number of both iodine and gadolinium samples decreased as the x-ray beam became harder, and these two contrast materials could not be visually differentiated on either low-energy or high-energy CT images. However, with the three-material decomposition algorithm implemented, iodine and gadolinium samples could be successfully identified and separated (the third and the fourth columns, respectively) for three DECT tube potential pairs.
Fig. 6.
Computed tomography images reconstructed from low-energy (first column) and high-energy (second column) x-ray beams; iodine-specific images (third column), gadolinium-specific images (fourth column), and water maps (fifth column); of note, the window/level was 10/1000 mg/cc for water maps to reflect the subtle density variations in contrast sample areas when they are removed.
The concentration values of iodine and gadolinium samples were measured in iodine-specific and gadolinium-specific images (Fig. 6: third and fourth columns, respectively), within the eight circular ROIs (noted in red, top row of Fig. 6). The measured concentration values were plotted against the nominal values in Fig. 7. Strong linear correlations between measured and nominal concentrations were found for both iodine and gadolinium samples with all the three DECT tube potential pairs (R2 ≥ 0.98, 0.89 ≤ slope ≤ 1.05, and −0.32 ≤ offset ≤ 1.05 mg/cc). The quantification biases (measured concentration values — nominal concentration values) in iodine-/gadolinium-specific images and water maps were summarized in Table II. Of note, the nominal concentration values in all ROIs in water map were derived based on iodine and gadolinium nominal concentration values using volume conservation. The error bars indicate the standard deviation of each measurement.
Fig. 7.
Linearity analysis between measured and nominal concentrations in iodine-specific and gadolinium-specific images using (a) 80/Sn150 kV, (b) 90/Sn150 kV, and (c) 100/Sn150 kV. Note: the primary vertical axis is defined for the measured iodine concentrations, and the secondary vertical axis is for the measured gadolinium concentrations.
Table II.
Quantification bias in material-specific images (iodine/gadolinium/water (I/Gd/W)).
| Sample 1 | Sample 2 | Sample 3 | Sample 4 | Sample 5 | Sample 6 | Sample 7 | Sample 8 | |
|---|---|---|---|---|---|---|---|---|
| Nominal concentration (I/Gd/W mg/cc) |
15.0/0.0/997.0 | 7.5/0.0/998.5 | 4.0/0.0/999.2 | 0.0/10.2/998.7 | 0.0/5.0/999.4 | 0.0/2.8/999.6 | 7.5/5.0/997.8 | 4.0/2.8/998.8 |
| Bias at 80/Sn150 (I/Gd/W mg/cc) |
0.4/−0.1/0.1 | −0.3/0.1/0.1 | 0.2/0.2/−0.0 | 0.7/−0.4/−0.1 | 0.4/−0.2/−0.0 | −0.1/−0.1/0.0 | 0.8/−0.5/−0.1 | 0.8/−0.5/−0.1 |
| Bias at 90/Sn150 (I/Gd/W mg/cc) |
0.4/0.3/−0.1 | 0.1/−0.2/−0.0 | −0.3/−0.2/0.0 | −0.4/0.3/0.0 | −0.1/0.1/0.0 | −0.6/0.4/0.1 | 0.2/−0.9/−0.0 | 1.2/−0.7/−0.2 |
| Bias at 100/Sn150 (I/Gd/W mg/cc) |
−1.1/−0.6/0.1 | 0.2/−0.2/−0.0 | 1.1/0.7/−0.1 | 0.0/0.0/−0.0 | 1.1/−0.7/−0.1 | 0.9/−0.7/−0.1 | 0.5/−0.4/−0.1 | 1.4/−0.2/−0.2 |
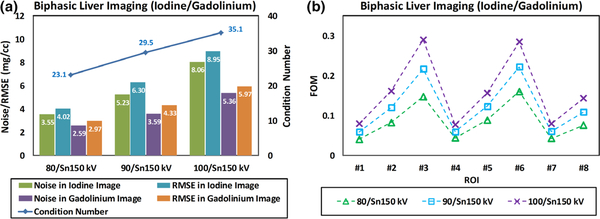
Figure 8(a) summarizes the noise levels and the RMSE values in both iodine-specific and gadolinium-specific images derived with three different tube potential pairs. The same ROIs in Fig. 6 were used for noise measurement. Also in Fig. 8(a), the condition numbers of the coefficient matrix for each DECT tube potential pair were plotted. FOM values representing the overall noise magnification in the material decomposition process were determined for each ROI for three DECT tube potential pairs and plotted in Fig. 8(b). The FOM values were consistent with noise levels in contrast-specific material maps.
Fig. 8.
(a) Summary of measured noise levels and root mean square error in iodine-specific and gadolinium-specific images; the condition number of coefficient matrix was also labeled; (b) figure of merit values calculated for eight region of interests with the overall trend being consistent with the noise measurements.
3.A.2. Small bowel imaging with iodine and bismuth
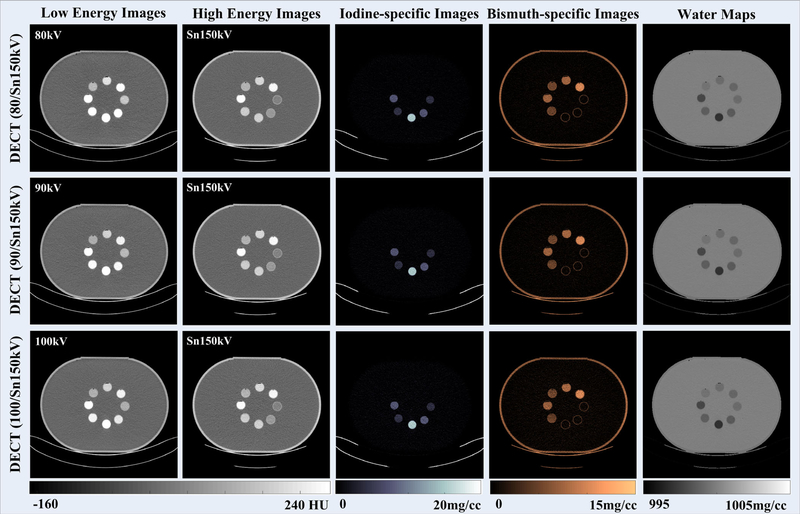
The DECT images reconstructed from low-energy and high-energy x-ray beams with three tube potential pairs are shown in Fig. 9. The CT number of iodine samples decreased as the x-ray beam became harder, while that of the bismuth samples did not change much due to its K-edge. However, these two contrast materials cannot be visually differentiated, especially for the mixed samples. With the three-material decomposition algorithm implemented, iodine and bismuth samples could be identified and separated (the third and the fourth columns, respectively) for the three DECT tube potential pairs. Note that the wall of the water tank in I/Bi water map (fifth column in Fig. 9) is not clearly observable as in I/Gd water map (fifth column in Fig. 6). However, the wall actually showed up on both maps if checking the concentration values closely. The reason for the major difference in visual impression is because of the very narrow display window width: [995 1005] mg/cc. In the I/Bi water map, the concentration value for water tank and that for water background are more close to each other, resulting in an impression that the water tank disappeared. This slight difference in water tank appearance between I/Gd and I/Bi is caused by the physical constraint of volume concentration specifically defined for basis material sets, I/Gd/Water and I/Bi/Water, respectively. The plastic material of the water tank itself does not belong to any of the three basis materials, so their values in the water map are slightly different. This, however, would not affect the quantification of contrast samples for either imaging task.
Fig. 9.
Computed tomography images reconstructed from low-energy (first column) and high-energy (second column) x-ray beams; iodine-specific images (third column), bismuth-specific images (fourth column), and water maps (fifth column); of note, the window/level was 10/1000 mg/cc for water maps to reflect the subtle density variations in contrast sample areas when they are removed.
The concentrations of iodine and bismuth samples were measured in iodine-specific and bismuth-specific images (Fig. 9: third and fourth columns, respectively), and plotted against the nominal values in Fig. 10. Strong linear correlations between measured and nominal concentrations were found for both iodine and bismuth samples with all the three DECT tube potential pairs (R2 = 1.00, 0.97 ≤ slope ≤ 0.99, and −0.03 ≤ offset ≤ 0.10 mg/cc). The quantification biases (measured concentration values — nominal concentration values) in iodine-/bismuth-specific images and water maps were summarized in Table III. Of note, the nominal concentration values in all ROIs in water map were derived based on iodine and bismuth nominal concentration values using volume conservation. The error bars indicate the standard deviation of each measurement.
Fig. 10.
Linearity analysis between measured and nominal concentrations in iodine-specific and bismuth-specific images using (a) 80/Sn150 kV, (b) 90/Sn150 kV, and (c) 100/Sn150 kV. Note: the primary vertical axis is defined for the measured iodine density, and the secondary vertical axis is for the measured bismuth density.
Table III.
Quantification bias in material-specific images (iodine/bismuth/water (I/Bi/W)).
| Sample 1 | Sample 2 | Sample 3 | Sample 4 | Sample 5 | Sample 6 | Sample 7 | Sample 8 | |
|---|---|---|---|---|---|---|---|---|
| Nominal concentration (I/Bi/W mg/cc) |
15.0/0.0/997.0 | 7.5/0.0/998.5 | 4.0/0.0/999.2 | 0.0/10.1/999.0 | 0.0/7.6/999.2 | 0.0/5.1/999.5 | 7.5/7.6/997.7 | 4.0/5.1/998.7 |
| Bias at 80/Sn150 (I/Bi/W mg/cc) |
0.1/−0.1/0.0 | −0.1/0.0/−0.0 | 0.0/−0.0/−0.0 | 0.0/0.1/0.0 | 0.2/−0.0/−0.0 | 0.0/0.1/0.1 | −0.4/−0.5/0.1 | 0.3/−0.5/−0.0 |
| Bias at 90/Sn150 (I/Bi/W mg/cc) |
0.2/0.0/0.0 | −0.1/−0.1/−0.0 | −0.0/0.6/−0.0 | 0.1/−0.0/0.0 | 0.1/−0.0/−0.0 | 0.0/0.1/0.0 | −0.3/−0.9/0.1 | 0.4/−0.3/−0.0 |
| Bias at 100/Sn150 (I/Bi/W mg/cc) |
0.3/0.0/0.0 | −0.2/0.1/−0.0 | −0.0/0.2/−0.0 | −0.0/−0.0/0.0 | −0.1/0.1/0.0 | −0.1/0.1/0.0 | −0.3/−0.4/0.1 | −0.4/−0.2/−0.0 |
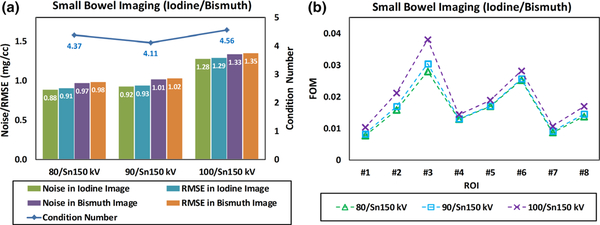
Figure 11 summarizes the noise levels and the RMSE values in both iodine-specific and bismuth-specific images derived with three different tube potential pairs. The condition numbers in Fig. 11(a) are similar because, given identical high-energy beam Sn150 kV, all x-ray photons in three low-energy beams are completely and almost completely below the K-edge energy of bismuth (90.5 keV). Particularly, 90/Sn150 kV provides the smallest condition number since the 90 kV is right below the K-edge. Compared to 100/Sn150 kV, 80/Sn150 kV is slightly better thanks to less spectral overlap. The condition numbers are not consistent with the noise levels in material-specific images because the CT numbers of input DECT images also play an important role in the noise magnification, as demonstrated in the definition of the FOM. As shown in Fig. 11(b), however, the FOM values were well consistent with the noise levels in each ROI of the contrast-specific images for three tube potential pairs.
Fig. 11.
(a) Summary of measured noise levels and root mean square error in iodine-specific and bismuth-specific images; the condition number of coefficient matrix was also labeled; (b) figure of merit values calculated for eight region of interests with the overall trend being consistent with the noise measurements.
3.B. Dose efficiency analysis
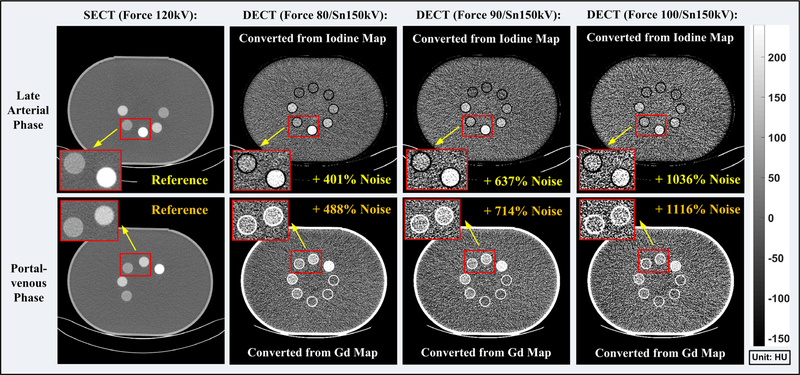
Figure 12 depicts SECT images and vSECT images at three different tube potential pairs for late arterial phase and portal-venous phase for biphasic liver imaging. The image noise level of both SECT and vSECT images was calculated as the standard deviation measured using identical ROIs as in Section 3.A.1. Compared with the SECT images, noise is significantly increased in the vSECT images at each phase, indicating that a much higher radiation dose is required in the DECT protocol in order to achieve comparable noise levels as in the SECT protocol. The noise difference between SECT and vSECT images at the same dose level and the corresponding dose difference at the same target noise were summarized in Table IV for each phase in biphasic liver imaging across all three x-ray tube potential pairs.
Fig. 12.
Single-energy computed tomography (CT) images (first column) acquired with the SECT protocol and the vSECT images generated from the dual-energy CT (DECT) protocol (2nd–4th columns) for the late arterial phase (upper row) and portal-venous phase (lower row), respectively. DECT are acquired with three different tube potential pairs (second column: 80/Sn150 kV; third column: 90/Sn150 kV; fourth column: 100/Sn150 kV). Note: the noise levels were measured in eight region of interests identical to those used in Section 3.A.1.
Table IV.
Overview of noise/dose difference in dual-energy computed tomography (CT) protocol in reference to single-energy CT protocol (biphasic liver imaging).
| Tube potential pair (kV) | Late arterial |
Portal-venous |
||
|---|---|---|---|---|
| Noise | Dose | Noise | Dose | |
| 80/Sn150 | 401% | 2410% | 488% | 3357% |
| 90/Sn150 | 637% | 5332% | 714% | 6526% |
| 100/Sn150 | 1036% | 12 805% | 1116% | 14 687% |
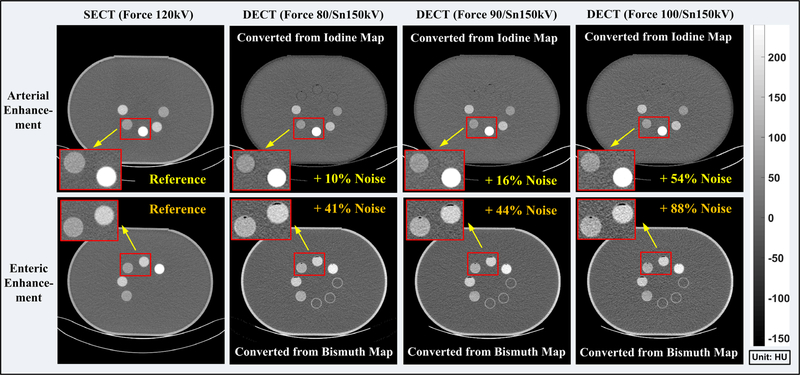
Figure 13 shows SECT images and vSECT images at three different tube potential pairs for arterial and enteric enhancement in small bowel imaging. Once again, noise level in the vSECT images increased compared with the SECT images, yet not as significant as in biphasic liver imaging. The noise difference between SECT and vSECT images at the same dose level and the corresponding dose difference at the same target noise were summarized in Table V for each phase in small bowel imaging across all three x-ray tube potential pairs.
Fig. 13.
Single-energy computed tomography (CT) images (first column) acquired with the SECT protocol and the vSECT images generated from the dual-energy CT (DECT) protocol (2nd–4th columns) for the arterial contrast enhancement (upper row) and enteric contrast enhancement (lower row), respectively. DECT are acquired with three different tube potential pairs (second column: 80/Sn150 kV; third column: 90/Sn150 kV; fourth column: 100/Sn150 kV). Note: the noise levels were measured in eight region of interests identical to those used in Section 3.A.1.
Table V.
Overview of noise/dose difference in dual-energy computed tomography (CT) protocol in reference to single-energy CT protocol (small bowel imaging).
| Tube potential pair (kV) | Arterial |
Enteric |
||
|---|---|---|---|---|
| Noise | Dose | Noise | Dose | |
| 80/Sn150 | 10% | 21% | 41% | 99% |
| 90/Sn150 | 16% | 35% | 44% | 107% |
| 100/Sn150 | 54% | 137% | 88% | 253% |
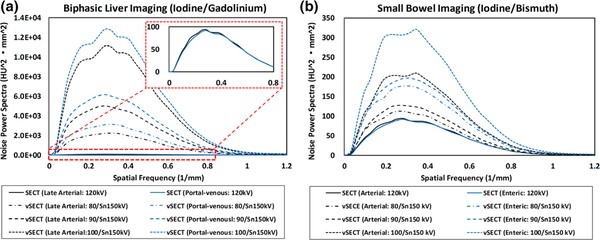
The NPS curves calculated for two imaging tasks were plotted in Fig. 14. All calculated NPS curves have similar shapes across SECT/vSECT images, phases/enhancements, and imaging tasks, indicating that the noise texture in all SECT/vSECT images is similar. The amplitudes are consistent with the visual observation and noise comparison (Figs. 12 and 13).
Fig. 14.
Noise power spectra (NPS) curves calculated on single-energy computed tomography (SECT)/virtual SECT images for (a) late arterial phase and portal-venous phase in biphasic liver imaging with iodine and gadolinium and (b) arterial enhancement and enteric enhancement in small bowel imaging with iodine and bismuth.
3.C. Dose partitioning analysis
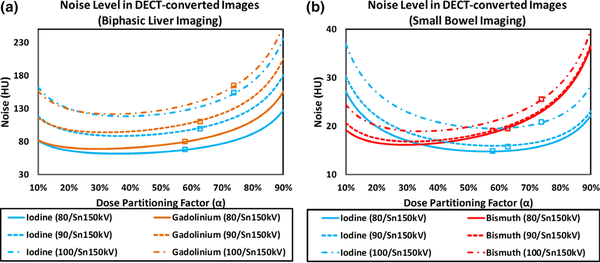
Using Eqs. (14) and (15), noise levels on vSECT images at the two phases for biphasic liver imaging and small bowel imaging are plotted with respect to the dose partitioning factor (α = 10% – 90% ) in Fig. 15.
Fig. 15.
Noise level on virtual single-energy computed tomography images with respect to the dose partitioning factor for (a) biphasic liver imaging with iodine and gadolinium, and (b) small bowel imaging with iodine and bismuth.
The noise levels measured on the vSECT images (Figs. 12 and 13) at default dose partitioning factor are labeled in Fig. 15, showing that the default dose partitioning between the two x-ray beams was not optimized for either imaging tasks. Based on the curves plotted in Fig. 15 and Eqs. (18), (19), (20), the optimized dose partitioning factors were determined and listed in Table VI.
Table VI.
Default and optimized dose partitioning factors (α) for both imaging tasks.
| Tube potential pair (kV) | Default | Biphasic
liver imaging |
Small
bowel imaging |
||||
|---|---|---|---|---|---|---|---|
| αI | αGd | αI,Gd | αI | αBi | αI,Bi | ||
| 80/Sn150 | 58% | 36% | 29% | 33% | 56% | 29% | 43% |
| 90/Sn150 | 63% | 37% | 32% | 34% | 58% | 32% | 45% |
| 100/Sn150 | 74% | 38% | 34% | 36% | 58% | 35% | 47% |
Tables VII and VIII summarize the noise levels on vSECT images at default and optimized dose partitioning factors. For most conditions, noise level on vSECT images with optimized dose partitioning factors was decreased in reference to that on vSECT images with default dose partitioning factors, except for the vSECT image corresponding to the arterial enhancement determined at 80/Sn150 kV.
Table VII.
Summary of noise level in virtual single-energy computed tomography (vSECT) images at default and optimized dose partitioning factor (α) for biphasic liver imaging; note: the percentages in the parentheses indicate the noise increase (+) or decrease (−) on vSECT images with optimized in reference to the default α.
| Tube potential pair (kV) | Biphasic liver
imaging |
|||
|---|---|---|---|---|
| Noise at default
α |
Noise at optimized
|
|||
| 80/Sn150 | 67.6 | 79.7 | 61.9 (−8.4%) | 69.3 (−13.0%) |
| 90/Sn150 | 99.6 | 110.3 | 88.8 (−10.8%) | 94.2 (−14.6%) |
| 100/Sn150 | 153.5 | 164.8 | 118.6 (−22.7%) | 121.8 (−26.1%) |
Table VIII.
Summary of noise level in virtual single-energy computed tomography (vSECT) images at default and optimized dose partitioning factor (α) for small bowel imaging; note: the percentages in the parentheses indicate the noise increase (+) or decrease (−) on vSECT images with optimized in reference to the default α.
| Tube potential pair (kV) | Small bowel imaging |
|||
|---|---|---|---|---|
| Noise at default
α |
Noise at optimized
αI,Bi |
|||
| 80/Sn150 | 14.9 | 19.1 | 15.3 (+2.7%) | 16.8 (−12.0%) |
| 90/Sn150 | 15.7 | 19.5 | 16.5 (+5.1%) | 17.5 (−10.3%) |
| 100/Sn150 | 20.8 | 25.5 | 20.0 (−3.8%) | 19.5 (−23.5%) |
4. DISCUSSION
A phantom study was performed to evaluate the quantitative accuracy and dose efficiency of dual-contrast imaging using DECT for two potential clinical imaging tasks: biphasic liver imaging with iodine and gadolinium, and small bowel imaging with iodine and bismuth. In both imaging tasks, two contrast agents were successfully decomposed and accurately quantified.
The performance of small bowel imaging using iodine and bismuth was much better than that of biphasic liver imaging using iodine and gadolinium in terms of noise properties. This effect can be explained as follows. Since it is almost impossible to capture iodine’s K-edge energy, as demonstrated in Figs. 5(a) and 5(b), the noise magnification in material decomposition is highly dependent on the K-edge energy of the second contrast agent. In Fig. 5(a), only a small portion of the photons in the low-energy x-ray beam is below the gadolinium’s K-edge, while in Fig. 5(b) almost all photons in the low-energy x-ray beam are below the bismuth’s K-edge. The balanced distribution of x-ray photons on both the low- and high-energy sides of the bismuth’s K-edge results in relatively small condition numbers (4.11–4.56 for iodine/bismuth imaging vs 23.1–35.1 for iodine/gadolinium imaging) and the FOM values (0.01–0.04 for iodine/bismuth imaging vs 0.03–0.30 for iodine/gadolinium imaging), and thus superior noise properties in small bowel imaging in comparison to biphasic liver imaging. The iodine was selected in both imaging tasks because it has been widely used in clinical practice for CT imaging. Although the iodine’s K-edge energy was below most of the photons in the low-energy spectrum, iodine itself was already sufficiently different from the background materials such as water in the current study and soft tissue in real patient scans, in terms of attenuation characteristics. Moreover, the atomic number and K-edge energy difference between the first contrast agent (iodine with an atomic number of 53 and a K-edge energy of 33.2 keV) and the second contrast agent (gadolinium with an atomic number of 64 and a K-edge of 50.2 keV; bismuth with an atomic number of 83 and a K-edge of 90.5 keV) also play a vital role in noise magnification. The further apart in atomic number and K-edge energy, the better the materials’ spectral distinction and noise properties of the material decomposition.31
For each task, the noise property was highly dependent on the DECT tube potential selection. For biphasic liver imaging [Fig. 5(a)], the percent of photons below the gadolinium’s K-edge was increased for a lower low-energy tube potential. Thus, a lower tube potential, such as 80 kV, provided better noise properties than 90 and 100 kV for iodine/gadolinium imaging, where the high energy tube potential was fixed as Sn150 kV. The results imply that a lower low-energy tube potential with sufficient photon counts should be considered in dual-contrast imaging involving iodine and gadolinium. For small bowel imaging [Fig. 5(b)], the tube potential pair of 80/Sn150 and 90/Sn150 kV showed comparable noise properties because all the photons in both low-energy x-ray beams were completely below the bismuth’s K-edge. For 100/Sn150 kV, though, a small percent of x-ray photons exceeded the bismuth’s K-edge, in turn degrading the overall imaging performance. Therefore, whenever possible, the low-energy tube potential should be limited to below 90 kV.
In this study, all DECT scans were performed with default dose partitioning (Table IV: 58%, 63%, and 74% for 80/Sn150, 90/Sn150, 100/Sn150 kV) between the two x-ray beams since adjustment of dose partitioning on commercial systems is not always possible. As shown in Table IV, the average optimized dose partitioning was around 33–36% and 43–47% across all the three tube potential pairs for biphasic liver imaging and small bowel imaging, respectively. As shown in Tables. V and VI, with the optimized dose partitioning, the noise levels on vSECT images could be reduced, and thus, the radiation dose efficiency in the DECT protocol may be improved. Therefore, it is recommended that the optimal dose-partitioning factor be used in future experimental and clinical studies and manufacturers should make the dose partitioning adjustable on their scanners.
There were several limitations in the current study. First, only one phantom size, representing a medium-size patient, was used. The impact of object size on imaging performance and dose efficiency in dual-contrast imaging are task dependent. In biphasic liver imaging with iodine and gadolinium, a lower low-energy tube potential (e.g., 70 kV) could be used for a small patient size, potentially improving the quantification accuracy and noise performance in iodine/gadolinium imaging due to the increased percent of x-ray photons below the gadolinium’s K-edge. In contrast, a higher low-energy tube potential (e.g., 90 or 100 kV) has to be used for a large patient size to avoid photon starvation, further degrading the quantitative imaging performance of gadolinium and iodine. In small bowel imaging with iodine and bismuth, the quantification accuracy and dose efficiency are expected to be stable between objects of varying size as long as the low-energy tube potential is under 90 kV, below the bismuth’s K-edge. The patient size-dependent optimal tube potential selection was previously investigated for DECT virtual-monochromatic imaging.32 Its impact on dual-contrast imaging remains to be investigated.
Second, a generic image-based material decomposition method was used without incorporating denoising algorithms either before or within the material decomposition process. This was by design in an effort to demonstrate the intrinsic performance of the DECT system for dual-contrast imaging. Incorporating a denoising algorithm into the material decomposition process may improve the image quality in material-specific images.33,34 However, these types of images do not reflect the fundamental properties of the DECT systems because they typically involve nonlinear operations.
Third, in addition to iodine, only two alternative contrast agents (gadolinium and bismuth) were used in this study. Dual-or multicontrast imaging with other contrast agents, such as ytterbium, tantalum, tungsten, and gold with K-edges of 61.3, 67.4, 69.5, and 80.7 keV, respectively, have also been proposed, since their K-edges are also located within the clinical x-ray spectrum.35–38 Their quantitative accuracy and dose efficiency remain to be investigated. Last but not the least, the three-material model in the phantom study used pure water as the background basis material, which is much simplified compared to that in realistic clinical tasks, where the background material is soft tissue or blood. The reason why we used water as the background material to mimic the dual-contrast imaging task is that this is simple and reliable to establish the reference standards in phantom studies. In realistic clinical tasks, the background material needs to be replaced by soft tissue or blood as appropriate. In addition, it is possible that, in the region of interest, there are unknown materials other than the presumed three basis materials (e.g., iron in the liver), which may lead to additional bias. This is a common issue for any of the DECT applications that involve material decomposition and quantification.25 But for many clinical tasks, a simplified three-material or even two-material model has been shown to be valuable. The dose efficiency of simultaneous imaging of two contrast agents were evaluated for the above two imaging tasks using photon-counting-detector-based MECT in a phantom study, also demonstrating much worse radiation dose efficiency compared to the SECT protocol.39
5. CONCLUSIONS
The quantitative accuracy and dose efficiency of dual-contrast imaging for two potential imaging tasks, one involving iodine and gadolinium, and the other involving iodine and bismuth, were experimentally determined using a clinical dual-source DECT system in a phantom study. Under the assumption that the object to be decomposed is composed of the three basis materials in the model and their mixtures, results showed that a single DECT scan can accurately quantify material concentrations for both imaging tasks. However, DECT was inherently dose inefficient and required more radiation dose to achieve the same image noise as in a SECT protocol for both imaging tasks.
ACKNOWLEDGMENTS
The authors thank Kristina Nunez for her assistance in manuscript preparation and Sonia Watson, PhD, and Desiree Lanzino, PhD, for assistance with editing the manuscript.
Research reported in this publication was supported by the National Institutes of Health under award numbers R21 EB024071. The content is solely the responsibility of the authors and does not necessarily represent the official views of the National Institutes of Health. Dr. McCollough receives industry grant support from Siemens. Some of the information contained in the manuscript was presented at the American Association of Physicists in Medicine 2018 annual meeting, Nashville, TN.
Footnotes
CONFLICTS OF INTEREST
No other potential conflicts of interest were declared.
REFERENCES
- 1.Taguchi K, Iwanczyk JS. Vision 20/20: single photon counting x-ray detectors in medical imaging. Med Phys. 2013;40:100901. [DOI] [PMC free article] [PubMed] [Google Scholar]
- 2.Kappler S, Henning A, Kreisler B, Schoeck F, Stierstorfer K, Flohr T. Photon counting CT at elevated X-ray tube currents: contrast stability, image noise and multi-energy performance. Paper presented at: SPIE Medical Imaging 2014; San Diego, California. [Google Scholar]
- 3.Yu Z, Leng S, Jorgensen SM, et al. Evaluation of conventional imaging performance in a research whole-body CT system with a photon-counting detector array. Phys Med Biol. 2016;61:1572–1595. [DOI] [PMC free article] [PubMed] [Google Scholar]
- 4.Ren L, Zheng B, Liu H. Tutorial on X-ray photon counting detector characterization. J Xray Sci Technol. 2018;26:1–28. [DOI] [PMC free article] [PubMed] [Google Scholar]
- 5.Yu L, Ren L, Li Z, Leng S, McCollough CH. Dual-source multienergy CT with triple or quadruple x-ray beams. J Med Imaging (Bellingham). 2018;5:033502. [DOI] [PMC free article] [PubMed] [Google Scholar]
- 6.Muenzel D, Proksa R, Daerr H, et al. Photon counting CT of the liver with dual-contrast enhancement. Paper presented at: SPIE Medical Imaging;2016. [Google Scholar]
- 7.Muenzel D, Daerr H, Proksa R, et al. Simultaneous dual-contrast multiphase liver imaging using spectral photon-counting computed tomography: a proof-of-concept study. Eur Radiol Exp. 2017;1:25. [DOI] [PMC free article] [PubMed] [Google Scholar]
- 8.Muenzel D, Bar-Ness D, Roessl E, et al. Spectral photon-counting CT: initial experience with dual-contrast agent K-edge colonography. Radiology. 2017;283:723–728. [DOI] [PubMed] [Google Scholar]
- 9.Symons R, Cork TE, Lakshmanan MN, et al. Dual-contrast agent photon-counting computed tomography of the heart: initial experience. Int J Cardiovasc Imaging. 2017;33:1253–1261. [DOI] [PubMed] [Google Scholar]
- 10.Dangelmaier J, Bar-Ness D, Daerr H, et al. Experimental feasibility of spectral photon-counting computed tomography with two contrast agents for the detection of endoleaks following endovascular aortic repair. Eur Radiol. 2018;28:3318–3325. [DOI] [PMC free article] [PubMed] [Google Scholar]
- 11.Ren L, Tao S, Rajendran K, McCollough CH, Yu L. Impact of prior information on material decomposition in dual- and multienergy computed tomography. J Med Imaging. 2019;6:1. [DOI] [PMC free article] [PubMed] [Google Scholar]
- 12.De Cecco CN, Buffa V, Fedeli S, et al. Dual energy CT (DECT) of the liver: conventional versus virtual unenhanced images. Eur Radiol. 2010;20:2870–2875. [DOI] [PubMed] [Google Scholar]
- 13.Cann CE. Quantitative CT for determination of bone mineral density: a review. Radiology. 1988;166:509–522. [DOI] [PubMed] [Google Scholar]
- 14.Sfeir JG, Drake MT, Atkinson EJ, et al. Evaluation of cross-sectional and longitudinal changes in volumetric bone mineral density in post-menopausal women using single- versus dual-energy quantitative computed tomography. Bone. 2018;112:145–152. [DOI] [PMC free article] [PubMed] [Google Scholar]
- 15.Mongan J, Rathnayake S, Fu Y, et al. In vivo differentiation of complementary contrast media at dual-energy CT. Radiology. 2012;265:267–272. [DOI] [PMC free article] [PubMed] [Google Scholar]
- 16.Qu M, Ehman E, Fletcher JG, et al. Toward biphasic computed tomography (CT) enteric contrast: material classification of luminal bismuth and mural iodine in a small-bowel phantom using dual-energy CT. J Comput Assist Tomogr. 2012;36:554–559. [DOI] [PubMed] [Google Scholar]
- 17.Mongan J, Rathnayake S, Fu Y, Gao DW, Yeh BM. Extravasated contrast material in penetrating abdominopelvic trauma: dual-contrast dual-energy CT for improved diagnosis–preliminary results in an animal model. Radiology. 2013;268:738–742. [DOI] [PMC free article] [PubMed] [Google Scholar]
- 18.Falt T, Soderberg M, Wasselius J, Leander P. Material decomposition in dual-energy computed tomography separates high-Z elements from iodine, identifying potential contrast media tailored for dual contrast medium examinations. J Comput Assist Tomogr. 2015;39:975–980. [DOI] [PubMed] [Google Scholar]
- 19.Rathnayake S, Mongan J, Torres AS, et al. In vivo comparison of tantalum, tungsten, and bismuth enteric contrast agents to complement intravenous iodine for double-contrast dual-energy CT of the bowel. Contrast Media Mol Imaging. 2016;11:254–261. [DOI] [PMC free article] [PubMed] [Google Scholar]
- 20.Soesbe TC, Lewis MA, Nasr K, Ananthakrishnan L, Lenkinski RE. Separating high-Z oral contrast from intravascular iodine contrast in an animal model using dual-layer spectral CT. Acad Radiol. 2018;26:1237–1244. [DOI] [PubMed] [Google Scholar]
- 21.Sofue K, Itoh T, Takahashi S, et al. Quantification of cisplatin using a modified 3-material decomposition algorithm at third-generation dual-source dual-energy computed tomography: an experimental study. Invest Radiol. 2018;53:673–680. [DOI] [PubMed] [Google Scholar]
- 22.Ren L, McCollough CH, Yu L. Three-material decomposition in multi-energy CT: impact of prior information on noise and bias. Paper presented at: Proc SPIE Int Soc Opt Eng; 2018. [DOI] [PMC free article] [PubMed] [Google Scholar]
- 23.Badea CT, Holbrook M, Clark DP, Ghaghada K. Spectral imaging of iodine and gadolinium nanoparticles using dual-energy CT. Paper presented at: SPIE Medical Imaging; 2018. [Google Scholar]
- 24.Li Z, Leng S, Yu L, Yu Z, McCollough CH. Image-based material decomposition with a general volume constraint for photon-counting CT. Paper presented at: SPIE Medical Imaging 2015. [DOI] [PMC free article] [PubMed] [Google Scholar]
- 25.Mendonca PR, Lamb P, Sahani DV. A flexible method for multi-material decomposition of dual-energy CT images. IEEE Trans Med Imaging. 2014;33:99 multi-energy 116. [DOI] [PubMed] [Google Scholar]
- 26.Datta BN. Chapter 4: Stability of Algorithms and Conditioning of Problems In: Numerical Linear Algebra and Applications. 2nd ed.: SIAM; 2010. [Google Scholar]
- 27.Rannacher R Chapter 1 In: Numerical Linear Algebra. Heidelberg University Publishing; 2018. [Google Scholar]
- 28.Leng S, Yu Z, Halaweish A, et al. Dose-efficient ultrahigh-resolution scan mode using a photon counting detector computed tomography system. Vol 3: SPIE; 2016. [DOI] [PMC free article] [PubMed] [Google Scholar]
- 29.Siewerdsen JH, Cunningham IA, Jaffray DA. A framework for noise-power spectrum analysis of multidimensional images. Med Phys. 2002;29:2655–2671. [DOI] [PubMed] [Google Scholar]
- 30.Faby S, Kuchenbecker S, Sawall S, et al. Performance of today’s dual energy CT and future multi energy CT in virtual non-contrast imaging and in iodine quantification: a simulation study. Med Phys. 2015;42:4349–4366. [DOI] [PubMed] [Google Scholar]
- 31.Kelcz F, Joseph PM, Hilal SK. Noise considerations in dual energy CT scanning. Med Phys. 1979;6:418–425. [DOI] [PubMed] [Google Scholar]
- 32.Michalak G, Grimes J, Fletcher J, et al. Technical note: improved CT number stability across patient size using dual-energy CT virtual monoenergetic imaging. Med Phys. 2016;43:513. [DOI] [PubMed] [Google Scholar]
- 33.Xue Y, Ruan R, Hu X, et al. Statistical image-domain multimaterial decomposition for dual-energy CT. Med Phys. 2017;44:886–901. [DOI] [PMC free article] [PubMed] [Google Scholar]
- 34.Tao S, Rajendran K, McCollough CH, Leng S. Material decomposition with prior knowledge aware iterative denoising (MD-PKAID). Phys Med Biol. 2018;63:195003. [DOI] [PubMed] [Google Scholar]
- 35.FitzGerald PF, Colborn RE, Edic PM, et al. CT image contrast of high-Z elements: phantom imaging studies and clinical implications. Radiology. 2016;278:723–733. [DOI] [PMC free article] [PubMed] [Google Scholar]
- 36.Hubbell JH, Seltzer SM. Tables of x-ray mass attenuation coefficients and mass energy-absorption coefficients 1 keV to 20 meV for elements z = 1 to 92 and 48 additional substances of dosimetric interest. https://nvlpubs.nist.gov/nistpubs/Legacy/IR/nistir5632.pdf. Accessed February 5, 2019.
- 37.Kim J, Bar-Ness D, Si-Mohamed S, et al. Assessment of candidate elements for development of spectral photon-counting CT specific contrast agents. Sci Rep. 2018;8:12119. [DOI] [PMC free article] [PubMed] [Google Scholar]
- 38.Lambert JW, Sun Y, Stillson C, et al. An intravascular tantalum oxide-based CT contrast agent: preclinical evaluation emulating overweight and obese patient size. Radiology. 2018;289:103–110. [DOI] [PMC free article] [PubMed] [Google Scholar]
- 39.Ren L, Rajendran K, McCollough CH, Yu L. Radiation dose efficiency of multi-energy photon-counting-detector CT for dual-contrast imaging. Phys Med Biol. 2019. In Press. [DOI] [PMC free article] [PubMed] [Google Scholar]


