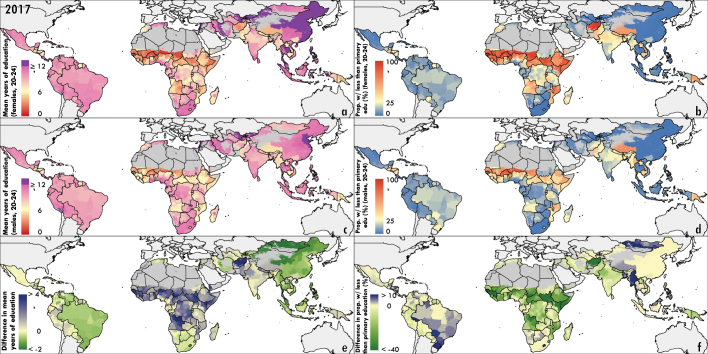
Extended Data Fig. 3. Average educational attainment and proportion with no primary school at the first administrative level and absolute difference between women and men aged 20–24 years.
a–d, Average educational attainment for women (a) and men (c) and proportion with no primary school for women (b) and men (d) aged 20–24 years in 2017. e, f, The absolute difference in average educational attainment between men and women aged 20–24 years in 2017 (e) and proportion of individuals with no primary school education (f). Maps reflect administrative boundaries, land cover, lakes and population; grey-coloured grid cells were classified as ‘barren or sparsely vegetated’ and had fewer than ten people per 1 × 1-km2 grid cell49,58–60,62, or were not included in these analyses. Interactive visualization tools are available at https://vizhub.healthdata.org/lbd/education. Maps were produced using ArcGIS Desktop 10.6.

