

Abstract
Natural plant pigment, anthocyanins have the capability to change its color with the change of its structure influenced by changing pH. This feature of anthocyanin has been harnessed to design a meat products quality indicator. In the present experiment anthocyanin rich Jamun fruit (Syzgium cumini) skin extract was used to develop quality indicator by immobilizing on filter paper strips with the purpose of application in chicken patties packets stored at refrigeration temperature (4 ± 1 °C). The indicator changed its color from violet to yellow due to changed pH in it when it was attached inside packet of chicken patties during storage, due to reaction with volatile basic compounds generated from meat. During storage for 21 days, various changes in quality attributes of chicken patties viz., pH, Total volatile basic nitrogen (TVBN), ammonia level, color value, sensory attributes and microbial evaluation were estimated. The pH decreased (P < 0.5) from 6.22 to 6.04. TVBN and ammonia and level increased significantly (P < 0.5) throughout storage. Redness, yellowness, hue and chroma value gradually changed during storage. Sensory scores also decreased significantly (P < 0.5). Microbial count also increased (P < 0.5) during this time. The experiment showed that, during storage, the color changing pattern of quality indicator was well correlated with the changes in quality attributes of chicken meat patties. Therefore, it is expected that the developed quality indicator can provide a convenient, non destructive, visual mean to monitor the meat products quality during refrigerated storage.
Keywords: Jamun fruit skin extracts, Anthocyanin, Quality indicator, Chicken patties quality
Introduction
Traditional food packaging systems in present scenario has limited function, as they do not provide any real-time information about the quality of food products to the consumers at any stage of supply chain. Monitoring the quality of food in supply chain is necessary to satisfy consumer demand for safe food, reduce food wastage and food poisoning. “Smart or intelligent packaging” is a system to detect sense and record any deterioration inside the food package; to enhance safety, improve quality and warn about possible problems during food transport and storage. Use of smart food packaging, which can assure food safety and provide real time quality monitoring to processors, distributors, retailers and consumers is the demand of the time.
Meat and meat products are very prone to quality deterioration during supply chain, if proper storage conditions have not been maintained. Therefore, use of smart packaging system containing indicators to monitor quality and freshness of meat products is worth to assure safety of the products. Use of these indicators is increasing in meat industry, because it is simple, non-invasive, non-destructive, and consumer friendly. Two types of common indicators used in food systems to assure the quality of packaged food are either chemical dye based indicators or natural dye based acid–base indicators for acid base titration (Kuswandi et al. 2015; Nwosu et al. 2004; Pathade et al. 2009).
Fabrication of quality indicators by application of natural pigments is advantageous over its chemical counterparts, because such indicator do not leave hazardous chemical residues in packaged meat products, is environment friendly and cost effective (Singh et al. 2018).
It has been observed that few natural pigments such as anthocyanins from plant source has potential to act as food quality indicators in packaging systems, because the color expression of this component is strongly influenced by its structure, pH, co-pigmentation, temperature and UV radiation. This capacity of variable color expression of anthocyanins makes these pigments suitable to be used as indicator of food quality in intelligent packaging systems (Golasz et al. 2013).
Anthocyanins, present in colored extracts from plant parts viz., leaf, flower and fruits are water-soluble pigments; available in red, purple, or blue color according to its status of pH. Anthocyanins are the complex molecules that can add or subtract hydroxide ions and each compounds reacts differently in the presence of light producing different color. With the change of pH, anthocyanin changes its structure, resulting into its color change (Talukder et al. 2017).
Among several tropical fruits in India, Jamun (Syzygium cuminii) is a potentially important indigenous minor commercial fruit. The full purple skin of ripe Jamun contains 3.79 mg/g of anthocyanin, this anthocyanin pigment can be used to develop an indicator in the acid–base titration (Zulfajri and Muttakin 2018). Therefore, a study was conducted to design a meat product quality indicator by using Jamun peel extracts (JPE) to monitor quality of chicken patties, during storage to assure supply of best quality packaged meat products to the consumers.
Materials and methods
Jamun fruits and chicken meat
Ripe Jamun fruits were obtained from the plantation in ICAR-IVRI, Izatnagar campus, Bareilly, India. The collected ripe fruits were washed and peels were collected, separating from inner flesh and seed. At room temperature (35 ± 2 °C) the peels were dried for 2 days to reduce its water content.
For chicken patties, white Leghorn layer spent hen of approximately 72–90 week old was procured from CARI, Izatnagar and slaughtered using the halal method in the experimental abattoir of division of Livestock Products Technology (LPT), Indian Veterinary Research Institute (IVRI), then manual deboning and trimming was done. Deboned chicken meat was packaged in Low Density Polyethylene (100 gauge) pouches and stored in refrigerator at 4 ± 1 °C for about 24 h. Thereafter, the meat was transferred to deep freezer (Blue Star, FS345, Denmark) for storage at − 18 ± 2 °C till further use.
Chemicals
Agarose UltraPhor® (gelling temperature ~ 35 °C) was purchased from Sisco Research Laboratories Pvt. Ltd. (SRL, Mumbai, India), Ethanol (Merck Specialities Pvt. Ltd., Mumbai, India) and filter paper (Merck Specialities Pvt. Ltd., Mumbai, India). All other required analytical grade chemicals and reagents were procured from standard firms viz, Qualigens, GS chemicals, Sigma, CDH and Merck. For microbiological analysis culture media was procured from Himedia® Laboratories, Mumbai, India.
Preparation of chicken patties
Chicken patties were prepared by mixing various ingredients, as per formulation (Table 1). Frozen lean chicken meat was partially thawed for 16 h in a refrigerator, cut into small chunks and minced once using meat mincer (4-mm plates) (Seydelman, Model D114, Deutschland, Germany). Meat emulsion was prepared in bowl chopper (Seydelmann, Model K20, Ras, Germany). Ice flakes, salt, sodium nitrite and Sodium Tripolyphosphate (STPP) were added to minced meat and chopped for 2 min. After adding vegetable oil, chopping was continued for 2 min. Condiment mix, spice mix and refined wheat flour (Maida) were added and chopped for another 1 min to prepare a fine viscous emulsion. The temperature of the emulsion varied from 5 to 10 °C. The patties were formed in a mould (62 × 15.8 mm) and cooked in pre-heated oven at 180 ± 5 °C for 35 min. with intermittent turning to have better color and appearance, till internal core temperature reached about 80 °C, monitored by using a probe thermometer (Digital thermometer, WT-1, China). The cooked patties were brought to room temperature and stored at 4 ± 1 °C temperature in sterile PET (Polyethylene Terephthalate) boxes (Godrej Cold Gold, India) (4.5 cm × 4.5 cm × 2.5 cm), closed with cling film (thickness-12.5 µm), after attaching the indicator inside the film surface. Pack in PET box covered with cling film simulates the aerobic packaging conditions. The storage was conducted for 21 days and samples were analyzed at every 3 days interval, hence total eight boxes along with indicator were used; sample was withdrawn aseptically from each box and remaining sample in box was discarded.
Table 1.
Composition of chicken patties
| Ingredients | Percentage |
|---|---|
| Lean meat | 70 |
| Ice flakes | 10 |
| Refined vegetable oil | 7.5 |
| Condiment mix (onion: garlic 2:1) | 5 |
| Refined wheat flour | 3.5 |
| Salt | 1.6 |
| Dry spice mix | 2 |
| Sodium tripolyphosphate (STPP) | 0.4 |
| Sodium nitrite (ppm) | 150 |
Preparation of quality indicator
Extract preparation
Crude Jamun Peel (JPE) extracts was made by following the method of Metivier et al. (1980) with suitable modifications. Five grams of dried peel was finely triturated using mortar and pestle, after adding 10 ml of 1% HCl-ethanol mixture. The slurry was transferred in a centrifuge tube (50 ml) wrapped in aluminium foil and kept overnight in refrigerator for proper extraction. Next day, the slurry was centrifuged for 15 min at 2600 G-force (Laboratory centrifuge, R8-C, REMI, Mumbai, India). Supernatant was transferred to an amber colored bottle to avoid light influenced degradation and kept in refrigerator (4 ± 1 °C) for further use.
Determination of absorption spectra of extracts
By using UV–Vis spectrophotometer (Backmann 640, USA) absorption spectra of JPE were studied to determine absorption maxima and absorbance responsible for difference in the color. To validate the extraction process the absorption spectrum of the extracts containing anthocyanins was correlated with the available reference by Yusoff et al. (2014).
Fabrication of quality indicator and testing of color change
Three different pH viz., 5.5, 6.0 & 6.5 of JPE was adjusted by adding required amount of buffer solution (Buffer capsule, pH 4.0, 7.0 and 9.2, Himedia, Mumbai, India). Whatman® (No. 42) filter paper was cut into strip of 4 cm × 1.5 cm. Agarose solution (3%) was prepared by dissolving it in distilled water and heating on hot plate magnetic stirrer (GeNei™) for 10 min at 70 °C, cooled to room temperature and 15 ml agarose solution was mixed with 15 ml JPE of three different pH, separately. Paper strips were dipped into three different pH solutions separately for 20 s. The coated paper strips were conditioned separately over night at refrigeration temperature (4 ± 1 °C) in amber colored bottle.
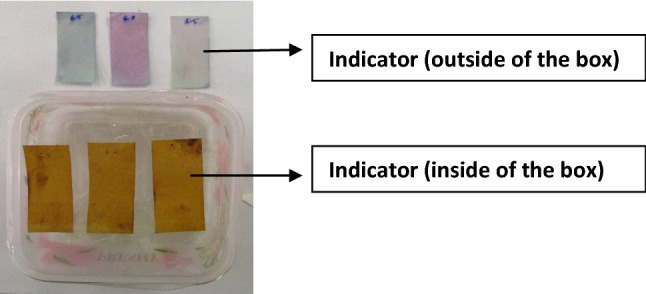
The color changing ability of indicator was determined by exposing them to the chicken meat patties. For this, 100 g patties were kept in sterile PET boxes covered with cling film (thickness-12.5 µm) and the indicators of 3 different pH were stick inside the film, after closing film boxes were stored at 4 °C for 21 days. The control indicator was stick outside the PET box. The color change was most distinguished in the indicator of pH-6, therefore the discussion of color change of indicator will be of indicator of pH-6. Changes in the color of the indicator inside chicken patties boxes were recorded by digital camera (SX160 IS, Canon, India).
Instrumental color (Lovibond Tintometer color) evaluation
The instrumental color was measured by using Lovibond Tintometer (Model F, Greenwich, UK). Chicken patties sample was placed in the sample holder of Lovibond Tintometer. The red (LTCU ‘R’) and yellow (LTCU ‘Y’) color units were recorded by matching sample color by adjusting (a*) red and (b*) yellow units, while keeping the blue unit fixed at 1.0. The hue and chroma values were determined by using the formulae, tan−1(b/a) and (a2 + b2)1/2, respectively where a = red unit, b = yellow unit (Little 1975; Froehlich et al. 1983).
Calculation of chromaticity change (ΔE) by hunter color lab
To find out the quantitative difference in the color change to avoid the errors of normal eye vision, chromaticity change (ΔE) of indicator was measured under the conditions of D65 illumination and a 2° observation angle using a hand-held colorimeter. The ΔE value was measured using Hunter Lab color space coordinates to objectively describe the irreversible indicator color change. The ΔE value was expressed by the following equation,
where L* is difference in brightness (white-black) change between t = 0 and measured unit time, a* is the difference in redness-greenness, b* is the difference in yellowness-blueness (Khare et al. 2015).
Analysis of meat quality attributes
Meat samples were drawn from storage at regular intervals of 3 days up to the point of visible spoilage observed, for determination of changes in different meat quality attributes viz., pH, Total Volatile Basic Nitrogen (TVBN), Ammonia, Tyrosine, Glucose, Titrable acidity, Free amino acid (FAA) and Shear force value, by applying suitable procedures.
The pH of chicken meat patties was determined by following the method of Trout et al. (1992). The TVBN value was estimated by micro-diffusion technique according of Pearson (1968). The ammonia concentration in samples during storage was evaluated by method prescribed by Sastry et al. (1999). The procedure of Strange et al. (1977) was followed for the estimation of tyrosine value. d-glucose estimation was performed with commercial kit, GAGO-20® (Sigma-Aldrich, USA) as per the method described by Washko and Rice (1961). The titrable acidity was evaluated by the method of Shelef and Jay (1970) with suitable modifications. The method of Rosen (1957) with suitable modification was followed for the determination of free amino acids. The shear force value of meat product sample was determined by the method of Berry and Stiffler (1981).
Microbiological analysis
All the microbiological parameters of meat samples were determined by following standard methods of APHA (2001).
Sensory evaluation
Sensory attributes of chicken meat patties during storage were enumerated based on color, odor, general appearance and acceptability following the method of Keeton (1983). For this, experienced sensory panel (10 members) consisting of scientists and postgraduate students (both male and female) of the Livestock Products Technology Division, were used. Sensory evaluation was organized around 3.30–4.00 PM every time. Changes in sensory attributes were judged three times by using five point descriptive scales, (Scale: 1-dislike extremely; 2-dislike slightly; 3-neither like nor dislike; 4-like slightly; 5-like extremely). Out of 10 members, those with extremely high or low scores were excluded and scores of remaining seven members (n = 21) were used for statistical analysis.
Correlation of color change of indicator and changes in quality of chicken patties
Samples were drawn from aerobically packed chicken patties and different quality parameters were analyzed and were correlated with the color response of the quality indicator, to evaluate the relationship between color changes of indicator due to changing concentration of volatile basic compounds and deterioration pattern of stored meat patties. All the parameters were evaluated at every 3 days interval up to visible signs of spoilage observed in chicken patties.
Statistical analysis
All experiments were repeated three times and the data generated for different attributes were compiled and analyzed by statistical method of one way ANOVA and Mean ± SE using SPSS® software (trial version 17.0 for Windows, SPSS Inc., USA). Duncan’s test was used to compare differences among mean values (Duncan, 1955). Significance was defined at P < 0.05.
Results and discussion
Validation of extraction
The UV–visible absorption spectra of anthocyanins from JPE (pH = 1.5) was recorded between 400 and 700 nm with UV–visible spectrophotometer. The result indicated that the extracts pigment from JPE has one absorption peaks (acidified ethanol): λ-max = 530 nm in visible range (Fig. 1a). The absorption peak obtained from sample extracts showed the presence of anthocyanin compounds, which has characteristic absorption at a wavelength region that is visible 490–550 nm. Zulfajri and Muttakin (2018) also observed λ-max in the similar range for anthocyanin Syzygium cumini (L.) fruits extract.
Fig. 1.
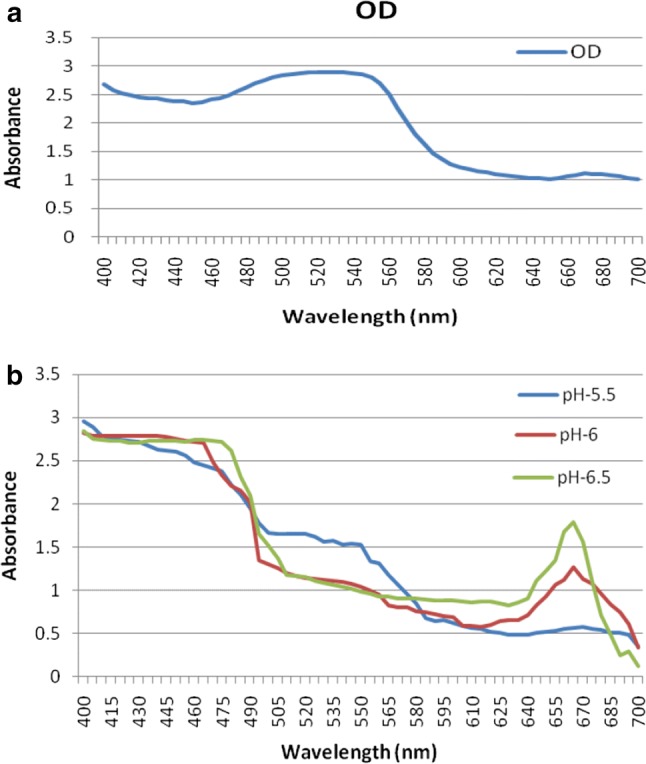
UV–Vis spectrum of HCl-ethanol JPE (a) and variations in UV–Vis spectra of HCl-ethanol JPE coated paper indicator in pH ranges of 5.5–6.5 (b)
UV–Vis spectra of pH adjusted JPE
The pH of JPE was adjusted to three different levels viz., 5.5, 6 and 6.5. Filter paper strips after being immersed in pH-adjusted extracts, changed its color immediately from white to various shades of violet indicating proper adsorption of extracts on filter paper. The absorption spectra of JPE coated paper indicator at different pH is presented in Fig. 1b. The variation of color of indictor at different pH might be due to structural variation of anthocyanins which directly has influenced its variation in absorption spectra.
Color changing pattern of indicator under simulated conditions
During storage of meat products various basic volatile compounds are generated due to microbial degradation of meat and due to their volatile nature they occupy the whole environment inside the closed package system (Talukder et al. 2017). To create a simulated condition as if in meat package, here in this experiment JPE coated indicator were attached to the inner side of PET box lid in which minimal quantity of ammonia (50 mg) comparable to that produced from meat during storage was poured. The lid was tightly closed to assume that indicator remain in atmosphere of ammonia gas during storage. The volatile compound reacts with the anthocyanins in indicator and the response of reaction was observed (Fig. 2). In the environment of ammonia gas inside the simulated packed chicken meat patties, the violet color of indicator changed to yellow gradually. The reason of color change in indicator was might be due the change in the structure of anthocyanin influenced by changing pH caused by the presence of basic metabolites (ammonia) in environment (Talukder et al. 2017).
Fig. 2.
Color change of Indicator in simulated condition
Color changing pattern of indicator and Hunter color value
In the environment of volatile basic gases produced by chicken patties inside the closed package, violet color of indicator changed gradually to yellow at the end of the storage at 4 ± 1 °C (Fig. 3). At pH below 2, Anthocyanins exist primarily in the form of the red flavylium cation. Hydration of the flavylium cation gives the colorless carbinol pseudobase at pH values ranging from 3 to 6, which can further equilibrate to an open form, the colorless chalcone pseudobase (He and Giusti 2010). These color change of indicator (indicator of adjusted pH = 6) has been monitored by hunter color meter shown in Table 2. The indicator (pH = 6) showed value of L* and b*, 40.54 and 0.83, respectively on day 1. Which increased significantly (P < 0.05) to 48.28 and 4.25 on the 3rd storage day. On further storage L* and b* value gradually increased (P < 0.05) to 92.31 and 29.47, respectively on 21st day. Changes in b* value corresponds to a shift from blue to yellow (Baldevbhai and Anand 2012). Therefore the changing b* value is corresponding to the change of color of indicator accordingly. In addition, redness value (a*) was 19.65 on day 1, and decreased (P < 0.05) to − 17.34 on 21st day of storage. Changes in a* value corresponds to a shift from red to green (Baldevbhai and Anand 2012). The changes in the L*, a* and b* value might be due to the changes in the pH, which in a cumulative way changing the color of indicator from violet to yellow (Walkowiak-Tomczak et al. 2016).
Fig. 3.

Color change in JPE based indicator inside packed chicken patties during storage at 4 ± 1 °C
Table 2.
Changes in hunter color value of quality indicators (pH = 6) associated with chicken patties packages during storage at 4 ± 1 °C (mean ± SE)
| Attributes | Storage period (day) | |||||||
|---|---|---|---|---|---|---|---|---|
| 1st | 3rd | 6th | 9th | 12th | 15th | 18th | 21st | |
| L* | 40.54 ± 0.17h | 48.28 ± 0.25fg | 52.69 ± 1.36ef | 57.83 ± 0.04cd | 61.41 ± 1.13c | 76.41 ± 0.58b | 90.32 ± 2.92a | 92.31 ± 0.52a |
| a* | 19.65 ± 0.75a | 9.91 ± 0.45b | 6.56 ± 0.14c | 6.10 ± 0.07c | 5.22 ± 0.05c | 0.22 ± 0.05d | − 16.48 ± 0.60e | − 17.34 ± 0.50e |
| b* | 0.83 ± 0.01g | 4.25 ± 0.02f | 14.57 ± 0.13de | 15.20 ± 0.58de | 17.20 ± 0.57d | 19.66 ± 1.35c | 25.41 ± 0.80b | 29.47 ± 0.46a |
| ∆E | – | 6.14 ± 0.22d | 0.48 ± 0.01i | 4.90 ± 0.06e | 4.45 ± 0.04f | 15.11 ± 0.91b | 4.65 ± 0.22ef | 22.07 ± 0.51a |
n = 6 for each treatment, Means with different superscripts in a row indicate significant (P < 0.05) difference, ∆E = the differences between the L*, a*, and b* of the sample and standard
The measurement of color difference in indicator between two consecutive storage days was calculated by ∆E value. Higher the value, higher the visible color difference measured by HunterLab (MiniScan EZ, 4500L, USA). For chicken patties ∆E value was recorded 6.14 on 3rd day, which reduced to 0.48 on 6th day, that means the color difference between 3rd and 6th day was lesser as compared to the color difference between 0 and 3rd day. In the present study the color change of indicator was not so significant in between 0 to 3rd day and 3rd to 6th day. ∆E value was found maximum (22.07) on the 21st day of storage. This indicate the calculated color difference was maximum in between storage day 18th and 21st, which correlate with the visible color change in indicator during this period (Fig. 3), from light violet to yellow. The maximum ∆E value was might be due to the maximum production of basic volatile gases in between that period. As the storage progress towards its end the microbial spoilage also progress, resulting in more production of basic volatile gases.
Changes in physico-chemical parameters
Changes in physico-chemical parameters of chicken patties during storage are presented in Table 3. pH is widely used for monitoring shelf-life of meat and meat products. In this study the pH of stored chicken patties increased significantly (P < 0.05) from 1st (6.22) to 3rd (6.27) day. Increase in pH might be due to accumulation of metabolites of bacterial action on meat and meat products and deamination of meat proteins (Jay 1996). Afterward, the pH decreased significantly (P < 0.05) up to the 21st day of storage to 6.04. During storage, endogenous and microbial enzymes degrade meat proteins and produce ammonia and amines, which increase pH. Gradually increasing bacterial population, indirectly decrease the pH of products, indicate the quality deterioration of products and finally to spoilage of meat products. Here in this experiment, degradation of chicken patties quality is directly being reflected by change in pH and indirectly by the color changing of indicator. At the beginning indicator was showing dark violet color, that time the pH value of patties was 6.22, but at the end of 21st day storage pH decreased to 6.04 with a consequent yellow color of indicator.
Table 3.
Physico-chemical parameters of chicken patties during storage at 4 ± 1 °C (mean ± SE)
| Parameters | Storage period (day) | |||||||
|---|---|---|---|---|---|---|---|---|
| 1st | 3rd | 6th | 9th | 12th | 15th | 18th | 21st | |
| pH | 6.22 ± 0.05b | 6.27 ± 0.02a | 6.24 ± 0.03ab | 6.17 ± 0.01c | 6.15 ± 0.02cd | 6.12 ± 0.06de | 6.10 ± 0.04ef | 6.04 ± 0.02f |
| TVBN (mg/100 g) | 16.10 ± 0.95b | 16.94 ± 1.40ab | 18.28 ± 1.62ab | 19.09 ± 1.87ab | 19.57 ± 1.78ab | 19.71 ± 1.72ab | 19.92 ± 1.52ab | 20.42 ± 2.30a |
| Ammonia (mg/100 g) | 10.30 ± 0.73 | 10.69 ± 0.92 | 11.13 ± 0.94 | 11.43 ± 0.70 | 11.57 ± 0.62 | 11.72 ± 1.65 | 11.94 ± 1.66 | 12.19 ± 1.49 |
| Tyrosine (mg/100 g) | 19.87 ± 0.5f | 20.81 ± 0.07e | 22.77 ± 3.14de | 24.59 ± 0.62cd | 25.51 ± 0.46cd | 27.34 ± 0.59c | 31.74 ± 0.5b | 35.80 ± 0.48a |
| Glucose (mg/100 g) | 138.98 ± 2.78a | 136.77 ± 2.56a | 130.05 ± 4.55ab | 121.43 ± 6.22bc | 115.05 ± 3.32cd | 112.73 ± 10.30cd | 102.54 ± 1.11de | 95.68 ± 2.18e |
| Titrable acidity (% LA) | 0.096 ± 0.00a | 0.092 ± 0.00ab | 0.086 ± 0.00bc | 0.080 ± 0.00de | 0.078 ± 0.00ef | 0.074 ± 0.00fg | 0.067 ± 0.00gh | 0.065 ± 0.00h |
| Free amino acid (mg/100 g) | 89.20 ± 2.21g | 109.00 ± 1.70f | 136.03 ± 4.77e | 160.16 ± 1.39d | 178.22 ± 3.10c | 189.14 ± 6.15c | 204.98 ± 2.70b | 218.09 ± 8.03a |
| Shear force (kg/cm2) | 0.62 ± 0.01a | 0.56 ± 0.00ab | 0.51 ± 0.00bc | 0.47 ± 0.00c | 0.45 ± 0.00c | 0.43 ± 0.00c | 0.42 ± 0.00cd | 0.37 ± 0.02d |
n = 6 for each treatment, means with different superscripts in a row indicate significant (P < 0.05) difference
During storage period, TVBN concentration increased significantly (P < 0.05). TVBN concentration reached beyond the recommended limit of 20 mg/100 g (Byun et al. 2003) on 21st day of storage. Increase in TVBN might be due to the breakdown of protein and deamination of amino acids leading to production of ammonia and other volatile bases (Soni et al. 2018). Psychrophilic bacteria preferably Pseudomonas produce volatile bases under aerobic conditions (Ghollasi-Mood et al. 2016). Presence of protein degrading microbes in chicken patties might have cause increase in TVBN concentration and indirectly lowering the product quality. TVBN, indicates key basic volatile compounds generated during meat storage due to quality deterioration, influenced by microbes (Ghollasi-Mood et al. 2016). With the advance in storage period, concentration of TVBN increased gradually. The released volatile basic gases react with indicator and change its color, might be due to change in pH. With the increasing gas concentration the reaction gets faster and pace of color change of indicator also increased. Therefore, color change in indicator directly showed the increased concentration of basic volatile gases due to microbial degradation and simultaneously indicated the quality deterioration of patties. Similar observation of increasing TVBN concentration and collateral changing color of anthocyanin based quality indicator, has also been found during storage of chicken meat at 10 ± 1 °C (Talukder and Mendiratta 2017).
It has been observed that, the concentration of ammonia in chicken patties increased (P > 0.05) during storage. Increase in ammonia concentration during storage was might be due to deamination of amino acids by microbes as a source of energy after the availability of glucose declined, which indirectly reflects the poor microbial quality of the products (Ali 2005). Increasing concentration of ammonia directly indicates the quality deterioration of meat due to microbial reason. At the same time this basic volatile gas might have reacted with the indicator and contributed in its color change by changing the pH of anthocyanin present in it, and showed a harmony in between increasing concentration of ammonia gas and gradual change in color indicator. The findings of Moldovanu and Laslo (2010), showed a positive correlation between increasing level of ammonia in meat products stored at 10-12 °C and its quality deterioration.
It has been found, the tyrosine value of chicken patties increased significantly (P < 0.05) during storage. Tyrosine value is an index of degree of autolytic and bacterial proteolysis occurring in meat and meat products. There was a significant (P < 0.05) increase in tyrosine value of chicken patties from 19.87 mg/100 g on 1st day to 35.80 mg/100 g on 21st day of storage. The reason behind Increase in tyrosine value could be due to hydrolytic changes in meat influenced by inherent tissue enzymes and bacterial proteolysis (Shukla et al. 2015). Here in this study, gradual increase in tyrosine directly indicate the higher level of microbes and lower quality of product. During progress in storage time, a gradual change in color of indicator has also been observed, which positively correlates with the changing concentration of tyrosine. Biswas et al. (2017) reported a significant increase in tyrosine value in fresh fish during storage at (4° ± 1 °C) and poultry muscles and also have correlated its quality deterioration with higher level of tyrosine.
The result showed a significant decrease (P < 0.05) in glucose value in chicken patties during storage. On 1st day of storage the level of glucose concentration was 138.98 mg/100 g, which decreased to 95.68 mg/100 g on 21st day. The reduced glucose level was might be due to use of glucose as initial substrate for the growth and multiplication of microbes. As per literature, depletion of glucose in meat is related to the onset of spoilage (Nychas et al. 2008). Bruckner et al. (2012) demonstrated that, decrease in glucose concentration in meat products indicates increasing microbial population, which denotes the deterioration of quality. In the present study, decreasing glucose level and increasing quality deterioration of meat patties has effectively been shown by indicator by its color change.
As observed for glucose concentration, titrable acidity (calculated as Lactic acid %) in chicken patties also decreased significantly (P < 0.05) throughout the storage period. The value of titrable acidity was comparable between 1st day (0.096%) and 3rd day (0.092%). Thereafter, decreased significantly (P < 0.05) up to the 21st day of storage (0.065%). In present study, a positive correlation was observed between the changing pattern of pH and titrable acidity during storage period, which could be due to the production of alkaline metabolites like ammonia and TVBN by microorganisms in meat, which have partially neutralized the lactic acid, produced by microbes (Goulas et al. 2005). Decrease in titrable acidity of buffalo meat was observed by Shukla et al. (2015) during refrigerated storage and they have concluded the reason behind is the production of alkaline metabolites by microbes, and one of the reason of quality deterioration of meat.
There was significant increase (P < 0.05) in Free amino acid (FAA) level in chicken patties during storage, which might be due to the growth of microbes. On 1st day it was 89.20 mg/100 g, which increased to 218.09 mg/100 g on 21st day of storage. Increasing FAA value indicates the microbial growth and inferior quality of meat products. During that time of storage, the color in indicator was also gradually changed from its initial dark violet to yellow and showed correlation with the increasing concentration of FAA. In previous work, increasing concentration of FAA in meat during storage has been shown due to increased breakdown of meat proteins by bacterial proteases, which indirectly indicate the lowering of meat quality (Shukla et al. 2015).
There was a significant (P < 0.05) decrease in Warner–Bratzler shear force values (WBSF) of chicken patties during storage, which was 0.62 kg/cm2 on 1st day which reduced to 0.37 kg/cm2 on 21st day of storage. A significant decrease (P < 0.05) in WBSF might be due to the combined effect of storage temperature and low ultimate pH at that temperature for patties. The consistent reduction in shear force value during subsequent storage could be due the action of bacterial enzymes, where bacteria can attack more rapidly on already denatured meat protein and can bring about structural disintegration of protein (Bhat et al. 2013). In the present study, the color of indicator also changed with the similar pace of changing WBSF value.
Lovibond Tintometer color value
Changes in Lovibond Tnintometer color values viz., Redness (a*), Yellowness (b*), Hue angle and Chroma of chicken patties during storage at refrigeration are presented in Table 4.
Table 4.
Changes in Lovibond Tintometer color value, ∆E value, sensory attributes and microbiological parameters of chicken patties during storage at 4 ± 1 °C (mean ± SE)
| Attributes | Storage period (day) | |||||||
|---|---|---|---|---|---|---|---|---|
| 1st | 3rd | 6th | 9th | 12th | 15th | 18th | 21st | |
| Lovibond tintometer color value | ||||||||
| Redness (a*) | 2.39 ± 0.02a | 2.33 ± 0.03b | 2.29 ± 0.02bc | 2.28 ± 0.06cd | 2.26 ± 0.01d | 2.20 ± 0.03e | 2.14 ± 0.02f | 2.04 ± 0.01g |
| Yellowness (b*) | 3.29 ± 0.07h | 3.31 ± 0.07gh | 3.35 ± 0.10fg | 3.42 ± 0.09e | 3.43 ± 0.03de | 3.52 ± 0.16cd | 3.55 ± 0.09bc | 3.69 ± 0.09a |
| Hue | 53.97 ± 0.50f | 55.73 ± 0.40d | 55.22 ± 0.63e | 55.62 ± 0.98de | 56.41 ± 0.68cd | 58.10 ± 0.94bc | 58.81 ± 1.18ab | 60.66 ± 0.76a |
| Chroma | 4.07 ± 0.06 | 4.15 ± 0.04 | 4.03 ± 0.06 | 4.06 ± 0.10 | 4.10 ± 0.08 | 4.19 ± 0.06 | 4.17 ± 0.08 | 4.19 ± 0.08 |
| ∆E value of chicken patties | ||||||||
| ∆E | − | 0.17 ± 0.00e | 0.20 ± 0.00cd | 0.28 ± 0.00b | 0.75 ± 0.01a | 0.21 ± 0.00bc | 0.89 ± 0.08a | 0.28 ± 0.00b |
| Sensory attributes | ||||||||
| Color | 4.83 ± 0.06a | 4.72 ± 0.11ab | 4.61 ± 0.04bc | 4.50 ± 0.04cd | 4.41 ± 0.08de | 4.31 ± 0.08fe | 4.10 ± 0.09gf | 3.65 ± 011g |
| Odor | 4.89 ± 0.02a | 4.72 ± 0.03ab | 4.60 ± 0.06bc | 4.55 ± 0.10cd | 4.34 ± 0.10d | 4.12 ± 0.13e | 4.00 ± 0.17ef | 3.06 ± 0.09g |
| General appearance | 4.81 ± 0.07a | 4.71 ± 0.08ab | 4.66 ± 0.07bc | 4.57 ± 0.08cd | 4.43 ± 0.15de | 4.32 ± 0.16ef | 4.26 ± 0.17fg | 3.46 ± 0.18g |
| Acceptability | 4.86 ± 0.02a | 4.75 ± 0.03ab | 4.63 ± 0.06bc | 4.45 ± 0.10d | 4.26 ± 0.10ef | 4.18 ± 0.13f | 4.02 ± 0.17g | 3.48 ± 0.22h |
| Microbiological parameters (log cfu/g) | ||||||||
| Total plate count | 1.73 ± 0.32f | 1.94 ± 0.16e | 2.32 ± 0.12e | 2.79 ± 0.21de | 3.11 ± 0.3dc | 3.86 ± 0.33bc | 4.52 ± 0.22ab | 5.06 ± 0.19a |
| Psychrophilic count | ND | ND | ND | 1.42 ± 0.07e | 2.02 ± 0.13d | 3.59 ± 0.32bc | 3.93 ± 0.30ab | 4.08 ± 0.18a |
| Pseudomonas count | ND | 1.51 ± 0.05gf | 1.94 ± 0.01ef | 2.28 ± 0.23de | 2.89 ± 0.43cd | 3.03 ± 0.09bc | 3.36 ± 0.40b | 4.14 ± 0.54a |
n = 6 (n = 21 for sensory evaluation), Means with different superscripts in a row indicate significant (P < 0.05) difference, ∆E = the differences between the L*, a*, and b* of the sample and standard
Lovibond Tintometer redness (a*) values of chicken patties decreased significantly (P < 0.05). The reduction in the intensity of red color during storage could be due to formation of metmyoglobin during storage (Fernandez-Lopez et al. 2005). Contrary to redness, Yellowness values (b*) showed significant (P < 0.05) increase with storage period in chicken patties.
Hue angle refers to the purity of color, which represents relative position of color between redness and yellowness, which in the present study increased significantly (P < 0.05) with increasing storage period. Increase in Hue angle might be due to formation of oxymyoglobin from myoglobin by oxygenation of chicken meat at refrigeration storage (Karamucki et al. 2013).
Chroma is a measure of color saturation. Chroma value of chicken patties did not change significantly (P > 0.05) during storage. Variation in chroma value during storage was probably due to conversion of oxymyoglobin to metmyoglobin (Karamucki et al. 2013).
Changes in color value, i.e. decreasing redness, increasing yellowness etc. from its initial value is mainly due to oxidation of available meat pigments, which results into less attractiveness of the products and consequent less demand. This quality deterioration of meat products during storage is well represented by the color change of quality indicator in this study.
Sensory attributes of chicken patties
Apart from physico-chemical parameters and instrumental color measurements, sensory evaluation of refrigerated chicken patties was also carried to correlate the changing sensory score with the color change in the indicator to assess quality deterioration of patties. Results are presented in the Table 4.
Color scores of chicken patties decreased significantly (P < 0.05). The color scores correlates to redness value (a*) of chicken patties in present study. With reducing redness (a*) value and increasing yellowness (b*) value the sensory score for color also reduces, it indicated the attractiveness of chicken patties in positively influenced by the instrumental redness value. The scores decreased significantly (P < 0.05) on 6th day of storage, which further reduced (P < 0.05) during progression of period up to 21st day of storage. This reduction in color scores of stored product might be due to oxidative fading. Gradual decrease in color scores of products stored at refrigeration storage might also be due to pigment and lipid oxidation, which results in non-enzymatic browning.
Significant (P < 0.05) decrease in the odor score of chicken patties on 6th day of storage was observed, which further decreased with progress of storage period and reached to 3.06 on 21st day of storage. It has been observed that the odor score decreases with increasing TVBN and ammonia concentration during storage. The volatile nature of both the gaseous compound might have influenced the odor scores during sensory evaluation. Psychrotrophic bacteria, like Pseudomonas spp. and Shewanella spp. had been previously identified as the primary bacteria producing sulphurous off-odors associated with spoiled poultry (Russell et al. 2005). Off-odor due to surface microbial contamination is one of the major causes of spoilage in meat. A positive correlation of odor score with FAA was observed in the present study.
Scores for general appearance of patties decreased significantly (P < 0.05) with progression of storage where the color of indicator also showed a changing pattern. Score reduced significantly (P < 0.05) from 1st day to 6th day of storage and further decreased on 18th and 21st day of storage.
Refrigerated storage of chicken patties for 21 days caused a significant (P < 0.05) reduction in overall acceptability scores. Decrease in scores for all sensory attributes viz., color, odor and general appearance has been reflected on low scores for overall acceptability during storage. Overall acceptability score significantly decreased (P < 0.05) from 1st day to 6th day of storage, which further decreased on 9th and then on 18th day of storage.
Gradual lowering of sensory scores for all attributes of chicken patties shows the deterioration of quality of patties, which is at the same time being reflected by gradual color change of quality indicator.
Microbiological parameters
The microbiological parameters viz., Total plate count (TPC), Psychrophilic bacteria and Pseudomonas count, enumerated in this study varied significantly (P < 0.05) during storage of chicken patties. The values are presented in Table 4.
There was a gradual increase in TPC in patties during storage. When indicator was showing its initial dark violet color on the day 1st, the TPC count was 1.73 log cfu/g, which increased to 4.52 log10 cfu/g on the 18th day when faded violet color of indicator was observed. Final yellow color of indicator was observed on 21st day of storage when TPC reached to 5.06 log10 cfu/g. Result showed a significant (P < 0.05) increase in TPC when initial color changes to intermediate and final stages on 18th and 21st day, respectively. During storage at refrigeration temperature, higher TPC could be due to proliferation of already existing micro flora on to the meat patties surface. Bhat et al. (2013) reported that, linear increase in total plate counts in Seekh Kababs, stored under refrigeration, could be stored up to 21 days without any quality deterioration. Similarly, here in present study quality indicator showed an ultimate yellow color at 21st day of storage of chicken patties at refrigeration.
Psychrophilic bacteria count was not detected up to 6th day of refrigerated storage of patties. On the 9th day it appeared for the first time (1.42 log cfu/g) which increased significantly (P < 0.05) during propagation of storage period to 4.08 log cfu/g on 21st day of storage with a concurrent change in color of quality indicator. Refrigeration temperature (4 ± 1 °C) does not allow growth of majority of the microbes, but some of the psychrophiles can grow and may cause spoilage, which could be detected by change in color of indicator.
There was as significant increase (P < 0.05) in pseudomonas bacteria count of patties during storage at 4 ± 1 °C. On the 1st day of storage Pseudomonas bacteria was not detected, on 3rd day onward it was found that count increased significantly (P < 0.05) from 1.51 to 3.36 log cfu/g on 18th day of storage. Which further increased (P < 0.05) to 4.14 log cfu/g on 21st day of storage, with simultaneous change of indicator color. As Pseudomonas is a psychrophilic bacterium, refrigeration temperature (4 ± 1 °C) favors its growth. Pseudomonas bacteria, the dominant microbial species in aerobically packaged poultry, therefore considered to be the prevalent cause of spoilage of poultry meat products (Patsias et al. 2008).
A gradual increase in TPC, Psychrophilic Bactria and Pseudomonas bacteria count indicate the increasing microbial growth and consequent down grading of quality of chicken patties. On the day 1 the counts were under acceptable limit, at that time the color of the indicator was showing dark violet. When count increase above the initial value, a simultaneous intermediate fade violet color of indicates was observed. But finally when the counts reaches beyond the acceptable limit, the color of the indicator showed yellow color. Therefore, in this experiment, the pattern of color change in indicator is showing a positive correlation with the change in microbial quality of the meat product.
∆E of chicken patties
∆E value were derived from Hunter color L*, a* and b* value for chicken patties during refrigerated storage. Relation between ΔE and time interval for color change at (4 ± 1 °C) is shown in Table 4. Color of chicken patties was observed brownish yellow on the 1st day of storage and the ∆E was estimated 0.17 on 3rd day, which changed to 0.20 on 6th day.
Color of patties became light yellow during the end stage of the storage period and the consequent ∆E value was calculated 0.89 and 0.28 on 18th and 21st day of storage, respectively. On 18th day of storage the ∆E value was maximum, indicating maximum change in color of patties during this period. Changes in acceptable color of chicken patties indicate the deterioration in its quality and acceptability; therefore change in color of quality indicator during the last stage of storage correlates well with change in quality of chicken patties.
Conclusion
In the present study, anthocyanin rich Jamun fruit skin extract has been used to develop a quality indicator. During storage, when these indicators were attached inside the packets of chicken patties, it changed its dark violet color to yellow. A simultaneous quality deterioration of packaged chicken patties was also been observed. The indicator is sensible to detect the volatile basic compounds generated during storage of meat products and its color change pattern is precise, which correlates well with the changes in the quality attributes. The developed quality indicator produces reliable responses to the variation in quality attributes of stored meat product, indicating its potential for applications in intelligent food packaging to assess meat food safety and quality.
Funding
This study was funded by Ministry of Food Processing Industries (SERB/MOFPI/0019/2014).
Compliance with ethical standards
Conflict of interest
Author Dr. Suman Talukder declares that he has no conflict of interest. Co-author Dr. S. K. Mendiratta declares that he has no conflict of interest. Co-author Dr. R. R. Kumar declares that he has no conflict of interest. Co-author Dr. R. K. Agrawal declares that he has no conflict of interest. Co-author Dr. A. Soni declares that he has no conflict of interest. Co-author Ashish Luke declares that he has no conflict of interest. Co-author Dr. Sagar Chand declares that he has no conflict of interest.
Ethical approval
This article does not contain any studies with human participants or animals performed by any of the authors.
Informed consent
Informed consent was obtained from all individual participants included in the study.
Footnotes
Publisher's Note
Springer Nature remains neutral with regard to jurisdictional claims in published maps and institutional affiliations.
References
- Ali EH. Effects of some amino acids on ammonia secretion and extracellular protease activity by three oomycetes in synthetic medium with or without glucose. Mycobiology. 2005;33(1):23–29. doi: 10.4489/MYCO.2005.33.1.023. [DOI] [PMC free article] [PubMed] [Google Scholar]
- APHA . Compendium of methods for microbiological examination of food. 4. Washington: American Public Health Association; 2001. [Google Scholar]
- Baldevbhai PJ, Anand RS. Color Image segmentation for medical images using L*a*b* Color space. IOSR J Electro Commun Eng. 2012;1(2):24–45. [Google Scholar]
- Berry BW, Stiffler DM. Effect of electric stimulator boiling temperature formulation and rate of freezing on sensory cooking chemical and physical properties of ground beef patties. J Food Sci. 1981;46:1103–1106. [Google Scholar]
- Bhat ZF, Pathak V, Fayaz H. Effect of refrigerated storage on the quality characteristics of microwave cooked chicken Seekh Kababs extended with different non-meat proteins. J Food Sci Technol. 2013;50(5):926–933. doi: 10.1007/s13197-011-0410-4. [DOI] [PMC free article] [PubMed] [Google Scholar]
- Biswas O, Talwar NA, Bhattacharya D, Das SK, Chaudhary S. Effect of refrigeration on quality and stability of fresh fish and poultry muscles. Indian J Anim Health. 2017;56(1):65–76. [Google Scholar]
- Bruckner S, Albrecht A, Petersen B, Kreyenschmidt J. characterization and comparison of spoilage processes in fresh pork and poultry. J Food Quality. 2012;35:372–382. [Google Scholar]
- Byun JS, Min JS, Kim IS, Kim JW, Chung MS, Lee M. Comparison of indicators of microbial quality of meat during aerobic cold storage. J Food Protect. 2003;66:1733–1737. doi: 10.4315/0362-028x-66.9.1733. [DOI] [PubMed] [Google Scholar]
- Duncan DB. Multiple range and multiple F tests. Biometrics. 1955;11:1–42. [Google Scholar]
- Fernandez-lopez J, Zhi N, Aleson-carbonell L, Perez-alvarez JA, Kuri V. Antioxidant and antibacterial activities of natural extracts: application in beef meatballs. Meat Sci. 2005;69:371–380. doi: 10.1016/j.meatsci.2004.08.004. [DOI] [PubMed] [Google Scholar]
- Froehlich DA, Gullet EA, Usborne WR. Effect of nitrite and salt on the color, flavor and overall acceptability of ham. J Food Sci. 1983;48(1):152–154. [Google Scholar]
- Ghollasi-Mood F, Mohsenzadeh M, Reza Housaindokht M, Varidi M. Microbial and chemical spoilage of chicken meat during storage at isothermal and fluctuation temperature under aerobic conditions. Iran J Vet Sci Technol. 2016;8(1):38–46. [Google Scholar]
- Golasz LB, Da Silva L, Da Silva SB. Film with anthocyanins as an indicator of chilled pork deterioration. Cienc Tecnol Aliment Campinas. 2013;33(1):155–162. [Google Scholar]
- Goulas AE, Chouliara I, Nessi E, Kontominas MG, Savvaidis IN. Microbiological, biochemical and sensory assessment of mussels (Mytilus galloprovincialis) stored under modified atmosphere packaging. J Appl Microbiol. 2005;98:752–760. doi: 10.1111/j.1365-2672.2004.02512.x. [DOI] [PubMed] [Google Scholar]
- He J, Giusti MM. Anthocyanins: natural colorants with health-promoting properties. Annu Rev Food Sci Technol. 2010;1:163–187. doi: 10.1146/annurev.food.080708.100754. [DOI] [PubMed] [Google Scholar]
- Jay JM. Modern food microbiology. 4. New Delhi: CBS Publishers and Distributors; 1996. [Google Scholar]
- Karamucki T, Jakubowska M, Rybarczyk A, Gardzielewska J. The influence of myoglobin on the colour of minced pork loin. Meat Sci. 2013;94:234–238. doi: 10.1016/j.meatsci.2013.01.014. [DOI] [PubMed] [Google Scholar]
- KEETON JIMMY T. Effects of Fat and NaCl/Phosphate Levels on the Chemical and Sensory Properties of Pork Patties. Journal of Food Science. 1983;48(3):878–881. [Google Scholar]
- Khare AK, Biswas AK, Balasubramanium S, Chatli MK, Sahoo J. Optimization of meat level and processing conditions for development of chicken meat noodles using response surface methodology. J Food Sci Technol. 2015;52(6):3719–3729. doi: 10.1007/s13197-014-1431-6. [DOI] [PMC free article] [PubMed] [Google Scholar]
- Kuswandi B, Damayanti F, Jayus AA, Heng LY. Simple and low-cost on-package sticker sensor based on litmus paper for real-time monitoring of beef freshness. J Math Fund Sci. 2015;47(3):236–251. [Google Scholar]
- Little AC. Off on a tangent. J Food Sci. 1975;40:410–412. [Google Scholar]
- Metivier RP, Francis FJ, Clydesdale FM. Solvent extraction of anthocyanin from wild pomace. J Food Sci. 1980;45:1099–1100. [Google Scholar]
- Moldovanu C, Laslo C. Physicochemical and microbiological research on characteristics of meat products during storage inthe membrane depending on the quality of rawmaterials. ABAH Bioflu. 2010;2(2):65–70. [Google Scholar]
- Nwosu FO, Adekola FA, Ihedioha KC. simple titrimetric colour indicators from some natural flower petals. Centrepoint. 2004;12(1):74–89. [Google Scholar]
- Nychas GJE, Skandamis PN, Tassou CC, Koutsoumanis KP. Meat spoilage during distribution. Meat Sci. 2008;78:77–89. doi: 10.1016/j.meatsci.2007.06.020. [DOI] [PubMed] [Google Scholar]
- Pathade KS, Patil SB, Konda-war MS, Naik-wade NS, Magdum CS. Morus alba fruit-herbal alternative to synthetic acid base indicators. Int J Chem Tech Res. 2009;1(3):549–551. [Google Scholar]
- Patsias A, Badeka AV, Savvaidis IN, Kontominas MG. Combined effect of freeze chilling and MAP on quality parameters of raw chicken fillets. Food Microbiol. 2008;25:575–581. doi: 10.1016/j.fm.2008.02.008. [DOI] [PubMed] [Google Scholar]
- Pearson D. Methods related to protein break down. J Sci Food Agric. 1968;19(3):366–369. doi: 10.1002/jsfa.2740191001. [DOI] [PubMed] [Google Scholar]
- Rosen H. A modified ninhydrin colorimetric analysis for amino acids. Archiv Biochem Biophys. 1957;67(1):10–15. doi: 10.1016/0003-9861(57)90241-2. [DOI] [PubMed] [Google Scholar]
- Russell SM, Fletcher DL, Cox NA. Spoilage bacteria of fresh broiler chicken carcasses. Poult Sci. 2005;74(12):2041–2047. doi: 10.3382/ps.0742041. [DOI] [PubMed] [Google Scholar]
- Sastry VRB, Kamra DN, Pathak NN. Estimation of ammonia nitrogen. Izatnagar: Laboratory Manual of Animal Nutrition, Indian Veterinary Research Institute; 1999. [Google Scholar]
- Shelef LA, Jay JM. Use of titrimetric method to assess the bacterial spoilage of fresh beef. Appl Microbiol. 1970;19:902–905. doi: 10.1128/am.19.6.902-905.1970. [DOI] [PMC free article] [PubMed] [Google Scholar]
- Shukla V, Kandeepan G, Vishnuraj MR. Evaluation of shelf life of buffalo meat in aerobic cold storage using physicochemical parameters. Buff Bull. 2015;34(4):453–457. [Google Scholar]
- Singh BP, Shukla V, Lalawmpuii H, Kumar S. Indicator sensors for monitoring meat quality: a review. J Pharmacogn Phytochem. 2018;7(4):809–812. [Google Scholar]
- Soni A, Mendiratta SK, Talukder S, Kumar RR, Chand S, Jaiswal RK. Development of colorimetric on-package indicator for monitoring of chicken meat freshness during refrigerated storage (4 ± 1°C) J Anim Res. 2018;8(5):847–853. [Google Scholar]
- Strange ED, Benedict RC, Smith JL, Swift CE. Evaluation of rapid test for monitoring alteration in meat quality during storage. J Food Protect. 1977;40:843–847. doi: 10.4315/0362-028X-40.12.843. [DOI] [PubMed] [Google Scholar]
- Talukder S, Mendiratta SK. Exploring purple leaf sand cherry (Prunus cistena) extracts based indicator to monitor meat quality during storage at 10 ± 1° C. Int J Livest Res. 2017;8(7):214–220. [Google Scholar]
- Talukder S, Mendiratta SK, Kumar RR, Agarwal RK, Soni A, Chand S, Singh TP, Sharma H. Development of plant extracts based indicator for monitoring quality of fresh chicken meat during storage at room temperature (25 ± 1° C) J Anim Res. 2017;7(4):751–755. [Google Scholar]
- Trout ES, Hunt MC, Jhnson DE, Claus JR, Kastner CL, Kropt DH. Characteristics of low fat ground beef containing texture modifying ingredients. J Food Sci. 1992;57:19–24. [Google Scholar]
- Walkowiak-Tomczak D, Czapski J, Mlynarczyk K. Assessment of colour changes during storage of elderberry juice concentrate solutions using the optimization method. Acta Sci Pol Technol Aliment. 2016;15(3):299–309. doi: 10.17306/J.AFS.2016.3.29. [DOI] [PubMed] [Google Scholar]
- Washko ME, Rice EW. Determination of glucose by an improved enzymatic procedure. Clin Chem. 1961;7:542–545. [PubMed] [Google Scholar]
- Yusoff A, Kumara NTRN, Lim A, Ekanayake P, Tennakoon KU. Impacts of temperature on the stability of tropical plant pigments as sensitizers for dye sensitized solar cells. J Biophys. 2014;1:1–8. doi: 10.1155/2014/739514. [DOI] [PMC free article] [PubMed] [Google Scholar]
- Zulfajri M, Muttakin M. Activity analysis of anthocyanin from Syzygium cumini (L.) skeels as a natural indicator in acid-base titration. Rasayan J Chem. 2018;11(1):135–141. [Google Scholar]