

Abstract
Hedonic assessment and sensory characteristics of 13 Amaranthus genotypes, stewed with onions, tomatoes and potatoes, were evaluated. 50 consumers ranked their preference on a nine-point hedonic scale to determine overall acceptability of the stewed samples. In addition, 100 consumers were asked to select sensory characteristics that described the genotypes best, using the Check-all-that-apply question. Hedonic responses indicated significant differences (p < 0.001) between stewed samples. Significant differences were also found in the frequency with which consumers used 15 of the 23 terms generated to characterise the sensory profile of stewed Amaranthus leaves. Correspondence analysis illustrated differences in sensory characteristics between genotypes, describing 72.4% variance. Agglomerative hierarchical clustering indicated three consumer preference clusters, while external preference mapping showed the regions of maximum liking. There was no correlation between hedonic evaluation and sensory characteristics. In addition, no strong association between specific species, genotypes and sensory attributes was observed.
Keywords: Amaranthus leaves, Sensory analysis, Check-all-that-apply, Preference mapping, Correspondence analysis
Introduction
Although enough food is produced to feed the earth’s entire population, 10.7% still suffer from malnutrition, mostly in developing countries (FAO et al. 2017). Food shortages and poverty, which eventually lead to micronutrient malnutrition (MNM), are two of the main reasons for food insecurity (Ihuoma 2015). While various fortification and supplementation strategies have been put in place to address MNM, people are advised to include a variety of foods in their diet (Faber and Wenhold 2007). Govender et al. (2017) recommend traditional leafy vegetables (TLVs) to serve as an inexpensive alternative food source for a nutritious and balanced diet, which will contribute to food security.
Over the past few decades, there has been more interest in improving the nutritional quality of plant-based foods (Sands et al. 2009), since research has shown that TLVs can greatly improve an individual’s vitamin A and iron (Fe) intake. According to Labadarios et al. (2008), a portion of cooked leafy vegetables can make a significant contribution to a person’s daily iron, vitamin C and beta-carotene intake. Regardless of the nutritional traits of TLVs, consumers ultimately determine the success of a product (Stone 2018). According to Venter et al. (2007), there is a need to conduct sensory tests on TLVs to provide valid and reliable information about their sensory characteristics.
Trained panels are used for laboratory evaluation of products (in terms of differences or similarities) and for the identification and quantification of sensory characteristics. On the other hand, affective or consumer sensory testing can identity consumer needs that are not currently met by the available food products (Stone 2018).
Amaranthus, an underutilised TLV, is cultivated and consumed in many parts of the world (Amornrit and Santiyanont 2016), including South Africa (SA), where it is known by various vernacular names (Jansen Van Rensburg et al. 2007). It has recently gained importance as a promising food crop, since it adapts to various climatic conditions, it is highly resistant to stresses (heat, drought) and it has high nutritional value (Alemayehu et al. 2015). Rural populations in developing countries mostly consume Amaranthus because it is an inexpensive food source rich in proteins, vitamins, fibre and minerals (Shukla et al. 2003, 2006). In SA, beet spinach (Beta vulgaris var. cicla L.) is the foremost leafy vegetable consumed and Amaranthus is often added as an extender to dishes prepared with spinach (Jansen Van Rensburg et al. 2007).
Recent evidence (Hiscock et al. 2018) reveals that consumers find certain Amaranthus genotypes less acceptable due to undesirable taste attributes, such as a bitter taste and aftertaste. The bitter taste, derived from glucosinolates and isoflavones (Drewnowski and Gomez-Carneros 2000), is widely appreciated by older generations with a rural decent, but rarely by young Western consumers (Owuor and Olaimer-anyara 2007).
Thus, it was proposed to incorporate Amaranthus leaves into a stewed dish that is widely and habitually consumed by rural consumers in SA. This study aimed to evaluate consumers’ hedonic responses towards the overall acceptability of 13 stewed Amaranthus genotypes, as well as to determine their sensory profiles through the application of the Check-all-that-apply (CATA) question, in order to gain insight in differences and similarities.
Materials and methods
Study area, experimental design and plant materials
The study was conducted at Sorgvliet (S29°29′30.5″ E25°31′12.1″), an agricultural farm located 90 km southwest of Bloemfontein, Free State Province, SA, during the 2015/2016 season. A randomised complete block design with three replications was used, where each plot was 3 metres (m) in length, with 0.75 m spacing between rows and 0.3 m within row spacing.
Harvesting of 13 Amaranthus genotypes took place in February 2016, 10 weeks after planting seedlings provided by Agricultural Research Council-Vegetable and Ornamental Plants (ARC-VOP). In order to simulate poor farm practices, plant material was cut back to 0.4 m above ground during manual harvesting and left to grow again for a next harvest event. After harvesting, the plant material was placed in woven polypropylene bags and transported to the sensory facility of the University of the Free State (UFS), where it was stored at 4 °C. Leaves were manually removed from the stem to prevent injury and any material damaged by insects was discarded.
The species that were harvested included Amaranthus caudatus (AC16, TOT 2295, TOT 2275); A. graecizans (Thohoyandou); A. tricolor (A5); A. cruentus (Kobie, Potch, TL, PI477913 and Ames 22680); A. dubius (TOT 2266); A. hypochondriacus (TOT 4151); and Amaranthus sp. (IP5), the species of which is unknown (Gerrano et al. 2017).
Sample preparation for sensory analysis
Samples were prepared on the day of sensory analysis under the supervision and assistance of a professional sensory analyst. Blanched samples (200 g) were defrosted and prepared according to a method used by Matenge et al. (2012). This preparation method was selected, because it represented a dish that was generally accepted and prepared by rural communities (Faber et al. 2010), in the event that money was available to purchase additional ingredients.
Uncooked Amaranthus leaves (37.7%), onions (18.8%) and tomatoes (18.8%) were separately pulsed in a food processor (Kenwood FP110) for 10 s, to ensure that the samples were homogeneous in appearance. Potatoes (15.2%) were pre-cooked in an electric pressure cooker and mashed to a smooth consistency. Subsequently, onions were sautéed in oil (0.9%), after which leaves, additional vegetables and water (5.6%), were added together with flavourings, including sugar (0.9%) and salt (0.2%).
Samples (40 g) were presented in glass ramekins, covered with foil, codified with random three-digit numbers and randomly served at 40 °C to the panel, for both the hedonic evaluation and CATA sensory technique. Panellists attended two evaluation sessions over 2 days (six samples on day one and seven samples on day two) for each sensory technique. Mineral water was available as neutraliser between samples to avoid any carryover effects.
Hedonic evaluation
50 untrained consumers (Table 1), including students and staff members from the UFS, were recruited to participate in the study. Participants who declared themselves regular consumers of LGVs were asked to evaluate the overall liking of the samples on a nine-point hedonic scale (1 = “dislike extremely”, 9 = “like extremely”).
Table 1.
Demographic profile and cluster analysis of 50-member consumer panel for stewed Amaranthus samples
| Percentage (%) | Cluster 1 | Cluster 2 | Cluster 3 | |
|---|---|---|---|---|
| Gender | ||||
| Male | 21 | 21 | 20 | 21 |
| Female | 79 | 79 | 80 | 79 |
| Race | ||||
| African | 75 | 75 | 80 | 72 |
| White | 23 | 25 | 15 | 24 |
| Coloured | 2 | 0 | 5 | 4 |
| Age (years) | ||||
| 20–29 | 21 | 20 | 17 | 25 |
| 30–39 | 30 | 33 | 28 | 23 |
| 40–49 | 32 | 27 | 49 | 37 |
| 50–59 | 15 | 17 | 6 | 15 |
| > 60 | 2 | 3 | 0 | 0 |
Check-all-that-apply (CATA) question
100 consumers, recruited from the UFS, completed a CATA question. According to Ares and Jaeger (2015), the smaller the differences between samples from the results obtained from the hedonic evaluation test, the more consumers are required to perform the CATA question.
The selection of attributes for the CATA question was based on a list of attributes that were generated by a panel of 10 assessors (eight women and two men) and a panel leader with experience in LGVs evaluation. A list of 23 attributes characterising the stewed samples best was compiled from their discussions. Panellists were asked to check all the attributes that they considered appropriate to characterise each of the samples on a ballot sheet. The CATA ballot sheet was presented to panellists in a fixed order and attributes were listed in a randomised order, not according to sensory modalities.
Statistical analysis
An analysis of variance (ANOVA), followed by a Tukey–Kramer multiple-comparison test (p ≤ 0.05), was carried out on the hedonic evaluation data to determine significant differences between genotypes (NCCS 11 Statistical Software 2016).
For the CATA question, the frequency of use for each attribute was determined by counting the number of participants that used the attribute to evaluate the stewed sample and a contingency table was created with these results. Cochran’s Q test was done to determine significant differences (p ≤ 0.05) between samples for each attribute. The Marascuilo procedure (p ≤ 0.05) determined the direction of use between samples. Correspondence analysis (CA) was conducted on the contingency table and was plotted to obtain sample and attribute configurations (XLSTAT 2018).
Agglomerative Hierarchical Cluster Analysis (AHC) was carried out using the Euclidean distances and Ward’s aggregation method. The dendrogram obtained from the AHC was used to identify clusters and grouped samples, based on their sensory characteristics (XLSTAT 2018; Hasted 2018). To conclude, external preference mapping (EPM) linked consumer overall liking scores and responses to the CATA question. A preference map and contour plot were created from class centroids, from the AHC, principal coordinates of the CA and a vector model. The preference map was superimposed on the contour plot (XLSTAT 2018).
Ethical consideration
The Ethics Committee of the Faculty of Natural and Agricultural Sciences, UFS, Bloemfontein approved this study. The ethical clearance number is UFS-HSD2017/0264.
Results and discussion
Hedonic evaluation of stewed leaves
The hedonic evaluation results are summarised in Table 2, revealing that there were highly significant differences (p < 0.001) between the overall hedonic acceptability of stewed samples.
Table 2.
Mean scores for overall hedonic acceptability of stewed Amaranthus samples
| Specie | Score |
|---|---|
| Amaranthus caudatus | |
| AC 16 | 5.30a ± 2.72 |
| TOT 2295 | 5.84ab ± 2.33 |
| TOT 2275 | 6.42ab ± 2.00 |
| A. cruentus | |
| Kobie | 6.00ab ± 2.16 |
| Potch | 7.12b ± 1.97 |
| TL | 6.02ab ± 1.97 |
| P1477913 | 5.92ab ± 2.30 |
| Ames 22680 | 5.72ab ± 2.54 |
| A. specie | |
| IP5 | 6.64ab ± 2.15 |
| A. graecizans | |
| Thohoyandou | 5.92ab ± 2.01 |
| A. hypochondriacus | |
| TOT 4151 | 6.00ab ± 2.12 |
| A. dubius | |
| TOT 2266 | 6.96b ± 1.59 |
| A. tricolor | |
| A5 | 5.26a ± 2.35 |
| Significance level | p < 0.001 |
Genotype Potch (A. cruentus) and TOT 2266 (A. dubius) obtained the highest overall hedonic acceptability, with moderate preference. However, the differences in acceptability for both genotypes were the best. Although these genotypes originated from two different species, they were both “liked moderately” by panellists. On the other hand, AC 16 (A. caudatus) and A5 (A. tricolor), which obtained the lowest mean scores and were “neither liked nor disliked”, differed significantly from Potch and TOT 2266. Similar results were also reported by Hiscock et al. (2018) on boiled Amaranthus genotypes. In the present investigation, no meaningful association could be made between genotypes of the same species.
Check-all-that-apply (CATA) question
A summary of the sensory characteristics of stewed Amaranthus, as well as the frequency of use and the significant differences between genotypes can be found in Table 3. Most frequently selected terms were “leafy”, “spinach”, “onion”, “sandy”, “onion aftertaste” and “bitter aftertaste”, while the least selected terms were “sour”, “metallic aftertaste”, “peppery” and “tasteless”. Significant differences were found in the frequencies for 15 of the 23 terms in the CATA question.
Table 3.
The frequency of use of attributes associated with stewed Amaranthus samples
| Species | A. caudatus | A. cruentus | A. sp | A. graecizans | A. hypochondriacus | A. dubius | A. tricolor | ||||||
|---|---|---|---|---|---|---|---|---|---|---|---|---|---|
| Genotype | AC 16 | TOT 2295 | TOT 2275 | Kobie | Potch | TL | P 1477913 | Ames 22680 | IP 5 | Thohoyandou | TOT 4151 | TOT 2266 | A5 |
| LeafyNS | 68 | 72 | 68 | 75 | 65 | 58 | 61 | 69 | 66 | 65 | 66 | 63 | 74 |
| SpinachNS | 57 | 54 | 49 | 54 | 45 | 45 | 55 | 47 | 47 | 41 | 51 | 55 | 51 |
| FibrousNS | 28 | 27 | 29 | 26 | 30 | 22 | 27 | 33 | 33 | 27 | 25 | 26 | 33 |
| SaltyNS | 21 | 31 | 28 | 25 | 27 | 23 | 24 | 32 | 30 | 17 | 18 | 26 | 25 |
| Salty AftertasteNS | 17 | 14 | 14 | 11 | 9 | 16 | 12 | 16 | 21 | 8 | 9 | 8 | 16 |
| PepperyNS | 7 | 9 | 7 | 2 | 6 | 12 | 13 | 12 | 10 | 17 | 9 | 10 | 8 |
| TastelessNS | 12 | 13 | 13 | 9 | 9 | 14 | 5 | 7 | 8 | 3 | 13 | 10 | 7 |
| SourNS | 7 | 6 | 3 | 4 | 6 | 6 | 11 | 4 | 10 | 6 | 5 | 7 | 8 |
| Grassy* | 28ab | 25ab | 23ab | 20ab | 11a | 22ab | 24ab | 36b | 27ab | 23ab | 19ab | 22ab | 27ab |
| Sandy** | 37ab | 39ab | 36ab | 48b | 35ab | 43b | 20a | 44b | 28ab | 32ab | 39ab | 33ab | 44b |
| Firm** | 20ab | 33ab | 36b | 20ab | 23ab | 20ab | 18ab | 28ab | 30ab | 16a | 16a | 31ab | 29ab |
| Coarse** | 13a | 21ab | 25ab | 18ab | 10a | 17ab | 19ab | 34b | 21ab | 15a | 14a | 20ab | 26ab |
| Sweet Aftertaste** | 14ab | 17ab | 14ab | 9ab | 14ab | 13ab | 5a | 3a | 8ab | 4a | 21b | 10ab | 6a |
| Onion Aftertaste** | 28ab | 37ab | 36ab | 35ab | 36ab | 24ab | 22ab | 22ab | 36ab | 17a | 30ab | 40b | 29ab |
| Onion*** | 43ab | 52b | 47b | 45b | 47b | 41ab | 39ab | 30ab | 52b | 21a | 33ab | 47b | 39ab |
| Bitter Aftertaste*** | 30abc | 17a | 20ab | 28abc | 25ab | 18a | 49 cd | 41bc | 22ab | 65d | 17a | 24ab | 33abc |
| Bitter*** | 38cde | 11a | 14ab | 23abcd | 31abcde | 12a | 42de | 45e | 25abcde | 67f | 17abc | 24abcde | 34bcde |
| Potato*** | 25ab | 41b | 27ab | 27ab | 23ab | 16a | 29ab | 21a | 26ab | 20a | 17a | 31ab | 22ab |
| Tomato*** | 18a | 30ab | 15a | 23a | 26ab | 27ab | 19a | 25a | 32ab | 22a | 46b | 17a | 25a |
| Stalky*** | 18ab | 22abc | 25abc | 25abc | 28abc | 23abc | 18ab | 38c | 33abc | 21abc | 18ab | 17a | 37bc |
| Soft*** | 27ab | 24ab | 17ab | 24ab | 36b | 32ab | 26ab | 13a | 21ab | 32ab | 35b | 20ab | 13a |
| Sweet*** | 18ab | 24ab | 24ab | 19ab | 24ab | 24ab | 12ab | 7a | 14ab | 10ab | 27b | 22ab | 8a |
| Metallic Aftertaste*** | 12ab | 4a | 5a | 9ab | 8ab | 9ab | 16ab | 10ab | 7a | 21b | 7a | 7a | 6a |
***Indicates significant differences among samples according to Cochrans Q test at p ≤ 0.001
**Indicates significant differences among samples according to Cochrans Q test at p ≤ 0.01
*Indicates significant differences among samples according to Cochrans Q test at p ≤ 0.05
NSIndicates no significant difference among samples according to Cochrans Q test at p > 0.05
Textural attributes, including “soft”, “coarse” and “firm”, differed significantly among genotypes. Genotypes Potch and TOT 4151 had a significantly higher frequency of use (p ≤ 0.001) for the term “soft” than Ames 22680 and A5. In contrast, Ames 22680 and TOT 2275 differed significantly (p ≤ 0.01) from TOT 4151 and Thohoyandou for the attributes “coarse” and “firm”, respectively. Texture is a major determinant of consumer preference. However, during freezing, ice crystals are formed that damage the rigid cellular structure and lead to changes in the flavours and pigments of the plant material (Fellows 2000). Furthermore, during cooking, structural carbohydrates soften due to the cellular wall structure that becomes permeable during heating. This leads to water loss and, consequently, loss of the cell walls’ turgor and rigidity. Thus, during heating, the plant material softens and eases chewing (Srilakshmi 2003). According to Weinberger and Msuya (2004), the leaves of Amaranthus spp. are generally regarded as soft, although some species are coarser and more fibrous.
The frequency of use for the term “stalky” differed significantly (p ≤ 0.001) between TOT 2266, and A5 and Ames 22680. According to Akaneme and Ani (2013), Amaranthus species can be distinguished from one another by means of their petiole length. Vorster et al. (2002) mention that young and soft petioles are preferred over old and hard petioles, and that it is often removed during the preparation of vegetable dishes.
The use of the attribute “sandy” was most noticeable in genotypes Kobie, Ames 22680, A5 and TL, and differed significantly (p ≤ 0.01) from P1477913. The “sandy” texture detected may be ascribed to the occurrence of calcium oxalate crystals in Amaranthus leaves. This confirms the results of Onyeoziri et al. (2018), who detected a sandy texture in Amaranthus cruentus and Cleome gynandra leaves and suspected that it may be due to an interaction between calcium and oxalic acid present in the vegetables. The oxalic content of Amaranthus leaves can vary between genotypes and species, and can be reduced by boiling (Chai and Liebman 2005).
There were significant differences between the frequency of use for attributes related to taste and aftertaste. The attributes “bitter” and “bitter aftertaste” were frequently selected to describe genotypes P1477913 and Ames 22680, and differed significantly (p ≤ 0.001) from TOT 2295, TL and TOT 4151. Thohoyandou was by far the “bitterest” of all the genotypes. These results correlate with the studies of Hiscock et al. (2018), who found that Thohoyandou and P1477913 were most frequently described as “bitter”, which suggests that there may be a difference in the concentration of bitter-inducing compounds between genotypes. Research indicates that components, such as glucosinolates (Drewnowski and Gomez-Carneros 2000), the calcium content of vegetables (Tordoff and Sandell 2009), and the presence of alkaloids in TLVs (Essack et al. 2017) are responsible for the bitter taste, which is the reason why consumption is often avoided (Slavin and Lloyd 2012).
In addition to unacceptable taste attributes, the frequency of use for the attribute “metallic aftertaste” differed significantly (p ≤ 0.001) between Thohoyandou and TOT 2295, TOT 2275, IP5, TOT 4151, TOT 2266 and A5. Lawless et al. (2005) state that the attribute “metallic aftertaste” is often used to describe the taste of salt compounds, including calcium (bitter) and magnesium (bitter). The results obtained from the current study are consistent with previous results by Hiscock et al. (2018), where genotype Thohoyandou, which was mainly described by attributes such as “bitter” with a “bitter aftertaste”, also scored a high frequency for “metallic aftertaste”, regardless of the additional ingredients.
Hiscock et al. (2018) suggest adding additional ingredients to boiled Amaranthus leaves to mask undesirable taste attributes. Even though the bitter taste still emerged among the stewed leaves, with specific genotypes, the frequency of use was considerably less, compared to boiled Amaranthus leaves. In contrast to the boiled leaves, the stewed leaves were also characterised by a sweeter taste. The frequency of use for the attribute “sweet” differed significantly (p ≤ 0.001) between genotypes TOT 4151, Ames 22680 and A5. Additionally, the use of the term “sweet aftertaste” also differed significantly (p ≤ 0.01) for genotypes P1477913, Ames 22680, Thohoyandou, A5 and TOT 4151. The increase in sweetness amongst the boiled and stewed leaves can be attributed to the addition of sugar and the sautéing of onions. During the process, large sugar molecules are broken down into simple sugar molecules, which results in a sweeter taste and reduced bitterness (Drewnowski and Gomez-Carneros 2000; López-Alt 2015). Similar results have been reported elsewhere for lucerne (Mielmann et al. 2015) and cowpea leaves (Matenge et al. 2012).
Furthermore, the frequency of use for the term “onion” and “onion aftertaste” differed significantly (p ≤ 0.01; p ≤ 0.001) between genotype TOT 2266 and Thohoyandou. Table 3 shows significant differences among genotypes, including TOT 4151 and TOT 2266, which obtained high values for “sweet”, “sweet aftertaste”, “onion” and “onion aftertaste” and lower values for “bitter” and “bitter aftertaste”. These all differed from Thohoyandou. Thus, regardless of the additional ingredients, which contributed to taste and overall acceptability, genotype Thohoyandou was still predominantly described as “bitter”, with a “bitter aftertaste”.
Correspondence analysis (CA)
To illustrate the association between samples and terms, CA was carried out on the contingency table to obtain a sensory map of the stewed samples (Fig. 1). The first two dimensions on the map explained 72.4% of the experimental data variability, representing 52.0% (D1) and 20.4% (D2), respectively.
Fig. 1.

Representation of the samples and the terms in the first and second dimensions of the CA, of the frequency table of the CATA question
As indicated in Fig. 1, genotypes TOT 4151, Potch and TL, positioned in the upper left quadrant, were described as “sweet”, with a “sweet aftertaste” and a “soft” texture. In the upper right quadrant, P1477913 and Thohoyandou were described as “bitter”, with a “bitter aftertaste” and “metallic aftertaste”. Genotypes TOT 2295 and TOT 2275, situated in the bottom left quadrant, had a “firm” texture with an “onion” aroma, and according to the attributes selected, it was also “sweet” with a “sweet aftertaste”. Lastly, in the bottom right quadrant, Ames 22680 was described as “coarse”. Participants also frequently used the attribute “bitter” to describe this genotype. In the same quadrant, A5 was described as “sandy” and “stalky”.
Agglomerative hierarchical clustering (AHC) and external preference mapping (EPM)
As indicated in Fig. 2, the dendrogram, which was comprised of variable demographic groups, is presented in Table 1. Cluster one consisted of 30 black (75%) female (79%) participants aged between 30 and 39 years. Cluster two, with eight participants, consisted of 80% black female participants aged between 40 and 49 years. This cluster had the smallest number of white (15%) male (20%) participants. Lastly, cluster three comprised 12 participants, mostly black (72%) females (79%) aged between 40 and 49 years.
Fig. 2.

Dendrogram of the AHC, indicating the presence of three clusters of consumers’ overall hedonic acceptability of stewed Amaranthus samples
External preference mapping shows cluster one, situated in the blue region of the plot, consisting of genotypes Ames 22680, TOT 2266, TOT 2295, TOT 2275, A5 and IP5 (Fig. 3). Genotypes TOT 2266 (A. dubius) and AC16 (A. caudatus), which differed significantly from each other, were both located in the blue region, with a 20–40% preference. This implied that small groups of consumers liked these two genotypes and gave high hedonic scores (XLSTAT 2018). Also located in the cold region, but not assigned to any clusters, were Thohoyandou, P1477913 and AC 16. These three genotypes were not preferred and were mainly characterised as “bitter”, with a “bitter aftertaste”. The remaining two clusters were situated in the orange area, with acceptance values between a 60–80% preferences (XLSTAT 2018). Cluster two indicated a clear preference for genotypes Potch and TOT 4151, while cluster three preferred TL and Kobie.
Fig. 3.
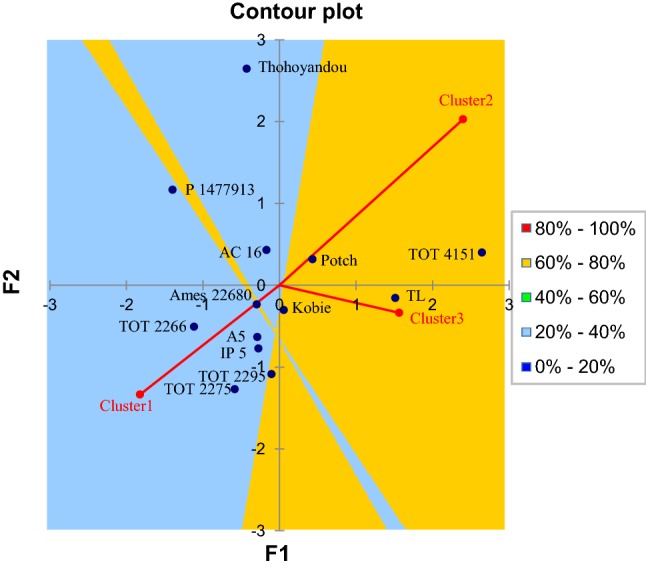
Contour plot of the EPM of consumers on the stewed Amaranthus leaves
Conclusion
The results of the present investigations suggest that a stewing method, containing ingredients, such as potatoes, tomatoes and onions, was able to mask the bitterness of Amaranthus genotypes and increased acceptability. Consumer hedonic evaluation and sensory characteristics differed significantly between Amaranthus genotypes and species. Genotypes in the same species revealed both similar and contradictory sensory characteristics. Thus, there was no strong association between specific species, genotypes and sensory descriptors.
The results of this study may be helpful for investigating components responsible for the bitter taste and sandy texture of Amaranthus leaves. As stated by Onyeoziri et al. (2018), additional methods that mask the bitterness of this LGV should be considered, as this may lead to commercially viable products that are acceptable to the target population. This may help to promote the consumption of Amaranthus leaves, create employment opportunities for small-scale farmers and promote the conservation of this indigenous LGV.
Acknowledgements
The authors are thankful to the Agricultural Research Council for providing the funding to conduct the research (No. P0900020-04).
Footnotes
Publisher's Note
Springer Nature remains neutral with regard to jurisdictional claims in published maps and institutional affiliations.
Contributor Information
Lucil Hiscock, Email: HiscockL@ufs.ac.za.
Carina Bothma, Email: BothmaC@ufs.ac.za.
Arnold Hugo, Email: HugoA@ufs.ac.za.
Angeline van Biljon, Email: avbiljon@ufs.ac.za.
Willem Sternberg Jansen van Rensburg, Email: WjvRensburg@arc.agric.za.
References
- Akaneme FI, Ani GO. Morphological assessment of genetic variability among accessions of Amaranthus hybridus. World Appl Sci J. 2013;28:568–577. [Google Scholar]
- Alemayehu FR, Bendevis MA, Jacobsen S-E. The potential for utilizing the seed crop Amaranth (Amaranthus spp.) in East Africa as an alternative crop to support food security and climate change mitigation. J Agron Crop Sci. 2015;201:321–329. doi: 10.1111/jac.12108. [DOI] [Google Scholar]
- Amornrit W, Santiyanont R. Neuroprotective effect of Amaranthus lividus and Amaranthus tricolor and their effects on gene expression of RAGE during oxidative stress in SH-SY5Y cells. Genet Mol Res. 2016;15:1–14. doi: 10.4238/gmr.15027562. [DOI] [PubMed] [Google Scholar]
- Ares G, Jaeger S. Check-all-that-apply (CATA) questions with consumers in practice: experimental considerations and impact on outcome. In: Delarue J, Lawlor B, Rogeaux M, editors. Rapid sensory profiling techniques and related methods: applications in new product development and consumer research. London: Woodhead Publishing; 2015. pp. 227–245. [Google Scholar]
- Chai W, Liebman M. Effect of different cooking methods on vegetable oxalate content. J Agric Food Chem. 2005;53:3027–3030. doi: 10.1021/jf048128d. [DOI] [PubMed] [Google Scholar]
- Drewnowski A, Gomez-Carneros C. Bitter taste, phytonutrients, and the consumer: a review. Am J Clin Nutr. 2000;72:1424–1435. doi: 10.1093/ajcn/72.6.1424. [DOI] [PubMed] [Google Scholar]
- Essack H, Odhav B, Mellem JJ. Screening of traditional South African leafy vegetables for specific anti-nutritional factors before and after processing. Food Sci Technol. 2017;37:462–471. doi: 10.1590/1678-457x.20416. [DOI] [Google Scholar]
- Faber M, Wenhold F. Nutrition in contemporary South Africa. Water SA. 2007;33:393–400. doi: 10.4314/wsa.v33i3.180609. [DOI] [Google Scholar]
- Faber M, Oelofse A, Van Jaarsveld PJ, et al. African leafy vegetables consumed by households in the Limpopo and KwaZulu-Natal Provinces in South Africa. S Afr J Clin Nutr. 2010;23:30–38. doi: 10.1080/16070658.2010.11734255. [DOI] [Google Scholar]
- FAO, IFAD, WFP, WHO . The state of food security and nutrition in the world 2017. Rome: Building Resilience for Peace and Food Security; 2017. [Google Scholar]
- Fellows PJ. Food processing technology: principles and practice. 2. Boca-Raton: CRC Press; 2000. [Google Scholar]
- Gerrano AS, Jansen Van Rensburg WS, Mavengahama S, Bairu M, Venter SL, Adebola P. Qualitative morphological diversity of Amaranthus species. J Trop Agric. 2017;55:12–20. [Google Scholar]
- Govender L, Pillay K, Siwela M, Modi A, Mabhaudhi T. Food and nutrition insecurity in selected rural communities of KwaZulu-Natal, South Africa—linking human nutrition and agriculture. Int J Environ Res Public Health. 2017;14:E17. doi: 10.3390/ijerph14010017. [DOI] [PMC free article] [PubMed] [Google Scholar]
- Hasted A. Statistical analysis of descriptive data. In: Kemp SE, Hort J, Hollowood T, editors. Descriptive analysis in sensory evaluation. New York: Wiley-Blackwell; 2018. p. 188. [Google Scholar]
- Hiscock L, Bothma C, Hugo A, Van Biljon A, Jansen van Rensburg WS. Overall liking and sensory profiling of boiled Amaranthus leaves using the check-all-that-apply question. CyTA J Food. 2018;16:822–830. doi: 10.1080/19476337.2018.1464521. [DOI] [Google Scholar]
- Ihuoma UN. Synergy of poverty, food insecurity and malnutrition. IOSR J Environ Sci Toxicol Food Technol. 2015;9:35–40. [Google Scholar]
- Jansen Van Rensburg WS, Van Averbeke W, Slabbert R, Faber M, Van Jaarsveld P, Van Heerden I, Wenhold F, Oelofse A. African leafy vegetables in South Africa. Water SA. 2007;33:317–326. doi: 10.4314/wsa.v33i3.180589. [DOI] [Google Scholar]
- Labadarios D, Swart R, Maunder E. Executive summary of the national food consumption survey fortification baseline (NFCS-FB-I) South Africa, 2005. S Afr J Clin Nutr. 2008;21:245–300. [Google Scholar]
- Lawless HT, Stevens DA, Chapman KW, Kurtz A. Metallic taste from electrical and chemical stimulation. Chem Senses. 2005;30:185–194. doi: 10.1093/chemse/bji014. [DOI] [PMC free article] [PubMed] [Google Scholar]
- López-Alt JK. The food lab: better home cooking through science. New York: WW Norton & Company; 2015. [Google Scholar]
- Matenge ST, Van der Merwe D, De Beer H, et al. Consumers’ beliefs on indigenous and traditional foods and acceptance of products made with cow pea leaves. Afr J Agr Res. 2012;7:2243–2254. [Google Scholar]
- Mielmann A, Bothma C, Hugo A, Hugo CJ. Descriptive sensory analysis and consumer acceptability of lucerne (Medicago sativa L.) Br Food J. 2015;117:2975–2992. doi: 10.1108/BFJ-02-2015-0066. [DOI] [Google Scholar]
- NCCS 11 Statistical Software . NCSS. Kaysville: LLC; 2016. [Google Scholar]
- Onyeoziri IO, Kinnear M, De Kock HL. Relating sensory profiles of canned amaranth (Amaranthus cruentus), cleome (Cleome gynandra), cowpea (Vigna unguiculata) and Swiss chard (Beta vulgaris) leaves to consumer acceptance. J Sci Food Agric. 2018;98:2231–2242. doi: 10.1002/jsfa.8710. [DOI] [PubMed] [Google Scholar]
- Owuor OB, Olaimer-anyara E. The value of leafy vegetables: an exploration of African Folklore. Afr J Food Agric Nutr Dev. 2007;7:1–13. [Google Scholar]
- Sands DC, Morris CE, Dratz EA, Pilgeram AL. Elevating optimal human nutrition to a central goal of plant breeding and production of plant-based foods. Plant Sci. 2009;177:377–389. doi: 10.1016/j.plantsci.2009.07.011. [DOI] [PMC free article] [PubMed] [Google Scholar]
- Shukla S, Pandey V, Pachauri G, Dixit BS, Banerji R, Singh SP. Nutritional contents of different foliage cuttings of vegetable amaranth. Plant Foods Hum Nutr. 2003;58:1–8. doi: 10.1023/B:QUAL.0000040338.33755.b5. [DOI] [Google Scholar]
- Shukla S, Bhargava A, Chatterjee A, Srivastava J, Singh N, Singh SP. Mineral profile and variability in vegetable amaranth (Amaranthus tricolor) Plant Foods Hum Nutr. 2006;61:21–26. doi: 10.1007/s11130-006-0004-x. [DOI] [PubMed] [Google Scholar]
- Slavin J, Lloyd B. Health benefits of fruits and vegetables. Adv Nutr. 2012;3:506–516. doi: 10.3945/an.112.002154. [DOI] [PMC free article] [PubMed] [Google Scholar]
- Srilakshmi B. Food science. New Delhi: New Age International; 2003. [Google Scholar]
- Stone H. Example food: what are its sensory properties and why is that important? NPJ Sci Food. 2018;2:1–3. doi: 10.1038/s41538-018-0019-3. [DOI] [PMC free article] [PubMed] [Google Scholar]
- Tordoff MG, Sandell MA. Vegetable bitterness is related to calcium content. Appetite. 2009;52:498–504. doi: 10.1016/j.appet.2009.01.002. [DOI] [PMC free article] [PubMed] [Google Scholar]
- Venter SL, Jansen Van Rensburg WS, Vorster HJ, et al. Promotion of African leafy vegetables within the agricultural research council—Vegetable and Ornamental Plant Institute: the impact of the project. Afr J Food Agric Nutr Dev. 2007;7:1–20. [Google Scholar]
- Vorster HJ, Jansen van Rensburg WS, Van Zijl J, Van den Heever E. Germplasm management of African Leafy Vegetables for the nutritional and food security needs of vulnerable groups in South Africa. Pretoria: ARC-VOPI; 2002. [Google Scholar]
- Weinberger K, Msuya J (2004) Indigenous vegetables in Tanzania: significance and prospects. Technical bulletin no. 31. AVRDC—The World Vegetable Center, Shanhua
- XLSTAT (2018) Data analysis and statistical solution for microsoft excel. Paris, France