

Abstract
Refractance window (RW) drying of mango pulp has shown good quality retention compared to conventional drying methods. Different pulp thickness (2, 3 and 4 mm) and drying temperature (85, 90 and 95 °C) were optimized for RW drying of mango pulp for responses as drying time, ascorbic acid, total phenolics content (TPC) and hardness of mango leather. Face-centered central composite design was performed for optimization using Design-Expert software. RW drying of 2 mm thick mango pulp took the shortest drying time, however lower ascorbic acid and TPC were determined as compared to 3 mm and 4 mm thick pulp mango leather. Hardness of RW dried mango leather was determined to be in the chewable range as 3.62–5.33 N. The optimum solution generated for RW drying temperature and pulp thickness was 95 °C and 2.49 mm, respectively. The drying time was 22.5 min with high quality retention in terms of ascorbic acid, TPC and hardness as 62.33 mg/100 g DW, 7.72 mg GAE/g DW and 4.60 N respectively of dried product with desirability function obtained was 0.969. More nutrients were preserved in mango leather as well as microstructure of mango powder was observed as smooth and flaky with uniform thickness of powder particles with RW drying process when compared with tray and oven drying at 95 °C drying temperature and 2.50 mm mango pulp thickness.
Keywords: Refractance window drying, Pulp thickness, Drying temperature, Optimization, Microstructure
Introduction
Mango (Mangifera indica L.) is a tropical fruit consumed widely in fresh or processed form throughout the world. Mango is the most important fruit of India and is known as “King of fruits”. Mango production support orchard rejuvenation program in India (Anonymous 2017). India occupies top position among mango growing countries of the world and produces 42.2% of the total world mango production in 2016–17 (Anonymous 2017).
Dehydration of mango pulp to make leather is effective for preservation of nutrients and taste for the offseason (Maskan et al. 2002). Fruit leathers evolved from homemade preparation; however, nowadays they are gaining popularity by becoming an industrial product. In past decades the main drying process for preparing fruit leathers were solar drying, tray drying, drum drying and cabinet drying with low cost of production (Pua et al. 2010). Conventional drying processes apply relatively high temperatures for longer duration which adversely affects the quality of product that changes consumer preferences (Kumar et al. 2006). Refractance window (RW) drying is a novel drying technique to preserve precious nutrients in dried products at relatively low processing temperatures with reasonable capital costs (Nindo et al. 2003a). Equipments of RW drying require 50% less energy, 50–70% less capital expenses than freeze-drying for the same drying capacity (Nindo and Tang 2007) and characterized to have high evaporation competence of up to 10 kg m−2 h−1 (Zotarelli et al. 2015; Raghavi et al. 2018).
Selection of proper drying conditions is of primary importance for reduced thermal stress during drying and retention of nutrients, flavour, aroma compounds and microstructure of the dried product (Caparino et al. 2012). Refractance window drying of fruit pulp mainly depends upon the drying temperature and thickness of pulp (Ochoa-Martínez et al. 2012; Zotarelli et al. 2015). Microscopic structure and solubility is an important characteristic of fruit powders which were significantly affected by the drying process employed (Caparino et al. 2012; Celli et al. 2016).
The effect of independent factors and their interactions on food processing can be efficiently evaluated and optimized using Response Surface Methodology (RSM) (Shende and Sidhu 2016). There is a lack of information on optimization and proper selection of drying temperature and pulp thickness for making mango leather using Refractance window drying process. Therefore, the primary aim of this work is to optimize refractance window drying process parameters viz., temperature of heated water and thickness of pulp. Secondary objective is to compare RW drying optimized results with the traditional or conventional drying processes such as tray and oven drying at similar drying temperature and pulp thickness.
Materials and methods
Pulp extraction
Langra variety ripe mango was procured from Local Market of Kharagpur, West Bengal, India. Healthy mangoes were selected for cleaning, washing and stones removal. Mango slices were converted into pulp using adapted pulper (Pasteur Engg. Co.(P) Ltd, Kolkata, India). Potassium meta-bisulphite (0.75% of pulp) was mixed with mango pulp. Pre-cleaned and sterilized glass bottles were filled with pulp and sealed with metal caps. The bottles were sterilized in boiler filled with water at boiling temperature 97–100 °C for 20 min, then cooled in open air to reach ambient temperature. These were placed inside refrigerator for further use and yearlong preservation. Mango pulp had moisture content 81.84 ± 0.52% (wb). TSS of mango pulp was determined using hand refracto-meter (Erma, Tokyo). The samples were thawed for 1 h at ambient room temperature before drying.
Refractance window drying
A float (24 × 15 × 3 cm) was prepared from Mylar® sheet (DuPont) to conduct experiments in batch mode. Uniform thickness of mango pulp was spread by means of Film Coating machine (MTI Corporation, USA) on the top surface of Mylar float. Batch Refractance window drying was conducted in water bath (S. D. Instruments & Equipments, Kolkata, India) at 95 ± 2 °C temperature (Nindo et al. 2003b; Zotarelli et al. 2015) as shown in Fig. 1. The Mylar float was put on the water surface in the hot water bath. Product temperature was maintained lower than 75 °C during drying experiment almost all the time, as indicated by Type-J thermocouple. Hot air oven (Orion, India) was used to determine residual moisture in mango leather after completion of drying process. Desirable moisture content in the mango should be in the range of 15–25% (wb) to categorise it as intermediate moisture food (Shende et al. 2016; Kaur et al. 2017).
Fig. 1.
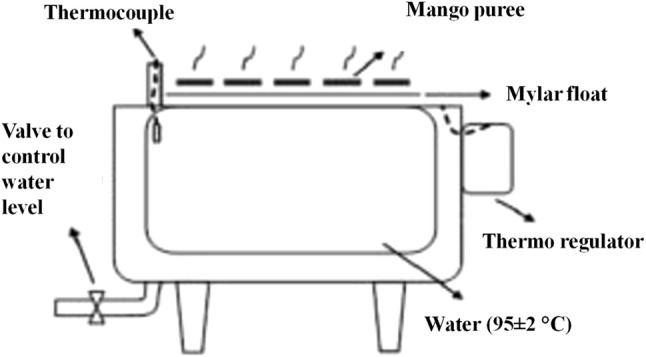
Refractance window drying of mango puree using thermostatic water bath
The time required for drying and quality characteristics of mango leather such as ascorbic acid, TPC and hardness were determined using standard methods as described below:
Ascorbic acid
Ascorbic acid of mango leather was determined by 2,6-dichloroindophenol titrimetric method (FSSAI 2015; Sogi et al. 2015). In brief, 2 g sample was agitated on rotary shaker (MULTISPAN) with 3% metaphosphoric acid (25 ml) for 60 min followed by homogenization and filtering through filter paper (Whatman 1, 2.5 cm). Afterwards, filtrate aliquot (5 ml) was titrated against 2,6-dichloroindophenol dye (standardized by metaphosphoric acid) until pink end-point resulted. The ascorbic acid content was expressed on a dry weight basis as mg/100 g sample.
Total phenolics content
Total phenolics content (TPC) of mango products was determined using the Folin–Ciocalteu assay with gallic acid as standards (Sogi et al. 2015). Mango pulp and leather sample (1 g) were mixed with 20 mL of methanol-80, agitated on water-bath shaker for 60 min, followed by centrifugation (10,000 g for 10 min) (Sogi et al. 2015). An aliquot of sample supernatant (0.5 ml) was added to 2.5 ml diluted Folin–Ciocalteu reagent (0.2 N). After 5 min, 2 ml sodium carbonate solution (7.5%) was added to the mixture and kept in dark at room temperature for 1.5 h. Absorbance of the solution was measured using UV visible spectrophotometer (Varian, Cary 50 Bio) at wavelength 765 nm (Liu et al. 2013). The TPC results were expressed as mg Gallic acid equivalents (GAE)/g sample.
Hardness
The Texture Analyzer (CT3, Brookfield Engineering Labs, Inc.) was used to analyze the hardness of mango leather (Phimpharian et al. 2011). Mango leather was folded 5 time for texture profile analysis using two compression cycles (Bourne 1978) as shown in Fig. 2. Texture Analyzer was set at: probe: TA44, pre-test speed: 5 mm s−1, test speed: 0.5 mm s−1, post-test speed: 0.5 mm s−1, target distance: 1 mm, where mango leather was compressed continuously two times up to the maximum force. The hardness of leather was recorded from the peak of first compression cycles.
Fig. 2.

Two-compression texture profile analysis of mango leather
Experimental design and statistical analysis
Response surface methodology (RSM) was performed for optimization of independent process parameters viz., drying temperature (°C) and pulp thickness (mm) using a commercial statistical package, Design-Expert version 7.0.0 (Stat-Ease, Inc.) (Toker et al. 2012; Shende and Sidhu 2016). The independent variables used in the RSM design in coded and uncoded form are listed in Table 1. The dependent responses were drying time (min), ascorbic acid (mg/100 g), TPC (mg GAE/g) and hardness (N). The experiments were initially designed according to the Central Composite face centred design, as presented in Table 2. Fully randomized order of experiments was carried out. The second order polynomial multiple regression equations were fitted with experimental data obtained as a function of independent variables.
| 1 |
The predicted response (Y) in Eq. 1 was correlated with the set of regression coefficients (b) such as intercept (b0) linear (bKI), interaction (bii) and quadratic (bij). Analysis of variance (ANOVA) determines the significance of model terms. The lack of fit and coefficient of determination ‘R2’ analyses were done to test the adequacy of the developed model. The optimization of multiple responses was performed with numerical optimization technique. All the independent process parameters were kept within range, while the responses were either minimized or maximized as per requirement. Numerical optimization generates desirability function for finding the optimum solution having some specific process parameters values. Experiments were carried out in triplicates and best results were fitted to RSM design.
Table 1.
Coded and actual experimental factors for refractance window drying of mango puree
| Factor | Name | Units | Coded factor | ||
|---|---|---|---|---|---|
| − 1 | 0 | + 1 | |||
| A | Drying temperature | °C | 85 | 90 | 95 |
| B | Puree thickness | mm | 2 | 3 | 4 |
Table 2.
Experimental design and responses for refractance window drying of mango puree
| Experiment no. | Drying temperature ( °C) | Puree thickness (mm) | Drying duration (min) | Ascorbic acid (mg/100 g) | Total phenolic content (mg GAE/g) | Hardness (N) |
|---|---|---|---|---|---|---|
| 1 | 85 | 2 | 34 | 58.36 | 4.87 | 5.14 |
| 6 | 85 | 3 | 42 | 58.45 | 5.28 | 5.33 |
| 4 | 85 | 4 | 65 | 56.80 | 5.31 | 5.26 |
| 10 | 90 | 2 | 28 | 59.17 | 6.27 | 5.03 |
| 3 | 90 | 3 | 34 | 60.24 | 6.86 | 4.82 |
| 7 | 90 | 3 | 35 | 60.50 | 6.61 | 4.94 |
| 8 | 90 | 3 | 36 | 60.26 | 6.85 | 4.85 |
| 11 | 90 | 3 | 34 | 58.93 | 6.63 | 4.73 |
| 12 | 90 | 3 | 36 | 59.67 | 6.81 | 4.81 |
| 9 | 90 | 4 | 50 | 58.40 | 6.55 | 4.67 |
| 5 | 95 | 2 | 20 | 62.20 | 7.49 | 4.71 |
| 2 | 95 | 3 | 27 | 61.88 | 7.85 | 4.56 |
| 13 | 95 | 4 | 40 | 61.45 | 7.45 | 3.62 |
Comparison of optimized results with commercial drying process
The RW drying optimized results were compared with tray drying (Recirculatory tray dryer) and oven drying (S D Instruments & Equipments, Kolkata) (Ochoa-Martínez et al. 2012; Tontul and Topuz 2017). Mango pulp of 2.50 mm thickness was dried at 95 °C drying temperature using three different drying processes. RW drying was employed as it was done earlier. For tray and oven drying, pulp was spread uniformly in petri dish (150 × 15 mm, Borosilicate) using spreader (made of Perspex glass) (Kaur et al. 2017). The petri dish was then kept in dryer to reach desirable moisture content. After desired drying, samples were kept in desiccator for cooling without gaining moisture in it. Then, leather was pulled from surface, wrapped in aluminium foil, packaged with LDPE zip lock pack and stored at ambient till analysis. The drying experiments were conducted in triplicate.
Different physico-chemical analyses were done on drying time, ascorbic acid, TPC, hardness, colour, water activity and micro-structure. Ascorbic acid, TPC and hardness analysis was done as described above; colour, water activity and micro-structure were estimated using standard procedure as follows:
Colour
The colour of mango pulp and leathers from different drying process was determined using Chromameter (CR-400, Konica Minolta Inc., Japan) (Shende et al. 2016). The colour parameters determined were lightness (L*), red-green (a*), yellow-blue (b*) and total colour difference (TCD) of mango leather compared with respect to mango pulp (Tontul and Topuz 2017).
Water activity
Water activity of mango pulp and leathers from different drying process was determined using digital water activity meter (CX-2 Aqua Lab) (Ochoa-Martínez et al. 2012; Kaur et al. 2017).
Microstructure of mango powder
Mango powder was prepared using three different drying process i.e. RW, tray and oven drying. Mango pulp was dried to obtain powder using up to < 5% (wb) moisture content. Mango powders (350–212 μm) from different drying process were spread in small quantity on aluminium stub and coated with gold using Sputter Coater of Gold–Palladium target (POLARON-SC7620, Carbon Accessory, Model-CA76, POLARON, UK) (Caparino et al. 2012). All powder samples were examined by Scanning Electron Microscopy using Scanning Electron Microscope (Carl ZEISS SMT, EVO 60, with Oxford EDS Detector, Germany) operated at an accelerating voltage of 20 kV. Micrographs were photographed at a magnification of 1.0 K X at scale bar of 20 μm.
Results and discussion
Langra mango variety pulping was done, 62.3% pulp was extracted from whole fruit. Pulp had moisture content 81.84 ± 0.13% wb, TSS 19 ± 0.05°Brix, ascorbic acid 94.55 ± 0.42 mg/100 g DW, TPC 10.75 ± 0.06 mg GAE/g DW. Refractance window drying process was used to dry pulp and effect of process parameters was determined by optimizing them.
Effect of process parameters on drying time
Initially the moisture content of mango pulp was 81.84% wb, when 2 mm thick pulp was dried at 95 °C it took 20 min to reach moisture content 17.2% wb. The effect of independent variables (drying temperature and pulp thickness) on drying time of mango leather is shown in Table 2 and Fig. 3a. It was observed that drying time increased with the increase of thickness (B) whereas it decreased with the increase in drying temperature (A) because water molecules travel reduced distance in thin samples in order to be get extracted (Maskan et al. 2002). The drying time increases more with the increase in thickness of sample (B) as it is directly proportional to the weight of dry solid (Geankoplis 1993). By increasing the drying temperature (A) the evaporation rate from the surface escalated and removal of water engaged in fruit molecules accelerated (Bahmani et al. 2016). Thus lowers the drying time by pacing up to reach the target moisture. RW Drying time of pulp was more influenced by thickness of the pulp (B) than by temperature of drying (A).
Fig. 3.

Response surface plot for the effect of process parameters on a drying time, b ascorbic acid, c total phenolics content and d texture hardness, of mango leather
The model terms were significant with higher model F value (129.70) and lower p (< 0.001). The experimental and theoretical results were in close agreement indicated by close proximity between R2 (0.9893) and adjusted R2 (0.9817) values. The significant model terms of drying time were A, B, AB and B2 at p < 0.05 as shown in Table 3. The drying time model regression equation showing the effect of process parameters is given below:
Table 3.
Analysis of variance for response surface quadratic model describing the effect of independent parameters on responses
| Source of variation | Drying time | Ascorbic acid | Total phenolic content | Hardness | ||||
|---|---|---|---|---|---|---|---|---|
| CP | F | CP | F | CP | F | CP | F | |
| Constant | + 34.83 | 129.70a | + 59.83 | 17.64a | + 6.74 | 176.91a | + 4.81 | 38.07a |
| A | − 9.00 | 213.82a | + 1.99 | 76.05a | + 1.22 | 823.84a | − 0.47 | 76.57a |
| B | + 12.17 | 390.75a | − 0.51 | 5.08c | + 0.11 | 7.09b | − 0.22 | 16.79a |
| AB | − 2.75 | 13.31a | + 0.20 | 0.53NS | − 0.12 | 5.30c | − 0.30 | 20.85a |
| A2 | + 0.10 | 0.013NS | + 0.57 | 2.88NS | − 0.16 | 6.46b | – | – |
| B2 | + 4.60 | 25.75a | − 0.81 | 5.82b | − 0.31 | 25.13a | – | – |
| Lack of fit | – | 3.97NS | – | 0.49NS | – | 0.37NS | – | 4.70NS |
| R2 | 0.9893 | 0.9265 | 0.9921 | 0.9507 | ||||
| Adj-R2 | 0.9817 | 0.8739 | 0.9865 | 0.9155 | ||||
CP coefficient of polynomial
NSNot significant (p ≥ 0.10), a(p ≤ 0.01), b(0.01 < p ≤ 0.05), c(0.05 < p ≤ 0.10)
Effect of process parameters on ascorbic acid
The ascorbic acid degradation occurs during drying due to thermal and aerobic oxidation (Ndawula et al. 2004). Ascorbic acid content of mango pulp was 94.55 mg/100 g DW. The effect of RW drying process parameters on ascorbic acid content of dried mango leather is shown in Table 2 and Fig. 3b. It can be observed from the figure that the increase in drying temperature (A) increases ascorbic acid retention which may be due to decreased exposure time of sample to heat resulting in reduced oxidation of the nutrient associated with increased drying temperature (Abonyi et al. 2002). Ascorbic acid retention was the highest for 3 mm thick pulp leather compared to 2 mm and 4 mm thick pulp leathers because 2 mm thick pulp got more surface area exposed to drying that facilitates oxidation of ascorbic acid (Nindo et al. 2003b; Sogi, Siddiq, & Dolan, 2015) and 4 mm pulp sample has more drying time means sample exposed to heat for longer duration. Slow drying of food product causes increased loss of ascorbic acid due to long duration oxidation of it (Jayaraman and Das Gupta 1995). Ascorbic acid content of pulp was more influenced by temperature of drying (A) than by thickness of the pulp (B).
The experimental and predicted results were in close agreement as proposed models R2 (0.9265) and adj R2 (0.8739) values were adjacent to each other. In this case the significant quadratic model terms were A, B, and B2 at p < 0.05 as shown in Table 3. The ascorbic acid model regression equation showing the effect of process parameters is shown below:
Effect of process parameters on total phenolics content
The total phenolics content (TPC) of Langra variety mango pulp was determined as 2.31 ± 0.03 mg GAE/g FW. TPC of mango pulp was found similar to previous studies (Liu et al. 2013). RW drying process parameters had significant effect on TPC of mango leather and it varied from 4.87 to 7.85 mg GAE/g DW as shown in Table 2 and Fig. 3c. Similar results for dried mango leather TPC were obtained by Sogi et al. (2015). It can be observed form Fig. 3c that with the increase in drying temperature (A) the TPC content of mango leather increases due to accelerated breakdown of cellular constituents and release of bound phenolic compounds. It can also be observed from Fig. 3c that 4 mm thick pulp retained more TPC than 2 mm thick pulp, may be due to 2 mm thick pulp undergoing greater oxidative and thermal degradations. Thicker samples (B) retain more TPC because during drying pulp is retained at elevated temperature for longer duration. That led to formation of Maillard reaction products, which might have caused new phenolic compounds to form from precursors during thermal treatments (Sultana et al. 2012). TPC of pulp was more influenced by temperature of drying (A) than by thickness of the pulp (B).
The proposed model R2 (0.9921) and adjusted R2 (0.9865) values were adjacent showing there was a close agreement between the experimental and predicted results. The significant quadratic model terms were A, B, AB, A2 and B2 at p < 0.05 as shown in Table 3. The TPC model regression equation showing the effect of process parameters is given below:
Effect of process parameters on hardness
The texture of mango leather was soft as that of leather and slightly sticky due to the presence of relatively high sugar content in mango. It can be observed from Table 2 and Fig. 3d that the texture hardness of mango leather varies from 3.62 to 5.33 N. Mango contains pectin and sugar that play important role in defining the final texture of dried leather (Dervisi et al. 2001). Hardness of mango leather decreases with the increase in drying temperature (A) because when pulp dries at elevated temperature for shorter duration molecules of pectin and sugar form gel which imparts it improved texture (Phimpharian et al. 2011). Pectin and sugar solution when exposed to higher temperature for longer duration of time, a firm gel structure forms leading to tough texture (Dervisi et al. 2001; Gujral and Brar 2003). There was no significant individual effect of thickness of pulp (B) on the hardness of mango leather. However, the combined effects of temperature and thickness can be observed from Fig. 3d. At 4 mm thickness and 95 °C drying temperature, the hardness of leather was the lowest i.e. 3.62 N. Hardness of dried sample was more influenced by temperature of drying (A) than by thickness of the pulp (B).
The proposed 2FI model R2 (0.9507) and adjusted R2 (0.9155) values were adjacent showing there was a close agreement between the experimental and predicted results. The 2FI model terms A, B and AB were significant at p < 0.05 as shown in Table 3. The hardness model regression equation showing the effect of process parameters is given below:
Optimization of process parameters
Numerical optimization of Refractance window drying process parameters was done using RSM to determine the best optimized solution. Independent variables were set in range while drying time was minimized; ascorbic acid and TPC were maximized and hardness of mango leather was kept in range. Eight number of solution were generated with desirability as 0.969. The best optimized solution for RW drying of mango pulp was drying temperature 95 °C and pulp thickness 2.49 mm. The predicted values of responses such as ascorbic acid, TPC and hardness were 22.31 min, 62.33 mg/100 g DW, 7.72 mg GAE/g DW and 4.60 N respectively.
Comparison of optimized results with commercial drying processes
Mango leather was prepared using three different drying processes i.e. RW, tray and oven for 2.5 mm thick mango pulp at 95 °C. Drying of mango pulp was done until moisture content reached 17–20% (wb) in each drying process. It can be observed from Table 4 that RW drying took only 34.67 ± 0.57 min to dry 2.50 mm thick mango pulp whereas tray and oven drying took 258.33 ± 10.41 and 441.67 ± 7.64 min, respectively.
Table 4.
Physico-chemical properties of mango pulp and leather
| Properties | Mango pulp | Mango leather | |||
|---|---|---|---|---|---|
| RW drying | Tray drying | Oven drying | |||
| Moisture content (% wb) | 81.84 ± 0.52 | 17.43 ± 0.05 | 18.58 ± 0.06 | 18.85 ± 0.06 | |
| Drying time (min) | – | 34.67 ± 0.57 | 258.33 ± 10.41 | 441.67 ± 7.64 | |
| Ascorbic acid (mg/100 g DW) | 94.55 ± 0.42 | 62.66 ± 0.61 | 32.93 ± 0.58 | 28.43 ± 0.25 | |
| TPC (mg GAE/g db) | 10.75 ± 0.06 | 7.73 ± 0.07 | 4.50 ± 0.11 | 3.95 ± 0.06 | |
| Hardness (N) | – | 5.49 ± 0.02 | 9.54 ± 0.04 | 8.82 ± 0.02 | |
| Colour | L | 73.13 ± 0.13 | 69.74 ± 0.09 | 55.56 ± 0.11 | 43.58 ± 0.12 |
| a* | 7.11 ± 0.03 | 10.86 ± 0.02 | 14.72 ± 0.02 | 14.08 ± 0.05 | |
| b* | 76.15 ± 0.22 | 58.64 ± 0.14 | 41.86 ± 0.27 | 21.08 ± 0.23 | |
| ΔE | – | 18.22 | 39.27 | 62.88 | |
| Water activity | 0.999 ± 0.00 | 0.572 ± 0.00 | 0.620 ± 0.01 | 0.634 ± 0.00 | |
The decline in ascorbic acid content of mango pulp to mango leather because of drying was in close agreement with previous studies (Ndawula et al. 2004; Sogi et al. 2015). Ascorbic acid content of mango pulp was 94.55 mg/100 g DW, which reduced to 62.66 mg/100 g DW for RW drying, 32.93 mg/100 g DW for tray drying and 28.43 mg/100 g DW for oven drying. This degradation occurs because of oxidation of ascorbic acid due to heat treatment during drying (Nindo et al. 2003b; Sogi et al. 2015). The TPC of mango leather affected by drying method, ranged from 3.95 to 10.75 mg GAE/g DW as shown in Table 4. The highest retention of TPC was observed in RW drying compared to tray and oven drying, which might be due to the effect of infrared heat during RW drying (Nindo et al. 2003a). Infrared heat stimulates phenolic precursors non-enzymatic conversion to new phenolic compounds. The lower TPC of traditionally or conventionally dried mango leather may be due to heat induced degradation and oxidation of phenolics during drying process (Tontul and Topuz 2017).
It can be observed form Table 4 that drying time and hardness of mango leather are directly correlated. RW drying has the lowest drying time and lowest hardness of the leather i.e. 5.49 N. However, leathers prepared from conventional methods of drying exhibit greater hardness than products obtained from RW drying process, possibly due to prolonged drying durations in traditional methods resulting in firmer gel structure of pectin and sugar present in mango (Dervisi et al. 2001; Gujral and Brar 2003). In traditional drying methods involvement of stronger heat treatment causes more formation of non-enzymatic reactions products (Tontul and Topuz 2017). Prolonged exposure of product to severe heat treatment causes sugar caramelization, non-enzymatic browning reactions, which bring forth the colour of the final product (Suna et al. 2014; Tontul and Topuz 2017). RW dried leather has higher value of L* and b* showing colour of leather is more vivid and yellow, but lower value of a* shows less intense red colour (Abonyi et al. 2002). The conventionally dried mango leathers have lower values of L*, b* and higher values of a* and TCD or ΔE compared to RW dried leather showing that traditional or conventional drying methods produce darker colored leather having less yellow and more red (Abonyi et al. 2002; Jafari et al. 2016). However, the water activity of mango leather produced from conventional processes were significantly higher due to difference in water holding capacity of product, created by different heat treatments (Pavan et al. 2012; Tontul and Topuz 2017).
Microstructure of mango powder
Mango powders (350–212 μm) obtained from three different drying process were studied for microstructure using scanning electron micrography (SEM) as shown in Fig. 4. The microstructure of RW-dried mango powder was observed as smooth and flaky with uniform thickness as shown in Fig. 4a. Uniform spreading of mango puree in the form of thin sheet before drying and thinly spread mango puree is undisturbed on the surface of the plastic film conveyor (Mylar sheet), except during moisture evaporation result into uniformity of the RW-dried flakes thickness (Caparino et al. 2012; Celli et al. 2016). Powder particles were irregularly shaped, mostly sharp edges and maintaining its thickness after grinding and crushing of RW-dried mango flakes, indicative of more flowability and less susceptibility to oxidation because of lesser surface area (Caparino et al. 2012) as shown in Fig. 4a.
Fig. 4.

SEM images of mango powder a RW dried, b tray dried and c oven dried
The microstructure of tray dried or hot air dried mango powder shows powder particles were irregularly shaped, rounded or irregularly shaped edges and thickness of flakes were not maintained after drying as shown in Fig. 4b. This result may happens due to uneven shrinkage of puree, bubble formation and collapse of the structure while escape or evaporation of moisture from surface of drying sheet in convective drying process inside tray dryer resulting in an insignificant change in volume (Ratti 2001). Oven dried mango powder was observed to have more corrugation and crinkle on particles surface as shown in Fig. 4c. Powder particles try to stick and was more hygroscopic compared to RW and tray dried mango powder particles. This may be due to uneven drying temperature distribution which results in irregular shape, uneven shrinkage and corrugation on the surface of dried powder particle. Similar results were observed for drum dried mango powder by Caparino et al. (2012). Hu et al. (2017) reported similar results of microstructure of polysaccharides from Crassostrea gigas using electric heating air-blowing drier at 100 °C for 12 h. They elucidated that convective drying process result in irregular shape and rough surface of polysaccharides particles which indicate lesser antioxidative and bioactive activity because of greater surface area.
Conclusion
Refractance window drying is a novel drying technique developed for drying of food pulp and purees to retain nutritional quality of food at lower energy cost. It is a thin film drying system and mainly depends upon the sample thickness and drying temperature. Optimization of RW drying process parameters was successfully done by using response surface methodology (RSM). Thirteen experiments were conducted in triplicates to obtain optimum drying conditions of 95 °C drying temperature and 2.49 mm pulp thickness with desirability function as 0.969. Results showed that 2.49 mm thick pulp take only 22.31 min drying time giving good retention in ascorbic acid and TPC as 62.33 mg/100 g DW and 7.72 mg GAE/g DW respectively. The comparison of RW drying was done with traditional or conventional methods such as tray and oven drying at 95 °C drying temperature and 2.5 mm mango pulp thickness. This resulted in RW drying taking much shorter duration and mango leather, so obtained, was of better quality and retained greater levels of nutrients, compared to conventional drying. SEM microstructure analysis of mango powder shows RW drying produce powder particles of irregular shape, smooth surface with uniform thickness. Whereas tray and oven drying produce mango powder particles of corrugated, irregular and crinkled surface with uneven shape and thickness.
Acknowledgements
The authors thank All India Coordinated Research Projects on post harvest technology (AICRP on PHET) (Grant No. Plan period XII), Indian Council of Agricultural Research (ICAR), India for financial assistance.
Compliance with ethical standards
Conflict of interest
All the authors declare that they have no conflict of interest.
Footnotes
Publisher's Note
Springer Nature remains neutral with regard to jurisdictional claims in published maps and institutional affiliations.
References
- Abonyi BI, Feng H, Tang J, et al. Quality retention in strawberry and carrot purees dried with refractance window (TM) system. J Food Sci. 2002;67:1051–1056. doi: 10.1111/j.1365-2621.2002.tb09452.x. [DOI] [Google Scholar]
- Anonymous (2017) Horticultural Statistics at a Glance 2017. Government of India
- Bahmani A, Jafari SM, Shahidi S-A, Dehnad D. Mass transfer Kinetics of eggplant during osmotic dehydration by neural networks. J Food Process Preserv. 2016;40:815–827. doi: 10.1111/jfpp.12435. [DOI] [Google Scholar]
- Bourne MC. Texture profile analysis. Food Technol. 1978;32:62–66. [Google Scholar]
- Caparino OA, Tang J, Nindo CI, et al. Effect of drying methods on the physical properties and microstructures of mango (Philippine “Carabao” var.) powder. J Food Eng. 2012;111:135–148. doi: 10.1016/j.jfoodeng.2012.01.010. [DOI] [Google Scholar]
- Celli GB, Khattab R, Ghanem A, Brooks MS. Refractance window TM drying of haskap berry—Preliminary results on anthocyanin retention and physicochemical properties. Food Chem. 2016;194:218–221. doi: 10.1016/j.foodchem.2015.08.012. [DOI] [PubMed] [Google Scholar]
- Dervisi P, Lamb J, Zabetakis I. High pressure processing in jam manufacture: effects on textural and colour properties. Food Chem. 2001;73:85–91. doi: 10.1016/S0308-8146(00)00289-2. [DOI] [Google Scholar]
- Fssai (2015) Manual of methods of analysis of foods fruit and vegetable producTS. New Delhi
- Geankoplis CJ. Transport processes and unit operations. 3. Upper Saddle River: Prentice-Hall International Inc; 1993. [Google Scholar]
- Gujral HS, Brar SS. Effect of hydrocolloids on the dehydration kinetics, color, and texture of mango leather. Int J Food Prop. 2003;6:269–279. doi: 10.1081/JFP-120017846. [DOI] [Google Scholar]
- Hu S, Zhao G, Zheng Y, et al. Effect of drying procedures on the physicochemical properties and antioxidant activities of polysaccharides from Crassostrea gigas. PLoS ONE. 2017;12:1–13. doi: 10.1371/journal.pone.0188536. [DOI] [PMC free article] [PubMed] [Google Scholar]
- Jafari SM, Azizi D, Mirzaei H, Dehnad D. Comparing quality characteristics of oven-dried and refractance window-dried kiwifruits. J Food Process Preserv. 2016;40:362–372. doi: 10.1111/jfpp.12613. [DOI] [Google Scholar]
- Jayaraman KS, Das Gupta DK. Drying of fruits and vegetables. In: Majumdar AS, editor. Handbook of industrial drying, Fourth. New York: Marcel Dekker Inc; 1995. p. 669. [Google Scholar]
- Kaur G, Saha S, Kumari K, Datta AK. Mango pulp drying by refractance window method. Agric Eng Int CIGR J. 2017;19:145–151. [Google Scholar]
- Kumar DGP, Hebbar HU, Ramesh MN. Suitability of thin layer models for infrared-hot air-drying of onion slices. LWT—Food Sci Technol. 2006;39:700–705. doi: 10.1016/j.lwt.2005.03.021. [DOI] [Google Scholar]
- Liu F-X, Fu S-F, Bi X-F, et al. Physico-chemical and antioxidant properties of four mango (Mangifera indica L.) cultivars in China. Food Chem. 2013;138:396–405. doi: 10.1016/j.foodchem.2012.09.111. [DOI] [PubMed] [Google Scholar]
- Maskan A, Kaya S, Maskan M. Hot air and sun drying of grape leather (pestil) J Food Eng. 2002;54:81–88. doi: 10.1016/S0260-8774(01)00188-1. [DOI] [Google Scholar]
- Ndawula J, Kabasa JD, Byaruhanga YB. Alterations in fruit and vegetable beta-carotene and vitamin C content caused by open-sun drying, visqueen-covered and polyethylene-covered solar-dryers. Afr Health Sci. 2004;4:125–130. [PMC free article] [PubMed] [Google Scholar]
- Nindo CI, Tang J. Refractance window dehydration technology: a novel contact drying method. Dry Technol. 2007;25:37–48. doi: 10.1080/07373930601152673. [DOI] [Google Scholar]
- Nindo CI, Feng H, Shen GQ, et al. Energy utilization and microbial reduction in a new film drying system. J Food Process Preserv. 2003;27:117–136. doi: 10.1111/j.1745-4549.2003.tb00506.x. [DOI] [Google Scholar]
- Nindo CI, Sun T, Wang SW, et al. Evaluation of drying technologies for retention of physical quality and antioxidants in asparagus (Asparagus officinalis, L.) LWT—Food Sci Technol. 2003;36:507–516. doi: 10.1016/S0023-6438(03)00046-X. [DOI] [Google Scholar]
- Ochoa-Martínez CI, Quintero PT, Ayala AA, Ortiz MJ. Drying characteristics of mango slices using the refractance window™ technique. J Food Eng. 2012;109:69–75. doi: 10.1016/j.jfoodeng.2011.09.032. [DOI] [Google Scholar]
- Pavan MA, Schmidt SJ, Feng H. Water sorption behavior and thermal analysis of freeze-dried, refractance window-dried and hot-air dried acai (Euterpe oleracea Martius) juice. LWT—Food Sci Technol. 2012;48:75–81. doi: 10.1016/j.lwt.2012.02.024. [DOI] [Google Scholar]
- Phimpharian C, Jangchud A, Jangchud K, et al. Physicochemical characteristics and sensory optimisation of pineapple leather snack as affected by glucose syrup and pectin concentrations. Int J Food Sci Technol. 2011;46:972–981. doi: 10.1111/j.1365-2621.2011.02579.x. [DOI] [Google Scholar]
- Pua CK, Hamid NSA, Tan CP, et al. Optimization of drum drying processing parameters for production of jackfruit (Artocarpus heterophyllus) powder using response surface methodology. LWT—Food Sci Technol. 2010;43:343–349. doi: 10.1016/j.lwt.2009.08.011. [DOI] [Google Scholar]
- Raghavi LM, Moses JA, Anandharamakrishnan C. Refractance window drying of foods_ A review. J Food Eng. 2018;222:267–275. doi: 10.1016/j.jfoodeng.2017.11.032. [DOI] [Google Scholar]
- Ratti C. Hot air and freeze-drying of high-value foods: a review. J Food Eng. 2001;49:311–319. doi: 10.1016/S0260-8774(00)00228-4. [DOI] [Google Scholar]
- Shende D, Sidhu GK. Response surface methodology to optimize enzyme-assisted aqueous extraction of maize germ oil. J Food Sci Technol. 2016 doi: 10.1007/s13197-016-2303-z. [DOI] [PMC free article] [PubMed] [Google Scholar]
- Shende D, Shrivastav A, Datta AK (2016) Effects of thickness of mango puree on refractance window drying to make mango leather. In: Emerging technologies in agricultural and food engineering (ETAE-2016). Excel India Publisher, New Delhi, India, IIT Kharagpur, pp 170–177
- Sogi DS, Siddiq M, Dolan KD. Total phenolics, carotenoids and antioxidant properties of Tommy Atkin mango cubes as affected by drying techniques. LWT—Food Sci Technol. 2015;62:564–568. doi: 10.1016/j.lwt.2014.04.015. [DOI] [Google Scholar]
- Sultana B, Anwar F, Ashraf M, Saari N. Effect of drying techniques on the total phenolic contents and antioxidant activity of selected fruits. J Med Plants Res. 2012;6:161–167. doi: 10.5897/JMPR11.916. [DOI] [Google Scholar]
- Suna S, Tamer CE, Incedayi B, et al. Impact of drying methods on physicochemical and sensory properties of apricot pestil. Indian J Tradit Knowl. 2014;13:47–55. [Google Scholar]
- Toker ÖS, Yilmaz MT, Karaman S, Mahmut D. “Optimization of edible oil extraction from ofada rice bran using response surface methodology” by Akinoso, R. & Adeyanju, J.A. Food and Bioprocess Food Bioprocess Technol. 2012;5:2630–2631. doi: 10.1007/s11947-012-0908-4. [DOI] [Google Scholar]
- Tontul I, Topuz A. Effects of different drying methods on the physicochemical properties of pomegranate leather (pestil) LWT—Food Sci Technol. 2017;80:294–303. doi: 10.1016/j.lwt.2017.02.035. [DOI] [Google Scholar]
- Zotarelli MF, Augusto B, Carcio M, Laurindo JB. Effect of process variables on the drying rate of mango pulp by refractance window. Food Res Int. 2015;69:410–417. doi: 10.1016/j.foodres.2015.01.013. [DOI] [Google Scholar]