

Abstract
The aim of this work was to characterize goat milk chocolates with different concentrations of cocoa (35%, 45%, 55% and 65%) and apply correlations between sensory features and analytical measures. The chocolates were evaluated through moisture, ashes, fat content, protein, acidity, pH, water activity, texture, instrumental color and sensory profile. The correlations showed that the brown color can be represented by the chromaticity coordinates a* and b* and the flavor attributes (sweet taste and bitter taste), by the ashes analysis, fat content and pH. Canonic scores superior to 0.5 indicate chocolates with better acceptance.
Keywords: Chemometry, Chocolate, Cocoa, Goat, Milk
Introduction
The chocolate is appreciated by individuals of many classes and ages and characterize itself by technologic, sensory and nutritional particularities (Aidoo et al. 2014). The goat milk chocolate development poses an alternative for the food industry and increase the goat milk consumption by the population, benefiting producers, amplifying this market niche and adding value to the milk.
The quality and acceptance of the food depends on the presentation, aroma, taste and texture (Lawless and Heymann 2010). The texture is an important attribute in chocolates, defined as the sensory and functional manifestation of the structural, mechanical and superficial properties, detected by vision, hearing, touch and palate (Szczesniak 2002). Along with the color, it is one of the main attributes used by the consumers to assess the quality of the chocolate (Afoakwa et al. 2009).
The investigation of the chemical composition and the physicochemical features prove the general quality aspects of the products, since the feedstock and ingredients used, associated with the processing conditions, influence in the final product composition parameters (Afoakwa et al. 2009).
Financial factors, extensive training phases and time demand associated to the sensory analysis are limiting for its use by the industry (Silva et al. 2013). However, some attributes are more precisely assessed by sensory techniques that use trained panels (Richter et al. 2010). In this context, correlations between sensory and analytical measures are necessary (Lawless and Heymann 2010).
Multivariate statistical analysis, can be defined as the application of statistical and mathematic methods to plan experiments in an optimized way, to retrieve the maximum of information from the data analysis (Massart et al. 1998). Principal component analysis (PCA) consists in transforming big data matrices in smaller matrices, making it easier to interpret. Canonic correlations examine the relations of two groups of variables, measuring the existence and intensity of association between the groups (Morrison 1978; Mingoti 2005; Ferreira 2011).
It was aimed to develop and characterize goat milk chocolates with different concentrations of cocoa, using correlations to identify the existent relations between sensory attributes and analytical measures.
Materials and methods
Chocolate production
The goat milk chocolate were produced in the factory of the Comissão Executiva do Plano da Lavoura Cacaueira (CEPLAC). The processing started with the weighting of cocoa almonds, which were toasted at 120 °C in circular toaster (JAF Inox Industries from Chocolate Machines Ltd., Tambaú, SP, Brazil). After that, they were peeled, removing peels and germen, originating the coca nibs, which were crushed in knife mill (JAF Inox Industries from Chocolate Machines Ltd., Tambaú, SP, Brazil) to obtain the liquor. The ingredients for each formulation (Table 1) were transferred to an equipment of multifunction UL-20 (Lloveras, Terrassa, Barcelona, Spain), that performed the ingredient mixture, refining and scalloping of the mass.
Table 1.
Formulations of the goat milk chocolates
| Formulations | Ingredients | ||||
|---|---|---|---|---|---|
| Cocoa mass (%) | Goat milk powder (%) | Refined sugar (%) | Cocoa butter (%) | Soybean lecithin (%) | |
| 35% | 35 | 7 | 51 | 6.6 | 0.4 |
| 45% | 45 | 7 | 41 | 6.6 | 0.4 |
| 55% | 55 | 7 | 31 | 6.6 | 0.4 |
| 65% | 65 | 7 | 21 | 6.6 | 0.4 |
Formulations expressed in % of cocoa mass. % expressed in mass/mass (m/m)
The milk powder content of all formulations was set at 7% because it was considered suitable for milk formulations, noting that the ratio (mass/mass) was changing according to the variation of the cocoa mass concentration.
The mass was refined to obtain granulometry inferior to 20 µm, verified using digital micrometer (Mitutoyo, Suzano, SP, Brazil). For the scalloping operation, the cocoa butter and lecithin of each formulation in the beginning of the process, which lasted 24 h at the temperature of 60 °C, were added. The mass was conducted for the tempering process, in tempering machine (JAF Inox Industries from Chocolate Machines Ltd., Tambaú, SP, Brazil), where the mass was subjected to a temperature of 45 °C, followed by cooling at 28 °C. The obtained mass was transferred to acrylic molds for chocolate and placed on vibrating table ZDT-02 (Food Machinery Service Co. Ltd, Nanquim, Jiangsu, China). The molds were placed in cooling tunnel (Hebleimar, Piracicaba, SP, Brazil) at 5 °C, followed by the stages of wrapping in lead paper packaging (Cromus Embalagens Ind. e Com. Ltd., Mauá, SP, Brazil) and refrigerated storage (4 °C).
Microbiologic analysis
The produced chocolate were analyzed for the presence of total coliforms, thermo tolerant coliforms and Salmonella sp, according to FDA (2005), fulfilling the demands of Brazil (2001).
Analytic measures
The color of the chocolates were determined in the system L*, a*, b*, in colorimeter Colorquest XE (HunterLab, Sunset Hills Reston, VA, USA), using the CIELAB system (CIE 2004), previously calibrated in a black and white surface, where L* represents the luminosity (L* = 0 − black e L* = 100 − white) and a* and b* the color coordinates responsible for the chromaticity (+ a* = red and − a* = green, + b* = yellow and − b* = blue).
The instrumental texture analysis were conducted in texture analyzer TA.HD Plus (Stable Micro Systems, Godalming, Surrey, UK), according to methodology described by Bourne (2002). The mechanical test made was a simple cut using the probe Extended Craft Knife A/ECB (Stable Micro Systems, Godalming, Surrey, UK), deformation rate of 2 mm/s, compression distance of 5 mm and trigger of 0.09 N.
For chemical composition and physicochemical characterization of the chocolates, the contents of water, ashes, fat, protein, and values for titratable acidity, pH and water activity, according to IAL (2008), were determined.
Descriptive sensory profile
The study was approved by the Ethics in Researches Committee of UESB, Presentation Certificate for Ethic Appreciation (CAAE): 24674513.3.0000.0055.
The Descriptive Sensory Profile is able to evaluate the attributes of food and its intensities, in which the trained judges describe the properties of the product under study (Lawless and Heymann 2010). The method used for the profile characterization of the sensory profile was an adaptation of the Quantitative Descriptive Analysis (QDA) proposed by Stone et al. (1974). The survey of the descriptive terms of the chocolates was made using the methodology described in Moskowitz (1983), in which the judges listed similarities and differences related to the appearance, aroma, flavor and texture of goat milk chocolates presented in sorted pairs (session 1: formulations 35% and 65%; session 2: formulations 45% and 55%; session 3: formulations 45% and 65%). All the judges assessed the descriptive terms and in open discussion defined the reference materials (weak or absent/strong). The attributes that described the chocolates were: (a) appearance: brightness and brown color; (b) aroma: cocoa butter aroma and chocolate aroma; (c) texture: hardness and melting; (d) flavor: sweet taste, acid taste, residual goat milk taste, bitter taste and chocolate taste.
After the definition of the sensory attributes, reference materials and QDA file elaboration (Table 2) the training was made (six sessions), in which were presented the reference materials that anchored the extremes of the intensity scale of the evaluation file of each attribute. The selection of the ten final judges was made based on their power of discrimination and repeatability using one-way analysis of variance (ANOVA) with two sources of variation (sample and repetition) by attribute for each judge. Three formulations (35%, 45% and 55%) of goat milk chocolate were served three consecutive times (three repetitions), in a monadic way, in individual cabins. The judges assessed the chocolates using the QDA file. Those who presented probability Fsample ≤ 0.50 and probability Frepetition > 0.05 in all attributes were selected.
Table 2.
Sensory attributes, definitions and standards
| Attributes | Definitions | Reference material |
|---|---|---|
| Appearance | ||
| Brightness | Capacity of the sample to reflect light |
Weak: Formulation 35% opaque Strong: Formulation 35% smeared with oil |
| Brown color | Brown color, specific of the chocolate/Intensity of the brown color |
Weak: Hershey’s® extra cream Strong: Lacta Amaro® 43% cocoa |
| Aroma | ||
| Cocoa butter aroma | Characteristic aroma of the pure fat extracted from the cocoa |
Weak: Cocoa powder Mavalério® (Gourmet Line) Strong: Peeled and crushed cocoa (cocoa nibs) |
| Chocolate aroma | Characteristic aroma of chocolate |
Absent Strong: Cocoa butter |
| Texture | ||
| Hardness | Necessary strength to break the food with the incisive tooth |
Weak: Nestlé Classic® milk Strong: Lacta Amaro® 43% cocoa |
| Melting | Capability of melting inside the mouth |
Weak: Hershey’s® 70% Strong: Formulation 45% |
| Flavor | ||
| Sweet taste | Sensation of the basic taste of sucrose |
Weak: Sucrose solution 1.5% Strong: Sucrose solution 7.5% |
| Acid taste | Sensation of the taste of a solution of acetic acid |
Weak: Pure water Strong: Alcohol vinegar solution 1.5% |
| Residual goat milk taste | Characteristic taste of goat milk in dairy products |
Weak: Goat milk powder solution (Caprilat®) 2.5% Strong: Goat milk powder solution (Caprilat®) 10% |
| Bitter taste | Characteristic bitter taste of the cocoa nibs, with permanence in the mouth after deglutition |
Weak: Lacta Amaro® 43% cocoa Strong: Cocoa nibs |
| Chocolate taste | Characteristic flavor of chocolate |
Weak: Hershey’s® extra cream Strong: Formulation of dark chocolate 56.6% |
In the final assessment, the ten trained and previously selected judges evaluated (4 repetitions), the four formulations, quantifying the intensity perceived of each attribute in non-structured scale of 9 cm.
The results were analyzed through ANOVA with two sources of variation (sample and judge) and interaction sample*judge. The test was performed again for treatments, using the medium square of the interaction sample*judge as denominator (F versus interaction), proposed by Stone et al. (1974).
For acceptance, the judges assessed the attributes of presentation, aroma, texture, flavor and global impression (GI) (Chaves and Sproesser 2005).
Statistical analysis
For the analytic measures, the experiment was conducted in Completely Randomized Design (CRD) with four treatments. The results were submitted to regression analysis in function of the treatments at 5% of significance. The mathematical models were chosen according to the significant effects of the proposed model (p ≤ 0.05), lack of non-significant adjustment (p > 0.05) and determination coefficients (R2) in relation to the SQTREAT.
For the sensory tests, the experiment was conducted in randomized design in blocks (RDB), where the results of the QDA (complete scores) were submitted to ANOVA and regression analysis in four repetitions for judge. The data set of the QDA was disposed in a matrix of m lines (samples by treatments) and n columns (sensory attributes), in which the multivariate technique of PCA (Jolliffe 1972; Ferreira 2011) was applied. The test of acceptance was characterized in 120 an experimental unit (blocks) in which regression analysis to the answer variables in function of the treatments at 5% of significance was applied.
The correlation between the QDA sensory and analytic measures was applied, using PCA and Pearsin linear correlation coefficient (Steel et al. 1997).
For the canonic relations, the QDA sensory attributes formed the first set of letters (X), while the analytic measures the second group (Y). Both groups (X and Y) were used to perform the canonic relations analysis; however two dispersion measures were made (standard deviation and variation coefficient). After that, the data standardization (mean value = 0 and standard deviation = 1). A linear combination was developed in each of the pair of canonic variables (letters), so the correlation between them was maximized (Eq. 1).
| 1 |
The Corr (X, Y) (Eq. 2) must be maximized, expressing the maximum association between the linear functions of the variable groups (Johnson and Wichern 1999).
| 2 |
After obtaining the canonic correlations, the F statistical test was performed with nullity hypothesis (H0) confirming that there are no correlations between the data sets (p > 0.05). The canonic weights (association between each original variable and its canonic variable) were obtained through structural correlations.
Results and discussion
Microbiological analysis
The microbiological analysis for the chocolates of every formulation answered to the actual legal standards, according to the resolution RDC nº 12 (Brazil 2001), that establishes maximum values of 10 MPN/g for thermo tolerant coliforms and absence of Salmonella sp in 25 g of the product.
Analytic measures
Lower pH values and, subsequently higher values for acidity (Tables 3, 4), represent higher content of organic acids, especially acetic, originated from errors in the stage of cocoa almonds fermentation, affecting negatively the flavor of the chocolate (Efraim et al. 2010).
Table 3.
Chemical composition and physical–chemical characteristics of the main ingredients used in the formulations of chocolates
| Variables** | Ingredientsa | |
|---|---|---|
| Cocoa mass | Goat milk powder | |
| pH | 4.88 ± 0.008 | 6.38 ± 0.007 |
| Titratable total acidity | 8.46 ± 0.20b | 16.22 ± 0.19c |
| Water activity | 0.64 ± 0.004 | 0.28 ± 0.009 |
| L* | 46.29 ± 2.43 | 91.70 ± 7.48 |
| a* | 8.69 ± 0.45 | − 2.61 ± 0.29 |
| b* | 14.00 ± 0.82 | 14.91 ± 1.60 |
| Moisture (%) | 3.15 ± 0.001 | 3.48 ± 0.005 |
| Ashes (%) | 2.94 ± 0.003 | 6.69 ± 0.005 |
| Fat (%) | 53.14 ± 1.23 | 29.88 ± 0.18 |
| Proteins (%) | 15.59 ± 0.036 | 24.21 ± 0.002 |
aAverage values ± standard deviation of chemical composition and physicochemical characterization. **Number of replications: 3
bMilliequivalent solution of NaOH (0.1 N) by 100 g of product
c% of lactic acid. L* = luminosity parameter/a* and b* = chromaticity coordinates
Table 4.
Statistical model of the effect of the cocoa mass in the analytic measures and sensory attributes of the goat milk chocolates
| Variables** | Equations | R2 |
|---|---|---|
| pH | 0.91 | |
| Titratable total acidity (meq NaOH 100 g−1)a | 0.92 | |
| Water activity | *** | |
| L* | 0.77 | |
| a* | 0.97 | |
| b* | 0.92 | |
| Hardness | *** | |
| Moisture (%) | 0.80 | |
| Ashes (%) | 0.99 | |
| Fat (%) | 0.89 | |
| Proteins (%) | 0.99 | |
| Attributes | ||
| Brightness | 0.92 | |
| Brown color | 0.95 | |
| Hardness | 0.92 | |
| Melting | 0.82 | |
| Acid taste | 0.93 | |
| Goat milk taste | 0.93 |
**Number of replications: 3.
aMilliequivalent solution of NaOH (0.1 N) by 100 g of product. L* = luminosity parameter/a* and b* = chromaticity coordinates. = answer variable. x = values obtained from the analytic measures and sensory attributes for the generation of the answer variable. = mean value of the respective analytic measure. *** Adjusting regression equations of linear or quadratic models was not possible (p > 0.05). R2 = determination coefficients
The L* parameter refers to the sample’s capacity of reflection or transmission of light, ranging in a scale from 0 (black) to 100 (white). With smaller values for L*, the samples are darker (Afoakwa et al. 2008a, b). The formulation containing 35% of cocoa mass presented the highest luminosity component, therefore lighter coloration.
For the chromaticity coordinates a* and b*, the chocolates presented colorations in the regions of red and green, due to the positive values of these coordinates. The chromaticity coordinate a* displays the coloration in the interval from the green (a* < 0) to the red (a* > 0), while b* from blue (b* < 0) to yellow (b* > 0). With the increase of cocoa mass in the chocolates, a reduction in the values of a* and b* was observed, causing a decrease in the intensity of the brown color. The combination of the positive coordinates of a* and b* results in the brown color, the characteristic color of chocolates.
The cocoa content increase on the chocolates caused a decrease in the sugar percentage, which lead to smaller interaction with water molecules. High levels of moisture, such as in formulations with more cocoa content, may aggregate sugar particles, increasing the sandiness and viscosity of the samples (Afoakwa et al. 2007), influencing the sensory characteristics in distinct ways.
Descriptive sensory profile
The QDA results displayed that with two sources of variation (sample and judge/sample*judge interaction), all the assessed attributes showed significant effects (p ≤ 0.05) of the sample*judge interaction. Thus, the test for treatments effect was performed again, using the mean square of the sample*judge interaction as denominator (F versus interaction) (Stone et al. 1974).
To verify the effect of the cocoa content in the sensory attributes, the mathematic models were tested (Table 4). The attributes cocoa butter aroma, chocolate aroma, sweet taste, bitter taste and chocolate taste presented lack of significant adjust (p ≤ 0.05) and/or non-significant mathematic model (p > 0.05). Brightness and brown color displayed linear increase effect with the increase of cocoa mass in the formulations of the chocolates, this result is compatible to what happened in the color instrumental analysis, where the L* luminosity index decreases in a linear way with the increase of cocoa mass, meaning that the samples got darker, also the a* and b* positive chromaticity coordinates, representing the brown color.
The sensory attribute of hardness presented linear increase in function of the increase of cocoa’s mass in the formulations of the chocolates. Formulations with higher concentration of cocoa presented structures strongly bonded, hard to be broken when chewing. This may be explained due to the aggregation of more particles present in the samples with higher cocoa content (Do et al. 2007).
PCA was performed to verify the correlation between the treatments and the sensory attributes (Fig. 1), in which the principal component 1 (PC1) explained 97.76% of the total variance, being enough to discriminate (Larrigaudiere et al. 2004) the chocolates in relation to their sensory attributes, for the most relevant information of the data from the original samples are contained in this PC, that presented positive correlation with brightness, chocolate aroma, brown color, hardness, acid taste, bitter taste and chocolate taste.
Fig. 1.

a Graphic representation of the principal components analysis (PCA) of samples (complete scores). b Graphic representation of the PCA of samples (QDA means) and sensory attributes
In the spatial separation of the chocolates, in relation to the PC1, the presence of three groups was observed: the first was formed by the formulations of 35% and 45%, the second by 55% and the last by 65%, with tendency of separation as the increase of cocoa content in the formulations occurred.
The treatment with 65% of cocoa mass showed distinct characteristics when compared to the others, with high scores of brightness, brown color, chocolate aroma, hardness, acid taste, bitter taste and chocolate taste, being compatible with what was expected from this formulation.
The Pearson’s correlation analysis (Table 5) confirmed that the sensory attributes of presentation of the chocolates displayed high correlations (p ≤ 0.05) with the analytic measures, with the exception of the instrumental texture (hardness) (p > 0.05). Brown color also did not present correlation (p > 0.05) with the L* luminosity index, moisture and titratable acidity. It is possible that these analytical measures correlated may be used for representation of the sensory features of the chocolates.
Table 5.
Pearson’s linear correlation coefficients (p ≤ 0.05) between the sensory attributes and the analytical measures
| Sensory atributes | Analytical measures | |||||||
|---|---|---|---|---|---|---|---|---|
| Y1 | Y2 | Y3 | Y6 | Y7 | Y8 | Y9 | Y11 | |
| X1 | − 0.93343 | − 0.97854 | − 0.96617 | 0.99629 | 0.96034 | 0.98353 | − 0.98053 | − 0.99378 |
| X2 | *** | − 0.96675 | − 0.94337 | 0.99848 | 0.97712 | 0.98885 | − 0.98658 | − 0.99769 |
| X4 | *** | *** | *** | *** | 0.96167 | *** | *** | *** |
| X6 | *** | *** | *** | *** | − 0.95390 | *** | *** | *** |
| X7 | *** | *** | *** | − 0.96549 | − 0.98583 | − 0.96589 | 0.96454 | 0.97008 |
| X8 | *** | *** | *** | 0.95441 | 0.99231 | *** | − 0.96820 | *** |
| X9 | *** | *** | *** | *** | − 0.98947 | *** | 0.96390 | *** |
| X10 | *** | *** | *** | 0.97105 | 0.98843 | 0.96907 | − 0.96994 | − 0.97427 |
| X11 | *** | *** | *** | *** | 0.97979 | *** | *** | *** |
X1 = brightness; X2 = brown color; X4 = chocolate aroma; X6 = melting; X7 = sweet taste; X8 = acid taste; X9 = goat milk taste; X10 = bitter taste; X11 = chocolate taste; Y1 = L* luminosity index; Y2 = a* chromaticity coordinate; Y3 = b* chromaticity coordinate; Y6 = ashes; Y7 = fat; Y8 = proteins; Y9 = pH; Y11 = water activity; *** Non-significant correlation coefficients (p > 0.05)
The sensory attribute chocolate aroma (0.96167) can be represented by the chemical analysis of fat (Table 5). According to Callegari-Jacques (2006) this linear correlation (p ≤ 0.05) is considered very strong, so the application of the sensory profile to obtain the characteristics described by these attributes is not necessary, where high fat content in chocolates with more cocoa indicate higher chocolate aromas.
The sugar particles are important in the chocolate production, they are necessary in specific sizes and shapes. With large quantities of sugar, the probability of formation of amorphous crystals with irregular structures is higher, which results in increase of the viscosity of the product (Glicerina et al. 2016) and, subsequently decrease in the melting capacity, causing inverse correlation with the fat content.
The flavor attributes, usually can be well represented by chemical composition analysis and physicochemical characteristics (p ≤ 0.05). Sweet taste and bitter taste have a very strong linear relation between the set of variables measured (analytical and sensory), especially to ashes (− 0.96549 and 0.97105), fat (− 0.98583 and 0.98843), proteins (− 0.96589 and 0.96907), pH (0.96454 and − 0.96994) and water activity (0.97008 and − 0.97427), respectively.
Significant correlation coefficients (p ≤ 0.05) are only indications of the individual association between the variables, the same way that low correlations do not represent lack of association between the attributes assessed, but the inexistence of casual relation (Carvalho 2004). With that, the analysis of canonic correlations complements in a more clear and reliable way the existent relations between the sets of data.
The two first canonic correlations presented high values (0.951190 and 0.920293, respectively) and, according to the F test (α = 0.05), there was correlation (p ≤ 0.05) between the sensory and analytical data only for these two correlations; the following pairs of canonic variables were obtained:
U1 and V1/U2 and V2 = first and second pairs of chronic variables, respectively. Ux = sensory measures. Vx = analytical measures.
Where: X1 = brightness; X2 = brown color; X3 = cocoa butter aroma; X4 = chocolate aroma; X5 = hardness; X6 = melting; X7 = sweet taste; X8 = acid taste; X9 = goat milk taste; X10 = bitter taste; X11 = chocolate taste.
And: Y1 = L* luminosity index; Y2 = a* chromaticity coordinate; Y3 = b* chromaticity coordinate; Y4 = hardness; Y5 = moisture; Y6 = ashes; Y7 = fat; Y8 = proteins; Y9 = pH; Y10 = titratable acidity; Y11 = water activity.
The U1 canonic variable can be interpreted as an index of global sensorial quality of the goat milk chocolate, while the V1 canonic variable as an analytic quality index. Formulations of chocolates with high sensory scores of sweet taste and analytical scores of a* chromaticity coordinate provided higher scores of the pairs of canonic variables. V1 is the best linear combination to be used to predict U1 and, therefore, the analytic measures can be applied as strategy for verification of the sensory characteristics of the chocolates, without the need of application of a panel of trained tasters, which demands time. The chocolates must be submitted to the sensory and analytical tests, and based on the standardized results, the scores of U1 and V1 for each formulation are calculated.
The pairs of canonic variables of the first correlation suggest that analytical measures of chromaticity coordinates a* (1.2879) and b* (− 0.8695), and of the ashes (− 0.8172) represent in a more clear manner the sweet taste (0.9429) of the chocolates.
For the first canonic correlation (U1 and V1), in the sensory measures, the attributes of higher correlation, meaning the most important for association with the analytical variables, were the brown color (− 0.7875), sweet taste (0.9039), bitter taste (− 0.8577) and chocolate taste (− 0.7468). On the other hand, the analytical measures that had more importance in relating with the sensory attributes were the chromaticity coordinates a* (0.8738) and b* (0.7234), contents of ashes (− 0.9108), fat (− 0.8499) and pH (0.367) (Table 5).
According to the results of the Pearson’s correlation analysis and canonic correlations, the conclusion is that the chocolate’s brown color (sensorial attribute of presentation) can be well represented by the chromaticity coordinates a* and b* and, the taste attributes (especially sweet taste and bitter taste), can be well represented by the analysis of ashes, fat and pH (Table 6).
Table 6.
Coefficient correlations of the sensory attributes and the analytical measures
| Sensory attributes | U1 | U2 | Analytical measures | V1 | V2 |
|---|---|---|---|---|---|
| X1 | − 0.2971 | 0.1678 | Y1 | 0.5372 | 0.0110 |
| X2 | − 0.7875 | 0.1572 | Y2 | 0.8738 | 0.1075 |
| X3 | 0.2269 | 0.1886 | Y3 | 0.7234 | 0.0402 |
| X4 | − 0.6832 | 0.0487 | Y4 | 0.0449 | 0.6243 |
| X5 | − 0.2716 | 0.1573 | Y5 | − 0.5281 | − 0.3169 |
| X6 | 0.1329 | 0.3406 | Y6 | − 0.9108 | − 0.1323 |
| X7 | 0.9039 | − 0.0452 | Y7 | − 0.8499 | 0.0737 |
| X8 | − 0.5228 | 0.1237 | Y8 | − 0.6528 | 0.2298 |
| X9 | 0.5132 | 0.4597 | Y9 | 0.7367 | 0.0034 |
| X10 | − 0.8577 | − 0.1686 | Y10 | − 0.6132 | 0.1473 |
| X11 | − 0.7468 | 0.0077 | Y11 | 0.0180 | 0.3518 |
U1 and V1/U2 and V2 = first and second pairs of canonic variables, respectively. Ux = sensory measures. Vx = analytic measures
X1 = brightness; X2 = brown color; X3 = cocoa butter aroma; X4 = chocolate aroma; X5 = hardness; X6 = melting; X7 = sweet taste; X8 = acid taste; X9 = goat milk taste; X10 = bitter taste; X11 = chocolate taste
Y1 = L* luminosity index; Y2 = a* chromaticity coordinate; Y3 = b* chromaticity coordinate; Y4 = hardness; Y5 = moisture; Y6 = ashes; Y7 = fat; Y8 = proteins; Y9 = pH; Y10 = titratable acidity; Y11 = water activity
Regarding the first pair of canonic variables (U1 and V1) the scores of all the samples of the chocolates formulations were obtained, indicating association between the analytical and sensory variables, and the spatial separation of treatments (Fig. 2).
Fig. 2.
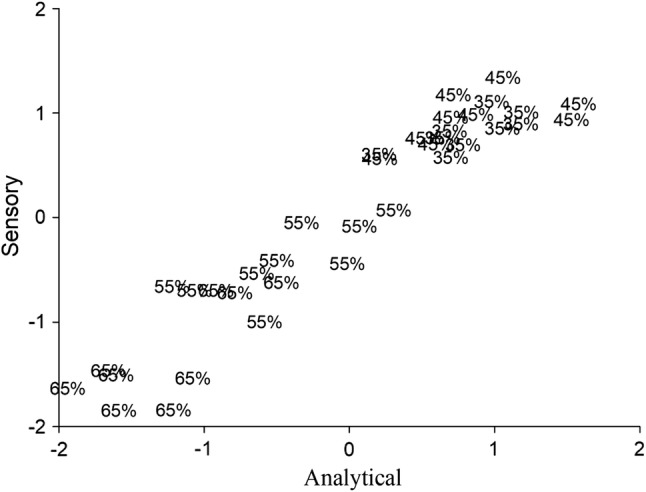
Graphical representation of the treatments according to the first pair of canonic variables
A separation of the samples based on the fraction of cacao in the formulations was observed. Treatments with 35% and 45% of cacao mass were in the same group with higher canonic scores, followed by 55% and 65% with lesser scores in individual and distinct groups.
For the sensory test of acceptance, the attributes of texture (), taste () and GI (), displayed a quadratic model adjust, with the significant model parameters (p ≤ 0.05) and lack of non-significant adjust (p > 0.05), showing that the formulation with 45% cocoa mass was the most accepted.
Correlating the results of acceptance with the canonic correlations (Fig. 2), the conclusion is that the canonic scores superior to 0.5, for both analytical (V1) and the sensory (U1), indicate a better acceptance of the chocolates, highlighting the formulation with 45%, followed by 35%, 55% and 65%.
Conclusion
The correlations between the sensory attributes and the analytical measures showed that the analysis of ashes, fat and pH can describe the sensory characteristics of sweet taste, bitter taste and brown color of the chocolates, which also can be well represented by the a* and b* chromaticity coordinates.
Canonic scores (U1 and V1) superior to 0.5 indicate more acceptance and purchase intention of the chocolates, highlighting the formulation with 45% of cocoa mass.
Acknowledgements
The authors acknowledge the Coordenação de Aperfeiçoamento de Pessoal de Nível Superior (Capes) for providing study scholarships and the CEPLAC for the contribution on the production of the chocolates.
Footnotes
Publisher's Note
Springer Nature remains neutral with regard to jurisdictional claims in published maps and institutional affiliations.
Contributor Information
Grazielly de Jesus Silva, Email: grazielly_silva@hotmail.com.
Ben-Hur Ramos Ferreira Gonçalves, Email: ben_hur_ramos@hotmail.com.
Daniele Gomes Conceição, Email: danielegomesc@gmail.com.
Gabrielle Cardoso Reis Fontan, Email: gcardosoreis@yahoo.com.br.
Leandro Soares Santos, Email: leosoaressantos@yahoo.com.br.
Sibelli Passini Barbosa Ferrão, Email: sibpass@yahoo.com.br.
References
- Afoakwa EO, Paterson A, Fowler M. Factors influencing rheological and textural qualities in chocolate—a review. Trends Food Sci Technol. 2007;18:290–298. doi: 10.1016/j.tifs.2007.02.002. [DOI] [Google Scholar]
- Afoakwa EO, Paterson A, Fowler M, Ryan A. Flavor formation and character in cocoa and chocolate: a critical review. Food Sci Nutr. 2008;48:840–857. doi: 10.1080/10408390701719272. [DOI] [PubMed] [Google Scholar]
- Afoakwa EO, Paterson A, Fowler M, Vieira J. Particle size distribution and compositional effects on textural properties and appearance of dark chocolates. J Food Eng. 2008;87:181–190. doi: 10.1016/j.jfoodeng.2007.11.025. [DOI] [Google Scholar]
- Afoakwa EO, Paterson A, Fowler M, Vieira J. Microstructure and mechanical properties related to particle size distribution and composition in dark chocolate. J Food Eng. 2009;44:111–119. doi: 10.1111/j.1365-2621.2007.01677.x. [DOI] [Google Scholar]
- Aidoo RP, De Clercq N, Afoakwa EO, Dewettinck K. Optimisation of processing conditions and rheological properties using Stephan Mixer as conche in small-scale chocolate processing. Int J Food Sci Technol. 2014;49:740–746. doi: 10.1111/ijfs.12360. [DOI] [Google Scholar]
- Bourne M. Food texture and viscosity: concept and measurement. Cambridge: Academic Press; 2002. [Google Scholar]
- Brazil. Ministério da Saúde. Agência Nacional de Vigilância Sanitária. Resolução – RDC nº 12 (2001) Regulamento Técnico sobre padrões microbiológicos para alimentos. Diário Oficial da União, Brasília, DF
- Callegari-Jacques SM. Bioestatística: princípios e aplicações. Porto Alegre: Artmed; 2006. [Google Scholar]
- Carvalho FIF (2004) Estimativas e implicações da correlação no melhoramento vegetal. Pelotas, Ed. Universitária da UFPel
- Chaves JBP, Sproesser RL. Práticas de Laboratório de Análise Sensorial de Alimentos e Bebidas. Viçosa: Editora da Universidade Federal de Viçosa; 2005. [Google Scholar]
- CIE Commission Internationale de L’Éclairage . Colorimetry. Vienna: CIE Publication; 2004. [Google Scholar]
- Do TAL, Hargreaves JM, Wolf B, Hort J, Mitchell JR. Impact of particle size distribution on rheological and textural properties of chocolate models with reduced fat content. J Food Sci. 2007;72:541–552. doi: 10.1111/j.1750-3841.2007.00572.x. [DOI] [PubMed] [Google Scholar]
- Efraim P, Pezoa-García NH, Jardim DCP, Nishikawa A, Haddad R, Eberlin MN. Influence of cocoa beans fermentation and drying on the polyphenol content and sensory acceptance. Food Sci Technol. 2010;30:142–150. doi: 10.1590/S0101-20612010000500022. [DOI] [Google Scholar]
- FDA Food and Drug Administration (2005) Bacteriological analytical. http://www.cfsan.fda.gov/ebam/bam-5.html/. Accessed 28 July 2016
- Ferreira DF. Estatística Multivariada. Editora UFLA: Lavras; 2011. [Google Scholar]
- Glicerina V, Balestra F, Rosa MD, Romani S. Microstructural and rheological characteristics of dark, milk and white chocolate: a comparative study. J Food Eng. 2016;169:165–171. doi: 10.1016/j.jfoodeng.2015.08.011. [DOI] [Google Scholar]
- IAL Instituto Adolfo Lutz (2008) Métodos físico-químicos para análise de alimentos Brasília, Ministério da Saúde
- Johnson RA, Wichern DW. Applied multivariate statistical analysis. Englewood Cliffs, NJ: Prentice-Hall; 1999. [Google Scholar]
- Jolliffe IT. Discarding variables in a principal component analysis. I: artificial data. J R Stat Soc. 1972;21:160–173. doi: 10.2307/2346488. [DOI] [Google Scholar]
- Larrigaudiere C, Lentheric I, Puy J, Pinto E. Biochemical characterization of core browning and brown heart disorders in pear by multivariate analysis. Postharvest Biol Technol. 2004;31:29–39. doi: 10.1016/S0925-5214(03)00132-7. [DOI] [Google Scholar]
- Lawless HT, Heymann H. Sensory evaluation of food: principles and practices. New York: Springer; 2010. [Google Scholar]
- Massart DL, Vandeginste BGM, Buydens LMC, JongS Lewi PJ, Smeyers-Berbeke J. Handbook of chemometrics and qualimetrics: part A. Amsterdam: Elsevier Science B. V.; 1998. [Google Scholar]
- Mingoti SA. Análise de dados através de métodos de estatística multivariada: uma abordagem aplicada. Editora UFMG: Belo Horizonte; 2005. [Google Scholar]
- Morrison DF. Multivariate statistical methods. Mc Graw Hill: Tokyo; 1978. [Google Scholar]
- Moskowitz HR. Product testing and sensory evaluation of foods. Westport: Food and Nutrition Press; 1983. [Google Scholar]
- Richter VB, Almeida TCA, Prudencio SH, Benassi MT. Proposing a ranking descriptive sensory method. Food Qual Prefer. 2010;21:611–620. doi: 10.1016/j.foodqual.2010.03.011. [DOI] [Google Scholar]
- Silva RCSN, Minim VPR, Carneiro JDS, Nascimento M, Lucia SMD, Minim LA. Quantitative sensory description using the optimized descriptive profile: comparison with conventional and alternative methods for evaluation of chocolate. Food Qual Prefer. 2013;30:169–179. doi: 10.1016/j.foodqual.2013.05.011. [DOI] [Google Scholar]
- Steel RGD, Torrie JH, Dickey DA. Principles and procedures of statistics: a biometrical approach. New York: McGraw Hill Book; 1997. [Google Scholar]
- Stone H, Sidel JL, Oliver S, Wooley A, Sinon RC. Sensory evaluation by quantitative descriptive analysis. Food Technol. 1974;28:24–34. doi: 10.1002/9780470385036.ch1c. [DOI] [Google Scholar]
- Szczesniak AS. Texture is a sensory property. Food Qual Prefer. 2002;13:215–225. doi: 10.1016/S0950-3293(01)00039-8. [DOI] [Google Scholar]