

Abstract
The phytochemical and antioxidant properties of mature (head stage) Chinese cabbage (Brassica rapa ssp. pekinensis) are known; however, data on the phenolic profile, vitamin C (L-ascorbic acid) content and antioxidant capacity of its fresh sprouts are lacking. Since the human consumption of fresh cruciferous sprouts has significantly increased in recent years, their nutritional characterization has become a somewhat urgent matter. Therefore, in this study the contents of total phenolics, flavonols and hydroxycinnamic acids were measured spectrophotometrically, whereas individual flavonoids, phenolic acids and vitamin C were identified and quantified using a newly-developed high performance liquid chromatography method. Also, the antioxidant capacity of five Chinese cabbage sprout growth stages was determined. These stages contained either cotyledons only (seedlings), cotyledons and two leaves, four leaves, six leaves, or ten leaves. Principal component analysis (PCA) and hierarchical clustering (HC) were implemented in order to visualize the classification trend between the stages. Seedlings contained more sinapic acid and vitamin C than older plants. Plants containing six or ten leaves had more ferulic acid and isorhamnetin than younger ones. Total phenolics, flavonols, hydroxycinnamic acids, quercetin and antioxidant capacity did not statistically differ between seedlings and stages with six or ten leaves and their concentrations were significantly higher than in stages with two or four leaves. PCA and HC confirmed the higher phytochemical similarity between seedlings and plants with six or ten leaves than plants with two or four leaves. Therefore, Chinese cabbage seedlings and plants with six or ten leaves should be preferred over plants with two or four leaves, which were ultimately shown to be of lesser nutritional quality.
Electronic supplementary material
The online version of this article (10.1007/s13197-019-04103-y) contains supplementary material, which is available to authorized users.
Keywords: Cruciferous sprouts, Flavonoids, Nutritional potential, Phenolic acids, Vitamin C
Introduction
Chinese cabbage (Brassica rapa L. subsp. pekinensis (Lour.) Hanelt) is a species from the Brassicaceae family, which originates from China and has seen an increasing presence in the human diet. The dietary quality of this species stems from its proteins, vitamins, minerals, dietary fibers, glucosinolates and phenolic compounds (Cartea et al. 2011). The species is generally consumed in its mature (head stage) phase; however, sprouts are often available in the market and are consumed fresh. Moreover, although the Citrus genus is often considered to be the main source of vitamin C in the human diet, the nutritional value of the Brassica is clearly demonstrated by the fact that in some parts of the world the Brassica species provides half of the daily recommended dietary intake of this vitamin (Pennington and Fisher 2010). Numerous studies have offered data on the phytochemical and antioxidant potential of mature Brassica crops, i.e., their heads and leaves (studies listed in Soengas et al. 2012), supporting the fact that they are an excellent source of healthy bioactive compounds.
The biological effects of phenolic compounds and L-ascorbic acid are most often explained by their antioxidant properties (Seong et al. 2016). The qualitative and quantitative content of phenolic compounds and concentration of L-ascorbic acid, as well as their antioxidant capacity, depend on the plant’s development stage (Domínguez-Perles et al. 2014; Petropoulos et al. 2018; Šamec et al. 2011). For example, phenolics and glucosinolates were proven to be present in a tenfold higher amount during the first days of germination of edible seed species germination than that of adult plants (Cevallos-Casals and Cisneros-Zevallos 2010). Two-to-three-month-old white cabbage contains more phytochemicals than in the mature head stage (Šamec et al. 2011). Total phenolics in kohlrabi, red cabbage, turnip, rutabaga and radish sprouts decreased during the first 12 days of development (Baenas et al. 2012). A similar trend was also observed in different fruits. The total phenolic content of Chinese bayberry (Myrica rubra) decreased during growth and full-ripe fruit juice possessed the lowest antioxidant activity (Wu et al. 2018). Wampee (Clausena lansium (Lour.) Skeels) leaf buds showed a higher antioxidant activity than those of young and mature leaves (Chang et al. 2018). In highbush blueberry (Vaccinium corymbosum) fruits, the concentrations of total soluble phenolics and the antioxidant activity (measured by ABTS assay) were higher in green than in the ripened stage (Cheplick et al. 2015). The concentration of total phenolic compounds in apple skin and pulp decreased and the antioxidant activity remained unchanged during the ripening (Kondo et al. 2002). Green strawberry fruit had a higher concentration of L-ascorbic acid than ripe fruits (Olsson et al. 2004). Total phenolics and antioxidant activity of blueberries decreased as fruit development progressed (Castrejon et al. 2008).
However, the decrease of the phenolic content and antioxidant potential of a plant during its development is not a rule. Quite the contrary, date palm (Phoenix dactylifera L.) fruits had higher concentrations of phenolic compounds and antioxidant activity in the mature than the half-ripe and ripe stage (Amira et al. 2012). Similarly, total phenolic content and antioxidant activities of the chloroform, ethyl-acetate and methanol extracts of the olive leaf were higher in the mature than the immature stage (Brahmi et al. 2015). During the 14 days of development of broccoli (Brassica oleracea var. Italica cv. Nubia and cv. Marathon) sprouts development, their vitamin C contents gradually increased, total flavonoids decreased, whereas total phenolic acids and total phenolics gradually decreased up to day 7, remaining unchanged until day 14. Their antioxidant activities (ABTS and DPPH) also decreased until day 7 and then remained unchanged until day 14 (Pérez-Balibrea et al. 2011). Therefore, developmentally-related variations in the number of phytonutrients and the antioxidant potential of a plant are species-specific and by no means unidirectional, and this fact needs to be taken into account when considering the general nutritional value of a plant.
So far, information on the content of phenolic compounds and vitamin C in the form of L-ascorbic acid (Klieber and Franklin 2000), as well as antioxidant capacity of Chinese cabbage has been recorded for mature plants (Seong et al. 2016). Concentrations of free and bound phenolic acids in Chinese cabbage seedlings and sprouts containing four leaves have been established (Pavlović 2017), but there are no comparative data on the qualitative and quantitative content of phenolic compounds or L-ascorbic acid and the antioxidant capacity of different Chinese cabbage sprout growth phases. Because brassicaceous sprouts, recognized as a novel plant food rich in bioactive compounds (Baenas et al. 2012), are consumed at an increasing rate and young plant tissues are known to be metabolically very active and to produce different phytochemicals, an assessment of their different early growth stages phytochemical and antioxidant potentials is necessary in order to assure the best utilisation of these vegetables and to perhaps establish their effect on human beings. Additionally, knowledge of the variations in biochemical metabolism during young plant development could provide information for the future development of functional edible fresh Chinese cabbage sprouts with large accumulation of antioxidant phenolics.
The aims of this study were the following: (a) spectrophotometrically determine the quantity of total phenolics, flavonols and hydroxycinnamic acids, (b) develop a new RP-HPLC method for the separation, identification and quantification of phenolics and L-ascorbic acid in Chinese cabbage, (c) identify and quantify individual flavonoids, phenolic acids and L-ascorbic acid, (d) determine the antioxidant capacity, and (e) statistically [using one-way analysis of variance (ANOVA), principal component analysis (PCA), hierarchical clustering and Pearson’s correlations] correlate all of the measured variables of five growth phases of Chinese cabbage sprout: 1 = two developed cotyledons, 2 = two developed cotyledons and two developed leaves, 3 = four developed leaves, 4 = six developed leaves, 5 = ten developed leaves in order to conclude which of the tested phases is, on the level of the studied parameters, optimal for further investigations. The selection of the best growth phase in terms of phytochemical composition and antioxidant capacity could assure a healthworthy utilization of Chinese cabbage sprouts in the food industry.
Materials and methods
Plant material
Chinese cabbage seeds were purchased from International Seeds Processing GmbH, Quedlinburg (Germany). The cultivation and collection of plant material (three biological replicas, each replica contained 30 plants) were carried out from February to May 2018. The seeds were sterilized with 2.55% (w/V) aqueous solution of izosan (commercial bleach) for 20 min at room temperature, subsequently washed 6–7 times with autoclaved deionized water and then germinated for 3–4 days on a wet filter paper in the dark at a temperature of 23 °C and humidity of 65%. After 4 to 5 days of germination, the seedlings were transferred to the pots containing sterile substrate Stender B400 (Schermbeck, Germany) sterile substrate, and further cultivated in the greenhouse under constant conditions (22–25 °C, light regime 16 h day/8 h night, humidity 65%) with controlled watering until the time of collection. Plant material was collected at five different growth phases: 1 = two developed cotyledons, 2 = two developed cotyledons and two developed leaves, 3 = four developed leaves, 4 = six developed leaves, 5 = ten developed leaves (Supp. Figure 1). The plants were cut with sterile shears underneath the lower leaves, cleaned from residual substrate, washed with distilled water, frozen in liquid nitrogen and immediately extracted.
Extraction
Extracts at a concentration of 150 mg/mL were prepared in 70% ethanol (EtOH) as follows: EtOH was added to the fresh powdered plant material, stirred in a vortex mixer, and shaken at 50 rpm for 50 min at room temperature. The obtained extracts were centrifuged for 5 min at 11,000 rpm and the supernatants were stored at − 20 °C until further analysis.
Total phenolics, hydroxycinnamic acids and flavonols
Spectrophotometric analyses were performed using a FLUOstar Optima (BMG LABTECH) device. The content of total phenolics was determined spectrophotometrically by measuring absorbance at 740 nm, according to Zhishen et al. (1999), and the results were expressed as equivalents of gallic acid per gram of fresh weight (mg GAE/100 g FW). To determine total hydroxycinnamic acids and flavonols, the method of Howard et al. (2003) was used. Total hydroxycinnamic acids were determined by measuring the absorbance at 310 nm and total phenolics at 360 nm. The results were expressed as equivalents of quercetin per gram of fresh weight (mg Q/100 g FW) or as equivalents of caffeic acid per gram of fresh weight (mg CAE/100 g FW), respectively.
Analysis of phenolics and L-ascorbic acid by reversed-phase high performance liquid chromatography
For purposes of the identification and quantification of the aglycone phenolic compounds and L-ascorbic acid in Chinese cabbage, the extracts were hydrolyzed with hydrochloric acid at a final concentration of 1.2 mol/L for 2 h at 80 °C with stirring at 300 rpmThe RP-HPLC analyses were performed using an Agilent 1100 Series device with a UV/VIS detector. The separation was carried out on a Poroshell 120 SB-C18 non-polar column (4.6 × 75 mm, 2.7 μm particle size) using the Zorbax Rx-C18 guard column (4.6 × 12.5 mm, 5 μm particle size). Mobile phase A was 0.2% acetic acid and mobile phase B was 0.2% acetic acid and 80% methanol. The flow rate was 1 mL/min and the applied volume of the sample was 25 μL. The gradient profile (A/B) was as follows: at 0 min = 100/0, at 42 min = 20/80, at 43 min = 0/100, at 45 min = 0/100, at 45.1 min = 100/0. The wavelength at which the flavonoids were analyzed was 360 nm; a wavelength of 310 nm was used for the phenolic acid analysis, and 254 nm for L-ascorbic acid.
Phenolic compounds and L-ascorbic acid were characterized according to their retention times, and the UV spectra were compared with commercial standards. For the quantitative analyses, calibration curves were obtained by injection of known concentrations (within the range 1–250 μg/mL) of the mixed standard solution in triplicate.
Antioxidant capacity
The free-radical-scavenging activity of non-hydrolyzed extracts was assessed using three standard methods—ABTS, DPPH and FRAP. The ABTS (2,2′-azinobis(3-ethylbenzothiazoline-6-sulfonic acid) assay was carried out as in Re et al. (1999). A volume of 2 μL of the tested solution was added to 200 μL of ABTS solution and incubated for 6 min at room temperature. The absorbance of the reaction mixture was read at 740 nm. The radical scavenging capacity was calculated as percentage of ABTS inhibition as follows: % inhibition = [(A0 − At)/A0] × 100, where A0 was the absorbance of the control (blank, without tested solution) and At was the absorbance in the presence of the tested solution. Trolox was used as a positive control.
DPPH (1,1-diphenyl-2-picrylhydrazyl) assay was performed as described in Germanò et al. (2002); 10 µL of tested solution was added to 190 µL of freshly prepared ethanolic DPPH solution (0.1 mM) and incubated in the dark for 30 min at room temperature. The decrease in absorbance was measured at 520 nm and the radical scavenging capacity was calculated using the above-mentioned equation.
The ferric reducing antioxidant power (FRAP) assay was performed according to the original method of Benzie and Strain (1999). The tested solution (10 μL) was mixed with the freshly prepared FRAP reagent (a complex of iron with 2,4,6-tripyridyl-S-triazine, Fe(III)(TPTZ)2Cl3, 190 µL) and the absorbance was measured at 595 nm after 4 min of reaction time. The percent of Fe3+-TPTZ reduction was calculated using the formula: % reduction = [(At − A0)/At] × 100, where A0 was the absorbance of the control (blank, without tested solution) and At was the absorbance in the presence of the tested solution. Trolox was used as a positive control. In all of the assays, three repetitions in three independent experiments were done for the same sample and all the absorbance measurements were performed with a Fluostar Optima microplate reader (BMG Labtech GmbH, Offenburg, Germany).
Statistical analysis
The obtained data were statistically processed using Statistica 13.1 software (Stat Soft Inc., USA). The comparison of the sample means was carried out using one-way variance analysis (ANOVA) and Duncan’s New Multiple Range Test (DNMRT), i.e., post hoc multiple comparison test. Statistically significant values were those that differed at the p ≤ 0.05 level. Multivariate PCA analysis was performed, as well as hierarchical clustering using the Euclidean distance between samples and single linkage clustering to evaluate how close the samples were. Pearson’s correlation coefficients between the phytochemical content and antioxidant capacity were calculated.
Results and discussion
Total phenolics, total hydroxycinnamic acids, and total flavonols
Because of promising phytochemical properties, the consumption of fresh young plants has become a frequent part of people’s daily nutrition. Determining the growth phase at which a sprout has the highest phenolic content, and L-ascorbic acid and antioxidant capacity could help improve the application of Chinese cabbage in the food industry. It was with this aim that we performed our spectrophotometric analyses, and the results showed that seedlings (containing cotyledons only) and the two last phases (six or ten developed leaves) had significantly higher levels of total phenolic compounds (154.06 ± 16.87, 148.24 ± 22.90, 170.27 ± 38.79 mg/kg, respectively) than the phases with two (110.85 ± 21.60 mg/kg) or four leaves (99.07 ± 18.43 mg/kg) (Fig. 1a). We assumed that the plant at the earliest stage of development, when it contains cotyledons only, synthesizes a larger amount of total phenolic compounds (known antioxidants) because of its need for additional protection against potential oxidative stress to which it can be exposed during intense growth. During the transition from the cotyledon phase to the phase with two or four real leaves, the plant probably invested much of its energy into the biosynthesis of the primary metabolites necessary for the development of real leaves. After the development of the first four leaves, the amount of total phenolic compounds in the plant again increased significantly, probably because of the need to protect the plant from environmental stress such as UV rays to which it was exposed more because of its now larger surface. Similar phytochemical variations were recorded in sweet cherry fruit, as well. Phenolics decreased as the fruit developed from green to pink and then increased back to green levels as the fruit continued to ripen (Serrano et al. 2005). The decrease in phenolic concentrations during fruit development has also been documented for chinese bayberry, highbush blueberry and blueberry (Wu et al. 2018; Cheplick et al. 2015; Castrejon et al. 2008). Total phenolics in apple skin and pulp also exhibited a decreasing trend during ripening (Kondo et al. 2002). The total amount of phenolics in the Chinese cabbage seedlings has already been investigated (Šamec et al. 2018) and the observed values, if we assume that the mass of dry tissue corresponds to 10 times mass of fresh tissue, were very similar to the values recorded in this study [1.54 mg GAE/g FW in the samples in this study and 13.20 mg GAE/g DW in samples from Šamec et al. (2011)]. Also, Seong et al. (2016) recorded a larger amount of total phenolics in the outer (older) leaves of technically mature Chinese cabbage, which coincides with the result of this study.
Fig. 1.

Values of a total phenolics, b total hydroxycinnamic acids, c total flavonols, and dL-ascorbic acid in Chinese cabbage ± standard deviation (three biological replicas) expressed in miligrams of gallic acid equivalents per kilogram fresh weight (mg GAE/kg FW), miligrams of caffeic acid equivalents per kilogram fresh weight (mg CAE/kg FW), miligrams of quercetin equivalents per kilogram fresh weight (mg QE/kg FW), and mg L-ascorbic acid/kg fresh weight, respectively. Values marked with different letters were considered significantly different (one-way ANOVA, Duncan test, p ≤ 0.05). Growth phases: 1 = two developed cotyledons, 2 = 2 developed cotyledons and 2 developed leaves, 3 = 4 developed leaves, 4 = 6 developed leaves, 5 = 10 developed leaves
The amount of total hydroxycinnamic acids did not differ significantly between the tested phases, except for the stage with two real leaves (72.35 ± 1.37 mg/kg) in relation to the seedlings (119.11 ± 14.85 mg/kg) and the stage with six leaves (114.17 ± 17.34 mg/kg), which differed significantly (Fig. 1b) probably due to the aforementioned reasons—a part of the energy during the development of the first true leaves is used for the synthesis of primary metabolites. A similar relationship between the phases was also observed for total flavonols (Fig. 1c); during the development of the first true leaves, a significantly lower concentration of these compounds was observed than in the seedlings (cotyledons only) and stages with six or ten leaves. Contrary to the finding of Baenas et al. (2012), who recorded a larger amount of sinapic and chlorogenic acid derivatives than flavonols in different Brassica varieties, similar concentrations of total hydroxycinnamic acids and flavonols were detected in the fresh Chinese cabbage seedlings and sprouts we studied (Fig. 1).
Reversed-phase high performance liquid chromatography of phenolics and L-ascorbic acid
The RP-HPLC method we developed for this study allowed us to separate, identify and quantify flavonoids, phenolic acids and L-ascorbic acid (Fig. 2).
Fig. 2.

RP-HPLC profiles of Chinese cabbage a flavonoids recorded at 360 nm, b phenolic acids recorded at 310 nm, and L-ascorbic acid recorded at 254 nm (c). Q quercetin, K kaempferol, Isorh isorhamnetin, Fer ferulic acid, Sin sinapic acid, L-Ascor L-ascorbic acid
The concentration of L-ascorbic acid is presented in Fig. 1d. The highest concentration was recorded in seedlings (348.72 ± 4.26 mg/kg), followed by a significant decrease in sprouts containing cotyledons and two real leaves (67.50 ± 1.92 mg/kg). During the phases with four and six real leaves, the concentration increased and no significant changes compared to the previous phase occurred during the phase containing ten real leaves. The L-ascorbic acid concentrations in different Chinese cabbage cultivars at the edible maturity stage were between 54 and 126 mg/kg FW (Singh et al. 2007; Hrncirik et al. 2001), and these results are similar to the concentrations we found in the stages with real leaves. Similarly to our results, younger broccoli sprouts (3 days old, corresponding to the seedlings in our experiment) were found to be a better source of vitamin C, phenolics and glucosinolates than 7-day-olds corresponding to the sprouts with cotyledons and two real leaves in our experiment (Pérez-Balibrea et al. 2008). As it is known that younger plants have higher net photosynthetic values than older ones (Horsley and Gottschalk 1993) and that L-ascorbic acid acts as an electron donor for the photosynthetic electron transport chain (Ivanov 2014), we presumed that this could be the reason that Chinese cabbage had significantly greater concentrations of L-ascorbic acid in the earliest development phase. Furthermore, it is known that L-ascorbic acid participates in cell proliferation and elongation (Davey et al. 2000), processes that are intensive during the earliest growth phase.
Among the flavonoids, we identified kaempferol, quercetin and isorhamnetin, and among the phenolic acids, sinapic and ferulic (Fig. 2a, b). In terms of concentration, the most common among the flavonoids in each of the growth phases was kaempferol, followed by quercetin, and the least represented was isorhamnetin (Fig. 3). Kaempferol was dominant among the identified compounds in all of the phases that involved both real leaves and seedlings, with an accompanying dominance of sinapic acid only in the latter. After kaempferol, quercetin was the second most abundant flavonoid in all of the phases, and isorhamnetin was present at the lowest concentrations. During the development from seedlings to the stage with ten real leaves, we observed the reduction of the quercetin/isorhamnetin ratio. We concluded that the biosynthesis of these flavonoids is developmentally specific and presumed that the reduction of the quercetin concentration and increase of the isorhamnetin (methylated form of quercetin) concentration occurred because of the increased activity of the quercetin-3-O-methyltransferase enzyme at a later phase of development.
Fig. 3.

The amount (expressed in mg/kg of fresh weight) of identified phenolic compounds at different growth phases (1–5) of Chinese cabbage. The y-axis shows the mean values of three biological replicas ± standard deviation. Values marked with different letters are considered significantly different (ANOVA, Duncan test, p ≤ 0.05). Growth phases: 1 = two developed cotyledons, 2 = 2 developed cotyledons and 2 developed leaves, 3 = 4 developed leaves, 4 = 6 developed leaves, 5 = 10 developed leaves
The trend of developmentally-related changes in the quantities of the identified hydroxycinnamic acids, sinapic and ferulic, was reversed in Chinese cabbage (Fig. 3). Sinapic acid had the highest concentration in the seedlings phase (23.72 ± 4.66 mg/kg), the concentrations in later phases not differing significantly among one another r, whereas ferulic acid was represented by the highest concentrations in the phases containing six (17.16 ± 1.43 mg/kg) and ten real leaves (18.18 ± 1.66 mg/kg). In the first three phases, its concentrations were not different. Based on this result, we concluded that, with regard to the developmental aspect, these two hydroxycinnamic acids are synthesized and/or used in an inversely proportional manner in Chinese cabbage sprouts. An analogous result was obtained by Seong et al. (2016), who analysed the content of these acids in the inner, central and outer leaves of Chinese cabbage in the adult (technically mature) stage. More precisely, the highest concentration of sinapic acid was recorded by the authors in the inner (youngest) leaves and ferulic acid only in the outer (oldest) leaves. Baenas et al. (2012) also found that cruciferous seeds and sprouts had a higher concentration of sinapic acid derivatives than mature plants. Because sinapic acid is a prominent anxiolytic agent (Yoon et al. 2007), we presume that Chinese cabbage seedlings could be a potential food of choice for people with anxiety problems. The increase in ferulic acid concentration recorded in the phases with six and ten real leaves can be explained by the fact that this acid is a precursor of coniferyl alcohol, a lignin monomer which assures the strength of cell walls as well as that of the whole plant, and the more leaves the plant possesses, the higher amount of lignin it needs to solidify its cell walls. Moreover, the amount of ferulic acid constantly increased from the seedlings phase to the phase with ten real leaves (Supp. Figure 2), whereas phases with six and ten leaves had significantly greater amounts of this component than earlier phases. In fact, this was the only compound whose concentration correlated completely positively with the development of Chinese cabbage.
If we examine the concentration of total identified phenolic acids and flavonoids in fresh Chinese cabbage, the amount of identified flavonoids dominated over the amount of identified phenolic acids in each of the phases (Suppl. Figure 3). The highest concentration of identified flavonoids was recorded in the phase with six leaves and, considering the results presented in Fig. 3, kaempferol contributed to the greatest extent. The highest concentration of identified phenolic acids was recorded in the seedlings, and mainly due to the sinapic acid. Similar results were recorded for broccoli, cabbage, cauliflower, kale, tronchuda cabbage and nabicol as well (Soengas et al. 2012). However, in contrast, the total identified flavonols dominated over total identified hydroxycinnamic acids in varieties of turnip greens and turnip tops (Francisco et al. 2009). Similarly to Singh et al. (2007), we concluded that the plant harvesting stage is one of the critical factors when defining potential bioactivity. As Cevallos-Casals and Cisneros-Zevallos (2010) had already emphasized, defining the growth stage where the level of phenolics and antioxidant capacity are optimised is important both for the growers and for the consumers of sprouts with improved nutritional properties.
Antioxidant capacity
As for the antioxidant capacity of fresh Chinese cabbage, we assumed that it would be significantly different between different growth phases, and the ABTS and FRAP results confirmed our hypothesis. Both methods showed a significantly lower antioxidant capacity of the phases with two and four leaves compared to the seedlings and phases containing six and ten leaves (p ≤ 0.05) (Fig. 4a, b). Moreover, ABTS showed that the phase with two leaves had a lower antioxidant capacity than the phase with four leaves. Such results are consistent with the amounts of phenolic compounds that we recorded in the tested phases. We expected that the phases with the lowest amount of total phenolic compounds (phases containing two and four leaves) would also show the lowest antioxidant capacity, as phenolic compounds are the major natural antioxidants of crucifers (Baenas et al. 2012). A positive correlation of the antioxidant capacity and the content of phenolic compounds, as significant antioxidants, was also reported by Seong et al. (2016) for the leaves of mature Chinese cabbage. Moreover, Cevallos-Casals and Cisneros-Zevallos (2010) concluded that “at initial germination stages, phenolics might serve as radical scavengers or antioxidants, whereas later they could become part of the structural framework of the growing plant and lose some of their antioxidant efficiency”, and our results from seedling to the phase with four leaves definitely support such a conclusion. It is interesting to note that ABTS and FRAP assays did not show a significant difference in antioxidant capacity between the seedlings and stages when the plant had six or ten true leaves. Nevertheless, we assumed that the increase in antioxidant capacity in plants with six or ten leaves was due to their greater surface exposure to environmental challenges. This fact indicated that, if a specific antioxidant activity (in this case about 30% inhibition of ABTS+ radicals or 87% reduction of Fe3+-TPTZ radicals) were necessary, one would not have to breed Chinese cabbage to the phase with six or ten leaves. This effect could be achieved using the cabbage in the stage with cotyledons only, which greatly shortens the growing time, reduces the amount of substrate and water required for irrigation, and is ultimately a more economical process. Given the amount of individually identified phenolic compounds, we assumed that the significantly higher concentrations of sinapic acid in the seedlings phase and higher concentrations of kaempferol and ferulic acid in the phases with six and ten leaves contributed to a similar degree of antioxidant capacity in the seedlings and phases with six and ten leaves. The DPPH method did not establish statistically significant differences between the tested phases (Fig. 4c) so we concluded that, among the tested parameters, DPPH radical reduction was the least sensitive (most stable) to the physiological changes during Chinese cabbage growth from the stage with cotyledons to the stage with ten real leaves. Similar results were recorded for broccoli sprouts as well; their antioxidant activity also decreased until day 7 and remained unchanged until day 14 (Pérez-Balibrea et al. 2011).
Fig. 4.
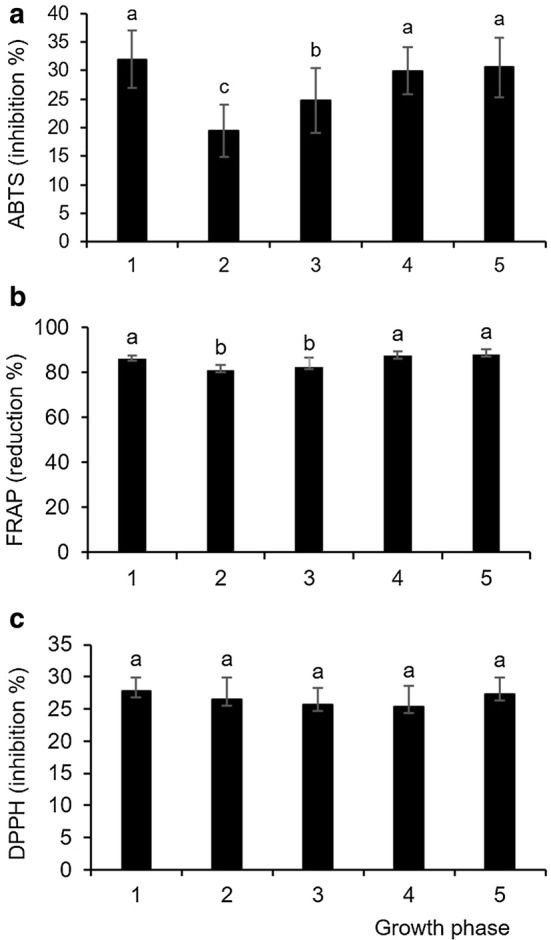
Antioxidant capacity of Chinese cabbage extracts measured by a ABTS, b FRAP and c DPPH. Values denote mean ± standard deviation of three biological replicas. Values marked with different letters are considered significantly different (ANOVA, Duncan test, p ≤ 0.05). Growth phases: 1 = two developed cotyledons, 2 = 2 developed cotyledons and 2 developed leaves, 3 = 4 developed leaves, 4 = 6 developed leaves, 5 = 10 developed leaves
PCA of phytochemical data and hierarchical clustering
In order to yield an overview of the variability between young Chinese cabbage growth phases based on their phytochemicals and antioxidant capacities, a multivariate statistical analysis of data was performed using PCA, and the result of the whole set of average values is presented in Fig. 5. Two principal components with eigenvalues greater than one (6.941 and 3.897), accounting for 90.31% of total variance, were obtained. Based on all of the phytochemical analyses, the growth phases were separated in three directions; the first growth phase (seedlings) was set apart from the other four phases, which were clustered into two groups (phases containing two and four real leaves were more similar to each other and had lower amounts of the analyzed phytochemicals, as well as lower antioxidant capacity than phases containing six and ten leaves, which clustered into another group with larger amounts of phytochemicals and greater antioxidant capacity). Furthermore, seedlings and plants containing six and ten leaves were located on one side of the plot, whereas plants with two and four leaves were on the other, suggesting a higher similarity between seedlings and plants with six or ten leaves. A comparable pattern is evident when one examines the hierarchical clustering (Supp. Figure 4) as well; the growth phases with six and ten leaves were highly correlated with each other and closely connected to the seedlings phase. Growth phases with two and four leaves were highly correlated to each other, but separated from the other three phases at a linkage distance greater than 400. Therefore, chemometric analyses seemed to be a useful approach in the evaluation of phytochemical (dis)similarities between different plant growth phases.
Fig. 5.

Score plot of the principal component analysis of five Chinese cabbage growth phases and all of the implemented phytochemical analyses. Q quercetin, K kaempferol, Isorh isorhamnetin, Fer ferulic acid, Sin sinapic acid, L-Ascor L-ascorbic acid, TP total phenolics, THCA total hydroxycinnamic acids, TFLA total flavonols. ABTS, FRAP and DPPH = antioxidant methods described in the Materials and Methods section. Growth phases: 1 = two developed cotyledons, 2 = 2 developed cotyledons and 2 developed leaves, 3 = 4 developed leaves, 4 = 6 developed leaves, 5 = 10 developed leaves
Pearson’s correlation coefficients
Pearson’s linear correlation coefficients between the phytochemical content and antioxidant capacity of Chinese cabbage growth phases are presented in Table 1. The results are discussed according to the interpretation of Evans’ (1996) correlations. As shown, sinapic and L-ascorbic acid were the most strongly correlated (0.970). Among the antioxidant assays, a very strong correlation was observed between ABTS and FRAP results. Interestingly, out of the identified phytochemicals and antioxidant assays performed, the only significant correlation was observed between quercetin and the ABTS results. L-ascorbic acid correlated very strongly with phenolic acids: sinapic (in a positive sense) and ferulic acid (in a negative sense). Ferulic acid and kaempferol correlated very strongly with isorhamnetin, but not with each other. Total flavonols showed significant correlations with the highest number of parameters (total hydroxycinnamic acids, ferulic acid, L-ascorbic acid and isorhamnetin), whereas DPPH results did not significantly correlate with any of the measured parameters.
Table 1.
Pearson’s correlation coefficients between the phytochemical content and antioxidant capacity
| TP | ABTS | DPPH | FRAP | THCA | TFLA | Fer | Sin | Q | K | Isorh | L-Ascor | |
|---|---|---|---|---|---|---|---|---|---|---|---|---|
| TP | 1.000 | |||||||||||
| ABTS | 0.829 | 1.000 | ||||||||||
| DPPH | 0.159 | 0.058 | 1.000 | |||||||||
| FRAP | 0.751 | 0.848 | − 0.426 | 1.000 | ||||||||
| THCA | 0.329 | 0.366 | − 0.173 | 0.366 | 1.000 | |||||||
| TFLA | 0.450 | 0.479 | − 0.339 | 0.565 | 0.967 | 1.000 | ||||||
| Fer | 0.233 | 0.086 | − 0.489 | 0.372 | 0.715 | 0.763 | 1.000 | |||||
| Sin | 0.128 | 0.329 | 0.315 | 0.104 | − 0.641 | − 0.585 | − 0.878 | 1.000 | ||||
| Q | 0.656 | 0.830 | − 0.044 | 0.748 | − 0.132 | 0.041 | − 0.308 | 0.712 | 1.000 | |||
| K | 0.372 | 0.517 | − 0.661 | 0.750 | 0.777 | 0.894 | 0.741 | − 0.446 | 0.226 | 1.000 | ||
| Isorh | 0.502 | 0.413 | − 0.674 | 0.751 | 0.650 | 0.807 | 0.845 | − 0.538 | 0.175 | 0.903 | 1.000 | |
| L-Ascor | 0.230 | 0.466 | 0.409 | 0.175 | − 0.472 | − 0.440 | − 0.828 | 0.970 | 0.736 | − 0.360 | − 0.502 | 1.000 |
*Bold values are significant at p ≤ 0.05
Conclusion
This is the first study on variability in phenolic and L-ascorbic acid content and antioxidant capacity of different growth phases of Chinese cabbage sprouts, as well as on the possible application of chemometric analysis in assessing the optimal Chinese cabbage harvest stage. Our data show that fresh Chinese cabbage seedlings and plants containing six or ten leaves should be preferred over plants with two or four leaves, which turned out to be of lower nutritional quality in each of the tests we performed in this study. A separation of the growth phases into three directions was observed from the PCA score plot: seedlings were set apart from the other four phases, which were clustered into two groups (plants containing two or four real leaves were more similar to each other and had lower amounts of the analyzed phytochemicals and lower antioxidant capacities than plants with six or ten leaves). A similar pattern was also visible after hierarchical clustering. Therefore, phytochemical methods combined with chemometric analysis could be a useful strategy for selecting the optimal plant harvest stage with regard to the level of the desired compound, antioxidant capacity or both.
Electronic supplementary material
Below is the link to the electronic supplementary material.
Acknowledgements
The authors sincerely thank Ivana Buj, Ph.D. for her help with the PCA. This study did not receive any specific Grant from funding agencies in the public, commercial, or not-for-profit sectors.
Footnotes
Publisher's Note
Springer Nature remains neutral with regard to jurisdictional claims in published maps and institutional affiliations.
References
- Amira EA, Behija SE, Beligh M, Lamia L, Manel I, Mohamed H, Lotfi A. Effects of the ripening stage on phenolic profile, phytochemical composition and antioxidant activity of date palm fruit. J Agric Food Chem. 2012;60:10896–10902. doi: 10.1021/jf302602v. [DOI] [PubMed] [Google Scholar]
- Baenas N, Moreno DA, García-Viguera C. Selecting sprouts of Brassicaceae for optimum phytochemical composition. J Agric Food Chem. 2012;60:11409–11420. doi: 10.1021/jf302863c. [DOI] [PubMed] [Google Scholar]
- Benzie IFF, Strain JJ. Ferric reducing/antioxidant power assay: direct measure of total antioxidant activity of biological fluids and modified version for simultaneous measurement of total antioxidant power and ascorbic acid concentration. Methods Enzymol. 1999;299:15–27. doi: 10.1016/S0076-6879(99)99005-5. [DOI] [PubMed] [Google Scholar]
- Brahmi F, Mechri B, Dhibi M, Hammami M. Effect of growth stage and solvent extract on the antioxidant potential of olive leaves. J Plant Sci. 2015;3:1–7. [Google Scholar]
- Cartea ME, Francisco M, Soengas P, Velasco P. Phenolic compounds in Brassica vegetables. Molecules. 2011;16:251–280. doi: 10.3390/molecules16010251. [DOI] [PMC free article] [PubMed] [Google Scholar]
- Castrejon ADR, Eicholz I, Rohn S, Kroh LW, Huyskens-Keil S. Phenolic profile and antioxidant activity of highbush blueberry (Vaccinium corymbosum L.) during fruit maturation and ripening. Food Chem. 2008;109:564–572. doi: 10.1016/j.foodchem.2008.01.007. [DOI] [Google Scholar]
- Cevallos-Casals BA, Cisneros-Zevallos L. Impact of germination on phenolic content and antioxidant activity of 13 edible seed species. Food Chem. 2010;119:1485–1490. doi: 10.1016/j.foodchem.2009.09.030. [DOI] [Google Scholar]
- Chang X, Yusheng L, Lin Z, Qiu J, Guo X, Pan J, Abbasi AM. Impact of leaf development stages on polyphenolics profile and antioxidant activity in Clausena lansium (Lour.) Skeels. Biomed Res Int. 2018 doi: 10.1155/2018/7093691. [DOI] [PMC free article] [PubMed] [Google Scholar]
- Cheplick S, Sarkar D, Bhowmik P, Shetty K. Phenolic bioactives from developmental stages of highbush blueberry (Vaccinium corymbosum) for hyperglycemia management using in vitro models. Can J Plant Sci. 2015;95:653–662. doi: 10.4141/cjps-2014-352. [DOI] [Google Scholar]
- Davey MW, Van Montagu M, Inzé D, Sanmartin M, Kanellis A, Smirnoff N, Benzie IJJ, Strain JJ, Favell D, Fletcher J. Plant L-ascorbic acid: chemistry, function, metabolism, bioavailability and effects of processing. J Sci Food Agric. 2000;80:825–860. doi: 10.1002/(SICI)1097-0010(20000515)80:7<825::AID-JSFA598>3.0.CO;2-6. [DOI] [Google Scholar]
- Domínguez-Perles R, Mena P, García-Viguera C, Moreno DA. Brassica foods as a dietary source of vitamin C: a review. Crit Rev Food Sci Nutr. 2014;54:1076–1091. doi: 10.1080/10408398.2011.626873. [DOI] [PubMed] [Google Scholar]
- Evans JD. Straightforward statistics for the behavioural sciences. Pacific Grove: Brooks/Cole Publishing; 1996. [Google Scholar]
- Francisco M, Moreno DA, Cartea ME, Ferreres F, García-Viguera C, Velasco P. Simultaneous identification of glucosinolates and phenolic compounds in a representative collection of vegetable Brassica rapa. J Chromatogr A. 2009;1216:6611–6619. doi: 10.1016/j.chroma.2009.07.055. [DOI] [PubMed] [Google Scholar]
- Germanò MP, Pasquale RD, D’Angelo V, Catania S, Silvari V, Costa C. Evaluation of extracts and isolated fraction from Capparis spinosa L. buds as an antioxidant source. J Agric Food Chem. 2002;50:1168–1171. doi: 10.1021/jf010678d. [DOI] [PubMed] [Google Scholar]
- Horsley SB, Gottschalk KW. Leaf area and net photosynthesis during development of Prunus serotina seedlings. Tree Physiol. 1993;12:55–69. doi: 10.1093/treephys/12.1.55. [DOI] [PubMed] [Google Scholar]
- Howard LR, Clark JR, Brownmiller C. Antioxidant capacity and phenolic content in blueberries as affected by genotype and growing season. J Sci Food Agric. 2003;83:1238–1247. doi: 10.1002/jsfa.1532. [DOI] [Google Scholar]
- Hrncirik K, Valusek J, Velisek J. Investigation of ascorbigen as a breakdown product of glucobrassicin autolysis in Brassica vegetables. Eur Food Res Technol. 2001;212:576–581. doi: 10.1007/s002170100291. [DOI] [Google Scholar]
- Ivanov BN. Role of ascorbic acid in photosynthesis. Biochem (Mosc) 2014;79:282–289. doi: 10.1134/S0006297914030146. [DOI] [PubMed] [Google Scholar]
- Klieber A, Franklin B. Ascorbic acid content of minimally processed Chinese cabbage. Acta Hortic. 2000;518:201–204. doi: 10.17660/ActaHortic.2000.518.27. [DOI] [Google Scholar]
- Kondo S, Tsuda K, Nuto N, Ueda J. Antioxidative activity of apple skin or flesh extracts associated with fruit development on selected apple cultivars. Sci Hortic. 2002;96:177–185. doi: 10.1016/S0304-4238(02)00127-9. [DOI] [Google Scholar]
- Olsson ME, Ekvall J, Gustavsson K, Nilsson J, Pillai D, Sjoholm I, Svensson U, Akesson B, Nyman MGL. Antioxidants, low molecular weight carbohydrates, and total antioxidant capacity in strawberries (Fragaria x ananassa): effects of cultivar, ripening, and storage. J Agric Food Chem. 2004;52:2490–2498. doi: 10.1021/jf030461e. [DOI] [PubMed] [Google Scholar]
- Pavlović I (2017) Plant stress response of Brassicaceae upon increased salinity: the role of auxin and stress hormones. Ph.D. Thesis, Josip Juraj Strossmayer University of Osijek, Croatia
- Pennington JAT, Fisher RA. Food component profiles for fruit and vegetable subgroups. J Food Compost Anal. 2010;23:411–418. doi: 10.1016/j.jfca.2010.01.008. [DOI] [Google Scholar]
- Pérez-Balibrea S, Moreno DA, García-Viguera C. Influence of light on health-promoting phytochemicals of broccoli sprouts. J Sci Food Agric. 2008;88:904–910. doi: 10.1002/jsfa.3169. [DOI] [Google Scholar]
- Pérez-Balibrea S, Moreno DA, García-Viguera C. Genotypic effects on the phytochemical quality of seeds and sprouts from commercial broccoli cultivars. Food Chem. 2011;125:348–354. doi: 10.1016/j.foodchem.2010.09.004. [DOI] [Google Scholar]
- Petropoulos SA, Fernandes A, Vasileios A, Ntatsi G, Barros L, Ferreira ICFR. Chemical composition and antioxidant activity of Cichorium spinosum L. leaves in relation to developmental stage. Food Chem. 2018;239:946–952. doi: 10.1016/j.foodchem.2017.07.043. [DOI] [PubMed] [Google Scholar]
- Re R, Pellegrini N, Proteggente A, Pannala A, Yang M, Rice-Evans C. Antioxidant activity applying an improved ABTS radical cation decolorization assay. Free Radic Biol Med. 1999;26:1231–1237. doi: 10.1016/S0891-5849(98)00315-3. [DOI] [PubMed] [Google Scholar]
- Šamec D, Piljac-Žegarac J, Bogović M, Habjanič K, Grúz J. Antioxidant potency of white (Brassica oleracea L. var. capitata) and Chinese (Brassica rapa L. var. pekinensis (Lour.)) cabbage: the influence of development stage, cultivar choice and seed selection. Sci Hortic. 2011;128:78–83. doi: 10.1016/j.scienta.2011.01.009. [DOI] [Google Scholar]
- Šamec D, Pavlović I, Radojčić Redovniković I, Salopek-Sondi B. Comparative analysis of phytochemicals and activity of endogenous enzymes associated with their stability, bioavailability and food quality in five Brassicaceae sprouts. Food Chem. 2018;269:96–102. doi: 10.1016/j.foodchem.2018.06.133. [DOI] [PubMed] [Google Scholar]
- Seong GU, Hwang IW, Chung SK. Antioxidant capacities and polyphenolics of Chinese cabbage (Brassica rapa L. ssp. pekinensis) leaves. Food Chem. 2016;199:612–618. doi: 10.1016/j.foodchem.2015.12.066. [DOI] [PubMed] [Google Scholar]
- Serrano M, Guillen F, Martinez-Romero D, Castillo S, Valero D. Chemical constituents and antioxidant activity of sweet cherry at different ripening stages. J Agric Food Chem. 2005;53:274–2745. doi: 10.1021/jf0479160. [DOI] [PubMed] [Google Scholar]
- Singh J, Upadhyay AK, Prasad K, Bahadur A, Rai M. Variability of carotenes, vitamin C, E and phenolics in Brassica vegetables. J Food Compost Anal. 2007;20:106–112. doi: 10.1016/j.jfca.2006.08.002. [DOI] [Google Scholar]
- Soengas P, Cartea ME, Francisco M, Sotelo T, Velasco P. New insights into antioxidant activity of Brassica crops. Food Chem. 2012;134:725–733. doi: 10.1016/j.foodchem.2012.02.169. [DOI] [PubMed] [Google Scholar]
- Wu D, Cheng H, Chen J, Ye X, Liu Y. Characteristics changes of Chinese bayberry (Myrica rubra) during different growth stages. J Food Sci Technol. 2018 doi: 10.1007/s13197-018-3520-4. [DOI] [PMC free article] [PubMed] [Google Scholar]
- Yoon BH, Jung JW, Lee JJ, Cho YW, Jang CG, Jin C, Oh TH, Ryu JH. Anxiolytic-like effects of sinapic acid in mice. Life Sci. 2007;81:234–240. doi: 10.1016/j.lfs.2007.05.007. [DOI] [PubMed] [Google Scholar]
- Zhishen J, Mengcheng T, Jianming W. The determination of flavonoid contents in mulberry and their scavenging effects on superoxide radicals. Food Chem. 1999;64:555–559. doi: 10.1016/S0308-8146(98)00102-2. [DOI] [Google Scholar]
Associated Data
This section collects any data citations, data availability statements, or supplementary materials included in this article.